Parkland to Acquire Chevron · Parkland to Acquire Chevron anada’s Downstream Fuel Business...
23
Parkland to Acquire Chevron Canada’s Downstream Fuel Business Transformational Acquisition Strengthens a Premier and Diversified Fuels Marketing Company and Enhances Canada-wide Network April 18, 2017
Transcript of Parkland to Acquire Chevron · Parkland to Acquire Chevron anada’s Downstream Fuel Business...

Parkland to Acquire Chevron Canada’s Downstream Fuel Business
Transformational Acquisition Strengthens a Premier and Diversified Fuels Marketing Company and Enhances Canada-wide Network
April 18, 2017

2
FORWARD LOOKING INFORMATION
Certain information included herein is forward-looking. Many of these forward looking statements can be identified by words such as “believe”, “expects”, “expected”, “will”, “intends”, “projects”, “projected”,“anticipates”, “estimates”, “continues”, "objective" or similar words and include, but are not limited to, statements regarding Parkland’s expectation of its future financial position, business and growth strategies andobjectives, sources of growth, capital expenditures, financial results, future financing and the terms thereof, future acquisitions and the efficiencies to be derived therefrom, Parkland's leverage pro forma the CCLTransaction (as defined in this presentation), Normalized EBITDA (as defined herein) of the business acquired in the CCL Transaction, future projections of Normalized Run-rate EBITDA, the contribution to EBITDAand/or Adjusted EBITDA, and/or Normalized EBITDA from the CCL Transaction, the pro forma site counts, volumes, and gross margins expected to be derived from the CCL Transaction and, where applicable the CSTAcquisition, potential synergies associated with the CST and CCL Transactions (as defined in this presentation) and the amount thereof, sources of financing for the CCL Transaction, and pro forma leverage. Unlessotherwise stated or the context dictates otherwise, the financial outlook and forward looking metrics contained in this presentation exclude potential import/export synergies and are based on the followingassumptions, as applicable, including but not limited to: (i) Parkland securing sufficient supply of crude oil, including sufficient access to linespace on the Trans Mountain pipeline; (ii) refining and marketing margins inMetro Vancouver, Vancouver Island, and the BC Interior remaining consistent with historic norms; (iii) conducting the 2018 Turnaround (as defined in this presentation) as planned in Q1 2018; (iv) maintaining theassets within the forecasted budget for capital expenditures, particularly those relating to the Burnaby Refinery (as defined herein); (v) operating the Burnaby Refinery with no unplanned extended outage; (vi)operating the Burnaby Refinery at a utilization rate within historic norms, including in respect of fluctuations of refining gross margins, and planned maintenance downtime and associated expenses. Parkland believesthe expectations reflected in such forward-looking statements are reasonable but no assurance can be given that these expectations will prove to be correct and such forward looking statements should not be undulyrelied upon. The forward-looking statements contained herein are based upon certain assumptions and factors including, without limitation: historical trends, current and future economic and financial conditions, andexpected future developments. Parkland believes such assumptions and factors are reasonably accurate at the time of preparing this presentation. However, forward-looking statements are not guarantees of futureperformance and involve a number of risks and uncertainties some of which are described in Parkland’s annual information form and other continuous disclosure documents. Such forward-looking statementsnecessarily involve known and unknown risks and uncertainties and other factors, which may cause Parkland’s actual performance and financial results in future periods to differ materially from any projections offuture performance or results expressed or implied by such forward looking statements. Such factors include, but are not limited to, risks associated with: the failure to achieve the anticipated benefits of acquisitions,including the acquisition of Chevron Canada R&M ULC (the "CCL Transaction") of which the assets include: i) 129 Chevron branded retail service stations, ii) 37 cardlock locations, iii) a wholesale aviation businessserving the Vancouver International Airport, and iv) terminals located in Burnaby, Hatch Point, and Port Hardy (collectively, the “Marketing Business”) which are integrated with and supported by a refinery inBurnaby, British Columbia (the “Burnaby Refinery” and together with the Marketing Business, the “Acquired Business”); the acquisition of the majority of the Canadian assets of CST Brands, Inc. (“CST”) fromAlimentation Couche-Tard Inc. (the “CST Transaction”); the operations of the Burnaby Refinery Assets including compliance with all necessary regulations; competitive action by other companies; refining andmarketing margins; the ability to cost-effectively secure sufficient supply of crude oil and other raw materials, including sufficient access to linespace on the Trans Mountain pipeline; the ability of suppliers to meetcommitments; the ability to conduct the 2018 Turnaround (as defined in the presentation) as planned in Q1 2018; the ability of management to maintain the assets within the forecasted budget for capitalexpenditures, particularly those relating to the Refinery; the ability to maintain productive relationships with the labour union (Unifor and Teamsters) that represent the majority of the employees at the BurnabyRefinery; failure to obtain necessary regulatory or other third party consents and approvals required to complete the CST Transaction and/or CCL Transaction; failure to complete the CCL Transaction and/or the CSTTransaction, failure to complete the subscription receipt offering, ability to secure alternative sources of funding to the bridge facility on terms acceptable to Parkland, failure to meet financial, operational andstrategic objectives and plans; general economic, market and business conditions; industry capacity, failure to realize anticipated synergies from CST Transaction and/or CCL Transaction; the operations of Parkland’sassets, competitive action by other companies; the ability of suppliers to meet commitments; actions by governmental authorities and other regulators including increases in taxes; changes and developments inenvironmental and other regulations; and other factors, many of which are beyond the control of Parkland. There is a specific risk that Parkland may be unable to complete the CCL Transaction in the mannerdescribed in this press release or at all. If Parkland is unable to complete the CCL Transaction there could be a material adverse impact on Parkland and on the value of its securities. Readers are directed to, and areencouraged to read, Parkland's management discussion and analysis for the year ended December 31, 2016 (the "MD&A"), including the disclosure contained under the heading "Risk Factors" therein. The MD&A isavailable by accessing Parkland's profile on SEDAR at www.sedar.com and such information is incorporated by reference herein. This presentation refers to certain financial measures that are not determined inaccordance with International Financial Reporting Standards (“IFRS”). Adjusted EBITDA, Distributable Cash Flow, Distributable cash flow per share, Payout Ratio, Earnings Per Share, Normalized EBITDA, NormalizedRun-rate EBITDA, Senior Funded Debt and Total Funded Debt to Credit Facility EBITDA are not measures recognized under IFRS and do not have standardized meanings prescribed by IFRS. Normalized EBITDA ismanagement’s estimate of the annualized five-year average EBITDA of the Acquired Business post-2018 Turnaround, based on the annualized average historical EBITDA of the Acquired EBITDA from 2012-2016 and issubject to the material factors and assumptions noted above as well as management’s assumptions regarding: i) crude oil costs and refined product pricing for the future period (refined product pricing is driven byrefined product supply and demand in Metro Vancouver); and ii) expenses in connection with routine turnarounds temporarily increase operating expenses and decreases throughput and revenue. Managementconsiders these to be important supplemental measures of Parkland’s performance and believes these measures are frequently used by securities analysts, investors and other interested parties in the evaluation ofcompanies in its industries. Normalized EBITDA in respect of the assets acquired in the CCL Transaction has been determined in a manner consistent with the manner in which Parkland determines EBITDA for reportingpurposes over the periods referred to. See “Non-GAAP financial measures, reconciliations and advisories” section of the MD&A. Investors are encouraged to evaluate each adjustment and the reasons Parklandconsiders it appropriate for supplemental analysis. Readers are cautioned, however, that these measures should not be construed as an alternative to net income determined in accordance with IFRS as an indicationof Parkland’s performance. The financial measures that are not determined in accordance with IFRS in this presentation are expressly qualified by this cautionary statement. Additionally, the estimated annualAdjusted EBITDA contribution from the assets Parkland will acquired pursuant to the CCL Transaction and/or business acquired in the CST Transaction is based on the financial statements of CCL and CST respectively,which were prepared in accordance with United States (U.S.) generally accepted accounting principles (U.S. GAAP) and converted to Canadian dollars at averaged historical exchange rates on a quarterly basis.Additionally, readers are directed to, and encouraged to read, the 2017 Adjusted EBITDA Guidance Range section of Parkland's press release dated March 2, 2017 and material factors and assumptions containedtherein. Parkland believes its estimation of annual Adjusted EBITDA, Adjusted Gross Profit, and Distributable Cash Flow per share based on such information is reasonable but no assurance can be given that theseexpectations will prove to be correct and such figures should not be unduly relied upon. Any forward-looking statements are made as of the date hereof and Parkland does not undertake any obligation, except asrequired under applicable law, to publicly update or revise such statements to reflect new information, subsequent or otherwise. The forward looking statements contained in this presentation are expressly qualifiedby this cautionary statement.

3
THE LARGEST ACQUISITION IN PARKLAND'S HISTORY
(1) Approximate Canadian dollar equivalent of US$1,100 million in base purchase price at the current exchange rate of C$1.33 : US$1.00.(2) Management’s estimate of C$230 million of Normalized EBITDA is the forecasted contribution from the CCL Business pre-synergies. This figure incorporates factors that fluctuate year to year including (i) refining gross margins,
(ii) and planned maintenance downtime and associated expenditures. The C$230 million estimate is less than the actual EBITDA generated by these assets for both FY2016 and the trailing five year average.(3) At mid-point of identified annual run-rate synergies of C$43 million, excluding estimated net working capital.(4) Nelson Complexity Index is an industry metric for quantifying and ranking the complexity of various refineries and units.(5) Distributable cash flow per share calculation compares (A) Parkland (including the CST Transaction) Pro Forma the CCL Transaction (C$2.80) to (B) Parkland Pro Forma CST Transaction (C$2.15) both including run-rate synergies.(6) Including estimated one-time transaction costs of C$80 million.
• C$1,460 million(1) to acquire 100% of the shares of Chevron Canada R&M, from Chevron Canada Limited (“CCL”) which includes its western Canadian retail, commercial, wholesale and fuel supply assets (the “CCL Business”) plus C$186 million to acquire the estimated net working capital (the “CCL Transaction”)
• Purchase multiple of ~6.3x the Normalized EBITDA of C$230 million(2) or a multiple of ~5.3x Normalized EBITDA including run-rate synergies of ~C$273 million(3)
PurchasePrice
AcquiredAssets
• Retail and Commercial :- 129 Chevron-branded retail service stations principally located in Metro Vancouver- 37 cardlock stations across British Columbia and Alberta- 3 marine fuel service stations in Metro Vancouver
• Supply and Wholesale:- Simple 55,000 bpd refinery with a low Nelson Complexity of 9.1(4) in Burnaby, BC running light / sweet
Canadian crude; supplies 85% of the volume for the CCL Business- Three terminals in Metro Vancouver (Burnaby) and on Vancouver Island (Hatch Point and Port Hardy)- Aviation business serving the Vancouver International Airport ("YVR")
Synergies and Accretion
• Total identified annual run-rate synergies of C$35 million to C$50 million• 30%+ accretion to 2016 adjusted distributable cash flow per share including run-rate synergies(5)
Financing Structure
• Fully underwritten financing package including(6):- C$660 million private placement of common shares;- C$268 million draw on revolving credit facility;- C$500 million bridge facility which Parkland intends to replace with alternative longer term debt; and- C$40 million in cash flow from operations.
• Furthermore, Parkland intends to enter into an intermediation agreement in the amount of C$258 million • Pro forma leverage at close of 3.5x with ~C$200 million of liquidity and cash

4
ACQUIRING THESE RETAIL, COMMERCIAL, WHOLESALE AND SUPPLY ASSETS IS HIGHLY ALIGNED WITH PARKLAND’S STRATEGY
ACQUIREPRUDENTLY
Strategic Rationale for the CCL Transaction
Own key supply infrastructure (terminals, and refinery with pipeline access) to further build Parkland’s supply advantage and facilitate Parkland’s marine and pipeline logistics capabilities
3
Acquire the strongest Retail, Commercial, and Wholesale businesses in BC with exclusive use of the Chevron brand(1)
to facilitate continued organic growth1
Acquire the premier Supply assets in the BC market, which are ideally matched with the Retail, Commercial, and Wholesale businesses
2
The CST and CCL Transactions provide significant opportunity for Parkland to achieve material synergies and create substantial value
4
GROW ORGANICALLY
SUPPLYADVANTAGE
Parkland’s Strategy
ACQUIREPRUDENTLY
(1) Exclusivity does not include lubricants.

5
WITH THE CST AND CCL TRANSACTIONS, PARKLAND SOLIDIFIES ITS POSITION AS CANADA’S LARGEST FUEL RETAILER BY SITE COUNT
(1) Includes Company Owned Retailer Operated sites ("CORO") and Company Owned Company Operated sites ("COCO").(2) Assumes 140 estimated COCO sites from the CST Transaction. CST COCO locations are estimated and actual locations of COCO sites will not be known until closing of the CST Transaction.(3) Includes approximately 490 estimated consigned dealers / agents which will be added upon closing of the CST Transaction.(4) Includes Parkland volume of 10.5BL as at December 31, 2016 and estimated CST volume of 3.5BL. CST volume is estimated and actual fuel volume will depend on the number of COCO sites acquired which will not be known until closing of the CST Transaction.
Parkland Pro Forma the CST and CCL Transactions Strategic Outcomes
Supply and Wholesale
Cardlock Locations 157 37 194
Marine Service Stations ✓ ✓
Aviation Fuel Sales ✓ ✓
Combined Annual Fuel Volume
Annual Fuel Volume (BL) 14.0(4) 2.5 16.5
Retail Service Stations
Corporate (1)(2) 447 129 576
Dealer (3) 1,258 - 1,258
Total 1,705 129 1,834
+24%
+18%
+29%
+8%
Aggregate % change
Bulk Fuel Sales ✓ ✓
Refining Operations ✓ ✓
✓
✓
Terminal Operations ✓ ✓✓
ACQUIRE PRUDENTLY
GROW ORGANICALLY
SUPPLYADVANTAGE
✓ Largest Canadian fuel marketer by site count with network spanning across the country
✓ 2nd largest convenience store operator in Canada
✓ Entry into new attractive markets in BC, including a strong urban footprint
Commercial

6
PARKLAND IS COMMITTED TO ACHIEVING C$60-C$75 MILLION COMBINED SYNERGIES FROM CST AND CCL TRANSACTIONS
Timing
Geography
Synergies
Additional Opportunities
Expected to close in 2Q17
Expected to close in 4Q17
Normalized Run-rate EBITDA of ~C$660 million in 2019(1)
Ontario / Quebec / Atlantic Canada
British Columbia Pan-Canadian marketing presence
Leverage the strongest brand in Quebec
Increase scale and optimization
C$25 million(2)
Leverage the strongest brand in British Columbia
Improve site productivity and operating efficiencies
C$35 – C$50 million(2)
Leverage supply optionality across CST network
Leverage west coast logistics assets
Combined run-rate synergies of C$60-C$75 million anticipated to be achieved in the next 36-months
Enhanced supply and brand optionality across network
Overall Implications for Parkland
(1) Normalized Run-rate EBITDA includes: 2016 Adjusted EBITDA (C$254 million) + the mid-point of management's guidance range of EBITDA contribution from the CST Transaction (C$110 million) + management estimates of the anticipated run-rate synergies from the CST Transaction (C$25 million) + management estimates of Normalized EBITDA from the CCL Transaction (C$230 million) + management estimates of the mid-point of anticipated run-rate synergies from the CCL Transaction (C$43 million).
(2) Based on management estimates and on annual Adjusted EBITDA on a pro forma basis assuming acquisitions maintain historical performance and Parkland is able to implement synergies consistent with past performance.

7
THE CCL TRANSACTION ENHANCES PARKLAND’S SUPPLY ADVANTAGE
Parkland Supply Strategy Strategic Outcomes
ACQUIRE PRUDENTLY
GROW ORGANICALLY
SUPPLYADVANTAGE
✓ Secures the best source of supply for the BC market
✓ Infrastructure ownership gives optionality as market evolves
✓ Provides access to scarce tidewater import/export assets
✓ Develops Parkland’s marine logistics capability
✓ Expands capabilities to additional products (e.g., jet fuel, intermediates)
Enablers
Key Strategies
OutcomeCreate
AdvantagedSupply
Exploit Market Inefficiencies
Partner of Choice for Refiners
Infra-structure
Import / Exports
Demand Planning
Balance Sheet
Balanced Barrel
Volume Growth
Rail /Truck/ Marine
Optionality Scale

8
PARKLAND WILL OWN AND OPERATE CHEVRON-BRANDED RETAIL, CARDLOCK, AND MARINE STATIONS IN BC
Retail and Commercial Business Investment Highlights
✓ 129 Chevron-branded service stations primarily in Metro Vancouver; complements Parkland's 44 existing Chevron-branded service stations for a total of 173 across BC
✓ Parkland secures long-term exclusive use of the Chevron brand(1) and Supreme Plus 94 octane gasoline
✓ The retail service station network benefits from industry-leading per-site throughputs and total fuel sales in BC
✓ The cardlock network expands Parkland's BC road transport cardlock network and will complement the Ultramar branded network in Eastern Canada once the CST Transaction closes
✓ The marine service stations expand Parkland’s existing service offerings in BC
Retail Service Stations
• Annual fuel volume of ~950 ML• 129 CORO sites principally in Metro
Vancouver• 91% of sites owned (9% leased)• Strategic relationship with Triple O
branded Quick Serve Restaurants; 21 locations throughout BC• 10 on-site car washes
Acquired Assets
~1,320 ML in incremental annual Retail and Commercial fuel volume
Cardlock Network
• Annual fuel volume of ~330 ML• 37 cardlocks across BC and AB
Marine Service Stations
• Annual fuel volume of ~40 ML• Three marine fueling stations
(1) Exclusivity does not include lubricants.

9
THE CCL TRANSACTION ENHANCES PARKLAND'S CANADIAN RETAIL FOOTPRINT WITH A PREMIER URBAN MARKET
(1) Parkland will also acquire three cardlock locations in Alberta.(2) Pro forma estimate for CST Transaction. Number and location of COCO sites is estimated and will not be finalized until the closing of the CST Transaction.
YT
NT
BC
AB
SK
MB
ON
QC
NL
NB
PEI
NS
NU
Legend:
Acquired retail locations(1)
Existing footprint (more concentrated)(2)
Existing footprint (less concentrated)(2)
BC Locations by Marketer
Legend:

10
THE CHEVRON-BRANDED STATIONS ARE WELL POSITIONED FOR FUTURE GROWTH IN THESE MARKETS
% Fuel Volume as Premium(2)% Respondents Indicating Preferred Retailer(1)
(1) Source Ipsos survey in BC: “Of the fuel retailers visited in the past 6 months, which one do you prefer to go to most often?”.(2) Kent Marketing data; includes both 91 octane Premium and 94 octane Supreme Plus.
6%
7%
7%
8%
10%
11%
18%
4%
8%
12%
13%
16%
18%
20%
The Chevron brand is a leader among consumer preferences in British Columbia…
…with a best-in-class premium fuel mix driven by its unique offer of 94 Octane Supreme Plus

THE INTEGRATED NATURE OF THIS BUSINESS CREATES THE STRONGEST FUEL NETWORK IN BC
11
Refinery Supply Matches Marketing Demand
✓ 85% of production sold through proprietary channels
Important Source of Premium Gasoline
✓ Self-source 94 Octane in BC
Reinforces High Quality Chevron Brand
✓ Drives high throughput volumes
Local Refining Supply
✓ Secures supply
3
1
4 2

12
SUPPLY AND WHOLESALE ASSETS ARE UNIQUE AND HIGHLY VALUABLE WITH A TRACK RECORD OF OPERATIONAL EXCELLENCE
✓ Burnaby Refinery in Metro Vancouver is ideally located to serve the BC market
✓ Strong stewardship under CCL ownership since 1935
✓ Low complexity refinery with track record of highly reliable operations
✓ Access to cost advantaged sources of crude through the Trans Mountain Pipeline
✓ Over 90% of the refinery output is high-value products; primarily gasoline, diesel and jet fuel
✓ Dedicated fuel supply to support existing Chevron-branded locations and future organic growth opportunities
✓ Source of Supreme Plus 94 octane gasoline sold throughout BC
✓ Burnaby, Hatch Point, and Port Hardy terminals are integrated with Burnaby Refinery and the Retail, Commercial, and Wholesale businesses
✓ Aviation fuel and terminal bulk sales facilitated by infrastructure co-located at terminals
Supply and Wholesale Investment Highlights Supply Assets in western Canada
Burnaby
Anacortes
Kamloops
Prince George
Edmonton
Cutbank
Taylor
Vancouver International Airport
KM Westridge Marine Terminal
KM Burnaby Terminal
Burnaby Refinery
Key
sto
ne
Sundre
Trans Mountain Pipeline
CCL Crude Line from Burnaby Terminal
Trans Mountain Jet Fuel Pipeline
Vancouver
Main Crude Oil Pipelines
Other Crude Oil Pipelines
Rainbow Lake
Zama
Fort McMurray
Hatch Point
Port Hardy

0
5
10
15
20
25
30
2012 2013 2014 2015 2016
US$ / bbl
13
NORMALIZED EBITDA ACCOUNTS FOR THE CYCLICALITY OF REFINING MARGINS AND SCHEDULED DOWNTIME
(1) The USWC refining market represents a relevant public benchmark for the Burnaby refinery, however, refining margins in Burnaby are also impacted by other factors that are not applicable the USWC.(2) Yearly average of U.S. Gulf Coast 321 crack spread, calculated using WTI Cushing, U.S. Gulf Prompt 87 Octane, and U.S. Gulf No. 2 Oil. Sourced from Bloomberg (CRKS321C Index). (3) Yearly average of U.S. West Coast 321 crack spread, calculated using Alaskan North Slope (ANS), Los Angeles 85.5 Octane, and Los Angeles LS Diesel. Sourced from Bloomberg (CRKS321A Index).
Like all refineries, the Burnaby Refinery goes through scheduled downtime (turnarounds) that impact in-year EBITDA
Though the USWC(1) is an attractive refining market, crack spreads have shown volatility over time
Normalized EBITDA accounts for variability
• The Burnaby Refinery’s annual profitability is expected to experience variability because of cyclicality inherent to the refining industry
• Annual EBITDA can fluctuate due to volatility in the underlying refining margins and turnaround maintenance; Normalized EBITDA accounts for this variability, and is an estimate of average future profitability
• The C$230 million forecasted EBITDA contribution from the CCL Transaction is a Normalized figure that incorporates variability from refining margins and turnaround expenditures
$18.70
$16.50
5-year Average
Exceptional USWC margins due to outage at Torrance
Refinery
Exceptional USGC margins due to heavy discounts on
inland crude
2018 202120202019
C$
5-year Average
2022
Burnaby Refinery forecast turnaround expenditures
USWC(3)USGC(2)
In 2018 and 2020, the Burnaby Refinery is expected to go undergo
larger than normal turnarounds

14
BURNABY REFINERY IS SCHEDULED TO UNDERGO A MATERIAL TURNAROUND IN 2018
The Burnaby Refinery is scheduled for a material turnaround in Q1 2018 ("2018 Turnaround") that is expected to last eight weeks and cost an incremental C$100 million(1) (some costs will be incurred in 2017 prior to close)
3
During the 2018 Turnaround, the Burnaby Refinery will have a lower throughput and incur higher costs than an average year. As a result, 2018 results are expected to be below Normalized EBITDA guidance
4
While some minor turnaround activity may occur each year, material turnarounds generally only occur every five or ten years
2
Refineries undergo periodic turnarounds to upgrade operating units and perform scheduled maintenance
1
(1) The vast majority of the 2018 turnaround expenditure is accounted for as an operating expense and is not capitalized, thus will impact EBITDA during the year in which it is incurred.
Planning for the turnaround is already well underway and key turnaround personnel will transition with the asset. Parkland will also receive technical assistance from CCL / Chevron post close
5

15
THREE CATEGORIES OF SYNERGIES HAVE BEEN IDENTIFIED RESULTING IN C$35M TO C$50M OF IDENTIFIED RUN-RATE SYNERGIES(1)
(1) Based on management estimates and on annual Adjusted EBITDA on a pro forma basis assuming acquisitions maintain historical performance and Parkland is able to implement synergies consistent with past performance. Excludes terminal import / export synergies. C$42.5 million is the midpoint of identified synergies of C$35 million and C$50 million.
Operations
✓ Reduce direct and indirect costs (e.g., transportation, c-store buying, and retail station maintenance) through integration with existing Parkland network and implementation of best practices
✓ Improve same-site revenue through improvements to retail, cardlock, and bulk customer offers
✓ Identified opportunities to increase refinery profitability by enhancing energy efficiency and streamlining operations
Back Office
✓ Savings on costs allocated from global operations to better align the business with local needs and to implement Parkland’s back office systems
Supply
✓ Enable supply and trading opportunities through west coast tidewater storage and terminal capabilities
$230
Normalized EBITDA including run-rate synergies
$43
Run-rate synergies
$35
Normalized EBITDA
$230
Synergies are focused on supply and operation opportunities
Normalized EBITDA including run-rate synergies
~$273
Run-rate synergies are estimated between C$35 million to C$50 million with a mid point of ~C$43 million
(Amounts in C$ millions)
Range of $35 – 50

PARKLAND HAS PROVEN INTEGRATION CAPABILITIES AND HAS THE CAPACITY TO MANAGE THE CCL TRANSACTION
16
Proven Track Record of Synergy Realization
(June 2015)
✓ Year one synergies tracked significantly ahead of business case
✓ Realized to-date C$13 million of synergies (~24% of acquired EBITDA vs. target of 20%):
• Operations: C$2 million
• Back Office: C$3 million
• Supply: C$8 million
Proven Framework for Synergy Realization
Supply
(0 – 6 months)
Operations
(6 – 24 months)
Back Office
(1 – 3 years)
✓ Successful track record of completing acquisitions and a proven framework for synergy realization
✓ Focused on strategic acquisitions with meaningful synergy upside and that position the company for accelerated organic growth
✓ Strong management and execution team with significant experience in integrating acquisitions and maximizing synergies
✓ Integration planning for both the CST and CCL Transactions are underway with marketing, refining and back office integration expected to be fully realized within 24 – 36 months post-close
✓ Parkland is committed to achieving an anticipated C$60 – C$75 million in combined run-rate synergies from the CST and CCL Transactions(1)
✓ Parkland has previously completed two marketing acquisitions with CCL in the past three years
(1) Based on management estimates and on annual Adjusted EBITDA on a pro forma basis assuming acquisitions maintain historical performance and Parkland is able to implement synergies consistent with past performance.
17
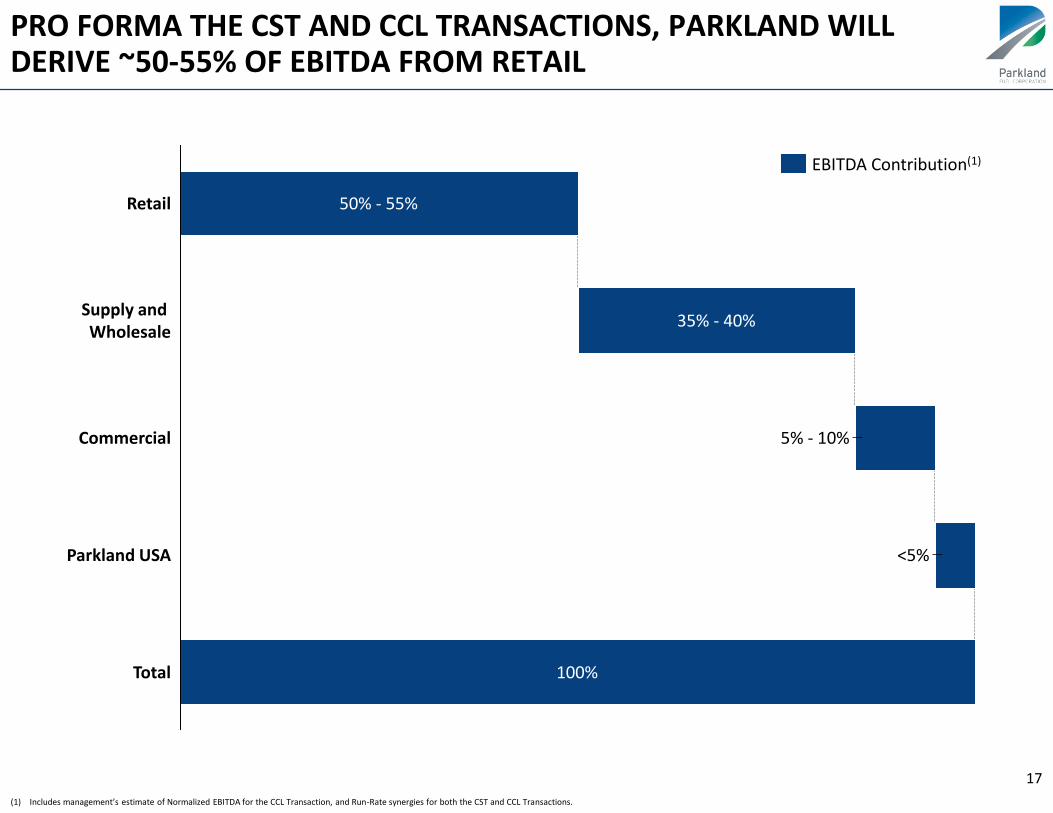
PRO FORMA THE CST AND CCL TRANSACTIONS, PARKLAND WILL DERIVE ~50-55% OF EBITDA FROM RETAIL
(1) Includes management’s estimate of Normalized EBITDA for the CCL Transaction, and Run-Rate synergies for both the CST and CCL Transactions.
Total 100%
Parkland USA <5%
Commercial 5% - 10%
Supply and Wholesale
35% - 40%
Retail 50% - 55%
EBITDA Contribution(1)

CST Transaction Run-Rate Synergies
25(2)
Parkland Pro Forma Guidance Volatility
Parkland Pro Forma CST and
CCL Transactions
Base Business Pro Forma CST
Transaction
364(1)
~660(5)43(4)
CCL Transaction Normalized EBITDA
230(3)
CCL Transaction Run-Rate Synergies
18
PARKLAND WILL CONTINUE TO BENEFIT FROM STABLE, DIVERSE, AND GROWING EBITDA
(1) 2016 Adjusted EBITDA (C$254 million) + the mid-point of management's guidance range of EBITDA contribution from the CST Transaction (C$110 million). See Parkland's press releases dated August 22, 2016 and September 7, 2016.(2) Management estimates of the anticipated run-rate synergies from the CST Transaction. Based on management estimates and on annual Adjusted EBITDA on a pro forma basis assuming acquisitions maintain historical performance and Parkland is able to
implement synergies consistent with past performance.(3) Management estimates of Normalized EBITDA from the CCL Transaction.(4) Management estimates of the mid-point of anticipated run-rate synergies from the CCL Transaction (C$43 million). Based on management estimates and on annual Adjusted EBITDA on a pro forma basis assuming acquisitions maintain historical performance
and Parkland is able to implement synergies consistent with past performance.(5) Normalized Run-rate EBITDA includes: 2016 Adjusted EBITDA (C$254 million) + the mid-point of management's guidance range of EBITDA contribution from the CST Transaction (C$110 million) + management estimates of the anticipated run-rate synergies
from the CST Transaction (C$25 million) + management estimates of Normalized EBITDA from the CCL Transaction (C$230 million) + management estimates of the mid-point of anticipated run-rate synergies from the CCL Transaction (C$43 million).
C$273 million Normalized EBITDA including anticipated run-rate synergies
EBITDA volatility of less than 10%
600
720
C$ millions
19
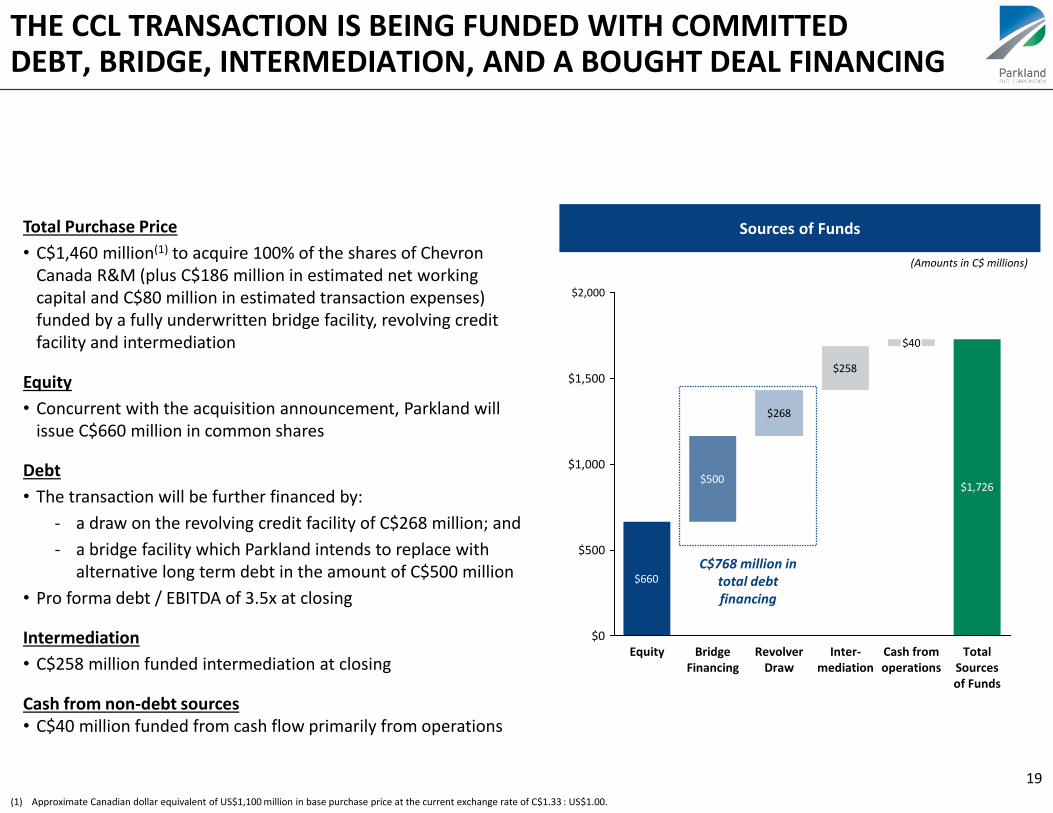
THE CCL TRANSACTION IS BEING FUNDED WITH COMMITTED DEBT, BRIDGE, INTERMEDIATION, AND A BOUGHT DEAL FINANCING
Total Purchase Price
• C$1,460 million(1) to acquire 100% of the shares of Chevron Canada R&M (plus C$186 million in estimated net working capital and C$80 million in estimated transaction expenses)funded by a fully underwritten bridge facility, revolving credit facility and intermediation
Equity
• Concurrent with the acquisition announcement, Parkland will issue C$660 million in common shares
Debt
• The transaction will be further financed by:
- a draw on the revolving credit facility of C$268 million; and
- a bridge facility which Parkland intends to replace with alternative long term debt in the amount of C$500 million
• Pro forma debt / EBITDA of 3.5x at closing
Intermediation
• C$258 million funded intermediation at closing
Cash from non-debt sources• C$40 million funded from cash flow primarily from operations
Sources of Funds
$660
$1,726$500
$258
$268
$1,500
$1,000
$500
$0
$2,000
Total Sources of Funds
Cash from operations
$40
Inter-mediation
RevolverDraw
Bridge Financing
Equity
C$768 million in total debt financing
(Amounts in C$ millions)
(1) Approximate Canadian dollar equivalent of US$1,100 million in base purchase price at the current exchange rate of C$1.33 : US$1.00.

2.5x
3.7x
3.5x3.6x
2.0x Target2.0x
Target3.5x
Parkland2019
Parkland2018
PF Chevron
PF CSTParkland2016
20
THE TRANSACTION ENABLES PARKLAND TO ACHIEVE ITS LONG TERM FINANCIAL TARGETS
Adjusted Distributable Cash Flow per Share(1)
Pro Forma Leverage Profile(3)
(Total Funded Debt / Credit Facility EBITDA)
(1) Adjusted Distributable Cash Flow per Share and Payout Ratio based on management estimate of Normalized EBITDA for the CCL Transaction.(2) See Dividends, Distributable Cash Flow, and Dividend Payout Ratio section of Parkland's MD&A for reconciliation.(3) Leverage is expected to increase as a result of the 2018 Turnaround. Pro Forma company expected to delver within target range by 2019.
$2.80
$2.56
$2.15
$1.98
$1.60
Target$2.00
+30%
PF Chevron
(Inc. synergies)
PF Chevron
PF CST (Inc.
synergies)
PF CSTParkland 2016(2)
42%
46%
54%
58%
71%
Target50%
PF Chevron
(Inc. synergies)
PF Chevron
PF CST (Inc.
synergies)
PF CSTParkland 2016(2)
(Amounts in C$)
Adjusted Payout Ratio(1)
✓ ✓
✓✓
✓
✓✓
✓
✓
✓
✓
✓ ✓
✓✓
✓
✓✓
✓
✓
✓
✓
✓ ✓
✓✓
✓
✓✓
✓
✓
Included
✓
✓✓

WE LOOK FORWARD TO WELCOMING THE CHEVRON TEAM TO PARKLAND

22
APPENDIX: PRO FORMA CAPITALIZATION
(1) Includes 1.1 million in exercisable share options at a weighted average exercise price of C$17.97 and 0.8 million equity-settled RSUs using the treasury stock method.(2) Reflects 9.4 million subscription receipts issued to fund CST Transaction at C$24.50 per subscription receipt.(3) Reflects approximately 24 million common shares that will be issued to fund the CCL Transaction.(4) Amounts as at December 31, 2016 balance sheet except for pro forma adjustments for CST / CCL Transactions.(5) Reflects unamortized discounts and premiums associated with amounts drawn under credit facilities and existing senior note obligations, finance lease obligations and collateralized notes and letters of credit and surety bonds.(6) Credit Facility EBITDA for the twelve month period ending December 31, 2016; Adjusted EBITDA adjusted for share incentive compensation, pro forma adjustments for acquisitions and acquisition, integration and other cost adjustments.(7) Mid-point of EBITDA guidance provided on CST announcement (C$105 million - C$115 million).(8) Normalized run-rate EBITDA.(9) Includes C$25 million in estimated CST synergies, mid-point of anticipated run-rate synergies (C$42.5 million).
(Amounts in C$ millions except per share amounts)
(Pro Forma CST) (Pro Forma CCL Transaction)
Share Price (Apr. 18, 2017) $28.85 $28.85
Di luted Shares Outstanding (Apr. 18, 2017)(1) 97.7 97.7
Add: CST Subscription Receipts (2) 9.4 9.4
Add: CCL Common Shares (3) - 23.8
Total Common Share Equiva lents Outstanding 107.1 131.0
Market Capitalization $3,092 $3,779
Less : Cash & Equiva lents (Dec. 31, 2016) ($26) ($26)
Add Debt(4): Amount Drawn on Credit Faci l i ties (Dec. 31, 2016) $132 $132
Exis ting Senior Note Obl igations (Dec. 31, 2016) $400 $400
Other Indebtedness (Dec. 31, 2016) (5) $17 $17
CST Revolver Draw $515 $515
CCL Revolver Draw - $268
CST Senior Notes Offering $300 $300
CCL Bridge Financing - $500
Net Debt $1,338 $2,107
Enterprise Value $4,430 $5,886
EBITDA:
Credit Faci l i ty EBITDA (Dec. 31, 2016) (6) $259 $259
CST EBITDA(7) $110 $110
CCL EBITDA(8) - $230
Total EBITDA (ex. Synergies) $369 $599
Net Debt / EBITDA (ex. Synergies) 3.6x 3.5x
Synergized EBITDA(9) $394 $666
Net Debt / Synergized EBITDA(9) 3.4x 3.2x

23
APPENDIX: CST INTEGRATION IS ON-TRACK; CCL INTEGRATION PLANNING IS WELL UNDERWAY AND PROGRESSING
Integration Planning
✓ Integration plan set to begin day-1 on close
✓ Dedicated Parkland central integration team
✓ Engaged experienced advisors to assist with planning and implementation to augment internal team
• Integration master plan developed in fall 2016
• Advisor chosen to assist with implementation / execution
• Additional consultants will assist with first 100 days
✓ Separate initiative to assist tracking and managing of synergy execution
✓ Management continues to expect run-rate synergies to be achieved 36 months post-closing
✓ Integration plan will include best practices from CST
• Engaged experienced advisors for integration planning and implementation
• Dedicated central integration team will be formed
✓ Integration planning underway since Q4/2016
✓ Transition plan being developed to enable operational continuity
✓ Key partners and advisors engaged to provide domain expertise and best practices from recent refinery acquisitions
✓ Management expects run-rate synergies to be achieved 36 months post-closing