
PARIA RIVER WATERSHED · · 2007-07-18administered Grand Staircase-Escalante National Monument...
42
P P A A R R I I A A R R I I V V E E R R W W A A T T E E R R S S H H E E D D WATER QUALITY MANAGEMENT PLAN Prepared For: Utah Department of Environmental Quality Division of Water Quality Carl Adams Project Manager Harry Lewis Judd Project Supervisor MSE Millennium Science & Engineering, Inc. Prepared By: Pocket Water Inc.
Transcript of PARIA RIVER WATERSHED · · 2007-07-18administered Grand Staircase-Escalante National Monument...

PPAARRIIAA RRIIVVEERR WWAATTEERRSSHHEEDD WATER QUALITY
MANAGEMENT PLAN
Prepared For: Utah Department of Environmental Quality
Division of Water Quality
Carl Adams Project Manager
Harry Lewis Judd Project Supervisor
MSE Millennium Science & Engineering, Inc.
Prepared By:
Pocket Water Inc.

i
PARIA RIVER WATERSHED WATER QUALITY MANAGEMENT PLAN
TABLE OF CONTENTS 1.0 INTRODUCTION ............................................................................................................... 1
1.1 Background and Document Organization.................................................................... 1 1.2 The TMDL Process ...................................................................................................... 2 1.3 Utah’s Watershed Approach ........................................................................................ 2 1.4 Watershed Characterization ......................................................................................... 4
1.4.1 Location and Population ................................................................................ 4 1.4.2 Land Use/Land Cover.................................................................................... 6 1.4.3 Geology and Soils.......................................................................................... 6 1.4.4 Climate........................................................................................................... 8 1.4.5 Surface Water Hydrology ............................................................................ 10 1.4.6 Groundwater Hydrogeology ........................................................................ 12
2.0 WATER QUALITY CRITERIA...................................................................................... 14 2.1 Beneficial Uses and 303(d) Listed Section ................................................................ 14 2.2 Water Quality Standards ............................................................................................ 14
3.0 IMPAIRMENT ANALYSIS ............................................................................................. 16 3.1 Geographic Extent of the Water Quality Management Plan...................................... 16 3.2 Water Quality Data in STORET ................................................................................ 16 3.3 SOURCE ASSESSMENT ......................................................................................... 18
4.0 TMDL/SITE-SPECIFIC CRITERIA .............................................................................. 19 5.0 PROJECT IMPLEMENTATION PLANS AND BMPs ................................................ 23
5.1 Statement of Need ...................................................................................................... 24 5.1.1 Project Water Quality Priority ..................................................................... 24 5.1.2 Project Goals................................................................................................ 24 5.1.3 Objectives and Tasks ................................................................................... 25 5.1.4 Permits ......................................................................................................... 28 5.1.5 Lead Sponsor ............................................................................................... 28 5.1.6 Assurance of Project Operation and Maintenance....................................... 28
5.2 Coordination Plan ...................................................................................................... 29 5.2.1 Lead Project Sponsor................................................................................... 29 5.2.2 Local Support............................................................................................... 29 5.2.3 Coordination and Linkages.......................................................................... 29 5.2.4 Similar Activities ......................................................................................... 29
5.3 Evaluation and Monitoring Plan ................................................................................ 30 5.3.1 Sampling and Analysis Plan Goals.............................................................. 30 5.3.2 Implementation and Effectiveness Monitoring ........................................... 30 5.3.3 Trend Monitoring......................................................................................... 33 5.3.4 Data Management, Storage, and Reporting................................................. 34
5.4 Long-Term Funding Plans for Operation and Maintenance ...................................... 35 5.5 Public Involvement .................................................................................................... 35
6.0 CONCLUSIONS AND RECOMMENDATIONS .......................................................... 36 7.0 REFERENCES .................................................................................................................. 38

ii
LIST OF TABLES
Table 1-1 Landownership Patterns in the Paria Study Area ......................................................... 6 Table 1-2 Climate zones for the GSENM including Paria River Watershed................................ 8 Table 1-3 Monthly Climate Summary, Tropic Utah (428847) ..................................................... 8 Table 1-4 Watershed Characteristics within the Paria Study Area ............................................. 10 Table 1-5 USGS Stream Gaging Stations ................................................................................... 11 Table 2-1 303(d) Listed Segments in the Paria River Watersheds.............................................. 14 Table 2-2 Utah Water Quality Criteria for TDS and Related Parameters................................... 14 Table 2-3 303(d) Criteria for Assessing Agricultural Beneficial Use Support - Class 4 ............ 15 Table 3-1 Summary of STORET Stations and Available TDS Data .......................................... 17 Table 4-1 Statistics and Site-Specific Criteria for Paria River Reach-1 Based on Station
495186 - Paria River at Kodachrome Basin Road Crossing ...................................... 20 Table 4-2 Statistics and Site-Specific Criteria for Paria River Reach-3 Based on Station
495185 - Paria River at US89 Crossing...................................................................... 22 Table 5-1 Example Variables for Tracking BMP implementation ............................................. 31 Table 5-2 Suggested Monitoring Stations for Trend Monitoring ............................................... 34 Table 6-1 Recommended Site-Specific Criteria for TDS in the Paria River .............................. 36
LIST OF FIGURES Figure 1-1 Location of Paria River ................................................................................................ 5 Figure 1-2 Average Precipitation for Southeast Colorado for the Most Recent 10-Year Period
(Utah Division of Water Resources website) ............................................................... 9 Figure 1-3 Historical Flows Compared to 2002 and 2003 Flows ................................................ 12 Figure 1-4 Regional Aquifers in the Paria River Area (BLM 1999) ........................................... 13 Figure 4-1 Concentration of TDS at Two Stations on Paria River Reach-1 Compared to the
Utah Standard for Irrigation of 1,200 mg/L ............................................................... 20 Figure 4-2 Concentration of TDS at Two Stations on Paria River Reach-3 Compared to the
Utah Standard for Irrigation of 1,200 mg/L ............................................................... 21
LIST OF APPENDICES Appendix 1: List of Contributors Appendix 2: Map 1 Watershed Overview
Map 2 General Topography Map 3 Geology Map 4 Soils Map 5 Vegetation Map 6 Land Ownership Map 7 STORET Sites and USGS Stream Gaging Stations
Appendix 3: STORET Station Data and Statistical Summaries Appendix 4: USGS Stream Gage Station Flow Summaries Appendix 5: Paria River Climate Summary Appendix 6: List of Acronyms Appendix 7: Response to Comments

1
1.0 INTRODUCTION
1.1 Background and Document Organization This document presents a Water Quality Management Plan (WQMP) for the Paria River Watershed located in southern Utah. The Utah Division of Water Quality (DWQ) developed this Water Quality Management Plan with assistance from the Canyonlands Soil Conservation District. The DWQ contracted Millennium Science & Engineering to assess water quality impairments of the Paria River, quantify loadings for limiting water quality parameters, develop Total Maximum Daily Loads, and assist the Canyonlands Soil Conservation District in developing this Watershed Water Quality Management Plan. Many private individuals, agencies, and consultants contributed to these efforts. A list of contributors is provided in Appendix 1.
Utah's Year 2002 303(d) list identifies two reaches of the Paria River as being impaired due to exceedence of Utah's total dissolved solids (TDS) criteria for protection of agricultural uses, Class-4 waters. The upper and lower reaches ("Reach-1" and "Reach-3", respectively) are listed due to the measured elevated TDS concentrations (the "Listed Sections"). The middle reach is not listed as a water quality limited segment.
The Paria River flows from the headwaters in Bryce Canyon National Park and Dixie National Forest through private agricultural lands in Garfield County, Utah and south through the BLM administered Grand Staircase-Escalante National Monument (GSENM) into Arizona and the Colorado River below Glen Canyon Dam. The river flows through the Grand Staircase region, a series of multi-colored cliffs which begin at the rim of the Grand Canyon, and ascend over 5,000 feet across GSENM to end at the cliffs in Bryce Canyon. The small towns of Tropic, Cannonville and Henrieville at the northern end of the basin are based on a primarily agricultural economy dependent on irrigation from surface waters. Downstream from private lands near Henrieville Wash the river enters GSENM and flows through these primitive public lands for approximately 45 river miles to the Arizona border. The Paria River is situated in a dry desert climate so the majority of surface streams and washes are intermittent. The Paria River is perennial for most but not all of its length through the state.
Section 1 of the Water Quality Management Plan provides background on the Environmental Protection Agency (EPA) Total Maximum Daily Load (TMDL) process, Utah’s watershed management approach, and describes the characteristics of the watershed. Section 2 describes the water quality criteria that apply to the TMDL. Section 3 evaluates impairment by evaluating the water quality, water quantity and TDS data. Section 4 describes the TMDL (sources of pollution, loading calculations and allocation if appropriate, water quality goals and targets) and evaluation of site-specific criteria. Section 5 describes the project implementation plans (PIPs) and best management practices (BMPs) to attain the water quality goals and targets, and describes a monitoring plan to evaluate implementation and effectiveness. Conclusions and recommendations are presented in Section 6. A list of references cited in this document is provided in Section 7.
Appendix 1 lists the people that contributed to this document. All maps are provided in Appendix 2. Appendices 3 through 5 provide supporting data on water quality, flow conditions, and climate. Appendix 6 lists acronyms used in the document. Review comments and responses are provided in Appendix 7.

2
1.2 The TMDL Process Water quality standards are set by States, Territories, and Tribes. They identify the scientific criteria to support a waterbody’s beneficial uses such as for drinking water supply, contact recreation (swimming), and agricultural uses (including irrigation of crops and stock watering). A TMDL or Total Maximum Daily Load is a calculation of the maximum amount of a pollutant that a waterbody can receive and still meet water quality standards (EPA, 1999). The Clean Water Act, Section 303(d), establishes the TMDL program. As part of the TMDL process, the maximum amount of the pollutant of concern is allocated to its contributing sources. Therefore, a TMDL is the sum of the allowable loads of the pollutant of concern from all contributing point and nonpoint sources. The calculation must include a margin of safety to account for future growth and changes in land use, uncertainties in data collection, analysis, and interpretation. Section 303(d) and EPA's Water Quality Planning and Management Regulations (40 CFR Part 130), requires that States report waterbodies (i.e., lakes, reservoirs, rivers, and streams) that currently do not support their designated beneficial use(s). EPA regulations require that each State submit a prioritized list of waterbodies to be targeted for improvement to EPA every two years. These regulations also require States to develop TMDLs for those targeted waterbodies. Thus, those waterbodies that are not currently achieving, or are not expected to achieve, applicable water quality standards are identified as water quality limited. Waterbodies can be water quality limited due to point sources of pollution and nonpoint sources of pollution. Pollutants that can cause use impairment include heavy metals, pathogens and nutrients for which there are numeric standards. In addition to pollutants, impairments may originate from sources such as habitat alteration or hydrologic modification that have associated narrative standards (DWQ, 2002). Section 303(d)(1)(A) and the implementing regulations (40 CFR 130.7(b)) provide States with latitude to determine their own priorities for developing and implementing TMDLs. Once a waterbody is identified as water quality limited, the State, Tribe, or EPA is required to determine the source(s) of the pollutant and to allocate the responsibility for controlling it. The goal of the TMDL is reduction in pollutant loading necessary for a waterbody to meet water quality standards and support its beneficial uses. This process determines: 1) the amount of a specific pollutant that a waterbody can receive without exceeding its water quality standard or impair a beneficial use; 2) the allocation of the load to point and nonpoint sources; and 3) a margin of safety. While the term TMDL implies that the target load (loading capacity) is determined on a daily time scale, TMDLs can range from meeting an instantaneous concentration (e.g., an acute standard) to computing an acceptable annual load to a waterbody (DWQ, 2002). The Paria River is listed on Utah's 2002 303d list (DWQ, 2002) for waters requiring the development of a TMDL due to the exceedences of the agricultural criteria for Beneficial Use 4. Cooperative monitoring by DWQ and BLM have identified several monitoring stations where TDS concentrations exceeded State criteria. Therefore, DWQ prompted this TMDL to identify and quantify sources contributing to TDS increase in the Paria River watershed.
1.3 Utah’s Watershed Approach Utah’s watershed approach is aimed at improving and protecting the State’s surface and groundwater resources. Characteristics of the approach include a high level of stakeholder involvement, water quality monitoring and information gathering, problem targeting and prioritization, and integrated solutions that make use of multiple agencies and groups. Federal

3
and state regulations appoint DWQ with the task of preventing, controlling, and abating water pollution. Other state and local agencies have associated responsibilities. Utah's watershed approach is to form partnerships with accountable government agencies and interested groups to combine resources and increase the effectiveness of existing programs. Throughout the State of Utah a series of ten nested management units provide spatial focus to watershed management activities, thereby improving coordination. Watershed management units in the State may contain more than one stream system, or watershed, defined as the entire area drained by a stream and its tributaries. Watershed management units are consistent with the hydrologic basins defined by the Utah Department of Natural Resources - Division of Water Resources for the State Water Plan project (Utah Division of Water Resources, 1990). The watershed management units provide boundaries for evaluating the impact of various stressors on commonly shared resources, provide boundaries for evaluating the impacts of management actions, and provide a better perspective for DWQ and stakeholders to determine environmental objectives and to develop management strategies that account for local and regional considerations. Each watershed plan will establish management actions at several spatial scales ranging from the watershed scale to specific sites that are influenced by unique environmental conditions. Watershed plans consider a holistic approach to watershed management in which groundwater hydrologic basins and eco-regions encompassed within the units are considered. The goal of Utah's watershed approach is better coordination and integration of the State's existing resources and water quality management programs to improve protection for surface and groundwater resources. Better coordination and integration extends beyond the tiers of government agencies to include all stakeholders in the watershed. Utah’s watershed approach is based on hydrologically defined watershed boundaries and aims to de-emphasize jurisdictional delineations in watershed management efforts. This approach is expected to accelerate improvements in water quality as a result of increased coordination and sharing of resources. Statewide watershed management is not a new regulatory program, it is a means of operating within existing regulatory and non-regulatory programs to more efficiently and effectively protect, enhance, and restore aquatic resources. The Statewide watershed management approach has been introduced to establish a framework to integrate existing programs and coordinate management activities geographically (DWQ, 2000c). In addition to the technical components, Utah’s watershed approach is dependant on the critical role stakeholders play in watershed water quality management. The success of the implementation plan, and ultimately the restoration of water quality, depends on the voluntary participation of the stakeholders in Utah's watersheds. Therefore, to be successful, the TMDL development approach must ensure public participation and input at critical points throughout the process. A successful water quality management plan and TMDL relies as much on voluntary stakeholder participation and buy-in as on the rigor of technical analysis. The advantages of involving stakeholders throughout the TMDL development and implementation process are numerous. Through their voluntary participation, the stakeholders can become more comfortable that the monitoring and modeling programs generate reliable data that are scientifically defensible. Further, effluent limits and BMPs developed by the Stakeholders are less prone to credibility challenges and litigation. Stakeholders are more apt to agree to pollutant reduction or habitat improvement schemes that they helped to formulate.

4
The boundaries of watershed management units in Utah were drawn so that stakeholders would be aggregated or grouped into areas sharing common environmental characteristics. Defining watershed management units in this way is intended to encourage a sense of ownership in the resident stakeholders and to encourage involvement in stewardship activities. Based on a model successfully used by other states, the program draws on the expertise of those involved in or affected by water quality management decisions. These stakeholders help gather information and design BMPs, then become involved in stewardship activities. In the Paria River watershed, both governmental and non-governmental entities worked to achieve a skillful and honest presentation of technical information to the Canyonlands Soil Conservation District throughout this study. These efforts have resulted in a Water Quality Management Plan that assures control of nonpoint source pollution that are acceptable to those living and working in the watershed.
1.4 Watershed Characterization 1.4.1 Location and Population
The Paria River is located in Garfield and Kane Counties in southern Utah and contained in part within the GSENM (Figure 1-1). The locations of the water quality limited sections of the Paria River are also indicated in Figure 1-1.
Garfield County had the fifth smallest population in the State of Utah, 4,599 in 2002, and is the least densely populated1. The county’s average annual growth rate from 1990-2000 was 1.8%; lower than the state average of 2.7%. Total nonagricultural employment totaled 2,129 in 2001 in Garfield County. Services accounted for the greatest share of nonagricultural employment at 45.2% and government accounted for 28.7% of Garfield County’s 2001 employment. Agriculture and trade were also important. Growth in tourism-related industries is expected to continue at a more accelerated pace because of the designation in 1996 of the GSENM. Garfield County had 121,381 acres of private land on 285 farms; 116 were full-time farms (1997). The market value of agricultural products sold was $7.6 million in 1997; crop sales accounted for 18% of agricultural products and livestock sales for 82%. Cattle, hay, dairy products, and sheep are all significant agricultural products of the county. There are 3,330,924 land acres in Garfield County. Of that amount, 90% is federally owned, while 5.4% is state owned. The remaining land in Garfield is privately owned, owned by municipal organizations, or state sovereign lands. Kane County’s population was 5,958 in 2002. With a population density of 1.5 persons per square mile, the county was one of the least densely populated in the state. Kane County sustained an average growth rate of 1.6% per year from 1990 to 2000. Kane’s Census 2000 average household size, 2.67 people, was one of the lowest in the state. By 2030, Kane County’s population is expected to swell to over 13,628 people. Nonagricultural employment reached 2,902 in 2001. Services (41%) and government (25.4%) accounted for the largest shares of employment. Manufacturing (12.9%) and trade (12.7%) also occupied an important presence. Kane’s economy is specialized in tourism-related industries, agriculture, and non-metallic minerals extraction.
1 County Economic Profiles. Governor’s Office of Planning and Budget, Demographic and Economic Analysis. http://governor.utah.gov/dea/WrittenProfiles.PDF

5
Figure 1-1 Location of Paria River

6
1.4.2 Land Use/Land Cover Land ownership patterns are shown in Map 6, and summarized in Table 1-1. The northern end of the watershed is bordered by Bryce Canyon National Park and Dixie National Forest. Below the national park and forest service boundary the watershed, excluding private land, has been incorporated into the GSENM.
Table 1-1 Landownership Patterns in the Paria Study Area
Land Ownership Area (square miles) Watershed BLM USFS NPS Utah Private Total Paria River Reach-1 (Paria Reach-1) 34.1 14.7 5.1 10.8 Rock Springs Creek1 50.1 1.5 0.6 5.2 57.4 Henrieville Wash 53.4 5.4 0.8 4.0 63.6 Yellow Creek 8.2 4.6 0.7 2.1 15.7 Henderson Creek 10.5 16.6 0.1 2.1 29.2 Tropic Ditch 3.9 0.7 17.6 0.6 6.0 28.8 Total 160.3 38.9 22.1 7.9 30.2 194.7 Paria River Reach-3 Kitchen Corral Creek2 292.3 10.3 4.0 1.2 17.8 325.7 Sand Gulch 36.6 3.7 40.3 (Paria Reach-3) 62.2 12.2 1.4 75.9 Total 391.1 10.3 4.0 13.4 22.9 441.8 Notes to Table: Subwatersheds Reach-1 and Reach-3 (in parentheses) are the land areas that drain directly to the river, and do not include the tributaries in the table. 1 Rock Springs Creek with Wiggler Wash tributary as headwaters. 2 Kitchen Corral Creek with Deer Springs Wash tributary as headwaters.
The Paria River occurs within the Grand Staircase physiographic region. The Grand Staircase region is a series of multi-colored cliffs which begin at the rim of the Grand Canyon, and ascend nearly 5,500 feet across the southwestern side of GSENM, to end with a final stair of pink cliffs in Bryce Canyon National Park. These stairs consist of "risers" of resistant and non-resistant rock formations up to 2,000 feet high, and "treads" which are valleys or plateaus up to 15 miles wide. The stairs include the Chocolate Cliffs, Vermilion Cliffs, White Cliffs, Gray Cliffs, and Pink Cliffs, all large expanses of exposed, virtually undeformed rock strata which provide a relatively continuous stratigraphic record from Grand Canyon (Precambrian) to Bryce Canyon (Tertiary). Map 5 shows the vegetation patterns as identified by the Utah GAP vegetation analysis. GAP refers to a process to identify “gaps” in protection of high biodiversity areas for wildlife species. The resulting maps characterize plant communities at a broad scale, and are not particularly useful for streamside zones. Vegetation in Paria River Reach-1 transitions from mountain shrub and juniper at higher elevations and wetter sites to salt desert scrub. In Paria River Reach-3, salt desert scrub transitions to blackbrush communities toward the Arizona border.
1.4.3 Geology and Soils The Paria River flows through a series of topographic benches and cliffs that form the Grand Staircase region. From its headwaters approximately 5 miles northeast of Tropic, Utah, to where it joins the Colorado River near the town of Lee's Ferry, Arizona, the Paria River cuts through

7
sedimentary strata of several geologic formations ranging from Late Triassic to Early Tertiary (middle to late Eocene) in age. The upper Listed Section of the Paria River flows through the Claron Formation in the northern most part of the study area. The Claron is characterized by upper white limestone and lower pink limestone members (Bowers, 1972), which are continuous throughout the Markagunt, Paunsaugunt, Seiver and Table Cliffs Plateaus (GSA, 2002). As the river flows south to Cannonville (near STORET 495187), it crosses the Wahweap Sandstone and Tropic Shale Formation and Dakota Sandstone. The Wahweap is composed of interbedded mudstones, siltstones sandstones, and conglomerates (Doelling, et al., 2000), that accumulated in fluvial, flood plain and lacustrine environments. Locally rich fossil-bearing sections of the Wahweap contain petrified wood, vertebrates (including dinosaurs), and gastropods. The Tropic Shale is characteristically blue-gray in color and represents deposition of muds in a deep water marine environment. It forms distinctive slopes that are prone to landslides and slumps that likely contribute much of the sediment loading to the Paria. Bentonite beds are abundant throughout the Tropic Shale and are correlated with well established ammonite biozones (Cobban, et al., 2000) The lower part of the Tropic Shale contains limestone concretions, rich in molluscan fauna, whereas the upper Tropic becomes sandy (GSA, 2002). The Dakota Sandstone is composed of sandstone, conglomerate, mudstone, siltstone and coal deposited in coastal flood plain and shallow marine environments. Approximately 8 miles south of Cannonville, the Paria River crosses the Entrada and Carmel formations of middle Jurassic age. The Entrada is highly variable, but is most often associated with cross bedded eolian sandstones in the region (Peterson, 1994). The Entrada has three members (Gunsite Butte, Cannonville, and Escalante) consisting of white to reddish-orange, silty to fine grained sandstones with sparse, medium to coarse frosted sand grains (Doelling, et al., 2000). Lower Jurassic formations (Navajo Sandstone, Kayenta Formation, Moenave Formation and Wingate Sandstone) are well developed in the Vermillion Cliffs, Wygaret Terrace and White Cliffs. They consist predominantly of red sandstones (Moenave and Kayenta Formations) that are crossed by the Paria River in the lower part of the upper Listed Section (Reach-1). The lower Listed Section Paria River begins approximately 2 miles south of STORET Site 599455. Here, the Paria again crosses Entrada/Carmel Formation, Wahweap Sandstone, Tropic Shale, Dakota Sandstone and Navajo/Kayenta/Moenave Formations, as it flows south to the Arizona Border. Throughout much of its entire length the Paria River flows through alluvium. From STORET Site 495192 to the end of the upper Listed Section, the Paria flows through thick deposits of Quaternary age alluvium. In the lower Listed Section, the Paria flows almost entirely though alluvium. These valley-fill deposits are extensive, extending across the entire width of the valley between bedrock margins. The alluvium formed by repeated (cut and fill) episodes of valley erosion and stream entrenchment followed by aggradation and build up of the stream bed (Hereford, 1997). Considering the geology of the Paria River Watershed, the Tropic Shale is identified as a potential source of TDS to the Paria River. Given its deposition in a marine environment it contains salts that could leach out to surface and groundwater. Furthermore, because its slopes are prone to landslides and slumps, percolating surface waters could also carry significant loads of saline sediments to the Paria River.

8
Soils data and GIS coverages from the Natural Resources Conservation Service (NRCS) were used to map soils in the Paria River Watershed. General soils data and map unit delineations for the area are provided as part of the State Soil Geographic (STATSGO) database. Identification fields in the GIS coverage can be linked to a database that provides information on chemical and physical soil characteristics. Map 4 shows the general soil unit boundaries in the Paria River Watershed.
1.4.4 Climate Extreme changes in weather are characteristic of the canyons and plateaus of the Grand Staircase region. Powder-dry arroyos can change suddenly into boiling, muddy stream channels by thunderstorms many miles away. Scorching desert heat during the day gives way to cold, clear nights. During the summer months, small springs and tinajas (small temporary rock pools) provide oasis for wildlife. When winter arrives, bitter cold temperatures rule the canyons, while snows blanket the higher plateaus. Annual precipitation varies from about 6 inches at the lowest elevations to approximately 25 inches at the highest elevations. The variation in elevation and precipitation produce three different climate zones: upland, semi-desert, and desert. At the highest elevations, precipitation falls primarily in the winter as snow. The majority of rainfall in the semi-desert areas occurs during the summer months as intense but localized thunderstorms. The climatic zones for the GSENM are summarized in Table 1-2 (BLM, 1999).
Table 1-2 Climate zones for the GSENM including Paria River Watershed
Desert Semi-desert Upland Precipitation (inches) 6 to 8 8 to 12 12 to 16 Soil temperature (degrees F) 50 to 57 47 to 55 43 to 50 Frost Free Period (days) 170 to 300 125 to 170 100 to 125 Elevation (feet) 4,000 to 4,800 4,800 to 6,200 6,200 to 7,500
The weather station at the town of Tropic, Utah (6295 feet elevation) is the closest long term climate station (Station Number 428847). Data was obtained from the Western Regional Climate Center (WRC) operated by the Desert Research Institute (Reno, Nevada), a clearinghouse for the National Climatic Data Center. The average monthly temperatures and average total precipitation for the 52-year period are shown in Table 1-3. The months of June, July and August are the warmest months during the year with average maximum temperatures between 80 - 85 degrees Fahrenheit. The higher precipitation in the late summer is due to the monsoon-type weather that influences climate in southern Utah. Additional climatic summaries for the Paria weather station (428847) are provided in Appendix 5.
Table 1-3 Monthly Climate Summary, Tropic Utah (428847)
Jan Feb Mar Apr May Jun Jul Aug Sep Oct Nov Dec Annual
Average Max. Temperature (F) 41 46 52 61 70 80 85 83 76 65 52 43 62.7
Average Min. Temperature (F) 15 19 24 30 37 45 52 50 43 34 24 17 32.3
Average Total Precipitation (in.) 1 1 1 0.7 0.7 0.5 1.1 1.8 1.2 1.2 0.9 0.9 12.08

9
Utah is experiencing a drought cycle that has influenced both the flow and TDS measurements in the Paria River system. Previous droughts occurred during 1896-1905, 1930-36, 1953-65, 1974-78, and more recently during 1988-93 and 1999-2002 (USGS 2003). Southern Utah began experiencing drought conditions during the winter of 1998-99. By 2000, drought conditions were evident throughout all of Utah. The current drought (1999-present) is generally comparable in length and magnitude to previous droughts. During 2002, the fourth straight year of nearly statewide drought conditions, some areas of Utah experienced record-low stream flows. Several record-low stream flows occurred in streams with records dating back to the 1900s.
The intensity and duration of the drought is illustrated by precipitation for the recent 10-year period (Figure 1-2) prepared by the Utah Division of Water Resources for the Southeast Colorado River Basin2. The figure uses a water year, which runs from the previous October 1st through September 30th.
Figure 1-2 Average Precipitation for Southeast Colorado for the Most Recent 10-Year Period (Utah Division of Water Resources website)
The recent five-year period starting with Water Year 2000 (October 1999) is well below the average precipitation when compared to the 30-Year average annual precipitation for the region. The TDS data available in STORET needs to be interpreted in the context of the drought when making policy and regulatory decisions.
2 Basin Drought Reports. Utah Division of Water Resources. http://www.water.utah.gov/droughtconditions/BasinDroughtReports/SeColorado/default.asp
Southeast Colorado River BasinAverage Precipitation for 3 Mountain Snotel Sites
05
101520253035
20042003
20022001
20001999
19981997
19961995
19941993
Water Years(dashed line - 30-year average annual precipitation 1961-1991)
Prec
ipita
tion
(inch
es)

10
1.4.5 Surface Water Hydrology Map 1, Watershed Overview, shows the primary stream network. Although indicated as a continuous blue line many of the stream reaches are not perennial. BLM roughly estimated that 10% of the 2,500 miles of stream channels and washes on the GSENM are perennial, (BLM 1999). The map delineates the 303(d) Listed Sections of the Paria River (Reach-1 and Reach-3) in red. The middle section of the watershed is not listed as a water quality limited stream segment. Paria River Reach-1 includes the headwaters of the Paria River and four major tributaries. Tropic Ditch is used for irrigation in the irrigated lands near the town of Tropic, bringing in irrigation water originating in the Sevier River basin. A smaller irrigation tract occurs within the vicinity of Cannonville and Henrieville. Watershed area and elevation are summarized in Table 1-4. The lower listed section, indicated as Reach-3 on Map 1 includes the Paria River from the Arizona-Utah Stateline to the confluence with Cottonwood Creek. Two major tributaries enter within the listed section; Sand Gulch that runs along Highway 89, and Kitchen Corral Creek that drains a large subwatershed on the western side of the basin. In addition, there are a number of washes and spring systems that drain into this reach of the river. The quantity and quality of water in these potential tributaries however is unknown.
Table 1-4 Watershed Characteristics within the Paria Study Area
Watershed Stream Miles
Sq mi Elevation (ft)minimum
Elevation (ft)maximum
Elevation (ft) mean
River Mile Index
Paria River Reach-1 21.0 39 to 60 Rock Springs Creek1 17.8 57.4 5,431 9,245 6,579 39 Henrieville Wash 15.4 63.6 5,741 10,073 6,914 46 Yellow Creek 9.3 15.7 5,669 8,292 6,628 50 Henderson Creek 12.2 29.2 6,093 10,270 7,752 50.5 Tropic Ditch 6.5 28.8 6,082 8,290 7,031 51 Paria River Reach-3 19.4 0 to 19.5 Kitchen Corral Creek2 46.8 325.8 4,323 9,392 6,178 0.1 Sand Gulch 14.9 40.3 4,360 6,712 5,293 9.5 Paria River TMDL Reach 3
Notes to Table: River/creek miles are approximate and measure the length of the primary channel as indicated as the blue and red lines on Map 7. 1 Rock Springs Creek with Wiggler Wash tributary as headwaters. 2
Kitchen Corral Creek with Deer Springs Wash tributary as headwaters.
Narrative Description of Surface Hydrology in the Paria River Basin
The Paria River drains the GSENM's west central area into Arizona and eventually the Colorado River. The towns of Tropic, Cannonville, and Henrieville, located high in the drainage, are the highest concentration of private and municipal water rights. Most of the mainstem of the Paria River within the GSENM flows on a perennial basis, with small reaches near the upper and lower extremities of the river within the Monument that are typically dry. The flowing reaches are fed by subsurface flows, springs and other groundwater expressions, and by bank storage after high flows.

11
A four-mile section of Cottonwood Creek is also perennial, but the creek is normally dry about 2 miles above its confluence with the Paria River. The gaining reaches of the Paria River and Cottonwood Creek are followed by losing reaches that are intermittent, flowing only after precipitation events. Little or no water storage occurs upstream of the GSENM. All upstream depletions result from direct diversions.
A BLM assessment3 noted that the Paria River is depleted but still flowing when it reaches the northern GSENM boundary. However, shortly after entering GSENM the Paria River commonly dries up for about one mile, then reappears and flows continuously until a point about four miles from where it again leaves the Monument boundaries. Outside the irrigation season, lesser upstream depletion results from the municipal uses of the towns of Tropic, Cannonville, and Henrieville. The USGS gage “Paria River near Cannonville”, with 20 years of record (1951-55 and 1959-74), is located inside GSENM in the intermittent reach of the river, below the stream emerging from Little Dry Valley but upstream of the river’s confluence with Rock Springs Creek, and shows a mean daily flow of 9.08 cubic feet per second (cfs) despite the intermittent character of the stream in this reach.
Water stored in Tropic Reservoir is imported from the Sevier River drainage via the “Tropic Ditch”. Upstream use has a more substantial impact on base flows near the northern boundary of the GSENM. Henrieville Creek contributes flow to the Paria River downstream from the irrigated lands. Three miles inside GSENM the Paria River becomes perennial at the confluence with Rock Springs Creek.
Other water-related concerns in the Paria River drainage relates to this stream as a source of sediment and salinity loading to the Colorado River system, largely as a result of the geologic formations through which it passes (claystone and siltstone of the Chinle Formation and Tropic Shale).
US Geological Survey (USGS) Stream Gaging Stations There are two USGS stream gaging stations located within the Listed Sections: one in Reach-1 at Paria River near Cannonville, Utah; and the second station on Reach-3 at Paria River near Kanab, Utah. The USGS gaging station number, name, and period of data coverage are summarized in Table 1-5. The locations of these gaging stations are shown on Map 7. The Paria River near Kanab gage was restarted January, 2002. Data for the Paria River near Kanab gage was initiated September, 2002, but the data is not yet available.
Table 1-5 USGS Stream Gaging Stations
USGS Gage Station # USGS Gage Name Data Coverage 093381500 Paria River near Cannonville, Utah 12/1950 - 09/1955 and 01/2002 - Present093381800 Paria River near Kanab, Utah 09/2002 - Present
3 Chapter 3, Affected Environment. EIS for the Grand Staircase-Escalante National Monument. (BLM 1999).
Note: The 1959-1974 stream gage records are only peak stream flow measurements.

12
Figure 1-3 Historical Flows Compared to 2002 and 2003 Flows
Average monthly flow for 2002 and 2003, the period of analysis for this report, compared to historical monthly flows is shown in Figure 1-3. The historical record covers only the period from January 1950 to September 1955, which is generally an insufficient period of time to estimate normal flow patterns; however, it is useful in placing the 2002 and 2003 flows into context. Years 2002 and 2003 experienced lower monthly flows than normal (50th percentile) and below normal (20th percentile) 4 flows in the winter and spring in 2002, and above average flows in the fall. Year 2003 appeared to be comparable to the 1950’s record with above average flow in September. It should be noted that USGS considers the period 1953-1965 as one of the cyclic drought periods in southeastern Utah.
1.4.6 Groundwater Hydrogeology Hydrogeology refers to the occurrence and movement of water below the Earth’s surface. The source of groundwater and its quality, and whether the Paria River loses or gains water along the Listed Sections, are of particular importance. Surface water and groundwater interactions with saline (marine) rocks and soils can significantly increase TDS concentrations in the Paria River. Groundwater is present in most of the consolidated rocks within the area. Freethy (1997) suggests that the period of major recharge for these aquifers was prior to 10,000 years ago during the waning stages of the last glacial period. Five regional aquifers occur within the watershed (Figure 1-4). In descending aquifer location, these are the: (1) Mesaverde aquifer, including Straight Cliffs and Wahweap Formations; (2) Dakota Formation aquifer; (3) Morrison Formation aquifer; (4) Entrada Formation aquifer; and (5) Glen Canyon aquifer including the Navajo, Kayenta, and Moenave (Wingate) Formations.
4 The 50th percentile is considered a “normal” year. The 20th percentile is considered “below normal”.
USGS Gage Paria River near Cannonville, Utah
02468
101214161820
Jan Feb Mar Apr May Jun Jul Aug Sep Oct Nov Dec
Flow
(cfs
)
50th Percentile 20th Percentile 2002 2003

13
The Glen Canyon aquifer is the thickest and most extensive of the principal aquifers. The rocks of the Glen Canyon aquifer are exposed in the Grand Staircase and in the Escalante Canyons regions of the Monument, but lie in the subsurface beneath the Kaiparowits Plateau to depths approaching 4,500 feet. The volume of water contained within the aquifer is estimated to be greater than 400,000,000 acre-feet (Freethy, 1997). In recharge areas of the Glen Canyon aquifer, or where water table conditions exist (unconfined parts of the aquifer), the water is generally fresh (<1,000 mg/L total dissolved solids (TDS)) and of the type calcium magnesium, bicarbonate. Where the Glen Canyon aquifer is confined, primarily beneath the Kaiparowits Plateau, ground water is generally slightly saline (1,000 to 3,000 mg/L TDS), and is sodium, sulfate type. The lowest TDS concentration in ground water occurs in the Glen Canyon aquifer (191 mg/L). The highest TDS concentration in ground water occurs in the Mesaverde aquifer (5,920 mg/L). The lowest TDS concentration in streams is in Boulder Creek (172 mg/L). The highest TDS concentration in streams is in the Paria River (3,980 mg/L). The potentiometric surface within the Glen Canyon aquifer in areas near Lake Powel has risen as much as 357 feet due to the inundation by the lake (Blanchard, 1986). Public Water Reserves were established by Executive Order of April 17, 1926. They were established to reserve for general public use all important springs and water holes on public lands, and to prevent monopolization of the public domain through control of these water sources. There are 248 public water reserves within the GSENM. Water resources research in the Monument has been limited to studies of historic and prehistoric flooding events (Webb, 1985) and assessment of groundwater aquifers in anticipation of coal development in the Kaiparowits Plateau (Blanchard, 1986). Several stream courses within the GSENM are perennial, but most are ephemeral, experiencing periodic flooding during storm runoff. Springs issue where canyons cut into the saturated zones of aquifers.
Figure 1-4 Regional Aquifers in the Paria River Area (BLM 1999)

14
2.0 WATER QUALITY CRITERIA
2.1 Beneficial Uses and 303(d) Listed Section
The Paria River and its tributaries are identified as having the following beneficial uses: Class 2-B secondary contact recreation, Class 3C- non-game fishery, and Class 4 - agriculture (Standards of Quality for Waters of the State § R317-2, UAC).
Two reaches of the Paria River are listed on Utah’s 2002 303(d) list (DWQ, 2002) for waters requiring the development of a TMDL due to the exceedence of TDS criteria for beneficial use Class-4 (agriculture), including irrigation of crops and stock watering. The Listed Sections are described in Utah's Year 2000 303(d) list and summarized in Table 2-1. The 303(d) Listed Sections, watershed boundaries, and other descriptive features are illustrated on Map 1.
Table 2-1 303(d) Listed Segments in the Paria River Watersheds
Waterbody ID Waterbody Name
Waterbody Description HUC Unit Beneficial Use Class
Perennial Stream Miles
Cause
UT14070007-001 Paria River-1 "Reach -1"
Paria River from confluence of Rock Springs Creek to headwaters
14070007 4 17.01 TDS
UT14070007-005 Paria River-3 "Reach-3"
Paria River from Arizona-Utah Border to confluence of Cottonwood Wash
14070007 4 12.09 TDS
2.2 Water Quality Standards Utah’s Standards of Quality for Waters of the State (§R317-2, UAC) establishes the numeric criterion of 1,200 mg/L TDS for protection of beneficial use Class 4 (agricultural) waters. In addition, the Utah Standards of Quality for Waters of the State also provide numeric criteria for pH, boron, and metals as summarized in Table 2-2.
Table 2-2 Utah Water Quality Criteria for TDS and Related Parameters
Parameter Criterion, Maximum Concentration Target Parameters*
Total Dissolved Solids 1,200 mg/L Secondary Parameters**
pH 6.5 - 9.0 pH units Boron 0.75 mg/L Arsenic 0.10 mg/L Cadmium 0.01 mg/L Chromium 0.10 mg/L Copper 0.20 mg/L Lead 0.10 mg/L Selenium 0.05 mg/L
Utah's Water Quality Standards clarify that TDS limits may be adjusted if such adjustment does not impair the designated beneficial use of the receiving water.

15
Additional criteria are used to determine the degree of beneficial use support. Utah's 2002 303d list (DWQ, 2002) provides guidance on how to apply the numeric water quality criteria for determining the degree of beneficial use support. These criteria are used to evaluate the listing and delisting of a waterbody. The 303(d) criterion for assessing the degree of support for beneficial use Class 4 is provided in Table 2-3.
Table 2-3 303(d) Criteria for Assessing Agricultural Beneficial Use Support - Class 4
Degree of Use Support
Conventional Parameter (Total Dissolved Solids - 1,200 mg/L) Toxic Parameters
Full Support Criterion exceeded in less than two samples or in less than 10% of the samples if there were two or more exceedances.
For any one pollutant, no more than one violation of criterion.
Partial Support Criterion was exceeded two times, and criterion was exceeded in more than 10% but not more than 25% of the samples.
For any one pollutant, two or more violations of the criterion, but violations occurred in less than or equal to 10% of the samples.
Non-Support Criterion was exceeded two times, and criterion was exceeded in more than 25% of the samples.
For any one pollutant, two or more violations of the criterion, and violations occurred in more than 10% of the samples.
Based on the above criteria, Utah's 2002 303(d) list identified two sections of the Paria River as non-supporting based on exceedence of the TDS concentrations.
Relation of Total Dissolved Solids to Beneficial Uses
TDS is listed as a criterion for protection of agricultural uses because of the negative effect of high salinity on crop production. The major components of salinity are the cations: calcium, magnesium, and sodium; and the anions: chlorine, sulfate, and bicarbonate. Potassium and nitrate ions are minor components of salinity. Salinity reduces crop growth by reducing the ability of plant roots to absorb water (known as salinity hazard), and is evaluated by the relationship of salt tolerance to crops. Unlike salinity hazard, excessive sodium does not impair the uptake of water by plants, but does impair the infiltration of water into the soil. The growth of plants is, thus, affected by the availability of water. The reduction in infiltration of water can usually be attributed to surface crusting, the dispersion and migration of clay into the soil pores, and the swelling of expandable clays. The hazard from sodium is evaluated using the Sodium Absorption Ratio (SAR), a ratio of sodium to calcium and magnesium in the irrigation water; in relation to the irrigation water TDS (Tanji, 1990).
Boron is the primary toxic element of concern in irrigation waters. Boron is an essential trace element at low concentrations, but becomes toxic to crops at higher concentrations. Other trace elements, as listed in Table 2-2 above, are potentially toxic to plants and animals. High pH (pH > 9.0) directly and adversely affects infiltration as well as limiting calcium concentrations and contributing to high SAR.

16
3.0 IMPAIRMENT ANALYSIS
3.1 Geographic Extent of the Water Quality Management Plan The Water Quality Management Plan (WQMP) addresses only the 303(d) listed sections of the Paria River: Reach-1, Paria River from confluence of Rock Springs Creek to headwaters, and Reach-3, Paria River from Arizona-Utah Border to confluence of Cottonwood Wash. These river sections are defined in the 303(d) listing (Table 2-1) and are shown on Figure 1-1 and Map 1.
3.2 Water Quality Data in STORET The most complete water quality monitoring station summaries and water quality observation data for the Paria River exist in the STORET database. STORET, short for STOrage and RETrieval, is a repository for water quality, biological, and physical data and is used by state environmental agencies, EPA and other federal agencies, universities, private citizens, and many others. Each data entry in the STORET database is accompanied by information on where the sample was taken (latitude, longitude, state, county, Hydrologic Unit Code, and a brief site identification), when the sample was gathered, the medium sampled (e.g., water, sediment, fish tissue), and the name of the organization that sponsored the monitoring. The STORET database for the Paria River contains 21 stations. These stations are listed in Appendix 3. Of these 21 stations, the Arizona Department of Environmental Quality, Water Quality Division, provided data for seven stations. Of these seven stations, three are on the Utah border and within the Paria River Reach-3 Listed Section. DWQ and BLM collected data for the other 14 stations. There are 330 TDS measurements in the STORET database for the Paria River. The Arizona stations have specific conductance (SC) data, but no TDS data for the Paria River. There are 374 SC measurements in the STORET database and 244 of these SC measurements have associated TDS measurements for the Paria River. Therefore, TDS values were generated from the SC data using a ratio between the measured TDS and SC data pairs. The conversion for TDS is 0.687 times the SC (umhos/cm). It should be noted that a regression analysis was calculated, but was a poor predictor at lower values. For the Arizona data set, 76 TDS values were generated using the conversion factor. For the remaining STORET data, 130 TDS values were generated. The calculated TDS values were combined with the measured TDS values into one data series (marking the calculated values in bold text and using one decimal point to maintain the distinction between calculated and measured values) as shown in Appendix 3. A summary of available TDS data for the Paria River, including the TDS values generated from SC data, are summarized in Table 3-1. As shown in Table 3-1, seven of the 17 stations have more than 10% exceedence of the TDS criteria for the period of record. It should be noted that two of the STORET stations that exceed the TDS criteria (599434 and 599435) are located on tributaries that flow to a segment of the Paria River that are outside the Listed Sections. Statistical Assessment of Data A statistical summary of data for the 17 STORET stations listed in Table 3-1 is provided in Appendix 3. Although not all of these stations would likely be used in the TMDL calculations, they may shed some light on the distribution of TDS in the watershed and therefore aid in identifying source contributions. For each station the data is tabulated and followed by descriptive statistics. The statistics list the number, mean, median, standard deviation, minimum, maximum, number greater than the criteria, and percent exceedence.

17
Table 3-1 Summary of STORET Stations and Available TDS Data
STORET Description MeanTDS
MaxTDS
% TDS Exceed-
ence
No. of TDS
Values
Begin Date
End Date
No. of TDS
Values 1993-2002
Paria River Reach -
495191 Tropic Ditch at U12 crossing
229 267 0 11 09/17/97 09/25/02 20 1
495192 Paria River 3 Miles NNE of Tropic
436 526 0 6 04/30/98 06/09/98 6 1
495187 Paria River at U12 crossing
923 1400 18 30 01/27/81 12/31/02 47 1
495190 Henrieville Wash at U-12 crossing 8 Miles East of Cannonville
387 530 0 27 08/20/98 12/30/02 38 1
495189 Henrieville Wash 3 Miles East of Cannonville
914 2048 14 49 09/17/97 12/31/02 49 1
495186 Paria River at Kodachrome Basin Road crossing
1651 4030 50 16 10/04/00 12/31/02 18 1
599434 Sheep Creek at Skutumpah Road crossing
1553 2086 96 23 08/27/98 12/31/02 27 2
599435 Willis Creek at Skutumpah Road crossing
1210 1642 80 10 09/21/98 11/27/02 15 2
599455 Paria River at Old Town Site
957 1640 7 54 08/13/98 08/12/02 85 2
599471 Cottonwood Creek Above Confluence with Hackberry Canyon
657 1264 4 26 08/13/98 04/24/01 38 3
599454 Hackberry Canyon Above Confluence with Cottonwood Creek
287 481 0 43 10/06/98 04/24/01 48 3
495185 Paria River At US89 crossing
1174 2564 37 132 02/04/76 07/17/02 78 3
599465 Deer Spring Wash Below Deer Spring Ranch
822 1086 0 31 09/25/98 08/12/02 41 3
599461 Nephi Wash Spring Development
1062 1980 25 8 08/08/98 08/16/02 12 3
101078 Paria River above Buckskin Gulch
840 1156 0 10 10/01/98 07/28/00 10 3
101079 Buckskin Gulch 244 400 0 10 10/01/98 07/28/00 10 3 101077 Paria River below
Buckskin Gulch 659 1116 0 9 03/03/99 07/28/00 9 3
Stations highlight in grey are located on tributaries to or on Paria River Reach-2, that is not on the 303(d) list.

18
Reliability and Applicability of the TDS Data Set for the TMDL The Paria River Listed Sections are comprised of two separate and disconnected stream reaches: Paria River Reach-1 the upper watershed, and Paria River Reach-3 the lower watershed. The middle reach (Paria River Reach-2), approximately 20 river miles in length, is not a 303(d) listed section. The Listed Sections of the Paria River are discussed in detail below. Paria River Reach-1: From the Confluence of Rock Springs Creek to the Headwaters: Paria River Reach-1 is located near the communities of Tropic, Cannonville, and Henrieville in Garfield County. Tropic Ditch and Henrieville Wash are tributaries monitored within this Listed Section. TDS increases in concentration from the STORET stations higher in the watershed to the Paria River at Kodachrome Basin Road (station 495186). The Paria River at this station exceeds TDS criteria 50% of the time (see Table 3-1) indicating a source of salinity within the reach. Willis Creek enters below the Paria River Reach-1 Listed Section, near river mile 36 (see Map 7) and is therefore not a source for this Listed Section. Also, as an ephemeral stream, the confluence of Willis Creek and Paria River Reach-2 is located more than 20 miles above the upper boundary of Paria River Reach-3, and is therefore not expected to be an important TDS contributor to the lower Listed Section. Willis Creek, and its tributary Sheep Creek, however, exhibit high TDS concentrations (see Table 3-1) indicating a salinity source on the west side of the watershed. These stations may be helpful in associating surface water and groundwater TDS with saline rock types and soils. Paria River Reach-3: From the Arizona-Utah Border to Confluence of Cottonwood Wash Two STORET stations can be used to measure TDS entering the lower Paria River Reach-3 Listed Section. Paria River at Old Town Site (599455) and Cottonwood Creek above confluence with Hackberry Canyon (599471) exhibit fairly low TDS concentrations. The station in Hackberry Canyon (599454), a tributary to Cottonwood Creek, has particularly low TDS concentrations, indicating the variable pattern of TDS sources in this region. Ten miles downstream from the Cottonwood Creek confluence with the Paria River the TDS concentrations increase again where Highway 89 crosses the Paria River (495185) and TDS exceeds the criteria 37% of the time. This station on the Paria River at US89 (495185) represents the practical boundary compliance point for TDS on the Paria River Reach-3 Listed Section. The remaining stations monitored in the watershed do not appear to contribute TDS to the Listed Sections. Two stations located on tributaries to the Paria River, Deer Spring (599465) and Nephi Wash Spring (599461), are monitored on the west side of the watershed and are over 30 river miles from the confluence with the Paria River; and the Paria River station below their confluence (101078) has no TDS criteria exceedences. In addition, these small tributaries have very low flows, generally less than 0.5 cfs. The lower three stations at the Utah-Arizona border illustrate again the extreme TDS variability along the Paria River. The mean TDS concentration at the Utah border stations (101078, 101079 and 101077) are 840 mg/L, 244 mg/L and 659 mg/L, respectively and well below the Utah TDS criteria. 3.3 SOURCE ASSESSMENT In evaluating the water quality data and land use patterns it is apparent that the predominant source of TDS loading into the Paria River is from naturally occurring saline geologic formations prevalent throughout the watershed, particularly Tropic shale. Therefore we are proposing the development of site specific criteria that reflects the natural background concentrations of TDS in the Paria River.

19
4.0 TMDL/SITE-SPECIFIC CRITERIA Development of site-specific criteria is recommended for the Listed Sections of the Paria River since the information available indicates that the observed spike in TDS at the lower end of the Paria River Reach-1 is due to inputs from a shallow alluvial aquifer. Paria River Reach-3 is located in a sparsely populated and relatively undeveloped landscape with no known anthropogenic sources of TDS. Guidance for developing site-specific criteria is summarized in two memorandums issued by EPA. A Region 8 Memorandum (Moon 1997) addressed procedures for Use Attainability Analysis and Ambient Based Criteria, and a memorandum from EPA Office of Science and Technology (Davies 1997) addressed the subject: Establishing Site-Specific Aquatic Life Criteria Equal to Natural Background. These two memoranda were consulted for guidance and direction in developing site-specific criteria for the Paria River. The applicable points from these memoranda for developing site-specific criteria are:
1. Site-specific criteria are allowed by regulation subject to EPA review and approval; 2. Site-specific numeric aquatic life criteria may be set equal to natural background where
natural background is defined as: background concentrations due only to non-anthropogenic sources; and
3. Previous guidance provided the direction to use the 85th percentile of the available representative data for natural ambient water quality conditions.
The Utah Standards of Quality for Waters of the State provide for adjustment of site-specific standards to background where the adjustment does not impair designated beneficial uses.
“Total dissolved solids (TDS) limits may be adjusted if such adjustment does not impair the designated beneficial use of the receiving water. The total dissolved solids (TDS) standards shall be at background where it can be shown that natural or un-alterable conditions prevent its attainment. In such cases rulemaking will be undertaken to modify the standard accordingly.”5
Paria River Reach-1 Two stations within Paria River Reach-1 were evaluated for setting site-specific criteria. The Paria River at Highway U12 Crossing station (495187) measures TDS in the Paria River upstream of Cannonville. The second station, Paria River at Kodachrome Basin Road crossing (495186) is located at the lower end of the reach and below Henrieville Wash.
The data distribution for these two stations is illustrated using box and whisker plots (Figure 4-1). Box and whisker plots are commonly used for comparing distributions because the center, spread, and overall range of data are graphically apparent. In a box and whisker plot the ends of the box are the upper and lower quartiles, so the box spans the interquartile range, the median is marked by a solid light line inside the box, the mean is marked as a solid heavy line, and the whiskers are the two lines outside the box that extend to the highest and lowest observations.
The TDS data used to construct the box and whisker plots for each station were collected between August 2000 and December 2002. The box plot for the upper station (Paria River at Highway U12 Crossing - 495187) shows that the majority of data are below the statewide criteria 5 Footnote to Table 2.1.4.1, Numeric Criteria for Domestic, Recreation, and Agricultural Uses, R317-2, Standards of
Quality for Waters of the State, UAC R-317-1, March 01, 2004, Utah Department of Administrative Rules.

20
of 1,200 mg/L; however, at the downstream station (Paria River at Kodachrome Basin Road crossing - 495186) the TDS concentration increases, with 50% of the TDS samples exceeding the 1,200 mg/L criteria. There are irrigation water withdrawals within the Paria River Reach-1; however, there is not sufficient agricultural use to explain the spike of TDS at the lower end of the reach. There is qualitative information on the high TDS associated with saline aquifers in the area, which appears to be the most logical explanation for the increase in TDS concentrations observed.
Figure 4-1 Concentration of TDS at Two Stations on Paria River Reach-1 Compared to the Utah Standard for Irrigation of 1,200 mg/L
Statistics for Paria River at Kodachrome Basin crossing (495186), the station with the highest TDS concentration, are summarized in Table 4-1. We recommend the site-specific criteria be 2,500 mg/L. This will ensure that the site-specific standard is set at an appropriate level that reflects the natural background concentrations of TDS.
Table 4-1 Statistics and Site-Specific Criteria for Paria River Reach-1
Based on Station 495186 - Paria River at Kodachrome Basin Road Crossing Statistic TDS Concentration (mg/L) Count 15 Mean 1,492 Median 1,094 Min 822 Max 3,444 85th Percentile 2,461 State Criteria - Irrigation 1,200 State Criteria - Stockwater 2,000
Recommended Site-Specific Criteria 2,500 Notes: Data period, October, 2000 to December 2002.
Paria River Reach-1 TDS Concentration (mg/L)1- At U12 Xing 2- At Kodachrome Rd.
0 1 2 3
TDS
Con
cent
ratio
n (m
g/L)
1000
2000
3000
4000
Utah TDS Criteria1200 mg/L

21
Paria River Reach-3
Two stations within Paria River Reach-3 were evaluated for setting site-specific criteria. Paria River at Old Town Site station (599455), measures TDS in the Paria River just above the Listed Section, at river mile 21.5. Cottonwood Creek flows into the river approximately two miles below this site. Cottonwood Creek has a low TDS concentration with a mean of 657 mg/L, less than in the Paria River at that point. The second river station, Paria River at US89 Crossing (495185), located at river mile 9.5 has the highest TDS concentration in the reach. As indicated earlier, the TDS concentration decreases at the State line as measured by the Arizona state monitoring stations (101078 and 101077). (Note: River Miles were measured from the Utah-Arizona state line to provide a point of reference.)
The data distribution for these two stations are also illustrated in box and whisker plots (Figure 4-2). The data used to construct these box plots included the entire data record at the stations including the TDS values generated from correlation with specific conductance. The majority of data at the upper station, Old Town Site, is below the statewide criteria of 1,200 mg/L. Downstream 12 river miles the TDS concentration increases and 37% of the TDS samples exceeded the 1,200 mg/L criteria.
There are no current (or legacy) human activities in this primitive and mostly road-less reach that would explain this increase in TDS. There is evidence of some illicit off road vehicle use through the river channel in this area but we feel through continued public education and enforcement it can be addressed before it becomes a significant problem in terms of TDS loading The source of TDS is considered a natural condition related to input to surface water from a higher salinity aquifer as discussed in Section 1.4.6.
Figure 4-2 Concentration of TDS at Two Stations on Paria River Reach-3 Compared to the Utah Standard for Irrigation of 1,200 mg/L
Paria River Reach-3 TDS Concentration (mg/L)
1- Old Town Site 2- at US 89 Crossing
0 1 2 3
TDS
Con
cent
ratio
n (m
g/L)
400
600
800
1000
1200
1400
1600
1800
2000
Utah TDS Criteria1200 mg/L

22
Statistics for Paria River at US89 Crossing (495185), the station with the highest TDS concentration, are summarized in Table 4-2. We recommend the site-specific criteria be 1,500 mg/L. This will ensure that the site-specific standard is set at an appropriate level that reflects the natural background concentrations of TDS.
Table 4-2 Statistics and Site-Specific Criteria for Paria River Reach-3
Based on Station 495185 - Paria River at US89 Crossing Statistic TDS Concentration (mg/L) Count 132 Mean 1,174 Median 1,121 Min 325 Max 2,564 85th Percentile 1,467
State Criteria Irrigation 1,200 Stockwater 2,000
Recommended Site-Specific Criteria 1,500 Notes: Data period, February 1976 to July 2002.
23
5.0 PROJECT IMPLEMENTATION PLANS AND BMPs The Canyonlands Soil Conservation District (CSCD) is coordinating with local stakeholders and agencies to develop Project Implementation Plans (PIPs) and a coordinated approach to improve water quality within the watershed. The CSCD will establish criteria and select cooperators for implementation of projects. These projects will be designed to minimize land use impacts on water quality in the Paria River and its tributaries. The overall project goals are to reduce TDS loading in the Paria River watershed by improving irrigation methods and conveyances, stabilizing stream channels and protecting stream banks from erosion. Surface runoff and percolation to the upper aquifers can be reduced or eliminated through gated pipe, sprinkler or drip irrigation methods and/or by delivering irrigation water through lined canals or pipe. Stream bank protection can be facilitated through ditch and canal lining and establishing herbaceous cover along riparian corridors. Much of this work is currently underway in other parts of the State under the auspices of the Salinity Control Program administered by the Department of Interior (Bureau of Reclamation) and the Department of Agriculture (Natural Resources Conservation Service). The project goals are also intended to inform and educate the community concerning nonpoint source pollution and the importance of managing natural resources within the watershed. To reach these goals, objectives and tasks are defined and a narrative description is provided for each objective and task. At least one task is proposed to accomplish each objective. These tasks may include specific activities such as milestones, outputs and identifying responsible parties. PIPs designed to reduce TDS concentrations in the Paria River incorporate Best Management Practices (BMPs) to address salt and sediment loading and improve the efficiency of irrigation methods and conveyances, thereby minimizing surface runoff and percolation to the underlying alluvial aquifer. By implementing appropriate BMPs, we hope to encourage adoption and implementation of similar activities to address water quality problems throughout the entire watershed. PIPs will be implemented throughout the next several years and will include water quality monitoring to evaluate their effectiveness. An evaluation and monitoring plan will also be implemented to document progress in achieving improved water quality conditions, to review effectiveness of BMPs, and to provide feedback on the direction of overall watershed health. Based upon the results of this monitoring program, management strategies and implementation priorities may change under the direction of the project sponsors. Successful projects combine a voluntary approach with cost-share assistance to identify key system components that improve irrigation water management and stream channel stabilization, while allowing management flexibility. A coordination plan is presented to identify the lead project sponsor, describe local support for the projects, describe how the project will coordinate with pertinent 319 and non-319 funded programs, and describe similar activities that are being undertaken elsewhere in the watershed. No long-term funding is planned for operation or maintenance of these projects. Individual landowners are responsible for operation and maintenance of BMPs throughout the projected life of the practices. Projects will be inspected by the project lead sponsor. The operation and maintenance of the designed systems will be thoroughly explained to the landowner and they will sign a document indicating their understanding and cooperation. If the landowner does not operate or maintain the system according to NRCS protocols, they will be in violation of their 319 contract and no longer eligible for NRCS assistance. Additionally they may risk having to pay back the federally contributed portion of their project funding.

24
5.1 Statement of Need The upper segment (Reach 1) of the Paria River is currently not meeting the designated beneficial uses for beneficial use 4 (agriculture) due to excessive TDS concentrations, which are attributed to natural and human sources. The middle reach of the Paria River is not listed as a water quality-limited segment. TDS concentrations in the lower segment (Reach 3) are attributed primarily to natural sources with no known human sources of salinity. This Project Implementation Plan addresses the primary human sources of dissolved solids identified within the TMDL analysis. Water from the Paria River is used for crop irrigation and stock watering. The small town economies of Tropic, Cannonville and Henrieville in the northern end of the basin rely on agriculture, which is dependent on irrigation from surface waters. Paria River flows are diverted to irrigation canals at numerous points along the river. The area is underlain by saline soils and geologic formations and, as irrigation water is applied, the return flows convey dissolved solids back into the river. Groundwater also contributes to an increase in TDS in some gaining segments of the Paria River. The intent of the proposed program is to reduce nonpoint source pollution in the Paria River through application of improved irrigation methods and BMPs. By demonstrating these practices to area stakeholders, we hope to encourage them to adopt and implement similar activities to address their own water quality problems. With the support and direction of the CSCD, priority will be given to implementation projects that feature efficient irrigation methods and conveyances that minimize surface runoff and percolation into the underlying alluvial aquifer. Tours of these project sites, news articles and fact sheets will help encourage adoption of these practices elsewhere in the watershed.
5.1.1 Project Water Quality Priority As required by 26-11-6 of the Utah Code Annotated 1953, waters of the State of Utah are grouped into classes so as to protect State waters against controllable pollution. The designated beneficial uses for the Paria River are secondary contact recreation (Class 2-C), non-game fishery (Class 3C), and agriculture (Class 4). The upper Paria River from its headwaters to the confluence of Rock Springs Creek and the Lower Paria River from its confluence with Cottonwood Creek to the Utah-Arizona border have been identified as impaired due to exceedence of Utah's TDS criteria for protection of agricultural uses (Class 4 waters). The Paria River is divided into upper, middle, and lower segments. The upper Paria River (Reach-1) has its headwaters in Bryce Canyon National Park and Dixie National Forest then flows south past the small towns of Tropic, Cannonville and Henrieville to the confluence with Rock Springs Creek in the GSENM. The middle Paria River (Reach-2) runs from Rock Springs Creek, south to its confluence with Cottonwood Creek and is entirely within the boundaries of the GSENM. The lower Paria River (Reach-3) flows from Cottonwood Creek south to the Utah-Arizona border. The middle reach of the Paria River has not been designated a 303(d) impaired water for TDS and is not considered by this water quality management plan.
5.1.2 Project Goals The overall project goals are to reduce nonpoint source TDS loading to the upper and lower Paria River watershed by decreasing the amount of salts entering the watershed from irrigated lands and stream channel erosion, in addition to informing and educating the community concerning nonpoint source pollution and the importance of managing natural resources within the

25
watershed. TDS loading will be addressed through a combination of efficient irrigation and irrigation water management methods, and stream bank protection and channel stabilization techniques. Public education will be addressed by offering tours of demonstration sites and publishing news articles and fact sheets to encourage adoption of these practices elsewhere in the watershed. Specific project goals are as follows:
Goal #1: Reduce TDS and sediment loading to impaired reaches of the Paria River and its tributaries.
Goal #2: Inform and educate the community concerning nonpoint source pollution and the importance of maintaining and improving water quality within the watershed.
Goal #3: Provide administrative services to project sponsors documenting matching contributions, tracking individual project progress, coordinating team efforts, and generating reports and data in a timely manner.
5.1.3 Objectives and Tasks
Goal #1: Reduce TDS and sediment loading to impaired reaches of the Paria River and its tributaries.
Objective 1: Improve irrigation techniques and irrigation water management practices.
Task 1: Select and identify project cooperators.
Output - Problem identification, cooperator selection. This will be lead by the CSCD cooperatively with the local work group and will be conducted in the early spring of the first contract year.
Task 2: Develop irrigation water management plan using BMPs (irrigation water management, improved irrigation systems and pipelines).
Output - Irrigation water management plans. This will be conducted in spring of the first and third contract years. Design work will be performed by NRCS and CSCD staff.
Task 3: Implement projects.
Output - Implementation will occur between fall of the first and third contract year through spring of the second and fourth contract year. Landowners will implement projects. NRCS and CSCD staff will advise, review and certify project implementation.
Task 4: Monitor according to methods described in Section 5.3.
Output - Water quality data for project use and long-term monitoring. Data will be collected four times; before implementation -once during spring runoff and once during summer base flows; after project completion -once during spring runoff and once during summer base flow. These data will be collected by a team of agency professionals made up of the landowner, NRCS, UACD, DWR, DEQ, USU extension, etc.
26
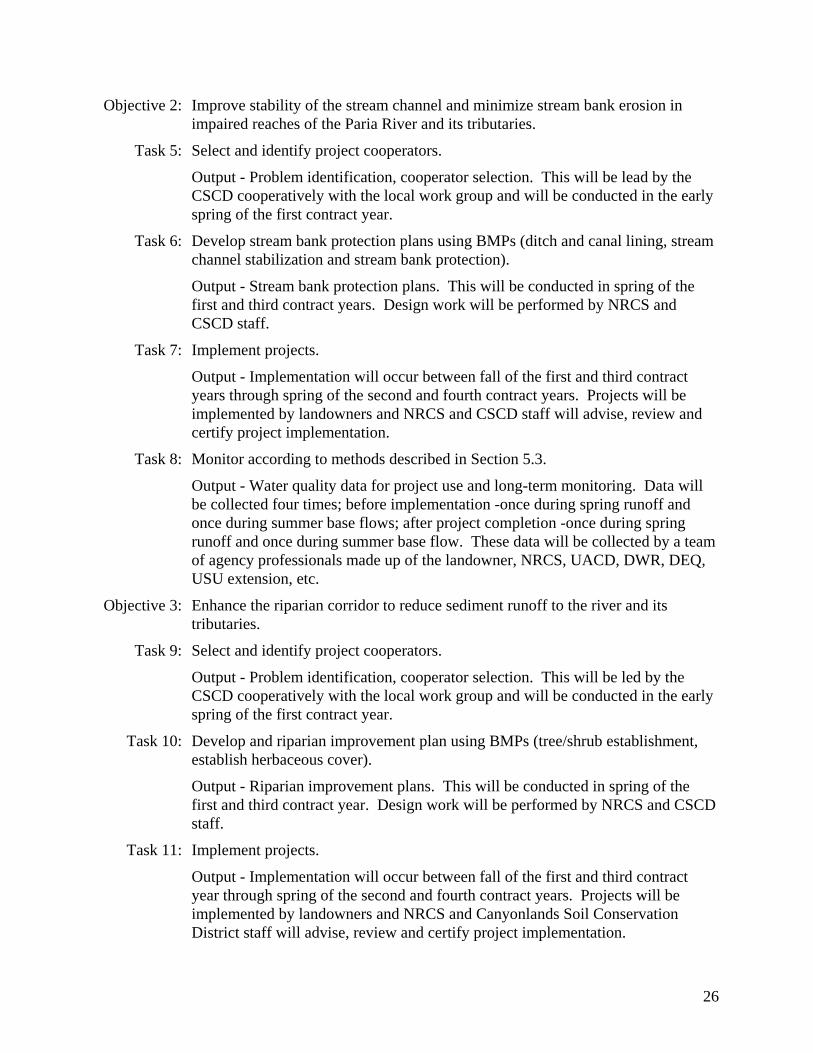
Objective 2: Improve stability of the stream channel and minimize stream bank erosion in impaired reaches of the Paria River and its tributaries.
Task 5: Select and identify project cooperators.
Output - Problem identification, cooperator selection. This will be lead by the CSCD cooperatively with the local work group and will be conducted in the early spring of the first contract year.
Task 6: Develop stream bank protection plans using BMPs (ditch and canal lining, stream channel stabilization and stream bank protection).
Output - Stream bank protection plans. This will be conducted in spring of the first and third contract years. Design work will be performed by NRCS and CSCD staff.
Task 7: Implement projects.
Output - Implementation will occur between fall of the first and third contract years through spring of the second and fourth contract years. Projects will be implemented by landowners and NRCS and CSCD staff will advise, review and certify project implementation.
Task 8: Monitor according to methods described in Section 5.3.
Output - Water quality data for project use and long-term monitoring. Data will be collected four times; before implementation -once during spring runoff and once during summer base flows; after project completion -once during spring runoff and once during summer base flow. These data will be collected by a team of agency professionals made up of the landowner, NRCS, UACD, DWR, DEQ, USU extension, etc.
Objective 3: Enhance the riparian corridor to reduce sediment runoff to the river and its tributaries.
Task 9: Select and identify project cooperators.
Output - Problem identification, cooperator selection. This will be led by the CSCD cooperatively with the local work group and will be conducted in the early spring of the first contract year.
Task 10: Develop and riparian improvement plan using BMPs (tree/shrub establishment, establish herbaceous cover).
Output - Riparian improvement plans. This will be conducted in spring of the first and third contract year. Design work will be performed by NRCS and CSCD staff.
Task 11: Implement projects.
Output - Implementation will occur between fall of the first and third contract year through spring of the second and fourth contract years. Projects will be implemented by landowners and NRCS and Canyonlands Soil Conservation District staff will advise, review and certify project implementation.

27
Task 12: Monitor according to methods described in Section 5.3.
Output - water quality data for project use and long-term monitoring. Data will be collected four times; before implementation -once during spring runoff and once during summer base flows; after project completion -once during spring runoff and once during summer base flow. This data will be collected by a team of agency professionals made up of the landowner, NRCS, UACD, DWR, DEQ, USU extension, etc.
Goal #2: Inform and educate the community concerning nonpoint source pollution and the importance of maintaining and improving water quality within the watershed.
Objective 1: Three tours will be conducted focusing on: 1) irrigation techniques, designs and proper management practices; 2) stable stream channels and stream bank erosion protection; and 3) and enhanced riparian corridors.
Task 13: Conduct improved irrigation technique and management tour.
Output - The tour will be conducted either near project completion or shortly after. USU Extension, UACD, Canyonlands Soil Conservation District staff and landowners will jointly plan this tour.
Task 14: Conduct riparian area/stream bank tour.
Output - The tour will be conducted either near project completion or shortly after. USU Extension, UACD, Canyonlands Soil Conservation District staff and the landowner will jointly plan this tour.
Objective 2: Share general and technical information with producers and area stakeholders.
Task 15: Develop Fact Sheets and Newspaper Articles
Output - Fact Sheet series, Newspaper articles. These products will be completed during implementation of the project and will be disseminated during tours after project completion and other times of the year. USU Extension, UACD, and NRCS will collaborate on the content of these products. USU Extension and UACD will jointly produce and disseminate them.
Goal #3: Provide administrative services to project sponsors documenting matching contributions, tracking individual project progress, coordinating team efforts, and generating reports and data in a timely manner.
Objective 1: Provide administrative services.
Task 16: Track Match and Prepare Reports
Output - Documented matching fund records and prepare Semiannual, Annual and Final reports. UACD staff will coordinate this effort. Completed semiannually, at the end of the first contract year and again at the completion of the project. UACD staff will prepare these products.

28
The following BMPs are considered for the Paria River Water Quality Management Plan and may be used along with the information and education efforts to improve water quality in the watershed. Numeric codes following each BMP indicate NRCS standards and specification numbers taken from the NRCS Field Office Technical Guide. 1. Irrigation Water Management (449) 2. Irrigation System (442, 443, 444) 3. Pipeline (430) 4. Ditch and Canal Lining (428) 5. Stream Channel Stabilization (584) 6. Stream bank Protection (580) 7. Tree/Shrub Establishment (612) 8. Riparian Herbaceous Cover (390)
All projects will include BMP's and will be planned to the level of a total resource management system in accordance with NRCS standards and specifications.
The following procedures will be used to achieve Project Goals: 1. Isolate water quality problem sources. 2. Select and implement projects for watershed nonpoint source problems. 3. Promote fair and cost effective nonpoint source pollution control. 4. Monitor progress and evaluate economic benefits of implementing water quality
improvements. 5. Create a public awareness of water quality concerns and educate the public on how they
can protect water quality for themselves and the community. Promote community involvement in project implementation activities by use of volunteer groups.
5.1.4 Permits All appropriate permits will be secured as needed. Project sponsors will ensure compliance with all local, state, and federal regulations pertaining to project activities such as not disturbing sensitive habitats, not filling or degrading wetlands.
5.1.5 Lead Sponsor The Canyonlands Soil Conservation District is the lead project sponsor. The CSCD is empowered by the State of Utah to devise and implement measures for the prevention of nonpoint source water pollution. Additionally the CSCD is able to enter into contracts, receive and administer funds from agencies, and contract with other agencies and corporate entities to promote conservation and appropriate development of natural resources. Memoranda of Understanding with state, federal and local agencies along with individual cooperator agreements empower the CSCD and individual cooperators to accomplish this work.
5.1.6 Assurance of Project Operation and Maintenance No long-term funding is planned for operation or maintenance of these projects. Individual landowners are responsible for operation and maintenance of BMPs throughout the projected life of the practices. Projects will be inspected by the project lead sponsor. The operation and maintenance of the designed systems will be thoroughly explained to the landowner and they

29
will sign a document indicating their comprehension. If the landowner does not operate or maintain the system according to NRCS protocols, they will be in violation of their 319 contract and no longer eligible for NRCS assistance. Additionally they may risk having to pay back the federally contributed portion of their project funding.
5.2 Coordination Plan
5.2.1 Lead Project Sponsor The CSCD will oversee detailed project development, planning, implementation, approval, creation of fact sheets and educational materials, administration and reporting. Some of these duties will be transferred to UACD, NRCS, DEQ, USU Extension Service and others as per Memoranda of Understanding. The CSCD will be responsible for writing the final project report pursuant to EPA and State requirements. UACD will oversee project administration, matching fund documentation, and contracting with agencies and individuals. They will also provide staffing assistance at the direction of the CSCD.
5.2.2 Local Support The CSCD is coordinating with local stakeholders and agencies to develop a watershed plan to further define water quality problems in the Paria River watershed and to proceed with a coordinated approach to improve water quality within the watershed. The CSCD will establish criteria and select cooperators for implementation of projects. This project will be used to show landowners and cooperators BMPs for minimizing land use impacts on water quality in the Paria River and its tributaries.
5.2.3 Coordination and Linkages The CSCD anticipates coordinating efforts with the following other entities, agencies, and organizations:
Cooperators - provide match for cost share, implementation of water quality plans Utah State University Extension - I&E, Technical assistance NRCS - Technical planning design and oversight Utah Department of Agriculture & Food - Technical assistance, I&E assistance Utah Division of Water Quality - Standard program monitoring, Technical assistance EPA - Financial assistance Utah Association of Conservation Districts - Administration, contracting, staff and technical assistance Utah Division of Water Rights- Permits advisory and monitoring assistance Utah Division of Water Resources - Advisory
5.2.4 Similar Activities A stream bank stabilization demonstration project on the Paria River near Cannonville was funded with 319 funds in 2001. The project entailed sloping back the vertical stream bank, constructing six rock barbs and planting cottonwood poles. In addition, a canal-lining project for the Tropic Ditch has been proposed and is likely to receive funding in the near future.

30
5.3 Evaluation and Monitoring Plan 5.3.1 Sampling and Analysis Plan Goals Monitoring plan goals are to track BMP implementation and effectiveness, and evaluate progress in achieving improved water quality conditions as these nonpoint source controls are implemented. The project lead sponsor has a strong commitment to demonstration of success of these pollution prevention and remediation strategies, but a limited monitoring budget, and therefore the monitoring effort needs to be shared with DWQ and other agency cooperators. The monitoring goal is divided into two primary objectives: 1) Implementation and effectiveness monitoring to evaluate project BMPs, and 2) Trend monitoring to evaluate success in meeting water quality standards and goals. The lead sponsor, the CSCD, is the lead entity for carrying out the implementation and effectiveness monitoring. The DWQ is the lead entity for completing trend monitoring. Implementation monitoring in comparison to effectiveness monitoring focuses on documenting the number and location of practices or implementation projects applied to meet water quality goals. This requires developing an accounting system of practices, or using currently established reporting procedures familiar to the lead sponsor, to track project implementation. Effectiveness monitoring evaluates whether BMPs were successful at meeting their intended purpose, such as reducing water use, reducing infiltration or reducing bank erosion. Effectiveness monitoring does not require water quality sampling to be effective. Simple methods, as described below, can be used to evaluate BMP effectiveness. Implementation and effectiveness monitoring can be carried out by CSCD staff, volunteers, or associated personnel in the agricultural community. Trend monitoring involves monitoring change in TDS and other parameters, such as discharge, over time. Detecting trends requires statistical design, commitment to long-term monitoring over time and high sample frequency. Trend monitoring needs to be carried out by an organization, such as DWQ or USGS, with sufficient infrastructure and funding to assure long-term monitoring. Work activities associated with these objectives include the following: 1) Develop a project specific monitoring plan to evaluate BMP effectiveness as projects are
approved for monitoring. Since each project may be comprised of multiple BMPs or multiple land-owners, only general monitoring approaches for effectiveness monitoring are described in this document.
2) Monitor water quality at long-term monitoring sites to demonstrate sustained and overall improvements in water quality. This task will be completed by the DWQ or a team from cooperating agencies.
3) Maintain a common database of all data collected pertaining to the projects. The database will be developed and maintained by lead agency support staff at the Utah Association of Conservation Districts (UACD).
4) Review data and include data summaries in annual reports. This activity will be performed as sub-tasks within tracking and reporting tasks.
5.3.2 Implementation and Effectiveness Monitoring Implementation and effectiveness monitoring are the responsibility of the CSCD and cooperating agencies such as NRCS, Utah State University Extension, and Utah Department of Agriculture. The monitoring methods therefore focus on those protocols that can be effectively carried out by natural resource staff with an agricultural background.
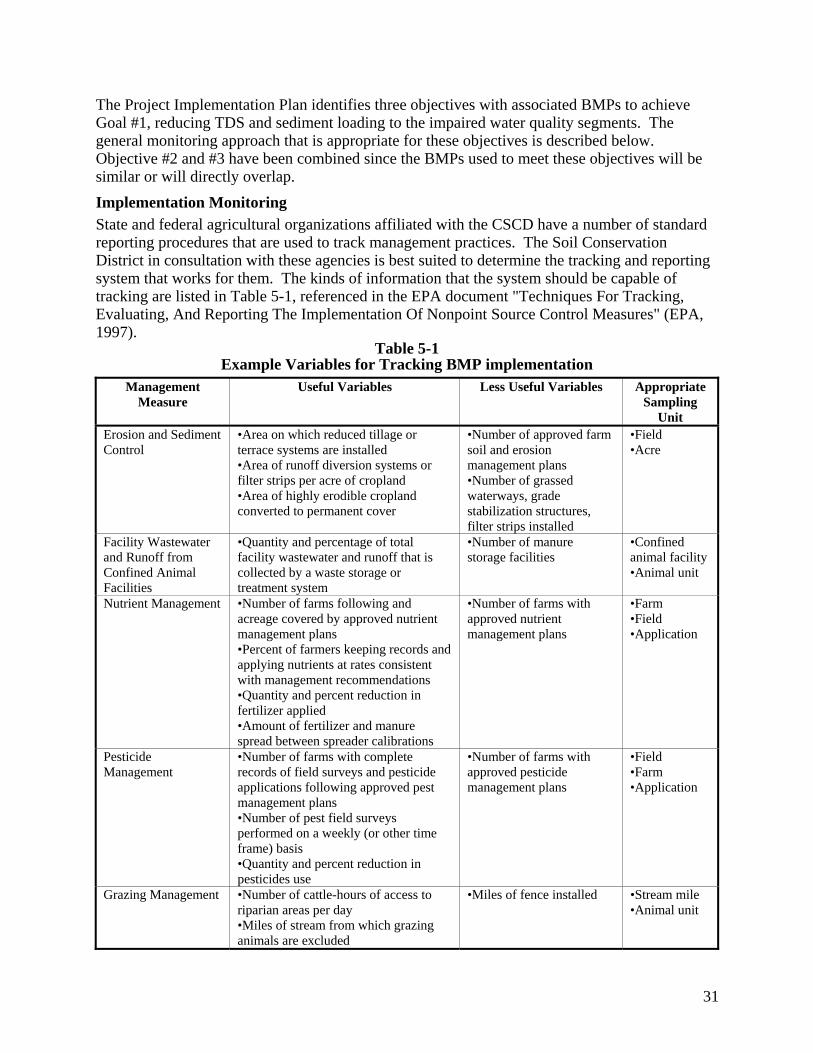
31
The Project Implementation Plan identifies three objectives with associated BMPs to achieve Goal #1, reducing TDS and sediment loading to the impaired water quality segments. The general monitoring approach that is appropriate for these objectives is described below. Objective #2 and #3 have been combined since the BMPs used to meet these objectives will be similar or will directly overlap. Implementation Monitoring State and federal agricultural organizations affiliated with the CSCD have a number of standard reporting procedures that are used to track management practices. The Soil Conservation District in consultation with these agencies is best suited to determine the tracking and reporting system that works for them. The kinds of information that the system should be capable of tracking are listed in Table 5-1, referenced in the EPA document "Techniques For Tracking, Evaluating, And Reporting The Implementation Of Nonpoint Source Control Measures" (EPA, 1997).
Table 5-1 Example Variables for Tracking BMP implementation
Management Measure
Useful Variables Less Useful Variables Appropriate Sampling
Unit Erosion and Sediment Control
•Area on which reduced tillage or terrace systems are installed •Area of runoff diversion systems or filter strips per acre of cropland •Area of highly erodible cropland converted to permanent cover
•Number of approved farm soil and erosion management plans •Number of grassed waterways, grade stabilization structures, filter strips installed
•Field •Acre
Facility Wastewater and Runoff from Confined Animal Facilities
•Quantity and percentage of total facility wastewater and runoff that is collected by a waste storage or treatment system
•Number of manure storage facilities
•Confined animal facility •Animal unit
Nutrient Management •Number of farms following and acreage covered by approved nutrient management plans •Percent of farmers keeping records and applying nutrients at rates consistent with management recommendations •Quantity and percent reduction in fertilizer applied •Amount of fertilizer and manure spread between spreader calibrations
•Number of farms with approved nutrient management plans
•Farm •Field •Application
Pesticide Management
•Number of farms with complete records of field surveys and pesticide applications following approved pest management plans •Number of pest field surveys performed on a weekly (or other time frame) basis •Quantity and percent reduction in pesticides use
•Number of farms with approved pesticide management plans
•Field •Farm •Application
Grazing Management •Number of cattle-hours of access to riparian areas per day •Miles of stream from which grazing animals are excluded
•Miles of fence installed •Stream mile •Animal unit
32
Effectiveness Monitoring
Where implementation monitoring is designed to answers the questions, “Were BMPs applied? Where and How Many?” Effectiveness monitoring should answer the question. “Were the BMPs effective at reducing pollutant inputs? Effectiveness monitoring is best carried out by the local sponsor because of their relationship with local growers and producers. Effectiveness monitoring plans should be built into each implementation grant as a necessary part of doing business. Although simple procedures can be used, effectiveness monitoring still requires resources to design the project specific plan, make field measurements, and develop reports.
The general monitoring approach is described below and organized by the Project Implementation Plan objectives listed under Goal # 1, reduction of TDS and sediment loading to impaired reaches (Section 5.1.3). Below each objective are the BMPs that are assumed to meet the objective, and the general monitoring approach which will accomplish effectiveness monitoring. Objective #2 and #3 are grouped together since the monitoring approach needed to evaluate the objective are similar. Objective 1: Improve irrigation techniques and irrigation water management practices.
Best Management Practices:
1. Irrigation Water Management (449) 2. Irrigation System (442, 443, 444) 3. Pipeline (430) 4. Ditch and Canal Lining (428)
Monitoring Approach:
These BMPs decrease salinity from irrigation by increasing the efficiency of irrigation systems and thereby reducing the volume of surface runoff or infiltration through the saline soils. Implementation and effectiveness monitoring evaluates the quantity of water conserved and the decrease in infiltration using these conservation practices compared to current methods.
A simple monitoring approach is to calculate the quantity of water expected to be saved or the decrease in infiltration that can be expected by applying the BMP to a specific project site. A more quantitative approach is to measure infiltration rates before and after the practice to determine the decrease in infiltration, however, the cost of monitoring becomes more expensive and impractical for project sponsors. Objective 2: Improve stability of the stream channel and minimize stream bank erosion in
impaired reaches of the Paria River and its tributaries. Objective 3: Enhance the riparian corridor to reduce sediment runoff to the river and its
tributaries. Best Management Practices:
5. Stream Channel Stabilization (584) 6. Stream bank Protection (580) 7. Tree/Shrub Establishment (612) 8. Riparian Herbaceous Cover (390)

33
Monitoring Approach:
BMPs for stream channel stabilization reduce inputs of sediment and salts by decreasing erosion within the near bank region of the stream channel. Since streambank erosion is a natural process BMPs should emphasize working with natural stream dynamics and avoid the use of hardened structures such as riprap that was used in the past. BMPs generally focus on revegetating streambanks by direct planting of riparian shrubs and forbs or bioengineering methods such as installing willow bundles.
Implementation and effectiveness monitoring will evaluate the success in establishing a riparian buffer and stabilizing the streambank. Planting success is evaluated by using a transect or grid method to count the number of live stems retained over time compared to that planted. Revegetation success for erosion control is evaluated by measuring soil cover, which can be estimated by measuring percent coverage at a portable plot (such as a 3 foot square) and repeating the measurements over time along an established transect. Bank stabilization can be measured by using bank pins to directly measure bank erosion rates, establishing cross-sections that can be accurately resurveyed over time, or by using photopoints.
Details of methods for these approaches can be found in documents such as:
• Bauer, S. B. and Burton, T. A. 1993. Monitoring protocols to evaluate water quality effects of grazing management of western rangeland streams. US EPA Region 10, Water Division, Surface Water Branch. EPA 910/R-93-017.
• Bedell, T. E., and Buckhouse, J. C. 1994. Monitoring primer for rangeland watersheds. US EPA Region 10, EPA 908-R-94-001.
• Harrelson, C. C., Rawlins, C. L., and Potyondy, J.P. 1994. Stream channel reference sites: an illustrated guide to field technique. USDA Forest Service: General Technical Report RM-245.
5.3.3 Trend Monitoring
Trend monitoring is used to answer two primary questions: 1) Are water quality criteria being met; and 2) are TDS concentrations decreasing over time with implementation of BMPs? Since site-specific criteria were recommended as part of this Water Quality Management Plan, a third objective should also be to determine if these revised criteria are appropriate for these river reaches given more data over different climatic regimes.
Trend monitoring for the purposes of this Water Quality Management Plan can be integrated into DWQ’s on-going monitoring program by prioritizing critical stations and parameters. Existing monitoring stations established by the DWQ and USGS can meet trend monitoring objectives if samples are collected with sufficient frequency. Generally DWQ currently collects samples at long-term trend monitoring stations once every six weeks (eight times per year) to evaluate trends in water quality.
Sample Locations The four DWQ monitoring stations listed in Table 5-2 were selected since they provide an initial assessment of background conditions, they are the most data rich stations, and they are generally accessible, which increases the likelihood that the stations can be sampled with a greater frequency. The USGS flow gaging stations can provide long-term continuous flow records;

34
however, these stations were reinitiated recently in 2002, and therefore are not sufficient to establish flow statistics. Monitoring of flow at the DWQ stations will be required until such time that a quantitative relationship (if any) can be established between the DWQ stations and the USGS gages. Another option (if not already being done) is to request USGS to add TDS monitoring to the parameters measured at the gaging stations.
Table 5-2 Suggested Monitoring Stations for Trend Monitoring
Station ID Station Name Sampling Location Rationale
Parameters of Concern
Agency
Paria River Reach-1
495187 Paria River at U12 crossing Located in the middle of Reach-1
TDS & Flow DWQ
495186 Paria River at Kodachrome Basin Road Located at the bottom of Reach-1
TDS & Flow DWQ
093381500 Paria River near Cannonville, Utah Stream flow gaging station in Reach-1.
Flow USGS
Paria River Reach-3 599455 Paria River at the Old Town Site Located upstream of Reach-
3. TDS & Flow DWQ
495185 Paria River at US89 crossing Located lower section of Reach-3.
TDS & Flow DWQ
093381800 Paria River near Kanab, Utah Stream flow gaging station in Reach-3.
Flow USGS
Sample Parameters and Frequency
The minimum list of parameters for trend monitoring at these stations is specific conductance (µmho/cm), total dissolved solids (mg/L), and flow (cfs). (Since USGS already monitors discharge continuously at the gaging stations it would be fairly simple to add continuous specific conductance monitoring, which can be used in lieu of TDS sampling. This would create an excellent long-term data record for evaluating trends over time compared to using grab samples.)
If grab samples are used at DWQ stations, sample frequency needs to be increased to a minimum of monthly frequency. The current target of every six weeks is not sufficient to evaluate trends over time.
5.3.4 Data Management, Storage, and Reporting
The data from this project will be maintained in an accessible common database. In addition, water quality and other relevant data will be transferred electronically to the DWQ database. Data will be compiled, analyzed and used in completing progress reports to the State NPS coordinator, DEQ, EPA and others. All water quality monitoring data will be transferred electronically to the DWQ who regularly enter data into the STORET system. These data will be available to all interested parties and organizations. Quality Assurance and Quality Control will be conducted according to the guidelines established in the Utah Water Quality Manual. Only those data that meet QA/QC standards will be entered into the project database.

35
5.4 Long-Term Funding Plans for Operation and Maintenance No long-term funding is planned for operation or maintenance of these projects. Maintenance of these projects will be the responsibility of the private landowner. Projects will be inspected by the project lead sponsor, UACD and NRCS staff. The operation and maintenance of the designed systems will be thoroughly explained to the landowner and they will sign a document indicating their understanding and cooperation. If the landowner does not operate or maintain the system according to NRCS protocols, they will be in violation of their 319 contract and no longer eligible for NRCS assistance. Additionally they may risk having to pay back the federally contributed portion of their project funding. We do anticipate increased interest in participation of BMP application and anticipate moving to a watershed-wide implementation phase in the future.
5.5 Public Involvement There has been public involvement from the inception of the project, through proposal development, review, and submission. The CSCD will select project participants and give oversight to project planning and implementation. This group actively seeks public input into the prioritization of natural resource problems and concerns. We anticipate volunteer help to be provided at many phases of the project.

36
6.0 CONCLUSIONS AND RECOMMENDATIONS
The Paria River is located in Garfield and Kane Counties in southern Utah and flows from the headwaters in Bryce Canyon National Park and Dixie National Forest through private agricultural lands in the upper reach and south through the BLM administered Grand Staircase-Escalante National Monument (GSENM) into Arizona and the Colorado River below Glen Canyon Dam. The small towns of Tropic, Cannonville and Henrieville at the northern end of the basin are based primarily on an agricultural economy dependent on irrigation from surface waters. Downstream from private lands near Henrieville Wash the river enters GSENM and flows through these primitive public lands for approximately 45 river miles to the Arizona border. The Paria River is situated in a dry desert climate and the majority of surface streams and washes are intermittent. The Paria River is perennial for most but not all of its length through the State of Utah.
The Water Quality Management Plan addresses two distinct reaches of the Paria River. Paria River Reach-1 is the section from the confluence of Rock Springs Creek below the Henrieville to the headwaters of the Paria River. Paria River Reach-3 extends from the Arizona-Utah Border to the confluence with Cottonwood Wash. Utah's Year 2002 303(d) list identifies Paria River Reach-1 and Reach-3 as being impaired due to exceedence of Utah's total dissolved solids (TDS) criteria for protection of agricultural uses, Class-4 waters. The middle section of the river between these two reaches is not listed on the 303(d) list and is not addressed in the Water Quality Management Plan. Based on the evaluation of available information on water quality, soils, rock types and groundwater aquifers we determined that the high TDS concentrations are primarily a natural feature of the desert environment along the Paria River.
In Paria River Reach-1 irrigated lands occur; however, the evaluation of water quality patterns has led us to conclude that exceedence of TDS criteria are primarily due to natural sources. No specific TDS load could be associated with irrigation practices. The Paria River Reach-3 is entirely contained within the Grand Staircase-Escalante National Monument and because of the remoteness and limited uses (primitive recreational activities), no human causes of impairment could be identified that contribute to TDS loading. Although illicit off road vehicle use should be addressed through continued public education and enforcement before it becomes a significant problem. For these reasons, site-specific criteria as provided for by the Standards of Water Quality for the Waters of the State (Utah) were recommended for the two listed reaches (Table 6-1).
Table 6-1 Recommended Site-Specific Criteria for TDS in the Paria River
Waterbody ID
Waterbody Name
Waterbody Description HUC Unit TDS Site-Specific Criteria (mg/L)
UT14070007-001
Paria River Reach-1 Paria River from confluence of Rock Springs Creek to headwaters
14070007 2,500
UT14070007-005
Paria River Reach-3 Paria River from Arizona-Utah Border to confluence of Cottonwood Wash
14070007 1,500
Although no specific TDS loading were attributed to human sources, the Canyonlands Soil Conservation District (CSCD) is taking the lead to reduce the possible sources of TDS loading from agricultural activities. The CSCD will coordinate with local stakeholders and agencies to

37
develop Project Implementation Plans to improve water quality within the watershed. The CSCD has identified specific practices from the NRCS Field Office Technical Guide to reduce potential sources of salinity and sediments that change irrigation practices, provide streambank protection, and enhance the riparian vegetation along the river and tributaries.
An evaluation and monitoring program describes implementation, effectiveness and trend monitoring to evaluate success in implementing BMPs and in reducing the concentration of TDS in the Paria River. The monitoring plan identifies implantation and effectiveness monitoring procedures that can be completed by the Conservation District and affiliated agencies. The plan also describes the suggested approach for DWQ to measure trends in TDS concentrations over the long term.

38
7.0 REFERENCES
Blanchard, P., 1986. Groundwater Conditions in the Kaiparowits Plateau Area, Utah and Arizona, with Emphasis on the Navajo Sandstone. State of Utah, Department of Natural Resources Technical Publication 81, 87 p. (In BLM 1999).
Bowers, W. E., 1972. The Canaan Peak, Pine Hollow and Wasatch Formations in the Table Cliffs region, Garfield County, Utah. U.S. Geological Survey Bulletin 1331-B, 39 p.
Bureau of Land Management (BLM), 1999. Grand Staircase-Escalante National Monument Approved Management Plan Environmental Impact Statement. BLM, Cedar City, Utah.
Bureau of Land Management (BLM), 2000. Grand Staircase-Escalante National Monument Approved Management Plan and Record of Decision. BLM, Cedar City, Utah.
Cobban, W. A., Dyman, T. S., Pollock, G. L., Takahashi1, K. I., Davis, L. E., and Riggin, D. B., 2000. Inventory of dominantly marine and brackish-water fossils from Late Cretaceous rocks in and near Grand Staircase-Escalante National Monument, Utah, in Sprinkel, D. A., Chidsey, T. C. and Anderson, P. B., editors, Geology of Utah's Parks and Monuments: Utah Geological Association Publication 28, p. 579-589.
Davies, Tudor, T., 1997. EPA Memorandum to Water Management Division Directors, Regions 1-10. Establishing Site Specific Aquatic Life Criteira Equal to Natural Background. Nov. 5, 1997.
Doelling, H. H., Blackett, R. E., Hamblin, A. H., Powell, J. D., and Pollock, G. L., 2000. Geology of the Grand Staircase-Escalante National Monument, Utah, in Sprinkel, D. A., Chidsey, T. C. and Anderson, P. B., editors, Geology of Utah's Parks and Monuments: Utah Geological Association Publication 28, p. 189-231.
Environmental Protection Agency (EPA), 1999. Total Maximum Daily Load Program. Office of Water, Washington, D.C. http://www.epa.gov/owow/tmdl/intro.html. Last updated August 12, 1999.
Environmental Protection Agency (EPA), 1997. Techniques For Tracking, Evaluating, And Reporting The Implementation Of Nonpoint Source Control Measures, EPA 8410B-97-010, Office of Water, Washington, D.C. http://www.epa.gov/owow/nps/agfinal.pdf
Freethy, G. W., 1997. Hydrogeology of the Grand Staircase-Escalante National Monument [Abs]: Learning From the Land, a science symposium sponsored by the Bureau Cretaceous Western Interior Seaway: Arizona, in Nations, J.D., and Eaton, J. G., of Land Management and the Governor’s Office of Planning and Budget, November 4- 5, 1997, Cedar City, Utah. (In BLM 1999).
Geological Society of America (GSA), 2002. The Geology of the Grand Staircase in Southern Utah: A Road Log and Guide for Public School Teachers. Geological Society of America 2002 Rocky Mountain Section Annual Meeting, Cedar City, Utah 10-11 May, 2002.
Hereford, R., 1997. Abstract - Environmental Change in Valleys of the Paria River. U.S. Department of Interior, Bureau of Land Management World Wide Web site: http://www.ut.blm.gov/monument/Science_and_Research/Science_Symposium/abstracts.html.

39
Millennium Science & Engineering (MSE), 2003. Paria River Data Evaluation Report. Prepared for Utah Division of Water Quality, Salt Lake City, Utah.
Moon, Dave 1997. Memorandum on Use Attainability Analysis and Ambient Based Criteria, Ecosystem Protection and Remediation office, US Environmental Protection Agency Region 8, Denver Colorado.
Peterson, M. V., 1994. Sand Dunes, sabkhas, streams and shallow seas: Jurassic paleogeography in the southern part of the Western Interior Basin, in Caputo, M. V., Peterson, J. A., and Franczyk, K. J., editors, Mesozoic Systems of the Rocky Mountain Region, USA: Rocky Mountain Section, Society for Sedimentary Geology, p. 233-272.
Pope, D. an Brough, C., Eds. 1994. Utah’s Weather and Climate. Publishers Press, Salt Lake City, Utah.
Stokes, W. L., 1988. Geology of Utah. Utah Museum of Natural History and Utah Geological and Mineral Survey. Salt Lake City, Utah.
United States Geological Survey (USGS), 2003. Drought Conditions in Utah During 1999-2002: A Historical Perspective. U.S. Geological Survey, Salt Lake, Utah.
Utah Administrative Code (UAC) R317-2. Standards of Quality for Waters of the State. August 1, 2000.
Utah Division of Water Quality (DWQ), 2000a. Standards of Water Quality for the Waters of the State. R317-2, Utah Administrative Code. Utah Department of Environmental Quality - Division of Water Quality. Revised March 17, 2000.
Utah Division of Water Quality (DWQ), 2002. Utah’s Year 2002 303(d) List of Waters. Utah Department of Environmental Quality - Division of Water Quality. August 2002.
Webb, R. H., 1985. Late Holocene flooding on the Escalante River, south-central Utah: University of Arizona, PhD Thesis, 204 p. (In BLM, 1999).


![Old Paria Badlands - wilde-weite-welt · Badlands an der Old Pareah / Paria Townsi-te [G.S.E.N.M.] Auch wenn die Reste der ehemaligen Old Pa-reah Townsite ebenso Vergangenheit sind](https://static.fdocuments.net/doc/165x107/605d54fc859962142540b399/old-paria-badlands-wilde-weite-welt-badlands-an-der-old-pareah-paria-townsi-te.jpg)


