PARENTAL EDUCATION AND FAMILY CHARACTERISTICS: …
28
119 Revista de Economía Aplicada Número 58 (vol. XX), 2012, págs. 119 a 146 E A PARENTAL EDUCATION AND FAMILY CHARACTERISTICS: EDUCATIONAL OPPORTUNITIES ACROSS COHORTS IN ITALY AND SPAIN * ANTONIO DI PAOLO Universitat Rovira i Virgili & Employment Observatory Drawing on data contained in the 2005 EU-SILC, this paper investigates the disparities in educational opportunities in Italy and Spain. Its main ob- jective is to analyse the predicted probabilities of completing upper-sec- ondary and tertiary education for individuals with different parental back- ground, and the changes in these probabilities across birth cohorts extending from 1940 to 1980. The results suggest that the disparities in ter- tiary education opportunities in Italy tend to increase over time. By con- trast, the gap in educational opportunity in Spain shows a marked decrease across the cohorts. Moreover, by using an intuitive decomposition strategy, the paper shows that a large part of the educational gap between individu- als from different educational backgrounds is “composed” of the differ- ence in the endowment of family characteristics. Specifically, it seems that more highly educated parents are more able to endow their children with a better composition of family characteristics, which accounts for a signifi- cant proportion of the observed disparities in educational opportunity. Key words: educational opportunity, family background, birth cohorts, Italy, Spain. JEL Classification: I21, J12, J62. O ver the last century, both Italy and Spain have experienced a significant expansion of their respective education systems. However, the educational performance of both countries has been particularly poor, especially in comparison with that of their Central and Northern European coun- terparts 1 . In fact, even though mean enrolment in post-compulsory educa- tion has increased considerably, the two countries record very high drop-out rates, (*) The author is especially in debt with Josep Lluís Raymond, Jorge Calero, Ada Ferrer-i-Carbonell, Massimiliano Bratti, Reginat Riphahn, Jaume Garcia, Lorenzo Cappellari and Raul Ramos for their very useful comments. He also thanks the suggestions received from two anonymous referees. This work has benefited from the financial support from the MEC grant ECO 2009-12234 and from the SGR grant 2009-SGR-00352. Remaining errors and opinions are sole responsibility of the author. (1) See OECD (2008, 2009), Boarini (2009) and Fuentes (2009).
Transcript of PARENTAL EDUCATION AND FAMILY CHARACTERISTICS: …

119
Revista de Economía Aplicada Número 58 (vol. XX), 2012, págs. 119 a 146EA
PARENTAL EDUCATION AND FAMILYCHARACTERISTICS: EDUCATIONALOPPORTUNITIES ACROSS COHORTS
IN ITALY AND SPAIN*
ANTONIO DI PAOLOUniversitat Rovira i Virgili & Employment Observatory
Drawing on data contained in the 2005 EU-SILC, this paper investigatesthe disparities in educational opportunities in Italy and Spain. Its main ob-jective is to analyse the predicted probabilities of completing upper-sec-ondary and tertiary education for individuals with different parental back-ground, and the changes in these probabilities across birth cohortsextending from 1940 to 1980. The results suggest that the disparities in ter-tiary education opportunities in Italy tend to increase over time. By con-trast, the gap in educational opportunity in Spain shows a marked decreaseacross the cohorts. Moreover, by using an intuitive decomposition strategy,the paper shows that a large part of the educational gap between individu-als from different educational backgrounds is “composed” of the differ-ence in the endowment of family characteristics. Specifically, it seems thatmore highly educated parents are more able to endow their children with abetter composition of family characteristics, which accounts for a signifi-cant proportion of the observed disparities in educational opportunity.
Key words: educational opportunity, family background, birth cohorts,Italy, Spain.
JEL Classification: I21, J12, J62.
Over the last century, both Italy and Spain have experienced a significantexpansion of their respective education systems. However, the educationalperformance of both countries has been particularly poor, especially incomparison with that of their Central and Northern European coun -terparts1. In fact, even though mean enrolment in post-compulsory educa-
tion has increased considerably, the two countries record very high drop-out rates,
(*) The author is especially in debt with Josep Lluís Raymond, Jorge Calero, Ada Ferrer-i-Carbonell,Massimiliano Bratti, Reginat Riphahn, Jaume Garcia, Lorenzo Cappellari and Raul Ramos for theirvery useful comments. He also thanks the suggestions received from two anonymous referees. Thiswork has benefited from the financial support from the MEC grant ECO 2009-12234 and from theSGR grant 2009-SGR-00352. Remaining errors and opinions are sole responsibility of the author.(1) See OECD (2008, 2009), Boarini (2009) and Fuentes (2009).

in both secondary and University education. Moreover, data from the PISA survey(Programme for International Student Assessment) indicate that, with respect totest scores in Mathematics, Reading and Science, Italian and Spanish students aresystematically among the worst in Europe.
Underlying these issues of educational participation, quality and perfor-mance, the two countries suffer a general problem of equity in their educationalsystems. Several authors suggest that a student’s educational opportunities are(still) strongly related to the educational background of their family, and this rep-resents a clear violation of equality of opportunities [see, for example, Checchi etal. (2006), (2008), Peragine & Serlenga (2007), Triventi & Trivellato (2009), forItaly; Petrongolo & San Segundo (2002), Rahona-López (2009), Casquel & Uriel(2009), for Spain]. Besides this educational underachievement, individuals fromdifferent social backgrounds are severely affected by a range of other problems inlater life that are closely related to their educational attainment (labour status,poverty, health, etc.). If this perverse mechanism of intergenerational inheritanceof socio-economic status persists, these disparities run the risk of being perpetuat-ed into the future generations.
A retrospective analysis can help to outline some of the main issues relatedto these existing inequalities in education. If we go back to the first half of the lastcentury2, we see that both Italy and Spain inherited a strong legacy from the elitistand highly stratified education systems of their respective Fascist regimes [Ballar-ino et al. (2009)]. However, during the second half of the century, both countriesimplemented similar, far-reaching education reforms. The general objective ofthese reforms was to guarantee equality of access and the opportunity to reach thehighest levels of education, regardless of social origin and family background.
The 1962 Educational Reform in Italy (L. 31-12-1962, no. 1859), and the1970 General Education Act in Spain (Ley General de Educación, LGE), extendedcompulsory schooling until the age of 14 and eliminated track separation in lowersecondary education [see Fort (2006) for details]. Nevertheless, these two reforms,which typify the two educational systems throughout the period of analysis3, wereinsufficient to guarantee equal post-compulsory education opportunities.
In both countries there is, at least one institutional feature that might serve toaccount for the existence, or persistence, of educational disparities related toparental background. The two countries maintained a stratified structure of uppersecondary education, with a key track separation at the age of 14. Basically, individ-
Revista de Economía Aplicada
120
(2) Given that I consider individuals born between 1940 and 1980 (from the EU-SILC database;see below), this period coincides with the beginning of this paper’s time span.(3) In addition, for the Italian case, a further reform in 1969 (no.910 Act December 11, 1969)eliminated restrictions on access to university, allowing graduates from non-academic secondaryschools to enrol. In Spain, the Organic General Act of the Educational System of 1990 (LOGSE)included, among other things, the further extension of compulsory (and comprehensive) educationuntil the age of 16, postponing the introduction of track separation. However, the effect of this re-form is not explicitly considered here; unfortunately, only individuals in the last cohorts are poten-tially affected by the reform, but many of them are excluded from the sample as they were stillstudying during the year the survey was conducted (2005).

uals (or their parents) can choose between academic (Licei), technical and profes-sional (Istituti Tecnici-Professionali) secondary education in Italy, and between aca-demic (Bachillerato) and vocational education (Formación Profesional) in Spain.
The empirical evidence suggests that this kind of early track separation couldreinforce the existing link between family background and a child’s final educa-tion attainment [see Hanushek & Wöβmann (2006), Brunello & Checchi (2007),Checchi & Flabbi (2007), among others]. This effect is mainly produced by theimpact of parental education background on the choice of educational curricula atthe secondary school stage. The children of poorly educated parents tend to beoverrepresented in non-academic secondary schools (irrespective of their ability),with marked (negative) consequences for the transition to University, and for thelikelihood of obtaining a degree [Giuliano (2008)]. This issue can be particularlyproblematic in countries such as Italy or Spain, since a significant proportion ofthe “parents’ generation” faced significant schooling constraints4.
On the basis of these arguments, the first contribution of this paper is toanalyse the potential disparities in upper secondary and tertiary education oppor-tunities for individuals of different parental educational background5. I shall ex-amine the temporal evolution in post-compulsory educational opportunities inItaly and Spain for individuals born between 1940 and 1980. I expect to find sig-nificant education gaps, especially as regards the possibility of being awarded aUniversity degree. Additionally, the analysis of temporal changes [as in Checchiet al. (2008), and Heineck & Riphahn (2009)] provides evidence regarding thepotential persistence in educational (in)equality of opportunity, in response to in-stitutional and social changes (i.e. the evolution in the labour market, educationalsystem and social environment).
A further question of relevance involves investigating the “composition” ofthese educational disparities between individuals of different backgrounds, and howit evolves over time. In order to assess this issue, we need first to determine the rea-sons why children of better educated parents obtain more and better schooling. Anobvious candidate for explaining the educational gaps between individuals of differ-ent backgrounds is the intergenerational transmission of cognitive ability [seeBehrman & Rosenzweig (2002), Sacerdote (2002), Plug & Vijverberg (2003)].
However, Chuna et al. (2006) and Chuna & Heckman (2007) have suggestedthat genetic ability is comprised of (and not additively separable from) a larger setof elements which children from better educated parents may inherit. These authorsrefer to the long-term parental income reflected by parental education, but also to
Parental education and family characteristics: educational opportunities across cohorts in Italy and Spain
121
(4) In other words, many of the parents of the individuals observed in the data (population bornbetween 1940 and 1980) may not have achieved the desired level of schooling because of the re-strictions inherent in the elitist educational system(s) imposed by the Fascist regime(s). In all like-lihood, school tracking would not be a “problem” for educational opportunities in a situation with-out a marked inequality of educational opportunities for the parents’ generation.(5) Parental education is considered the most powerful indicator of family background, and a “good”proxy of long-term parental income, as suggested by Cameron & Heckman (1998, 2001). See Sec-tion 2 for the exact definition of parental education, as well as for those of the other variables used.

non-cognitive skills such as motivation, time preferences, risk aversion and self-es-teem, which are important determinants of socioeconomic success in later life.
Educational opportunities might also depend on the home environment andother relevant family characteristics during childhood. Several contributions havesought to investigate the role played by circumstantial characteristics at the familylevel in children’s educational outcomes6. Even though the causality of these ef-fects remains unclear [e.g. Björklund et al. (2006), argue that family structure onlyimpacts through unobserved family factors), some source of educational disparitiesbetween individuals of different educational background might be associated withdifferences in family characteristics (other than parental education).
Better educated parents may provide their children with a better home envi-ronment during childhood, increasing their educational opportunities [Carneiro(2008)]. Higher parental education is, in general, associated with fewer financialdistress episodes, as well as with better employment and occupational prospects.Moreover, parents with a different educational background are also likely to differin terms of fertility and cohabitation behaviours. As a consequence, one compo-nent of the educational gap could be related to the additional role of parentalschooling in the provision of a better and more stimulating educational circum-stances for the children’s education7.
In short, the differences in educational opportunity that can be observed be-tween individuals of different backgrounds are broadly composed of two main ef-fects of parental education: 1) a direct impact on a child’s schooling generated bylong-term factors and unobservable skills; and, 2) an indirect effect of parental ed-ucation, produced through the improvement of other family characteristics that arerelevant for a child’s education. I propose a simple decomposition methodology forinvestigating this issue, which would contribute to the literature concerning thepersistent gap in educational opportunity. The results from this analysis across sev-eral birth cohorts will provide useful evidence for policymaking. In fact, if educa-tional disparities do not decline over time because of the persistent relationship be-tween parental education and family characteristics, the departure from a situationof equality of opportunity in education would be even more pronounced. In anycase, it should be noted in advance that I rely on a descriptive approach, given thatit is not possible to rule out the genetic ability component with the data that I usein this work. However, as commented in Section 3, assuming that the effect of ge-netic ability is constant over time, the analysis across the cohorts might be consid-ered as valid (at least in a descriptive sense).
With these purposes in mind, I will proceed as follows. The next section con-tains a description of the data used, also providing some descriptive evidence. In
Revista de Economía Aplicada
122
(6) See, for example, the papers by Chevalier & Lanot (2002), Blanden (2004), Franzini & Rai-tano (2009) examining the effect of short-term family financial constraints, or the papers by Er-misch & Francesconi (2001a, 2001b), Gennatian (2005), Björklund et al. (2006) concerned withthe effect of family structure and cohabitation on children’s schooling.(7) Moreover, better educated parents also make better residential and school choices for theirchildren, which could be another source of educational disparity through the neighbourhood/peereffect channel. However, due to data limitations, I am unable to consider this issue explicitly here.

Section 3, I present the empirical methodology. Section 4 reports the basic resultsabout the temporal patterns of educational opportunity and the decomposition ofthe direct and indirect effects of parental education. Finally, Section 5 discussesthe results and Section 6 concludes.
1. DATA AND DESCRIPTIVE EVIDENCE
In this paper I draw on data from the 2005 wave of the “Survey on Incomeand Living Conditions” (EU-SILC), a comparative multi-country panel survey co-ordinated by the Eurostat8. The 2005 wave of the EU-SILC survey is especiallyappropriate for analysing the link between educational opportunities and parentalbackground because it contains retrospective information about parental educa-tion and other family characteristics during childhood (specifically, when the indi-vidual was 14 years old). Additionally, the high number of observations in theItalian and in the Spanish samples9 is very useful for investigating temporal pat-terns because it enables the sample to be split into eight birth cohorts of five yearseach, extending from 1940 to 1980.
This allows a flexible strategy to be adopted for the analysis of temporalchanges (described in the next section), supported by the fact that education canbe considered unchanging before it is completed. Consequently, the evidenceacross cohorts can be taken as a temporal pattern, given that completed education(and its relationship with parental education) is not affected by the typical life-cycle bias considered in many intergenerational income transmission studies [see,for example, Nicoletti & Ermisch (2007) or Lee & Solon (2009)].
Information about educational attainment in the EU-SILC database is report-ed by ISCED levels (see UNESCO, 1997). However, in the empirical analysis, Igroup this information into four standard categorical levels of completed educa-tion, namely: 1) no-education or primary education, 2) lower secondary educa-tion, 3) upper secondary education, 4) tertiary education. This definition appliesto individual’s education, but also to the highest level of education completed byhis or her parents, which here represents the main measure of parental educationalbackground. Table 1A in the Appendix reports the relative frequencies of com-pleted education by country and birth cohort. As commented above, both coun-tries experienced a clear expansion of higher education across these forty years(i.e. less relative frequencies in the lower levels and more in the higher levels ofcompleted education). However, the movement towards tertiary education has
Parental education and family characteristics: educational opportunities across cohorts in Italy and Spain
123
(8) More information about the EU-SILC survey can be found in the following link: http://epp.eu-rostat.ec.europa.eu/portal/page/portal/microdata/eu_silc.(9) The retrospective information of the intergenerational transmission of poverty module is report-ed only for individuals aged between 25 and 65 in 2005 (that is, individuals born between 1940 and1980). Moreover, I retain only those observations i) for individuals who are not still studying in theyear of the survey, ii) with valid information about completed education, iii) about parental educa-tion for at least one parent and iv) for individuals who were not living in an institution when 14. Thefinal samples contain 30,493 observations for Italy and 17,889 observations for Spain.

been more marked for Spain than for Italy, given the higher concentration inupper secondary education in the latter, even for the youngest cohorts.
In an attempt to support the importance of this study, I present an intuitivedescriptive picture of the educational gap associated with parental backgroundand its evolution across the eight birth cohorts between 1940 and 1980. Figure 1contains, for both countries, the expected number of years of education10 by birthcohort, for each level for the highest level of parental education completed. Thisfigure shows an important and persistent schooling gap in both countries, whereonly individuals with at least one tertiary educated parent constantly achieve 15 ormore years of education (on average). Moreover, it is also clear that children fromthe least-advantaged group (individuals whose parents have no-education or onlyprimary education) are strongly penalized, even if their mean schooling attain-ment is increasing significantly over time.
Revista de Economía Aplicada
124
(10) The number of years of education are imputed from completed levels. Specifically, for Italy:2 years for no-education, 5 for primary education, 8 for lower-secondary, 13 for upper-secondaryand 18 for tertiary education. For Spain: 2 years for no-education, 6 for primary, 8 for lower-sec-ondary, 12 for upper-secondary and 17 for tertiary education.
Figure 1: EXPECTED (IMPUTED) YEARS OF EDUCATION
ACROSS BIRTH COHORTS BY PARENTAL EDUCATION
Source: Own elaboration.

However, in order to obtain more detailed evidence regarding the disparitiesin educational opportunity, we need to investigate the chances of completing anygiven level of education, since educational certificates have a strong legal value inthe two countries11. This means that any additional year of schooling not resultingin a higher grade has no value in the labour market, because it cannot be certified.
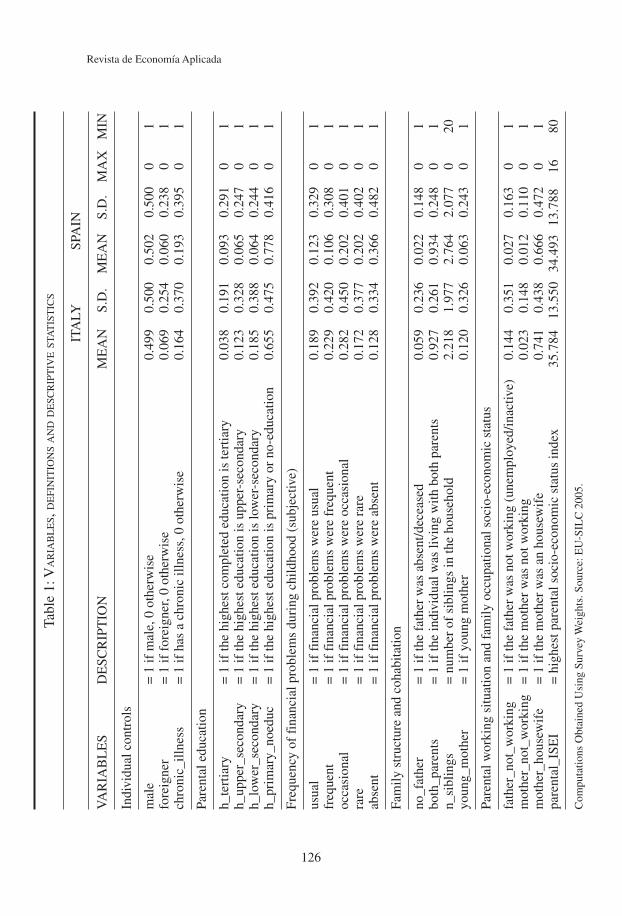
Moreover, we need to consider the presence of covariates (e.g. family char-acteristics and any other relevant variable), given that the educational gap ex-pressed by simple means might be exacerbated by the effect of other importantdeterminants of educational attainment. Therefore, with the information avail-able in the EU-SILC database, I define a set of family characteristics (other thanparental education), which are included in the empirical multivariate analysis;the details are contained in Table 1 together with some basic descriptive statisticsfor the two countries12.
Apart from information concerning the highest level of education completedby one of the two parents, I also consider the impact of 1) the frequency of finan-cial problems during childhood, 2) a set of variables representing family structureand cohabitation at the age of 14 (father absent/deceased, living with both parents,the number of siblings and young maternal age13), 3) parental working situationand occupational status.
Notice that, unfortunately, the EU-SILC 2005 database does not include ret-rospective information about family income. In order to partially circumvent thislimitation of the data, parental occupation (initially recorded in ISCO-88 codes)has been converted into family occupational socio-economic status [i.e. I consid-ered the highest ISEI index in the family, see Ganzeboom et al. (1992)]. By doingthis, the information about parental occupation is ranked according to (potential)family income, from the lowest value (16) to the highest possible value of theISEI index (90, 80 in these data).
Parental education and family characteristics: educational opportunities across cohorts in Italy and Spain
125
(11) This tends to provoke the ship-skin effect, which means that the students either obtain thecertificate or drop-out as soon as they realise they have little chance of completing that educationalgrade (Checchi 2003).(12) I also include as individual controls three separate indicators for gender, having a chronic ill-ness and foreign nationality, respectively. Note that, for brevity reasons, the analysis of the differ-ences by gender is not considered in this paper. The econometric model also includes indicators forobservations with missing values of the explanatory variables, where the original variables are re-placed with the mean value (by parental education and birth cohort) for continuous variables, andwith a zero for dummy variables.(13) The dummy for father absent/deceased would capture the possibility that the highest level ofeducation of the parents was that reported by the mother simply because the father was absent ordeceased, which is a common occurrence especially in the period post WWII for Italy, and postCivil War for Spain (that is, in the first two birth cohorts here). The definition of young mother-hood varies across cohorts, in order to take into account temporal changes in fertility behaviour: Iconsider a case of young motherhood a situation where the mother was younger than 18 during thefirst 4 cohorts, younger than 20 between the fifth and the sixth (included), and younger than 23 forthe last two cohorts.
Revista de Economía Aplicada
126
Tabl
e 1:
VA
RIA
BL
ES,
DE
FIN
ITIO
NS
AN
DD
ESC
RIP
TIV
EST
AT
IST
ICS
ITA
LYSP
AIN
VA
RIA
BL
ES
DE
SCR
IPT
ION
ME
AN
S.D
.M
EA
NS.
D.
MA
XM
IN
Indi
vidu
al c
ontr
ols
mal
e=
1 if
mal
e, 0
oth
erw
ise
0.49
90.
500
0.50
20.
500
01
fore
igne
r=
1 if
for
eign
er, 0
oth
erw
ise
0.06
90.
254
0.06
00.
238
01
chro
nic_
illne
ss=
1 if
has
a c
hron
ic il
lnes
s, 0
oth
erw
ise
0.16
40.
370
0.19
30.
395
01
Pare
ntal
edu
catio
n
h_te
rtia
ry=
1 if
the
high
est c
ompl
eted
edu
catio
n is
tert
iary
0.03
80.
191
0.09
30.
291
01
h_up
per_
seco
ndar
y=
1 if
the
high
est e
duca
tion
is u
pper
-sec
onda
ry0.
123
0.32
80.
065
0.24
70
1h_
low
er_s
econ
dary
= 1
if th
e hi
ghes
t edu
catio
n is
low
er-s
econ
dary
0.18
50.
388
0.06
40.
244
01
h_pr
imar
y_no
educ
= 1
if th
e hi
ghes
t edu
catio
n is
pri
mar
y or
no-
educ
atio
n0.
655
0.47
50.
778
0.41
60
1
Freq
uenc
y of
fin
anci
al p
robl
ems
duri
ng c
hild
hood
(su
bjec
tive)
usua
l=
1 if
fin
anci
al p
robl
ems
wer
e us
ual
0.18
90.
392
0.12
30.
329
01
freq
uent
= 1
if f
inan
cial
pro
blem
s w
ere
freq
uent
0.22
90.
420
0.10
60.
308
01
occa
sion
al=
1 if
fin
anci
al p
robl
ems
wer
e oc
casi
onal
0.28
20.
450
0.20
20.
401
01
rare
= 1
if f
inan
cial
pro
blem
s w
ere
rare
0.17
20.
377
0.20
20.
402
01
abse
nt=
1 if
fin
anci
al p
robl
ems
wer
e ab
sent
0.12
80.
334
0.36
60.
482
01
Fam
ily s
truc
ture
and
coh
abita
tion
no_f
athe
r=
1 if
the
fath
er w
as a
bsen
t/dec
ease
d0.
059
0.23
60.
022
0.14
80
1bo
th_p
aren
ts=
1 if
the
indi
vidu
al w
as li
ving
with
bot
h pa
rent
s0.
927
0.26
10.
934
0.24
80
1n_
sibl
ings
= n
umbe
r of
sib
lings
in th
e ho
useh
old
2.21
81.
977
2.76
42.
077
020
youn
g_m
othe
r=
1 if
you
ng m
othe
r0.
120
0.32
60.
063
0.24
30
1
Pare
ntal
wor
king
situ
atio
n an
d fa
mily
occ
upat
iona
l soc
io-e
cono
mic
sta
tus
fath
er_n
ot_w
orki
ng=
1 if
the
fath
er w
as n
ot w
orki
ng (
unem
ploy
ed/in
activ
e)0.
144
0.35
10.
027
0.16
30
1m
othe
r_no
t_w
orki
ng=
1 if
the
mot
her
was
not
wor
king
0.02
30.
148
0.01
20.
110
01
mot
her_
hous
ewif
e=
1 if
the
mot
her
was
an
hous
ewif
e0.
741
0.43
80.
666
0.47
20
1pa
rent
al_I
SEI
= h
ighe
st p
aren
tal s
ocio
-eco
nom
ic s
tatu
s in
dex
35.7
8413
.550
34.4
9313
.788
1680
Com
puta
tions
Obt
aine
d U
sing
Sur
vey
Wei
ghts
. Sou
rce:
EU
-SIL
C 2
005.
2. EMPIRICAL STRATEGY
As discussed above, the main objective of this paper is to explain the chancesof achieving a given educational grade for individuals of different parental educa-tional background. With the information about completed education categorizedinto four ordinal levels (no-education or primary (1), lower-secondary (2), upper-secondary (3) and tertiary education (4)), the most direct specification for model-ling this kind of dependent variable consists in the ordered probit, extensivelyused in the literature [see Cameron & Heckman (1998), Ermisch & Francesconi(2001a), Chevalier & Lanot (2002), Lauer (2003), Brunello & Checchi (2005),Heineck & Riphahn (2009), among many others).
Specifically, the educational opportunity for an individual of a particular edu-cational background who was born in a given cohort is defined as the predictedprobability from the ordered probit. In order to obtain a flexible representation ofthe temporal pattern of educational opportunities, I separately estimated themodel for each birth cohort. Moreover, family characteristics are fixed at the co-hort-by-parental education average value. In formulae, the predicted probabilityof completing level of education j, for an individual born in cohort c, with pa -rental educational background (highest completed education by the parents, PE)equal to k, is computed as:
Pr[E = j | PE = k, Z–k,c]c = Φ(μj,c – βk,c PEk – γc Z
–k,c) –
– Φ(μj–1,c – βk,c PEk – γc Z–k,c)
[1]
where Ф is the standard normal distribution and Z–k,c represents the vector of family
characteristics when the individual was 14, fixed at the mean value by parental edu-cation (k) and birth cohort (c). The coefficients, estimated separately for each cohort,represent the cut-points (μj,c), the coefficients associated with the parental educationindicator (PEk = k if parental education is equal to k), and the effect of family charac-teristics (Z
–k,c) on educational attainment (i.e. the coefficient vectors γc), respectively.One may argue that these results are biased by the effect of (the intergenerationaltransmission of) unobserved genetic ability; unfortunately, the EU-SILC 2005 datado not allow us to deal with this potential issue. Nevertheless, assuming that genetictransmission is constant over time [following Checchi et al. (2008) and Heineck &Riphahn (2009)], we may consider that the analysis of temporal changes is stillvalid, at least in a descriptive sense (i.e., not in causal terms). Moreover, other au-thors suggest that the contribution of ability to the intergenerational socio-economicpersistence seems to be rather limited [see Bowles and Gintis (2002)].
Subsequently, I investigate the “composition” of the disparities in education-al opportunities, which represents the second objective of this paper. The objetiveis to examine the extent to which children of better educated parents enjoy highereducational opportunities because of the better endowment of family characteris-tics they have with respect to children of parents with a lower educational back-ground (that is, fewer financial problems, better parental employment and occupa-tional outcomes, different fertility and cohabitation behaviours and so forth).
Parental education and family characteristics: educational opportunities across cohorts in Italy and Spain
127

In order to do this, I use a simple decomposition strategy which is based onthe pioneer Oaxaca-Blinder method [Blinder (1973), Oaxaca (1973)]. The follow-ing variant of the traditional Oaxaca-Blinder decomposition has been adaptedfrom the methodology used in Bourguignon et al. (2007), for investigating in-equality of opportunity in Brazil14. I consider the counterfactual predicted proba-bilities, computed by replacing the mean endowment of family characteristicsfrom the least-advantaged group (i.e. families whose parents have no-education oronly primary education, PE = 1).
These counterfactual predicted probabilities represent the (hypothetical) edu-cational opportunity for an individual with a given educational background (morethan primary education), if he/she had been endowed with the same family char-acteristics as those presented by the least-advantaged group. The counterfactualpredicted probabilities are computed as
Pr[E = j | PE = k, Z–1,c]c = Φ(μj,c – βk,c PEk – γc Z
–1,c) –
– Φ(μj–1,c – βk,c PEk – γc Z–1,c)
[2]
that is, replacing Z–k,c for Z
–1,c (the mean endowment of family characteristics whenparental education is equal to 1) for every level of parental education higher than1 (k = 2, 3, 4), and for every birth cohort c. Therefore, the difference between theactual and the counterfactual probability represents the changes in educational op-portunity in response to the better composition of family characteristics amongfamilies with higher levels of parental education (i.e., the indirect effect ofparental education on educational opportunity through the improvement in the en-dowment of family characteristics).
Notice that, as in Bourguignon et al. (2007), I consider that the returns onfamily characteristics (the γc coefficients) are the same for every level of parentaleducation (e.g. the increase in the number of siblings has the same effect for indi-viduals from different parental backgrounds, etc.). The justification for this as-sumption is twofold: first, I am only concerned with the disparities in the compo-sition/endowment of family characteristics. Second, it was not possible toestimate a separate model for each cohort with γc coefficients that are specific foreach level of parental education. Given that the main aim of this work consists ofanalysing temporal changes, I decided to maintain this constrained specification,considering that the educational disparities due to differences in the returns on fami-ly characteristics are of secondary importance.
Revista de Economía Aplicada
128
(14) The authors separate the component of income inequality due to “effort” from the componentsdue to the direct effect of “circumstances” on income inequality, and the indirect effect through theimpact of these circumstances on effort. Unfortunately, I cannot directly assess the issue of inequalityof opportunities (that is, dividing a given outcome into “effort” and “circumstances” components),because of the lack of “effort” variables for educational attainments in the EU-SILC database.

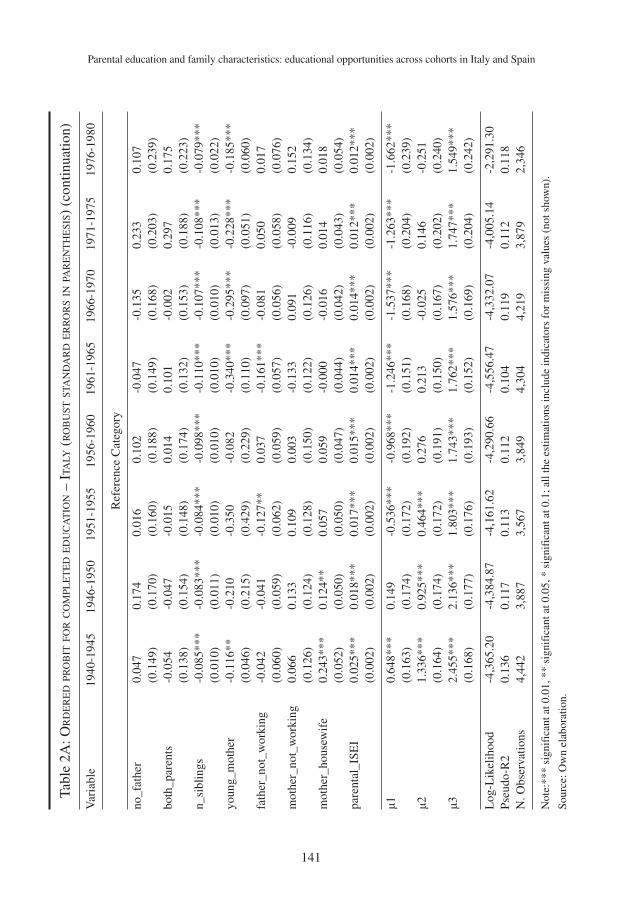
3. ESTIMATION RESULTS
The estimation results from the ordered probit models for completed educa-tion are reported in Tables 2A and 3A in the Appendix. Before proceeding withthe analysis of the predicted probabilities, I briefly describe the coefficient esti-mates and their changes over the eight birth cohorts for Italy and Spain. The firstsignificant result is that, in both countries, males obtained more schooling than fe-males in the first four cohorts. However, this gender gap was visibly reversed inthe last four cohorts.
As expected, parental educational background (the highest completed gradeby one of the two parents) represents the most important determinant of an indi-vidual’s education; its effect tends to decrease over time only in the case of Spain.An increase in the frequency of financial problems during childhood has a strongnegative impact on schooling in the two countries. However, the associated coeffi-cients decline over time in Spain but only moderately in Italy.
The only (observed) feature of cohabitation and family structure whichseems to have a clearly significant effect on educational attainment is the numberof siblings. In general, the negative effect of an increase in the number of siblingstends to increase across the cohorts for both Italy and Spain. Furthermore, ayoung maternal age clearly represents a penalization for educational attainmentsfor the later cohorts.
Parental working status does not significantly affect educational attainment,apart from the positive (and unexpected) effect of having a housewife mother,which was statistically significant in some birth cohorts in Spain and only in thefirst two cohorts in Italy. By contrast, a family’s occupational socio-economic sta-tus (represented by the highest ISEI in the family) is a strong predictor of educa-tional attainments, showing an effect that tends to decrease over time.
3.1. Predicted probabilitiesThe following step involves examining the predicted probabilities (the mea-
sure of educational opportunity) by parental education and for each birth cohort.For the sake of brevity, I only explicitly consider the predicted probabilities ofachieving post-compulsory education (that is, upper-secondary or tertiary educa-tion)15. The (actual) predicted probabilities and the 90% confidence intervals (dis-continuous lines) are shown in Figures 2a and 2b for Italy and Spain, respectively.For each level of parental education (PE), the line with triangular markers repre-sents the probability of being awarded a University degree and the line with squaremarkers corresponds to the probability of completing upper-secondary education.
Parental education and family characteristics: educational opportunities across cohorts in Italy and Spain
129
(15) The results (not shown here) indicate that the predicted probability of having only primaryeducation approaches the value of zero very quickly in both countries. Moreover, the probability ofleaving the educational system with only lower-secondary education is almost stable over time forthe two countries, and higher than 0.3% only for individuals with the lowest level of parental edu-cation. Even so, this “typology of individual” is likely to disappear with time when the effect of thecompulsory education reforms has an impact on the whole of the parent generation.

In Italy, the likelihood of completing upper-secondary education clearly in-creases across the cohorts. Moreover, upper-secondary educational opportunitiesfor individuals of different backgrounds tend to converge at the same level, exceptin the case of the children of tertiary educated parents, who are consistently onestep further towards tertiary education. The picture for tertiary education opportu-nity is quite distinct; in fact, only individuals from families with the highest edu-cational backgrounds display a persistently higher chance (but also the greatestdispersion) of completing their tertiary studies.
Revista de Economía Aplicada
130
Figure 2a: PREDICTED PROBABILITIES – ITALY
Source: Own elaboration.
The temporal pattern indicates that the probabilities of obtaining a Universitydegree were greatest during the first cohorts. This, in all likelihood, reflects a“transitory” effect of the 1962 educational reform, further enhanced by the effectsof the subsequent 1969 reform which opened up university entrance to studentsfrom non-academic schools. However, for the children of secondary educated par-ents, this probability fell during subsequent cohorts, increasing the disparities inopportunity for tertiary education. Moreover, for individuals from the lowestbackgrounds, the likelihood of achieving tertiary education remained consistentlylow over the entire period. In general, only the children of tertiary educated par-ents presented greater chances of completing tertiary education, which means that

they are the only ones to really benefit from the expansion of tertiary education.In fact, individuals from a lower background are always more likely to terminatetheir schooling in upper-secondary school than with a University degree.
Parental education and family characteristics: educational opportunities across cohorts in Italy and Spain
131
Figure 2b: PREDICTED PROBABILITIES – SPAIN
Source: Own elaboration.
The evidence for Spain differs considerably; in fact, the probability of ob-taining an upper-secondary education remains virtually unchanged over time,showing a moderately rising tendency only in the case of individuals from lower-secondary educated families or less. Nevertheless, the disparities in upper-sec-ondary education opportunities tend to disappear over the course of time in Spainas well. As for tertiary education opportunity, the results for Spain suggest amarked improvement, given the general increase in predicted probabilities. Evenso, the chances of being awarded a University degree are visibly higher among thechildren of tertiary educated parents, while they are markedly lower among thechildren of primary or uneducated parents16. This picture suggests that the dispar-
(16) Note also that, in the case of Spain, the dispersion of tertiary education opportunities (whichcan be taken as a broad measure of within-group inequality) is higher for individuals with upper-secondary and “to a lesser extent” lower-secondary educated parents. Moreover, in the Spanish
ities in tertiary education opportunities have clearly diminished over time but that“to some extent” they still persist for the youngest cohorts (at least up to the endof the period analysed here).
However, the situation is less complicated than in the case of Italy, given thatthe chances of completing University are always higher than the chances of leav-ing education at the end of upper-secondary school (except for individuals fromthe least-advantaged group). In general, this means that, in Spain, individualsfrom a lower background have also benefited from the expansion of tertiary edu-cation, albeit not to the same extent as individuals from higher backgrounds.
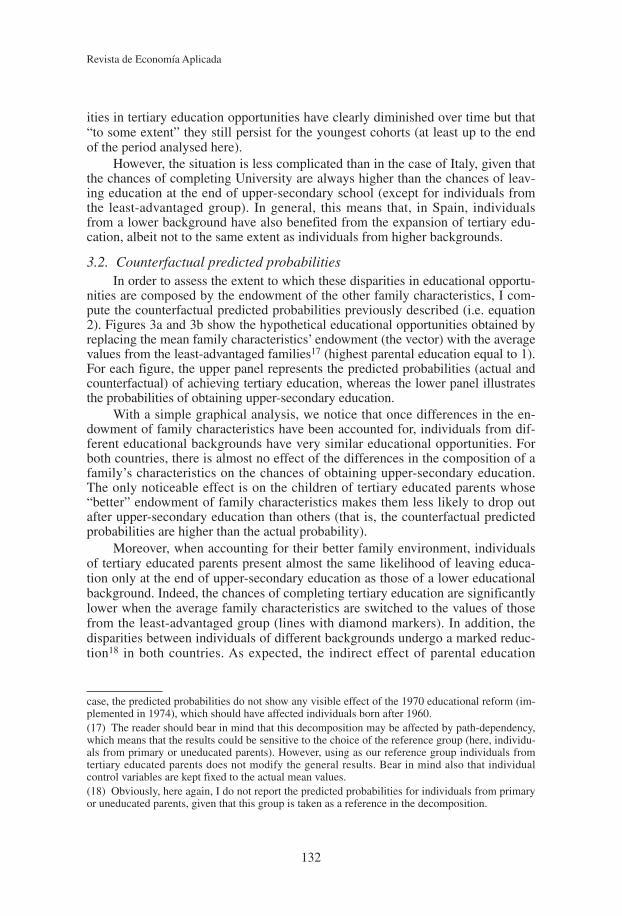
3.2. Counterfactual predicted probabilitiesIn order to assess the extent to which these disparities in educational opportu-
nities are composed by the endowment of the other family characteristics, I com-pute the counterfactual predicted probabilities previously described (i.e. equation2). Figures 3a and 3b show the hypothetical educational opportunities obtained byreplacing the mean family characteristics’ endowment (the vector) with the averagevalues from the least-advantaged families17 (highest parental education equal to 1).For each figure, the upper panel represents the predicted probabilities (actual andcounterfactual) of achieving tertiary education, whereas the lower panel illustratesthe probabilities of obtaining upper-secondary education.
With a simple graphical analysis, we notice that once differences in the en-dowment of family characteristics have been accounted for, individuals from dif-ferent educational backgrounds have very similar educational opportunities. Forboth countries, there is almost no effect of the differences in the composition of afamily’s characteristics on the chances of obtaining upper-secondary education.The only noticeable effect is on the children of tertiary educated parents whose“better” endowment of family characteristics makes them less likely to drop outafter upper-secondary education than others (that is, the counterfactual predictedprobabilities are higher than the actual probability).
Moreover, when accounting for their better family environment, individualsof tertiary educated parents present almost the same likelihood of leaving educa-tion only at the end of upper-secondary education as those of a lower educationalbackground. Indeed, the chances of completing tertiary education are significantlylower when the average family characteristics are switched to the values of thosefrom the least-advantaged group (lines with diamond markers). In addition, thedisparities between individuals of different backgrounds undergo a marked reduc-tion18 in both countries. As expected, the indirect effect of parental education
Revista de Economía Aplicada
132
case, the predicted probabilities do not show any visible effect of the 1970 educational reform (im-plemented in 1974), which should have affected individuals born after 1960.(17) The reader should bear in mind that this decomposition may be affected by path-dependency,which means that the results could be sensitive to the choice of the reference group (here, individu-als from primary or uneducated parents). However, using as our reference group individuals fromtertiary educated parents does not modify the general results. Bear in mind also that individualcontrol variables are kept fixed to the actual mean values.(18) Obviously, here again, I do not report the predicted probabilities for individuals from primaryor uneducated parents, given that this group is taken as a reference in the decomposition.

Parental education and family characteristics: educational opportunities across cohorts in Italy and Spain
133
Figu
re 3
a: C
OU
NT
ER
FAC
TU
AL
PRE
DIC
TE
DPR
OB
AB
ILIT
IES
–IT
ALY
Sour
ce: O
wn
elab
orat
ion.

Revista de Economía Aplicada
134
Figu
re 3
b: C
OU
NT
ER
FAC
TU
AL
PRE
DIC
TE
DPR
OB
AB
ILIT
IES
–SP
AIN
Sour
ce: O
wn
elab
orat
ion.

through the endowment of family characteristics increases with parental school-ing. Moreover, it displays only a moderate tendency to decrease across the cohorts(which seems to be more marked in the Spanish case); in fact, a significant effectof family characteristics’ composition still persists for the youngest cohorts.
Finally, it seems that parental socio-economic status represents the most im-portant component of family characteristics. In Figures 3a and 3b I also report theadditional counterfactual probabilities obtained by switching only parental socio-economic status (lines with squared markers) to the average values from the least-advantaged group. In both countries, the impact of parental education on the en-dowment of family’s socio-economic status accounts for the greatest part of thefamily characteristics’ composition effect. Furthermore, the effect of the rest offamily characteristics19 –i.e. the difference between the diamonded and thesquared lines– is, in general, less marked.
4. DISCUSSION
The results reported above make several contributions to the existing evidenceregarding educational opportunities in Italy and Spain. First of all, the results forupper-secondary education opportunities appear to show that individuals of differ-ent educational backgrounds have, over the course of time, attained almost the samechances of completing upper-secondary education. In fact, both countries display atendency towards the equalization of the predicted probability of completing upper-secondary education (with the exception of individuals with at least one tertiary ed-ucated parent, who consistently go one step further into tertiary education).
However, the definition of upper-secondary education might hide major dis-parities in relation to family background, given the differences in the educationalcurricula. In fact, the definition of upper-secondary education (taken from theISCED codification) does not differentiate between academic and non-academictracks at upper secondary school. This means that, even though it might seem thatindividuals of different backgrounds record the same predicted probability, thosewith a more unfavourable educational background might be more likely to enrolin non-academic schools (irrespective of their ability). This represents an addi-tional source of educational disparity, which, unfortunately, is not possible to cap-ture with the EU-SILC data.
The effects of this disparity in secondary education track choices probablyresults in a reduction in the chances of successfully graduating from University,given the lower levels of quality and prestige traditionally attached to non-acade-mic schools. Note that this problem might be considerably more pronounced inItaly than in Spain, since the track separation in the former is much more marked
Parental education and family characteristics: educational opportunities across cohorts in Italy and Spain
135
(19) The effect of the rest of family characteristics is mainly attributable to the impact of the num-ber of siblings and the impact of financial problems during childhood. Note that this could meanthat short-term financial constraints are not a real problem for educational opportunity (given thatparental education is highly correlated with this variable). However, this variable represents “sub-jective financial well-being”, and its subjective nature could explain the relatively low impact oneducational opportunity (apart from other potential “recall” problems).

than in the latter. In general, in Spain, vocational secondary school has been his-torically associated with school failure cases, while the general schooling processconsists of proceeding with an academic secondary education.
The evidence for tertiary education opportunities is, in general, consistentwith this possibility and presumably represents the other side of the same coin. Infact, while disparities in the chances of obtaining a University degree have signifi-cantly diminished across the cohorts in Spain, the evidence for the Italian case isquite distinct; in Italy, the difference in the likelihood of obtaining tertiary educa-tion among individuals of different backgrounds has tended to increase over time.Moreover, in Italy, only the children of tertiary educated parents are more likelyto complete tertiary education than upper-secondary education; for individuals ofa lower background, the evidence is just the reverse. By contrast, in Spain, thechances of obtaining a University degree are always higher than the probability ofterminating one’s schooling with (only) an upper-secondary education (excludingindividuals of the lowest backgrounds).
Another factor that might rationalise this divergence in the results betweenthe two countries consists of the stable effect of parental education on a child’seducational achievements in Italy. This persistent relationship between parentaleducation and a child’s schooling (reported in the previous estimations), togetherwith the strong early track separation in post-compulsory secondary schools,might explain why, in Italy, the inequality in tertiary education opportunities hastended to rise over time and why this has not been the case in Spain. However,other possible explanations might lie in the labour market and in the supply sideof education (i.e. different returns on education, differences in educational quality,etc.), or systematic differences in individual/family behaviour related to educa-tional choices [for example, with respect to the role of risk aversion, as in Checchiet al. (2008), Belzil & Leonardi 2007].
In addition, the results from the decomposition of the predicted probabilitiessuggest that individuals with a more favourable educational background obtainhigher tertiary education opportunities, as well as because of their better endow-ment of family characteristics (with respect to individuals of the lowest back-ground). In other words, higher parental education yields better tertiary educationopportunity for their children because it enables them to generate a more stimulat-ing family environment. When accounting for differences in family characteristicsassociated with parental education, children from tertiary educated parents (whodisplay the highest tertiary education opportunity) are more prone to stop atupper-secondary school. Moreover, the disparities in the chances of obtaining aUniversity degree are significantly reduced.
The results reported here indicate that the most important component of fami-ly characteristics is parental socio-economic status during the childhood. Thus,more highly educated parents increase the educational opportunity of their childrenbecause their educational achievements enable them to generate a higher socio-economic status in the family. Indeed, the effect of family socio-economic statuson educational opportunity might proxy some long-standing income element butalso other factors related to parental social networking. Another potential explana-tion for these results could be that parents who have achieved a high socio-eco-nomic status thanks to their schooling might be more capable of shaping their chil-
Revista de Economía Aplicada
136

dren’s educational opportunity because of the transmission of non-cognitive skills(such as motivation and persistence), but also by providing a better perception ofthe global value of schooling, and creating the right incentives to stay in education.
Finally, as commented above, it should be borne in mind that unobservedparental characteristics, related to parental education, might simultaneously affecta child’s educational opportunity and the endowment of family characteristics.Therefore, to some extent, the indirect effect of parental education on educationalopportunity might also include such unobservable effects. Nevertheless, assessingthis issue in causal terms requires more detailed data and would be an interestingsubject for future research (once additional data become available).
5. CONCLUSIONS
This paper provides an analysis of post-compulsory educational opportuni-ties in Italy and Spain and their respective evolutions across birth cohorts for indi-viduals born between 1940 and 1980. The results indicate that individuals of dif-ferent educational backgrounds have, over the course of time, attained the samechances of completing upper-secondary education. This evidence may be inter-preted as the equalization of opportunity in secondary education for individuals ofdifferent origins. However, as discussed above, the results may conceal significantdisparities related to the choice of educational curricula in academic and non-aca-demic secondary schools.
This analysis also confirms the conclusions reported elsewhere that the ex-pansion of tertiary education has had a disproportionate advantage for individualsfrom a higher educational background, who are the only ones who consistentlypresent the best chances of completing University education. This situation is sig-nificantly more complex in Italy where the disparity in opportunities in tertiaryeducation among individuals from different backgrounds seems to increase overtime. In the Spanish case, the gap in the predicted probability of obtaining a Uni-versity degree clearly tends to decrease over time, even if significant disparitiesare also present in the youngest cohorts.
The results obtained from the decomposition of educational opportunitiesseem to indicate that a sizeable part of the disparity in the chances of completing aUniversity degree is explained by differences in the endowment of family charac-teristics. More specifically, they suggest that the children of better educated parentsare, more likely to complete their tertiary education because the higher educationof their parents provides them with a better family environment for their schooling.Among the various family characteristics considered, parental socio-economic sta-tus is, in both countries, the most important factor accounting for the observed gapin educational opportunity.
The difference in the endowment of family characteristics provides a furtherpotential explanation of the persistence in educational disparities based on socialorigins. Even if the effect family characteristic cannot be entirely separated fromother potential explanations (e.g. the effect of unobservable parental characteris-tics or other factors related to secondary school choices), it needs to be taken intoconsideration by policymakers. The main recommendation here involves focusing
Parental education and family characteristics: educational opportunities across cohorts in Italy and Spain
137

educational policies so as to reduce the impact of long-standing family character-istics on post-compulsory education opportunities. The first alternative would in-volve creating school support programs for students from poor educational back-grounds, especially as regards their educational choices. However, the mosteffective policy would involve institutional changes in the educational system it-self, promoting early schooling, extending compulsory education, postponing thetracking decision by implementing a comprehensive secondary school system.
Note that, in Spain, the educational system has already moved in this direc-tion. With the implementation of the Organic General Act of the Educational Sys-tem (LOGSE) of 1990, the country took two important steps towards the destrati-fication of education. This act introduced a comprehensive system of compulsoryeducation up to the age of 16 (primary and lower-secondary education), delayingtrack separation by an additional two years. In all likelihood, more recent datawould reflect this institutional change, showing a further reduction in educationaldisparities associated with family background.
In the case of Italy, the stratification appears to be much stronger. Even thoughcompulsory education was recently extended until the age of 16 (with law no.296/2006), the marked track separation between academic, professional and techni-cal upper-secondary education remains. In addition, a more recent act called “Colle-gato Lavoro” (law no. 183/2010, which was approved in October 2010) states thatstudents may substitute the last year of compulsory schooling with a year spent asan apprentice in a firm20. It is quite likely that this reform would nullify the positiveeffect of the extension of compulsory schooling on the equalisation of educationalopportunities. In any case, the current academic and political debate is now con-cerned, among other things, with the possibility of reducing or restructuring thenumber of educational programs, or switching towards a comprehensive system ofupper-secondary education, which (as frequently suggested) is the most effectivestrategy for reducing the existing disparities in educational opportunities.
Finally, as regards tertiary education, a number of authors claim that the in-troduction of the “Bologna System” is a crucial opportunity for equalising oppor-tunities for higher education, especially among the more able students from un-favourable family backgrounds [Cappellari & Lucifora (2009)]. This reformmight serve to reduce the disparity in tertiary education opportunities. This seemspossible because the reduction in the duration of tertiary studies and in the num-ber of examinations should reduce University opportunity costs, relaxing the neg-ative effect of credit constraints on more able individuals. Since the Bologna Re-form has still not been fully implemented in Spain, and the data for Italy are onlyavailable for the first cohort of individuals educated under this new system, weneed to wait for the availability of fresh data before considering the long-term ef-fects of this reform on tertiary education opportunities.
Revista de Economía Aplicada
138
(20) I am grateful to an anonymous referee for this suggestion.

Parental education and family characteristics: educational opportunities across cohorts in Italy and Spain
139
APPENDIX
Table 1A: COMPLETED EDUCATION BY COUNTRY
AND BIRTH COHORT (RELATIVE FREQUENCIES)
Completed education (% of the sample by birth-cohort)
Italy
Lower Upper Number ofBirth cohort Basic Secondary Secondary Tertiary Observations
1 1940-1945 49.43 23.34 19.73 7.49 4,4422 1946-1950 36.82 28.22 24.53 10.44 3,8873 1951-1955 22.42 33.72 30.58 13.28 3,5674 1956-1960 13.25 39.48 34.89 12.38 3,8495 1961-1965 8.38 39.45 39.73 12.45 4,3046 1966-1970 5.82 37.45 42.20 14.54 4,2197 1971-1975 6.03 32.87 44.43 16.67 3,8798 1976-1980 3.95 30.50 50.93 14.62 2,346Pooled sample 18.22 33.42 35.64 12.71 30,493
Spain
Lower Upper Number ofBirth cohort Basic Secondary Secondary Tertiary Observations
1 1940-1945 66.28 11.65 10.03 12.04 2,2172 1946-1950 54.00 18.71 13.36 13.93 2,0883 1951-1955 42.38 23.40 17.47 16.75 2,0974 1956-1960 30.17 24.26 23.61 21.97 2,4715 1961-1965 23.29 26.87 23.57 26.27 2,6846 1966-1970 18.16 24.85 26.02 30.97 2,4647 1971-1975 15.13 21.39 25.74 37.73 2,2868 1976-1980 13.14 23.43 26.41 37.02 1,582Pooled sample 30.86 22.02 21.43 25.51 17,889
Computations Obtained Using Survey Weights SOURCE EU-SILC 2005.

Revista de Economía Aplicada
140
Tabl
e 2A
: OR
DE
RE
DPR
OB
ITFO
RC
OM
PLE
TE
DE
DU
CA
TIO
N–
ITA
LY(R
OB
UST
STA
ND
AR
DE
RR
OR
SIN
PAR
EN
TH
ESI
S)
Var
iabl
e19
40-1
945
1946
-195
019
51-1
955
1956
-196
019
61-1
965
1966
-197
019
71-1
975
1976
-198
0
mal
e0.
427*
**0.
392*
**0.
202*
**0.
117*
**-0
.012
-0.1
39**
*-0
.180
***
-0.2
62**
*(0
.036
)(0
.037
)(0
.037
)(0
.035
)(0
.034
)(0
.034
)(0
.036
)(0
.047
)fo
reig
ner
0.29
4**
0.30
7**
-0.0
580.
051
-0.0
26-0
.061
-0.2
67**
*-0
.348
***
(0.1
18)
(0.1
30)
(0.1
33)
(0.0
87)
(0.0
75)
(0.0
66)
(0.0
71)
(0.0
89)
chro
nic_
illne
ss-0
.117
***
-0.0
96**
-0.1
88**
*-0
.094
*-0
.293
***
-0.2
17**
*-0
.314
***
-0.2
80**
*(0
.039
)(0
.043
)(0
.046
)(0
.049
)(0
.050
)(0
.059
)(0
.071
)(0
.095
)h_
tert
iary
0.93
6***
1.33
4***
1.11
2***
1.08
8***
1.04
2***
1.19
8***
1.22
0***
1.16
8***
(0.1
41)
(0.2
03)
(0.1
60)
(0.1
40)
(0.1
25)
(0.1
32)
(0.1
21)
(0.1
38)
h_up
per_
seco
ndar
y0.
821*
**0.
974*
**1.
002*
**0.
850*
**0.
701*
**0.
784*
**0.
678*
**0.
682*
**(0
.068
)(0
.088
)(0
.084
)(0
.070
)(0
.064
)(0
.059
)(0
.055
)(0
.073
)h_
low
er_s
econ
dary
0.64
1***
0.73
8***
0.64
0***
0.58
1***
0.45
1***
0.38
4***
0.38
0***
0.25
1***
(0.0
61)
(0.0
61)
(0.0
60)
(0.0
52)
(0.0
46)
(0.0
43)
(0.0
42)
(0.0
58)
h_pr
imar
y_no
educ
Ref
eren
ce C
ateg
ory
usua
l-0
.452
***
-0.4
48**
*-0
.482
***
-0.5
25**
*-0
.261
***
-0.3
97**
*-0
.369
***
-0.5
67**
*(0
.071
)(0
.077
)(0
.073
)(0
.073
)(0
.066
)(0
.066
)(0
.072
)(0
.101
)fr
eque
nt-0
.374
***
-0.3
29**
*-0
.380
***
-0.3
47**
*-0
.249
***
-0.3
01**
*-0
.154
**-0
.441
***
(0.0
71)
(0.0
75)
(0.0
69)
(0.0
68)
(0.0
60)
(0.0
60)
(0.0
62)
(0.0
85)
occa
sion
al-0
.246
***
-0.2
16**
*-0
.223
***
-0.1
46**
-0.1
14**
-0.1
65**
*-0
.118
**-0
.311
***
(0.0
70)
(0.0
75)
(0.0
68)
(0.0
65)
(0.0
55)
(0.0
54)
(0.0
53)
(0.0
72)
Rar
e-0
.087
-0.0
51-0
.112
-0.1
39**
-0.0
73-0
.093
0.05
8-0
.243
***
(0.0
76)
(0.0
81)
(0.0
75)
(0.0
71)
(0.0
62)
(0.0
60)
(0.0
56)
(0.0
75)
abse
nt
Not
e:**
* si
gnif
ican
t at 0
.01,
**
sign
ific
ant a
t 0.0
5, *
sig
nifi
cant
at 0
.1; a
ll th
e es
timat
ions
incl
ude
indi
cato
rs f
or m
issi
ng v
alue
s (n
ot s
how
n).
Sour
ce: O
wn
elab
orat
ion.
Parental education and family characteristics: educational opportunities across cohorts in Italy and Spain
141
Tabl
e 2A
: OR
DE
RE
DPR
OB
ITFO
RC
OM
PLE
TE
DE
DU
CA
TIO
N–
ITA
LY(R
OB
UST
STA
ND
AR
DE
RR
OR
SIN
PAR
EN
TH
ESI
S)(c
ontin
uatio
n)
Var
iabl
e19
40-1
945
1946
-195
019
51-1
955
1956
-196
019
61-1
965
1966
-197
019
71-1
975
1976
-198
0
Ref
eren
ce C
ateg
ory
no_f
athe
r0.
047
0.17
40.
016
0.10
2-0
.047
-0.1
350.
233
0.10
7(0
.149
)(0
.170
)(0
.160
)(0
.188
)(0
.149
)(0
.168
)(0
.203
)(0
.239
)bo
th_p
aren
ts-0
.054
-0.0
47-0
.015
0.01
40.
101
-0.0
020.
297
0.17
5(0
.138
)(0
.154
)(0
.148
)(0
.174
)(0
.132
)(0
.153
)(0
.188
)(0
.223
)n_
sibl
ings
-0.0
85**
*-0
.083
***
-0.0
84**
*-0
.098
***
-0.1
10**
*-0
.107
***
-0.1
08**
*-0
.079
***
(0.0
10)
(0.0
11)
(0.0
10)
(0.0
10)
(0.0
10)
(0.0
10)
(0.0
13)
(0.0
22)
youn
g_m
othe
r-0
.116
**-0
.210
-0.3
50-0
.082
-0.3
40**
*-0
.295
***
-0.2
28**
*-0
.185
***
(0.0
46)
(0.2
15)
(0.4
29)
(0.2
29)
(0.1
10)
(0.0
97)
(0.0
51)
(0.0
60)
fath
er_n
ot_w
orki
ng-0
.042
-0.0
41-0
.127
**0.
037
-0.1
61**
*-0
.081
0.05
00.
017
(0.0
60)
(0.0
59)
(0.0
62)
(0.0
59)
(0.0
57)
(0.0
56)
(0.0
58)
(0.0
76)
mot
her_
not_
wor
king
0.06
60.
133
0.10
90.
003
-0.1
330.
091
-0.0
090.
152
(0.1
26)
(0.1
24)
(0.1
28)
(0.1
50)
(0.1
22)
(0.1
26)
(0.1
16)
(0.1
34)
mot
her_
hous
ewif
e0.
243*
**0.
124*
*0.
057
0.05
9-0
.000
-0.0
160.
014
0.01
8(0
.052
)(0
.050
)(0
.050
)(0
.047
)(0
.044
)(0
.042
)(0
.043
)(0
.054
)pa
rent
al_I
SEI
0.02
5***
0.01
8***
0.01
7***
0.01
5***
0.01
4***
0.01
4***
0.01
2***
0.01
2***
(0.0
02)
(0.0
02)
(0.0
02)
(0.0
02)
(0.0
02)
(0.0
02)
(0.0
02)
(0.0
02)
μ1
0.64
8***
0.14
9-0
.536
***
-0.9
68**
*-1
.246
***
-1.5
37**
*-1
.263
***
-1.6
62**
*(0
.163
)(0
.174
)(0
.172
)(0
.192
)(0
.151
)(0
.168
)(0
.204
)(0
.239
)μ
21.
336*
**0.
925*
**0.
464*
**0.
276
0.21
3-0
.025
0.14
6-0
.251
(0.1
64)
(0.1
74)
(0.1
72)
(0.1
91)
(0.1
50)
(0.1
67)
(0.2
02)
(0.2
40)
μ3
2.45
5***
2.13
6***
1.80
3***
1.74
3***
1.76
2***
1.57
6***
1.74
7***
1.54
9***
(0.1
68)
(0.1
77)
(0.1
76)
(0.1
93)
(0.1
52)
(0.1
69)
(0.2
04)
(0.2
42)
Log
-Lik
elih
ood
-4,3
65.2
0-4
,384
.87
-4,1
61.6
2-4
,290
.66
-4,5
56.4
7-4
,332
.07
-4,0
05.1
4-2
,291
.30
Pseu
do-R
20.
136
0.11
70.
113
0.11
20.
104
0.11
90.
112
0.11
8N
. Obs
erva
tions
4,44
23,
887
3,56
73,
849
4,30
44,
219
3,87
92,
346
Not
e:**
* si
gnif
ican
t at 0
.01,
**
sign
ific
ant a
t 0.0
5, *
sig
nifi
cant
at 0
.1; a
ll th
e es
timat
ions
incl
ude
indi
cato
rs f
or m
issi
ng v
alue
s (n
ot s
how
n).
Sour
ce: O
wn
elab
orat
ion.

Revista de Economía Aplicada
142
Tabl
e 3A
: OR
DE
RE
DPR
OB
ITFO
RC
OM
PLE
TE
DE
DU
CA
TIO
N–
SPA
IN(R
OB
UST
STA
ND
AR
DE
RR
OR
SIN
PAR
EN
TH
ESI
S)
Var
iabl
e19
40-1
945
1946
-195
019
51-1
955
1956
-196
019
61-1
965
1966
-197
019
71-1
975
1976
-198
0
mal
e0.
456*
**0.
356*
**0.
330*
**0.
197*
**-0
.079
*-0
.109
**-0
.190
***
-0.2
89**
*(0
.057
)(0
.053
)(0
.051
)(0
.046
)(0
.043
)(0
.045
)(0
.047
)(0
.057
)fo
reig
ner
0.56
9***
0.12
10.
223
0.23
5**
0.09
50.
105
-0.0
89-0
.118
(0.2
06)
(0.1
43)
(0.1
38)
(0.1
14)
(0.0
97)
(0.0
84)
(0.0
91)
(0.1
05)
chro
nic_
illne
ss-0
.210
***
-0.1
47**
-0.1
41**
-0.2
50**
*-0
.292
***
-0.2
76**
*-0
.213
***
-0.3
13**
*(0
.059
)(0
.059
)(0
.058
)(0
.059
)(0
.058
)(0
.069
)(0
.079
)(0
.098
)h_
tert
iary
0.95
0***
0.77
0***
1.04
3***
0.86
4***
0.84
5***
0.86
7***
0.71
6***
0.86
8***
(0.1
47)
(0.1
33)
(0.1
35)
(0.1
09)
(0.0
99)
(0.0
96)
(0.0
99)
(0.1
25)
h_up
per_
seco
ndar
y0.
919*
**1.
031*
**0.
949*
**0.
727*
**0.
501*
**0.
737*
**0.
533*
**0.
614*
**(0
.125
)(0
.118
)(0
.128
)(0
.098
)(0
.098
)(0
.098
)(0
.088
)(0
.086
)h_
low
er_s
econ
dary
0.57
8***
0.80
3***
0.71
1***
0.52
4***
0.42
5***
0.28
5***
0.34
5***
0.16
7**
(0.1
23)
(0.1
43)
(0.1
09)
(0.1
15)
(0.0
89)
(0.0
75)
(0.0
75)
(0.0
70)
h_pr
imar
y_no
educ
Ref
eren
ce C
ateg
ory
usua
l-0
.584
***
-0.5
53**
*-0
.412
***
-0.4
81**
*-0
.208
**-0
.307
***
-0.4
76**
*-0
.564
***
(0.0
87)
(0.0
87)
(0.0
85)
(0.0
84)
(0.0
85)
(0.0
87)
(0.1
02)
(0.1
16)
freq
uent
-0.5
45**
*-0
.394
***
-0.4
28**
*-0
.346
***
-0.2
58**
*-0
.277
***
-0.2
70**
*-0
.489
***
(0.0
95)
(0.0
87)
(0.0
85)
(0.0
85)
(0.0
79)
(0.0
91)
(0.0
92)
(0.1
17)
occa
sion
al-0
.511
***
-0.2
93**
*-0
.241
***
-0.3
02**
*-0
.217
***
-0.1
95**
*-0
.242
***
-0.2
89**
*(0
.082
)(0
.076
)(0
.073
)(0
.062
)(0
.058
)(0
.062
)(0
.066
)(0
.080
)R
are
-0.2
79**
*-0
.166
**-0
.141
*-0
.069
-0.1
96**
*-0
.176
***
-0.1
11*
-0.0
81(0
.090
)(0
.080
)(0
.074
)(0
.062
)(0
.059
)(0
.061
)(0
.061
)(0
.075
)ab
sent
Not
e:**
* si
gnif
ican
t at 0
.01,
**
sign
ific
ant a
t 0.0
5, *
sig
nifi
cant
at 0
.1; a
ll th
e es
timat
ions
incl
ude
indi
cato
rs f
or m
issi
ng v
alue
s (n
ot s
how
n).
Sour
ce: O
wn
elab
orat
ion.

Parental education and family characteristics: educational opportunities across cohorts in Italy and Spain
143
Tabl
e 3A
: OR
DE
RE
DPR
OB
ITFO
RC
OM
PLE
TE
DE
DU
CA
TIO
N–
SPA
IN(R
OB
UST
STA
ND
AR
DE
RR
OR
SIN
PAR
EN
TH
ESI
S) (
cont
inua
tion)
Var
iabl
e19
40-1
945
1946
-195
019
51-1
955
1956
-196
019
61-1
965
1966
-197
019
71-1
975
1976
-198
0
Ref
eren
ce C
ateg
ory
no_f
athe
r-0
.102
0.09
7-0
.179
0.23
2-0
.198
0.36
9*-0
.129
0.03
7(0
.198
)(0
.252
)(0
.259
)(0
.191
)(0
.188
)(0
.200
)(0
.186
)(0
.287
)bo
th_p
aren
ts0.
023
0.04
5-0
.180
0.23
0*-0
.084
0.27
9**
-0.1
330.
008
(0.1
17)
(0.1
45)
(0.1
54)
(0.1
22)
(0.1
32)
(0.1
31)
(0.1
35)
(0.1
63)
n_si
blin
gs-0
.082
***
-0.0
69**
*-0
.067
***
-0.0
75**
*-0
.106
***
-0.1
23**
*-0
.108
***
-0.1
08**
*(0
.014
)(0
.014
)(0
.012
)(0
.011
)(0
.011
)(0
.012
)(0
.013
)(0
.019
)yo
ung_
mot
her
-0.1
26-0
.136
-0.2
52-0
.765
***
-0.1
15-0
.347
***
-0.2
22**
*-0
.330
***
(0.1
67)
(0.2
21)
(0.2
12)
(0.1
47)
(0.1
20)
(0.1
04)
(0.0
60)
(0.0
74)
fath
er_n
ot_w
orki
ng-1
.110
***
-0.4
26-0
.366
-0.3
37*
0.10
6-0
.027
-0.0
100.
289
(0.4
00)
(0.3
23)
(0.2
24)
(0.2
04)
(0.2
18)
(0.1
92)
(0.1
59)
(0.1
93)
mot
her_
not_
wor
king
0.52
1*0.
074
-0.2
52-0
.047
-0.2
85-0
.135
-0.1
31-0
.295
*(0
.284
)(0
.302
)(0
.245
)(0
.233
)(0
.195
)(0
.247
)(0
.246
)(0
.173
)m
othe
r_ho
usew
ife
0.18
1***
0.05
10.
126*
*0.
070
0.14
2***
0.18
3***
0.15
2***
0.05
6(0
.065
)(0
.060
)(0
.057
)(0
.052
)(0
.048
)(0
.049
)(0
.051
)(0
.060
)pa
rent
al_I
SEI
0.02
2***
0.02
5***
0.02
0***
0.02
5***
0.02
6***
0.01
8***
0.01
8***
0.01
6***
(0.0
03)
(0.0
03)
(0.0
03)
(0.0
02)
(0.0
02)
(0.0
02)
(0.0
02)
(0.0
03)
μ1
0.87
2***
0.70
7***
0.10
20.
193
-0.4
24**
*-0
.467
***
-0.9
66**
*-1
.163
***
(0.1
66)
(0.1
83)
(0.1
81)
(0.1
52)
(0.1
59)
(0.1
61)
(0.1
75)
(0.2
08)
μ2
1.39
4***
1.35
3***
0.79
8***
0.96
8***
0.50
0***
0.47
6***
-0.1
16-0
.206
(0.1
67)
(0.1
85)
(0.1
82)
(0.1
53)
(0.1
59)
(0.1
61)
(0.1
75)
(0.2
06)
μ3
1.92
9***
1.92
7***
1.49
7***
1.77
1***
1.29
3***
1.28
8***
0.63
3***
0.62
7***
(0.1
72)
(0.1
88)
(0.1
84)
(0.1
54)
(0.1
61)
(0.1
63)
(0.1
75)
(0.2
06)
Log
-Lik
elih
ood
-1,8
11.3
7-2
,103
.42
-2,4
05.5
5-2
,995
.41
-3,2
99.1
7-3
,023
.20
-2,7
69.1
7-1
,853
.47
Pseu
do-R
20.
178
0.14
10.
123
0.12
00.
111
0.10
50.
099
0.11
4N
. Obs
erva
tions
2,21
72,
088
2,09
72,
471
2,68
42,
464
2,28
61,
582
Not
e:**
* si
gnif
ican
t at 0
.01,
**
sign
ific
ant a
t 0.0
5, *
sig
nifi
cant
at 0
.1; a
ll th
e es
timat
ions
incl
ude
indi
cato
rs f
or m
issi
ng v
alue
s (n
ot s
how
n).
Sour
ce: O
wn
elab
orat
ion.
E A

REFERENCESBallarino, G., Bernardi, F., Requena, M. and Schadee, H. (2009): “Persistent Inequalities?
Expansion of Education and Class Inequality in Italy and Spain”, European Sociologi-cal Review, vol. 25, pp. 123-138.
Behrman, J.R. and Rosenzweig, M.R. (2002): “Does Increasing Women’s Schooling Raise theSchooling of the Next Generation?”, American Economic Review, vol. 92, pp. 323-334.
Belzil, C. and Leonardi, M. (2007): “Risk Aversion and Schooling Decisions”, IZA Dis-cussion Papers 2994, Institute for the Study of Labor (IZA).
Björklund, A. Donna Ginther, D. and Sundström, M. (2007): “Family structure and childoutcomes in the USA and Sweden”, Journal of Population Economics, Springer, vol.20, pp. 183-201.
Blanden, J. (2004): “Family Income and Educational Attainment: a Review of Approachesand Evidence for Britain”, Oxford Review of Economic Policy, vol. 20, pp. 245-263.
Blinder, A.S. (1973): “Wage discrimination: Reduced form and structural estimates”, Jour-nal of Human Resources, vol. 8, pp. 436-455.
Boarini, R. (2009): “Towards better Schools and more Equal Opportunities for Learning inItaly”, OECD Economics Department Working Papers, No. 727, OECD Publishing.
Bowles, S. and Gintis, H. (2002): “The Inheritance of Inequality”, Journal of Economic Pers -pectives, vol. 16, pp. 3-30.
Brunello, G. & Checchi, D. (2005): “School quality and family background in Italy”, Eco-nomics of Education Review, vol. 24, pp. 563-577.
Brunello, G. & Checchi, D. (2007): “Does school tracking affect equality of opportunity?New international evidence”, Economic Policy, vol. 22, pp. 781-861.
Bourguignon F., Ferreira F.H.G. and Menéndez M. (2007): “Inequality Of Opportunity InBrazil”, Review of Income and Wealth, vol. 53, pp. 585-618.
Cameron S. and Heckman J. (1998): “Life cycle schooling and dynamic selection bias:models and evidence for five cohorts of American males”, Journal of Political Econo-my, vol. 106, pp. 262-333.
Cameron S. and Heckman J. (2001): “The Dynamics of Educational Attainment for Black,Hispanic and White Males”, Journal of Political Economy, vol. 109, pp. 455-499.
Cappellari, L. and Lucifora, C. (2009): “The ‘Bologna Process’ and college enrolment de-cisions”, Labour Economics, vol. 16, pp. 638-647.
Carneiro, P. (2008): “Equality of Opportunity and Educational Achievement in Portugal”,Portuguese Economic Journal, vol. 7, pp. 17-41.
Casquel, E. and Uriel, E. (2009): “The determinants of post-compulsory education inSpain”, Applied Economics Letters, vol. 16: 399-404.
Checchi, D. (2003) “The Italian educational system: family background and social stratifi-cation”, Departemental Working Papers 2003-01, Department of Economics Universityof Milan, Italy.
Checchi, D., Fiorio, C.V. and Leonardi, M. (2006): “Sessanta anni di istruzione in Italia”,Rivista di Politica Economica, vol. 96, pp. 285-318.
Checchi, D., Fiorio, C.V. & Leonardi, M. (2008): “Intergenerational Persistence in Educa-tional Attainment in Italy”, IZA Discussion Papers 3622, Institute for the Study ofLabor (IZA).
Checchi D. & Flabbi, L. (2007): “Intergenerational Mobility and Schooling Decisions inGermany and Italy: The Impact of Secondary School Tracks”, IZA Discussion Papers2876, Institute for the Study of Labor (IZA).
Chevalier, A. and Lanot, G. (2002): “The Relative Effect of Family Characteristics and Finan-cial Situation on Educational Achievement”, Education Economics, vol. 10, pp. 165-181.
Revista de Economía Aplicada
144

Cunha, F., Heckman, J. and Lochner, L. (2006): “Interpreting the Evidence on Life CycleSkill Formation”, Handbook of the Economics of Education, Elsevier.
Cunha, F. and Heckman, J. (2007): “The Technology of Skill Formation”, American Eco-nomic Review, vol. 97, pp. 31-47.
Ermisch, J. and Francesconi, M. (2001a): “Family Matters: Impacts of Family Backgroundon Educational Attainments”, Economica, vol. 68, pp. 137-56.
Ermisch, J. and Francesconi, M. (2001b): “Family structure and children’s achievements”,Journal of Population Economics, vol. 14, pp. 249-270.
Fort, M. (2006): “Educational reform in Europe: a toolbox for empirical research”, Unpub-lished working paper (available at http://www2.dse.unibo.it/fort/files/papers/fort_re-forms.pdf).
Franzini, M. and Raitano, M. (2009): “Persistent inequality in Europe: the role of family eco-nomic conditions”, International Review of Applied Economics, vol. 23, pp. 345-366.
Fuentes, A. (2009): “Raising Education Outcomes in Spain”, OECD Economics Depart-ment Working Papers, No. 666, OECD Publishing.
Ganzeboom, H.B.G., de Graaf, P.M. and Treiman, D.J. (1992): “A standard internationalsocio-economic index of occupational status”, Social Science Research, vol. 21, pp. 1-56.
Gennatian, L.A. (2005): “One or Two Parents? Half or Step Siblings? The Effect of FamilyStructure on Young Child’s Achievements”, Journal of Population Economics, vol. 18,pp. 415-436.
Giuliano, P. (2008): “Culture and the Family: An Application to Educational Choices inItaly”, Rivista di Politica Economica, vol. 98, pp. 3-38.
Hanushek, E. and Wössmann, L. (2006): “Does Educational Tracking Affect Performanceand Inequality? Differences-in-Differences Evidence Across Countries”, EconomicJournal, vol. 116: C63-C76.
Heineck, G. and Riphahn, R. (2009): “Intergenerational Transmission of Educational At-tainment in Germany - The Last Five Decades”, Journal of Economics and Statistics(Jahrbuecher fuer Nationaloekonomie und Statistik), Justus-Liebig University Giessen,Department of Statistics and Economics, vol. 229, pp. 36-60.
Lauer, C. (2003): “Family background, cohort and education: a French-German compari-son based on a multivariate ordered probit model of educational attainment”, LabourEconomics, vol. 10, pp. 231-251.
Oaxaca, R. (1973): “Male-female wage differentials in urban labor markets”, InternationalEconomic Review, vol. 14, pp. 673-709.
OECD Economic Survey; (2008) Spain; (2009) Italy.Petrongolo, B. and San Segundo, M.J. (2002): “Staying-on at school at 16: the impact of
labour market conditions in Spain”, Economics of Education Review, vol. 21, pp. 353-365.Plug E. and Vijverberg, W. (2003): “Schooling, Family Background, and Adoption: Is It
Na ture or Is It Nurture?”, Journal of Political Economy, vol. 111, pp. 611-641.Rahona-López, M. (2009): “Equality of Opportunity in Spanish Higher Education”, High-
er Education, vol. 57, pp. 681-702.Sacerdote B. (2002): “The Nature and Nurture of Economic Outcomes”, American Eco-
nomic Review, Papers and Proceedings, vol. 92, pp. 344-348.Serlenga, L. & Peragine, V. (2008): “Higher education and equality of opportunity in Italy”,
Research in Economic Inequality, vol. 16, pp. 67-97.Triventi, M. & Trivellato, P. (2009): “Participation, performance and inequality in Italian
higher education in the 20th century”, Higher Education, vol. 58, pp. 285-306.
Fecha de recepción del original: mayo, 2010Versión final: marzo, 2011
Parental education and family characteristics: educational opportunities across cohorts in Italy and Spain
145

RESUMENUtilizando los datos de la encuesta EU-SILC del 2005, este artículo anali-za las disparidades en las oportunidades educativas en Italia y en España.El objetivo principal consiste en analizar las probabilidades predichas decompletar la educación secundaria post-obligatoria y la educación terciariapara individuos con un background familiar diferente, y los cambios en di-chas probabilidades entre las cohortes de nacimientos comprendidas entre1940 y 1980. Los resultados sugieren que las disparidades en las oportuni-dades de educación terciaria tienden a crecer con el tiempo para Italia. Encambio, en España las diferencias en oportunidades educativas muestranuna clara reducción a lo largo de las cohortes. Además, utilizando una téc-nica de descomposición muy intuitiva, este artículo demuestra que unaparte importante de las disparidades educativas entre individuos proceden-tes de un background educativo diferente está compuesta por diferenciasen la dotación de características familiares. Concretamente, parece que lospadres más educados son más capaces de dotar a sus hijos de una mejorcomposición de características familiares, hecho que explica una propor-ción significativa de las disparidades en oportunidades educativas.
Palabras clave: oportunidades educativas, background familiar, cohortesde nacimiento, Italia, España.
Clasificación JEL: I21, J12, J62.
Revista de Economía Aplicada
146