Parent and Family Involvement in Education: Results from ... · Parent and Family Involvement in...
61
U.S. DEPARTMENT OF EDUCATION Parent and Family Involvement in Education: Results from the National Household Education Surveys Program of 2016 First Look NCES 2017-102
Transcript of Parent and Family Involvement in Education: Results from ... · Parent and Family Involvement in...

U.S. DEPARTMENT OF EDUCATION
Parent and Family Involvement in Education: Results from the National Household Education Surveys Program of 2016First Look
NCES 2017-102


Parent and Family Involvement in Education: Results from the National Household Education Surveys Program of 2016 First Look
SEPTEMBER 2017
Meghan McQuiggan Mahi Megra American Institutes for Research
Sarah Grady Project Officer National Center for Education Statistics
NCES 2017-102 U.S. DEPARTMENT OF EDUCATION

U.S. Department of Education Betsy DeVos Secretary
Institute of Education Sciences Thomas W. Brock Commissioner for Education Research Delegated Duties of the Director
National Center for Education Statistics Peggy G. Carr Acting Commissioner
The National Center for Education Statistics (NCES) is the primary federal entity for collecting, analyzing, and reporting data related to education in the United States and other nations. It fulfills a congressional mandate to collect, collate, analyze, and report full and complete statistics on the condition of education in the United States; conduct and publish reports and specialized analyses of the meaning and significance of such statistics; assist state and local education agencies in improving their statistical systems; and review and report on education activities in foreign countries.
NCES activities are designed to address high-priority education data needs; provide consistent, reliable, complete, and accurate indicators of education status and trends; and report timely, useful, and high-quality data to the U.S. Department of Education, the Congress, the states, other education policymakers, practitioners, data users, and the general public. Unless specifically noted all information contained herein is in the public domain.
We strive to make our products available in a variety of formats and in language that is appropriate to a variety of audiences. You, as our customer, are the best judge of our success in communicating information effectively. If you have any comments or suggestions about this or any other NCES product or report, we would like to hear from you. Please direct your comments to
NCES, IES, U.S. Department of Education Potomac Center Plaza 550 12th Street, SW Washington, D.C. 20202
September 2017
The NCES Home Page address is http://nces.ed.gov. The NCES Publications and Products address is http://nces.ed.gov/pubsearch.
This report was prepared for the National Center for Education Statistics under Contract No. ED-IES-12-D-0002 with the American Institutes for Research. Mention of trade names, commercial products, or organizations does not imply endorsement by the U.S. Government.
Suggested Citation McQuiggan, M. and Megra, M. (2017). Parent and Family Involvement in Education: Results from the National Household Education Surveys Program of 2016 (NCES 2017-102). U.S. Department of Education. Washington, DC: National Center for Education Statistics. Retrieved [date] from http://nces.ed.gov/pubsearch/pubsinfo.asp?pubid=2017102.
Content Contact Sarah Grady (202) [email protected]

iii
Acknowledgments The authors would like to thank the thousands of parents who completed the National Household Education Survey questionnaires upon which this report is based.

This page is intentionally left blank.

v
Contents Acknowledgments ......................................................................................................................... iii
List of Tables ................................................................................................................................ vi
Introduction .................................................................................................................................... 1
Selected Findings ........................................................................................................................... 3
Estimate Tables .............................................................................................................................. 5
References .................................................................................................................................... 21
Appendix A. Technical Notes ...................................................................................................... 23
Appendix B. Glossary of Terms .................................................................................................. 29
Appendix C: Standard Error Tables ............................................................................................. 37

vi
List of Tables Table Page Table 1. Percentage of students in kindergarten through grade 12 whose parents reported
school-initiated communication practices, by method of communication and selected school, student, and family characteristics: 2015–16 ...................................6
Table 2. Percentage of students in kindergarten through grade 12 whose parents reported participation in school-related activities and mean number of meetings or activities, by selected school, student, and family characteristics: 2015–16 ..............8
Table 3. Percentage of students in kindergarten through grade 12 whose parents reported satisfaction with school characteristics and amount of homework, by selected school, student, and family characteristics: 2015–16 ...............................................10
Table 4. Percentage of students in kindergarten through grade 12 whose parents reported that students do homework outside of school, a place is set aside in the home for students to do homework, and an adult checks that homework is done, by selected school, student, and family characteristics: 2015–16 .................................12
Table 5. Percentage of students in grades 6 through 12 whose parents reported expectations of specific educational attainment levels, by selected school, student, and family characteristics: 2015–16 ...........................................................14
Table 6. Percentage of students in kindergarten through grade 12 whose parents reported participation in various activities, by selected school, student, and family characteristics: 2015–16 ...........................................................................................16
Table 7. Percentage distribution of homeschooled students ages 5 through 17 with a grade equivalent of kindergarten through grade 12 and homeschooling rate, by selected student and family characteristics: 2015–16 .........................................18
Table 8. Percentage of school-age children who were homeschooled, ages 5 through 17 with a grade equivalent of kindergarten through grade 12, by reasons parents gave as important and most important for homeschooling: 2015–16 ......................19
Exhibit Exhibit B-1. Poverty definition in Parent and Family Involvement in Education analyses,
by household size: 2016 ..........................................................................................32
Appendix Tables Table C-1. Standard errors for table 1: Percentage of students in kindergarten through
grade 12 whose parents reported school-initiated communication practices, by method of communication and selected school, student, and family characteristics: 2015–16 ...........................................................................................38
vii
Table Page Table C-2. Standard errors for table 2: Percentage of students in kindergarten through
grade 12 whose parents reported participation in school-related activities and mean number of meetings or activities, by selected school, student, and family characteristics: 2015–16 ...........................................................................................40
Table C-3. Standard errors for table 3: Percentage of students in kindergarten through grade 12 whose parents reported satisfaction with school characteristics and amount of homework, by selected school, student, and family characteristics: 2015–16 ....................................................................................................................42
Table C-4. Standard errors for table 4: Percentage of students in kindergarten through grade 12 whose parents reported that students do homework outside of school, a place is set aside in the home for students to do homework, and an adult checks that homework is done, by selected school, student, and family characteristics: 2015–16 ..........................................................................................44
Table C-5. Standard errors for table 5: Percentage of students in grades 6 through 12 whose parents reported expectations of specific educational attainment levels, by selected school, student, and family characteristics: 2015–16 ............................46
Table C-6. Standard errors for table 6: Percentage of students in kindergarten through grade 12 whose parents reported participation in various activities, by selected school, student, and family characteristics: 2015–16 ...............................................48
Table C-7. Standard errors for table 7: Percentage distribution of homeschooled students ages 5 through 17 with a grade equivalent of kindergarten through grade 12 and homeschooling rate, by selected student and family characteristics: 2015–16 .........50
Table C-8. Standard errors for table 8: Percentage of school-age children who were homeschooled, ages 5 through 17 with a grade equivalent of kindergarten through grade 12, by reasons parents gave as important and most important for homeschooling: 2015–16 ....................................................................................51

This page is intentionally left blank.

1
Introduction This report presents data on students in the United States attending kindergarten through grade 12. The focus of the report is on parent and family involvement in the students’ education duringthe 2015–16 school year, as reported by the students’ parents. It includes the percentage ofstudents who participated in selected family activities. This report also presents characteristics onhomeschooling, including homeschooling rates and reasons for homeschooling. Demographicinformation about students and families is presented, including students’ poverty status andparents’ education and language spoken at home, as well as school characteristics, such as schoolsize and school type.
The data for this report come from the Parent and Family Involvement in Education (PFI) Survey, administered as part of the 2016 National Household Education Surveys Program (NHES:2016). The PFI survey collects data about students who are enrolled in kindergarten through grade 12 or are homeschooled for equivalent grades and asks questions about various aspects of parent involvement in education, such as help with homework, family activities, and parent involvement at school, such as attending a school or class event. For homeschooled students, the survey asks questions related to students’ homeschooling experiences, the sources of the curriculum, and the reasons for homeschooling. Parents are the respondents.
The NHES:2016 used a nationally representative address-based sample covering the 50 states and the District of Columbia. The survey was conducted by the U.S. Census Bureau from January through August 2016. The 2016 administration of NHES included a screener survey and three topical surveys: the Early Childhood Program Participation Survey, the Adult Training and Education Survey, and the PFI. The screener survey asked for an enumeration of household members and was used to select an eligible household member for a topical survey. All sampled households received initial contact by mail. Although the majority of respondents completed paper questionnaires, a small sample of cases was part of a web experiment with mailed invitations to complete the survey online. For more information about the 2016 web experiment, including methodology, please reference the forthcoming Data File User’s Manual (McPhee, Jackson, Bielick, Masterton, Battle, McQuiggan, Payri, Cox, and Medway, forthcoming).
The NHES:2012, which was the last time the NHES was administered, also used an address-based sample; however, there was no option to complete the survey online. Prior to 2012, the NHES used random digit dial samples of landline telephones. Due to changes in the survey mode over the last few administrations, readers should use caution when comparing estimates with prior NHES administrations.
PFI questionnaires were completed by a parent or guardian who knew about the sampled child. When weighted, the PFI data are nationally representative of students enrolled in kindergarten through grade 12, including children enrolled in private schools, enrolled in public schools, and homeschooled. The total number of completed PFI questionnaires was 14,075 (13,523 enrolled and 552 homeschooled children), representing a population of 53.2 million students either homeschooled or enrolled in a public or private school in 2015–16.

2
The screener questionnaire had a weighted response rate of 66.4 percent. The weighted unit response rate for the PFI is 74.3 percent, and the overall response rate is 49.3 percent. An analysis of bias in the NHES:2016 data, described further in appendix A, detected some measurable differences between respondents and the original sample, which were partially corrected by the use of nonresponse-adjusted weights. The level of potential bias detected is considered to be low. Additional details about the survey methodology, response rates, and data reliability are provided in appendix A.
The results presented in this report are weighted. All statements of comparison have been tested for statistical significance using two-tailed t-tests and are significant at the 95 percent confidence level. No adjustments were made for multiple comparisons. Some estimates that appear different may not be measurably different in a statistical sense due to sampling error. Readers are directed to the Statistical Tests section of appendix A for information about how to compare estimates in the tables.
Tables 1 through 6 in this report present data by school, student, and family characteristics and primarily relate to activities associated with schools. Therefore, students who were homeschooled are not included in these tables. Tables 7 and 8 specifically examine characteristics of homeschoolers and homeschooling rates as well as reasons for homeschooling. Students enrolled in public or private schools for more than 25 hours per week are not included in homeschooling tables. Additionally, homeschooling tables are restricted to students ages 5–17, whereas students in grades K–12 could be younger than 5 or older than 17.
This First Look report presents selected descriptive information. Readers are cautioned not to draw causal inferences based on the results presented. It is important to note that many of the variables examined in this report may be related to one another, and complex interactions and relationships among the variables have not been explored. The variables examined here are just a few of the variables that can be examined in these data; they were selected to demonstrate the range of information available from the study. The release of this report is intended to encourage more in-depth analysis of the data using more sophisticated statistical methods.

3
Selected Findings
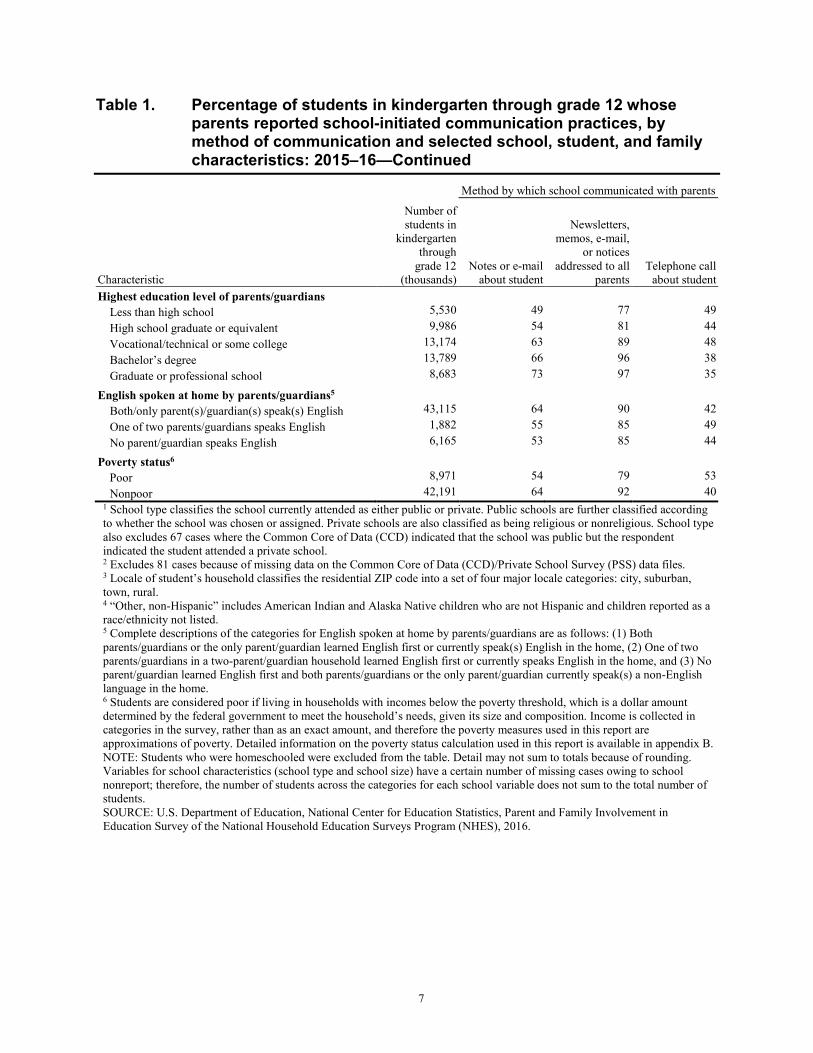
• In the 2015-16 school year, 89 percent of students in kindergarten through grade 12 hadparents who reported receiving newsletters, memos, e-mail, or notices addressed to allparents from their child’s school. Sixty-two percent of students had parents who reportedreceiving notes or e-mail from the school specifically about their child, and 42 percent ofstudents had parents who reported that the school had contacted them by telephone(table 1).
• The most common school-related activity that parents reported participating in during theschool year was attending a general school or a parent-teacher organization or associationmeeting (89 percent). Seventy-eight percent of students had parents who reportedattending a regularly scheduled parent-teacher conference; 79 percent had parents whoattended a school or class event; 43 percent had parents who volunteered or served ona school committee; 59 percent had parents who participated in school fundraising; and33 percent had parents who met with a guidance counselor. Parents reported attending anaverage of 7.5 meetings or activities at their children’s school during the 2015-16 schoolyear (table 2).
• Eighty-three percent of students in kindergarten through grade 2 had parents who felt thatthe amount of homework their child is assigned is “about right.” This percentage wassignificantly higher than the percentage for students in grades 3 through 5 (75 percent),students in grades 6 through 8 (73 percent), and students in grades 9 through 12(70 percent) (table 3).
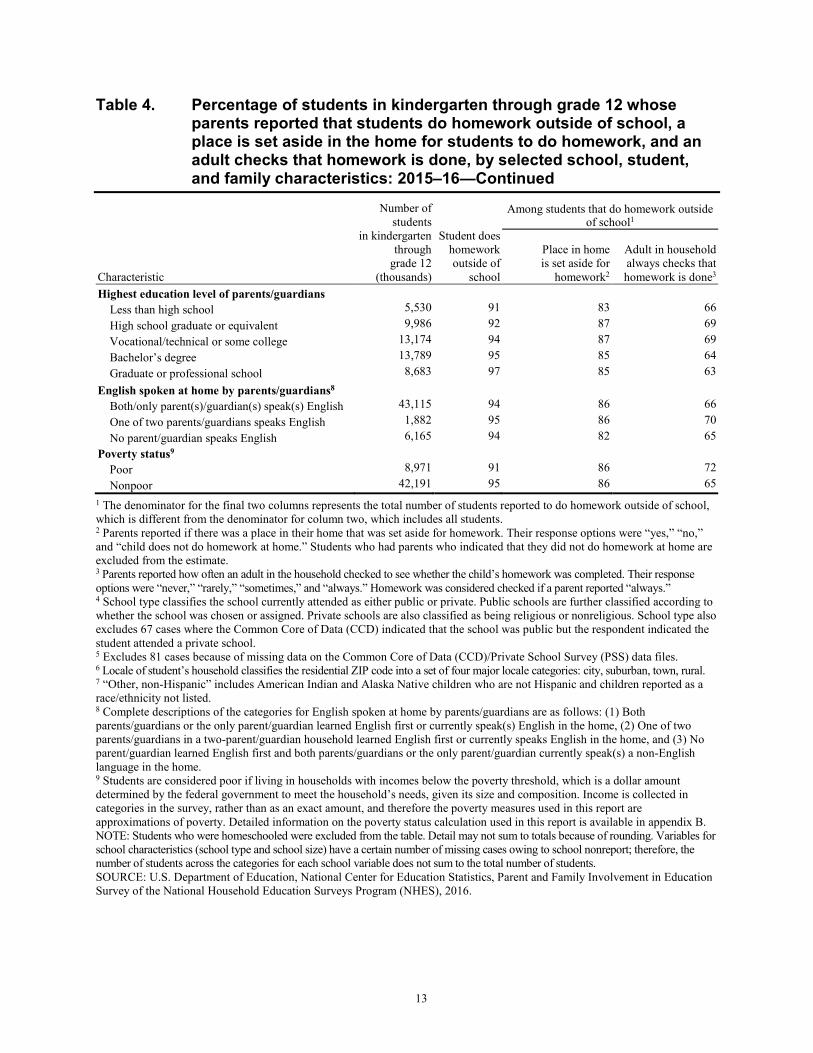
• According to their parents, 94 percent of students in kindergarten through grade 12 didhomework outside of school. Among those students who did homework outside ofschool, 86 percent had a place set aside for homework in their home and 66 percenthad an adult in the household who checked that their homework was done (table 4).
• One percent of students in grades 6 through 12 had parents who said that they did notexpect their child to complete high school; 9 percent were not expected to pursueeducation after high school completion; 8 percent were expected to attend vocational ortechnical school after high school; 15 percent were expected to attend 2 or more yearsof college; 29 percent were expected to earn a bachelor’s degree; and 39 percent wereexpected to earn a graduate or professional degree (table 5).
• According to parents, a higher percentage of students attended a community, religious,or ethnic event (54 percent) in the past month than visited a library (34 percent); visiteda bookstore (34 percent); went to a play, concert, or other live show (34 percent); visitedan art gallery, a museum, or a historical site (25 percent); visited a zoo or an aquarium(24 percent); or attended an athletic or sporting event (42 percent) (table 6).
• Overall, about 3 percent of students ages 5 through 17 were reported as beinghomeschooled, representing 1.7 million homeschooled students in 2016. Thehomeschooling rate among students from rural areas (4 percent) was higher than thehomeschooling rate for students in cities (3 percent) and suburban areas (3 percent).Although the homeschooling rate for students in towns was also around 4 percent, itwas not significantly different from students in cities, suburban, or rural areas (table 7).

4
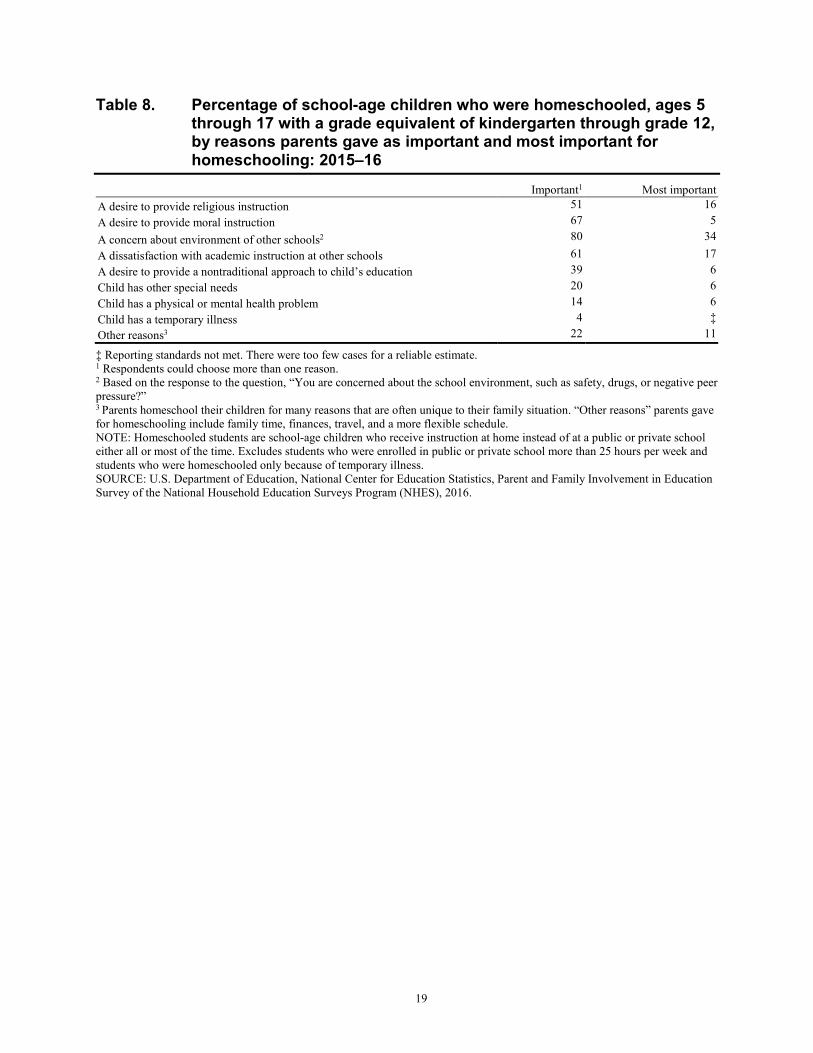
• When asked to select the reasons parents decided to homeschool their child, the highestpercentage of homeschooled students had parents who said that a concern about theenvironment of other schools, such as safety, drugs, or negative peer pressure was onereason to homeschool (80 percent). The highest percentage of students’ parents reportedthat among all reasons, a concern about the environment of other schools was the mostimportant reason for homeschooling (34 percent). Seventeen percent of homeschooledstudents had parents who reported dissatisfaction with academic instruction at otherschools as the most important reason for homeschooling, while 16 percent reported adesire to provide religious instruction as the most important reason for homeschooling(table 8).

5
Estimate Tables

6
Table 1. Percentage of students in kindergarten through grade 12 whose parents reported school-initiated communication practices, by method of communication and selected school, student, and family characteristics: 2015–16
Characteristic
Number of students in
kindergarten through
grade 12 (thousands)
Method by which school communicated with parents
Notes or e-mail about student
Newsletters, memos, e-mail,
or notices addressed to all
parents Telephone call
about student Total 51,162 62 89 42
School type1 Public, assigned 38,730 61 88 42 Public, chosen 7,282 64 90 45 Private, religious 3,686 69 96 37 Private, nonreligious 1,043 80 97 42
School size2 Under 300 5,800 67 90 46 300–599 16,953 65 91 43 600–999 15,126 62 89 42 1,000 or more 12,990 57 87 41
Locale of student’s household3 City 16,278 59 88 46 Suburban 22,615 65 92 40 Town 4,042 61 86 43 Rural 8,227 61 86 42 Student’s sex Male 26,495 63 89 46 Female 24,667 61 90 39 Student’s race/ethnicity White, non-Hispanic 25,703 64 91 38 Black, non-Hispanic 7,139 64 87 57 Hispanic 12,281 59 86 46 Asian or Pacific Islander, non-Hispanic 3,199 53 87 30
Other, non-Hispanic4 2,840 64 92 43
Student’s grade level Kindergarten–2nd grade 13,090 67 93 42 3rd–5th grade 12,040 65 92 44 6th–8th grade 11,602 61 87 43 9th–12th grade 14,430 56 85 41
See notes at end of table.
7
Table 1. Percentage of students in kindergarten through grade 12 whose parents reported school-initiated communication practices, by method of communication and selected school, student, and family characteristics: 2015–16—Continued
Characteristic
Number of students in
kindergarten through
grade 12 (thousands)
Method by which school communicated with parents
Notes or e-mail about student
Newsletters, memos, e-mail,
or notices addressed to all
parents Telephone call
about student Highest education level of parents/guardians Less than high school 5,530 49 77 49 High school graduate or equivalent 9,986 54 81 44 Vocational/technical or some college 13,174 63 89 48 Bachelor’s degree 13,789 66 96 38 Graduate or professional school 8,683 73 97 35
English spoken at home by parents/guardians5 Both/only parent(s)/guardian(s) speak(s) English 43,115 64 90 42 One of two parents/guardians speaks English 1,882 55 85 49 No parent/guardian speaks English 6,165 53 85 44
Poverty status6 Poor 8,971 54 79 53 Nonpoor 42,191 64 92 40
1 School type classifies the school currently attended as either public or private. Public schools are further classified according to whether the school was chosen or assigned. Private schools are also classified as being religious or nonreligious. School type also excludes 67 cases where the Common Core of Data (CCD) indicated that the school was public but the respondent indicated the student attended a private school. 2 Excludes 81 cases because of missing data on the Common Core of Data (CCD)/Private School Survey (PSS) data files. 3 Locale of student’s household classifies the residential ZIP code into a set of four major locale categories: city, suburban, town, rural. 4 “Other, non-Hispanic” includes American Indian and Alaska Native children who are not Hispanic and children reported as a race/ethnicity not listed. 5 Complete descriptions of the categories for English spoken at home by parents/guardians are as follows: (1) Both parents/guardians or the only parent/guardian learned English first or currently speak(s) English in the home, (2) One of two parents/guardians in a two-parent/guardian household learned English first or currently speaks English in the home, and (3) No parent/guardian learned English first and both parents/guardians or the only parent/guardian currently speak(s) a non-English language in the home. 6 Students are considered poor if living in households with incomes below the poverty threshold, which is a dollar amount determined by the federal government to meet the household’s needs, given its size and composition. Income is collected in categories in the survey, rather than as an exact amount, and therefore the poverty measures used in this report are approximations of poverty. Detailed information on the poverty status calculation used in this report is available in appendix B. NOTE: Students who were homeschooled were excluded from the table. Detail may not sum to totals because of rounding. Variables for school characteristics (school type and school size) have a certain number of missing cases owing to school nonreport; therefore, the number of students across the categories for each school variable does not sum to the total number of students. SOURCE: U.S. Department of Education, National Center for Education Statistics, Parent and Family Involvement in Education Survey of the National Household Education Surveys Program (NHES), 2016.

8
Table 2. Percentage of students in kindergarten through grade 12 whose parents reported participation in school-related activities and mean number of meetings or activities, by selected school, student, and family characteristics: 2015–16
Characteristic
Number of students in
kindergarten through
grade 12 (thousands)
Participation in school activities by parent or other household member
Attended a general
school or PTO/PTA meeting1
Attended regularly
scheduled parent-teacher
conference
Attended a school or
class event
Volunteered or served on
school committee
Participated in school
fundraising
Met with a guidance
counselor
Mean number of
meetings or activities at
child's school
Total 51,162 89 78 79 43 59 33 7.5 School type2 Public, assigned 38,730 88 76 78 39 57 33 7.0 Public, chosen 7,282 90 79 78 46 58 33 7.7 Private, religious 3,686 92 85 92 73 80 38 11.6 Private, nonreligious 1,043 97 92 90 67 71 39 10.6 School size3 Under 300 5,800 88 87 85 54 68 33 8.2 300–599 16,953 91 85 82 50 64 30 7.8 600–999 15,126 91 81 78 43 60 29 7.5 1,000 or more 12,990 83 59 74 31 49 42 6.9 Locale of student’s household4 City 16,278 86 79 75 42 53 34 7.4 Suburban 22,615 90 78 81 46 62 34 7.4 Town 4,042 87 77 76 35 57 32 7.3 Rural 8,227 90 76 84 44 67 30 8.3 Student’s sex Male 26,495 87 79 77 42 58 35 7.5 Female 24,667 90 77 82 45 61 31 7.5 Student’s race/ethnicity White, non-Hispanic 25,703 91 79 86 49 69 32 8.6 Black, non-Hispanic 7,139 87 79 72 34 48 43 6.1 Hispanic 12,281 87 75 71 36 48 33 6.4 Asian or Pacific Islander, non-Hispanic 3,199 80 76 71 42 51 26 5.2 Other, non-Hispanic5 2,840 91 79 83 49 60 33 8.3 Student’s grade level Kindergarten–2nd grade 13,090 91 92 85 56 67 23 7.5 3rd–5th grade 12,040 92 90 84 51 65 27 7.6 6th–8th grade 11,602 90 73 76 35 55 34 6.9 9th–12th grade 14,430 82 58 73 32 51 48 8.0
See notes at end of table.

9
Table 2. Percentage of students in kindergarten through grade 12 whose parents reported participation in school-related activities and mean number of meetings or activities, by selected school, student, and family characteristics: 2015–16—Continued
Characteristic
Number of students in
kindergarten through
grade 12 (thousands)
Participation in school activities by parent or other household member
Attended a general
school or PTO/PTA meeting1
Attended regularly
scheduled parent-teacher
conference
Attended a school or
class event
Volunteered or served on
school committee
Participated in school
fundraising
Met with a guidance
counselor
Mean number of
meetings or activities at
child's school
Highest education level of parents/guardians Less than high school 5,530 76 70 54 25 29 35 5.0 High school graduate or equivalent 9,986 82 73 69 27 49 31 5.5 Vocational/technical or some college 13,174 90 76 80 39 60 35 7.0 Bachelor’s degree 13,789 93 82 87 54 70 32 9.1 Graduate or professional school 8,683 95 84 93 65 73 34 9.9 English spoken at home by parents/guardians6 Both/only parent(s)/guardian(s) speak(s) English 43,115 90 79 82 46 64 34 7.9 One of two parents/guardians speaks English 1,882 86 74 71 38 47 33 6.8 No parent/guardian speaks English 6,165 81 68 62 25 33 30 4.9 Poverty status7 Poor 8,971 81 75 62 27 37 37 5.6 Nonpoor 42,191 90 78 83 47 64 32 7.9 1 Parent Teacher Organization (PTO) or Parent Teacher Association (PTA) meeting. 2 School type classifies the school currently attended as either public or private. Public schools are further classified according to whether the school was chosen or assigned. Private schools are also classified as being religious or nonreligious. School type also excludes 67 cases where the Common Core of Data (CCD) indicated that the school was public but the respondent indicated the student attended a private school. 3 Excludes 81 cases because of missing data on the Common Core of Data (CCD)/Private School Survey (PSS) data files. 4 Locale of student’s household classifies the residential ZIP code into a set of four major locale categories: city, suburban, town, rural. 5 “Other, non-Hispanic” includes American Indian and Alaska Native children who are not Hispanic and children reported as a race/ethnicity not listed. 6 Complete descriptions of the categories for English spoken at home by parents/guardians are as follows: (1) Both parents/guardians or the only parent/guardian learned English first or currently speak(s) English in the home, (2) One of two parents/guardians in a two-parent/guardian household learned English first or currently speaks English in the home, and (3) No parent/guardian learned English first and both parents/guardians or the only parent/guardian currently speak(s) a non-English language in the home. 7 Students are considered poor if living in households with incomes below the poverty threshold, which is a dollar amount determined by the federal government to meet the household’s needs, given its size and composition. Income is collected in categories in the survey, rather than as an exact amount, and therefore the poverty measures used in this report are approximations of poverty. Detailed information on the poverty status calculation used in this report is available in appendix B. NOTE: Students who were homeschooled were excluded from the table. Detail may not sum to totals because of rounding. Variables for school characteristics (school type and school size) have a certain number of missing cases owing to school nonreport; therefore, the number of students across the categories for each school variable does not sum to the total number of students. SOURCE: U.S. Department of Education, National Center for Education Statistics, Parent and Family Involvement in Education Survey of the National Household Education Surveys Program (NHES), 2016.

10
Table 3. Percentage of students in kindergarten through grade 12 whose parents reported satisfaction with school characteristics and amount of homework, by selected school, student, and family characteristics: 2015–16
Characteristic
Number of students in kindergarten
through grade 12 (thousands)
Parent reports of being “very satisfied” Amount of homework assigned is
“about right”1 With
the school
With teachers student had
this year
With academic standards of
the school
With order and discipline
at the school
With the way school staff interacts with parents
Total 51,162 60 61 59 59 54 75 School type2 Public, assigned 38,730 57 59 56 56 51 75 Public, chosen 7,282 65 62 65 62 56 75 Private, religious 3,686 78 74 79 81 73 77 Private, nonreligious 1,043 84 75 81 76 75 76 School size3 Under 300 5,800 66 67 64 65 63 78 300–599 16,953 63 66 61 62 59 77 600–999 15,126 60 64 60 60 56 75 1,000 or more 12,990 55 49 55 54 42 71 Locale of student’s household4 City 16,278 59 60 58 58 55 75 Suburban 22,615 63 62 62 62 55 74 Town 4,042 56 60 55 55 50 78 Rural 8,227 58 60 56 57 53 76 Student’s sex Male 26,495 60 60 58 60 54 76 Female 24,667 61 61 60 59 54 75 Student’s race/ethnicity White, non-Hispanic 25,703 65 64 62 62 56 75 Black, non-Hispanic 7,139 48 52 54 52 51 78 Hispanic 12,281 60 61 58 59 53 76 Asian or Pacific Islander, non-Hispanic 3,199 60 60 57 60 55 78 Other, non-Hispanic5 2,840 55 58 56 56 51 70 Student’s grade level Kindergarten–2nd grade 13,090 69 75 67 68 67 83 3rd–5th grade 12,040 65 68 62 65 62 75 6th–8th grade 11,602 54 55 55 53 47 73 9th–12th grade 14,430 54 47 54 52 43 70
See notes at end of table.

11
Table 3. Percentage of students in kindergarten through grade 12 whose parents reported satisfaction with school characteristics and amount of homework, by selected school, student, and family characteristics: 2015–16—Continued
Characteristic
Number of students in kindergarten
through grade 12 (thousands)
Parent reports of being “very satisfied” Amount of homework assigned is
“about right”1 With
the school
With teachers student had
this year
With academic standards of
the school
With order and discipline
at the school
With the way school staff interacts with parents
Highest education level of parents/guardians Less than high school 5,530 59 61 54 56 53 78 High school graduate or equivalent 9,986 53 58 54 54 50 78 Vocational/technical or some college 13,174 57 58 56 56 52 75 Bachelor’s degree 13,789 65 64 64 63 57 74 Graduate or professional school 8,683 68 64 66 68 60 73 English spoken at home by parents/guardians6 Both/only parent(s)/guardian(s) speak(s) English 43,115 60 60 59 59 54 75 One of two parents/guardians speaks English 1,882 61 60 58 65 61 75 No parent/guardian speaks English 6,165 62 66 58 62 54 78 Poverty status7 Poor 8,971 53 61 54 54 52 79 Nonpoor 42,191 62 61 60 61 55 75 1 Response options were “the amount is about right,” “it’s too much,” or “it’s too little.” This estimate pertains only to the students whose parents reported that their children did homework outside of school. 2 School type classifies the school currently attended as either public or private. Public schools are further classified according to whether the school was chosen or assigned. Private schools are also classified as being religious or nonreligious. School type also excludes 67 cases where the Common Core of Data (CCD) indicated that the school was public but the respondent indicated the student attended a private school. 3 Excludes 81 cases because of missing data on the Common Core of Data (CCD)/Private School Survey (PSS) data files. 4 Locale of student’s household classifies the residential ZIP code into a set of four major locale categories: city, suburban, town, rural. 5 “Other, non-Hispanic” includes American Indian and Alaska Native children who are not Hispanic and children reported as a race/ethnicity not listed. 6 Complete descriptions of the categories for English spoken at home by parents/guardians are as follows: (1) Both parents/guardians or the only parent/guardian learned English first or currently speak(s) English in the home, (2) One of two parents/guardians in a two-parent/guardian household learned English first or currently speaks English in the home, and (3) No parent/guardian learned English first and both parents/guardians or the only parent/guardian currently speak(s) a non-English language in the home. 7 Students are considered poor if living in households with incomes below the poverty threshold, which is a dollar amount determined by the federal government to meet the household’s needs, given its size and composition. Income is collected in categories in the survey, rather than as an exact amount, and therefore the poverty measures used in this report are approximations of poverty. Detailed information on the poverty status calculation used in this report is available in appendix B. NOTE: Students who were homeschooled were excluded from the table. Detail may not sum to totals because of rounding. Variables for school characteristics (school type and school size) have a certain number of missing cases owing to school nonreport; therefore, the number of students across the categories for each school variable does not sum to the total number of students. SOURCE: U.S. Department of Education, National Center for Education Statistics, Parent and Family Involvement in Education Survey of the National Household Education Surveys Program (NHES), 2016.

12
Table 4. Percentage of students in kindergarten through grade 12 whose parents reported that students do homework outside of school, a place is set aside in the home for students to do homework, and an adult checks that homework is done, by selected school, student, and family characteristics: 2015–16
Characteristic
Number of students
in kindergarten through
grade 12 (thousands)
Student does homework outside of
school
Among students that do homework outside of school1
Place in home is set aside for
homework2
Adult in household always checks that homework is done3
Total 51,162 94 86 66
School type4 Public, assigned 38,730 94 86 66 Public, chosen 7,282 94 86 66 Private, religious 3,686 95 86 64 Private, nonreligious 1,043 88 84 59
School size5 Under 300 5,800 89 85 74 300–599 16,953 94 85 76 600–999 15,126 95 86 71 1,000 or more 12,990 94 86 44 Locale of student’s household6 City 16,278 93 87 68 Suburban 22,615 95 86 65 Town 4,042 91 82 66 Rural 8,227 93 84 66 Student’s sex Male 26,495 93 86 68 Female 24,667 95 85 64 Student’s race/ethnicity White, non-Hispanic 25,703 94 85 64 Black, non-Hispanic 7,139 93 88 71 Hispanic 12,281 94 86 70 Asian or Pacific Islander, non-Hispanic 3,199 96 87 58 Other, non-Hispanic7 2,840 92 87 66 Student’s grade level Kindergarten–2nd grade 13,090 93 85 93 3rd–5th grade 12,040 97 87 82 6th–8th grade 11,602 95 86 56 9th–12th grade 14,430 91 84 36
See notes at end of table
13
Table 4. Percentage of students in kindergarten through grade 12 whose parents reported that students do homework outside of school, a place is set aside in the home for students to do homework, and an adult checks that homework is done, by selected school, student, and family characteristics: 2015–16—Continued
Characteristic
Number of students
in kindergarten through
grade 12 (thousands)
Student does homework outside of
school
Among students that do homework outside of school1
Place in home is set aside for
homework2
Adult in household always checks that homework is done3
Highest education level of parents/guardians Less than high school 5,530 91 83 66 High school graduate or equivalent 9,986 92 87 69 Vocational/technical or some college 13,174 94 87 69 Bachelor’s degree 13,789 95 85 64 Graduate or professional school 8,683 97 85 63 English spoken at home by parents/guardians8 Both/only parent(s)/guardian(s) speak(s) English 43,115 94 86 66 One of two parents/guardians speaks English 1,882 95 86 70 No parent/guardian speaks English 6,165 94 82 65 Poverty status9 Poor 8,971 91 86 72 Nonpoor 42,191 95 86 65 1 The denominator for the final two columns represents the total number of students reported to do homework outside of school, which is different from the denominator for column two, which includes all students. 2 Parents reported if there was a place in their home that was set aside for homework. Their response options were “yes,” “no,” and “child does not do homework at home.” Students who had parents who indicated that they did not do homework at home are excluded from the estimate. 3 Parents reported how often an adult in the household checked to see whether the child’s homework was completed. Their response options were “never,” “rarely,” “sometimes,” and “always.” Homework was considered checked if a parent reported “always.” 4 School type classifies the school currently attended as either public or private. Public schools are further classified according to whether the school was chosen or assigned. Private schools are also classified as being religious or nonreligious. School type also excludes 67 cases where the Common Core of Data (CCD) indicated that the school was public but the respondent indicated the student attended a private school. 5 Excludes 81 cases because of missing data on the Common Core of Data (CCD)/Private School Survey (PSS) data files. 6 Locale of student’s household classifies the residential ZIP code into a set of four major locale categories: city, suburban, town, rural. 7 “Other, non-Hispanic” includes American Indian and Alaska Native children who are not Hispanic and children reported as a race/ethnicity not listed. 8 Complete descriptions of the categories for English spoken at home by parents/guardians are as follows: (1) Both parents/guardians or the only parent/guardian learned English first or currently speak(s) English in the home, (2) One of two parents/guardians in a two-parent/guardian household learned English first or currently speaks English in the home, and (3) No parent/guardian learned English first and both parents/guardians or the only parent/guardian currently speak(s) a non-English language in the home. 9 Students are considered poor if living in households with incomes below the poverty threshold, which is a dollar amount determined by the federal government to meet the household’s needs, given its size and composition. Income is collected in categories in the survey, rather than as an exact amount, and therefore the poverty measures used in this report are approximations of poverty. Detailed information on the poverty status calculation used in this report is available in appendix B. NOTE: Students who were homeschooled were excluded from the table. Detail may not sum to totals because of rounding. Variables for school characteristics (school type and school size) have a certain number of missing cases owing to school nonreport; therefore, the number of students across the categories for each school variable does not sum to the total number of students. SOURCE: U.S. Department of Education, National Center for Education Statistics, Parent and Family Involvement in Education Survey of the National Household Education Surveys Program (NHES), 2016.

14
Table 5. Percentage of students in grades 6 through 12 whose parents reported expectations of specific educational attainment levels, by selected school, student, and family characteristics: 2015–16
Characteristic
Number of students in
grades 6 through 12
(thousands)
Parent expects student to
Receive less than a high school
diploma
Graduate from high
school
Attend vocational or technical school
after high school
Attend 2 or more years of college
Earn a bachelor’s
degree
Earn a graduate or
professional degree
Total 26,032 1 9 8 15 29 39 School type1 Public, assigned 19,670 1 9 8 16 29 36 Public, chosen 3,749 1 ! 8 7 12 27 45 Private, religious 1,935 ‡ 2 ! 3 9 34 51 Private, nonreligious 489 ‡ ‡ ‡ 3 ! 36 53 School size2 Under 300 2,238 2 ! 12 10 18 26 33 300–599 5,364 1 ! 12 9 16 25 37 600–999 6,874 1 10 7 14 29 39 1,000 or more 11,394 1 6 7 14 31 42 Locale of student’s household3 City 7,882 2 9 6 13 29 41 Suburban 11,789 1 7 6 13 30 43 Town 2,029 ‡ 10 11 24 22 32 Rural 4,333 1 13 13 18 29 26 Student’s sex Male 13,539 1 10 10 15 29 34 Female 12,494 1 8 5 15 28 44 Student’s race/ethnicity White, non-Hispanic 13,483 1 9 9 16 32 33 Black, non-Hispanic 3,657 1 14 9 14 18 43 Hispanic 6,075 1 7 6 14 27 45 Asian or Pacific Islander, non-Hispanic 1,440 ‡ 2 ! ‡ 7 34 56 Other, non-Hispanic4 1,378 ‡ 8 6 16 28 40 Student’s grade level 6th–8th grade 11,602 1 9 7 14 28 42 9th–12th grade 14,430 1 8 8 16 29 37 Highest education level of parents/guardians Less than high school 2,853 3 ! 16 9 16 24 31 High school graduate or equivalent 5,166 1 ! 20 10 23 16 29 Vocational/technical or some college 6,710 1 ! 7 11 22 28 31 Bachelor’s degree 7,086 1 ! 3 5 7 42 42 Graduate or professional school 4,219 1 ! 1 2 5 28 63
See notes at end of table.

15
Table 5. Percentage of students in grades 6 through 12 whose parents reported expectations of specific educational attainment levels, by selected school, student, and family characteristics: 2015–16—Continued
Characteristic
Number of students in
grades 6 through 12
(thousands)
Parent expects student to
Receive less than a high school
diploma
Graduate from high
school
Attend vocational or technical school
after high school
Attend 2 or more years
ofcollege
Earn a bachelor’s
degree
Earn a graduate or
professional degree
English spoken at home by parents/guardians5 Both/only parent(s)/guardian(s) speak(s) English 22,063 1 9 8 16 29 37 One of two parents/guardians speaks English 881 # 8 ! 4 ! 16 17 56 No parent/guardian speaks English 3,088 1 ! 5 ! 4 ! 8 32 50 Poverty status6 Poor 4,210 2 21 7 19 17 34 Nonpoor 21,823 1 6 8 14 31 40
# Estimate rounds to zero. ‡ Reporting standards not met. There were too few cases for a reliable estimate. ! Interpret data with caution; coefficient of variation is between 30 and 50 percent. 1 School type classifies the school currently attended as either public or private. Public schools are further classified according to whether the school was chosen or assigned.Private schools are also classified as being religious or nonreligious. School type also excludes 38 cases where the Common Core of Data (CCD) indicated that the school waspublic but the respondent indicated the student attended a private school.2 Excludes 58 cases because of missing data on the Common Core of Data (CCD)/Private School Survey (PSS) data files.3 Locale of student’s household classifies the residential ZIP code into a set of four major locale categories: city, suburban, town, rural.4 “Other, non-Hispanic” includes American Indian and Alaska Native children who are not Hispanic and children reported as a race/ethnicity not listed.5 Complete descriptions of the categories for English spoken at home by parents/guardians are as follows: (1) Both parents/guardians or the only parent/guardian learned Englishfirst or currently speak(s) English in the home, (2) One of two parents/guardians in a two-parent/guardian household learned English first or currently speaks English in the home,and (3) No parent/guardian learned English first and both parents/guardians or the only parent/guardian currently speak(s) a non-English language in the home.6 Students are considered poor if living in households with incomes below the poverty threshold, which is a dollar amount determined by the federal government to meet thehousehold’s needs, given its size and composition. Income is collected in categories in the survey, rather than as an exact amount, and therefore the poverty measures used in thisreport are approximations of poverty. Detailed information on the poverty status calculation used in this report is available in appendix B.NOTE: Students who were homeschooled were excluded from the table. Detail may not sum to totals because of rounding. Variables for school characteristics (school type andschool size) have a certain number of missing cases owing to school nonreport; therefore, the number of students across the categories for each school variable does not sum to thetotal number of students.SOURCE: U.S. Department of Education, National Center for Education Statistics, Parent and Family Involvement in Education Survey of the National Household EducationSurveys Program (NHES), 2016.

16
Table 6. Percentage of students in kindergarten through grade 12 whose parents reported participation in various activities, by selected school, student, and family characteristics: 2015–16
Characteristic
Number of students in
kindergarten through
grade 12 (thousands)
Activities in the past month
Visited library
Visited bookstore
Gone to a play,
a concert, or other
live show
Visited an art gallery, a museum,
or a historical site
Visited a zoo or an aquarium
Attended a community/
religious/ ethnic event1
Attended athletic/ sporting
event2 Total 51,162 34 34 34 25 24 54 42 School type3 Public, assigned 38,730 33 32 33 24 24 52 41 Public, chosen 7,282 38 35 35 28 28 54 41 Private, religious 3,686 35 40 41 31 20 69 49 Private, nonreligious 1,043 36 42 53 34 21 56 40 School size4 Under 300 5,800 35 32 35 27 26 59 43 300–599 16,953 40 35 34 27 27 57 43 600–999 15,126 36 35 34 27 26 53 42 1,000 or more 12,990 25 30 33 21 17 48 39 Locale of student’s household5 City 16,278 37 35 33 28 28 51 39 Suburban 22,615 35 35 37 27 24 54 43 Town 4,042 31 26 29 19 17 52 40 Rural 8,227 29 30 32 20 19 57 45 Student’s sex Male 26,495 32 31 30 24 23 52 44 Female 24,667 37 37 39 27 24 55 40 Student’s race/ethnicity White, non-Hispanic 25,703 32 35 36 26 20 53 44 Black, non-Hispanic 7,139 40 28 33 26 28 64 45 Hispanic 12,281 31 32 32 25 30 51 40 Asian or Pacific Islander, non-Hispanic 3,199 47 35 33 24 24 49 26 Other, non-Hispanic6 2,840 38 39 34 29 21 52 36 Student’s grade level Kindergarten–2nd grade 13,090 41 35 32 28 37 54 38 3rd–5th grade 12,040 43 39 35 31 28 57 45 6th–8th grade 11,602 34 33 35 23 19 55 45 9th–12th grade 14,430 21 29 34 20 13 49 40 See notes at end of table.

17
Table 6. Percentage of students in kindergarten through grade 12 whose parents reported participation in various activities, by selected school, student, and family characteristics: 2015–16—Continued
Characteristic
Number of students in
kindergarten through
grade 12 (thousands)
Activities in the past month
Visited library
Visited bookstore
Gone to a play,
a concert, or other
live show
Visited an art gallery, a museum,
or a historical site
Visited a zoo or an aquarium
Attended a community/
religious/ ethnic event1
Attended athletic/ sporting
event2 Highest education level of parents/guardians Less than high school 5,530 30 22 24 16 28 40 31 High school graduate or equivalent 9,986 29 23 28 20 25 47 38 Vocational/technical or some college 13,174 32 32 31 23 23 52 41 Bachelor’s degree 13,789 36 40 39 30 23 59 46 Graduate or professional school 8,683 44 45 45 34 22 64 47 English spoken at home by parents/guardians7 Both/only parent(s)/guardian(s) speak(s) English 43,115 35 35 35 26 23 55 43 One of two parents/guardians speaks English 1,882 36 28 33 20 22 51 38 No parent/guardian speaks English 6,165 29 28 28 21 29 48 31 Poverty status8 Poor 8,971 36 23 24 21 29 47 35 Nonpoor 42,191 34 36 36 26 23 55 43 1 Actual question wording asks if anyone in the family has attended an event sponsored by a community, religious, or ethnic group with the student. 2 Actual question wording asks if anyone in the family has attended an athletic or sporting event outside of school in which this child was not a player. 3 School type classifies the school currently attended as either public or private. Public schools are further classified according to whether the school was chosen or assigned. Private schools are also classified as being religious or nonreligious. School type also excludes 67 cases where the Common Core of Data (CCD) indicated that the school was public but the respondent indicated the student attended a private school. 4 Excludes 81 cases because of missing data on the Common Core of Data (CCD)/Private School Survey (PSS) data files. 5 Locale of student’s household classifies the residential ZIP code into a set of four major locale categories: city, suburban, town, rural. 6 “Other, non-Hispanic” includes American Indian and Alaska Native children who are not Hispanic and children reported as a race/ethnicity not listed. 7 Complete descriptions of the categories for English spoken at home by parents/guardians are as follows: (1) Both parents/guardians or the only parent/guardian learned English first or currently speak(s) English in the home, (2) One of two parents/guardians in a two-parent/guardian household learned English first or currently speaks English in the home, and (3) No parent/guardian learned English first and both parents/guardians or the only parent/guardian currently speak(s) a non-English language in the home. 8 Students are considered poor if living in households with incomes below the poverty threshold, which is a dollar amount determined by the federal government to meet the household’s needs, given its size and composition. Income is collected in categories in the survey, rather than as an exact amount, and therefore the poverty measures used in this report are approximations of poverty. Detailed information on the poverty status calculation used in this report is available in appendix B. NOTE: Students who were homeschooled were excluded from the table. Detail may not sum to totals because of rounding. Variables for school characteristics (school type and school size) have a certain number of missing cases owing to school nonreport; therefore, the number of students across the categories for each school variable does not sum to the total number of students. SOURCE: U.S. Department of Education, National Center for Education Statistics, Parent and Family Involvement in Education Survey of the National Household Education Surveys Program (NHES), 2016.

18
Table 7. Percentage distribution of homeschooled students ages 5 through 17 with a grade equivalent of kindergarten through grade 12 and homeschooling rate, by selected student and family characteristics: 2015–16
Characteristic Number of students 5–17
(thousands) Percentage distribution
Homeschooling rate1
Total 51,644 100 3.3 Locale of student’s household2 City 16,345 29 3.0 Suburban 22,796 39 2.9 Town 4,136 10 4.3 Rural 8,367 22 4.4 Student’s sex Male 26,544 48 3.0 Female 25,101 52 3.5 Student’s race/ethnicity White, non-Hispanic 26,052 59 3.8 Black, non-Hispanic 7,055 8 1.9 Hispanic 12,553 26 3.5 Asian or Pacific Islander, non-Hispanic 3,226 3 1.5 Other, non-Hispanic3 2,757 4 2.4 Student’s grade equivalent
Kindergarten–2nd grade 13,256 23 2.9 3rd–5th grade 12,433 22 3.0 6th–8th grade 12,001 24 3.3 9th–12th grade 13,954 31 3.8
Highest education level of parents/guardians Less than high school 5,670 15 4.4 High school graduate or equivalent 9,910 16 2.7 Vocational/technical or some college 13,336 25 3.1 Bachelor’s degree 13,952 30 3.6 Graduate or professional school 8,777 15 3.0 English spoken at home by parents/guardians4 Both/only parent(s)/guardian(s) speak(s) English 43,429 84 3.3 One of two parents/guardians speaks English 1,939 5 ! 4.7 ! No parent/guardian speaks English 6,277 11 2.9 Poverty status5 Poor 9,173 21 3.9 Nonpoor 42,472 79 3.1
! Interpret data with caution; coefficient of variation is between 30 and 50 percent. 1 The homeschooling rate is the percentage of the total subgroup that is homeschooled. For example, in 2016, some 3 percent ofall school-age males were homeschooled. The total number of homeschooled students in 2016 was 1,689,726 (standard error of118,447.8).2 Locale of student’s household classifies the residential ZIP code into a set of four major locale categories: city, suburban, town,rural.3 “Other, non-Hispanic” includes American Indian and Alaska Native children who are not Hispanic and children reported as arace/ethnicity not listed.4 Complete descriptions of the categories for English spoken at home by parents/guardians are as follows: (1) Bothparents/guardians or the only parent/guardian learned English first or currently speak(s) English in the home, (2) One of twoparents/guardians in a two-parent/guardian household learned English first or currently speaks English in the home, and (3) Noparent/guardian learned English first and both parents/guardians or the only parent/guardian currently speak(s) a non-Englishlanguage in the home.5 Students are considered poor if living in households with incomes below the poverty threshold, which is a dollar amountdetermined by the federal government to meet the household’s needs, given its size and composition. Income is collected incategories in the survey, rather than as an exact amount, and therefore the poverty measures used in this report areapproximations of poverty. Detailed information on the poverty status calculation used in this report is available in appendix B.NOTE: Detail may not sum to totals because of rounding. Homeschooled students are school-age children who receiveinstruction at home instead of at a public or private school either all or most of the time. Excludes students who were enrolled inpublic or private school more than 25 hours per week and students who were homeschooled only because of temporary illness.SOURCE: U.S. Department of Education, National Center for Education Statistics, Parent and Family Involvement in EducationSurvey of the National Household Education Surveys Program (NHES), 2016.
19
Table 8. Percentage of school-age children who were homeschooled, ages 5 through 17 with a grade equivalent of kindergarten through grade 12, by reasons parents gave as important and most important for homeschooling: 2015–16
Important1 Most important A desire to provide religious instruction 51 16 A desire to provide moral instruction 67 5 A concern about environment of other schools2 80 34 A dissatisfaction with academic instruction at other schools 61 17 A desire to provide a nontraditional approach to child’s education 39 6 Child has other special needs 20 6 Child has a physical or mental health problem 14 6 Child has a temporary illness 4 ‡ Other reasons3 22 11
‡ Reporting standards not met. There were too few cases for a reliable estimate.1 Respondents could choose more than one reason. 2 Based on the response to the question, “You are concerned about the school environment, such as safety, drugs, or negative peer pressure?” 3 Parents homeschool their children for many reasons that are often unique to their family situation. “Other reasons” parents gave for homeschooling include family time, finances, travel, and a more flexible schedule. NOTE: Homeschooled students are school-age children who receive instruction at home instead of at a public or private school either all or most of the time. Excludes students who were enrolled in public or private school more than 25 hours per week and students who were homeschooled only because of temporary illness. SOURCE: U.S. Department of Education, National Center for Education Statistics, Parent and Family Involvement in Education Survey of the National Household Education Surveys Program (NHES), 2016.

This page is intentionally left blank.

21
References Geverdt, D. (2015). Education Demographic and Geographic Estimates Program (EDGE):
Locale Boundaries User’s Manual (NCES 2016-012). U.S. Department of Education. Washington, DC: National Center for Education Statistics. Retrieved March 31, 2017, from https://nces.ed.gov/programs/edge/docs/NCES_LOCALE_USERSMANUAL_2016012.pdf.
McPhee, C., Jackson, M., Bielick, S., Masterton, M., Battle, D., McQuiggan, M., Payri, M., Cox, C., and Medway, R. (forthcoming). National Household Education Surveys Program of 2016: Data File User’s Manual (NCES 2017-100). U.S. Department of Education. Washington, DC: National Center for Education Statistics.

This page is intentionally left blank.
23
Appendix A. Technical Notes The National Household Education Surveys Program (NHES) is a set of surveys sponsored by the U.S. Department of Education’s National Center for Education Statistics (NCES). This First Look report presents survey data released from the Parent and Family Involvement in Education (PFI) Survey of the 2016 NHES. Earlier administrations of the NHES—in 1996, 1999, 2003, 2007, and 2012—also focused on parent and family involvement in education.
The PFI data collection was conducted by the U.S. Census Bureau, from January through August of 2016. This section provides a brief description of the study methodology. For more extensive information on the study methodology and data collection procedures, readers are advised to consult the National Household Education Surveys Program of 2016: Data File User’s Manual (McPhee et al., forthcoming).
The NHES:2016 sample was selected using a two-stage address-based sampling frame. The first sampling stage selected residential addresses; at this first stage, households were asked to complete a screener questionnaire. To increase the number of Blacks and Hispanics in the sample, Black and Hispanic households were sampled at a higher rate than other households by identifying census tracts with higher percentages of these residents. At the second stage, one individual from each household was sampled. The majority of data were collected using printed questionnaires that were mailed to the sampled respondents. However, 35,000 of 206,000 sampled households were first asked to complete the survey by web in order to assess the feasibility of including a web-based administration in future NHES collections. A total of 1,803 respondents completed the PFI by web, which is about 13 percent of all PFI respondents. For more information about the 2016 web experiment, including response rates by administration mode, please see the forthcoming Data File User’s Manual (McPhee et al., forthcoming).
The NHES:2016 included four topical survey instruments: the Parent and Family Involvement Survey for enrolled students (PFI-Enrolled), the Parent and Family Involvement Survey for homeschooled students (PFI-Homeschooled), the Early Childhood Program Participation Survey (ECPP), and the Adult Training and Education Survey (ATES). A within-household sampling scheme controlled for the number of persons sampled for topical questionnaires in each household. No household received more than one survey; either one child was sampled for the ECPP survey, the PFI-Enrolled, or the PFI-Homeschooled survey; or an adult was sampled for the ATES.
The PFI sample is nationally representative of all noninstitutionalized students in the 50 states and the District of Columbia from kindergarten through grade 12 enrolled in school or children who are ages 3 through 20 and homeschooled for these grades. While the PFI sample is representative of children ages 3 through 20, homeschooling estimates are restricted to children ages 5 through 17 for analytical purposes.
The respondent to the PFI questionnaire was a parent or guardian in the household who knew about the sampled child. The respondent was asked questions about school choice, homeschooling, school characteristics, student experiences, teacher feedback on school performance and behavior, family involvement in the school, school practices to involve and
24
support families, satisfaction with different aspects of the school, family involvement in schoolwork, and family involvement in selected activities with students. The respondent was also asked basic demographic questions about the child as well as questions about the child’s health and disability status, parent/guardian characteristics, and household characteristics.
Multiple follow-up attempts were made to obtain completed questionnaires with respondents who did not respond to the first questionnaire that was mailed to them. The survey contact materials and questionnaires (both printed and online) were available in English and Spanish. The total number of completed PFI surveys was 14,075, representing a population of 53.2 million students when weighted to reflect national totals.
Data Reliability
Estimates produced using data from the NHES are subject to two types of errors: sampling errors and nonsampling errors. Nonsampling errors are errors made in the collection and processing of data. Sampling errors occur because the data are collected from a sample, rather than a census, of the population.
Nonsampling Errors Nonsampling error is the term used to describe variations in the estimates that may be caused by population coverage limitations and data collection, processing, and reporting procedures. The sources of nonsampling errors are typically problems such as unit and item nonresponse, the differences in respondents’ interpretations of the meaning of survey questions, response differences related to the particular month or time of the year when the survey was conducted, the tendency for respondents to give socially desirable responses, and mistakes in data preparation.
In general, it is difficult to identify and estimate either the amount of nonsampling error or the bias caused by this error. For each NHES survey, efforts were made to prevent such errors from occurring and to compensate for them, where possible. For instance, during the survey design phase, cognitive interviews were conducted to assess respondents’ knowledge of the survey topics, their comprehension of questions and terms, and the sensitivity of items.
Sampling Errors The sample of households selected for the NHES:2016 is just one of many possible samples that could have been selected from all households based on addresses. Therefore, estimates produced from this survey may differ from estimates that would have been produced from other samples. This type of variability is called sampling error because it arises from using a sample of households rather than all households.
The standard error is a measure of the variability due to sampling when estimating a statistic; standard errors for estimates presented in this report were computed using a jackknife replication method. Standard errors can be used as a measure of the precision expected from a particular sample. The probability that a complete census count would differ from the sample estimate by less than 1 standard error is about 68 percent. The chance that the difference would be less than
25
1.65 standard errors is about 90 percent, and the chance that the difference would be less than 1.96 standard errors is about 95 percent.
Standard errors for all of the estimates are presented in appendix C and can be used to produce confidence intervals. For example, an estimated 79 percent of students in kindergarten through grade 12 had a parent who reported attending a school or class event (table 2). This figure has an estimated standard error of 0.5. Therefore, the estimated 95 percent confidence interval for this statistic is approximately 78 percent to 80 percent [79 percent ± (1.96 * 0.5)]. If repeated samples were drawn from the same population and confidence intervals were constructed for the percentage of students in kindergarten through grade 12 who had a parent who reported attending a school or class event, then these intervals would contain the true population parameter 95 percent of the time.
Weighting To produce estimates representing national totals rather than sample characteristics, all of the analyses in this report were weighted using the probabilities of selection of the respondents and other adjustments to account for nonresponse and coverage bias. The weight used in this First Look report is FPWT, which is the weight variable available in the PFI data file that is used to estimate the characteristics of the school-age children.
Complex sample designs, such as that used in NHES:2016, result in data that violate some of the assumptions that are made when assessing the statistical significance of results from a simple random sample. For example, the standard errors of the estimates from these surveys may vary from those that would be expected if the sample were a simple random sample and the observations were independent and identically distributed random variables. The estimates and standard errors presented in this report were produced using Stata 13.1 software and the jackknife option (jkrweight) as a replication procedure. Eighty replicate weights, FPWT1 to FPWT80, were used to compute sampling errors of estimates. These replicate weights are also available in the PFI data file.
Response Rates In the NHES:2016 collection, an initial screener questionnaire was sent to all sampled households to determine which household members were eligible to be sampled for a second-stage survey on a specific topic. Screener questionnaires were completed by 115,342 households, for a weighted screener unit response rate of 66.4 percent. PFI questionnaires were completed for 14,075 (552 homeschooled and 13,523 enrolled) children, for a weighted unit response rate of 74.3 percent and an overall estimated unit response rate (the product of the screener unit response rate and the PFI unit response rate) of 49.3 percent.
Bias Analysis NCES statistical standards require a bias analysis be conducted if the response rate at any phase of data collection falls below 85 percent. The NHES:2016 included a bias analysis to evaluate whether nonresponse at the unit and item levels impacted the estimates. The term bias has a specific technical definition in this context: It is the expected difference between the estimate from the survey and the actual population value. For example, if all households were included in the survey (i.e., if a census was conducted rather than a sample survey), then the difference

26
between the estimate from the survey and the actual population value (which includes persons who did not respond to the survey) would be the bias due to unit nonresponse. Because NHES is based on a sample, the bias is defined as the expected or average value of this difference over all possible samples.
Unit nonresponse bias, or the bias due to the failure of some persons or households in the sample to respond to the survey, can be substantial when two conditions hold. First, the differences between the characteristics of respondents and nonrespondents must be relatively large. For example, consider estimating the percentage of students who have repeated a grade. If the percentage is nearly identical for both respondents and nonrespondents, then the unit nonresponse bias of the estimate will be negligible. Second, the unit nonresponse rate must be relatively high. If the nonresponse rate is very low relative to the magnitude of the estimates, then the unit nonresponse bias in the estimates will be small, even if the differences in the characteristics between respondents and nonrespondents are relatively large. For example, if the unit nonresponse rate is only 2 percent, then estimates of totals that comprise 20 percent or 30 percent of the population will not be greatly affected by nonresponse, even if the differences in these characteristics between respondents and nonrespondents are relatively large. If the estimate is for a small domain or subgroup (of about 5 percent or 10 percent of the population), then even a relatively low overall rate of nonresponse can result in important biases if the differences between respondents and nonrespondents are large.
A number of strategies were used to evaluate the level of bias in NHES:2016 estimates. First, characteristics of the full sample of NHES:2016 addresses were compared to the sample of completed NHES surveys. Because we have relatively limited information about sampled addresses, the number of such possible comparisons is constrained to information available on the commercially purchased sample frame, auxiliary data from the Census Bureau at the block group level, and variables related to survey operations, such as the types of mailings sent. These comparisons represent the most direct evidence of bias because they compare all sampled addresses, including nonresponders, to responding addresses.
Three additional analyses were conducted to look for approximate evidence of bias; the additional analyses suggest potential for bias but do not measure bias. In one set of analyses, addresses with responses to either of the first two survey mailings were compared to addresses who responded only after receiving the third or fourth survey mailings. The assumption behind these analyses is that late responders are more like nonresponders than early responders and that any differences between these groups can suggest potential sources of bias from nonresponding households. In another set of analyses, estimates generated using nonresponse-adjusted weights were compared to estimates generated using unadjusted weights to evaluate the extent to which the nonresponse adjustments may have reduced bias in the estimates. Finally, NHES estimates were compared to extant survey estimates to find large differences, which may suggest some bias in NHES estimates. Results of all analyses are summarized below and suggest that there are a small number of demographic characteristics that are underrepresented in the NHES survey but are ameliorated with nonresponse weighting adjustments. Chapter 10 of the National Household Education Surveys Program of 2016: Data File User’s Manual (McPhee et al., forthcoming) contains a detailed description of the nonresponse bias analysis.
27
Comparisons between the full sample population and respondent populations were made before and after the nonresponse weighting adjustments were applied to evaluate the extent to which the adjustments reduced any observed nonresponse bias. The NHES sampling frame variables were used for the unit nonresponse bias analysis for the screener and topical surveys. The analysis of unit nonresponse bias showed some evidence of bias based on the distributions of the sample characteristics for the survey respondents compared with the full eligible sample for specific demographic characteristics. Most differences between the sample characteristics and the screener survey respondents were less than 5 percentage points. Respondents who were married, White, or homeowners were overrepresented in the screener survey sample by 5–7 percentage points prior to being statistically adjusted for nonresponse. All differences between PFI respondents and initial sample member addresses were at about 4 percentage points or less, with most differences less than 2 percentage points prior to adjustment.
This bias was greatly reduced by the nonresponse weighting adjustments. In the post-adjusted screener estimates, the number of estimates showing measurable and practical differences was reduced approximately in half. Additionally, nonresponse weighting adjustments reduced the differences between married, White, or homeowner screener respondents and the full initial screener sample to less than 3 percentage points. The percentage of PFI estimates with measurable survey and sample differences greater than 1 percentage point was reduced from 29 percent to 7 percent after the nonresponse weighting adjustments. After nonresponse adjustments, all PFI comparisons were 1.5 percentage points different or less from the full sample characteristics except married respondents (1.8 percentage point estimated bias) and homeowners (2.1 percentage point estimated bias).
Key survey estimates were also compared between early and late respondents at both the topical and screener phases. The subgroups with the highest percent relative difference between early and late topical respondents for PFI were students whose parents had less than a high school diploma (42 percent), students whose parents’ highest level of education was a high school credential (38 percent), and students whose parents took them to a zoo or aquarium in the last week (36.7 percent). Approximately 40 percent of the 55 PFI demographic estimates and substantive estimates examined showed statistically significant differences of at least 1 percentage point between early and late screener respondents; and approximately 42 percent showed statistically significant differences of at least 1 percentage point between early and late topical respondents. This finding suggests a potential for bias in some PFI estimates, although the magnitude of the potential bias is unknown because it might be incorrect to assume that late responders are more like nonresponders than like early responders.
When key survey estimates generated with unadjusted and nonresponse adjusted weights were compared, only a small number of measurable differences was observed. All differences were less than 2 percentage points. This suggests that none of these variables were powerful predictors of unit response. Therefore, the unit nonresponse adjustment had limited effect on the potential bias, but it is possible that there was little bias to be removed.
Nonresponse bias might be present in other variables that were not studied. For this reason, it is important to consider other methods of examining unit nonresponse bias. One such method is comparing NHES estimates with other sources. NHES estimates were compared with estimates from the American Community Survey, Current Population Survey, and prior NHES collections.

28
Comparisons were made on common variables of interest—such as child’s race/ethnicity and sex, key questionnaire items, and parents’ education and household income—to discover any indication of potential bias that might exist in the NHES:2016 data. The results from these comparisons indicate that NHES survey estimates are comparable with other data sources.
Statistical Tests
Comparisons of proportions were tested using Student’s t statistic. Differences between proportions were tested against the probability of a Type I error1
1 A Type I error occurs when one concludes that a difference observed in a sample reflects a true difference in the population from which the sample was drawn, when no such difference is present.
or significance level. The statistical significance of each comparison was determined by calculating the Student’s t value for the difference between each pair of proportions and comparing the t value with published tables of significance levels for two-tailed hypothesis testing. Student’s t values were computed to test differences between independent proportions2
2 Several significance tests in this report used the formula for the t-test of the difference between two dependent samples. This formula is used when the two proportions are estimated using partially or wholly overlapping samples. This formula is similar to that used for independent samples but accounts for the covariance between P1 and P2.
using the following formula:
( )[ ] ( )[ ]222
1
12
.... pespes
ppt+
−=
where p1 and p2 are the proportions to be compared and se1 and se2 are their corresponding standard errors.
There are hazards in reporting statistical tests for each comparison. First, comparisons based on large t statistics may appear to merit special attention. This can be misleading because the magnitude of the t statistic is related not only to the observed differences in proportions but also to the number of respondents in the specific categories used for comparisons. Hence, a small difference compared across a large number of respondents would produce a large (and thus possibly statistically significant) t statistic.
A second hazard in reporting statistical tests is the possibility that one can report a “false positive” or Type I error. Statistical tests are designed to limit the risk of this type of error using a value denoted by alpha. The alpha level of .05 was selected for findings in this report and ensures that a difference of a certain magnitude or larger would be produced when there was no actual difference between the quantities in the underlying population no more than 1 time out of 20.3
3 No adjustments were made for multiple comparisons.
When analysts test hypotheses that show alpha values at the .05 level or smaller, they reject the null hypothesis that there is no difference between the two quantities. Failing to reject a null hypothesis (i.e., detect a difference), however, does not imply the values are the same or equivalent.

29
Appendix B. Glossary of Terms The row and column variables used in analyses for this First Look report are described in this appendix. The names of variables that are included in the data file and were used to produce estimates for this report appear in capital letters. In some cases, the variables have been used in the exact format in which they appear on the data file. In other cases, variables available on the data file have been modified, for instance, when the categories have been combined to create a smaller number of categories. Such collapsing of categories is noted in the descriptions. In other cases, new measures have been created specifically for this report by combining information from two or more variables in the data file. In these instances, the variables used to create the new measure are noted. Values were imputed for items with missing data.
Row Variables
School Characteristics School type: School type is created by classifying the school currently attended by the student as either public or private using the variables S16TYPE and S16PBPV. S16TYPE and S16PBPV are derived from parent-reported information linked to data from the Common Core of Data (CCD) or Private School Universe Survey (PSS) data files. Public schools are further classifiedusing the variables S16CHART, S16MAGN, and DISTASSI. S16CHART and S16MAGN arevariables derived from the CCD that are used to determine whether the school is a charter ormagnet school. DISTASSI is a parent-reported variable asking whether the school the childattends is the child’s regularly assigned school. Private schools are also classified using thevariable S16TYPE as being religious or nonreligious.
The values are as follows:
1 = Public, assigned 2 = Public, chosen 3 = Private, religious 4 = Private, nonreligious
School size: The variable S16NUMST classifies the student’s school on the basis of the number of students currently enrolled. The data come from the CCD and PSS.
The values are as follows:
1 = Under 300 2 = 300–599 3 = 600–999 4 = 1,000–2,499 5 = 2,500 or more -1 = Homeschooled student-2 = Inapplicable in the CCD universe file-9 = Data are missing for school

30
For the analyses, categories 4 and 5 are collapsed to create a category “1,000 or more.”
Student Characteristics Locale of student’s household: ZIPLOCL is a household location variable that classifies the ZIP code into a set of community types. This variable was derived using the respondent’s ZIP code and census data.
The values for ZIPLOCL are as follows:
1 = City—Large 2 = City—Midsize 3 = City—Small 4 = Suburb—Large 5 = Suburb—Midsize 6 = Suburb—Small 7 = Town—Fringe 8 = Town—Distant 9 = Town—Remote 10 = Rural—Fringe 11 = Rural—Distant 12 = Rural—Remote
For the analyses, the first three categories from ZIPLOCL are combined to form the “City” category. Other categories from ZIPLOCL are combined to form the categories “Suburban” (categories 4, 5, and 6), “Town” (categories 7, 8, and 9), and “Rural” (10, 11, and 12). For definitions of these 12 categories of community type, see Geverdt (2015).
Student’s sex: The data for the variable CSEX are taken directly from responses to the topical interview. If values are missing for this variable, they are imputed from the screener interview where possible.
Student’s race/ethnicity: RACEETH2 indicates the race and ethnicity of the sampled student. This variable is used in this report in the same format in which it appears on the data file and is derived from information in CHISPAN, CWHITE, CBLACK, CAMIND, CASIAN, and CPACI. If values are missing for these variables, they are imputed. If students are reported to be both Asian and Pacific Islander, and are not Hispanic, they are included in the “Asian or Pacific Islander, non-Hispanic” category.
The values of RACEETH2 are as follows:
1 = White, non-Hispanic 2 = Black, non-Hispanic 3 = Hispanic 4 = Asian or Pacific Islander, non-Hispanic 5 = All other races and multiple races, non-Hispanic

31
Student’s grade level: ALLGRADEX, a derived variable available on the data file, indicates the grade in which the student is currently enrolled or provides the student’s grade equivalent. The values of ALLGRADEX are kindergarten through grade 12. For this report, grades are collapsed into the following categories: kindergarten–2, 3–5, 6–8, and 9–12.
Family Characteristics Highest education level of parents/guardians: PARGRADEX indicates the highest level of education for either of the child’s parents or nonparent guardians who reside in the household. This measure, which is used in this report in the same format in which it appears on the data file, is derived from PAR1EDUC and PAR2EDUC.
The values for PARGRADEX are as follows:
1 = Less than high school credential 2 = High school graduate or equivalent 3 = Vocational/technical education after high school or some college 4 = College graduate 5 = Graduate or professional school
English spoken at home by parents/guardians: LANGUAGEX indicates the knowledge and/or use of English by the parent(s)/guardian(s) in the household. LANGUAGEX is used in this report in the same format in which it appears on the data file and is created using the variables P1FRLNG, P1SPEAK, P2GUARD, P2FRLNG, and P2SPEAK.
The values for LANGUAGEX are as follows:
1 = Both/only parent(s)/guardians(s) learned English first or currently speak(s) English in the home 2 = One of two parents/guardians(s) learned English first or currently speaks English in the home 3 = No parent/guardian learned English first and both/only parent(s) currently speak(s) a non-English language in the home
Poverty status: This variable indicates whether a sample student resided in a household categorized as poor or nonpoor. NHES provides an approximate measure of poverty; therefore, the midpoint of the income variable range was used. The income variable used to establish whether a child resided in a household categorized as poor or nonpoor is TTLHHINC, which lists possible income ranges (e.g., $0 to $10,000, $10,001 to 20,000, $20,001 to $30,000, up to over $150,001). If data for TTLHHINC are missing, they are imputed. Using the income ranges and household size (HHTOTAL), poverty thresholds are then used to establish whether a child resided in a household categorized as poor or nonpoor. Thresholds to define poverty are based on weighted averages from 2015 census poverty thresholds. A household is considered poor if a household of a particular size matches the income categories shown in exhibit B-1. Otherwise, the household is considered to be nonpoor.

32
Exhibit B-1. Poverty definition in Parent and Family Involvement in Education analyses, by household size: 2016
Household size (HHTOTAL)¹ Income categories in variable TTLHHINC 2 Less than or equal to $20,000 (TTLHHINC = 1, 2) 3 Less than or equal to $20,000 (TTLHHINC = 1, 2) 4 Less than or equal to $20,000 (TTLHHINC = 1, 2) 5 Less than or equal to $30,000 (TTLHHINC = 1, 2, 3) 6 Less than or equal to $30,000 (TTLHHINC = 1, 2, 3) 7 Less than or equal to $40,000 (TTLHHINC = 1, 2, 3, 4) 8 Less than or equal to $40,000 (TTLHHINC = 1, 2, 3, 4)
9+ Less than or equal to $50,000 (TTLHHINC = 1, 2, 3, 4, 5) 1 Indicates the total number of individuals living in the household, top-coded to 10 for NHES:2016. SOURCE: U.S. Department of Education, National Center for Education Statistics, Parent Family Involvement in Education Survey of the National Household Education Surveys Program (PFI-NHES:2016); U.S. Census Bureau, Poverty Thresholds for 2015 by Size of Family and Number of Related Children Under 18 Years, https://www.census.gov/data/tables/time-series/demo/income-poverty/historical-poverty-thresholds.html.
Column Variables
Table 1. Method by which school communicated with parents Parents were asked whether their children’s teachers or school sent them notes or e-mail about their children (FSNOTESX); whether the school sent newsletters, memos, e-mail, or notices addressed to all parents (FSMEMOSX); and whether they were called on the phone (FSPHONCHX).
Table 2. Parental participation in school activities Parents were asked whether they or anyone else in their household had done the following things since the beginning of the school year: attended a general school meeting such as an open house or a back-to-school night (FSMTNG); attended a meeting of the parent-teacher organization or association (FSPTMTNG); went to a regularly scheduled parent-teacher conference with their child’s teacher (FSATCNFN); attended a school or class event such as a play, dance, sports event, or science fair because of the child (FSSPORTX); served as a volunteer in the child’s classroom or elsewhere in the school (FSVOL); participated in fundraising for the school (FSFUNDRS); served on a school committee (FSCOMMTE); and met with a guidance counselor in person (FSCOUNSLR). For this report, attending a general school meeting or attending a parent-teacher organization or association meeting are combined so that the estimates reported indicate the percentages of students whose parents reported attendance at either of these types of meetings since the beginning of the school year. Similarly, volunteering and serving on a school committee are combined so that the estimate reported indicates the percentage of parents who volunteered or served on a committee. The last column of this table presents the mean number of meetings or activities at the child’s school (FSFREQ), which is computed from parents’ responses to an item asking, “During this school year, how many times has any adult in the household gone to meetings or participated in activities at this child’s school?”

33
Table 3. Parental satisfaction with school characteristics and amount of homework Parents were asked to rate how satisfied they were with the school their child attends this year (FCSCHOOL). The choices were “very satisfied,” “somewhat satisfied,” “somewhat dissatisfied,” and “very dissatisfied.” Table 3 reports the percentage of parents who were “very satisfied.” The other items in the table, coded in the same way as FCSCHOOL, are satisfaction with the teachers their child has this year (FCTEACHR), satisfaction with the academic standards of the school (FCSTDS), satisfaction with the order and discipline at the school (FCORDER), and satisfaction with the way the school staff interacts with parents (FCSUPPRT).
Parents who reported that their children did homework outside of school were asked their opinion about the amount of homework their children are assigned (FHAMOUNT). The choices were “The amount is about right,” “It’s too much,” or “It’s too little.” Table 3 reports the percentage of parents who thought that the amount of homework assigned was “about right.”
Table 4. Family involvement in homework for students who do homework outside of school Parents were asked to report how often their children do homework outside of school (FHHOME). The choices were “never,” “less than once a week,” “1 to 2 days a week,” “3 to 4 days a week,” “5 or more days a week,” or “child does not have homework.” The estimates in table 4 indicate the percentage of students whose parents reported any response other than “never” or “child does not have homework.”
Parents were asked to report whether there is a place in their home that is set aside for homework (FHPLACE). The choices were “yes,” “no,” and “child does not do homework at home.” For the analysis, the estimates pertain only to students whose parents reported that their children do homework at home.
Parents were asked, “How often does any adult in your household check to see that this child’s homework is done?” (FHCHECKX). For the analysis, the estimates for “adult in household checks that homework is done” pertain only to students whose parents reported that their children do homework outside of school.
Table 5. Parental expectations for student’s education after high school Parents were asked to report how far they expect their child to go in their education (SEFUTUREX). The choices were “to receive less than a high school diploma,” “to graduate from high school,” “to attend a vocational school after high school,” “to attend two or more years of college,” “to finish a four- or five-year college degree,” and “to earn a graduate degree or professional degree beyond a bachelor’s.” For the analysis, the estimates for education expectations pertain only to students in grades 6 through 12.
Table 6. Family participation in non-school-related activities Parents were asked whether they did the following activities with the child in the past month: visited a library (FOLIBRAYX); visited a bookstore (FOBOOKSTX); went to a play, concert, or other live show (FOCONCRTX); visited an art gallery, a museum, or a historical site (FOMUSEUMX); visited a zoo (FOZOOX); attended an event sponsored by a community

34
religious or ethnic group (FOGROUPX); and attended an athletic or sporting event outside of school in which the child was not a player (FOSPRTEVX). Responses were yes or no.
Table 7. Homeschooled students and homeschooling rate Unlike the other variables used in this report, the data for tables 7 and 8 come from the PFI-Enrolled and the PFI-Homeschool surveys but are restricted to homeschoolers. Homeschooled students are defined by NCES as:
• Ages 5 through 17 (AGE2015), and in a grade equivalent of at least kindergarten and nothigher than grade 12.
If the parent received the PFI-Homeschool survey, the variable indicating the gradeequivalence is GRADEEQ.
If the parent received the PFI-Enrolled survey, the grade variable is GRADE.
• Receiving instruction at home instead of at a public or private school either all or most ofthe time.
If the parent received the PFI-Homeschool survey (QTYPE), it is because the parentindicated on the first-stage screener survey that the child receives instruction at homeand is therefore considered to be receiving instruction at home.
If the parent received the PFI-Enrolled survey and marked “Yes” for the question, “Isthis child being schooled at home instead of at school for some classes or subjects?”(HOMESCHLX) and also indicated that the child is homeschooled for either “someclasses or subject areas” or “all classes or subject areas” when asked “Which of thefollowing statements best describes your homeschooling arrangement for this child?”(HMSCHARR), the child was considered to be receiving instruction at home.
• Excluding students who were enrolled in public or private school more than 25 hours perweek (HSSCHR) and students who were homeschooled only because of temporaryillness (HSILLX).4
4 In 2012 HMSCHARR, HSSCHR, and HSILLX were not asked on the PFI-Enrolled questionnaire. Therefore, it was not possible to identify homeschoolers in the same way from the PFI-Enrolled and PFI-Homeschooled surveys. For this reason an adjustment was used to estimate the homeschooling rates in 2012. This adjustment was not needed in 2016 because these questions were added to the PFI-Enrolled questionnaire allowing for full-time and part-time homeschoolers to be consistently identified across PFI questionnaires.
Table 7 provides the distribution and rate of homeschooling. The percentage distribution provides the breakdown of child and family characteristics among homeschoolers (e.g., among homeschoolers, the percentage who live in each type of locale code). The homeschooling rate is the percentage of ALL students who are homeschooled within each characteristic subgroup (e.g., the percentage of students who are homeschooled within each locale group).
Table 8. Reasons for homeschooling Unlike the other variables used in this report, the data for tables 7 and 8 come from the PFI-Enrolled and the PFI-Homeschool surveys but are restricted to homeschoolers. See the glossary
35
entry above about “homeschooled students and homeschooling rate” for details about how NCES defined homeschoolers.
Homeschooling parents were asked whether they chose to homeschool their child to provide religious instruction (HSRELGON); to provide moral instruction (HSMORAL); because of a concern about the school environment such as safety, drugs, or negative peer pressure (HSSAFETYX); because of dissatisfaction with the academic instruction at other schools (HSDISSATX); to provide a nontraditional approach (HSALTX); because the child has special needs that they believed the school could not or would not meet (HSSPCLNDX); because the child has a physical or mental problem that has lasted six months or more (HSDISABLX); or for other reasons beyond those listed (HSOTHERX). Parents were asked to mark “yes” to all reasons that applied.
Parents were also asked to indicate the most important reason for homeschooling their child (HSMOSTX) based on the list in the previous question. These choices included the variables listed above.

This page is intentionally left blank.

37
Appendix C: Standard Error Tables

38
Table C-1. Standard errors for table 1: Percentage of students in kindergarten through grade 12 whose parents reported school-initiated communication practices, by method of communication and selected school, student, and family characteristics: 2015–16
Characteristic
Number of students in
kindergarten through
grade 12 (thousands)
Method by which school communicated with parents
Notes or e-mail about
student
Newsletters, memos, e-mail,
or notices addressed to all
parents Telephone call
about student Total 157.8 0.6 0.4 0.7 School type Public, assigned 308.0 0.7 0.6 0.9 Public, chosen 239.6 1.7 1.1 1.6 Private, religious 150.8 2.0 1.0 1.8 Private, nonreligious 92.0 3.6 1.2 3.8 School size Under 300 233.7 2.2 1.5 1.7 300–599 328.4 1.1 0.7 1.4 600–999 312.5 1.1 0.8 1.1 1,000 or more 282.1 1.2 1.1 1.3 Locale of student’s household City 391.4 1.3 0.9 1.4 Suburban 356.0 0.8 0.5 0.9 Town 178.3 1.7 1.6 2.4 Rural 232.9 1.7 1.1 1.2 Student’s sex Male 348.4 0.9 0.7 0.9 Female 323.8 0.8 0.5 1.1 Student’s race/ethnicity White, non-Hispanic 225.7 0.8 0.6 0.8 Black, non-Hispanic 28.9 2.1 1.4 2.2 Hispanic 103.6 1.4 0.9 1.6 Asian or Pacific Islander, non-Hispanic 191.1 3.0 3.7 2.4 Other, non-Hispanic 152.4 3.1 1.3 3.0 Student’s grade level Kindergarten–2nd grade 144.9 1.7 1.2 1.6 3rd–5th grade 136.4 1.2 0.8 1.5 6th–8th grade 155.0 1.3 1.0 1.2 9th–12th grade 121.6 1.1 0.7 1.0
See notes at end of table.
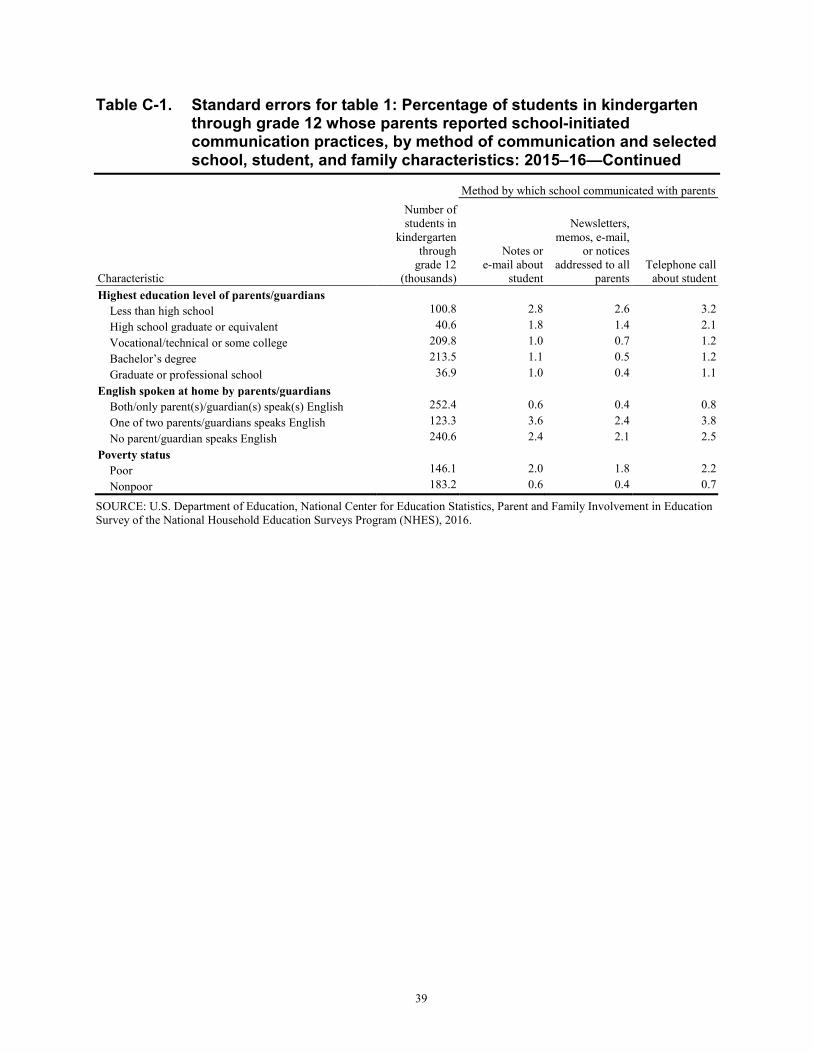
39
Table C-1. Standard errors for table 1: Percentage of students in kindergarten through grade 12 whose parents reported school-initiated communication practices, by method of communication and selected school, student, and family characteristics: 2015–16—Continued
Characteristic
Number of students in
kindergarten through
grade 12 (thousands)
Method by which school communicated with parents
Notes or e-mail about
student
Newsletters, memos, e-mail,
or notices addressed to all
parents Telephone call
about student Highest education level of parents/guardians Less than high school 100.8 2.8 2.6 3.2 High school graduate or equivalent 40.6 1.8 1.4 2.1 Vocational/technical or some college 209.8 1.0 0.7 1.2 Bachelor’s degree 213.5 1.1 0.5 1.2 Graduate or professional school 36.9 1.0 0.4 1.1 English spoken at home by parents/guardians Both/only parent(s)/guardian(s) speak(s) English 252.4 0.6 0.4 0.8 One of two parents/guardians speaks English 123.3 3.6 2.4 3.8 No parent/guardian speaks English 240.6 2.4 2.1 2.5 Poverty status Poor 146.1 2.0 1.8 2.2 Nonpoor 183.2 0.6 0.4 0.7
SOURCE: U.S. Department of Education, National Center for Education Statistics, Parent and Family Involvement in Education Survey of the National Household Education Surveys Program (NHES), 2016.

40
Table C-2. Standard errors for table 2: Percentage of students in kindergarten through grade 12 whose parents reported participation in school-related activities and mean number of meetings or activities, by selected school, student, and family characteristics: 2015–16
Characteristic
Number of students in
kindergarten through
grade 12 (thousands)
Participation in school activities by parent or other household member
Attended a general
school or PTO/PTA
meeting
Attended regularly
scheduled parent- teacher
conference
Attended a school or
class event
Volunteered or served
on school committee
Participated in school
fundraising
Met with a guidance
counselor
Mean number of
meetings or activities at
child's school
Total 157.8 0.5 0.5 0.5 0.7 0.6 0.6 0.08 School type Public, assigned 308.0 0.6 0.6 0.7 0.7 0.8 0.6 0.09 Public, chosen 239.6 0.9 1.2 1.3 1.7 1.6 1.7 0.23 Private, religious 150.8 1.5 1.5 1.4 2.1 1.7 1.9 0.48 Private, nonreligious 92.0 1.3 2.8 4.1 4.4 3.9 3.9 0.61 School size Under 300 233.7 1.7 1.4 1.8 2.4 2.3 1.9 0.26 300–599 328.4 0.6 0.8 1.0 1.1 1.4 1.1 0.16 600–999 312.5 0.7 0.8 1.1 1.3 1.1 1.0 0.18 1,000 or more 282.1 1.1 1.3 1.1 1.1 1.4 1.2 0.15 Locale of student’s household City 391.4 1.0 1.1 1.3 1.4 1.2 1.3 0.15 Suburban 356.0 0.7 0.9 0.8 0.9 1.0 0.9 0.12 Town 178.3 1.5 1.7 1.8 2.0 2.3 1.8 0.28 Rural 232.9 1.0 1.3 1.2 1.7 1.4 1.2 0.28 Student’s sex Male 348.4 0.8 0.7 1.0 0.8 0.8 0.8 0.11 Female 323.8 0.6 0.8 0.6 0.9 1.0 0.8 0.13 Student’s race/ethnicity White, non-Hispanic 225.7 0.5 0.7 0.6 0.8 0.8 0.6 0.13 Black, non-Hispanic 28.9 1.7 1.6 2.0 1.8 2.4 2.4 0.19 Hispanic 103.6 1.0 1.4 1.3 1.5 1.4 1.4 0.18 Asian or Pacific Islander, non-Hispanic 191.1 3.6 2.3 2.4 3.0 2.8 3.5 0.20 Other, non-Hispanic 152.4 1.3 2.1 2.0 3.0 3.0 3.3 0.36 Student’s grade level Kindergarten–2nd grade 144.9 1.4 0.8 1.2 1.9 1.6 1.2 0.18 3rd–5th grade 136.4 0.8 1.0 1.2 1.5 1.5 1.1 0.19 6th–8th grade 155.0 0.8 1.1 1.3 1.2 1.4 1.4 0.16 9th–12th grade 121.6 0.9 1.1 1.0 0.9 1.1 1.0 0.19 See notes at end of table.

41
Table C-2. Standard errors for table 2: Percentage of students in kindergarten through grade 12 whose parents reported participation in school-related activities and mean number of meetings or activities, by selected school, student, and family characteristics: 2015–16—Continued
Characteristic
Number of students in
kindergarten through
grade 12 (thousands)
Participation in school activities by parent or other household member
Attended a general
school or PTO/PTA
meeting
Attended regularly
scheduled parent- teacher
conference
Attended a school or
class event
Volunteered or served
on school committee
Participated in school
fundraising
Met with a guidance
counselor
Mean number of
meetings or activities at
child's school
Highest education level of parents/guardians Less than high school 100.8 3.0 2.7 2.7 2.7 2.6 3.0 0.27 High school graduate or equivalent 40.6 1.3 1.5 1.7 2.0 1.8 1.8 0.15 Vocational/technical or some college 209.8 0.6 0.8 0.9 0.9 1.2 1.1 0.19 Bachelor’s degree 213.5 0.6 1.0 0.7 1.2 1.1 0.9 0.18 Graduate or professional school 36.9 0.5 0.8 0.6 1.0 0.9 1.0 0.23 English spoken at home by parents/guardians Both/only parent(s)/guardian(s) speak(s) English 252.4 0.5 0.6 0.6 0.7 0.6 0.6 0.09 One of two parents/guardians speaks English 123.3 2.4 3.2 3.2 3.9 3.7 3.6 0.67 No parent/guardian speaks English 240.6 2.3 2.4 2.2 2.3 2.0 2.6 0.20 Poverty status Poor 146.1 1.7 1.9 1.8 1.8 1.8 2.0 0.19 Nonpoor 183.2 0.5 0.5 0.6 0.8 0.7 0.6 0.10
SOURCE: U.S. Department of Education, National Center for Education Statistics, Parent and Family Involvement in Education Survey of the National Household Education Surveys Program (NHES), 2016.

42
Table C-3. Standard errors for table 3: Percentage of students in kindergarten through grade 12 whose parents reported satisfaction with school characteristics and amount of homework, by selected school, student, and family characteristics: 2015–16
Characteristic
Number of students in kindergarten
through grade 12 (thousands)
Parent reports of being “very satisfied” Amount of homework assigned is
“about right”With
the school
With teachers student had
this year
With academic standards of
the school
With order and discipline
at the school
With the way school staff interacts with parents
Total 157.8 0.7 0.6 0.7 0.7 0.6 0.6 School type
Public, assigned 308.0 0.8 0.7 0.9 0.8 0.8 0.7 Public, chosen 239.6 1.8 1.6 1.8 1.6 1.7 1.6 Private, religious 150.8 1.8 1.5 1.7 1.7 1.7 1.8 Private, nonreligious 92.0 2.8 3.5 2.9 4.0 3.8 3.0
School size Under 300 233.7 2.0 2.1 2.2 2.2 2.1 1.6 300–599 328.4 1.3 1.2 1.4 1.3 1.3 1.0 600–999 312.5 1.3 1.3 1.4 1.2 1.3 1.2 1,000 or more 282.1 1.2 1.2 1.1 1.2 1.1 1.1
Locale of student’s household City 391.4 1.5 1.4 1.7 1.5 1.5 1.1 Suburban 356.0 0.9 0.9 1.0 0.9 0.9 0.8 Town 178.3 2.5 2.1 2.3 2.2 2.2 1.8 Rural 232.9 1.7 1.7 1.7 1.6 1.6 1.4
Student’s sex Male 348.4 1.0 0.8 0.9 1.0 0.9 0.8
Female 323.8 1.0 0.9 1.1 1.0 1.0 0.8 Student’s race/ethnicity
White, non-Hispanic 225.7 0.8 0.8 0.9 0.8 0.8 0.8 Black, non-Hispanic 28.9 2.0 2.2 2.1 2.1 2.0 1.5 Hispanic 103.6 1.5 1.5 1.6 1.7 1.7 1.4 Asian or Pacific Islander, non-Hispanic 191.1 2.8 3.1 3.0 3.0 3.1 2.5 Other, non-Hispanic 152.4 2.6 2.6 2.8 2.5 2.7 3.1
See notes at end of table.
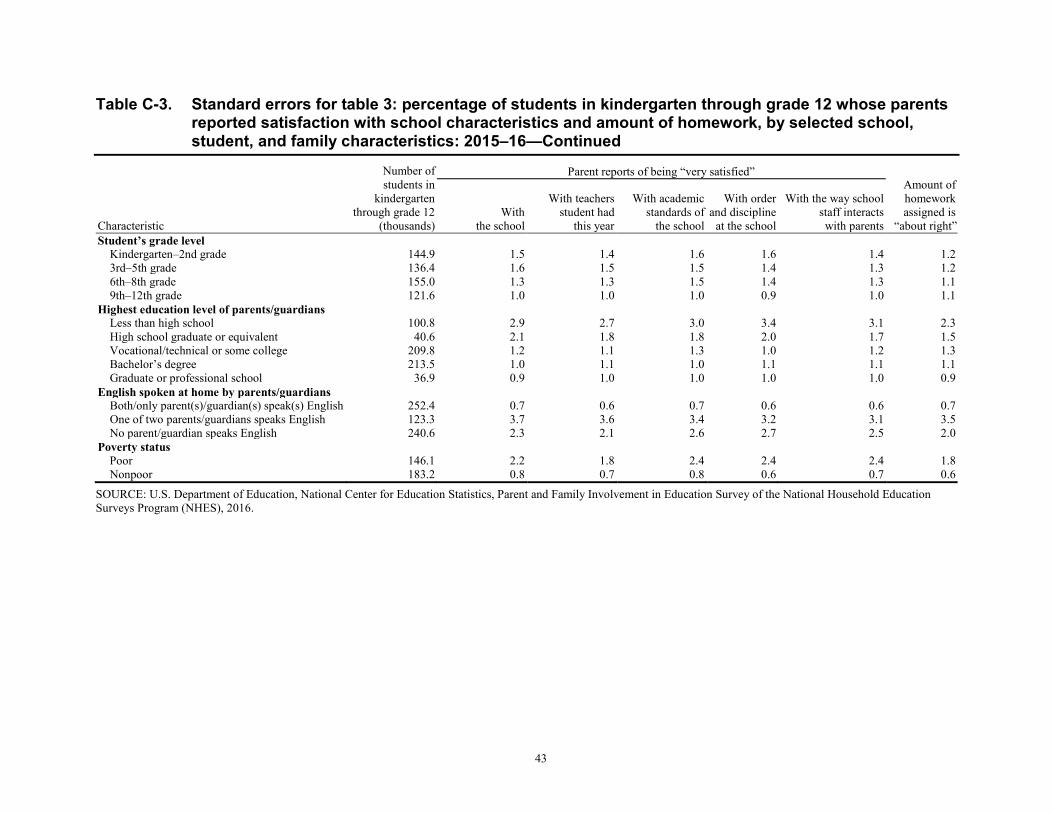
43
Table C-3. Standard errors for table 3: percentage of students in kindergarten through grade 12 whose parents reported satisfaction with school characteristics and amount of homework, by selected school, student, and family characteristics: 2015–16—Continued
Characteristic
Number of students in
kindergarten through grade 12
(thousands)
Parent reports of being “very satisfied” Amount of homework assigned is
“about right”With
the school
With teachers student had
this year
With academic standards of
the school
With order and discipline
at the school
With the way school staff interacts with parents
Student’s grade level Kindergarten–2nd grade 144.9 1.5 1.4 1.6 1.6 1.4 1.2 3rd–5th grade 136.4 1.6 1.5 1.5 1.4 1.3 1.2 6th–8th grade 155.0 1.3 1.3 1.5 1.4 1.3 1.1 9th–12th grade 121.6 1.0 1.0 1.0 0.9 1.0 1.1
Highest education level of parents/guardians Less than high school 100.8 2.9 2.7 3.0 3.4 3.1 2.3 High school graduate or equivalent 40.6 2.1 1.8 1.8 2.0 1.7 1.5 Vocational/technical or some college 209.8 1.2 1.1 1.3 1.0 1.2 1.3 Bachelor’s degree 213.5 1.0 1.1 1.0 1.1 1.1 1.1 Graduate or professional school 36.9 0.9 1.0 1.0 1.0 1.0 0.9
English spoken at home by parents/guardians Both/only parent(s)/guardian(s) speak(s) English 252.4 0.7 0.6 0.7 0.6 0.6 0.7 One of two parents/guardians speaks English 123.3 3.7 3.6 3.4 3.2 3.1 3.5 No parent/guardian speaks English 240.6 2.3 2.1 2.6 2.7 2.5 2.0
Poverty status Poor 146.1 2.2 1.8 2.4 2.4 2.4 1.8 Nonpoor 183.2 0.8 0.7 0.8 0.6 0.7 0.6
SOURCE: U.S. Department of Education, National Center for Education Statistics, Parent and Family Involvement in Education Survey of the National Household Education Surveys Program (NHES), 2016.

44
Table C-4. Standard errors for table 4: Percentage of students in kindergarten through grade 12 whose parents reported that students do homework outside of school, a place is set aside in the home for students to do homework, and an adult checks that homework is done, by selected school, student, and family characteristics: 2015–16
Characteristic
Number of students
in kindergarten through
grade 12 (thousands)
Student does homework outside of
school
Among students that do homework outside of school
Place in home is set aside for
homework
Adult in household always checks that homework is done
Total 157.8 0.3 0.5 0.6 School type Public, assigned 308.0 0.4 0.6 0.7 Public, chosen 239.6 0.7 1.6 1.7 Private, religious 150.8 1.1 1.6 1.9 Private, nonreligious 92.0 3.8 3.5 4.0 School size Under 300 233.7 2.0 1.3 1.7 300–599 328.4 0.5 0.9 1.1 600–999 312.5 0.6 1.0 0.9 1,000 or more 282.1 0.5 0.8 1.3 Locale of student’s household City 391.4 0.8 0.9 1.2 Suburban 356.0 0.4 0.8 1.0 Town 178.3 1.3 2.3 2.0 Rural 232.9 0.8 1.1 1.4 Student’s sex Male 348.4 0.6 0.7 0.9 Female 323.8 0.4 0.8 0.9 Student’s race/ethnicity White, non-Hispanic 225.7 0.4 0.7 0.7 Black, non-Hispanic 28.9 1.4 1.7 1.8 Hispanic 103.6 0.8 1.2 1.5 Asian or Pacific Islander, non-Hispanic 191.1 1.1 1.9 3.3 Other, non-Hispanic 152.4 1.3 1.7 2.6 Student’s grade level Kindergarten–2nd grade 144.9 1.0 1.2 1.2 3rd–5th grade 136.4 0.4 1.1 1.3 6th–8th grade 155.0 0.6 1.1 1.2 9th–12th grade 121.6 0.8 0.8 0.8
See notes at end of table.

45
Table C-4. Standard errors for table 4: Percentage of students in kindergarten through grade 12 whose parents reported that students do homework outside of school, a place is set aside in the home for students to do homework, and an adult checks that homework is done, by selected school, student, and family characteristics: 2015–16—Continued
Characteristic
Number of students
in kindergarten through
grade 12 (thousands)
Student does homework outside of
school
Among students that do homework outside of school
Place in home is set aside for
homework
Adult in household always checks that homework is done
Highest education level of parents/guardians Less than high school 100.8 2.2 2.3 3.1 High school graduate or equivalent 40.6 1.0 1.5 1.8 Vocational/technical or some college 209.8 0.5 0.8 1.1 Bachelor’s degree 213.5 0.6 1.0 1.1 Graduate or professional school 36.9 0.5 0.9 1.1 English spoken at home by parents/guardians Both/only parent(s)/guardian(s) speak(s) English 252.4 0.3 0.6 0.6 One of two parents/guardians speaks English 123.3 2.0 2.6 3.0 No parent/guardian speaks English 240.6 1.4 2.1 2.4 Poverty status Poor 146.1 1.3 1.7 2.0 Nonpoor 183.2 0.3 0.6 0.6 SOURCE: U.S. Department of Education, National Center for Education Statistics, Parent and Family Involvement in Education Survey of the National Household Education Surveys Program (NHES), 2016.

46
Table C-5. Standard errors for table 5: Percentage of students in grades 6 through 12 whose parents reported expectations of specific educational attainment levels, by selected school, student, and family characteristics: 2015–16
Characteristic
Number of students in
grades 6 through 12
(thousands)
Parent expects student to
Receive less than a high
school diploma Graduate from
high school
Attend vocational or technical school
after high school Attend 2 or more
years of college
Earn a bachelor’s
degree
Earn a graduate or professional
degree Total 152.3 0.2 0.6 0.4 0.5 0.7 0.8 School type Public, assigned 197.7 0.2 0.7 0.6 0.7 0.9 0.9 Public, chosen 127.3 0.5 1.0 1.1 1.5 1.8 2.1 Private, religious 96.1 † 0.9 0.9 1.6 2.6 3.0 Private, nonreligious 51.0 † † † 1.2 5.6 5.6 School size Under 300 122.9 0.8 1.7 1.5 2.2 2.3 2.2 300–599 212.1 0.2 1.6 1.1 1.5 1.7 1.9 600–999 187.4 0.4 1.5 1.0 1.0 1.4 1.7 1,000 or more 208.2 0.3 0.5 0.6 0.8 1.0 1.1 Locale of student’s household City 189.2 0.4 1.2 0.7 1.1 1.3 1.7 Suburban 218.1 0.2 0.7 0.7 0.7 0.9 1.2 Town 118.8 † 1.5 1.5 3.1 2.3 2.5 Rural 150.2 0.4 1.4 1.2 1.4 1.4 1.5 Student’s sex Male 235.9 0.3 0.9 0.7 0.8 0.9 1.1 Female 258.2 0.2 0.7 0.4 0.8 1.1 1.2 Student’s race/ethnicity White, non-Hispanic 214.0 0.3 0.7 0.6 0.8 0.9 1.0 Black, non-Hispanic 136.6 0.5 2.2 1.4 1.3 1.7 2.5 Hispanic 166.3 0.3 1.3 1.1 1.3 1.6 1.9 Asian or Pacific Islander, non-Hispanic 89.6 † 0.8 † 1.8 3.2 3.4 Other, non-Hispanic 97.4 † 2.0 1.3 2.5 2.6 3.9 Student’s grade level 6th–8th grade 155.0 0.2 1.0 0.6 0.9 1.0 1.4 9th–12th grade 121.6 0.3 0.7 0.6 0.7 0.9 0.9
See notes at end of table.

47
Table C-5. Standard errors for table 5: Percentage of students in grades 6 through 12 whose parents reported expectations of specific educational attainment levels, by selected school, student, and family characteristics: 2015–16—Continued
Characteristic
Number of students in
grades 6 through 12
(thousands)
Parent expects student to
Receive less than a high
school diploma Graduate from
high school
Attend vocational or technical school
after high school Attend 2 or more
years of college
Earn a bachelor’s
degree
Earn a graduate or professional
degree Highest education level of parents/guardians Less than high school 158.9 1.0 2.9 2.3 2.5 2.7 3.1 High school graduate or equivalent 176.6 0.5 1.9 1.2 1.6 1.6 2.4 Vocational/technical or some college 164.6 0.3 0.7 0.9 1.1 1.3 1.3 Bachelor’s degree 168.7 0.2 0.5 0.7 0.6 1.2 1.2 Graduate or professional school 108.3 0.2 0.3 0.3 0.6 1.2 1.2 English spoken at home by parents/guardians Both/only parent(s)/guardian(s) speak(s) English 204.9 0.2 0.6 0.5 0.6 0.7 0.8 One of two parents/guardians speaks English 86.9 † 2.7 1.5 3.5 3.0 5.6 No parent/guardian speaks English 156.9 0.6 2.0 1.3 1.4 2.6 3.1 Poverty status Poor 191.8 0.5 2.4 1.1 2.0 1.8 2.7 Nonpoor 249.5 0.2 0.4 0.5 0.6 0.7 0.8 † Not applicable. SOURCE: U.S. Department of Education, National Center for Education Statistics, Parent and Family Involvement in Education Survey of the National Household Education Surveys Program (NHES), 2016.

48
Table C-6. Standard errors for table 6: Percentage of students in kindergarten through grade 12 whose parents reported participation in various activities, by selected school, student, and family characteristics: 2015–16
Characteristic
Number of students in
kindergarten through
grade 12 (thousands)
Activities in the past month
Visited library
Visited bookstore
Gone to a play,
a concert, or other
live show
Visited an art gallery, a museum,
or a historical site
Visited a zoo or an aquarium
Attended a community/
religious/ ethnic event
Attended athletic/ sporting
event Total 157.8 0.7 0.6 0.6 0.6 0.6 0.6 0.6 School type
Public, assigned 308.0 0.8 0.8 0.6 0.7 0.7 0.8 0.7 Public, chosen 239.6 1.7 1.4 1.6 1.5 1.7 1.5 1.9 Private, religious 150.8 2.0 1.9 1.9 1.9 1.4 2.1 1.8 Private, nonreligious 92.0 4.3 4.6 4.6 4.1 3.7 3.9 3.9
School size Under 300 233.7 2.0 2.0 2.1 1.8 2.2 2.2 2.4 300–599 328.4 1.1 1.2 1.0 1.1 1.1 1.0 1.3 600–999 312.5 1.2 1.1 1.2 1.1 1.2 1.2 1.2 1,000 or more 282.1 1.0 1.0 1.1 1.1 0.9 1.3 1.3
Locale of student’s household City 391.4 1.2 1.2 1.1 1.0 1.2 1.4 1.3 Suburban 356.0 1.0 0.9 0.9 0.9 0.9 1.0 1.0 Town 178.3 2.3 2.4 1.8 1.7 2.1 2.1 2.1 Rural 232.9 1.5 1.1 1.5 1.2 1.4 1.6 1.7
Student’s sex Male 348.4 0.9 0.8 0.9 0.9 0.9 0.9 0.9
Female 323.8 0.9 0.9 0.8 0.9 1.0 0.9 1.0 Student’s race/ethnicity
White, non-Hispanic 225.7 0.9 0.7 0.7 0.8 0.8 0.8 0.9 Black, non-Hispanic 28.9 2.1 1.7 2.0 1.9 1.7 2.1 2.2 Hispanic 103.6 1.2 1.5 1.5 1.4 1.4 1.5 1.5 Asian or Pacific Islander, non-Hispanic 191.1 3.2 2.7 2.3 2.1 2.1 3.3 2.0 Other, non-Hispanic 152.4 3.0 2.8 2.6 2.4 2.6 2.7 2.7
Student’s grade level Kindergarten–2nd grade 144.9 1.6 1.5 1.5 1.2 1.8 1.7 1.5 3rd–5th grade 136.4 1.3 1.4 1.3 1.3 1.5 1.2 1.5 6th–8th grade 155.0 1.4 1.1 1.2 1.1 1.1 1.2 1.5 9th–12th grade 121.6 0.9 0.9 1.0 0.9 0.7 1.0 1.1
See notes at end of table.

49
Table C-6. Standard errors for table 6: Percentage of students in kindergarten through grade 12 whose parents reported participation in various activities, by selected school, student, and family characteristics: 2015–16—Continued
Characteristic
Number of students in
kindergarten through
grade 12 (thousands)
Activities in the past month
Visited library
Visited bookstore
Gone to a play,
a concert, or other
live show
Visited an art gallery, a museum,
or a historical site
Visited a zoo or an aquarium
Attended a community/
religious/ ethnic event
Attended athletic/ sporting
eventHighest education level of parents/guardians
Less than high school 100.8 2.6 2.5 2.5 1.6 2.9 2.7 2.4 High school graduate or equivalent 40.6 1.8 1.5 1.7 1.5 1.8 2.0 1.9 Vocational/technical or some college 209.8 1.3 1.0 1.1 0.9 1.2 1.0 1.1 Bachelor’s degree 213.5 1.1 1.1 1.2 1.2 1.1 1.1 1.3 Graduate or professional school 36.9 1.2 1.1 1.1 1.1 1.0 1.1 1.1
English spoken at home by parents/guardians Both/only parent(s)/guardian(s) speak(s) English 252.4 0.7 0.7 0.6 0.6 0.5 0.6 0.7 One of two parents/guardians speaks English 123.3 3.0 2.8 4.0 2.7 2.9 3.8 3.6 No parent/guardian speaks English 240.6 2.0 2.4 2.1 2.3 2.6 2.5 2.3
Poverty status Poor 146.1 1.7 1.7 1.7 1.3 2.0 2.0 2.0 Nonpoor 183.2 0.7 0.7 0.6 0.6 0.6 0.7 0.7
SOURCE: U.S. Department of Education, National Center for Education Statistics, Parent and Family Involvement in Education Survey of the National Household Education Surveys Program (NHES), 2016.

50
Table C-7. Standard errors for table 7: Percentage distribution of homeschooled students ages 5 through 17 with a grade equivalent of kindergarten through grade 12 and homeschooling rate, by selected student and family characteristics: 2015–16
Characteristic
Number of students 5–17
(thousands) Percentage distribution Homeschooling rate
Total 128.7 † 0.2 Locale of student’s household City 378.9 2.7 0.33 Suburban 350.5 3.4 0.33 Town 180.0 1.7 0.70 Rural 235.4 2.2 0.54 Student’s sex Male 362.3 2.9 0.30 Female 333.5 2.9 0.29 Student’s race/ethnicity White, non-Hispanic 208.1 3.3 0.35 Black, non-Hispanic 44.9 1.6 0.39 Hispanic 95.2 3.3 0.50 Asian or Pacific Islander, non-Hispanic 187.9 0.8 0.42 Other, non-Hispanic 138.8 0.8 0.53 Student’s grade equivalent
Kindergarten–2nd grade 169.8 2.6 0.37 3rd–5th grade 137.0 2.6 0.43 6th–8th grade 147.2 2.4 0.41 9th–12th grade 112.8 2.6 0.40
Highest education level of parents/guardians Less than high school 89.5 3.2 1.02 High school graduate or equivalent 109.1 2.2 0.39 Vocational/technical or some college 213.7 2.7 0.36 Bachelor’s degree 218.4 2.9 0.45 Graduate or professional school 34.5 1.6 0.35 English spoken at home by parents/guardians Both/only parent(s)/guardian(s) speak(s) English 239.6 3.1 0.25 One of two parents/guardians speaks English 126.6 2.1 1.90 No parent/guardian speaks English 240.2 2.2 0.61 Poverty status Poor 152.1 2.7 0.58 Nonpoor 175.2 2.7 0.24 † Not applicable. SOURCE: U.S. Department of Education, National Center for Education Statistics, Parent and Family Involvement in Education Survey of the National Household Education Surveys Program (NHES), 2016.

51
Table C-8. Standard errors for table 8: Percentage of school-age children who were homeschooled, ages 5 through 17 with a grade equivalent of kindergarten through grade 12, by reasons parents gave as important and most important for homeschooling: 2015–16
Important Most important A desire to provide religious instruction 3.0 2.7 A desire to provide moral instruction 2.9 1.3 A concern about environment of other schools 2.4 3.2 A dissatisfaction with academic instruction at other schools 3.0 2.2 A desire to provide a nontraditional approach to child’s education 2.7 1.2 Child has other special needs 1.9 1.3 Child has a physical or mental health problem 1.5 1.2 Child has a temporary illness 0.8 † Other reasons 2.7 1.9
† Not applicable. SOURCE: U.S. Department of Education, National Center for Education Statistics, Parent and Family Involvement in Education Survey of the National Household Education Surveys Program (NHES), 2016.