Parent and Family Involvement in Education: 2002–03
76
U.S. Department of Education Institute of Education Sciences NCES 2005–043 Parent and Family Involvement in Education: 2002–03 E.D. TAB
Transcript of Parent and Family Involvement in Education: 2002–03

U.S. Department of EducationInstitute of Education SciencesNCES 2005–043
Parent and FamilyInvolvement inEducation: 2002–03
E.D. TAB

U.S. Department of EducationInstitute of Education SciencesNCES 2005–043
Parent and FamilyInvolvement inEducation: 2002–03
E.D. TAB
May 2005
Nancy Vaden-KiernanJohn McManusWestat
Chris ChapmanProject OfficerNational Center forEducation Statistics

U.S. Department of EducationMargaret SpellingsSecretary
Institute of Education SciencesGrover J. WhitehurstDirector
National Center for Education StatisticsGrover J. WhitehurstActing Commissioner
The National Center for Education Statistics (NCES) is the primary federal entity for collecting, analyzing, andreporting data related to education in the United States and other nations. It fulfills a congressional mandateto collect, collate, analyze, and report full and complete statistics on the condition of education in the UnitedStates; conduct and publish reports and specialized analyses of the meaning and significance of such statistics;assist state and local education agencies in improving their statistical systems; and review and report oneducation activities in foreign countries.
NCES activities are designed to address high-priority education data needs; provide consistent, reliable, complete,and accurate indicators of education status and trends; and report timely, useful, and high-quality data to theU.S. Department of Education, the Congress, the states, other education policymakers, practitioners, data users,and the general public. Unless specifically noted, all information contained herein is in the public domain.
We strive to make our products available in a variety of formats and in language that is appropriate to avariety of audiences. You, as our customer, are the best judge of our success in communicating informationeffectively. If you have any comments or suggestions about this or any other NCES product or report, we wouldlike to hear from you. Please direct your comments to
National Center for Education StatisticsInstitute of Education SciencesU.S. Department of Education1990 K Street NWWashington, DC 20006–5651
May 2005
The NCES World Wide Web Home Page address is http://nces.ed.gov.The NCES World Wide Web Electronic Catalog is http://nces.ed.gov/pubsearch.
Suggested Citation
Vaden-Kiernan, N., and McManus, J. (2005). Parent and Family Involvement in Education: 2002–03 (NCES2005–043). U.S. Department of Education, National Center for Education Statistics. Washington, DC: U.S.Government Printing Office.
For ordering information on this report, write to
U.S. Department of EducationED PubsP.O. Box 1398Jessup, MD 20794–1398
or call toll free 1–877–4ED–Pubs or order online at http://www.edpubs.org.
Content ContactChris Chapman(202) 502–[email protected]://nces.ed.gov/nhes

iii
Acknowledgements
The authors would like to thank Chris Chapman, Jerry West, Shelley Burns, Marilyn Seastrom, Holly Spurlock, Frank Johnson, Robert Lerner, and Val Plisko from the National Center for Education Statistics; Lisa Bridges of the Institute of Education Sciences; and Sandy Eyster, Stacey Bielick, Robert Stillwell, Lauren Gilbertson, and Zeyu Xu from the Education Statistics Services Institute for their helpful suggestions and reviews of the report. At Westat, we would also like to thank Mary Hagedorn, the director of the NHES Program at Westat; Kevin O’Donnell; and Ying Long. Finally, we would like to thank the parents who provided the data upon which the report is based.

iv
This page is intentionally blank.

v
Table of Contents
Section Page Acknowledgments ................................................................................................................................. iii Highlights ............................................................................................................................................... 1 References ............................................................................................................................................ 55 Appendix A: Technical Notes ............................................................................................................. 56
Appendix B: Glossary ......................................................................................................................... 60
List of Tables
Table Page
1. Percentage of students in grades K through 12 whose parents reported school-initiated communication practices, by means of communication and selected characteristics: 2002–03 ....................................................................................................................................... 5 1a. Standard errors of the percentage of students in grades K through 12 whose parents reported school-initiated communication practices, by means of communication and selected characteristics: 2002–03 .............................................................................................................. 6 2. Percentage of students in grades K through 12 whose parents reported school-initiated provision of information, by information topic and selected characteristics: 2002–03 .............. 7 2a. Standard errors of the percentage of students in grades K through 12 whose parents reported school-initiated provision of information, by information topic and selected characteristics:
2002–03 ....................................................................................................................................... 9 3. Percentage of students in grades K through 12 whose parents reported participation in school- related activities, by activity type and selected characteristics: 2002–03 ................................. 11 3a. Standard errors of the percentage of students in grades K through 12 whose parents reported participation in school-related activities, by activity type and selected characteristics: 2002–03 ..................................................................................................................................... 13 4. Percentage of students in grades K through 12 who have homework whose parents reported involvement in homework activities, by activity type, frequency, and selected characteristics:
2002–03 ..................................................................................................................................... 15 4a. Standard errors of the percentage of students in grades K through 12 who have homework whose parents reported involvement in homework activities, by activity type, frequency, and
selected characteristics: 2002–03 .............................................................................................. 17 5. Percentage of students in grades K through 3 whose parents reported reading to student, by frequency and selected characteristics: 2002–03 ...................................................................... 19 5a. Standard errors of the percentage of students in grades K through 3 whose parents reported reading to student, by frequency and selected characteristics: 2002–03 ................................... 20

vi
List of Tables (Continued)
Table Page
6. Percentage of students in grades K through 5 whose parents reported participation in home activities with student in the past week, by type of involvement and selected characteristics:
2002–03 ..................................................................................................................................... 21 6a. Standard errors of the percentage of students in grades K through 5 whose parents reported participation in home activities with student in the past week, by type of involvement and
selected characteristics: 2002–03 .............................................................................................. 22 7. Percentage of students in grades 6 through 12 whose parents reported participation in home activities with student in the past week, by type of activity and selected characteristics: 2002–03 ..................................................................................................................................... 23 7a. Standard errors of the percentage of students in grades 6 through 12 whose parents reported participation in home activities with student in the past week, by type of activity and selected characteristics: 2002–03 .............................................................................................. 24
8. Percentage of students in grades K through 12 whose parents reported outings with student in the past month, by type of outing and selected characteristics: 2002–03 ................. 25
8a. Standard errors of the percentage of students in grades K through 12 whose parents reported outings with student in the past month, by type of outing and selected characteristics: 2002–03 ............................................................................................................ 27
9. Percentage distribution of students in grades K through 12, by statements regarding student's experience in school, parent’s level of agreement with statement, and selected
characteristics: 2002–03 ............................................................................................................ 29
9a. Standard errors of the percentage distribution of students in grades K through 12, by statements regarding student's experience in school, parent’s level of agreement with statement, and selected characteristics: 2002–03 ...................................................................... 31
10. Percentage of students in grades K through 12 whose parents reported educational expectations and plans to help pay for education after high school, by educational attainment
expectation and selected characteristics: 2002–03 .................................................................... 33
10a. Standard errors of the percentage of students in grades K through 12 whose parents reported educational expectations and plans to help pay for education after high school, by educational attainment expectation and selected characteristics: 2002–03 .......................... 35
11. Percentage of students in grades K through 12 who participated in activities in and out of school, by selected activity categories and selected characteristics: 2002–03 .......................... 37
11a. Standard errors of the percentage of students in grades K through 12 who participated in activities in and out of school, by selected activity categories and selected characteristics:
2002–03 ..................................................................................................................................... 39
12. Percentage of students in grades K through 12 whose parents reported satisfaction with school provision of information, by type of information and selected characteristics: 2002–03 ..................................................................................................................................... 41

vii
List of Tables (Continued)
Table Page
12a. Standard errors of the percentage of students in grades K through 12 whose parents reported
satisfaction with school provision of information, by type of information and selected characteristics: 2002–03 ........................................................................................................... 43
13. Percentage of students in grades K through 12 whose parents reported satisfaction with school characteristics, by selected school characteristics and selected characteristics: 2002–03 ..................................................................................................................................... 45
13a. Standard errors of the percentage of students in grades K through 12 whose parents reported
satisfaction with school characteristics, by selected school characteristics and selected characteristics: 2002–03 ............................................................................................................ 47
14. Percentage distribution of public school students in grades K through 12 by school choice and percent of students whose families moved to neighborhood for students to attend school, by household and student characteristics: 2002–03 ...................................................... 49 14a. Standard errors of the percentage distribution of public school students in grades K through 12 by school choice and percent of students whose families moved to neighborhood for
students to attend school, by household and student characteristics: 2002–03 .......................... 50
15. Percentage of students with disabilities in grades K through 12 who received services from public and private sources, by source of services and selected characteristics: 2002–03 ......... 51
15a. Standard errors of the percentage of students with disabilities in grades K through 12 who received services from public and private sources, by source of services and selected
characteristics: 2002–03 ............................................................................................................ 53 B-1 Poverty definition for Parent and Family Involvement in Education (PFI) analysis ................ 60

1
Highlights This report presents data on parents’ and families’ involvement in their children’s education in the United States. The data are from the Parent and Family Involvement in Education Survey of the 2003 National Household Education Surveys Program (PFI-NHES:2003). The survey was completed by parents of over 12,000 children in kindergarten through grade 12. Data highlights are shown below, along with examples of questions for each topic area of the questionnaire. The NHES:2003 sample was selected using random digit dial (RDD) methods, and the data were collected using computer-assisted telephone interviewing (CATI) technology. The sample for the 2003 survey is nationally representative of all children in kindergarten through grade 12 enrolled in regular school or homeschooled in the 50 states and the District of Columbia. A Screener was used to collect information on household composition and interview eligibility. Screener interviews had a weighted Screener unit response rate of 65 percent. In households with one eligible child, the child was selected for PFI with certainty. In households with two eligible children, both were selected for PFI with certainty. If there were more than two eligible children/youth, then two were sampled with equal probability. The parent interview had a weighted unit response rate of 83 percent using base weights. The overall unit response rate for the Parent and Family Involvement in Education Survey in 2003 was 54 percent. A unit nonresponse bias analysis was undertaken for NHES:2003. (See Montaquila et al. forthcoming.) The analysis of unit nonresponse bias showed no evidence of bias in estimates computed with nonresponse adjusted weights from the PFI-NHES:2003 survey. The results presented below were chosen to highlight some of the findings in the tables. To test the differences between estimates, Student’s t statistics were calculated. All differences reported were significant at the .05 level. More information about the statistical test used is in the Technical Notes section of this report, along with a discussion of sampling methodology. Many of the tables include estimates for students in kindergarten through grade 12. However, some tables are divided into estimates for students in kindergarten through grade 5 or in grades 6 through 12. This is because for some topic areas (e.g., home activities), different questions were asked of parents of younger children than of parents of older children. Similarly, while a common set of selected school, household, and student characteristics are repeated across most tables, there are occasional variations in either the characteristics, the population, or both that are designed to fit particular data items. Students who were homeschooled were excluded from all of the tables. School Practices Encouraging Parents’ Involvement Parents were asked about school communication with families, such as sending the family personal notes or e-mails specifically about their child; sending newsletters, memos, or notices; and calling the family on the telephone. Parents were also asked about school practices to provide information to parents, such as information about their child’s performance and their opportunities to volunteer at the school.
As the student’s grade level increased, relatively fewer parents reported that schools sent home notes or e-mails. Relatively more parents of fourth- and fifth-graders reported that schools sent home notes or e-mails specifically about their children (55 percent) than parents of students in sixth to eighth grade (49 percent) (table 1). Similarly, more parents of students in 6th to 8th grade reported that schools sent home notes or e-mails specifically about their children (49 percent) than parents of students in 9th and 10th grade (42 percent).

2
Parents’ Involvement in Their Children’s School Parents were asked if they had attended a general school meeting, a regularly scheduled parent-teacher conference, or a school or class event. They were also asked if they had acted as a volunteer or served on a school committee and if they had participated in fundraising for the school.
The percentage of students in kindergarten through grade 12 whose parents reported (in a single-item question) that they had acted as a volunteer at their children’s schools or served on a school committee was higher for students in private schools that were either church related or not church related (70 and 63 percent) than for students in public schools that were either assigned or selected by parents1 (38 and 40 percent) (table 3).
The percentage of students whose parents had attended a general school meeting was higher in households where
parents had completed higher levels of education. Specifically, the percentage of students whose parents reported that they had attended a general school meeting was higher for children whose parents had attended graduate or professional school (93 percent) or completed college (93 percent) than for children whose parents had completed only a high school education or the equivalent (84 percent), and children whose parents had completed less than a high school education (70 percent) (table 3).
Parents’ Involvement in Their Children’s Homework Parents were asked about the frequency with which the student did homework at home and the number of hours the student spent doing homework. They were also asked if there is a place in their home set aside for the student to do homework, if an adult in the household checks that homework is done, and the number of days per week that persons inside or outside the household help with homework.
In kindergarten through grade 12, 95 percent of children had parents who reported they assisted with homework (table 4). In addition, 85 percent of children in kindergarten through grade 12 had parents who reported that an adult in the household checked that homework was done.
Overall, 90 percent of students in kindergarten through grade 12 had a place in their homes set aside for doing
homework (table 4). Relatively fewer children of parents with less than a high school diploma had a place in their homes set aside for homework (80 percent), compared to children whose parents had completed a high school education or more—90 percent for high school education or the equivalent, 91 percent for vocational/technical education after high school or some college, 89 percent for completed college, and 92 percent for attended graduate or professional school.
Parents’ Involvement With Their Children in Nonschool Activities Parents of students in kindergarten through grade 3 were asked how often someone in the family had read to the student in the past week. Parents of students in kindergarten through grade 12 were asked about home activities with the student in the past week and outings with the student in the past month.
In kindergarten through grade 5, the percentage of students whose parents reported they had played sports, active games, or exercised with them increased as parents’ education level increased. Specifically, the percentage of students in kindergarten through grade 5 whose parents reported that they had played sports, active games, or exercised with their children was lower for children whose parents had completed less than a high school education (68 percent) than for children whose parents’ highest educational attainment was a high school education or the equivalent (77 percent), children whose parents had completed vocational or technical education after high school or some college (80 percent), children whose parents had completed college (84 percent), and children whose parents had attended graduate or professional school (87 percent) (table 6).
1 The analysis in this report divides private school students into those attending private, church-related and private, not church-related schools. Public school students are divided into those attending public assigned and public chosen schools.

3
The percentage of students in kindergarten through grade 12 whose parents reported taking them to a public library in the past month was higher for Asian students (65 percent) than for White, non-Hispanic (41 percent), Black, non-Hispanic (49 percent), or Hispanic students (44 percent) (table 8).
Student Experiences With Their Schools Parents were asked about the extent to which they agreed or disagreed with statements about whether the student finds his or her schoolwork challenging, whether the student enjoys school, whether most students and teachers in the student’s school respect each other, and whether the school makes it easy for the family to be involved.
The percentage of students in kindergarten through grade 12 whose parents reported that they “strongly agreed” that the student’s school makes it easy for the family to be involved was higher for students in households above the poverty level (45 percent) than for students in households at or below the poverty level (35 percent) (table 9).
Parents’ Expectations and Planned Financial Support for Their Children’s Postsecondary Education Parents were asked about the highest education level they expected their children to attain. Those who expected their children to continue education after high school were also asked questions about their plans to help pay for their children’s education after high school.
The percentage of students in kindergarten through grade 12 whose parents expected their children to earn a graduate or professional degree was higher among students in private schools that were not church related (48 percent) than in other types of private and public schools (28 to 41 percent) (table 10).
Among students in kindergarten through grade 12 whose parents expected them to continue their education after
high school, the percentage whose parents planned to help pay for their children’s postsecondary education was higher in households where parents had completed higher levels of education. Specifically, the percentage of students whose parents reported that they planned to help their children pay for education after high school was higher for children whose parents had attended graduate or professional school (93 percent) or completed college (91 percent) than for children whose parents‘ highest educational attainment was vocational or technical education after high school or some college (81 percent), children whose parents had completed only a high school education or the equivalent (75 percent), and children whose parents had completed less than a high school education (59 percent) (table 10).
Student Activities in and out of School Parents were asked whether the student participated in school activities. They were also asked about student participation in a variety of out-of-school activities, such as music lessons, sports, and educational programs.
In kindergarten through grade 12, the percentage of students who reportedly participated in school activities increased as parents’ education level increased. Specifically, the percentage of students in kindergarten through grade 12 whose parents reported that their children participated in school activities was higher for students whose parents had attended or completed graduate or professional school (70 percent) than for students whose parents’ highest level of education completed was a vocational or technical education after high school or some college (58 percent), only a high school education or the equivalent (49 percent), and less than a high school education (35 percent) (table 11).
Parents’ Satisfaction With School Parents were asked how well the school did at providing information in various areas related to the child and the school (e.g., their child’s performance, opportunities to volunteer at the school). Parents were also asked about their satisfaction with the school, their children’s teachers in 2002–03, the academic standards of the school, and order and discipline at the school. In addition, parents were asked about the amount of homework assigned and the amount of standardized testing at the school.

4
The percentage of students in kindergarten through grade 12 whose parents reported their children’s school did “very well” at providing information about the student’s performance was lower among students in public, assigned schools (58 percent) than in public schools selected by parents and private schools (64 to 76 percent) (table 12).
The percentage of students in kindergarten through grade 12 whose parents reported being “very satisfied” with
their school was higher for students whose parents had graduated from college (64 percent) or attended graduate or professional school (64 percent) than for students whose parents’ highest education was a high school education or the equivalent (59 percent) or less than a high school education (56 percent) (table 13).
School Choice Parents of public school students were asked if their children were in a regularly assigned school or a school that they chose. They were also asked whether the family had moved to the neighborhood so that the student would be eligible for the school.
The percentage of public school students in kindergarten through grade 12 whose parents reported that their children attended a public school of choice was higher for Black, non-Hispanic students (25 percent) and Asian or Pacific Islander, non-Hispanic students (22 percent) than for White, non-Hispanic students (13 percent) (table 14). The percentage of public school students in kindergarten through grade 12 whose parents reported their children attended a public school of choice was also higher for Black, non-Hispanic students (25 percent) than for Hispanic students (14 percent).
The percentage of public school students in kindergarten through grade 12 whose parents reported they moved to
the neighborhood so that their child would be eligible for the school was higher for students whose parents had graduated from college (29 percent) or attended graduate or professional school (35 percent) than for children whose parents had completed vocational or technical education after high school or some college (24 percent), children whose parents’ highest education was a high school education or the equivalent (24 percent), or children whose parents had less than a high school education (22 percent) (table 14).
Services Provided for Students With Disabilities Parents of students with disabilities were asked about the sources of services received for their children’s special health needs (e.g., the local school district, a doctor, a clinic, or other health care provider), Individualized Education Program (IEP) services, and their children’s participation in special education.
The percentage of students with disabilities in kindergarten through grade 12 whose parents reported that their children received services through an IEP and that the family worked with the school to develop or change the student’s IEP was lowest for students whose parents did not have a high school diploma (71 percent) and highest for students whose parents had attended graduate or professional school (96 percent) (table 15).
The percentage of students with disabilities in kindergarten through grade 12 whose parents reported that their
children received services through an IEP and that the family worked with the school to develop or change the student’s IEP was higher for White, non-Hispanic students (92 percent) than for Black, non-Hispanic students (81 percent), and higher for both White, non-Hispanic (92 percent) and Asian or Pacific Islander, non-Hispanic students (93 percent) than for Hispanic students (75 percent) (table 15).

5
Table 1. Percentage of students in grades K through 12 whose parents reported school-initiated
communication practices, by means of communication and selected characteristics: 2002–03
Means by which school communicated with parents Characteristic Number of students in
grades K through 12 (thousands)
Notes or e-mail about student
Newsletters, memos, or notices Telephone
Total 51,388 49 91 42
School type
Public, assigned ................................................ 37,875 49 91 41 Public, chosen ................................................... 7,915 49 90 45 Private, church-related ...................................... 4,317 51 97 39 Private, not church-related ............................... 1,280 60 95 57
School schedule
Traditional ......................................................... 47,768 50 92 42 Year-round ........................................................ 3,620 44 84 47
Household poverty status
Above poverty level .......................................... 41,418 50 93 41 At or below poverty level ................................. 9,970 45 85 47
Parents’ language
Both/only parent(s) speak(s) English .............. 45,505 51 92 42 One of two parents speaks English .................. 1,090 42 88 40 No parent speaks English ................................. 4,793 37 82 41
Student’s grade level1
K – 1st grade ..................................................... 7,823 55 96 45 2nd – 3rd grade ................................................. 7,696 54 96 45 4th – 5th grade .................................................. 8,368 55 96 43 6th – 8th grade .................................................. 12,170 49 90 43 9th – 10th grade ................................................ 7,783 42 85 38 11th – 12th grade .............................................. 7,543 38 85 39
Student’s race/ethnicity
White, non-Hispanic ......................................... 31,931 51 93 40 Black, non-Hispanic ......................................... 8,165 50 87 51 Hispanic ............................................................. 8,250 44 86 44 Asian or Pacific Islander, non-Hispanic .......... 1,453 37 92 38 Other, non-Hispanic .......................................... 1,588 56 95 44
Student’s sex Male .............................................................. 26,328 53 91 46 Female ........................................................... 25,060 45 92 39
1 Students whose parents reported that their classes were “ungraded” were excluded from the analyses of grade level. NOTE: Students who were homeschooled were excluded from the table. Detail may not sum to totals because of rounding. SOURCE: U.S. Department of Education, National Center for Education Statistics, Parent and Family Involvement in Education Survey of the 2003 National Household Education Surveys Program (PFI-NHES:2003).

6
Table 1a. Standard errors of the percentage of students in grades K through 12 whose parents reported
school-initiated communication practices, by means of communication and selected characteristics: 2002–03
Means by which school communicated with parents
Characteristic Number of students in
grades K through 12 (thousands)
Notes or e-mail about student
Newsletters, memos, or notices Telephone
Total ............................................................. 94.8 0.6 0.3 0.5
School type
Public, assigned ................................................. 288.1 0.7 0.4 0.7 Public, chosen ................................................... 208.3 1.5 0.8 1.3 Private, church-related ...................................... 165.0 2.1 0.7 1.8 Private, not church-related ............................... 87.1 3.4 1.3 3.1
School schedule
Traditional ......................................................... 172.8 0.6 0.3 0.5 Year-round ........................................................ 165.5 2.1 1.5 2.3
Household poverty status
Above poverty level .......................................... 180.1 0.6 0.3 0.6 At or below poverty level ................................. 178.3 1.4 1.1 1.2
Parents’ language
Both/only parent(s) speak(s) English .............. 194.9 0.6 0.3 0.6 One of two parents speaks English .................. 85.9 3.4 2.0 3.5 No parent speaks English ................................. 157.9 1.6 1.3 2.0
Student’s grade level1
K – 1st grade ..................................................... 32.5 1.3 0.5 1.7 2nd – 3rd grade ................................................. 24.5 1.4 0.5 1.4 4th – 5th grade ................................................. 30.1 1.4 0.6 1.2 6th – 8th grade .................................................. 45.0 1.1 0.7 1.1 9th – 10th grade ................................................ 28.4 1.5 0.9 1.3 11th – 12th grade .............................................. 42.8 1.4 1.1 1.2
Student’s race/ethnicity
White, non-Hispanic ......................................... 178.3 0.7 0.4 0.7 Black, non-Hispanic ......................................... 36.1 1.6 1.2 1.5 Hispanic ............................................................. 21.5 1.4 0.9 1.2 Asian or Pacific Islander, non-Hispanic .......... 113.2 3.3 1.8 3.6 Other, non-Hispanic .......................................... 124.7 3.7 1.3 3.3
Student’s sex Male ................................................................... 282.6 0.8 0.4 0.7 Female ............................................................... 272.3 0.8 0.5 0.9
1 Students whose parents reported that their classes were “ungraded” were excluded from the analyses of grade level. NOTE: Students who were homeschooled were excluded from the table. Detail may not sum to totals because of rounding. SOURCE: U.S. Department of Education, National Center for Education Statistics, Parent and Family Involvement in Education Survey of the 2003 National Household Education Surveys Program (PFI-NHES:2003).

7
Table 2. Percentage of students in grades K through 12 whose parents reported school-initiated provision of information, by information topic and selected characteristics: 2002–03
Topics about which school provided information 1
Characteristic Number of students in
grades K through 12
(thousands) Student’s
performance
What children
of the student’s
age are like
Opportunities to volunteer
How to help
student learn at
home Community
services
How to help with
homework
Why student is placed in particular groups or
classes
How to help
student plan for college 2
How to help
student plan for
work 2 Total ................................... 51,388 93 81 91 82 79 83 79 73 63
School type
Public, assigned ....................... 37,875 93 80 91 82 78 83 78 73 62Public, chosen ......................... 7,915 91 81 90 84 79 84 80 72 66Private, church-related ............ 4,317 97 90 97 86 84 88 83 75 62Private, not church-related ..... 1,280 97 89 93 82 75 83 77 79 64
School schedule
Traditional ............................... 47,768 93 81 92 82 79 83 79 73 63Year-round .............................. 3,620 93 85 89 83 76 84 79 66 57
Household poverty status
Above poverty level ................ 41,418 93 81 92 83 79 83 79 75 64At or below poverty level ....... 9,970 93 81 87 81 76 82 78 66 60
Parents’ language
Both/only parent(s) speak(s) English ................ 45,505 93 80 92 83 79 83 79 74 63One of two parents speaks English ............................... 1,090 94 88 92 86 83 88 81 66 63No parent speaks English ....... 4,793 92 86 85 80 77 85 77 69 63
Student’s grade level3
K – 1st grade ........................... 7,823 93 90 96 93 84 91 80 — —2nd – 3rd grade ....................... 7,696 94 86 96 91 85 90 84 — —4th – 5th grade ......................... 8,368 94 88 97 87 83 87 83 — —6th – 8th grade ......................... 12,170 94 79 90 80 76 82 77 58 509th – 10th grade ....................... 7,783 93 72 84 74 72 75 76 80 7111th – 12th grade .................... 7,543 89 72 86 72 74 74 73 89 75
Student’s race/ethnicity
White, non-Hispanic ............... 31,931 93 80 93 82 79 83 79 75 64Black, non-Hispanic ............... 8,165 94 80 91 82 77 83 79 70 58Hispanic ................................... 8,250 92 84 87 82 79 84 79 69 61Asian or Pacific Islander, non-Hispanic ..................... 1,453 95 90 93 90 84 92 80 76 71Other, non-Hispanic ................ 1,588 93 78 92 83 79 86 78 62 56See notes at end of table.

8
Table 2. Percentage of students in grades K through 12 whose parents reported school-initiated provision of information, by information topic and selected characteristics: 2002–03—Continued
Topics about which school provided information 1
Characteristic Number of students in
grades K through 12
(thousands) Student’s
performance
What children
of the student’s
age are like
Opportunities to volunteer
How to help
student learn at
home Community
services
How to help with
homework
Why student is placed in particular groups or
classes
How to help
student plan for college 2
How to help
student plan for
work 2 Total ............................... 51,388 93 81 91 82 79 83 79 73 63
Student’s sex Male ................................ 26,328 93 81 91 82 78 84 80 72 63Female ............................ 25,060 92 81 92 83 79 83 78 74 62
— Not available. 1 Parents of students in grades K through 12 were asked to rate school performance relative to the provision of seven types of information (items 1-7 in the list below). Parents of students in grades 6 through 12 were asked to rate school performance for the provision of nine types of information (items 1-9 in the list that follows): (1) letting them know between report cards about student’s school performance; (2) helping them understand what children of the student’s age are like; (3) making them aware of chances to volunteer at school; (4) helping them help their child learn at home; (5) providing information about community services; (6) providing information about how to help with homework; (7) providing information about why their child was placed in particular groups or classes; (8) providing information on how to help their child plan for college or vocational school; and (9) providing information about how to help their child plan for work after completing his or her education. Response options were does it “very well,” “just okay,” “not very well,” “doesn’t do it at all,” or “don’t know.” Answers of “don’t know” were imputed. The table estimates indicate the percentage of parents who said their child’s school provided information on the given topic (i.e., parents who gave any answer other than “doesn’t do it at all”). 2 This question was only asked of parents of children in grades 6 through 12. 3 Students whose parents reported that their classes were “ungraded” were excluded from the analyses of grade level. NOTE: Students who were homeschooled were excluded from the table. Detail may not sum to totals because of rounding. SOURCE: U.S. Department of Education, National Center for Education Statistics, Parent and Family Involvement in Education Survey of the 2003 National Household Education Surveys Program (PFI-NHES:2003).

9
Table 2a. Standard errors of the percentage of students in grades K through 12 whose parents reported school-initiated provision of information, by information topic and selected characteristics:
2002–03
Topics about which school provided information 1
Characteristic Number of students in
grades K through 12
(thousands) Student’s
performance
What children of
the student’s
age are likeOpportunities
to volunteer
How to help
student learn at
home Community
services
How to help with
home-work
Why student is placed in particular groups or
classes
How to help student plan for college2
How to help student
plan for
work2 Total ..................................... 94.8 0.3 0.4 0.4 0.5 0.5 0.4 0.4 0.6 0.6
School type
Public, assigned ........................ 288.1 0.4 0.5 0.4 0.6 0.6 0.5 0.6 0.7 0.7 Public, chosen ........................... 208.3 0.8 1.2 0.8 1.0 1.2 0.9 1.1 1.9 1.9 Private, church-related ............. 165.0 0.6 1.1 0.7 1.4 1.6 1.1 1.3 2.3 2.4 Private, not church-related ....... 87.1 1.2 1.9 1.6 2.7 3.0 2.9 2.8 3.7 3.9
School schedule
Traditional ................................. 172.8 0.3 0.4 0.4 0.5 0.5 0.4 0.5 0.6 0.6 Year-round ................................ 165.5 1.1 1.6 1.4 1.6 2.0 1.6 1.6 2.6 2.9
Household poverty status
Above poverty level ................. 180.1 0.3 0.5 0.3 0.5 0.6 0.5 0.4 0.6 0.7 At or below poverty level ......... 178.3 0.7 1.1 1.0 1.1 1.3 1.1 1.3 1.6 1.9
Parents’ language
Both/only parent(s) speak(s) English ................. 194.9 0.3 0.5 0.4 0.5 0.5 0.4 0.4 0.7 0.7 One of two parents speaks English ................................ 85.9 1.5 2.4 1.8 2.2 2.2 2.1 2.8 4.4 4.3 No parent speaks English ......... 157.9 1.1 1.3 1.4 1.7 1.6 1.3 1.6 2.3 2.3
Student’s grade level3
K – 1st grade ............................. 32.5 0.7 0.8 0.6 0.7 1.0 0.9 1.2 — — 2nd – 3rd grade ......................... 24.5 0.6 1.0 0.5 0.8 1.0 0.8 0.9 — — 4th – 5th grade .......................... 30.1 0.6 0.8 0.5 1.0 1.2 0.9 0.9 — — 6th – 8th grade .......................... 45.0 0.5 0.9 0.8 0.9 0.9 0.9 0.9 1.0 1.0 9th – 10th grade ........................ 28.4 0.7 1.3 1.2 1.3 1.3 1.3 1.2 1.1 1.2 11th – 12th grade ...................... 42.8 0.8 1.1 0.9 1.2 1.1 1.1 1.2 0.9 1.2
Student’s race/ethnicity
White, non-Hispanic ................. 178.3 0.4 0.5 0.4 0.6 0.7 0.6 0.6 0.8 0.8 Black, non-Hispanic ................. 36.1 0.6 1.3 0.9 1.2 1.3 1.2 1.3 2.0 1.9 Hispanic .................................... 21.5 0.7 1.0 0.9 1.0 1.1 0.9 1.1 1.6 1.7 Asian or Pacific Islander, non-Hispanic ...................... 113.2 1.3 1.8 2.0 1.9 2.8 1.7 2.4 4.2 4.0 Other, non-Hispanic ................. 124.7 1.8 2.4 1.5 2.2 2.5 1.9 2.8 4.3 5.1
See notes at end of table.

10
Table 2a. Standard errors of the percentage of students in grades K through 12 whose parents reported school-initiated provision of information, by information topic and selected characteristics: 2002–03—Continued
Topics about which school provided information 1
Characteristic Number of students in
grades K through 12
(thousands) Student’s
performance
What children of
the student’s
age are like
Opportunities to volunteer
How to help
student learn at
home Community
services
How to help with
home-work
Why student is placed in particular groups or
classes
How to help student
plan for college2
How to help
student plan
for work2
Total ...................................... 94.8 0.3 0.4 0.4 0.5 0.5 0.4 0.4 0.6 0.6
Student’s sex Male ....................................... 282.6 0.4 0.6 0.5 0.6 0.6 0.6 0.6 0.8 0.9 Female ................................... 272.3 0.5 0.6 0.5 0.7 0.7 0.6 0.5 0.9 0.8
— Not available. 1 Parents of students in grades K through 12 were asked to rate school performance relative to the provision of seven types of information (items 1-7 in the list below). Parents of students in grades 6 through 12 were asked to rate school performance for the provision of nine types of information (items 1-9 in the list that follows): (1) letting them know between report cards about student’s school performance; (2) helping them understand what children of the student’s age are like; (3) making them aware of chances to volunteer at school; (4) helping them help their child learn at home; (5) providing information about community services; (6) providing information about how to help with homework; (7) providing information about why their child was placed in particular groups or classes; (8) providing information on how to help their child plan for college or vocational school; and (9) providing information about how to help their child plan for work after completing his or her education. Response options were does it “very well,” “just okay,” “not very well,” “doesn’t do it at all,” or “don’t know.” Answers of “don’t know” were imputed. The table estimates indicate the percentage of parents who said their child’s school provided information on the given topic (i.e., parents who gave any answer other than “doesn’t do it at all”). 2 This question was only asked of parents of children in grades 6 through 12. 3 Students whose parents reported that their classes were “ungraded” were excluded from the analyses of grade level. NOTE: Students who were homeschooled were excluded from the table. Detail may not sum to totals because of rounding. SOURCE: U.S. Department of Education, National Center for Education Statistics, Parent and Family Involvement in Education Survey of the 2003 National Household Education Surveys Program (PFI-NHES:2003).

11
Table 3. Percentage of students in grades K through 12 whose parents reported participation in school-related activities, by activity type and selected characteristics: 2002–03
Participation in school activities by parent or other household member
Characteristic Number of students in K
through 12(thousands)
Attended a general school
meeting
Attended regularly-scheduled
parent-teacher
conference
Attended a school or
class event
Acted as volunteer or
served on school
committee
Participated in school
fundraising Total ....................................................................................................... 51,388 88 77 70 42 62
School type
Public, assigned .......................................................................................... 37,875 87 75 68 38 60Public, chosen ............................................................................................ 7,915 85 80 66 40 61Private, church-related ............................................................................... 4,317 96 87 88 70 84Private, not church-related ........................................................................ 1,280 95 84 80 63 63
School schedule
Traditional .................................................................................................. 47,768 88 77 71 42 63Year-round ................................................................................................. 3,620 84 82 60 35 49
Household poverty status
Above poverty level ................................................................................... 41,418 90 78 73 45 66At or below poverty level .......................................................................... 9,970 79 75 57 27 46
Parents’ highest education level
Less than high school ................................................................................ 3,638 70 68 42 16 33High school graduate or equivalent .......................................................... 12,891 84 75 62 30 56Vocational/technical education after high school or some college ........ 16,186 89 78 70 39 63College graduate ........................................................................................ 9,877 93 80 80 55 70Graduate or professional school ............................................................... 8,797 93 79 80 60 71
Parents’ language
Both/only parent(s) speak(s) English ....................................................... 45,505 89 77 72 44 65One of two parents speaks English ........................................................... 1,090 83 79 62 31 44No parent speaks English .......................................................................... 4,793 79 78 52 21 34
Student’s grade level1
K – 1st grade ............................................................................................ 7,823 93 92 71 54 702nd – 3rd grade ........................................................................................ 7,696 94 91 77 53 704th – 5th grade ......................................................................................... 8,368 94 91 78 50 706th – 8th grade ......................................................................................... 12,170 88 75 70 35 619th – 10th grade ....................................................................................... 7,783 83 59 63 30 5011th – 12th grade ..................................................................................... 7,543 74 53 59 31 50
Student’s race/ethnicity
White, non-Hispanic .................................................................................. 31,931 89 76 74 48 67Black, non-Hispanic .................................................................................. 8,165 89 79 63 32 59Hispanic ...................................................................................................... 8,250 83 78 61 28 45Asian or Pacific Islander, non-Hispanic ................................................... 1,453 89 78 65 34 61Other, non-Hispanic ................................................................................... 1,588 87 78 72 40 57
See notes at end of table.

12
Table 3. Percentage of students in grades K through 12 whose parents reported participation in school-related activities, by activity type and selected characteristics: 2002–03—Continued
Participation in school activities by parent or other household member
Characteristic Number of students in K
through 12(thousands)
Attended a general school
meeting
Attended regularly-scheduled
parent-teacher
conference
Attended a school or
class event
Acted as volunteer or
served on school
committee
Participated in school
fundraising Total ....................................................................................................... 51,388 88 77 70 42 62
Student’s sex Male ............................................................................................................ 26,328 87 78 67 41 59 Female ........................................................................................................ 25,060 88 76 73 42 65 Student experiences in school
Student participated in school activities ................................................... 29,616 91 78 84 48 69Teacher or school contacted parent about behavior problems ................ 9,856 86 83 63 34 55Teacher or school contacted parent about schoolwork problems ........... 13,307 88 83 67 36 59
Student grades or marks2
Mostly A’s or excellent ............................................................................. 20,868 91 77 78 50 69Mostly B’s or above average .................................................................... 18,673 87 76 69 40 61Mostly C’s or average ............................................................................... 9,785 82 78 60 32 53Mostly D’s or lower, or below average or failing ................................... 2,062 81 81 43 21 43
1 Students whose parents reported that their classes were “ungraded” were excluded from the analyses of grade level. 2 Parents were asked whether overall, across all subjects, the student got mostly A’s, mostly B’s, mostly C’s, mostly D’s or lower, or whether the student’s school did not give those grades. If the student’s school did not give letter grades (e.g., A, B, C), they were asked whether the parent would describe the student’s work at school as excellent, above average, average, below average, or failing. The two questions about grades or marks were combined for the table. NOTE: Students who were homeschooled were excluded from the table. Detail may not sum to totals because of rounding. SOURCE: U.S. Department of Education, National Center for Education Statistics, Parent and Family Involvement in Education Survey of the 2003 National Household Education Surveys Program (PFI-NHES:2003).

13
Table 3a. Standard errors of the percentage of students in grades K through 12 whose parents reported participation in school-related activities, by activity type and selected characteristics: 2002–03
Participation in school activities by parent or other household member
Characteristic Number of students in K
through 12(thousands)
Attended a general school
meeting
Attended regularly-scheduled
parent-teacher
conference
Attended a school or
class event
Acted as volunteer or
served on school
committee
Participated in school
fundraising Total ....................................................................................................... 94.8 0.4 0.4 0.4 0.6 0.6
School type
Public, assigned .......................................................................................... 288.1 0.5 0.5 0.6 0.7 0.7Public, chosen ............................................................................................ 208.3 0.9 1.3 1.5 1.6 1.8Private, church-related ............................................................................... 165.0 0.7 1.1 1.2 2.0 1.4Private, not church-related ........................................................................ 87.1 1.5 2.5 2.8 3.2 3.0
School schedule
Traditional .................................................................................................. 172.8 0.4 0.4 0.4 0.6 0.6Year-round ................................................................................................. 165.5 1.6 1.4 1.9 2.5 2.2
Household poverty status
Above poverty level ................................................................................... 180.1 0.4 0.5 0.4 0.7 0.6At or below poverty level .......................................................................... 178.3 1.4 1.2 1.5 1.5 1.7
Parents’ highest education level
Less than high school ................................................................................ 205.6 2.0 2.5 2.4 2.0 2.3High school graduate or equivalent .......................................................... 280.2 0.9 0.9 1.3 1.3 1.3Vocational/technical education after high school or some college ........ 333.9 0.6 0.9 0.9 1.0 1.0College graduate ........................................................................................ 281.7 0.7 0.9 0.9 1.4 1.5Graduate or professional school ............................................................... 245.6 0.8 0.9 1.1 1.5 1.2
Parents’ language
Both/only parent(s) speak(s) English ....................................................... 194.9 0.4 0.5 0.5 0.7 0.6One of two parents speaks English ........................................................... 85.9 2.8 3.2 3.4 3.5 3.5No parent speaks English .......................................................................... 157.9 1.6 1.6 1.9 1.6 1.7
Student’s grade level1
K – 1st grade ............................................................................................ 32.5 0.7 0.8 1.3 1.4 1.22nd – 3rd grade ........................................................................................ 24.5 0.8 0.8 1.3 1.4 1.54th – 5th grade ......................................................................................... 30.1 0.7 0.8 0.9 1.4 1.16th – 8th grade ......................................................................................... 45.0 0.7 0.9 1.0 1.1 1.29th – 10th grade ....................................................................................... 28.4 1.2 1.4 1.4 1.3 1.111th – 12th grade ..................................................................................... 42.8 1.3 1.5 1.5 1.3 1.5
Student’s race/ethnicity
White, non-Hispanic .................................................................................. 178.3 0.5 0.6 0.7 0.8 0.7Black, non-Hispanic .................................................................................. 36.1 0.9 1.4 1.5 1.6 1.6Hispanic ...................................................................................................... 21.5 1.0 1.1 1.4 1.2 1.4Asian or Pacific Islander, non-Hispanic ................................................... 113.2 2.1 3.0 3.7 2.7 3.6Other, non-Hispanic ................................................................................... 124.7 2.2 3.2 3.0 3.9 3.8
See notes at end of table.

14
Table 3a. Standard errors of the percentage of students in grades K through 12 whose parents reported participation in school-related activities, by activity type and selected characteristics: 2002–03—Continued
Participation in school activities by parent or other household member
Characteristic Number of students in K
through 12(thousands)
Attended a general school
meeting
Attended regularly-scheduled
parent-teacher
conference
Attended a school or
class event
Acted as volunteer or
served on school
committee
Participated in school
fundraising Total ....................................................................................................... 94.8 0.4 0.4 0.4 0.6 0.6
Student’s sex Male ............................................................................................................ 282.6 0.5 0.6 0.7 0.9 0.7 Female ........................................................................................................ 272.3 0.6 0.6 0.6 0.8 0.7 Student experiences in school
Student participated in school activities ................................................... 284.2 0.4 0.6 0.4 0.9 0.7Teacher or school contacted parent about behavior problems ................ 210.9 0.9 1.0 1.2 1.2 1.2Teacher or school contacted parent about schoolwork problems ........... 245.7 0.8 0.9 1.0 1.1 1.1
Student grades or marks2
Mostly A’s or excellent ............................................................................. 283.8 0.6 0.8 0.7 0.9 0.9Mostly B’s or above average .................................................................... 268.1 0.6 0.7 0.7 0.8 0.9Mostly C’s or average ............................................................................... 251.6 1.0 1.2 1.1 1.4 1.2Mostly D’s or lower, or below average or failing ................................... 131.4 2.3 2.5 3.3 2.8 3.0
1 Students whose parents reported that their classes were “ungraded” were excluded from the analyses of grade level. 2 Parents were asked whether overall, across all subjects, the student got mostly A’s, mostly B’s, mostly C’s, mostly D’s or lower, or whether the student’s school did not give those grades. If the student’s school did not give letter grades (e.g., A, B, C), they were asked whether the parent would describe the student’s work at school as excellent, above average, average, below average, or failing. The two questions about grades or marks were combined for the table. NOTE: Students who were homeschooled were excluded from the table. Detail may not sum to totals because of rounding. SOURCE: U.S. Department of Education, National Center for Education Statistics, Parent and Family Involvement in Education Survey of the 2003 National Household Education Surveys Program (PFI-NHES:2003).

15
Table 4. Percentage of students in grades K through 12 who have homework whose parents reported involvement in homework activities, by activity type, frequency, and selected characteristics: 2002–03
Number of days per week persons inside or outside household helped with homework1
Characteristic
Number of students in
grades K through 12
(thousands)
Place in home set aside for
homework
Adult in household
checks that homework
is done No help given
Less than once a week
1 to 2 days a week
3 to 4 days a week
5 or more days a week
Total .............................................................. 49,132 90 85 5 25 34 25 11
School type
Public, assigned ................................................. 36,222 90 85 5 26 34 25 11Public, chosen ................................................... 7,585 90 89 4 20 34 28 13Private, church-related ...................................... 4,174 89 81 5 22 31 27 14Private, not church-related ............................... 1,150 87 76 5 28 32 23 12
School schedule
Traditional ......................................................... 45,727 90 85 5 25 34 25 11Year-round ........................................................ 3,404 87 92 4 13 35 31 16
Household poverty status
Above poverty level .......................................... 39,747 91 84 5 26 33 25 11At or below poverty level ................................. 9,385 86 91 5 17 37 26 15
Parents’ highest education level
Less than high school ....................................... 3,342 80 90 9 17 41 21 12High school graduate or equivalent ................. 12,222 90 89 6 22 34 27 12Vocational/technical education after high school or some college ...................... 15,591 91 86 4 24 34 26 11College graduate ............................................... 9,469 89 82 4 28 33 24 11Graduate or professional school ...................... 8,508 92 78 4 29 32 24 11
Parents’ language
Both/only parent(s) speak(s) English .............. 43,519 91 85 4 26 34 25 11One of two parents speaks English .................. 1,031 88 91 6 14 29 30 20No parent speaks English ................................. 4,582 78 90 9 14 37 26 14
Student’s grade level2 K – 1st grade ..................................................... 7,010 87 100 # 11 30 37 222nd – 3rd grade ................................................. 7,608 89 99 1 ! 10 28 43 194th – 5th grade .................................................. 8,254 91 97 1 14 34 36 166th – 8th grade .................................................. 11,824 91 87 4 26 41 21 89th – 10th grade ................................................ 7,325 91 72 10 39 38 10 311th – 12th grade .............................................. 7,109 88 53 16 49 28 6 2
Student’s race/ethnicity White, non-Hispanic ......................................... 30,450 90 82 5 29 34 23 9Black, non-Hispanic ......................................... 7,929 95 93 4 16 33 29 17Hispanic ............................................................. 7,853 83 92 6 16 36 27 15Asian or Pacific Islander, non-Hispanic .......... 1,404 92 82 7 19 30 29 15Other, non-Hispanic .......................................... 1,496 94 88 5 25 27 32 11
See notes at end of table.
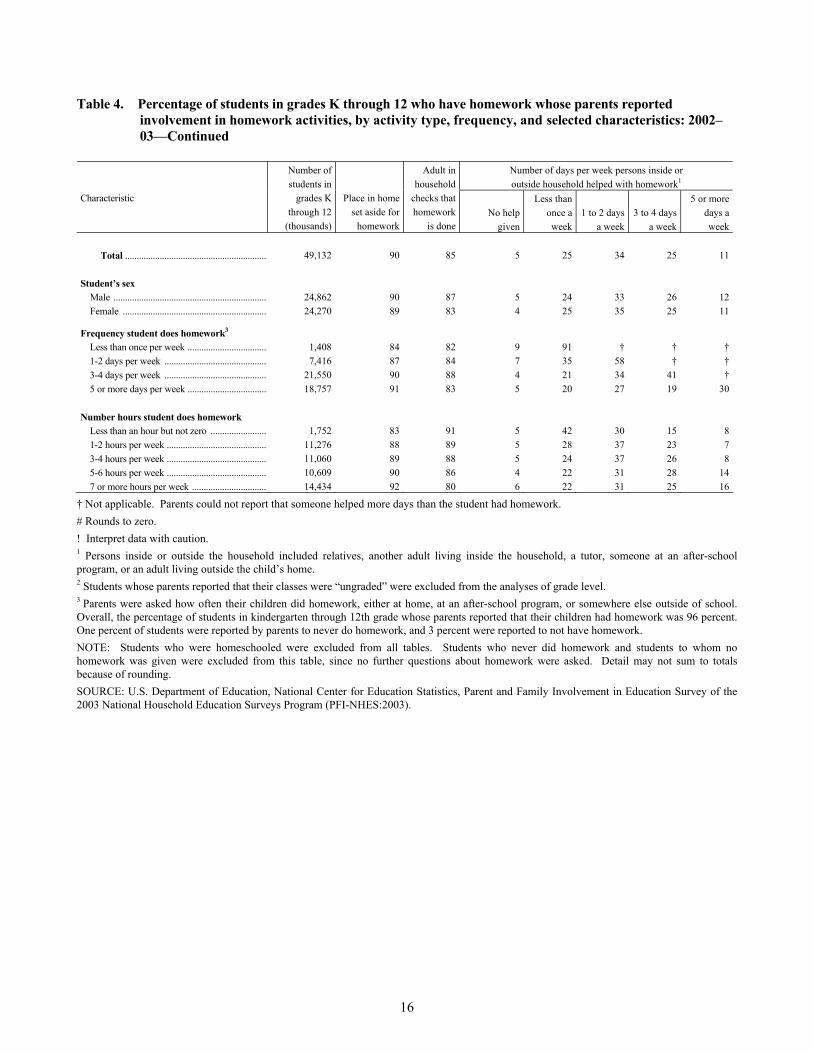
16
Table 4. Percentage of students in grades K through 12 who have homework whose parents reported involvement in homework activities, by activity type, frequency, and selected characteristics: 2002–03—Continued
Number of days per week persons inside or outside household helped with homework1
Characteristic
Number of students in
grades K through 12
(thousands)
Place in home set aside for
homework
Adult in household
checks that homework
is doneNo help
given
Less than once a week
1 to 2 days a week
3 to 4 days a week
5 or more days a week
Total .............................................................. 49,132 90 85 5 25 34 25 11
Student’s sex
Male ................................................................... 24,862 90 87 5 24 33 26 12Female ............................................................... 24,270 89 83 4 25 35 25 11
Frequency student does homework3 Less than once per week ................................... 1,408 84 82 9 91 † † † 1-2 days per week ............................................. 7,416 87 84 7 35 58 † † 3-4 days per week ............................................. 21,550 90 88 4 21 34 41 † 5 or more days per week ................................... 18,757 91 83 5 20 27 19 30 Number hours student does homework Less than an hour but not zero ......................... 1,752 83 91 5 42 30 15 8 1-2 hours per week ............................................ 11,276 88 89 5 28 37 23 7 3-4 hours per week ............................................ 11,060 89 88 5 24 37 26 8 5-6 hours per week ............................................ 10,609 90 86 4 22 31 28 14 7 or more hours per week ................................. 14,434 92 80 6 22 31 25 16
† Not applicable. Parents could not report that someone helped more days than the student had homework. # Rounds to zero. ! Interpret data with caution. 1 Persons inside or outside the household included relatives, another adult living inside the household, a tutor, someone at an after-school program, or an adult living outside the child’s home. 2 Students whose parents reported that their classes were “ungraded” were excluded from the analyses of grade level. 3 Parents were asked how often their children did homework, either at home, at an after-school program, or somewhere else outside of school. Overall, the percentage of students in kindergarten through 12th grade whose parents reported that their children had homework was 96 percent. One percent of students were reported by parents to never do homework, and 3 percent were reported to not have homework. NOTE: Students who were homeschooled were excluded from all tables. Students who never did homework and students to whom no homework was given were excluded from this table, since no further questions about homework were asked. Detail may not sum to totals because of rounding. SOURCE: U.S. Department of Education, National Center for Education Statistics, Parent and Family Involvement in Education Survey of the 2003 National Household Education Surveys Program (PFI-NHES:2003).

17
Table 4a. Standard errors of the percentage of students in grades K through 12 who have homework whose parents reported involvement in homework activities, by activity type, frequency, and selected characteristics: 2002–03
Number of days per week persons inside or outside household helped with homework1
Characteristic
Number of students in
grades K through 12
(thousands)
Place in home set aside for
homework
Adult in household
checks that homework
is done No help given
Less than once a week
1 to 2 days a week
3 to 4 days a week
5 or more days a week
Total .............................................................. 148.3 0.4 0.3 0.2 0.4 0.6 0.5 0.4
School type
Public, assigned ................................................. 286.4 0.4 0.4 0.3 0.5 0.7 0.5 0.4Public, chosen ................................................... 206.4 1.1 0.8 0.5 1.1 1.2 1.3 0.9Private, church-related ...................................... 166.9 1.3 1.7 1.0 1.5 1.7 1.8 1.1Private, not church-related ............................... 81.4 2.3 2.6 1.4 3.3 3.2 3.6 2.1
School schedule
Traditional ......................................................... 210.3 0.4 0.3 0.2 0.4 0.6 0.5 0.4Year-round ........................................................ 156.4 1.4 0.9 0.7 1.3 2.1 2.0 1.5
Household poverty status
Above poverty level .......................................... 193.6 0.4 0.4 0.2 0.5 0.6 0.5 0.4At or below poverty level ................................. 182.8 1.0 1.0 0.6 1.3 1.6 1.3 1.1
Parents’ highest education level
Less than high school ....................................... 200.3 1.7 1.4 1.3 1.8 2.9 1.9 1.7High school graduate or equivalent ................. 261.4 0.7 0.7 0.6 0.9 1.0 1.0 0.7Vocational/technical education after high school or some college ...................... 337.5 0.6 0.7 0.4 0.8 1.1 0.9 0.6College graduate ............................................... 273.2 1.0 1.0 0.5 1.2 1.2 1.0 0.8Graduate or professional school ...................... 247.9 0.8 1.0 0.5 1.1 1.1 1.1 0.9
Parents’ language
Both/only parent(s) speak(s) English .............. 226.4 0.4 0.4 0.2 0.5 0.7 0.6 0.4One of two parents speaks English .................. 76.8 2.4 2.2 1.6 2.2 3.2 3.4 2.5No parent speaks English ................................. 154.4 1.7 0.9 1.1 1.3 1.7 1.4 1.2
Student’s grade level2 K – 1st grade ..................................................... 70.4 1.0 0.2 0.1 0.8 1.4 1.6 1.12nd – 3rd grade ................................................. 30.4 0.8 0.2 0.2 0.9 1.3 1.3 1.14th – 5th grade .................................................. 42.6 0.8 0.5 0.2 1.0 1.3 1.3 1.16th – 8th grade .................................................. 67.9 0.6 0.8 0.4 1.0 1.1 0.9 0.69th – 10th grade ................................................ 54.9 0.8 1.1 0.8 1.3 1.4 0.8 0.411th – 12th grade .............................................. 72.9 1.0 1.3 1.0 1.3 1.3 0.6 0.4
Student’s race/ethnicity White, non-Hispanic ......................................... 197.0 0.6 0.5 0.3 0.6 0.8 0.6 0.4Black, non-Hispanic ......................................... 57.2 0.7 0.9 0.6 1.2 1.5 1.5 1.1Hispanic ............................................................. 49.8 1.0 0.6 0.6 0.9 1.3 1.1 0.9Asian or Pacific Islander, non-Hispanic .......... 106.7 1.9 2.5 1.6 2.5 2.9 3.5 2.5Other, non-Hispanic .......................................... 120.0 1.5 2.5 1.4 2.7 2.7 3.4 2.0
See notes at end of table.

18
Table 4a. Standard errors of the percentage of students in grades K through 12 who have homework whose parents reported involvement in homework activities, by activity type, frequency, and selected characteristics: 2002–03—Continued
Number of days per week persons inside or outside household helped with homework1
Characteristic
Number of students in
grades K through 12
(thousands)
Place in home set aside for
homework
Adult in household
checks that homework
is done No help given
Less than once a week
1 to 2 days a week
3 to 4 days a week
5 or more days a week
Total .............................................................. 148.3 0.4 0.3 0.2 0.4 0.6 0.5 0.4
Student’s sex
Male .................................................................... 270.6 0.5 0.4 0.4 0.6 0.7 0.7 0.5Female ................................................................ 277.5 0.5 0.6 0.3 0.7 0.9 0.7 0.6
Frequency student does homework3 Less than once per week .................................... 77.7 2.0 2.2 1.7 1.7 † † † 1-2 days per week ............................................... 216.5 1.0 0.9 0.8 1.4 1.6 † † 3-4 days per week ............................................... 309.6 0.6 0.5 0.3 0.7 0.9 0.9 † 5 or more days per week .................................... 292.4 0.6 0.7 0.4 0.8 0.8 0.7 0.8 Number hours student does homework Less than an hour but not zero ........................... 94.7 2.6 1.4 1.1 2.6 2.7 2.3 1.5 1-2 hours per week ............................................. 254.6 0.8 0.7 0.5 1.0 1.0 0.9 0.6 3-4 hours per week ............................................. 266.0 0.8 0.7 0.5 1.0 1.2 1.0 0.6 5-6 hours per week ............................................. 212.2 0.7 0.8 0.4 1.0 1.2 1.1 0.8 7 or more hours per week ................................... 270.5 0.6 0.7 0.4 0.9 1.0 0.9 0.7
† Not applicable. Parents could not report that someone helped more days than the student had homework. # Rounds to zero. 1 Persons inside or outside the household included relatives, another adult living inside the household, a tutor, someone at an after-school program, or an adult living outside the child’s home. 2 Students whose parents reported that their classes were “ungraded” were excluded from the analyses of grade level. 3 Parents were asked how often their children did homework, either at home, at an after-school program, or somewhere else outside of school. Overall, the percentage of students in kindergarten through 12th grade whose parents reported that their children had homework was 96 percent. One percent of students were reported by parents to never do homework, and 3 percent were reported to not have homework. NOTE: Students who were homeschooled were excluded from all tables. Students who never did homework and students to whom no homework was given were excluded from this table, since no further questions about homework were asked. Detail may not sum to totals because of rounding. SOURCE: U.S. Department of Education, National Center for Education Statistics, Parent and Family Involvement in Education Survey of the 2003 National Household Education Surveys Program (PFI-NHES:2003).

19
Table 5. Percentage of students in grades K through 3 whose parents reported reading to student, by frequency and selected characteristics: 2002–03
Parent or other family member read to student in past week
Characteristic
Number of students in
grades K through 3
(thousands) Not at all Once or twice Three or more times Every day Total .............................................................. 15,519 10 25 29 36
School type
Public, assigned ................................................. 11,031 10 25 30 35Public, chosen ................................................... 2,537 11 25 29 35Private, church-related ...................................... 1,553 7 25 28 39Private, not church-related ............................... 397 8 ! 15 25 52
School schedule
Traditional ......................................................... 14,178 10 24 30 36Year-round ........................................................ 1,341 7 31 25 37
Household poverty status
Above poverty level .......................................... 12,422 10 24 30 37At or below poverty level ................................. 3,097 10 29 27 34
Parents’ highest education level
Less than high school ....................................... 1,072 18 33 26 23High school graduate or equivalent ................. 3,652 10 29 27 34Vocational/technical education after high school or some college ...................... 4,963 11 26 31 33College graduate ............................................... 3,269 7 22 30 40Graduate or professional school ...................... 2,562 6 17 31 46
Parents’ language
Both/only parent(s) speak(s) English .............. 13,482 10 24 30 37One of two parents speaks English .................. 440 10 21 36 34No parent speaks English ................................. 1,598 11 32 26 31
Student’s grade level1
K – 1st grade 7,823 3 18 32 472nd – 3rd grade ................................................. 7,696 16 32 27 25
Student’s race/ethnicity
White, non-Hispanic ......................................... 9,218 9 23 30 37Black, non-Hispanic ......................................... 2,404 10 30 28 32Hispanic ............................................................. 2,940 10 27 28 35Asian or Pacific Islander, non-Hispanic .......... 462 15 26 24 35Other, non-Hispanic .......................................... 495 9 18 34 40
Student’s sex Male ................................................................... 7,943 10 24 31 35Female ............................................................... 7,575 9 26 28 37
! Interpret data with caution. 1Students whose parents reported that their classes were “ungraded” were excluded from the analyses.
NOTE: Students who were homeschooled were excluded from the table. Detail may not sum to totals because of rounding. SOURCE: U.S. Department of Education, National Center for Education Statistics, Parent and Family Involvement in Education Survey of the 2003 National Household Education Surveys Program (PFI-NHES:2003).

20
Table 5a. Standard errors of the percentage of students in grades K through 3 whose parents reported reading to student, by frequency and selected characteristics: 2002–03
Parent or other family member read to student in past week
Characteristic
Number of students in
grades K through 3
(thousands) Not at all Once or twice Three or more times Every day Total .............................................................. 42.1 0.6 0.8 0.8 0.9
School type
Public, assigned ................................................. 148.5 0.8 1.1 1.1 1.1Public, chosen ................................................... 117.0 1.5 2.2 2.1 2.0Private, church-related ...................................... 80.6 1.3 2.5 2.5 2.8Private, not church-related ............................... 48.4 3.0 3.0 4.1 5.0
School schedule
Traditional ......................................................... 83.7 0.7 0.9 0.9 0.9Year-round ........................................................ 70.8 1.5 3.1 3.0 3.7
Household poverty status
Above poverty level .......................................... 138.3 0.6 1.0 0.9 0.9At or below poverty level ................................. 132.7 1.4 1.9 2.0 2.4
Parents’ highest education level
Less than high school ....................................... 91.1 2.9 3.6 3.1 4.4High school graduate or equivalent ................. 136.4 1.4 1.8 1.8 1.9Vocational/technical education after high school or some college ...................... 165.3 1.2 1.6 1.5 1.5College graduate ............................................... 127.2 1.0 1.7 1.7 1.9Graduate or professional school ...................... 105.5 1.2 1.7 2.4 2.7
Parents’ language
Both/only parent(s) speak(s) English .............. 91.9 0.7 0.9 0.9 0.9One of two parents speaks English .................. 51.5 2.6 3.9 5.7 5.6No parent speaks English ................................. 81.5 1.5 2.9 2.3 2.6
Student’s grade level1
K – 1st grade 32.5 0.5 1.1 1.2 1.32nd – 3rd grade ................................................. 24.5 1.1 1.2 1.1 1.2
Student’s race/ethnicity
White, non-Hispanic ......................................... 114.9 0.8 1.1 1.1 1.0Black, non-Hispanic ......................................... 96.4 1.7 2.8 2.5 2.7Hispanic ............................................................. 86.6 1.2 1.8 1.4 1.9Asian or Pacific Islander, non-Hispanic .......... 58.4 3.9 4.5 4.5 5.3Other, non-Hispanic .......................................... 59.0 2.7 4.0 5.5 4.6
Student’s sex
Male ................................................................... 166.0 0.8 1.2 1.2 1.4Female ............................................................... 162.0 0.8 1.3 1.3 1.2
1Students whose parents reported that their classes were “ungraded” were excluded from the analyses.
NOTE: Students who were homeschooled were excluded from the table. Detail may not sum to totals because of rounding. SOURCE: U.S. Department of Education, National Center for Education Statistics, Parent and Family Involvement in Education Survey of the 2003 National Household Education Surveys Program (PFI-NHES:2003).

21
Table 6. Percentage of students in grades K through 5 whose parents reported participation in home activities with student in the past week, by type of involvement and selected characteristics: 2002–03
Home activities with student in past week
Characteristic
Number of students in
grades K through 5
(thousands)
Told student
storyDid arts
and crafts
Played sports, active games, or
exercised
Involved student in household
chores Worked
on project
Talked about family
or ethnic heritage
Played board games or did
puzzles Total ...................................................................... 23,887 75 75 80 97 61 53 73
School type
Public, assigned ......................................................... 17,063 75 75 81 97 60 51 74Public, chosen ........................................................... 3,941 76 77 78 98 62 57 71Private, church-related .............................................. 2,307 73 71 83 95 62 59 70Private, not church-related ....................................... 576 77 75 80 94 64 56 64
School schedule
Traditional ................................................................. 21,922 75 74 81 97 61 52 73Year-round ................................................................ 1,965 77 79 79 95 56 63 73
Household poverty status
Above poverty level .................................................. 19,064 75 74 81 98 62 51 73At or below poverty level ......................................... 4,823 74 77 77 96 56 62 73
Parents’ highest education level
Less than high school ............................................... 1,664 67 75 68 95 42 60 67High school graduate or equivalent ......................... 5,604 71 75 77 97 58 55 73Vocational/technical education after high school or some college ....................................... 7,786 76 75 80 97 63 51 71College graduate ....................................................... 4,764 78 73 84 97 63 48 76Graduate or professional school .............................. 4,068 77 75 87 98 67 58 74
Parents’ language
Both/only parent(s) speak(s) English ...................... 20,920 75 74 82 98 64 51 74One of two parents speaks English .......................... 614 79 76 82 94 56 75 81No parent speaks English ......................................... 2,353 69 79 70 90 38 66 64
Student’s grade level1
K – 1st grade ............................................................... 7,823 84 89 82 97 61 48 772nd – 3rd grade ........................................................... 7,696 75 74 80 97 60 55 734th – 5th grade ............................................................ 8,368 66 62 79 98 62 57 69
Student’s race/ethnicity
White, non-Hispanic ................................................. 14,419 76 75 82 98 65 45 74Black, non-Hispanic ................................................. 3,765 70 68 79 99 59 67 73Hispanic ..................................................................... 4,220 74 80 76 93 48 65 68Asian or Pacific Islander, non-Hispanic .................. 709 76 71 84 89 59 68 77Other, non-Hispanic .................................................. 773 84 76 83 97 68 68 77
Student’s sex
Male ........................................................................... 12,192 73 70 83 97 63 51 72Female ....................................................................... 11,695 77 80 78 97 59 55 74
1Students whose parents reported that their classes were “ungraded” were excluded from the analyses of grade level. NOTE: Students who were homeschooled were excluded from the table. Detail may not sum to totals because of rounding. SOURCE: U.S. Department of Education, National Center for Education Statistics, Parent and Family Involvement in Education Survey of the 2003 National Household Education Surveys Program (PFI-NHES:2003).

22
Table 6a. Standard errors of the percentage of students in grades K through 5 whose parents reported participation in home activities with student in the past week, by type of involvement and selected characteristics: 2002–03
Home activities with student in past week
Characteristic
Number of students in
grades K through 5
(thousands)
Told student
storyDid arts
and crafts
Played sports, active games, or
exercised
Involved student in household
chores Worked
on project
Talked about family or
ethnic heritage
Played board games or did
puzzles Total ...................................................................... 55.7 0.7 0.7 0.6 0.2 0.9 0.9 0.7
School type
Public, assigned ......................................................... 168.9 0.8 0.8 0.8 0.2 1.1 1.1 0.8 Public, chosen ............................................................ 136.0 2.1 1.8 1.5 0.5 2.2 2.2 2.0 Private, church-related .............................................. 104.4 2.5 2.1 1.9 1.0 2.5 2.4 2.3 Private, not church-related ........................................ 59.5 3.8 4.1 4.1 2.2 4.5 4.5 4.9
School schedule
Traditional .................................................................. 111.2 0.7 0.7 0.6 0.2 1.0 0.9 0.7 Year-round ................................................................. 94.1 2.3 2.0 2.1 1.1 2.8 2.8 2.5
Household poverty status
Above poverty level .................................................. 170.0 0.7 0.8 0.7 0.2 1.0 1.0 0.7 At or below poverty level ......................................... 161.5 1.7 1.8 1.5 0.7 1.9 2.0 1.8
Parents’ highest education level
Less than high school ................................................ 120.3 3.2 3.2 3.1 1.2 3.4 3.0 3.2 High school graduate or equivalent .......................... 163.6 1.6 1.3 1.4 0.6 1.8 1.9 1.4 Vocational/technical education after high school or some college ....................................... 200.6 1.2 1.3 1.1 0.5 1.6 1.6 1.4 College graduate ........................................................ 169.1 1.6 1.6 1.2 0.5 2.1 1.9 1.4 Graduate or professional school ............................... 149.9 1.5 1.5 1.1 0.5 1.7 2.1 1.7
Parents’ language
Both/only parent(s) speak(s) English ....................... 126.0 0.7 0.7 0.6 0.2 1.0 0.9 0.7 One of two parents speaks English .......................... 60.6 3.1 3.8 3.5 2.4 4.2 3.6 3.1 No parent speaks English .......................................... 103.8 2.4 1.6 1.9 1.1 2.0 2.5 2.1
Student’s grade level1
K – 1st grade .............................................................. 32.5 0.9 0.8 1.1 0.4 1.5 1.4 1.2 2nd – 3rd grade .......................................................... 24.5 1.2 1.1 0.9 0.4 1.5 1.3 1.1 4th – 5th grade ........................................................... 30.1 1.2 1.4 1.0 0.4 1.3 1.4 1.2
Student’s race/ethnicity
White, non-Hispanic ................................................. 155.8 1.0 0.9 0.8 0.2 1.1 1.1 0.9 Black, non-Hispanic .................................................. 111.4 2.0 2.1 1.8 0.4 2.2 2.5 1.9 Hispanic ..................................................................... 98.3 1.5 1.4 1.3 0.9 1.7 1.7 1.8 Asian or Pacific Islander, non-Hispanic .................. 82.9 3.7 4.3 3.0 2.6 4.3 4.8 3.8 Other, non-Hispanic .................................................. 77.8 4.4 3.6 3.6 1.2 5.1 5.0 3.8
Student’s sex
Male ............................................................................ 215.7 0.9 1.0 0.8 0.3 1.1 1.2 0.9 Female ........................................................................ 207.6 1.0 1.0 0.9 0.3 1.2 1.3 1.1
1Students whose parents reported that their classes were “ungraded” were excluded from the analyses of grade level. NOTE: Students who were homeschooled were excluded from the table. Detail may not sum to totals because of rounding. SOURCE: U.S. Department of Education, National Center for Education Statistics, Parent and Family Involvement in Education Survey of the 2003 National Household Education Surveys Program (PFI-NHES:2003).

23
Table 7. Percentage of students in grades 6 through 12 whose parents reported participation in home activities with student in the past week, by type of activity and selected characteristics: 2002–03
Home activities with student in past week
Characteristic
Number of students in grades
6 through 12 (thousands)
Worked with student on project
Played a sport or exercised together
Discussed time management
Total ............................................................................. 27,496 44 57 78
School type
Public, assigned ................................................................ 20,807 43 56 77 Public, chosen .................................................................. 3,974 48 60 81 Private, church-related ..................................................... 2,010 45 59 77 Private, not church-related .............................................. 705 40 58 81
School schedule
Traditional ........................................................................ 25,843 44 57 78 Year-round ....................................................................... 1,654 41 58 82
Household poverty status
Above poverty level ......................................................... 22,351 45 56 78 At or below poverty level ................................................ 5,145 43 57 76
Parents’ highest education level
Less than high school ...................................................... 1,972 36 55 78 High school graduate or equivalent ................................ 7,287 43 53 74 Vocational/technical education after high school or some college ....................................... 8,396 47 58 78 College graduate .............................................................. 5,113 46 57 78 Graduate or professional school ..................................... 4,728 44 59 83
Parents’ language
Both/only parent(s) speak(s) English ............................. 24,580 45 57 77 One of two parents speaks English ................................. 476 45 65 86 No parent speaks English ................................................ 2,440 39 55 84
Student’s grade level1
6th – 8th grade .................................................................. 12,170 54 68 78 9th – 10th grade ................................................................ 7,783 38 54 78 11th – 12th grade .............................................................. 7,543 34 41 77
Student’s race/ethnicity
White, non-Hispanic ........................................................ 17,509 46 56 76 Black, non-Hispanic ........................................................ 4,399 39 56 81 Hispanic ............................................................................ 4,030 41 59 85 Asian or Pacific Islander, non-Hispanic ......................... 744 50 60 79 Other, non-Hispanic ......................................................... 815 42 63 72
Student’s sex
Male .................................................................................. 14,131 45 60 79 Female .............................................................................. 13,365 44 53 77
1 Students whose parents reported that their classes were “ungraded” were excluded from the analyses of grade level. NOTE: Students who were homeschooled were excluded from the table. Detail may not sum to totals because of rounding. SOURCE: U.S. Department of Education, National Center for Education Statistics, Parent and Family Involvement in Education Survey of the 2003 National Household Education Surveys Program (PFI-NHES:2003).

24
Table 7a. Standard errors of the percentage of students in grades 6 through 12 whose parents reported participation in home activities with student in the past week, by type of activity and selected characteristics: 2002–03
Home activities with student in past week
Characteristic
Number of students in grades
6 through 12 (thousands)
Worked with student on project
Played a sport or exercised together
Discussed time management
Total .............................................................................. 62.4 0.8 0.7 0.7
School type
Public, assigned ................................................................. 204.6 0.9 0.8 0.8 Public, chosen ................................................................... 155.2 2.1 2.0 1.6 Private, church-related ...................................................... 114.6 2.7 2.7 2.6 Private, not church-related ............................................... 56.8 4.2 4.4 4.0
School schedule
Traditional ......................................................................... 121.5 0.8 0.7 0.8 Year-round ........................................................................ 118.6 2.9 3.3 2.1
Household poverty status
Above poverty level .......................................................... 156.9 0.7 0.8 0.8 At or below poverty level ................................................. 153.2 2.2 2.0 1.9
Parents’ highest education level
Less than high school ....................................................... 129.6 3.0 3.0 2.1 High school graduate or equivalent ................................. 204.9 1.7 1.7 1.6 Vocational/technical education after high school or some college ...................................... 223.6 1.2 1.4 1.0 College graduate ............................................................... 168.0 1.5 1.7 1.5 Graduate or professional school ...................................... 172.8 2.3 1.7 1.4
Parents’ language
Both/only parent(s) speak(s) English .............................. 132.3 0.8 0.8 0.8 One of two parents speaks English .................................. 51.2 5.3 4.6 3.9 No parent speaks English ................................................. 108.7 2.4 2.6 2.0
Student’s grade level1
6th – 8th grade .................................................................. 45.0 1.2 1.1 1.0 9th – 10th grade ................................................................ 28.4 1.2 1.4 1.2 11th – 12th grade .............................................................. 42.8 1.3 1.5 1.3
Student’s race/ethnicity
White, non-Hispanic ......................................................... 163.6 0.9 1.0 0.9 Black, non-Hispanic ......................................................... 109.7 2.4 2.2 1.9 Hispanic ............................................................................. 100.6 1.9 2.2 1.1 Asian or Pacific Islander, non-Hispanic .......................... 69.0 4.2 4.1 3.8 Other, non-Hispanic .......................................................... 82.3 4.5 4.2 5.3
Student’s sex
Male .................................................................................. 180.7 1.1 1.0 1.0 Female .............................................................................. 177.0 1.1 1.0 0.9
1 Students whose parents reported that their classes were “ungraded” were excluded from the analyses of grade level. NOTE: Students who were homeschooled were excluded from the table. Detail may not sum to totals because of rounding. SOURCE: U.S. Department of Education, National Center for Education Statistics, Parent and Family Involvement in Education Survey of the 2003 National Household Education Surveys Program (PFI-NHES:2003).

25
Table 8. Percentage of students in grades K through 12 whose parents reported outings with student in the past month, by type of outing and selected characteristics: 2002–03
Outings with student in past month
Characteristic Number of students in
grades K through 12
(thousands) Visited a
library
Went to a play, concert,
or other live show
Visited an art gallery,
museum, or historical site
Visited a zoo or
aquarium
Attended event
sponsored by religious
group
Attended event
sponsored by community
or ethnic group
Attended athletic or
sporting event
Total .............................................................. 51,388 44 35 20 12 53 24 38
School type
Public, assigned ................................................. 37,875 42 34 18 12 51 23 37 Public, chosen ................................................... 7,915 47 38 24 14 52 27 36 Private, church-related ...................................... 4,317 53 41 25 13 70 26 47 Private, not church-related ............................... 1,280 46 38 32 14 50 28 31
School schedule
Traditional ......................................................... 47,768 43 36 19 12 53 24 38 Year-round ........................................................ 3,620 48 28 21 22 48 21 32
Household poverty status
Above poverty level .......................................... 41,418 44 37 20 11 55 25 39 At or below poverty level ................................. 9,970 42 27 17 16 45 19 32
Parents’ highest education level
Less than high school ....................................... 3,638 32 22 10 15 33 10 19 High school graduate or equivalent ................. 12,891 39 27 15 12 42 18 35 Vocational/technical education after high school or some college ...................... 16,186 41 35 18 11 54 25 39 College graduate ............................................... 9,877 50 40 24 13 62 27 44 Graduate or professional school ...................... 8,797 54 47 29 13 66 30 41
Parents’ language
Both/only parent(s) speak(s) English .............. 45,505 43 36 20 11 55 25 40 One of two parents speaks English .................. 1,090 55 31 23 23 47 23 29 No parent speaks English ................................. 4,793 48 24 18 23 37 14 21
Student’s grade level1
K – 1st grade ..................................................... 7,823 49 34 21 18 52 21 34 2nd – 3rd grade ................................................. 7,696 51 33 22 18 54 25 38 4th – 5th grade .................................................. 8,368 51 39 23 14 57 24 39 6th – 8th grade .................................................. 12,170 47 37 20 11 53 25 41 9th – 10th grade ................................................ 7,783 36 34 17 7 53 24 39 11th – 12th grade .............................................. 7,543 27 30 13 7 48 22 34
See notes at end of table.

26
Table 8. Percentage of students in grades K through 12 whose parents reported outings with student in the past month, by type of outing and selected characteristics: 2002–03—Continued
Outings with student in past month
Characteristic Number of students in
grades K through 12
(thousands) Visited a
library
Went to a play, concert,
or other live show
Visited an art gallery,
museum, or historical site
Visited a zoo or
aquarium
Attended event
sponsored by religious
group
Attended event
sponsored by community
or ethnic group
Attended athletic or
sporting event
Total ............................................................. 51,388 44 35 20 12 53 24 38
Student’s race/ethnicity
White, non-Hispanic ......................................... 31,931 41 36 19 9 54 24 40 Black, non-Hispanic ......................................... 8,165 49 36 22 15 62 29 41 Hispanic ............................................................. 8,250 44 28 18 21 43 17 31 Asian or Pacific Islander, non-Hispanic .......... 1,453 65 39 30 16 50 34 25 Other, non-Hispanic .......................................... 1,588 44 34 24 12 50 24 35
Student’s sex
Male ................................................................... 26,328 39 32 20 12 52 23 41 Female ............................................................... 25,060 48 38 19 13 55 24 35
1 Students whose parents reported that their classes were “ungraded” were excluded from the analyses of grade level. NOTE: Students who were homeschooled were excluded from the table. Detail may not sum to totals because of rounding. SOURCE: U.S. Department of Education, National Center for Education Statistics, Parent and Family Involvement in Education Survey of the 2003 National Household Education Surveys Program (PFI-NHES:2003).

27
Table 8a. Standard errors of the percentage of students in grades K through 12 whose parents reported outings with student in the past month, by type of outing and selected characteristics: 2002–03
Outings with student in past month
Characteristic Number of students in
grades K through 12
(thousands) Visited a
library
Went to a play, concert,
or other live show
Visited an art gallery,
museum, or historical site
Visited a zoo or
aquarium
Attended event
sponsored by religious
group
Attended event
sponsored by community
or ethnic group
Attended athletic or
sporting event
Total ............................................................. 94.8 0.6 0.6 0.6 0.4 0.7 0.4 0.6
School type
Public, assigned ................................................. 288.1 0.7 0.7 0.6 0.5 0.8 0.5 0.7 Public, chosen ................................................... 208.3 1.4 1.3 1.2 0.9 1.5 1.1 1.4 Private, church-related ...................................... 165.0 2.2 2.2 1.6 1.6 1.9 1.7 2.0 Private, not church-related ............................... 87.1 3.3 3.2 3.6 2.3 3.6 2.6 3.2
School schedule
Traditional ......................................................... 172.8 0.6 0.6 0.6 0.4 0.7 0.5 0.7 Year-round ........................................................ 165.5 2.3 1.9 1.7 2.0 2.5 2.0 2.5
Household poverty status
Above poverty level .......................................... 180.1 0.6 0.7 0.6 0.4 0.8 0.5 0.7 At or below poverty level ................................. 178.3 1.7 1.5 1.2 1.0 1.5 1.2 1.6
Parents’ highest education level
Less than high school ....................................... 205.6 2.4 2.3 1.4 1.6 2.8 1.5 1.9 High school graduate or equivalent ................. 280.2 1.1 1.2 1.2 0.9 1.3 1.0 1.3 Vocational/technical education after high school or some college ...................... 333.9 1.1 1.1 0.9 0.6 1.2 0.9 1.3 College graduate ............................................... 281.7 1.2 1.2 1.3 0.9 1.3 1.1 1.3 Graduate or professional school ...................... 245.6 1.6 1.5 1.4 0.9 1.4 1.4 1.5
Parents’ language
Both/only parent(s) speak(s) English .............. 194.9 0.6 0.6 0.6 0.4 0.7 0.5 0.7 One of two parents speaks English .................. 85.9 4.0 3.7 3.5 3.6 3.8 3.4 3.7 No parent speaks English ................................. 157.9 2.0 1.5 1.5 1.9 2.0 1.2 1.6
Student’s grade level1
K – 1st grade ..................................................... 32.5 1.3 1.3 1.0 1.1 1.3 1.2 1.4 2nd – 3rd grade ................................................. 24.5 1.4 1.4 1.1 1.1 1.4 1.3 1.5 4th – 5th grade .................................................. 30.1 1.3 1.2 1.3 0.9 1.3 1.1 1.4 6th – 8th grade .................................................. 45.0 1.2 1.1 1.0 0.7 1.3 0.9 1.1 9th – 10th grade ................................................ 28.4 1.4 1.2 1.0 0.8 1.5 1.0 1.3 11th – 12th grade .............................................. 42.8 1.3 1.1 0.9 0.7 1.6 1.1 1.3
See notes at end of table.

28
Table 8a. Standard errors of the percentage of students in grades K through 12 whose parents reported outings with student in the past month, by type of outing and selected characteristics: 2002–03—Continued
Outings with student in past month
Characteristic Number of students in
grades K through 12
(thousands) Visited a
library
Went to a play, concert,
or other live show
Visited an art gallery,
museum, or historical site
Visited a zoo or
aquarium
Attended event
sponsored by religious
group
Attended event
sponsored by community
or ethnic group
Attended athletic or
sporting event
Total ............................................................. 94.8 0.6 0.6 0.6 0.4 0.7 0.4 0.6
Student’s race/ethnicity
White, non-Hispanic ......................................... 178.3 0.7 0.8 0.7 0.5 1.0 0.6 0.7 Black, non-Hispanic ......................................... 36.1 1.7 1.4 1.2 1.1 1.6 1.4 1.7 Hispanic ............................................................. 21.5 1.4 1.2 1.0 1.3 1.4 1.1 1.3 Asian or Pacific Islander, non-Hispanic .......... 113.2 3.6 3.8 3.0 2.6 3.5 3.3 3.4 Other, non-Hispanic .......................................... 124.7 3.5 3.2 2.7 1.9 4.0 2.9 3.8
Student’s sex
Male ................................................................... 282.6 0.8 0.7 0.7 0.5 0.9 0.7 0.9 Female ............................................................... 272.3 0.8 0.8 0.7 0.6 0.9 0.6 0.8
1 Students whose parents reported that their classes were “ungraded” were excluded from the analyses of grade level. NOTE: Students who were homeschooled were excluded from the table. Detail may not sum to totals because of rounding. SOURCE: U.S. Department of Education, National Center for Education Statistics, Parent and Family Involvement in Education Survey of the 2003 National Household Education Surveys Program (PFI-NHES:2003).

29
Table 9. Percentage distribution of students in grades K through 12, by statements regarding student’s experience in school, parent’s level of agreement with statement, and selected characteristics: 2002–03
Student experiences in school1
Student finds his/her schoolwork challenging Student enjoys school
Most students and teachers in student’s
school respect each other
Student’s school makes it easy for family to be
involved there
Characteristic
Number of students in
grades K through 12
(thousands) SA A D SD SA A D SD SA A D SD SA A D SD Total ............................................................. 51,388 27 60 11 2 40 50 8 2 39 52 6 2 43 50 6 1
School type
Public, assigned ................................................. 37,875 25 61 12 2 38 51 9 3 34 56 7 2 39 53 6 1Public, chosen ................................................... 7,915 27 60 11 2 44 49 6 2 43 51 5 2 45 49 5 1Private, church-related ...................................... 4,317 38 55 7 1! 53 43 4 # 70 30 1 ! # 64 35 1! 1! Private, not church-related ............................... 1,280 43 48 9 # 49 42 7 2! 67 30 2 ! 1 ! 60 35 2! 1!
School schedule
Traditional ......................................................... 47,768 27 60 11 2 40 49 8 3 40 52 6 2 43 50 6 1Year-round ........................................................ 3,620 26 61 11 2! 40 51 8 1 35 57 6 3 ! 38 56 5 1!
Household poverty status
Above poverty level .......................................... 41,418 28 59 11 2 41 49 8 2 41 51 6 2 45 49 5 1At or below poverty level ................................. 9,970 23 62 12 3 37 52 9 2 32 57 9 3 35 56 7 2
Parents’ highest education level
Less than high school ....................................... 3,638 19 68 11 2 32 58 8 2! 29 60 8 3 27 64 7 1! High school graduate or equivalent ................. 12,891 25 61 11 2 37 51 9 3 33 56 8 3 39 55 5 1Vocational/technical education after high school or some college ...................... 16,186 26 60 12 2 39 50 9 3 38 54 7 2 43 49 6 2College graduate ............................................... 9,877 29 59 10 2 44 47 7 2 44 50 4 1 48 46 5 1Graduate or professional school ...................... 8,797 33 56 9 2 47 46 5 2 51 45 4 1 49 46 4 1
Parents’ language
Both/only parent(s) speak(s) English .............. 45,505 27 59 11 2 40 49 8 3 40 52 6 2 44 49 6 1One of two parents speaks English .................. 1,090 30 58 9 3! 45 50 4 1! 37 59 3 2 ! 32 64 4 #No parent speaks English ................................. 4,793 25 65 9 1! 38 57 4 1 34 59 6 1 ! 31 64 5 1
Student’s grade level2
K – 1st grade ..................................................... 7,823 26 58 13 3 56 40 3 1 53 43 2 1 57 40 3 12nd – 3rd grade ................................................. 7,696 27 60 11 2 50 45 4 1 52 44 3 1 ! 55 41 3 14th – 5th grade .................................................. 8,368 30 61 8 1 42 49 7 1 46 50 4 1 49 47 3 1! 6th – 8th grade .................................................. 12,170 28 59 11 2 34 55 8 3 33 56 8 2 36 56 6 19th – 10th grade ................................................ 7,783 26 60 11 3 33 50 13 4 28 59 10 4 31 58 9 211th – 12th grade .............................................. 7,543 25 61 12 2 29 55 12 4 27 61 10 2 32 58 9 1
Student’s race/ethnicity
White, non-Hispanic ......................................... 31,931 27 60 11 2 40 49 8 3 42 51 6 2 46 48 6 1Black, non-Hispanic ......................................... 8,165 25 60 12 3 39 50 8 2 33 56 8 3 38 55 5 2Hispanic ............................................................. 8,250 26 62 10 2 39 53 6 2 35 56 7 2 36 57 6 1Asian or Pacific Islander, non-Hispanic .......... 1,453 33 53 12 1! 54 42 3 # 44 54 2 ! # 37 59 4 #Other, non-Hispanic .......................................... 1,588 24 55 18 3! 39 49 9 3 37 50 12 1 ! 45 47 6 2!
See notes at end of table.

30
Table 9. Percentage distribution of students in grades K through 12, by statements regarding student’s experience in school, parent’s level of agreement with statement, and selected characteristics:
2002–03—Continued
Student experiences in school1
Student finds his/her schoolwork challenging Student enjoys school
Most students and teachers in student’s
school respect each other
Student’s school makes it easy for family to be
involved there
Characteristic
Number of students in
grades K through 12
(thousands) SA A D SD SA A D SD SA A D SD SA A D SD Total .............................................................. 51,388 27 60 11 2 40 50 8 2 39 52 6 2 43 50 6 1
Student’s sex
Male ................................................................... 26,328 25 60 12 2 34 52 10 3 39 54 6 2 42 51 6 1Female ............................................................... 25,060 29 60 10 2 46 47 5 2 40 51 7 2 44 49 5 1
# Rounds to zero. ! Interpret data with caution. 1 Parents were asked whether they strongly agreed (SA), agreed (A), disagreed (D), or strongly disagreed (SD) with statements about the child’s school experiences. 2 Students whose parents reported that their classes were “ungraded” were excluded from the analyses of grade level. NOTE: Students who were homeschooled were excluded from the table. Detail may not sum to totals because of rounding. SOURCE: U.S. Department of Education, National Center for Education Statistics, Parent and Family Involvement in Education Survey of the 2003 National Household Education Surveys Program (PFI-NHES:2003).

31
Table 9a. Standard errors of the percentage distribution of students in grades K through 12, by statements regarding student’s experience in school, parent’s level of agreement with statement, and selected characteristics: 2002–03
Student experiences in school1
Student finds his/her schoolwork challenging Student enjoys school
Most students and teachers in student’s
school respect each other
Student’s school makes it easy for
family to be involved there
Characteristic
Number of students in
grades K through 12
(thousands) SA A D SD SA A D SD SA A D SD SA A D SD Total .............................................................. 94.8 0.5 0.6 0.3 0.2 0.5 0.6 0.3 0.2 0.5 0.5 0.3 0.2 0.6 0.6 0.3 0.1
School type
Public, assigned ................................................. 288.1 0.5 0.7 0.4 0.2 0.7 0.7 0.4 0.2 0.5 0.6 0.4 0.2 0.7 0.7 0.3 0.1Public, chosen ................................................... 208.3 1.4 1.4 1.0 0.3 1.4 1.3 0.6 0.3 1.5 1.4 0.8 0.4 1.7 1.7 0.6 0.2Private, church-related ...................................... 165.0 1.8 1.8 1.0 0.4 1.8 1.9 0.7 0.2 2.0 1.9 0.6 0.1 2.1 2.0 0.3 0.5Private, not church-related ............................... 87.1 3.3 3.3 2.0 0.3 3.3 3.2 2.0 0.7 3.1 3.0 1.2 0.6 3.6 3.5 0.8 0.8
School schedule
Traditional ......................................................... 172.8 0.5 0.6 0.4 0.2 0.6 0.6 0.3 0.2 0.5 0.6 0.3 0.2 0.6 0.6 0.3 0.1Year-round ........................................................ 165.5 1.9 2.0 1.2 0.6 2.0 2.0 1.3 0.3 1.8 1.8 1.0 0.9 1.9 1.9 0.8 0.3
Household poverty status
Above poverty level .......................................... 180.1 0.6 0.6 0.4 0.2 0.6 0.6 0.3 0.2 0.6 0.6 0.3 0.1 0.6 0.7 0.3 0.1At or below poverty level ................................. 178.3 1.4 1.4 1.0 0.5 1.5 1.5 0.9 0.4 1.5 1.6 0.7 0.6 1.6 1.5 0.9 0.4
Parents’ highest education level
Less than high school ....................................... 205.6 2.2 2.5 1.6 0.5 2.3 2.2 1.4 0.8 2.5 2.6 1.3 0.8 2.4 2.7 1.4 0.7High school graduate or equivalent ................. 280.2 0.9 1.0 0.7 0.4 1.1 1.1 0.6 0.4 1.1 1.3 0.7 0.4 1.2 1.2 0.6 0.2Vocational/technical education after high school or some college ...................... 333.9 0.9 1.1 0.6 0.3 1.0 1.0 0.6 0.3 0.8 0.9 0.5 0.3 1.0 1.1 0.5 0.2College graduate ............................................... 281.7 1.0 1.0 0.7 0.3 1.1 1.1 0.6 0.3 1.3 1.3 0.6 0.3 1.2 1.3 0.6 0.3Graduate or professional school ...................... 245.6 1.4 1.3 0.7 0.4 1.6 1.5 0.6 0.3 1.4 1.4 0.6 0.2 1.6 1.6 0.5 0.2
Parents’ language
Both/only parent(s) speak(s) English .............. 194.9 0.5 0.6 0.4 0.2 0.5 0.6 0.3 0.2 0.6 0.6 0.3 0.2 0.6 0.7 0.3 0.1One of two parents speaks English .................. 85.9 3.0 3.4 1.7 1.0 3.6 3.4 1.1 0.6 3.8 3.8 0.9 1.1 3.5 3.5 1.0 0.3No parent speaks English ................................. 157.9 1.5 1.7 1.0 0.4 2.0 2.0 0.7 0.2 2.0 2.1 0.8 0.3 1.8 1.8 0.7 0.2
Student’s grade level2
K – 1st grade ..................................................... 32.5 1.1 1.3 0.8 0.5 1.3 1.3 0.4 0.4 1.2 1.3 0.5 0.3 1.3 1.4 0.4 0.32nd – 3rd grade ................................................. 24.5 1.3 1.4 0.9 0.5 1.3 1.3 0.6 0.2 1.3 1.3 0.4 0.3 1.4 1.4 0.5 0.34th – 5th grade .................................................. 30.1 1.2 1.4 0.9 0.2 1.4 1.4 0.7 0.3 1.2 1.3 0.6 0.3 1.4 1.4 0.5 0.26th – 8th grade .................................................. 45.0 1.1 1.3 0.8 0.4 1.2 1.1 0.6 0.3 0.9 1.0 0.6 0.4 1.1 1.1 0.5 0.29th – 10th grade ................................................ 28.4 1.2 1.3 0.8 0.5 1.2 1.3 0.9 0.5 1.2 1.3 0.7 0.4 1.3 1.3 0.7 0.311th – 12th grade .............................................. 42.8 1.2 1.3 1.0 0.4 1.3 1.3 1.0 0.6 1.3 1.4 0.9 0.3 1.4 1.6 0.9 0.3
Student’s race/ethnicity
White, non-Hispanic ......................................... 178.3 0.6 0.7 0.4 0.2 0.7 0.6 0.4 0.2 0.8 0.8 0.4 0.2 0.6 0.7 0.3 0.2Black, non-Hispanic ......................................... 36.1 1.1 1.5 0.9 0.6 1.5 1.5 0.9 0.4 1.4 1.5 1.0 0.6 1.6 1.7 0.8 0.4Hispanic ............................................................. 21.5 1.3 1.3 0.6 0.3 1.2 1.3 0.6 0.3 1.3 1.4 0.7 0.3 1.4 1.3 0.6 0.2Asian or Pacific Islander, non-Hispanic .......... 113.2 3.1 3.2 2.0 0.6 3.5 3.3 1.1 0.1 3.7 3.6 0.8 0.3 3.3 3.5 1.1 0.3Other, non-Hispanic .......................................... 124.7 2.8 3.5 2.5 1.0 2.9 3.2 1.7 0.9 3.5 3.9 3.2 0.5 4.0 4.2 1.6 0.9
See notes at end of table.

32
Table 9a. Standard errors of the percentage distribution of students in grades K through 12, by statements regarding student’s experience in school, parent’s level of agreement with statement, and selected characteristics: 2002–03—Continued
Student experiences in school1
Student finds his/her schoolwork challenging Student enjoys school
Most students and teachers in student’s
school respect each other
Student’s school makes it easy for family to be
involved there
Characteristic
Number of students in
grades K through 12
(thousands) SA A D SD SA A D SD SA A D SD SA A D SD Total .............................................................. 94.8 0.5 0.6 0.3 0.2 0.5 0.6 0.3 0.2 0.5 0.5 0.3 0.2 0.6 0.6 0.3 0.1
Student’s sex
Male ................................................................... 282.6 0.6 0.8 0.5 0.2 0.7 0.8 0.5 0.3 0.7 0.7 0.4 0.2 0.8 0.8 0.4 0.1Female ............................................................... 272.3 0.7 0.8 0.5 0.2 0.8 0.8 0.3 0.2 0.8 0.8 0.4 0.2 0.8 0.9 0.4 0.2
1 Parents were asked whether they strongly agreed (SA), agreed (A), disagreed (D), or strongly disagreed (SD) with statements about the child’s school experiences. 2 Students whose parents reported that their classes were “ungraded” were excluded from the analyses of grade level. NOTE: Students who were homeschooled were excluded from the table. Detail may not sum to totals because of rounding. SOURCE: U.S. Department of Education, National Center for Education Statistics, Parent and Family Involvement in Education Survey of the 2003 National Household Education Surveys Program (PFI-NHES:2003).

33
Table 10. Percentage of students in grades K through 12 whose parents reported educational expectations and plans to help pay for education after high school, by educational attainment expectation and selected characteristics: 2002–03
Parent expects student to…
Characteristic
Number of students in
grades K through 12
(thousands)
Receive less than a high
school diploma
Graduate from high
school
Attend vocational
or technical school after high school
Attend 2 or more years of college
Finish 4- or 5-year
college degree
Earn a graduate or
professional degree
Family plans to help pay for student education after high
school1
Total .............................................................. 51,388 # 7 7 16 39 30 83
School type
Public, assigned ...................................................... 37,875 # 8 8 17 39 28 82 Public, chosen ......................................................... 7,915 1 9 7 16 35 33 79 Private, church-related ........................................... 4,317 # 2 2 9 45 41 91 Private, not church-related ..................................... 1,280 1 ! 6 6 7 32 48 92
School schedule
Traditional ............................................................... 47,768 # 7 7 15 39 31 83 Year-round .............................................................. 3,620 1 ! 11 8 17 34 29 66
Household poverty status
Above poverty level ............................................... 41,418 # 6 7 15 41 32 86 At or below poverty level ...................................... 9,970 1 15 9 20 30 26 64
Parents’ highest education level
Less than high school ............................................. 3,638 1 ! 23 10 20 27 20 59 High school graduate or equivalent ....................... 12,891 1 14 11 25 30 20 75 Vocational/technical education after high school or some college ............................ 16,186 # 6 9 18 39 27 81 College graduate ..................................................... 9,877 # 2 3 8 55 33 91 Graduate or professional school ............................ 8,797 # 1 3 4 38 54 93
Parents’ language
Both/only parent(s) speak(s) English .................... 45,505 # 7 8 16 39 29 85 One of two parents speaks English ....................... 1,090 0 6 4 14 27 49 66 No parent speaks English ....................................... 4,793 1 ! 9 4 10 36 41 61
Student’s grade level2
K – 1st grade ........................................................... 7,823 # 6 4 13 44 34 † 2nd – 3rd grade ....................................................... 7,696 # 7 5 15 40 33 † 4th – 5th grade ........................................................ 8,368 # 7 7 16 39 30 † 6th – 8th grade ........................................................ 12,170 # 8 8 15 37 31 83 9th – 10th grade ...................................................... 7,783 1 10 10 17 35 27 82 11th – 12th grade .................................................... 7,543 1 ! 7 11 17 38 27 83
Student’s race/ethnicity
White, non-Hispanic .............................................. 31,931 1 7 8 15 42 27 87 Black, non-Hispanic ............................................... 8,165 # 9 7 17 30 36 76 Hispanic .................................................................. 8,250 # 8 6 16 36 34 72 Asian or Pacific Islander, non-Hispanic ............... 1,453 # 2 ! 1 ! 9 30 56 76 Other, non-Hispanic ............................................... 1,588 1 ! 10 8 20 31 29 85
See notes at end of table.

34
Table 10. Percentage of students in grades K through 12 whose parents reported educational expectations and plans to help pay for education after high school, by educational attainment expectation and selected characteristics: 2002–03—Continued
Parent expects student to…
Characteristic
Number of students in
grades K through 12
(thousands)
Receive less than a high
school diploma
Graduate from high
school
Attend vocational
or technical school after high school
Attend 2 or more years of college
Finish 4- or 5-year
college degree
Earn a graduate or
professional degree
Family plans to help pay for student education after high
school1
Total ............................................................... 51,388 # 7 7 16 39 30 83
Student’s sex
Male ........................................................................ 26,328 1 9 10 15 38 28 82 Female .................................................................... 25,060 # 6 5 16 39 33 83
Student grades or marks3
Mostly A’s or excellent ......................................... 20,868 # 3 2 9 40 45 85 Mostly B’s or above average ................................ 18,673 # 6 7 19 43 24 83 Mostly C’s or average ........................................... 9,785 1 16 14 22 31 15 76 Mostly D’s or lower, or below average or failing ............................................................... 2,062 5 25 23 17 20 10 75
† Not applicable. # Rounds to zero. ! Interpret data with caution. 1 This question was only asked of parents of children in grades 6 through 12 who expected their children to continue education after high school. 2 Students whose parents reported that their classes were “ungraded” were excluded from the analyses of grade level. 3 Parents were asked whether overall, across all subjects, the student got mostly A’s, mostly B’s, mostly C’s, mostly D’s or lower, or whether the student’s school did not give those grades. If the student’s school did not give letter grades (e.g., A, B, C), they were asked whether the parent would describe the student’s work at school as excellent, above average, average, below average, or failing. The two questions about grades or marks were combined for the table. NOTE: Students who were homeschooled were excluded from the table. Detail may not sum to totals because of rounding. SOURCE: U.S. Department of Education, National Center for Education Statistics, Parent and Family Involvement in Education Survey of the 2003 National Household Education Surveys Program (PFI-NHES:2003).

35
Table 10a. Standard errors of the percentage of students in grades K through 12 whose parents reported educational expectations and plans to help pay for education after high school, by educational attainment expectation and selected characteristics: 2002–03
Parent expects student to…
Characteristic
Number of students in
grades K through 12
(thousands)
Receive less than a high
school diploma
Graduate from high
school
Attend vocational
or technical school after high school
Attend 2 or more years of college
Finish 4- or 5-year
college degree
Earn a graduate or
professional degree
Family plans to help pay for student education after high
school1
Total ................................................................... 94.8 0.1 0.3 0.3 0.4 0.5 0.6 0.8
School type
Public, assigned ...................................................... 288.1 0.1 0.4 0.4 0.5 0.6 0.6 1.0 Public, chosen ........................................................ 208.3 0.2 0.9 0.6 1.2 1.2 1.2 1.8 Private, church-related ........................................... 165.0 0.2 0.8 0.4 1.1 1.9 1.7 1.4 Private, not church-related .................................... 87.1 0.7 1.7 1.9 1.8 2.5 2.9 2.8
School schedule
Traditional .............................................................. 172.8 0.1 0.3 0.3 0.4 0.5 0.6 0.8 Year-round ............................................................. 165.5 0.5 1.2 1.1 1.8 2.1 1.8 3.3
Household poverty status
Above poverty level ............................................... 180.1 0.1 0.3 0.3 0.5 0.6 0.6 0.7 At or below poverty level ...................................... 178.3 0.2 1.2 0.8 1.2 1.0 1.4 2.5
Parents’ highest education level
Less than high school ............................................ 205.6 0.4 2.6 1.6 2.0 2.0 2.0 3.0 High school graduate or equivalent ...................... 280.2 0.1 0.9 0.7 1.1 1.1 1.0 1.6 Vocational/technical education after high school or some college ........................... 333.9 0.1 0.5 0.5 0.8 1.0 0.9 1.6 College graduate .................................................... 281.7 0.1 0.3 0.4 0.8 1.2 1.3 1.0 Graduate or professional school ........................... 245.6 0.2 0.2 0.4 0.5 1.4 1.4 0.9
Parents’ language
Both/only parent(s) speak(s) English ................... 194.9 0.1 0.3 0.3 0.5 0.6 0.6 0.7 One of two parents speaks English ....................... 85.9 0.0 1.4 1.1 2.6 3.4 4.1 4.6 No parent speaks English ...................................... 157.9 0.2 1.0 0.6 1.2 2.1 1.9 2.7
Student’s grade level2
K – 1st grade .......................................................... 32.5 0.1 0.6 0.6 0.9 1.5 1.2 † 2nd – 3rd grade ...................................................... 24.5 0.1 0.7 0.5 1.2 1.2 1.2 † 4th – 5th grade ....................................................... 30.1 0.1 0.7 0.8 1.1 1.5 1.3 † 6th – 8th grade ....................................................... 45.0 0.2 0.7 0.6 0.7 1.0 1.0 1.0 9th – 10th grade ..................................................... 28.4 0.3 1.0 0.8 1.0 1.2 1.1 1.2 11th – 12th grade ................................................... 42.8 0.3 0.8 0.9 1.0 1.3 1.3 1.3
Student’s race/ethnicity
White, non-Hispanic .............................................. 178.3 0.1 0.4 0.4 0.5 0.7 0.7 0.8 Black, non-Hispanic .............................................. 36.1 0.2 1.1 0.7 1.2 1.2 1.4 2.1 Hispanic .................................................................. 21.5 0.2 0.7 0.5 0.9 1.3 1.3 2.1 Asian or Pacific Islander, non-Hispanic ............... 113.2 0.3 1.3 0.7 2.5 2.6 3.1 3.8 Other, non-Hispanic ............................................... 124.7 0.4 3.3 2.0 2.8 3.1 2.9 3.5
See notes at end of table.

36
Table 10a. Standard errors of the percentage of students in grades K through 12 whose parents reported educational expectations and plans to help pay for education after high school, by educational attainment expectation and selected characteristics: 2002–03—Continued
Parent expects student to…
Characteristic
Number of students in
grades K through 12
(thousands)
Receive less than a high
school diploma
Graduate from high
school
Attend vocational or
technical school after high school
Attend 2 or more years of college
Finish 4- or 5-year
college degree
Earn a graduate or
professional degree
Family plans to help pay for student education after high
school1
Total .............................................................. 94.8 0.1 0.3 0.3 0.4 0.5 0.6 0.8
Student’s sex
Male ................................................................... 282.6 0.1 0.5 0.4 0.6 0.7 0.7 1.0 Female ............................................................... 272.3 0.1 0.4 0.4 0.7 0.7 0.8 0.8
Student grades or marks3
Mostly A’s or excellent .................................... 283.8 0.1 0.3 0.2 0.5 0.9 0.9 1.0 Mostly B’s or above average ........................... 268.1 0.0 0.5 0.5 0.8 1.0 0.8 1.1 Mostly C’s or average ...................................... 251.6 0.2 1.0 0.9 1.0 1.3 0.8 2.0 Mostly D’s or lower, or below average or failing .......................................................... 131.4 1.3 2.3 2.4 2.1 2.8 1.5 3.9
† Not applicable. 1 This question was only asked of parents of children in grades 6 through 12 who expected their children to continue education after high school. 2 Students whose parents reported that their classes were “ungraded” were excluded from the analyses of grade level. 3 Parents were asked whether overall, across all subjects, the student got mostly A’s, mostly B’s, mostly C’s, mostly D’s or lower, or whether the student’s school did not give those grades. If the student’s school did not give letter grades (e.g., A, B, C), they were asked whether the parent would describe the student’s work at school as excellent, above average, average, below average, or failing. The two questions about grades or marks were combined for the table. NOTE: Students who were homeschooled were excluded from the table. Detail may not sum to totals because of rounding. SOURCE: U.S. Department of Education, National Center for Education Statistics, Parent and Family Involvement in Education Survey of the 2003 National Household Education Surveys Program (PFI-NHES:2003).

37
Table 11. Percentage of students in grades K through 12 who participated in activities in and out of school, by selected activity categories and selected characteristics: 2002–03
Out-of-school activities Characteristic
Number of students in
grades K through 12
(thousands)
Student participated
in school activities Music lessons
Religious group
Organized sports Scouting
Educational programs College prep1 Other
Total ............................................. 51,388 58 17 58 42 24 21 15 2
School type
Public, assigned ................................ 37,875 57 16 58 41 23 21 15 3 Public, chosen ................................... 7,915 51 17 57 38 24 24 18 3 Private, church-related ...................... 4,317 71 24 63 55 29 22 17 2 Private, not church-related ............... 1,280 68 32 49 50 25 28 18 2 !
School schedule
Traditional ......................................... 47,768 59 17 59 43 24 21 15 2 Year-round ........................................ 3,620 43 13 48 33 15 25 20 2
Household poverty status
Above poverty level ......................... 41,418 61 19 60 46 26 21 16 2 At or below poverty level ................. 9,970 45 9 49 26 14 22 15 3
Parents’ highest education level
Less than high school ....................... 3,638 35 7 36 22 8 19 13 1 ! High school graduate or equivalent .................................... 12,891 49 8 49 30 16 21 13 2 Vocational/technical education after high school or some college ........................... 16,186 58 14 60 40 25 21 15 3 College graduate ............................... 9,877 66 23 66 54 29 20 17 2 Graduate or professional school ........................................ 8,797 70 32 67 59 33 25 18 3
Parents’ language
Both/only parent(s) speak(s) English ........................................ 45,505 60 17 61 44 25 22 15 2 One of two parents speaks English ........................................ 1,090 51 20 50 35 18 27 20 4 ! No parent speaks English ................. 4,793 41 14 31 28 11 19 15 2
Student’s grade level2
K – 1st grade ..................................... 7,823 29 11 53 43 20 14 † 1 2nd – 3rd grade ................................. 7,696 43 15 60 48 31 20 † 2 4th – 5th grade .................................. 8,368 68 22 61 50 29 21 † 2 6th – 8th grade .................................. 12,170 72 20 61 46 21 22 7 2 9th – 10th grade ................................ 7,783 64 17 59 35 22 24 12 4 11th – 12th grade .............................. 7,543 60 13 51 28 21 27 33 4
See notes at end of table.

38
Table 11. Percentage of students in grades K through 12 who participated in activities in and out of school, by selected activity categories and selected characteristics: 2002–03—Continued
Out-of-school activities
Characteristic
Number of students in
grades K through 12
(thousands)
Student participated
in school activities1 Music lessons
Religious group
Organized sports Scouting
Educational programs College prep1 Other
Total ...................................... 51,388 58 17 58 42 24 21 15 2
Student’s race/ethnicity
White, non-Hispanic ................. 31,931 62 18 61 48 27 18 13 2 Black, non-Hispanic ................. 8,165 53 14 67 30 20 32 26 2 Hispanic ..................................... 8,250 46 13 40 32 15 19 15 2 Asian or Pacific Islander, non-Hispanic ....................... 1,453 61 33 56 39 21 33 23 3 ! Other, non-Hispanic .................. 1,588 57 14 51 46 24 27 14 2 !
Student’s sex
Male ........................................... 26,328 57 14 56 48 22 21 14 2 Female ....................................... 25,060 59 19 60 36 26 22 16 3
† Not applicable. ! Interpret data with caution. 1 This question was only asked of parents of children in grades 6 through 12. 2 Students whose parents reported that their classes were “ungraded” were excluded from the analyses of grade level. NOTE: Students who were homeschooled were excluded from the table. Detail may not sum to totals because of rounding. SOURCE: U.S. Department of Education, National Center for Education Statistics, Parent and Family Involvement in Education Survey of the 2003 National Household Education Surveys Program (PFI-NHES:2003).

39
Table 11a. Standard errors of the percentage of students in grades K through 12 who participated in activities in and out of school, by selected activity categories and selected characteristics: 2002–03
Out-of-school activities Characteristic
Number of students in
grades K through 12
(thousands)
Student participated
in school activities Music lessons
Religious group Organized sports Scouting
Educational programs College prep1 Other
Total ........................................... 94.8 0.5 0.4 0.6 0.6 0.4 0.4 0.6 0.2
School type
Public, assigned .............................. 288.1 0.6 0.5 0.7 0.6 0.5 0.5 0.6 0.2 Public, chosen ................................. 208.3 1.5 1.0 1.4 1.4 1.2 1.0 1.2 0.4 Private, church-related .................... 165.0 1.7 1.5 1.9 2.1 1.6 1.4 1.8 0.4 Private, not church-related ............. 87.1 3.4 2.8 3.5 3.3 2.6 3.3 3.1 0.9
School schedule
Traditional ....................................... 172.8 0.6 0.4 0.7 0.6 0.5 0.5 0.6 0.2 Year-round ...................................... 165.5 2.2 1.3 2.2 2.1 1.4 1.8 2.7 0.5
Household poverty status
Above poverty level ....................... 180.1 0.6 0.5 0.7 0.7 0.5 0.5 0.6 0.2 At or below poverty level ............... 178.3 1.3 0.8 1.5 1.3 1.0 1.1 1.6 0.6
Parents’ highest education level
Less than high school ..................... 205.6 1.9 0.9 2.4 1.8 1.1 1.8 2.1 0.4 High school graduate or equivalent .................................. 280.2 1.1 0.7 1.4 1.0 0.9 1.1 1.2 0.4 Vocational/technical education after high school or some college ....................................... 333.9 1.0 0.7 1.0 1.0 0.9 0.8 0.9 0.3 College graduate ............................. 281.7 1.1 0.9 1.5 1.3 1.0 1.1 0.9 0.3 Graduate or professional school .... 245.6 1.3 1.4 1.3 1.4 1.4 1.1 1.3 0.6
Parents’ language
Both/only parent(s) speak(s) English ...................................... 194.9 0.6 0.4 0.7 0.6 0.5 0.5 0.6 0.2 One of two parents speaks English ...................................... 85.9 3.6 3.1 3.8 3.6 2.6 3.2 4.3 1.4 No parent speaks English ............... 157.9 1.8 1.2 1.8 1.9 1.0 1.3 1.8 0.5
Student’s grade level2
K – 1st grade ................................... 32.5 1.2 0.7 1.3 1.1 1.0 0.9 † 0.3 2nd – 3rd grade ............................... 24.5 1.3 1.0 1.3 1.4 1.1 0.9 † 0.4 4th – 5th grade ................................ 30.1 1.3 1.2 1.1 1.1 1.4 1.1 † 0.5 6th – 8th grade ................................ 45.0 1.0 0.8 1.3 1.1 0.9 0.9 0.6 0.4 9th – 10th grade .............................. 28.4 1.4 1.0 1.3 1.3 1.0 1.1 0.9 0.6 11th – 12th grade ............................ 42.8 1.3 0.9 1.3 1.3 1.2 1.2 1.4 0.5
See notes at end of table.

40
Table 11a. Standard errors of the percentage of students in grades K through 12 who participated in activities in and out of school, by selected activity categories and selected characteristics: 2002–03—Continued
Out-of-school activities Characteristic
Number of students in
grades K through 12
(thousands)
Student participated
in school activities Music lessons
Religious group
Organized sports Scouting
Educational programs College prep1 Other
Total ...................................... 94.8 0.5 0.4 0.6 0.6 0.4 0.4 0.6 0.2
Student’s race/ethnicity
White, non-Hispanic .................. 178.3 0.7 0.5 0.8 0.8 0.6 0.5 0.6 0.3 Black, non-Hispanic .................. 36.1 1.6 1.2 1.7 1.5 1.2 1.6 2.1 0.5 Hispanic ...................................... 21.5 1.2 0.9 1.2 1.2 0.9 0.9 1.2 0.4 Asian or Pacific Islander, non-Hispanic ........................ 113.2 2.9 3.3 3.6 3.8 2.2 3.3 3.9 1.1 Other, non-Hispanic .................. 124.7 3.2 2.1 3.8 3.1 2.6 2.7 3.1 1.5
Student’s sex Male ............................................ 282.6 0.7 0.5 0.9 0.8 0.6 0.5 0.8 0.3 Female ........................................ 272.3 0.7 0.6 0.8 0.7 0.6 0.6 0.8 0.3
† Not applicable. 1 This question was only asked of parents of children in grades 6 through 12. 2 Students whose parents reported that their classes were “ungraded” were excluded from the analyses of grade level. NOTE: Students who were homeschooled were excluded from the table. Detail may not sum to totals because of rounding. SOURCE: U.S. Department of Education, National Center for Education Statistics, Parent and Family Involvement in Education Survey of the 2003 National Household Education Surveys Program (PFI-NHES:2003).

41
Table 12. Percentage of students in grades K through 12 whose parents reported satisfaction with school provision of information, by type of information and selected characteristics: 2002–03
Percentage of parents reporting that school did “very well” at providing information about…1
Characteristic Number of students in
grades K through 12
(thousands) Student’s
performance
What children of
the student’s age are like
Opportunities to volunteer
How to help
student learn at
home
Com-munity
services
How to help with
homework
Why student is placed in
particular groups or
classes
How to help student plan for college2
How to help
student plan for
work2
Total ......................................... 51,388 61 40 59 39 33 42 43 32 21
School type
Public, assigned ........................... 37,875 58 37 56 38 32 39 41 30 19Public, chosen .............................. 7,915 64 44 61 45 36 49 50 36 28Private, church-related ................ 4,317 74 50 82 38 39 47 47 44 22Private, not church-related .......... 1,280 76 56 73 50 40 51 57 53 25
School schedule
Traditional .................................... 47,768 61 39 59 38 33 41 43 32 20Year-round ................................... 3,620 63 51 56 50 42 52 52 37 29
Household poverty status
Above poverty level .................... 41,418 60 38 60 38 32 40 42 32 19At or below poverty level ........... 9,970 63 48 54 46 39 49 48 33 27
Parents’ highest education level
Less than high school ................... 3,638 62 47 49 49 40 50 48 38 34High school graduate or equivalent ............................... 12,891 64 44 58 44 36 46 47 32 24Vocational/technical education after high school or some college .......... 16,186 60 38 56 37 32 40 43 29 19College graduate .......................... 9,877 60 37 62 36 30 38 39 33 16Graduate or professional school ...................................... 8,797 60 37 67 37 33 39 42 34 17
Parents’ language
Both/only parent(s) speak(s) English .................................... 45,505 61 38 60 38 32 40 43 31 19One of two parents speaks English .................................... 1,090 65 57 58 52 46 59 57 39 32No parent speaks English ............ 4,793 63 51 49 49 43 54 47 38 32
Student’s grade level3
K – 1st grade ................................. 7,823 65 55 74 56 41 60 51 — —2nd – 3rd grade ............................. 7,696 67 49 74 53 42 54 52 — —4th – 5th grade .............................. 8,368 65 45 70 45 37 45 47 — —6th – 8th grade .............................. 12,170 62 35 54 33 29 36 41 20 149th – 10th grade ............................ 7,783 54 28 39 27 26 28 38 38 2411th – 12th grade .......................... 7,543 51 27 45 23 27 28 33 46 28
See notes at end of table.

42
Table 12. Percentage of students in grades K through 12 whose parents reported satisfaction with school provision of information, by type of information and selected characteristics: 2002–03—Continued
Percentage of parents reporting that school did “very well” at providing information about…1
Characteristic Number of students in
grades K through 12
(thousands) Student’s
performance
What children
of the student’s
age are like
Opportunities to volunteer
How to help
student learn at
home
Com-munity
services
How to help with
homework
Why student is placed in particular groups or
classes
How to help
student plan for college2
How to help
student plan for
work2
Total ................................... 51,388 61 40 59 39 33 42 43 32 21
Student’s race/ethnicity
White, non-Hispanic .............. 31,931 60 36 61 35 31 37 40 30 18Black, non-Hispanic ............... 8,165 67 45 58 48 36 48 48 34 24Hispanic .................................. 8,250 61 50 56 47 42 52 50 38 29Asian or Pacific Islander, non-Hispanic ..................... 1,453 62 43 50 41 34 44 42 35 21Other, non-Hispanic ............... 1,588 59 40 60 41 32 43 49 26 20
Student’s sex
Male ........................................ 26,328 60 39 57 38 32 41 44 31 21Female ..................................... 25,060 62 41 61 40 34 43 43 33 20
— Not available. 1 Parents of students in grades K through 12 were asked to rate school performance relative to the provision of seven types of information (items 1-7 in the list below). Parents of students in grades 6 through 12 were asked to rate school performance for the provision of nine types of information (items 1-9 in the list that follows): (1) letting them know between report cards about student’s school performance; (2) helping them understand what children of the student’s age are like; (3) making them aware of chances to volunteer at school; (4) helping them help their child learn at home; (5) providing information about community services; (6) providing information about how to help with homework; (7) providing information about why their child was placed in particular groups or classes; (8) providing information on how to help their child plan for college or vocational school; and (9) providing information about how to help their child plan for work after completing his or her education. Response options were does it “very well,” “just okay,” “not very well,” “doesn’t do it at all,” or “don’t know.” 2 This question was only asked of parents of children in grades 6 through 12. 3 Students whose parents reported that their classes were “ungraded” were excluded from the analyses of grade level. NOTE: Students who were homeschooled were excluded from the table. Detail may not sum to totals because of rounding. SOURCE: U.S. Department of Education, National Center for Education Statistics, Parent and Family Involvement in Education Survey of the 2003 National Household Education Surveys Program (PFI-NHES:2003).

43
Table 12a. Standard errors of the percentage of students in grades K through 12 whose parents reported satisfaction with school provision of information, by type of information and selected characteristics: 2002–03
Percentage of parents reporting that school did “very well” at providing information about…1
Characteristic Number of students in
grades K through 12
(thousands) Student’s
performance
What children of the
student’s age are like
Opportunities to volunteer
How to help
student learn at
home
Com-munity
services
How to help with
homework
Why student is placed in
particular groups or
classes
How to help
student plan for college2
How to help
student plan for
work2
Total ........................................ 94.8 0.6 0.5 0.6 0.5 0.6 0.5 0.5 0.7 0.6
School type
Public, assigned ........................... 288.1 0.6 0.6 0.7 0.6 0.7 0.6 0.6 0.8 0.7Public, chosen .............................. 208.3 1.8 1.6 1.7 1.6 1.6 1.6 1.6 2.3 2.0Private, church-related ................ 165.0 1.9 1.7 1.4 1.8 1.7 2.0 1.7 2.2 2.0Private, not church-related .......... 87.1 2.7 3.2 3.5 3.3 3.3 3.2 3.4 4.3 3.6
School schedule
Traditional ................................... 172.8 0.6 0.5 0.6 0.5 0.6 0.5 0.6 0.7 0.6Year-round ................................... 165.5 2.1 2.6 1.7 2.2 2.3 2.2 2.3 3.5 2.8
Household poverty status
Above poverty level .................... 180.1 0.7 0.6 0.6 0.6 0.6 0.6 0.6 0.8 0.6At or below poverty level ........... 178.3 1.6 1.3 1.5 1.5 1.4 1.5 1.6 2.0 1.6
Parents’ highest education level
Less than high school .................. 205.6 2.5 2.3 2.4 2.3 2.2 2.3 2.4 3.0 2.9High school graduate or equivalent .............................. 280.2 1.2 1.3 1.0 1.2 1.1 1.1 1.2 1.5 1.3Vocational/technical education after high school or some college ......... 333.9 1.0 1.0 1.1 1.0 1.0 1.1 1.1 1.3 1.2College graduate ......................... 281.7 1.4 1.2 1.3 1.2 1.3 1.2 1.2 1.5 1.2Graduate or professional school ..................................... 245.6 1.2 1.2 1.4 1.3 1.3 1.4 1.2 1.8 1.3
Parents’ language
Both/only parent(s) speak(s) English ................................... 194.9 0.6 0.6 0.6 0.5 0.6 0.5 0.6 0.8 0.6One of two parents speaks English ................................... 85.9 3.8 3.7 3.9 3.3 3.1 3.1 3.7 4.8 4.7No parent speaks English ........... 157.9 1.7 1.7 2.0 2.0 1.9 2.0 1.9 2.3 2.4
Student’s grade level3
K – 1st grade ................................ 32.5 1.4 1.6 1.3 1.3 1.3 1.3 1.5 — —2nd – 3rd grade ............................ 24.5 1.5 1.4 1.2 1.5 1.3 1.5 1.3 — —4th – 5th grade ............................. 30.1 1.3 1.3 1.3 1.3 1.4 1.2 1.2 — —6th – 8th grade ............................. 45.0 1.1 1.0 1.0 1.2 1.0 1.1 1.1 0.9 0.79th – 10th grade ........................... 28.4 1.4 1.2 1.4 1.3 1.1 1.0 1.3 1.2 1.111th – 12th grade ......................... 42.8 1.4 1.2 1.3 1.2 1.2 1.3 1.2 1.5 1.2
See notes at end of table.

44
Table 12a. Standard errors of the percentage of students in grades K through 12 whose parents reported satisfaction with school provision of information, by type of information and selected characteristics: 2002–03—Continued
Percentage of parents reporting that school did “very well” at providing information about…1
Characteristic Number of students in
grades K through 12
(thousands) Student’s
performance
What children of
the student’s
age are likeOpportunities
to volunteer
How to help
student learn at
home
Com-munity
services
How to help with
homework
Why student is placed in
particular groups or
classes
How to help
student plan for college2
How to help
student plan for
work2
Total ......................................... 94.8 0.6 0.5 0.6 0.5 0.6 0.5 0.5 0.7 0.6
Student’s race/ethnicity
White, non-Hispanic .................... 178.3 0.7 0.7 0.7 0.6 0.7 0.7 0.7 0.9 0.7Black, non-Hispanic ..................... 36.1 1.6 1.5 1.7 1.8 1.5 1.6 1.7 2.2 1.7Hispanic ........................................ 21.5 1.3 1.4 1.3 1.3 1.4 1.3 1.3 1.8 1.6Asian or Pacific Islander, non- Hispanic .................................. 113.2 3.1 3.3 3.7 3.3 2.8 3.1 2.9 4.7 3.7Other, non-Hispanic ..................... 124.7 3.1 3.5 3.6 3.1 3.1 3.2 3.6 5.0 4.4
Student’s sex Male .............................................. 282.6 0.8 0.8 0.7 0.8 0.7 0.7 0.8 0.9 0.8Female ........................................... 272.3 0.8 0.8 0.8 0.8 0.8 0.8 0.8 1.0 0.8
— Not available. 1 Parents of students in grades K through 12 were asked to rate school performance relative to the provision of seven types of information (items 1-7 in the list below). Parents of students in grades 6 through 12 were asked to rate school performance for the provision of nine types of information (items 1-9 in the list that follows): (1) letting them know between report cards about student’s school performance; (2) helping them understand what children of the student’s age are like; (3) making them aware of chances to volunteer at school; (4) helping them help their child learn at home; (5) providing information about community services; (6) providing information about how to help with homework; (7) providing information about why their child was placed in particular groups or classes; (8) providing information on how to help their child plan for college or vocational school; and (9) providing information about how to help their child plan for work after completing his or her education. Response options were does it “very well,” “just okay,” “not very well,” “doesn’t do it at all,” or “don’t know.” 2 This question was only asked of parents of children in grades 6 through 12. 3 Students whose parents reported that their classes were “ungraded” were excluded from the analyses of grade level. NOTE: Students who were homeschooled were excluded from the table. Detail may not sum to totals because of rounding. SOURCE: U.S. Department of Education, National Center for Education Statistics, Parent and Family Involvement in Education Survey of the 2003 National Household Education Surveys Program (PFI-NHES:2003).

45
Table 13. Percentage of students in grades K through 12 whose parents reported satisfaction with school characteristics, by selected school characteristics and selected characteristics: 2002–03
Parent reports of being “very satisfied”1
Characteristic
Number of students in
grades K through 12
(thousands) With the
school
With teachers student had this
year
With academic standards of the
school
With order and discipline at the
school
Amount of
homework assigned is
“about right”2
Amount of
standardized testing is
“about right”3
Total ............................................................ 51,388 61 64 61 63 76 77 School type
Public, assigned ............................................... 37,875 57 61 58 60 75 75Public, chosen .................................................. 7,915 68 68 66 67 76 79Private, church-related ..................................... 4,317 78 75 81 82 82 89Private, not church-related .............................. 1,280 75 73 81 81 80 88
School schedule
Traditional ........................................................ 47,768 61 63 61 63 76 77Year-round ....................................................... 3,620 59 64 60 65 77 77
Household poverty status
Above poverty level ........................................ 41,418 62 64 62 64 76 77At or below poverty level ................................ 9,970 57 61 58 61 74 76
Parents’ highest education level
Less than high school ...................................... 3,638 56 61 58 63 78 77High school graduate or equivalent ................ 12,891 59 63 60 61 77 80Vocational/technical education after high school or some college .................... 16,186 60 64 60 62 73 76College graduate .............................................. 9,877 64 63 64 65 77 77Graduate or professional school ..................... 8,797 64 65 64 66 77 75
Parents’ language
Both/only parent(s) speak(s) English ............. 45,505 61 63 61 63 75 77One of two parents speaks English ................. 1,090 60 68 64 68 72 80No parent speaks English ................................ 4,793 61 65 62 63 80 79
Student’s grade level4
K – 1st grade .................................................... 7,823 73 78 72 76 83 802nd – 3rd grade ................................................ 7,696 71 76 68 72 81 784th – 5th grade ................................................. 8,368 67 70 64 69 74 766th – 8th grade ................................................. 12,170 55 57 57 59 71 759th – 10th grade ............................................... 7,783 52 51 54 52 73 7711th – 12th grade ............................................. 7,543 52 53 56 54 76 77
See notes at end of table.

46
Table 13. Percentage of students in grades K through 12 whose parents reported satisfaction with school characteristics, by selected school characteristics and selected characteristics: 2002–03—Continued
Parent reports of being “very satisfied”1
Characteristic
Number of students in
grades K through 12
(thousands) With the
school
With teachers student had this
year
With academic standards of the
school
With order and
discipline at the school
Amount of
homework assigned is
“about right” 2
Amount of
standardized testing is
“about right” 3
Total .............................................................. 51,388 61 64 61 63 76 77 Student’s race/ethnicity White, non-Hispanic ......................................... 31,931 64 65 62 65 76 77 Black, non-Hispanic ......................................... 8,165 54 57 57 60 73 75 Hispanic ............................................................. 8,250 61 66 63 64 78 79 Asian or Pacific Islander, non-Hispanic .......... 1,453 54 59 54 59 73 79 Other, non-Hispanic ......................................... 1,588 56 61 59 56 70 74 Student’s sex
Male .................................................................... 26,328 60 62 60 62 75 76Female ................................................................ 25,060 63 65 63 64 77 79
1 Parents were asked to rate satisfaction (1) “with the school”; (2) “with teachers student had this year”; (3) “with academic standards of the school”; and (4) “with order and discipline at the school.” Response options were “very satisfied,” “somewhat satisfied,” “somewhat dissatisfied,” or “very dissatisfied.” 2 Response options were “the amount is about right,” “it’s too much,” or “it’s too little.” This estimate pertains only to the children whose parents reported that their children did homework outside of school. 3 Response options were “doing about the right amount of standardized testing and assessment,” “doing too much,” or “doing too little.” 4 Students whose parents reported that their classes were “ungraded” were excluded from the analyses of grade level. NOTE: Students who were homeschooled were excluded from the table. Detail may not sum to totals because of rounding. SOURCE: U.S. Department of Education, National Center for Education Statistics, Parent and Family Involvement in Education Survey of the 2003 National Household Education Surveys Program (PFI-NHES:2003).

47
Table 13a. Standard errors of the percentage of students in grades K through 12 whose parents reported satisfaction with school characteristics, by selected school characteristics and selected characteristics: 2002–03
Parent reports of being “very satisfied”1
Characteristic
Number of students in
grades K through 12
(thousands) With the
school
With teachers student had this
year
With academic standards of the
school
With order and
discipline at the school
Amount of
homework assigned is
“about right”2
Amount of
standardized testing
is “about right” 3
Total ............................................................ 94.8 0.6 0.5 0.6 0.6 0.5 0.5 School type
Public, assigned ............................................... 288.1 0.8 0.7 0.7 0.7 0.5 0.6Public, chosen .................................................. 208.3 1.6 1.4 1.6 1.6 1.3 1.3Private, church-related ..................................... 165.0 1.7 1.5 1.6 1.6 1.3 1.4Private, not church-related .............................. 87.1 3.0 3.0 2.9 2.8 2.6 2.8
School schedule
Traditional ........................................................ 172.8 0.6 0.6 0.6 0.6 0.5 0.6Year-round ....................................................... 165.5 2.2 1.7 2.1 2.0 2.1 2.0
Household poverty status
Above poverty level ........................................ 180.1 0.7 0.6 0.7 0.6 0.5 0.6At or below poverty level ................................ 178.3 1.6 1.5 1.6 1.6 1.3 1.3
Parents’ highest education level
Less than high school ...................................... 205.6 2.2 2.5 2.7 2.2 1.8 2.2High school graduate or equivalent ................ 280.2 1.4 1.3 1.2 1.2 1.1 1.2Vocational/technical education after high school or some college ..................... 333.9 1.0 0.9 1.2 1.0 1.0 1.1College graduate .............................................. 281.7 1.3 1.2 1.4 1.4 0.9 1.1Graduate or professional school ..................... 245.6 1.5 1.4 1.3 1.4 1.1 1.3
Parents’ language
Both/only parent(s) speak(s) English ............. 194.9 0.7 0.6 0.7 0.6 0.5 0.6One of two parents speaks English ................. 85.9 3.6 3.1 3.5 3.5 3.0 3.2No parent speaks English ................................ 157.9 1.9 1.9 2.0 1.8 1.2 1.6
Student’s grade level4
K – 1st grade .................................................... 32.5 1.2 1.1 1.2 1.2 1.1 1.22nd – 3rd grade ................................................ 24.5 1.4 1.2 1.4 1.2 1.2 1.24th – 5th grade ................................................. 30.1 1.4 1.3 1.4 1.3 1.2 1.06th – 8th grade ................................................. 45.0 1.2 1.2 1.2 1.1 1.1 0.99th – 10th grade ............................................... 28.4 1.3 1.4 1.4 1.4 1.3 1.111th – 12th grade ............................................. 42.8 1.5 1.4 1.3 1.6 1.1 1.1
See notes at end of table.

48
Table 13a. Standard errors of the percentage of students in grades K through 12 whose parents reported satisfaction with school characteristics, by selected school characteristics and selected characteristics: 2002–03—Continued
Parent reports of being “very satisfied”1
Characteristic Number of students in
grades K through 12
(thousands) With the
school
With teachers student had this
year
With academic standards of the
school
With order and discipline at the
school
Amount of
homework assigned
is “about right” 2
Amount of standardized
testing is
“about right” 3
Total ............................................................ 94.8 0.6 0.5 0.6 0.6 0.5 0.5 Student’s race/ethnicity White, non-Hispanic ......................................... 178.3 0.8 0.7 0.8 0.7 0.6 0.7 Black, non-Hispanic ......................................... 36.1 1.8 1.7 1.8 1.7 1.4 1.6 Hispanic ............................................................. 21.5 1.4 1.1 1.2 1.3 1.1 1.1 Asian or Pacific Islander, non-Hispanic .......... 113.2 3.6 3.2 3.6 3.4 2.7 2.6 Other, non-Hispanic ......................................... 124.7 3.4 3.2 3.9 3.2 3.2 3.8 Student’s sex
Male .................................................................. 282.6 0.9 0.8 0.9 0.9 0.7 0.7Female .............................................................. 272.3 0.8 0.8 0.7 0.9 0.6 0.8
1 Parents were asked to rate satisfaction (1) “with the school”; (2) “with teachers student had this year”; (3) “with academic standards of the school”; and (4) “with order and discipline at the school.” Response options were “very satisfied,” “somewhat satisfied,” “somewhat dissatisfied,” or “very dissatisfied.” 2 Response options were “the amount is about right,” “it’s too much,” or “it’s too little.” This estimate pertains only to the children whose parents reported that their children did homework outside of school. 3 Response options were “doing about the right amount of standardized testing and assessment,” “doing too much,” or “doing too little.” 4 Students whose parents reported that their classes were “ungraded” were excluded from the analyses of grade level. NOTE: Students who were homeschooled were excluded from the table. Detail may not sum to totals because of rounding. SOURCE: U.S. Department of Education, National Center for Education Statistics, Parent and Family Involvement in Education Survey of the 2003 National Household Education Surveys Program (PFI-NHES:2003).

49
Table 14. Percentage distribution of public school students in grades K through 12 by school choice and percent of students whose families moved to neighborhood for students to attend school, by household and student characteristics: 2002–03
Enrollment by school choice
Characteristic Number of students in grades K through 12
(thousands)Student is in
assigned schoolStudent is in
chosen school
Student’s assigned school is school of
choice
Family moved to neighborhood so
student eligible for school
Total .............................................................. 45,790 83 15 2 26
Household poverty status
Above poverty level .......................................... 36,181 83 15 2 27At or below poverty level ................................. 9,609 82 17 2 22
Parents’ highest education level
Less than high school ....................................... 3,535 80 18 2 ! 22High school graduate or equivalent ................. 12,262 83 15 2 24Vocational/technical education after high school or some college .............................. 14,822 83 15 2 24College graduate ............................................... 8,144 83 14 2 29Graduate or professional school ....................... 7,028 83 16 2 35
Parents’ language
Both/only parent(s) speak(s) English .............. 40,298 83 16 2 26One of two parents speaks English .................. 991 76 22 3 ! 30No parent speaks English ................................. 4,501 85 13 1 29
Student’s grade level1
K – 1st grade ..................................................... 6,798 82 16 2 262nd – 3rd grade ................................................. 6,770 81 17 2 264th – 5th grade ................................................... 7,436 81 16 2 6th – 8th grade ................................................... 10,903 84 15 1 279th – 10th grade ................................................. 7,058 83 15 2 2411th – 12th grade .............................................. 6,819 85 14 1 27
Student’s race/ethnicity
White, non-Hispanic ......................................... 27,955 85 13 2 28Black, non-Hispanic ......................................... 7,472 74 25 1 19Hispanic ............................................................. 7,672 84 14 2 26Asian or Pacific Islander, non-Hispanic .......... 1,252 78 22 # 33Other, non-Hispanic .......................................... 1,439 79 21 1 ! 19
Student’s sex
Male ................................................................... 23,496 83 15 2 26Female ............................................................... 22,295 83 15 2 26
# Rounds to zero. ! Interpret data with caution. 1 Students whose parents reported that their classes were “ungraded” were excluded from the analyses of grade level. NOTE: Students who were homeschooled were excluded from the table. Detail may not sum to totals because of rounding. SOURCE: U.S. Department of Education, National Center for Education Statistics, Parent and Family Involvement in Education Survey of the 2003 National Household Education Surveys Program (PFI-NHES:2003).

50
Table 14a. Standard errors of the percentage distribution of public school students in grades K through 12 by school choice and percent of students whose families moved to neighborhood for students to attend school, by household and student characteristics: 2002–03
Enrollment by school choice
Characteristic Number of students in grades K through 12
(thousands)Student is in
assigned schoolStudent is in
chosen school
Student’s assigned school is school of
choice
Family moved to neighborhood so
student eligiblefor school
Total ................................................................. 213.6 0.5 0.4 0.2 0.6
Household poverty status
Above poverty level ............................................. 250.5 0.5 0.5 0.2 0.7At or below poverty level .................................... 184.3 1.0 1.0 0.3 1.4
Parents’ highest education level
Less than high school .......................................... 199.5 1.8 1.8 0.6 2.1High school graduate or equivalent .................... 274.7 0.9 0.9 0.3 1.5Vocational/technical education after high school or some college ......................... 330.2 0.8 0.8 0.3 1.1College graduate .................................................. 255.3 1.0 1.0 0.4 1.2Graduate or professional school .......................... 237.3 1.3 1.3 0.4 1.7
Parents’ language
Both/only parent(s) speak(s) English ................. 251.3 0.5 0.5 0.2 0.6One of two parents speaks English ..................... 81.6 3.4 3.2 1.2 3.8No parent speaks English .................................... 143.5 1.4 1.4 0.3 1.6
Student’s grade level1
K – 1st grade ........................................................ 74.2 1.0 1.0 0.4 1.42nd – 3rd grade .................................................... 61.1 1.3 1.2 0.4 1.34th – 5th grade ...................................................... 73.8 1.1 1.0 0.5 1.36th – 8th grade ...................................................... 87.9 0.9 1.0 0.3 1.19th – 10th grade .................................................... 70.1 1.0 0.9 0.3 1.411th – 12th grade ................................................. 74.3 0.9 0.9 0.3 1.3
Student’s race/ethnicity
White, non-Hispanic ............................................ 230.8 0.5 0.5 0.3 0.9Black, non-Hispanic ............................................ 75.2 1.5 1.5 0.3 1.3Hispanic ................................................................ 59.3 1.1 1.0 0.4 1.1Asian or Pacific Islander, non-Hispanic ............. 104.8 3.7 3.6 0.4 3.9Other, non-Hispanic ............................................. 117.5 3.2 3.0 0.6 3.1
Student’s sex
Male ...................................................................... 285.7 0.6 0.6 0.2 0.8Female .................................................................. 267.6 0.6 0.6 0.3 0.9
# Rounds to zero. 1 Students whose parents reported that their classes were “ungraded” were excluded from the analyses of grade level. NOTE: Students who were homeschooled were excluded from the table. Detail may not sum to totals because of rounding. SOURCE: U.S. Department of Education, National Center for Education Statistics, Parent and Family Involvement in Education Survey of the 2003 National Household Education Surveys Program (PFI-NHES:2003).

51
Table 15. Percentage of students with disabilities in grades K through 12 who received services from public and private sources, by source of services and selected characteristics: 2002–03
Source of services for student’s special health needs
Individualized Education Programs (IEP) and special education1
Characteristic Number of students in
grades K through 12
(thousands)
Local school district
State or local health or
social service agency
Doctor, clinic, or
other health care provider
Other source
Services were
provided through an IEP
Family worked with school to
develop or change IEP2
Student currently in
special education
classes Total .............................................................. 14,384 33 15 61 3 34 89 28
School type
Public, assigned ................................................. 10,640 35 16 62 3 34 89 29Public, chosen .................................................... 2,382 35 18 59 4 38 86 29Private, church-related ...................................... 943 14 4 ! 56 7 13 95 7 ! Private, not church-related ................................ 420 26 13 ! 66 13 ! 40 94 32
Household poverty status
Above poverty level .......................................... 11,290 32 11 62 4 35 92 27At or below poverty level ................................. 3,094 36 29 57 3 31 76 33
Parents’ highest education level
Less than high school ........................................ 1,177 39 27 55 2 ! 32 71 35High school graduate or equivalent .................. 3,835 38 20 54 3 34 89 33Vocational/technical education after high school or some college ............................... 4,678 33 16 65 4 36 90 29College graduate ................................................ 2,345 27 8 61 4 30 88 19Graduate or professional school ....................... 2,349 29 8 66 3 33 96 22
Parents’ language
Both/only parent(s) speak(s) English ............... 13,147 34 14 61 4 35 90 29One of two parents speaks English .................. 181 33 24 68 4 ! 29 89 30No parent speaks English .................................. 1,056 27 26 54 0 15 48 16
Disability affects student’s ability to learn
Yes ...................................................................... 5,252 55 21 60 6 58 91 53No ....................................................................... 9,132 20 12 61 2 18 84 12
Student’s grade level3
K – 1st grade ......................................................... 1,616 39 15 57 3 ! 36 91 232nd – 3rd grade ..................................................... 2,150 36 17 61 3 34 85 284th – 5th grade ...................................................... 2,416 36 14 65 3 34 93 306th – 8th grade ...................................................... 3,614 34 16 62 4 33 88 299th – 10th grade .................................................... 2,354 29 16 59 4 35 89 3111th – 12th grade .................................................. 2,229 26 14 57 4 32 90 23
Student’s race/ethnicity
White, non-Hispanic ......................................... 9,412 33 11 62 3 34 92 28Black, non-Hispanic .......................................... 2,122 36 26 58 4 40 81 37Hispanic ............................................................. 2,121 30 20 56 3 22 75 21Asian or Pacific Islander, non-Hispanic .......... 283 38 23 ! 69 0 41 93 23Other, non-Hispanic .......................................... 445 39 19 66 6 ! 35 96 23
See notes at end of table.

52
Table 15. Percentage of students with disabilities in grades K through 12 who received services from public and private sources, by source of services and selected characteristics: 2002–03—Continued
Source of services for student’s special health needs Individualized Education Programs (IEP)
and special education1
Characteristic Number of students in
grades K through 12
(thousands)
Local school district
State or local health
or social service agency
Doctor, clinic, or
other health care provider
Other source
Services were
provided through an
IEP
Family worked with school to
develop or change IEP2
Student currently in special education
classes Total .............................................................. 14,384 33 15 61 3 34 89 28
Student’s sex
Male .................................................................... 8,496 38 16 60 4 40 90 32Female ................................................................ 5,888 26 14 63 3 24 87 22
! Interpret data with caution. 1 Estimates pertain only to the students whose parents reported that their children received services. 2 Estimates pertain only to the students whose parents reported that their children received services through an IEP. 3 Students whose parents reported that their classes were “ungraded” were excluded from the analyses of grade level. NOTE: Estimates pertain to students whose parents indicated they had one or more of the following disabilities: a specific learning disability; mental retardation; speech or language delay; a serious emotional disturbance; deafness or another hearing impairment; blindness or another visual impairment; an orthopedic impairment; another health impairment lasting 6 months or more; autism; attention deficit disorder (ADD, ADHD); or pervasive developmental disorder (PDD). Students who were homeschooled were excluded from the table. Detail may not sum to totals because of rounding. SOURCE: U.S. Department of Education, National Center for Education Statistics, Parent and Family Involvement in Education Survey of the 2003 National Household Education Surveys Program (PFI-NHES:2003).

53
Table 15a. Standard errors of the percentage of students with disabilities in grades K through 12 who received services from public and private sources, by source of services and selected characteristics: 2002–03
Source of services for student’s special health
needs Individualized Education Programs (IEP)
and special education1
Characteristic Number of students in
grades K through 12
(thousands)
Local school district
State or local health or social service agency
Doctor, clinic, or
other health care
providerOther
source
Services were
provided through an IEP
Family worked with school to
develop or change IEP2
Student currently in
special education
classes
Total ...................................................................... 265.5 1.1 0.8 1.1 0.4 1.3 1.2 1.1 School type
Public, assigned ......................................................... 268.8 1.4 0.9 1.3 0.4 1.6 1.4 1.4Public, chosen ............................................................ 107.3 2.7 2.1 2.5 0.9 2.8 3.4 2.9Private, church-related .............................................. 67.8 2.1 1.3 3.8 2.1 2.9 5.1 2.4Private, not church-related ........................................ 59.4 5.9 4.3 7.5 5.0 7.8 3.9 6.5
Household poverty status
Above poverty level .................................................. 249.2 1.2 0.8 1.3 0.4 1.5 1.1 1.2At or below poverty level .......................................... 137.7 2.6 2.5 2.3 0.9 2.5 4.1 2.3
Parents’ highest education level
Less than high school ............................................. 106.7 4.4 4.0 3.9 1.1 4.4 6.7 4.0High school graduate or equivalent ....................... 181.7 2.2 1.7 2.1 0.8 2.6 3.0 2.2Vocational/technical education after high school or some college ..................................... 176.9 1.6 1.5 1.7 0.8 2.0 1.9 1.8College graduate ..................................................... 139.1 2.5 1.1 2.3 0.9 2.6 3.1 2.3Graduate or professional school ............................ 121.8 2.3 1.4 2.8 0.7 2.9 1.9 2.2
Parents’ language
Both/only parent(s) speak(s) English .................... 258.5 1.2 0.9 1.2 0.4 1.4 1.4 1.2One of two parents speaks English ........................ 26.7 7.4 5.8 7.8 3.0 7.6 9.1 8.8No parent speaks English ....................................... 83.1 3.0 2.7 3.3 0.0 2.6 8.7 2.8
Disability affects student’s ability to learn
Yes ...................................................................... 173.5 1.6 1.6 1.7 0.8 1.8 1.7 1.8No ....................................................................... 228.2 1.1 0.8 1.4 0.4 1.3 2.2 1.1
Student’s grade level3
K – 1st grade ................................................................... 78.2 3.1 2.2 2.9 0.9 3.5 2.5 2.72nd – 3rd grade ............................................................... 87.6 2.6 2.0 3.0 0.8 2.9 4.3 2.84th – 5th grade ................................................................ 104.1 2.3 1.7 2.3 0.7 2.4 2.1 2.76th – 8th grade ................................................................ 125.1 1.9 1.6 2.3 0.8 2.2 2.7 2.29th – 10th grade .............................................................. 107.6 2.1 1.9 2.1 1.1 3.0 2.9 2.711th – 12th grade ............................................................ 90.5 3.0 1.9 2.6 0.8 3.5 4.1 3.3
Student’s race/ethnicity
White, non-Hispanic .......................................... 233.9 1.4 0.8 1.4 0.5 1.6 1.5 1.5Black, non-Hispanic .......................................... 121.5 3.1 2.7 2.8 1.1 3.4 4.0 3.6Hispanic .............................................................. 74.7 2.1 1.7 2.6 0.7 2.2 4.6 2.4Asian or Pacific Islander, non-Hispanic ........... 43.0 9.5 9.8 9.1 0.0 10.2 5.4 6.7Other, non-Hispanic .......................................... 60.1 6.3 4.3 6.8 3.3 7.6 4.1 6.3
See notes at end of table.

54
Table 15a. Standard errors of the percentage of students with disabilities in grades K through 12 who received services from public and private sources, by source of services and selected characteristics: 2002–03—Continued
Source of services for student’s special health needs Individualized Education Programs (IEP)
and special education1
Characteristic Number of students in
grades K through 12
(thousands)
Local school district
State or local health or social service agency
Doctor, clinic, or
other health care provider
Other source
Services were
provided through an IEP
Family worked with
school to develop or
change IEP2
Student currently in special education
classes Total ............................................................... 265.5 1.1 0.8 1.1 0.4 1.3 1.2 1.1
Student’s sex
Male .................................................................... 206.3 1.5 1.0 1.3 0.5 1.6 1.5 1.4Female ................................................................ 177.3 1.4 1.2 2.0 0.6 1.7 2.2 1.7
1 Estimates pertain only to the students whose parents reported that their children received services. 2 Estimates pertain only to the students whose parents reported that their children received services through an IEP. 3 Students whose parents reported that their classes were “ungraded” were excluded from the analyses of grade level. NOTE: Estimates pertain to students whose parents indicated they had one or more of the following disabilities: a specific learning disability; mental retardation; speech or language delay; a serious emotional disturbance; deafness or another hearing impairment; blindness or another visual impairment; an orthopedic impairment; another health impairment lasting 6 months or more; autism; attention deficit disorder (ADD, ADHD); or pervasive developmental disorder (PDD). Students who were homeschooled were excluded from the table. Detail may not sum to totals because of rounding. SOURCE: U.S. Department of Education, National Center for Education Statistics, Parent and Family Involvement in Education Survey of the 2003 National Household Education Surveys Program (PFI-NHES:2003).

55
References
Brick, J.M. (1996). Undercoverage Bias in Estimates of Characteristics of Adults and 0- to 2-Year-Olds in the 1995
National Household Education Survey (NHES:95) (NCES 96–29). U.S. Department of Education. Washington, DC: National Center for Education Statistics.
Brick, J.M., Burke, J., and West, J. (1992). Telephone Undercoverage Bias of 14- to 21-Year-Olds and 3- to 5-Year-Olds (NCES 92–101). U.S. Department of Education. Washington, DC: National Center for Education Statistics.
Brick, J.M., Tubbs, E., Collins, M.A., Nolin, M.J., Cantor, D., Levin, K., and Carnes, Y. (1997). Telephone Coverage Bias and Recorded Interviews in the 1993 National Household Education Survey (NHES:93) (NCES 97–02). U.S. Department of Education. Washington, DC: National Center for Education Statistics.
Hagedorn, M.C., Montaquila, J., Vaden-Kiernan, N., Kim, K., and Chapman, C. (2004a). National Household Education Surveys of 2003: Data File User’s Manual, Volume I (NCES 2004–101). U.S. Department of Education. Washington, DC: National Center for Education Statistics.
Hagedorn, M.C., Montaquila, J., Vaden-Kiernan, N., Kim, K., and Chapman, C. (2004b). National Household Education Surveys of 2003: Data File User’s Manual, Volume II, Parent and Family Involvement in Education Survey (NCES 2004–102). U.S. Department of Education. Washington, DC: National Center for Education Statistics.
Montaquila, J.M., Brick, J.M., and Brock, S.P. (forthcoming). Potential Nonresponse Bias in Estimates from the National Household Education Surveys Program of 2003. U.S. Department of Education. Washington, DC: National Center for Education Statistics.
Montaquila, J.M., Brick, J.M., and Brock, S.P. (1997). Undercoverage Bias in Estimates of Characteristics of Households and Adults in the 1996 National Household Education Survey (NCES 97–39). U.S. Department of Education. Washington, DC: National Center for Education Statistics.
Rao, J.N.K., and Shao, J. (1992). Jackknife Variance Estimation with Survey Data under Hot Deck Imputation. Biometrika, 79, 811–822.
U.S. Census Bureau. (2002). 2000 Census of Population and Housing Survey, File 3: Technical Documentation. Washington, DC: U.S Department of Commerce.
Westat. (2000). WesVar 4.0 User's Guide. Rockville, MD: Author.

56
Appendix A: Technical Notes
Survey Methodology and Data Reliability The National Household Education Surveys Program (NHES) is a set series of telephone surveys sponsored by the U.S. Department of Education's National Center for Education Statistics (NCES). NHES surveys focused on parent and family involvement in education in 1996 and 2003. This report presents data from the Parent and Family Involvement in Education Survey of the 2003 NHES (NHES:2003). NHES:2003 data collection was conducted by Westat and took place from January through April of 2003. This section provides a brief description of the survey methodology; further details appear in Hagedorn et al. (2004a). The NHES:2003 sample was selected using random digit dial (RDD) methods, and the data were collected using computer-assisted telephone interviewing (CATI) technology. A random sample of telephone numbers was selected in the first stage, and within each household with eligible children, at least one eligible child was selected in the second stage.1 The sample for the 2003 survey is nationally representative of all children in kindergarten through grade 12 enrolled in regular school or homeschooled in the 50 states and the District of Columbia. Different probabilities of selection were used to sample children, depending on the characteristics of the telephone number and the number of eligible children in the household, and in some households more than one child was selected; these unequal selection probabilities and the clustering effect of sampling more than one child in some households were accounted for in estimation. In the Parent and Family Involvement in Education interview, information was collected about demographic characteristics, homeschooling, school choice, types and frequency of family involvement in children’s schools, school information practices to involve and support families, learning activities with children outside of school, and the involvement of nonresidential parents. The person chosen as the respondent for the interview was the parent or guardian in the household who knew the most about the child’s education. Although the interview respondent was an adult, the sampling unit and unit of analysis is the child. Multiple attempts were made to complete interviews with persons not available at the time of selection. Interviews were conducted in both English and Spanish. Nine percent of the interviews were conducted in Spanish. The parent interview was completed by the parents of 12,426 of the 14,942 sampled children in kindergarten through grade 12. Data Reliability Estimates produced using data from the survey are subject to two types of error, sampling and nonsampling errors. Nonsampling errors are errors made in the collection and processing of data. Sampling errors occur because the data are collected from a sample rather than the whole population. Nonsampling Errors Nonsampling error is the term used to describe variations in the estimates that may be caused by population coverage limitations and data collection, processing, and reporting procedures. The sources of nonsampling errors are typically problems like unit2 and item nonresponse, the differences in respondents' interpretations of the meaning of the questions, response differences related to the particular time the survey was conducted, and mistakes in data preparation. In the 2003 survey, efforts were made to minimize nonsampling error through cognitive testing in the survey design stage, a two-stage field test of the survey, online data edits and postinterview edits, and a comparison of the survey estimates with similar estimates from previous surveys. An important source of nonsampling error for a telephone survey is the failure to include persons who do not live in households with telephones. This is particularly problematic in random digit dial (RDD) surveys
1 In some households, eligible adults were sampled for the Adult Education for Work-Related Reasons Survey of the 2003 NHES. 2 In the 2003 survey, the unit nonresponse rate for children is defined as the percentage of eligible sampled children whose parents do not complete the survey.

57
because so little is known about the sampled telephone numbers with which contact has not been made. The October 2001 Current Population Survey (CPS) shows that 95.8 percent of all adults ages 16 and older live in households with telephones and 95.2 percent of persons age 4 to 20 live in households with telephones (based on independent tabulations of the October 2001 CPS). Estimation procedures were used to help reduce the bias in the estimates associated with excluding the 4 percent of children who do not live in households with telephones. An issue that has arisen in recent years is households that have cell phones rather than landlines. Specific statistics on "cell phone only households" will be available from the February 2004 CPS. Several studies have examined telephone coverage bias for subsamples of the population in NHES. For example, Brick, Burke, and West (1992) looked at undercoverage bias for 3- to 5-year-olds and 14- to 21-year-olds. Brick (1996) examined undercoverage bias for 0- to 2-year-olds and adults. Undercoverage bias for 3- to 7-year-olds was examined by Brick et al. (1997), and undercoverage bias for estimates of characteristics of households and for adults was investigated by Montaquila, Brick, and Brock (1997). These studies found that with very few exceptions, the adjusted weights yielded estimates with absolute telephone coverage bias of 2 percent or less. The only important exceptions are estimates of educational attainment for certain subgroups of adults (in particular, Blacks, Hispanics, and renters). Another potential source of nonsampling error is respondent bias. Respondent bias occurs when respondents systematically misreport (intentionally or unintentionally) information in a study. There are many different forms of respondent bias. One of the best known is social desirability bias, which occurs when respondents give what they believe is the socially desirable response. For example, surveys that ask about whether respondents voted in the most recent election typically obtain a higher estimate of the number of people who voted than do voting records. Although respondent bias may affect the accuracy of the results, it does not necessarily invalidate other results from a survey. If there are no systematic differences among specific groups under study in their tendency to give socially desirable responses, then comparisons of the different groups will accurately reflect differences among the groups. In this report, there may be a tendency for respondents to say that they participated in a school activity when they did not, went on outings when they did not, expect to pay for their children’s education after high school when they do not, etc. There is no a priori reason, however, to believe that some parents are more likely than others to give a socially desirable response. Thus, it is likely that contrasts in this E.D. TAB reflect true differences by school, family, and student characteristics. Another form of respondent bias occurs when respondents give unduly positive assessments about those close to them. For example, parents may give rosier assessments about their children’s school experiences than might be obtained from school records or from the children themselves. It is possible that parents who are highly involved in their children’s schools are more likely than those who are not so involved to say that their children are doing well in school. However, it is also possible that parents who are highly involved in their children’s schools have more information than those who are less involved on which to base their reports. This information could be positive or negative. Thus, it is equally conceivable that parents who are highly involved in their children’s schools are less likely than other parents to give rosy assessments of their children’s school experiences. Readers should be aware that respondent bias may be present in this survey as in any survey. It is not possible to state precisely how such bias may affect the results. Response Rates In the 2003 survey, Screener interviews were completed with 32,049 households, with a weighted Screener unit response rate of 65 percent. A Screener was used to collect information on household composition and interview eligibility. In households with one eligible child, the child was selected for PFI with certainty. In households with two eligible children, both were selected for PFI with certainty. If there were more than two eligible children/youth, then two were sampled with equal probability. The parent interview was completed by the parents of 12,426 of the 14,942 sampled children in kindergarten through the 12th grade; these yielded a weighted unit response rate of 83 percent using base weights. Thus, the overall unit response rate for the Parent and Family Involvement in Education Survey in 2003 was 54 percent (the product of the Screener unit response rate and the parent interview unit response rate).

58
A unit nonresponse bias analysis was undertaken for NHES:2003. (See Montaquila et al. forthcoming.) This study involved an examination of unit response rates as a whole and for various subgroups, an analysis to determine characteristics that are associated with Screener unit nonresponse, and a comparison of estimates based on adjusted and unadjusted weights. The analysis of unit nonresponse bias showed no evidence of bias in estimates computed with nonresponse adjusted weights from the PFI-NHES:2003 survey. The statistical adjustments used in weighting may have corrected at least partially for biases that might have existed due to differential unit nonresponse. Unit nonresponse bias may still be present in other variables that were not studied. Item nonresponse (i.e., the failure to complete some items in an otherwise completed interview) was very low for most items in the 2003 survey. The item nonresponse rates for most variables included in this report are 3 percent or lower. All variables in the report had nonresponse rates of 6 percent or lower. Variables in this report that had nonresponse rates that were higher than 3 percent are the following: whether the family worked with the school to develop or change an IEP; the parent’s feelings about the amount of standardized testing done at the child’s school; and parent reports about how well the school provided information about community services, how to help their child plan for college, and how to help their child plan for work. Items with missing data were imputed using a hot-deck procedure (Rao and Shao 1992) in which cells are formed that contain cases with similar characteristics and a donor value is used to impute the missing value. The estimates included in this report are based on the imputed data. Sampling Errors The sample of telephone households selected for the 2003 survey is just one of many possible samples that could have been selected. Therefore, estimates produced from this sample may differ from estimates that would have been produced from other samples. This type of variability is called sampling error because it arises from using a sample of households with telephones, rather than having surveyed all households with telephones. The standard error is a measure of the variability due to sampling when estimating a statistic; standard errors for estimates presented in this report were computed using a jackknife replication method. Standard errors can be used as a measure of the precision expected from a particular sample. The probability that a sample estimate would differ from the population parameter obtained from a complete census count by less than 1 standard error is about 68 percent. The chance that the difference would be less than 1.65 standard errors is about 90 percent; and that the difference would be less than 1.96 standard errors, about 95 percent. Standard errors for all of the estimates are presented in the tables. These standard errors can be used to produce confidence intervals. For example, an estimated 61 percent of parents reported in 2003 that the school did very well at letting them know between report cards how their child was doing in school. This figure has an estimated standard error of 0.6. Therefore, the estimated 95 percent confidence interval for this statistic is approximately 60 to 62 percent (61 ± 1.96 (0.6)). That is, if the processes of selecting a sample, collecting the data, and constructing the confidence interval were repeated, it would be expected that in 95 out of 100 samples from the same population, the confidence interval would contain the true participation rate. Weighting
All of the estimates in this report are based on weighting the observations using the probabilities of selection of the respondents and other adjustments to partially account for nonresponse and coverage bias. Weights were developed to produce unbiased and consistent estimates of the national totals. The weight used in this E.D. TAB is FPWT, the weight variable used to estimate the characteristics of children and youth. In addition to properly weighting the responses, special procedures for estimating the statistical significance of the estimates were employed because the NHES:2003 data were collected using a complex sample design. Complex sample designs result in data that violate some of the assumptions that are normally used to assess

59
the statistical significance of results from a simple random sample. For example, frequently the standard errors of the estimates from these surveys are larger than would be expected if the sample was a simple random sample and the observations were independent and identically distributed random variables. Eighty replicate weights, FPWT1 to FPWT80, were used to produce estimates of the sampling errors of the estimates. The estimates and standard errors presented in this report were produced using Wesvar Complex Samples software and a jackknife replication procedure (Westat 2000). Statistical Tests The tests of significance used in this E.D. TAB are based on Student’s t statistics for the comparison of individual estimates and for bivariate relationships. The test used assumes the two subgroups are independent. Due to the sampling of two children in some households with eligible children, the two subgroups are not truly independent if the two children are in the different subgroups in the comparison. However, for most items, any covariance between children in the same household is expected to be positive. Therefore, the t-tests that do not reflect this covariance will generally be conservative. To test for differences between subgroups, standard errors were computed using jackknife replication methods. To test for a difference between two subgroups in the population proportion having a particular characteristic, say 1P versus 2P , the test statistic is computed as:
( )[ ] ( )[ ]22
21
12
.... pespes
ppT
+
−= ,
where ip is the estimated proportion of subgroup i (i = 1, 2) having the particular characteristic and ( )ipes .. is the standard error of that estimate. Thus, if p1 is for the 35 percent of students in households that were above the poverty level whose parents “strongly agreed” that the student’s school makes it easy for the family to be involved there, with a standard error of 1.6, and p2 is for the 45 percent of students in households that were at or below the poverty level whose parents “strongly agreed” that the student’s school makes it easy to be involved there, with a standard error of .6, T = 5.89. For the aforementioned comparison, the decision rule is to reject the null hypothesis (i.e., that there is no difference between the two groups in the population in terms of the proportion having the characteristic) if
dftT
;2α> , where
dft
;2α is the value such that the probability that a Student’s t random variable with df degrees
of freedom exceeds that value is 2α .

60
Appendix B: Glossary Each variable used in analyses for this E.D. TAB is described below. First, demographic variables used in the tables are described. These are alphabetized within topic. Second, other variables are described in the order that they appear in the tables. When the variable is in the Parent and Family Involvement in Education Survey of the 2003 National Household Education Surveys Program (PFI-NHES:2003) data file, the variable name appears in parentheses after the bold entry name. If a variable is not on the data file, but constructed for the purpose of this report, information is provided about how the variable was derived. For more information on variable construction, please see Hagedorn et al. (2004b). SCHOOL CHARACTERISTICS
SCHOOL SCHEDULE (SSCHEDUL): This variable is used to classify whether the student went to a school with a traditional schedule or a year-round schedule. The data for SSCHEDUL were taken directly from the PFI parent questionnaire (PC14) when available. Otherwise, they were imputed.
SCHOOL TYPE (SCHLTYPE): The variable SCHLTYPE classifies the school currently attended as either public or private using the variable SPUBLIC (PC1). Schools that are public are further classified using the variable SCHOICE (PC2) according to whether the school was chosen or assigned. Schools that are private are also classified using the variable SRELGON (PC9) as being church-related or not church-related. Otherwise, the data are imputed. The values for SCHLTYPE are: 1) = Public, assigned; 2) Public, chosen; 3) Private, church-related; 4) Private, not church-related; and -1) Home school.
HOUSEHOLD CHARACTERISTICS HOUSEHOLD POVERTY STATUS (POVERTY): NHES provides an approximate measure of poverty. Households were asked to report the total income of all persons in the household over the past year using income ranges rather than exact dollars. The income variable used to construct POVERTY was HINCOME (PY16OV) that listed possible income ranges (e.g., $10,001 to 15,000, $15,001 to $20,000, etc., up to over $100,000). If data for HINCOME were missing, they were imputed. Using the income ranges and household size, poverty thresholds were used to establish poverty status. Thresholds to define poverty were based on weighted averages from 2002 census poverty thresholds. A household was considered in poverty if a household of a particular size matched the income categories shown in table A-1 below. Table B-1. Poverty definition for Parent and Family Involvement in Education (PFI) analysis
Household size Income categories in variable HINCOME (PY16OV)
1 Less than or equal to $10,000 2 Less than or equal to $15,000 3 Less than or equal to $15,000 4 Less than or equal to $20,000 5 Less than or equal to $25,000 6 Less than or equal to $25,000 7 Less than or equal to $30,000 8 Less than or equal to $35,000 9+ Less than or equal to $40,000
SOURCE: U.S. Department of Education, National Center for Education Statistics, Parent and Family Involvement in Education Survey of the 2003 National Household Education Surveys Program (PFI-NHES:2003).

61
PARENTS’ HIGHEST EDUCATION LEVEL (PARGRADE): The variable PARGRADE indicates the highest level of education for the subject child's parents or nonparent guardians who reside in the household. It is constructed from questions in the PFI parent questionnaire about the mother’s education and whether she received a high school diploma or equivalent (MOMGRADE, PU7; MOMDIPL, PU8 ) and the father’s education and whether he received a high school diploma or equivalent (DADGRADE, PV7; DADDIPL, PV8). If these data were missing for a household member, they were imputed. The values for PARGRADE are: 1) Less than high school diploma; 2) High school graduate or equivalent; 3) Vocational/technical education after high school or some college; 4) College graduate; and 5) Graduate or professional school.
PARENTS’ LANGUAGE (LANGUAGE): The variable LANGUAGE indicates whether or not
parent(s)/guardian(s) in the household know English. LANGUAGE was created using variables from the PFI parent questionnaire about the mother and father’s language (MOMLANG (PU2), MOMSPEAK (PU3), DADLANG (PV2) and DADSPEAK (PV3)). If these data were missing for a household member, they were imputed. A parent is categorized as knowing English if English was one of his/her first languages or one of the primary languages he/she spoke in the household at the time of the survey. The values for LANGUAGE are: 1) 1= Both/only parent(s) learned English as a child or currently speak(s) English in the home; 2) One of two parents learned English as a child or currently speaks English in the home; and 3) No parent learned English as a child and both/only parent(s) currently speak(s) a non-English language in the home. STUDENT CHARACTERISTICS STUDENT’S GRADE LEVEL (ALLGRADE): This variable was constructed from parent reports of student grade level in GRADE (PB6) or grade level equivalent in GRADEEQ (PB7) when available. Otherwise, it was imputed. Parent reports that the student was in transitional kindergarten, kindergarten, or prefirst grade were all counted as kindergarten for ALLGRADE. If the variable GRADE indicated that a child was in grades 1 through 12, the variable GRADE was used to set ALLGRADE. If the variable GRADE indicated that a child was in an ungraded class, in special education, or was homeschooled, and the variable for grade equivalent, GRADEEQ, was equal to U for “ungraded” or was missing, then ALLGRADE was set to U for ungraded. Otherwise, if the variable GRADE indicated that a child was in an ungraded class, in special education, or was homeschooled, and the variable for grade equivalent was not missing, then ALLGRADE was equal to the grade equivalent given in GRADEEQ. The values for ALLGRADE are: 1) K: Transitional kindergarten, kindergarten, and prefirst grade; 2) 1: First grade or equivalent; 3) 2: Second grade or equivalent; 4) 3: Third grade or equivalent; 5) 4: Fourth grade or equivalent; 6) 5: Fifth grade or equivalent; 7) 6: Sixth grade or equivalent; 8) 7: Seventh grade or equivalent; 9) 8: Eighth grade or equivalent; 10) 9: Ninth grade or equivalent/freshman; 11) 10: Tenth grade or equivalent/sophomore; 12) 11: Eleventh grade or equivalent/junior; 13) 12: Twelfth grade or equivalent/senior; and 14) U: Ungraded/no equivalent.
STUDENT’S RACE/ETHNICITY (RACEETH2): The variable RACEETH2 indicates the race and ethnicity of the child and is based on the variables for race (CRACE, PI2) and Hispanic origin (CHISPAN, PI3) in the PFI parent questionnaire. If these data were missing, they were imputed. If the respondent designates the child's ethnicity as Hispanic, RACEETHN is Hispanic regardless of whether RACE was classified as White, Black, Asian or Pacific Islander, or another race. The values of RACEETH2 are: 1) White, non-Hispanic; 2) Black, non-Hispanic; 3) Hispanic; 4) Asian or Pacific Islander; and 5) All other races, non-Hispanic.
STUDENT’S SEX (SEX): The data for the variable SEX are taken directly from the PFI parent questionnaire (PA3) when available. Otherwise, they were imputed.

62
MEANS BY WHICH SCHOOL COMMUNICATED WITH PARENTS
NOTES OR E-MAIL (FSNOTES): The data for FSNOTES are taken directly from the PFI parent questionnaire (PE4a) when available. Otherwise, they were imputed.
NEWSLETTERS, MEMOS, OR NOTICES (FSMEMOS): The data for FSMEMOS are taken directly from the PFI parent questionnaire (PE4b) when available. Otherwise, they were imputed.
TELEPHONE (FSPHONE): The data for FSPHONE are taken directly from the PFI parent questionnaire (PE4c) when available. Otherwise, they were imputed. TOPICS ABOUT WHICH SCHOOL PROVIDED INFORMATION
STUDENT’S PERFORMANCE: In table 2, the data for whether the school provided information on this topic are based on a recode of the variable FSSPPERF (PE5a) in the PFI parent questionnaire. Responses indicating that the school provided this information “very well,” “just okay,” or “not very well” (FSSPPERF = 1, 2, or 3) were included. Responses indicating that the school “doesn’t do it at all” (FSSPPERF = 4) were excluded. Otherwise, values were imputed.
WHAT CHILDREN OF THE STUDENT’S AGE ARE LIKE: In table 2, the data for whether the school provided information on this topic are based on a recode of the variable FSSPCDEV (PE5b) in the PFI parent questionnaire. Responses indicating that the school provided this information “very well,” “just okay,” or “not very well” (FSSPCDEV = 1, 2, or 3) were included. Responses indicating that the school “doesn’t do it at all” (FSSPCDEV = 4) were excluded. Otherwise, values were imputed.
OPPORTUNITIES TO VOLUNTEER: In table 2, the data for whether the school provided information on this topic are based on a recode of the variable FSSPVOLN (PE5c) in the PFI parent questionnaire. Responses indicating that the school provided this information “very well,” “just okay,” or “not very well” (FSSPVOLN = 1, 2, or 3) were included. Responses indicating that the school “doesn’t do it at all” (FSSPVOLN = 4) were excluded. Otherwise, values were imputed.
HOW TO HELP STUDENT LEARN AT HOME: In table 2, the data for whether the school provided information on this topic are based on a recode of the variable FSSPHOME (PE5d) in the PFI parent questionnaire. Responses indicating that the school provided this information “very well,” “just okay,” or “not very well” (FSSPHOME = 1, 2, or 3) were included. Responses indicating that the school “doesn’t do it at all” (FSSPHOME = 4) were excluded. Otherwise, values were imputed.
COMMUNITY SERVICES: In table 2, the data for whether the school provided information on this topic are based on a recode of the variable FSSPSERV (PE5e) in the PFI parent questionnaire. Responses indicating that the school provided this information “very well,” “just okay,” or “not very well” (FSSPSERV = 1, 2, or 3) were included. Responses indicating that the school “doesn’t do it at all” (FSSPSERV = 4) were excluded. Otherwise, values were imputed.
HOW TO HELP WITH HOMEWORK: In table 2, the data for whether the school provided information on this topic are based on a recode of the variable FSSPHW (PE5f) in the PFI parent questionnaire. Responses indicating that the school provided this information “very well,” “just okay,” or “not very well” (FSSPHW = 1, 2, or 3) were included. Responses indicating that the school “doesn’t do it at all” (FSSPHW = 4) were excluded. Otherwise, values were imputed.
WHY STUDENT IS PLACED IN PARTICULAR GROUPS OR CLASSES: In table 2, the data for whether the school provided information on this topic are based on a recode of the variable FSSPCOUR (PE5g) in the PFI parent questionnaire. Responses indicating that the school provided this information “very

63
well,” “just okay,” or “not very well” (FSSPCOUR = 1, 2, or 3) were included. Responses indicating that the school “doesn’t do it at all” (FSSPCOUR = 4) were excluded. Otherwise, values were imputed.
HOW TO HELP STUDENT PLAN FOR COLLEGE: In table 2, the data for whether the school provided information on this topic are based on a recode of the variable FSSPCOLL (PE5h) in the PFI parent questionnaire. Responses indicating that the school provided this information “very well,” “just okay,” or “not very well” (FSSPCOLL = 1, 2, or 3) were included. Responses indicating that the school “doesn’t do it at all” (FSSPCOLL = 4) were excluded. Otherwise, values were imputed.
HOW TO HELP STUDENT PLAN FOR WORK: In table 2, the data for whether the school provided information on this topic are based on a recode of the variable FSSPWORK (PE5i) in the PFI parent questionnaire. Responses indicating that the school provided this information “very well,” “just okay,” or “not very well” (FSSPWORK = 1, 2, or 3) were included. Responses indicating that the school “doesn’t do it at all” (FSSPWORK = 4) were excluded. Otherwise, values were imputed. STUDENT EXPERIENCES IN SCHOOL STUDENT PARTICIPATED IN SCHOOL ACTIVITIES (FOSCHACT): The data for FOSCHACT are taken directly from the PFI parent questionnaire (PG10) when available. Otherwise, they were imputed. TEACHER OR SCHOOL CONTACTED PARENT ABOUT BEHAVIOR PROBLEMS (SEBEHAVR): The data for FSMEETNG are taken directly from the PFI parent questionnaire (PD4) when available. Otherwise, they were imputed. TEACHER OR SCHOOL CONTACTED PARENT ABOUT SCHOOLWORK PROBLEMS (SESCHLWR): The data for FSMEETNG are taken directly from the PFI parent questionnaire (PD5) when available. Otherwise, they were imputed. STUDENT GRADES OR MARKS: Parents were asked whether overall, across all subjects, the student got mostly A’s, mostly B’s, mostly C’s, mostly D’s or lower, or whether the student’s school did not give those grades (SEGRADES, PD2). If the student’s school did not give letter grades (e.g., A, B, C), they were asked whether the parent would describe the student’s work at school as excellent, above average, average, below average, or failing (SEGRADEQ, PD3). The two questions about grades or marks were combined for the variable about student grades or marks. If data were missing, they were imputed. The values for this variable are: 1) Mostly A’s or excellent; 2) Mostly B’s or above average; 3) Mostly C’s or average; and 4) Mostly D’s or lower, or below average or failing. PARTICIPATION IN SCHOOL ACTIVITIES BY PARENT OR OTHER HOUSEHOLD MEMBER
ATTENDED A GENERAL SCHOOL MEETING (FSMEETNG): The data for FSMEETNG are taken directly from the PFI parent questionnaire (PE1a) when available. Otherwise, they were imputed.
ATTENDED REGULARLY-SCHEDULED PARENT-TEACHER CONFERENCE (FSATCNFN): The data for FSATCNFN are taken directly from the PFI parent questionnaire (PE1b) when available. Otherwise, they were imputed.
ATTENDED A SCHOOL OR CLASS EVENT (FSSPORT): The data for FSSPORT are taken directly from the PFI parent questionnaire (PE1c) when available. Otherwise, they were imputed.
ACTED AS VOLUNTEER OR SERVED ON SCHOOL COMMITTEE (FSVOLNTR): The data for FSVOLNTR are taken directly from the PFI parent questionnaire (PE1d) when available. Otherwise, they were imputed.

64
PARTICIPATED IN SCHOOL FUNDRAISING (FSFUNDRS): The data for FSFUNDRS are
taken directly from the PFI parent questionnaire (PE1f) when available. Otherwise, they were imputed. FREQUENCY STUDENT DOES HOMEWORK: This variable was constructed from a question in the PFI parent questionnaire (FHHOME, PF1) that asked about how frequently the student did homework. Students who never did homework and students to whom no homework was given were excluded. If data were missing, they were imputed. Values for the variable indicate whether the student was reported by parents to do homework: 1) less than once a week; 2) 1 to 2 days a week; 3) 3 to 4 days a week; or 4) 5 or more days a week. NUMBER HOURS STUDENT DOES HOMEWORK: This variable was constructed from a question in the PFI parent questionnaire (FHWKHRS, PF2) that asked parents how many hours their children spent on homework outside of school during an “average” week. If data were missing, they were imputed. Hours were categorized into the following: 1) less than an hour but not zero; 2) 1 to 2 hours per week; 3) 3 to 4 hours per week; 4) 5 to 6 hours per week; and 5) 7 or more hours per week. PLACE IN HOME SET ASIDE FOR HOMEWORK (FHPLACE): The data for this variable were taken directly from FHPLACE (PF4) in the PFI parent questionnaire when available. Otherwise, they were imputed. ADULT IN HOUSEHOLD CHECKS THAT HOMEWORK IS DONE (FHCHECK): The data for this variable were taken directly from FHCHECK (PF5) in the PFI parent questionnaire when available. Otherwise, they were imputed. NUMBER OF DAYS PER WEEK PERSONS INSIDE OR OUTSIDE HOUSEHOLD HELPED WITH HOMEWORK: The data for this variable were constructed from FHHELP (PF7) indicating how often someone in the household helped with homework, FHHOME (PF1) indicating how frequently the student had homework, and FHMOMH (PF6a), FHDADH (PF6b), FHSIBH (PF6c), FHHHADLH (PF6d), and FHNHADLH (PF6e) that asked if various persons helped the student with homework either at home or somewhere else during this school year. If FHHOME indicated that the student never did homework or that no homework was given to the student, the case was excluded. If the student had homework (FHHOME) “less than once a week,” “1 to 2 days a week,” “3 to 4 days a week,” or “5 or more days a week,” but no help was given by the mother, father, sibling, or other person inside or outside the household (the items in PF6a–e, FHMOMH, FHDADH, FHSIBH, FHHHADLH, and FHNHADLH = 2 (no help)), the value for the recoded variable was set to indicate that no help was given. Otherwise, the value was set to the value for FHHELP, which indicated how often during this school year the respondent, or any of the people indicated in PF6a-e (the mother, father, etc), helped the child with (his/her) homework. If questionnaire data were not available, the data were imputed. PARENT OR OTHER FAMILY MEMBER READ TO STUDENT IN PAST WEEK (FOREADTO): The data for FOREADTO are taken directly from the PFI parent questionnaire (PG1) when available. Otherwise, they were imputed. HOME ACTIVITIES WITH STUDENT IN THE PAST WEEK
TOLD STUDENT STORY (FOSTORY): The data for FOSTORY are taken directly from the PFI parent questionnaire (PG2a) when available. Otherwise, they were imputed.
DID ARTS AND CRAFTS (FOCRAFTS): The data for FOCRAFTS are taken directly from the PFI parent questionnaire (PG2b) when available. Otherwise, they were imputed.

65
PLAYED SPORTS, ACTIVE GAMES, OR EXCERCISED (FOSPORTS): The data for FOSPORTS are taken directly from the PFI parent questionnaire (PG2c for students in grades K through 5; PG3b for students in grades 6 through 12) when available. Otherwise, they were imputed.
INVOLVED STUDENT IN HOUSHOLD CHORES (FOCHORE): The data for FOCHORE are taken directly from the PFI parent questionnaire (PG2d) when available. Otherwise, they were imputed.
WORKED ON PROJECT (FOBUILD): The data for FOBUILD are taken directly from the PFI parent questionnaire (PG2e for students in grades K through 5; PG3a for students in grades 6 through 12) when available. Otherwise, they were imputed.
TALKED ABOUT FAMILY OR ETHNIC HERITAGE (FOHIST): The data for FOHIST are
taken directly from the PFI parent questionnaire (PG2f) when available. Otherwise, they were imputed.
PLAYED BOARD GAMES OR DID PUZZLES (FOGAMES): The data for FOGAMES are taken directly from the PFI parent questionnaire (PG2g) when available. Otherwise, they were imputed.
DISCUSSED TIME MANAGEMENT (FORESPON): The data for FORESPON are taken directly from the PFI parent questionnaire (PG3c) when available. Otherwise, they were imputed. OUTINGS WITH STUDENT IN THE PAST MONTH
VISITED A LIBRARY (FOLIBRAY): The data for FOLIBRAY are taken directly from the PFI parent questionnaire (PG4a) when available. Otherwise, they were imputed.
GONE TO A PLAY, CONCERT, OR OTHER LIVE SHOW (FOCONCRT): The data for FOCONCRT are taken directly from the PFI parent questionnaire (PG4b) when available. Otherwise, they were imputed.
VISITED AN ART GALLERY, MUSEUM, OR HISTORICAL SITE (FOMUSEUM): The data for FOMUSEUM are taken directly from the PFI parent questionnaire (PG4c) when available. Otherwise, they were imputed.
VISITED A ZOO OR AQUARIUM (FOZOO): The data for FOZOO are taken directly from the PFI parent questionnaire (PG4d) when available. Otherwise, they were imputed.
ATTENDED EVENT SPONSORED BY RELIGIOUS GROUP (FORELIG): The data for FORELIG are taken directly from the PFI parent questionnaire (PG4e) when available. Otherwise, they were imputed.
ATTENDED EVENT SPONSORED BY COMMUNITY OR ETHINIC GROUP
(FOCOMMUN): The data for FOCOMMUN are taken directly from the PFI parent questionnaire (PG4f) when available. Otherwise, they were imputed.
ATTENDED ATHLETIC OR SPORTING EVENT (FOSPRTEV): The data for FOSPRTEV are taken directly from the PFI parent questionnaire (PG4g) when available. Otherwise, they were imputed. STUDENT EXPERIENCES IN SCHOOL
STUDENT FINDS HIS/HER SCHOOLWORK CHALLENGING (SECHALNG): The data for SECHALNG are taken directly from the PFI parent questionnaire (PD1a) when available. Otherwise, they were imputed.

66
STUDENT ENJOYS SCHOOL (SEENJOY): The data for SEENJOY are taken directly from the PFI parent questionnaire (PD1b) when available. Otherwise, they were imputed.
MOST STUDENTS AND TEACHERS IN STUDENT’S SCHOOL RESPECT EACH OTHER (SERESPCT): The data for SERESPCT are taken directly from the PFI parent questionnaire (PD1c) when available. Otherwise, they were imputed.
STUDENT’S SCHOOL MAKES IT EASY FOR FAMILY TO BE INVOLVED THERE (SEEASY): The data for SEEASY are taken directly from the PFI parent questionnaire (PD1d) when available. Otherwise, they were imputed. PARENT EXPECTATIONS FOR STUDENT (SEFUTURE): The data for SEFUTURE are taken directly from the PFI parent questionnaire (PD10) when available. Otherwise, they were imputed. FAMILY TO HELP PAY FOR STUDENT EDUCATION AFTER SCHOOL (SEFAMPAY): The data for SEFUTURE are taken directly from the PFI parent questionnaire (PD11) when available. Otherwise, they were imputed. STUDENT PARTICIPATES IN SCHOOL ACTIVITIES (FOSCHACT): The data for SEFUTURE are taken directly from the PFI parent questionnaire (PG10) when available. Otherwise, they were imputed. OUT-OF-SCHOOL ACTIVITIES
MUSIC LESSONS (FOMUSCLES): The data for FOMUSCLES are taken directly from the PFI parent questionnaire (PG11a) when available. Otherwise, they were imputed.
RELIGIOUS GROUP (FOCHURCH): The data for SEFUTURE are taken directly from the PFI parent questionnaire (PG11b) when available. Otherwise, they were imputed.
ORGANIZED SPORTS (FOORGSPR): The data for FOMUSCLES are taken directly from the PFI parent questionnaire (PG11c) when available. Otherwise, they were imputed.
SCOUTING (FOSCOUTS): The data for FOMUSCLES are taken directly from the PFI parent questionnaire (PG11d) when available. Otherwise, they were imputed.
EDUCATIONAL PROGRAMS (FOEDUC): The data for FOMUSCLES are taken directly from the PFI parent questionnaire (PG11e) when available. Otherwise, they were imputed.
COLLEGE PREP (FOCOLEXM): The data for FOMUSCLES are taken directly from the PFI parent questionnaire (PG11f) when available. Otherwise, they were imputed.
OTHER (FOOOSACT): The data for FOMUSCLES are taken directly from the PFI parent questionnaire (PG11g) when available. Otherwise, they were imputed. PERCENTAGE OF PARENTS REPORTING THAT SCHOOL DID ‘’VERY WELL’’ AT PROVIDING INFORMATION
STUDENT’S PERFORMANCE: In table 12, the data for whether the school provided information on this topic are based on a recode of the variable FSSPPERF (PE5a) in the PFI parent questionnaire. Otherwise, values were imputed. Responses indicating that the school provided this information “very well” (FSSPPERF = 1) were included in the recode.

67
WHAT CHILDREN OF THE STUDENT’S AGE ARE LIKE: In table 12, the data for whether the school provided information on this topic are based on a recode of the variable FSSPCDEV (PE5b) in the PFI parent questionnaire. Otherwise, values were imputed. Responses indicating that the school provided this information “very well” (FSSPPERF = 1) were included in the recode.
OPPORTUNITIES TO VOLUNTEER: In table 12, the data for whether the school provided information on this topic are based on a recode of the variable FSSPVOLN (PE5c) in the PFI parent questionnaire. Otherwise, values were imputed. Responses indicating that the school provided this information “very well” (FSSPPERF = 1) were included in the recode.
HOW TO HELP STUDENT LEARN AT HOME: In table 12, the data for whether the school provided information on this topic are based on a recode of the variable FSSPHOME (PE5d) in the PFI parent questionnaire. Otherwise, values were imputed. Responses indicating that the school provided this information “very well” (FSSPPERF = 1) were included in the recode.
COMMUNITY SERVICES: In table 12, the data for whether the school provided information on this topic are based on a recode of the variable FSSPSERV (PE5e) in the PFI parent questionnaire. Otherwise, values were imputed. Responses indicating that the school provided this information “very well” (FSSPPERF = 1) were included in the recode.
HOW TO HELP WITH HOMEWORK: In table 12, the data for whether the school provided information on this topic are based on a recode of the variable FSSPHW (PE5f) in the PFI parent questionnaire. Otherwise, values were imputed. Responses indicating that the school provided this information “very well” (FSSPPERF = 1) were included in the recode.
WHY STUDENT IS PLACED IN PARTICULAR GROUPS OR CLASSES: In table 12, the data for whether the school provided information on this topic are based on a recode of the variable FSSPCOUR (PE5g) in the PFI parent questionnaire. Otherwise, values were imputed. Responses indicating that the school provided this information “very well” (FSSPPERF = 1) were included in the recode.
HOW TO HELP STUDENT PLAN FOR COLLEGE: In table 12, the data for whether the school provided information on this topic are based on a recode of the variable FSSPCOLL (PE5h) in the PFI parent questionnaire. Otherwise, values were imputed. Responses indicating that the school provided this information “very well” (FSSPPERF = 1) were included in the recode.
HOW TO HELP STUDENT PLAN FOR WORK: In table 12, the data for whether the school provided information on this topic are based on a recode of the variable FSSPWORK (PE5i) in the PFI parent questionnaire. Otherwise, values were imputed. Responses indicating that the school provided this information “very well” (FSSPPERF = 1) were included in the recode. PARENT REPORTS OF BEING ‘’VERY SATISFIED’’
WITH THE SCHOOL (FCSCHOOL): The data for FCSCHOOL are taken directly from the PFI parent questionnaire (PE11a) when available. Otherwise, they were imputed.
WITH TEACHERS STUDENT HAD THIS YEAR (FCTEACHR): The data for FCTEACHR are taken directly from the PFI parent questionnaire (PE11b) when available. Otherwise, they were imputed.
WITH ACADEMIC STANDARDS OF THE SCHOOL (FCSTDS): The data for FCSTDS are taken directly from the PFI parent questionnaire (PE11c) when available. Otherwise, they were imputed.
WITH ORDER AND DISCIPLINE AT THE SCHOOL (FCORDER): The data for FCORDER are taken directly from the PFI parent questionnaire (PE11d) when available. Otherwise, they were imputed.

68
AMOUNT OF HOMEWORK ASSIGNED IS “ABOUT RIGHT” (FHAMOUNT): The data for FHAMOUNT are taken directly from the PFI parent questionnaire (PF3) then available. Otherwise, they were imputed. AMOUNT OF STANDARDIZED TESTING IS “ABOUT RIGHT” (FESTDTST): The data for FESTDTST are taken directly from the PFI parent questionnaire (PE12) when available. Otherwise, they were imputed. ENROLLMENT BY SCHOOL CHOICE (SCHOICE): The data for SCHOICE are taken directly from the PFI parent questionnaire (PC2) when available. Otherwise, they were imputed. FAMILY MOVED TO NEIGHBORHOOD SO STUDENT ELIGIBLE FOR SCHOOL (SNEIGHBR): The data for SNEIGHBR are taken directly from the PFI parent questionnaire (PC8) when available. Otherwise, they were imputed. DISABILITY AFFECTS STUDENT’S ABILITY TO LEARN (HDAFFECT). The data for HDAFFECT are taken directly from the PFI parent questionnaire (PH9) when available. Otherwise, they were imputed. SOURCE OF SERVICES FOR STUDENT’S CONDITION
LOCAL SCHOOL DISTRICT (HDSCHL): The data for HDSCHL are taken directly from the PFI parent questionnaire (PH4a) when available. Otherwise, they were imputed.
STATE OR LOCAL HEALTH OR SOCIAL SERVICE AGENCY (HDGOVT): The data for HDGOVT are taken directly from the PFI parent questionnaire (PH4b) when available. Otherwise, they were imputed.
DOCTOR, CLINIC, OR OTHER HEALTH CARE PROVIDER (HDDOCTOR): The data for HDDOCTOR are taken directly from the PFI parent questionnaire (PH4c) when available. Otherwise, they were imputed.
OTHER SOURCE (HDSOURCE): The data for HDSOURCE are taken directly from the PFI parent questionnaire (PH4d) when available. Otherwise, they were imputed. INDIVIDUALIZED EDUCATION PROGRAMS (IEP) AND SPECIAL EDUCATION
SERVICES WERE PROVIDED THROUGH AN IEP (HNIFSP): The data for HNIFSP are taken directly from the PFI parent questionnaire (PH5) when available. Otherwise, they were imputed.
FAMILY WORKED WITH SCHOOL TO DEVELOP OR CHANGE IEP (HDDEVIEP): The data for HDDEVIEP are taken directly from the PFI parent questionnaire (PH6) when available. Otherwise, they were imputed.
STUDENT CURRENTLY IN SPECIAL EDUCATION CLASS (HDSPCLED): The data for HDSPCLED are taken directly from the PFI parent questionnaire (PH7) when available. Otherwise, they were imputed.