Parametric Investigation of Thrust Augmentation by ...
21
1 Parametric Investigation of Thrust Augmentation by Ejectors on a Pulsed Detonation Tube Jack Wilson and Alexandru Sgondea QSS Group, Inc., Cleveland, Ohio 44135 Daniel E. Paxson and Bruce N. Rosenthal National Aeronautics and Space Administration Glenn Research Center, Cleveland, Ohio 44135 A parametric investigation has been made of thrust augmentation of a 1 in. diameter pulsed detonation tube by ejectors. A set of ejectors was used which permitted variation of the ejector length, diameter, and nose radius, according to a statistical design of experiment scheme. The maximum augmentation ratios for each ejector were fitted using a polynomial response surface, from which the optimum ratios of ejector diameter to detonation tube diameter, and ejector length and nose radius to ejector diameter, were found. Thrust augmentation ratios above a factor of 2 were measured. In these tests, the pulsed detonation device was run on approximately stoichiometric air-hydrogen mixtures, at a frequency of 20 Hz. Later measurements at a frequency of 40 Hz gave lower values of thrust augmentation. Measurements of thrust augmentation as a function of ejector entrance to detonation tube exit distance showed two maxima, one with the ejector entrance upstream, and one downstream, of the detonation tube exit. A thrust augmentation of 2.5 was observed using a tapered ejector. Nomenclature b ij = constants in Eqs. (4) and (5) D = ejector diameter D tube = internal diameter of detonation tube D pulse = effective diameter of flow pulse leaving the driving tube f = frequency ff = detonation tube fill fraction h = length of wires supporting thrust plate L = ejector length L pulse = length of flow pulse leaving the driving tube 2 h m & = mass flow rate of hydrogen R = ejector inlet radius T air = thrust of detonation tube when flowing air only T det = extra thrust of detonation tube only generated by detonations T ejector = thrust of detonation tube plus ejector δT ejector = uncertainty in measurement of T ejector T jet = thrust of detonation tube without ejector δT jet = uncertainty in measurement of T jet W = weight of thrust plate x = distance from detonation tube exit to ejector entrance α = total thrust augmentation ratio δα = uncertainty in thrust augmentation ratio α ss = steady state thrust augmentation ratio α det = unsteady thrust augmentation ratio caused by detonations δ = deflection of thrust plate φ = equivalence ratio τ = ratio T det /T air
Transcript of Parametric Investigation of Thrust Augmentation by ...

1
Parametric Investigation of Thrust Augmentation by Ejectors on a Pulsed Detonation Tube
Jack Wilson and Alexandru Sgondea QSS Group, Inc., Cleveland, Ohio 44135
Daniel E. Paxson and Bruce N. Rosenthal
National Aeronautics and Space Administration Glenn Research Center, Cleveland, Ohio 44135
A parametric investigation has been made of thrust augmentation of a 1 in. diameter pulsed detonation tube by ejectors. A set of ejectors was used which permitted variation of the ejector length, diameter, and nose radius, according to a statistical design of experiment scheme. The maximum augmentation ratios for each ejector were fitted using a polynomial response surface, from which the optimum ratios of ejector diameter to detonation tube diameter, and ejector length and nose radius to ejector diameter, were found. Thrust augmentation ratios above a factor of 2 were measured. In these tests, the pulsed detonation device was run on approximately stoichiometric air-hydrogen mixtures, at a frequency of 20 Hz. Later measurements at a frequency of 40 Hz gave lower values of thrust augmentation. Measurements of thrust augmentation as a function of ejector entrance to detonation tube exit distance showed two maxima, one with the ejector entrance upstream, and one downstream, of the detonation tube exit. A thrust augmentation of 2.5 was observed using a tapered ejector.
Nomenclature bij = constants in Eqs. (4) and (5) D = ejector diameter Dtube = internal diameter of detonation tube Dpulse = effective diameter of flow pulse leaving the driving tube f = frequency ff = detonation tube fill fraction h = length of wires supporting thrust plate L = ejector length Lpulse = length of flow pulse leaving the driving tube
2hm& = mass flow rate of hydrogen R = ejector inlet radius Tair = thrust of detonation tube when flowing air only Tdet = extra thrust of detonation tube only generated by detonations Tejector = thrust of detonation tube plus ejector δTejector = uncertainty in measurement of Tejector Tjet = thrust of detonation tube without ejector δTjet = uncertainty in measurement of Tjet W = weight of thrust plate x = distance from detonation tube exit to ejector entrance α = total thrust augmentation ratio δα = uncertainty in thrust augmentation ratio αss = steady state thrust augmentation ratio αdet = unsteady thrust augmentation ratio caused by detonations δ = deflection of thrust plate φ = equivalence ratio τ = ratio Tdet/Tair

2
I.Introduction he pulsed detonation engine was studied by Nicholls et al.1 as a thrust producing device as early as 1957.
Interest then seems to have lapsed until it was revived in 1991 by Eidelman, Grossman, and Lotati.2 The
objective in using pulsed detonation engines is to achieve high efficiency through use of approximately constant
volume combustion.3,4 Obviously, it is important to establish the performance of pulse detonation engines to see
whether they do match the promise. Thus Zitoun and Desbordes5 compared the impulse from pulsed detonations
with the impulse from a single shot, and found them comparable, although the pulsed detonations were lower. This
they attributed to imperfect fuel-oxidizer mixing in their apparatus. Cambier and Tegnér6 carried out computational
simulations to determine possible techniques for performance improvement. An extensive review of research in this
area has been given by Kailasanath,7 who concluded that performance of idealized laboratory devices is in line with
calculated values, though operation under flight conditions is less well resolved. One way to increase the thrust of a
jet is to add an ejector.8,9 In steady flow, thrust augmentation ratios over 2 have been achieved, but with ejectors of
large diameter compared with the jet.10 Kentfield4 proposed that ejectors should be used on pulsed detonation
engines to increase the thrust, since it is known that unsteady ejectors can generate higher thrust augmentation than a
steady ejector of the same length. Lockwood,2 using a pulsejet driver, achieved a thrust augmentation of 1.9, with an
ejector of diameter slightly over 3 times that of the jet orifice, and length 1.5 times the ejector diameter. Didelle,12
using a jet interrupted by a rotating butterfly valve, also measured a thrust augmentation of 1.9, but with an ejector
of length to diameter ratio of 9. A major feature of any pulsed flow is the starting vortex ring.13,14 Recent works by
Paxson, Wilson, and Dougherty,15 using a pulsejet, Wilson and Paxson,16 using a Hartmann-Sprenger tube, and
Choutapalli et al.,17 using a flow chopper, have all shown an optimum ejector radius, roughly co-incident with the
size of the vortex rings produced. In reference 18, Wilson expanded the earlier work with a Hartmann-Sprenger tube
to different frequencies, and found for this case that the optimum ejector radius depended on the jet properties, with
thrust augmentation being maximized when the jet Lpulse/Dpulse equals the formation number, which is the largest
value of Lpulse/Dpulse at which the flow produces a vortex ring with no trailing jet.19
In applying an ejector to a pulsed detonation engine, it would be expected that there would be an optimum
radius, of about the size of the vortex ring, but since the value of Lpulse/Dpulse for a pulsed detonation tube is usually
much higher than the formation number, it is not obvious that the thrust augmentation will be high. Recently there
have been several reports of experimental20-22 and theoretical23 investigations of thrust augmentation with conflicting
T

3
results, and one report of a shadowgraph investigation of the flow in an ejector driven by a pulsed detonation
engine.24 The calculations by Gröschel et al. did show that thrust augmentations as high as 2 should be possible.
Shehadeh et al.20 used a constant diameter ejector, with an ejector diameter to detonation tube diameter of 2.55, and
found a maximum augmentation of 1.4, when the ejector overlapped the detonation tube. Better performance was
achieved when the nose of the ejector was rounded. Their experiments were performed at a frequency of 10 Hz, with
ethylene and oxygen-nitrogen mixtures. Allgood, et al.21 found that the best position of the ejector was dependent on
fill fraction. They used a constant ejector to tube diameter ratio of 2.75, and tested both straight ejectors, and ejectors
with a diverging tailpiece. Both types of ejector had a bell-mouth entrance. Their maximum thrust augmentation was
1.65 at a fill-fraction of 0.4, with the ejector entrance downstream of the tube exit. Thrust augmentation decreased
with increasing fill-fraction. The detonation tube was operated at a frequency of 30 Hz, using stoichiometric air-
hydrogen mixtures. Rasheed, Tangirala, Pinard, and Dean22 used three different ejectors to detonation tube diameter
ratios of 1.5, 2, and 3, and also found that the best position of the ejector entrance was downstream of the tube exit,
but only saw a thrust augmentation of 1.14. They used air-hydrogen mixtures, operating at 10 Hz. None of these
experiments seem to have observed an optimum ejector radius, nor to have generated thrust augmentations as high
as 2.
The initial objective of the present experiment was to use an existing set of ejectors to provide information on
the optimum diameter, length, and nose radius, for ejectors driven by detonation pulses. This ejector set was used
previously for thrust augmentation experiments using a pulsejet,15 and a Hartmann-Sprenger tube,16,18 as the driver.
The set provides three different diameters, with three different lengths, and three different nose radii, permitting a
Box-Behnken statistical design of experiment. The experiment was performed on a detonation tube operating on air-
hydrogen mixtures, at 20 Hz. As initial experiments showed the optimum ejector length to be longer than any length
tested, a later test was run at a longer length. Further experiments involved increasing the frequency to 40 Hz, and
testing a different ejector geometry, with virtually no straight section, so that it is an inlet section plus a long
diffuser. This was called the tapered ejector.

4
II. Apparatus A. Detonation Tube
An overall diagram of the apparatus is given in Fig. 1(a), and photographs in Figs. 2(a) and 2(b). The detonation
tube first used, as sketched in Fig. 1(b), was 3 feet long, with an internal diameter of 1 in., and an external diameter
of 1.75 in. Hydrogen was chosen as the fuel since it was known that it would detonate in a 1 in. diameter tube.1 The
hydrogen is admitted under pressure by two high frequency valves (Parker-Hannifin Pulse Valves Model 91–200–
900) into a small plenum in the inlet manifold, from where it is fed into the detonation tube via 8 passages in the
face plate. Each passage is surrounded by three air passages, directed to impinge on the hydrogen a short distance
from the face plate, in similar fashion to the injection scheme used by Lee et al.25 The air is flowed continuously, but
the hydrogen is pulsed. The air flow rate and the average hydrogen flow rate are measured with venturi meters. An
Iota One Solenoid Valve Controller opens and closes the hydrogen valves, and provides a signal to fire the spark gap
which triggers the combustion wave which accelerates to a detonation wave. A Shchelkin spiral,26 17 in. long, with
1 in. pitch, is inserted into the front end of the tube, to reduce the deflagration to detonation distance. Three
ionization gauges,27 which are simply spark plugs, are provided from the middle of the tube towards the end, and
spaced 20 cm apart, to measure the detonation speed. In addition, a PCB high frequency pressure transducer, located
4.5 in. from the end of the tube, was initially used to monitor the pressure signal, to verify that a detonation had been
achieved. A more detailed description of the detonation tube has been given by Opalski, Paxson, and Wernet.28
The pressure transducer, plus the final ionization gauge, prevented ejector measurements from being made with
the inlet of the ejector upstream of the detonation tube exit. Later, to permit such measurements, a new tube was
made, with the last 6.5 in. of the tube having an external diameter of 1.25 in., Fig. 1(c). This made the tube external
to internal diameter ratio in this region the same that of the tube used by Shehadeh et al.20 This necessitated moving
the ionization gauges, and the PCB pressure transducer upstream, Figs. 1(c) and 2(b).
Experiments were typically run at a duty cycle around 50 percent. By duty cycle, what is meant is the ratio of the
time during which hydrogen is admitted to the time between pulses. High duty cycles tended to result in overheating
of the spiral. The flow rates were adjusted to give the desired equivalence ratio and fill fraction, ff, which is the
fraction of the tube that is filled with a fuel/air mixture. Inadvertently, the statistical experiment, plus the experiment
to increase the ejector length were run at an equivalence ratio of 1.2, and a fill fraction of 1.4. Later experiments
were made at an equivalence ratio of 1, and a fill fraction of 1.05.

5
Figure 1. (a) is a schematic diagram of the detonation tube, ejector, thrust plate, and thrust spring system. (b) is a diagram of the original detonation tube, and (c) is a diagram of the second detonation tube.
Figure 2. (a) Photograph of the original pulsed detonation tube, with the exit end pointing to the lower right. The short 3 in. diameter ejector is mounted downstream of the tube exit, and (b) the modified tube permitting the ejector entrance to be upstream of the tube exit, and mounted on air bearings for the spring extension technique of thrust measurements. The ballistic thrust plate can be seen at the right.
B. Ejectors

6
The set of ejectors for the statistical experiment is shown schematically in Fig. 3(a). At each ejector diameter
there are two center sections, of different lengths, three inlets with nose radii of 0.25, 0.5, and 0.75 in., and a diffuser
section, which has a half-angle divergence of 5°. By either inserting the diffuser directly into the inlet, or using a
center section, three different lengths are possible, roughly 3, 7.5, and 12.5 in. Unfortunately, the inlets are not all
the same length, so the exact length depends on which inlet is installed. The set comprises three different diameters,
2.2, 3, and 4 in.
One model of pulsed ejector performance is that the vortex rings produced by impulsively starting a flow act like
a piston in pushing external air in front of it into the ejector, and pulling external air in behind it. This seems
commensurate with the optimum ejector diameter being about the same size as the vortex ring. Since the ring grows
slightly as it propagates away from the tube exit, this suggests that if an ejector was tapered so as to follow the
vortex ring growth, it would be a better “fit,” and hence a better piston. In order to verify this, a tapered ejector was
built with a 4° cone behind the throat, as shown in Fig. 3(b). The 4° angle was chosen as it conformed to the vortex
ring growth observed by DPIV on the experiment of Paxson, Wilson, and Dougherty15. The ejector was built in
sections so that by removing or adding sections, the length of the ejector could be altered. The throat was 3 in. in
diameter, and lengths of 8½, 11, 13½, and 16 in. were possible. The inlet radius was ¾ in.
Figure 3. (a) Schematic diagram of the set of ejectors used in the statistical experiment and (b) the tapered ejector.
C. Thrust Measurements

7
Measurements of thrust, both with, and without an ejector in place, were made with a 21 in. diameter thrust
plate, mounted 20 in. from the tube exit. Initially, the thrust plate was directly in front of a load cell, with the
objective of obtaining the thrust reading from the load cell signal. In practice, the signal was strongly oscillatory,
and extracting the DC component from it proved unreliable. Instead, the thrust plate was suspended from four wires,
and used in a ballistic mode, i.e., by measuring the deflection, which is proportional to the thrust (for small
deflections). A paddle attached to the thrust plate, and immersed in a tank of glycerine provided damping for the
thrust plate. The deflection of the plate was recorded on a video camera, and the magnitude read off after the run.
The net deflection was the final reading when fluctuations due to the impulsive start had died down minus the
reading before the air was turned on. Thus the thrust due to the air flow alone is included in the thrust measurement.
The thrust is W tan(sin–1[δ/h]). Without an ejector the thrust plate measures Tair when the air is turned on and Tjet
when detonations are initiated. With an ejector, it measures Tejector when detonations are initiated.
Because the observed thrust amplification values seemed large compared with other workers, it was felt
desirable to add an additional method of measuring thrust, and for later runs, a scheme similar to that used by
Shehadeh et al.20 was added. For this scheme, the pulsed detonation tube was mounted on a sled, which was
supported by four air bearings sliding on stainless steel rails, as indicated in Fig. 1(a). This gave a very low friction
support. When an ejector was used, this was also mounted on the sled, so that this system then also measures Tejector
when firing. Movement of the tube was restrained by one or more springs, depending on the level of thrust
anticipated. The tube movement when it fired was monitored by a Transtek linear variable differential transformer,
model 024000, with the signal displayed on a Datamax recorder The device was calibrated by hanging weights from
a cord attached to the tube, running horizontally to a pulley, and down to the weights. As with the thrust plate,
oscillations were damped by two paddles attached to the detonation tube, and immersed in glycerine filled tanks.
These are not shown in Fig. 1.
III. The Experiment The initial experiment used a three level; three parameter Box-Behnken design.29 Such a design minimizes the
runs necessary to get a good fit to the data. The exact set of runs, i.e., the combination of diameter, length, and nose
radius to be used, is given in Table 1, together with the results. The actual runs comprising the 15 runs of the Box-
Behnken design are runs 1 to 11, plus 16 and 17. These were run first, and were analyzed using the parameters D, L,
and R30. The results showed that the thrust augmentation was still increasing with ejector length at the longest
8
ejector used. Consequently, it was decided to increase the ejector length. Fortunately a longer length center section
was available, providing an overall length of 17 in. Only the 3 in. diameter ejector, with the 0.75 in. radius inlet was
used, as the initial response surface showed that the 3 in. diameter combined with the larger inlet radius gave the
best results. For this ejector, runs at lengths of 3.375 and 12.625 had been made in the statistical series, but no runs
at a length of 7.625 in. Consequently, additional runs with both 7.625 and 17 in. lengths were made, also at a duty
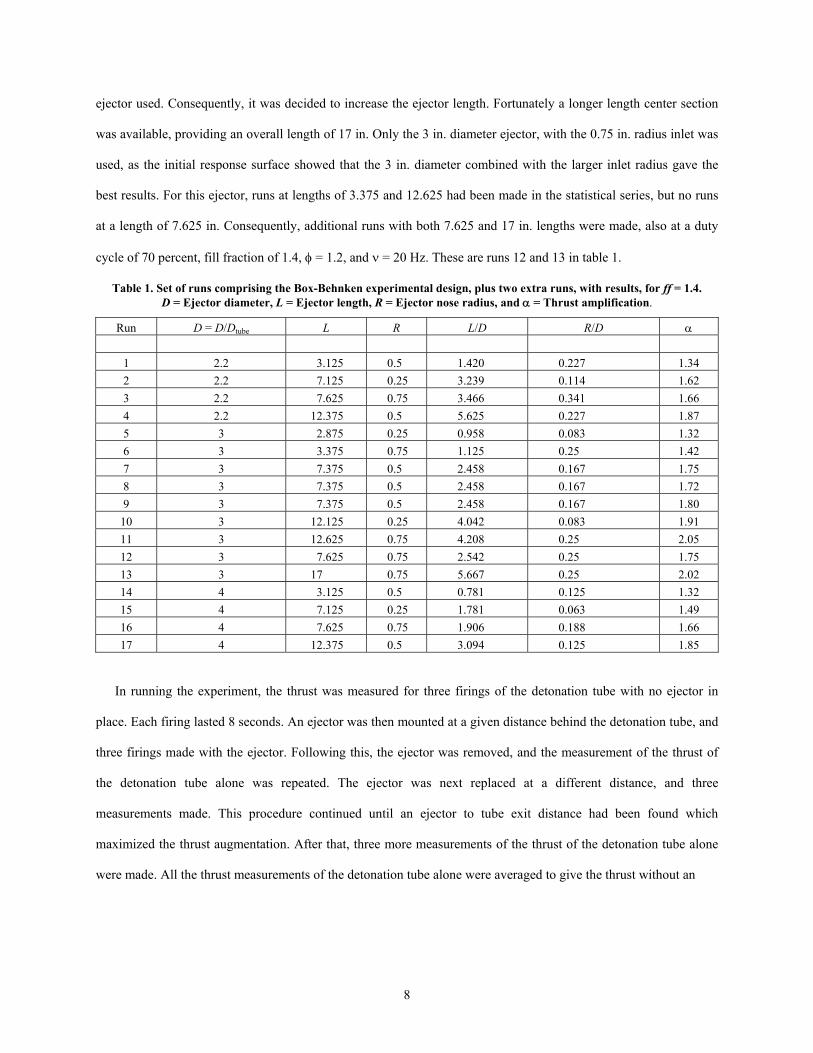
cycle of 70 percent, fill fraction of 1.4, φ = 1.2, and ν = 20 Hz. These are runs 12 and 13 in table 1.
Table 1. Set of runs comprising the Box-Behnken experimental design, plus two extra runs, with results, for ff = 1.4. D = Ejector diameter, L = Ejector length, R = Ejector nose radius, and α = Thrust amplification.
Run D = D/Dtube L R L/D R/D α
1 2.2 3.125 0.5 1.420 0.227 1.34 2 2.2 7.125 0.25 3.239 0.114 1.62 3 2.2 7.625 0.75 3.466 0.341 1.66 4 2.2 12.375 0.5 5.625 0.227 1.87 5 3 2.875 0.25 0.958 0.083 1.32 6 3 3.375 0.75 1.125 0.25 1.42 7 3 7.375 0.5 2.458 0.167 1.75 8 3 7.375 0.5 2.458 0.167 1.72 9 3 7.375 0.5 2.458 0.167 1.80
10 3 12.125 0.25 4.042 0.083 1.91 11 3 12.625 0.75 4.208 0.25 2.05 12 3 7.625 0.75 2.542 0.25 1.75 13 3 17 0.75 5.667 0.25 2.02 14 4 3.125 0.5 0.781 0.125 1.32 15 4 7.125 0.25 1.781 0.063 1.49 16 4 7.625 0.75 1.906 0.188 1.66 17 4 12.375 0.5 3.094 0.125 1.85
In running the experiment, the thrust was measured for three firings of the detonation tube with no ejector in
place. Each firing lasted 8 seconds. An ejector was then mounted at a given distance behind the detonation tube, and
three firings made with the ejector. Following this, the ejector was removed, and the measurement of the thrust of
the detonation tube alone was repeated. The ejector was next replaced at a different distance, and three
measurements made. This procedure continued until an ejector to tube exit distance had been found which
maximized the thrust augmentation. After that, three more measurements of the thrust of the detonation tube alone
were made. All the thrust measurements of the detonation tube alone were averaged to give the thrust without an

9
Figure 4. Measurements of thrust augmentation on the 2.2 in. diameter, 7.6 in. long, 0.75 in. inlet radius ejector, as a function of detonation tube exit to ejector entrance distance. Frequency = 20 Hz, φ = 1.2, ff = 1.4.
ejector, Tjet. At each distance, the three thrust measurements made with an ejector were averaged to give the thrust at
that distance, Tejector. The thrust augmentation ratio is then given by:
α = Tejector/Tjet (1)
As an example of the effect of changing the distance between the detonation tube exit and the ejector entrance, a plot
of the thrust augmentation versus distance is given in Fig. 4, for the 2.2 in. diameter ejector at a length of
7.6 in., with a nose radius of 0.75 in. These runs were made at a duty cycle of 70 percent, a fill fraction of 1.4 (i.e.,
the tube was overfilled), and an equivalence ratio of 1.2, at a frequency of 20 Hz.
IV. Experimental Accuracy There were daily variations in thrust, mainly due to inability to set pressures precisely. The overall average value
of Tjet during the statistical series was 1.05 lb, with a standard deviation of 0.05. However, measurements taken via
the procedure outlined above were all conducted on one day for any given value of α. Thus the more important
quantities are the uncertainties in Tjet, i.e., δTjet, and δTejector for a given measurement, which were evaluated from the
data from that run. The average value of δTjet was 0.038, and that of δTejector was 0.042. To determine the uncertainty
in the thrust augmentation ratio, use was made of Kline and McClintock’s formula,31 expressed as;
δα = [ ( δTjet.∂ α / ∂ Tjet)2 + ( δTejector. ∂ α / ∂ Tejector)2 ]½ (2)
Performing the partial differentiations from Eq. (1) leads to:
δα = [ α2 ( δTjet/Tjet)2 + ( δTejector /Tjet)2 ]½ (3)

10
This was calculated for each run. The average value of δα for the statistical experiment was 0.076.
DPIV measurements were made on the flow leaving the detonation tube by Oplaski, Paxson, and Wernet.28 The
velocity of the vortex rings was measured by determining the location of the vortex core at different times after
leaving the tube. This was done for both ff = 1.4, and ff = 1.05, with locations found at 12 different times. A least
squares straight line fit to these locations gave the velocity and the 95% velocity uncertainty.
V. Experimental Results A. The statistical experiment
The maximum thrust augmentation ratio measured for a given combination of D, L, and R is given in Table 1,
together with the distance between detonation tube exit and ejector entrance at which that maximum was achieved.
This distance is positive when the ejector entrance is downstream of the tube exit. As can be seen in Fig. 4, for the
2.2 in. diameter ejector, a maximum in thrust augmentation ratio occurred with the ejector entrance downstream of
the tube exit. This was true of all the ejectors tested in the statistical experiment, although, as stated above, it was not
possible to make measurements at negative values of x. There is no obvious correlation between the distances for
maximum thrust augmentation and the parameters L, D, and R, although they do seem to increase as D increases, a
trend also observed for steady ejectors.9 Although the dimensional parameters D, L, and R were used previously to
assess the results of the present experiment,30 they are not particularly useful for comparing the results with those of
other workers, for which non-dimensional parameters would be more useful. The ratio D/Dtube, is frequently used in
comparing steady state ejectors, as is the ratio L/D,9 so seem reasonable non-dimensional variables for unsteady
ejectors also. The ratio R/D seems a reasonable non-dimensional parameter for the nose radius. However, it is by no
means clear that these are the appropriate non-dimensional parameters, but will be used here in the absence of better
ones, and experimental evidence to the contrary.
With these parameters, the thrust augmentation ratio can be fitted with a response surface of the form:
α = b0 + b1D/Dtube + b2 L/D + b3 R/D + b11 (D/Dtube )2 + b22 (L/D)2 + b33 (R/D)2
+ b12 (D/Dtube )(L/D) + b13 (D/Dtube )( R/D )+ b23 (L/D)( R/D ) (4)
The bij can be found by entering the independent and dependant variables into a statistical program. Doing this with
the results of all the Box-Behnken runs, plus the two additional runs, it was found that the terms b12, b13, and b23
were statistically insignificant, so that the thrust amplification ratio was fitted with a simpler model, namely:
α = b0 + b1(D/Dtube) + b2(L/D) + b3(R/D) + b11(D/Dtube)2 + b22(L/D)2 + b33(R/D)2 (5)

11
The values of the bii are given in Table 2, and a plot of the data plus response surface contours versus L/D is given in
Fig. 5.
Table 2. Values of the constants in Eq. (5) which fit the thrust augmentation data.
Constant b0 b1 b2 b3 b11 b22 b33 Value –0.772 0.918 0.363 2.36 –0.129 –0.0338 –5.39
In plotting the contours, the value of R/D used was the intermediate value for each value of D/Dtube.
Surprisingly, the results with the 3 in. diameter, 17 in. length, and 0.75 in. nose radius ejector showed less thrust
amplification than the equivalent 12.625 in. long ejector, and the optimum value of L/D seems to be 5.4. Using Eq.
(5) and the optimum value of L/D = 5.4, the thrust augmentation ratio is plotted against R/D in Fig. 6, for each of the
experimental values of D/Dtube, as well as D/Dtube = 3.5. It is seen that R/D = 0.22 is the optimum value, independent
of D/Dtube. Using the optimum values of L/D and R/D, the thrust augmentation ratio from Eq. (5) is plotted against
D/Dtube in Fig. 7, showing the predicted optimum of D/Dtube to be 3.5.
Figure 5. Maximum thrust augmentation for the full set of data of Table 1, plotted using the variables D/Dtube, L/D, and R/D. The contour lines are from the response surface of Eq. (5), using the average value of R/D for each value of D/Dtube. With this response surface the optimum value of L/D is 5.4.
Figure 6. Thrust augmentation as predicted by the response surface of Eq. (5) for the optimum value of L/D = 5.4, as a function of R/D for different values of D/Dtube.

12
Figure 7. Thrust augmentation as predicted for the response surface of Eq. (5) for the optimum value of L/D = 5.4 and R/D = 0.22, as a function of D/Dtube. B. Effect of separation between ejector and pulsed detonation tube exit
As stated above, different workers have observed the maximum in thrust augmentation ratio as a function of the
distance between detonation tube exit and ejector entrance at differing locations. Some have found a maximum with
the ejector downstream of the detonation tube exit, others with it upstream. Thus it seemed useful to investigate this
phenomenon. Although the thrust augmentation at an ejector length of 12.625 in. was found above to be higher than
that at an ejector length of 17 in., the latter length was chosen since it closely scaled the best ejector of Shehadeh et
al.20 The ejector diameter used was 3 in., with a 0.75 in. inlet radius. For these runs, the modified detonation tube
was used which has the 6.5 in. long section of 1.25 in. outer diameter at the downstream end (Fig. 1(c)). The
experiments were initially run at a frequency of 20 Hz, ff = 1.05, φ = 1, at a duty cycle of 55 percent, later at a
frequency of 40 Hz, ff = 1.05, φ = 1, and a duty cycle of 60 percent. Three runs were made at each distance between
ejector and tube exit, with two runs without an ejector between each distance setting, the latter being averaged to
determine the base thrust. The results are shown in Fig. 8. There appear to be maxima both for the ejector entrance
upstream and for the ejector entrance downstream of the detonation tube. Also thrust augmentation decreases with
increasing frequency.
Figure 8. Thrust amplification ratio as a function of distance between the detonation tube exit and the ejector entrance. Positive values indicate ejector entrances downstream of the detonation tube exit. The results are for two different frequencies. The equivalence ration = 1. The ejector length was 17 in. (L/D = 5.67), the diameter was 3 in., and inlet radius 0.75 in. (R/D = 0.25).

13
Figure 9. Thrust amplification ratio plotted against L/D for the tapered ejector. The frequency is 20 Hz, ff = 1.05 and φ = 1. Open symbols and dashed lines represent results using the damped spring-displacement technique, and solid lines with filled symbols represent results with the thrust plate system.
C. Tapered Ejector Finally, measurements of the thrust augmentation ratio were made with the tapered ejector (Fig. 3(b)). The
objective was to investigate the effects of length change with this ejector, and also the effect of changing the
position of the entrance. To minimize the number of runs needed, the ejector entrance to detonation tube exit
distance was set to the values giving the maximum augmentation in the runs of section B, shown in Fig. 6, namely –
3 in., and +1.5 in. However, since prior experience with this ejector had shown its best performance occurred at
longer positive distances than those used for the ejectors of Fig. 3(a), a distance of +3 in. was also used. For these
tests, the frequency was 20 Hz, the equivalence ratio was 1, the fill fraction was 1.05, and the duty cycle was 55
percent.
Since the tests of section B had shown quite large thrust augmentations, with apparently similar geometry to that
used by Shehadeh et al.,20 but with a different thrust measuring technique, this raised the question as to whether the
technique itself was in error. Consequently, for these runs, an additional technique, measuring thrust by the
calibrated extension of a spring was also used. The results of the tests are given in Fig. 9. Although the spring
extension system gave lower values of thrust than the thrust plate, it can be seen that the thrust amplifications of the
two techniques were in good agreement. Over this set of tests, the thrust plate gave an average thrust reading of

14
0.95 ± 0.03 lb, versus 0.825 ± 0.06 lb (95% confidence uncertainty) for the spring system thrust. Thus the
discrepancy is outside the experimental uncertainty, but its cause is unknown. A thrust amplification ratio of
2.5 was observed at x = +3 in., and it appears that even higher values might be achieved at longer lengths.
VI. Discussion Higher values of thrust augmentation ratio were found in this study than were found by previous workers,20-22
which raises the question as to how this could be. Since both the thrust plate and spring-displacement methods of
measuring augmentation gave essentially identical results for thrust augmentation, it would not seem to be an error
in technique. Presumably then, it rests with the details of the detonation tube and ejectors used. Details of each
experiment, with the ejectors giving the maximum augmentation are listed in Table 3.
Table 3. Comparison of results and conditions of different workers. Paper Fuel Oxidiser τ f (Hz) D/Dtube L/D R/D α Ejector Geometry
Shehadeh et al.20 Ethylene N2-O2 mix — 10 2.55 8.36 0.087 1.4 Straight Allgood et al.21 H2 Air — 30 2.75 14.ff Bell 1.65 Straight + Diffuser
“ “ “ — “ “ “ “ 1.28 Straight Rasheed et al.22 H2 Air 0.77 10 2.0* 3.8 0.13 1.16 Straight This work H2 Air 9 20 3.0 4.2 0.25 2.05 Straight + Diffuser
“ “ “ “ “ “ >5.3 “ 2.5 Tapered *D/Dtube = 3 might have given a higher value of α at a larger value of L/D than was tested
Most striking is the discrepancy between the low thrust augmentation seen by Rasheed et al.,22 and values found
by other workers. A major difference between Rasheed et al., and the present work is the value of τ, the ratio
between the extra thrust produced by the detonations relative to the thrust generated by the air flow itself.
Unfortunately, τ is not known for Shehadeh et al.,20 and Allgood et al.21 The thrust of the jet without an ejector is:
Tjet = Tair + Tdet (6) The thrust with an ejector is: Tejector = αss.Tair + αdet.Tdet (7) So that the thrust augmentation ratio is: α = Tejector /Tjet = (αss + αdet.τ )/(1 + τ) (8)
The air is flowing continuously in both the experiments of Rasheed et al., and the present work. Consequently
the thrust augmentation of the air flow (and the air/fuel mixture also) will be the steady state value. A graph of
steady state thrust augmentation against the ratio of ejector area ratio to jet area given by Porter and Squyers,9
indicates that for Rasheed et al., a value of αss = 1.1 is not unreasonable, and a value of αss = 1.2 is appropriate for
the area ratio of the present work. This latter value is in line also with rather crude experimental observations made
here (i.e., on turning the air on with and without an ejector). For the present experiment, using αss = 1.2, and τ = 9,
15
and assuming a value of αdet = 2.14, gives the observed value of α = 2.05 when inserted into Eq. (8). Thus α and αdet
are not very different. Rasheed et al. did not define thrust augmentation in the same way as is done here. Instead,
they called Tdet the base thrust, and used this in the denominator for thrust augmentation. Despite this, they only
achieved a thrust augmentation of 1.16, which they point out is in line with values for steady state thrust
augmentation from Porter and Squyers.9 Their best ejector was at a smaller ratio of D/Dtube than the optimum found
here, with a smaller L/D, and a smaller R/D, and was also a straight ejector. However, Allgood et al.,21 and Shehadeh
et al.,20 had achieved thrust augmentations of 1.28, and 1.4 respectively, using straight ejectors, but at larger D/Dtube
and L/D ratios. As pointed out above, the value of τ used by Rasheed et al. is only 0.77, compared with 9 found in
the present work. This means that their unsteady component of thrust is quite small, which probably leads to low
thrust augmentation. Thus, while it can not be stated definitely, it does seem probable that the low value of thrust
augmentation seen by Rasheed et al. is a result of non-optimum ejector geometry combined with a low value of τ.
It was stated above that the statistical experiment was run at a fill factor of 1.4, and only at positive values of x.
In Fig. (8), in which the results presented were run at a fill factor of 1.05, it is seen that at positive x, the maximum
thrust augmentation at 20 Hz is 1.9, and at 40 Hz is 1.75. Extrapolating to 60 Hz would give a value of 1.6. Allgood
et al. ran at a frequency of 30 Hz, but with a tube twice as long. Since the gasdynamic pulse length is proportional to
the length of the tube, their 30 Hz results should be equivalent to 60 Hz on the tube used here, to have the same ratio
of pulse length to time between pulses (i.e., 1/f ). Allgood et al. measured a maximum thrust augmentation of 1.65 at
positive x. Thus their result does not seem greatly disparate with the present result.
The statistical experiment showed that there is an optimum value of D/Dtube around 3.5. Unfortunately, this was
for an equivalence ratio of 1.2, and a fill factor of 1.4. If, as been shown for other unsteady thrust augmentation
measurements,15,16 the optimum ejector diameter is approximately equal to the size of the vortex ring generated on
each pulse, it is probably independent of equivalence ratio. This needs to be confirmed, however. Increasing
equivalence ratio does lead to a slightly faster detonation velocity, which might result in a higher circulation in the
vortex ring, and hence vortex ring velocity. However, see below, the vortex ring diameter and velocity for the two
different conditions tested here were found to be the same.
More disturbing is that the fill factor was 1.4, which means that there was a large region of un-ignited fuel-air
mixture outside the tube when the detonation reaches the end of the tube. Since the critical diameter for near
stoichiometric hydrogen-air mixtures is 20 cm,32 the detonation will quench on leaving the tube. However it may

16
still cause the mixture to burn as a deflagration. Thus this may be the cause of the higher thrust augmentation seen
when the fill fraction was 1.4, as against that seen at with a fill fraction of 1.05.
Figure 10. DPIV measurement of vorticity in the vortex ring emerging from the pulsed detonation tube.
Planar DPIV measurements of the vortex ring emerging from the present detonation tube made by Opalski
et al.28 show that the size of the vortex ring is about 3.6 in. in diameter (Fig. 10), where the size is defined as the
diameter at which the vorticity goes to zero. The optimum ejector diameter was found to be 3.5 in., and so is slightly
smaller than the size of the vortex ring. The size of the vortex ring was the same for both values of equivalence
ratio/fill factor combinations used, as were the vortex ring velocities, which were 233 ± 14 m/sec for
ff = 1.05, and 210 ± 14 m/sec for ff = 1.4. DPIV measurements taken at the exit of the ejector show that the portion
of the spherical shock which is created when the detonation wave leaves the detonation tube that is captured by the
ejector, exits the ejector, with a resulting impulsive increase in exit velocity. This sudden increase in velocity leads
to the creation of a new vortex ring, much weaker than the original vortex ring generated when the detonation leaves
the detonation tube. The original vortex ring, though it appears to enter the ejector, does not exit from it.
In evaluating the results of the statistical experiment as originally performed,30 namely, with the variables being
D, L, and R, it was found that the term b33 had a low confidence level, and so was not retained. This left the value of
the optimum nose radius undetermined. However, when the model was revised with the extra points, and using the
variables D/Dtube, L/D, and R/D, the term b33 was significant. This indicates that R/D is the better scaling parameter,

17
and, as shown in Fig. 6 that the optimum value of R/D is 0.22. This is larger than most of the rounded inlets used by
the other workers, and needs further confirmation.
Since the over-filled condition gave a higher thrust augmentation than the correctly filled condition, the question
is raised as to whether this is a better condition for operating a pulsed detonation engine. In Table 4, the fuel specific
thrust is given for five different runs, corresponding to the maximum thrust augmentation for different conditions.
Although the augmentation ratio for a fill factor of 1.4 was higher than that for a fill factor of 1.05 at the same
frequency and value of x, the hydrogen flow rate was significantly higher, so the fuel specific thrust was in fact
lower, indicating that this is not a good way to run the engine. The values of base specific thrust shown are much
lower than those reported by Schauer, Stutrud, and Bradley,33 who found values around 3600 sec at a fill fraction of
1.05 and 2800 sec at a fill fraction of 1.4, independent of frequency. If the thrust augmentation ratio seen with the
tapered ejector could also be observed with a pulsed detonation engine operating at a specific thrust of 2800 sec at a
fill fraction of 1.05 as seen by Schauer, Stutrud, and Bradley, then a specific thrust of 6800 sec would result.
Table 4. Fuel specific thrust for the base thrust, and augmented thrust, for several different runs.
Ejector (D/L/R) 3/17/0.75 3/17/0.75 3/17/0.75 Tapered 3/17/0.75 x (in.) 1 1 –3 3 –2 Frequency (Hz) 20 20 20 20 40 Fill fraction 1.4 1.05 1.05 1.05 1.05 Base Thrust (lb) 1.045 1.12 1.087 0.954 2.35 Augmented Thrust (lb) 2.109 2.146 2.149 2.32 4.264 Alpha 2.02 1.92 1.98 2.43 1.81
2hm& (lb/sec) 8.57E-4 5.70E-4 5.27E-4 5.74E-4 1.07E-3 Base Thrust/mh2 1,220 1,960 2,600 1,660 2,200 Aug thrust/mh2 2,460 3,760 4,080 4,040 3,990
The present values of specific thrust for the detonation tube only, are not only lower than those of Schauer,
Stutrud, and Bradley, but are dependent on frequency. A few, rather crude, results at higher frequency, seemed to be
showing a trend towards the values of Schauer, Stutrud, and Bradley as the frequency approached 80 Hz. A problem
with the tube used here is that the air was flowing continuously, with no valves, so that the high pressure gas
produced by the detonation could, and did, flow back through the air inlet orifices. The evidence for this was a time
dependent increase in pressure in the air supply lines upstream of the inlet orifices. As frequency was increased, a
higher air flow was required, which was achieved by increasing the air plenum pressure, thereby reducing the back
flow. As a result of this backflow, the first gas to enter the tube after a detonation would be vitiated air. At a fill
18
fraction of 1.4, this air would probably have exited the tube by the time a detonation arrived, but this may not be the
case for a fill fraction of 1.05. It is not clear what effect this has on thrust augmentation. More work is needed to
examine this, and also the question of whether the overfilled gas does burn, and if so, does it affect thrust
augmentation. No such work is currently planned.
V. Conclusions Experiments with the 1 in. diameter pulsed detonation tube, using a statistical design of experiment have shown
that, for the set of ejectors used, there is an optimum diameter, such that the ratio D/Dtube = 3.5. The optimum length
to diameter ratio for the ejector was found to be 5.4. A fairly large inlet radius gave the best results, with a predicted
optimum at R/D = 0.22. Thrust amplification ratios at a frequency of 20 Hz were larger than those at 40 Hz. Higher
thrust amplification was also seen at a fill fraction of 1.4 than was seen at a fill fraction of 1.05, though this may be a
consequence of the particular experimental arrangement. The thrust amplification depends on the distance between
the detonation tube exit and the ejector entrance, with maxima at both positive and negative values of this distance.
For both 20 and 40 Hz operation, the maxima with the ejector entrance upstream of the detonation tube exit were
higher than the maxima with the ejector entrance downstream of the detonation tube exit. Finally, a tapered ejector
showed a thrust augmentation ratio of 2.5 at 20 Hz, with augmentation apparently still increasing with length at the
longest length used. From the combined results of all the experiments in Table 3, it seems clear that the specific
geometry of the ejector is important as well as the ratios D/Dtube, L/D, and R/D. Thus an ejector with a diffusing
tailpiece is better than a straight ejector, and a tapered ejector is better than either of the other two.
Acknowledgments The support of the former CVCCE project, directed by Leo Burkardt, is gratefully acknowledged.
References 1Nicholls, J.A., Wilkinson, H.R., and Morrison, R.B., “Intermittent Detonation as a Thrust-Producing
Mechanism,” Jet Propulsion, vol. 27, 1957, pp. 534–541.
2Eidelman, S., Grossman, W., and Lottati, I., “Review of Propulsion Applications and Numerical Simulations of
the Pulsed Detonation Engine Concept,” Journal of Propulsion, vol. 7, no. 6, 1991, pp. 857–865.
3Heiser, W.H., and Pratt, D.T., “Thermodynamic Cycle Analysis of Pulse Detonation Engines,” Journal of
Propulsion and Power, vol. 18, no. 1, 2002, pp. 68–76.

19
4Kentfield, J.A.C., “Fundamentals of Idealized Air-Breathing Pulse-Detonation Engines,” Journal of Propulsion
and Power, vol. 18, no. 1, 2002, pp. 77–83.
5Zitoun, R., and Desbordes, D., “Propulsive Performances of Pulsed Detonations,” Combustion Science and
Technology, vol. 144, 1999. pp. 93–114.
6Cambier, J.-L. and Tegnér, J.K., “Strategies for Pulsed Detonation Engine Performance Optimization,” Journal
of Propulsion and Power, vol. 14, no. 4, 1998, pp. 489–498.
7Kailasanath, K., “Recent Developments in the Research on Pulse Detonation Engines,” AIAA Journal, vol. 41,
no. 2 February 2003.
8Foa, J.V. “Elements of Flight Propulsion,” John Wiley and Sons, Inc., New York, N.Y. 1960.
9Porter, J.L., and Squyers, R.A. “A Summary/Overview of Ejector Augmentor Theory and Performance, Phase II
– Technical Report.” Vought Corporation Advanced Technology Center Report No. R-91100/9CR-47A., 1979.
10Quinn, B., “Compact Ejector Thrust Augmentation,” Journal of Aircraft, vol. 10, no. 8, 1973, pp. 481–486.
11Lockwood, R.M. 1961 “Interim Summary Report on Investigation of the Process of Energy Transfer from an
Intermittent Jet to Secondary Fluid in an Ejector-type Thrust Augmenter,” Hiller Aircraft Report No. ARD–286.
12Didelle, H., “L’augmentation de pousée des trompes à jets pulsants ou battant,” doctoral thesis presented to the
Université Scientifique et Médicale et l’Institut National Polytechnique de Grenoble. March 1976.
13Elder, F.K. and de Haas, N. (1952) “Experimental Study of the Formation of a Vortex Ring at the Open End
of a Cylindrical Shock Tube,” Journal of Applied Physics, vol. 23, 1952, pp. 1065–1069.
14Bremhorst, K., and Hollis, P.G., “Velocity Field of an Axisymmetric Pulsed, Subsonic Air Jet,” AIAA Journal,
vol. 28, no. 12, 1990, pp. 2043–2049.
15Paxson, D.E., Wilson, J., and Dougherty, K.T., “Unsteady Ejector Performance: An Experimental Investigation
using a Pulsejet Driver,” AIAA Paper 2002–3915, July 2002.
16Wilson, J., and Paxson, D.E., “Unsteady Ejector Performance: An Experimental Investigation using a
Resonance Tube Driver,” AIAA Paper 2002–3632, July 2002.
17Choutapalli, I.M., Alkislar, M.B., Krothpalli, A., and Lourenco, L.M., “An Experimental Study of Pulsed Jet
Ejector,” AIAA Paper, 2005–1208, January 2005.
18Wilson, J., “The Effect of Pulse Length and Ejector Radius on Unsteady Ejector Performance,” AIAA Paper
2005–3829, July 2005, submitted to the Journal of Propulsion and Power.

20
19Gharib, M., Rambod, E., and Shariff, K., “A universal time scale for vortex ring formation,” Journal of Fluid
Mechanics, vol. 360, 1998 pp. 121–140.
20Shehadeh, R., Saretto, S., Lee S.-Y., Pal S., and Santoro, R.J., “Thrust Augmentation Experiments for a Pulse
Detonation Driven Ejector,” AIAA Paper 2004–3398, July 2004.
21Allgood, D., Gutmark, E., Hoke, J., Bradley, R., and Schauer, F., “Performance Measurements of Pulse
Detonation Engine Ejectors,” AIAA Paper 2005–223, January 2005.
22Rasheed, A., Tangirala, V., Pinard, P.F., and Dean, A.J., “Experimental and Numerical Investigations of
Ejectors for PDE Applications,” AIAA Paper 2003–4971, July 2003.
23Gröschel, E., Tsuei, H.-H., Xia, G., and Merkle, C.L., “Characterization of Thrust Augmentation by Unsteady
Ejectors,” AIAA Paper 2003–4970, July 2003.
24Allgood, D., Gutmark, E., Rasheed, A., and Dean, A.J., “Experimental Investigation of a Pulse Detonation
Engine with a 2-D Ejector,” AIAA Journal, vol. 43, no. 2, 2005, pp. 390–398.
25Lee, S.-Y., Watts, J., Saretto, S., Pal, S., Conrad, C., Woodward, R., and Santoro, R., “Deflagration to
Detonation Transition Processes by Turbulence-Generating Obstacles in Pulse Detonation Engines,” Journal of
Propulsion and Power, vol. 20, no. 6, 2004, pp. 1026–1036.
26Shchelkin, K.L., Soviet Journal of Technical Physics, vol. 10, 1940, pp. 823–827.
27Knight, H.T., and Duff, R.E., “Precision Measurement of Detonation and Strong Shock Velocity in Gases,”
The Review of Scientific Instruments, vol. 26, no. 3, 1955, pp. 257–260.
28Opalski, A., Paxson, D.E., and Wernet, M.F., “Detonation Driven Ejector Exhaust Flow Characterization
Using Planar DPIV,” Paper AIAA–2005–4379, July 2005.
29Mason, R.L., Gunst, R.F., and Hess, J.L., “Statistical Design and Analysis of Experiments: with Applications to
Engineering and Science,” John Wiley & Sons, Inc., New York, NY, 1989.
30Wilson, J., Sgondea, A., Paxson, D. E. and Rosenthal B.N. “Parametric Investigation of Thrust Augmentation
by Ejectors on a Pulsed Detonation Tube,” Paper AIAA–2005–4208, July 2005.
31Kline, S.J., and McClintock, F. A., “Describing Uncertainties in Single-sample Experiments,” Mechanical
Engineering, January 1953, p. 3.
32Knystautas, R., Guirao, C., Lee, J.H., and Sulmistras, A., “Measurements of Cell Size in Hydrocarbon-Air
Mixtures and Predictions of Critical Tube Diameter, Critical Initiation Energy, and Detonability Limits,” in

21
Dynamics of Shock Waves, Explosions, and Detonations, vol. 94, Progress in Aeronautics and Astronautics, edited
by Bowen, J.R., Manson, N., Oppenheim, A.K., and Soloukhin, R.I., 1984, pp. 23–37.
33Schauer, F., Stutrud, J., and Bradley, R. “Detonation Initiation Studies and Performance Results for Pulsed
Detonation Engine Applications,” Paper AIAA–2001–1129, January 2001.