
Parameters affecting crystal lifetime in MX and possible ... · Parameters affecting crystal...
63
Parameters affecting crystal lifetime in MX and possible radiation damage mitigation strategies. Elspeth Garman, LMB, Oxford [email protected] Karthik Paithanker, LMB, Oxford MX Frontiers at the One Micron Scale BNL, USA. July 2009
-
Upload
doannguyet -
Category
Documents
-
view
218 -
download
1
Transcript of Parameters affecting crystal lifetime in MX and possible ... · Parameters affecting crystal...

Parameters affecting crystal lifetime
in MX and possible radiation damage
mitigation strategies.
Elspeth Garman, LMB, Oxford
Karthik Paithanker, LMB, Oxford
MX Frontiers at the
One Micron Scale
BNL, USA.
July 2009

The Plan:
• A metric for Radiation Damage.
Dose: RADDOSE.
• Scavengers: RT and 100K.
• Simultaneous multi-crystal data
collection and data retrieval.

3
What really happens when X-ray photons hit the crystal ?
Photoelectriceffect
ElasticThomson 8 % (useful !)
InelasticCompton 8 %
λ = 1 Å (at energy 12.4 keV) for a
100x100x100μm crystal
Compton scattering
and photoelectric effect both
deposit energy in the crystal

DOSE
• DOSE is the ENERGY lost per KILOGRAMME (!!)
• Measured in Joules/kg i.e. the absorbed energy per unit mass.
• Fundamental metric against which to measure damage.
• FLUX is in photons/second.
• Flux density is in photons/second/unit area.
• Takes care of the physics but NOT the chemistry.

DOSE Postulate:
• Damage at 100K is proportional to dose (Imean, Bfactor,
Rmerge, Rd, specific structural damage [dose rate effect?]).
• There is a MAXIMUM dose (Joules/kg = Gy) which
protein crystals can tolerate which depends only on the
PHYSICS of the situation.
• Crystal might not reach that limit due to chemical factors,
but it will not last BEYOND the limit.
• Need to be able to calculate this DOSE:
[RADDOSE: Murray, Garman & Ravelli, JAPC 2004]

Way of estimating absorbed dose,
D: (Gy = J kg-1)
Dose rate = mass absorption coeff * photon energy * number of photons in unit time / Area
dD/dt = (/) E Iinc (Iinc= incident flux density)
For (/) in cm2/g, Iinc in photons/s/m2, E in keV, t in seconds, total dose is:
D = (/) E Iinc t 1011 (Gy)
e.g. (/) = 2.6 cm2/g (50% solvent), E= 12 keV,
t= 100 m, A = 80 x 80 m2 beam cross section
D= 7.8 x 10⁻⁸ Gy/photon
• For 106 Gy, 1 ionisation / 20 amino acids for a 400 a.a. protein
molecule. [ See O’Neill, Stevens & Garman. JSR (2002) 9, 329-332]
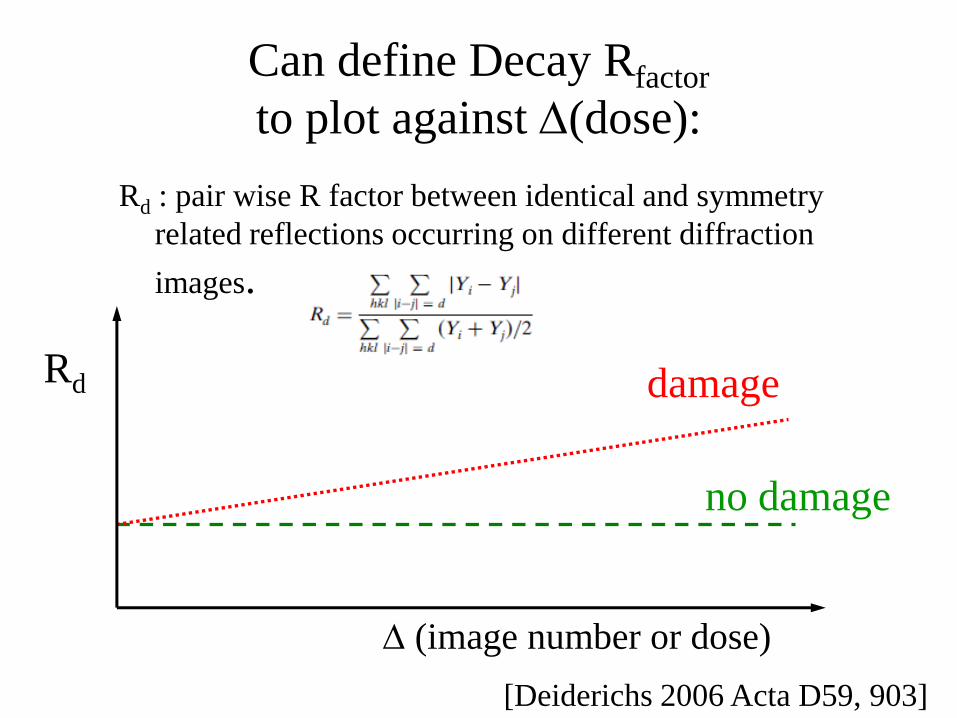
Can define Decay Rfactor
to plot against (dose):
Rd : pair wise R factor between identical and symmetry
related reflections occurring on different diffraction
images.
[Deiderichs 2006 Acta D59, 903]
no damage
damageRd
(image number or dose)

Can define a sAD (to plot against dose):
[Kmetko et al 2006, Acta D62, 1030]
• Coefficient of sensitivity change in relative isotropic B factor:
sAD= Brel / 82D (e.g. HEWL= 0.012 at 100K)

Make this easier for MX
(include solvent contribution in mM
and heavy atoms explicitly)
RADDOSE
Use crystal and beam characteristics to calculate
the dose.

Calculating Dose(RADDOSE)
Beam Characteristics
Size and
profile
Flux
Exposure
timeEnergy

Beam Characteristics
N-layer
P-layer
+ve
electrode
-ve
electrode
Photodiode
Beam profile Photons per second
ID14-4
Calibration
Wavelength

Beam Characteristics
0 50000 100000 150000 200000
0
100
200
300
400
500
600
700
Cu
rre
nt in
A
Integrated Counts
Current in A = A + B*counts
Parameter Value Error
A 1.4 ± 1
B 3.55x10⁻³ ± 0.01x10
-3
R 0.99992
0.0
0.2
0.4
0.6
0.8
1.0
1.2
1.4
1.6
1.8
2.0
0 50000 100000 150000 200000
Integrated counts
Pho
ton
s p
er
se
co
nd
/x1
012
number of photons /s-1 = A + B * counts
A -386 ± 302
B 1.03194x10⁻⁷ ± 0.004x10
-7
N.B.; Two calibrations required.Determination of X-ray flux using silicon pin diodes. RL Owen, JM Holton, C Schulze-Briese,
EF Garman. JSR (2009) 16, 143-151.
Pin-diode current vs.
integrated counts at different
attenuations
Hamamatsu Si (S3204-09)
Photons per second vs.
integrated counts

Beam Profile Comparison uniform or 2D Gaussians
• Beam Profiles may be entered into RADDOSE as uniform or 2D
Gaussians
• Lifetime curve is reciprocal of intensity curve
• Differential irradiation may lead to differential damage
get data which merge poorly
• Crystal heating might be higher than first predicted

Number of amino acids
‘HA’ atoms per monomer, e.g. S, Se, Hg
Solvent - concentrations of components, e.g. Na+, Cl-

Calculating Dose(RADDOSE)
Crystal Characteristics
Crystal
size
No of molecules
per unit cell
Solvent
content
No residues
Calculation of absorption
coefficients
absorption coefficients at 12.4 keV
e.g. apoferritin: 0.406mm-1
holoferritin: 1.133mm-1
A.A.: 5C, 1.35N, 1.5O, 8H
DNA:9.75C,4N,6O,11.75H,1P

Experimental Absorption Coefficients for heavy atoms
• f’’ is proportional to µpe
• One can normalise a fluorescence spectrum to known values of
• µpe far from the absorption edge.
• This is implemented in RADDOSE using the SPLINOR file from
CHOOCH. (G. Evans and R. F. Pettifer J. Appl. Cryst. 34, 82-86, 2001.)
• Other absorption values are taken from library values McMaster 1960 and mucal.f
Variety of anomalous edges

Calculating Dose(RADDOSE)
DOSE
Crystal Characteristics Beam Characteristics
Fluorescence
information
Crystal
size
No of molecules
per unit cell
Solvent
content
No residues
Calculation of
absorption coefficients
Size and
profile
Flux
Exposure
time
e.g. absorption coefficients (12.4 keV)
apoferritin: 0.406mm-1
holoferritin: 1.133mm-1
A.A.: 5C, 1.35N, 1.5O, 8H
DNA:9.75C,4N,6O,11.75H,1P

Experimental Dose Limit (100K)
For I0 1/2
D1/2 = 4.3 ( 0.4) 107 Gy = 43 MGy
(cf `Henderson limit’ 20 MGy 5 electrons/Å2
43 MGy 10 electrons/Å2
cf. hamster death 3 Gy)
Suggested limit to retain biological `fidelity’
I0 0.7
D0.7 = 3.0 107 Gy =30 MGy
D0.7 for ferritin corresponds 107 photons/unit cell
Robin Leslie Owen, Enrique Rudiño-Piñera, Elspeth F. Garman.
PNAS (2006) 103, 4912 - 4917.

Assumptions in distributed version of
RADDOSE
• µabs = µpe small underestimate at high energies: as Compton scattering is neglected
• Fluorescent X-rays are absorbed:
results in an overestimate of dose for heavy scatterers
• Crystal rotation neglected
• No potential dose rate effect considered.
`X-ray Absorption by Macromolecular Crystals; the Effects of Wavelength and Crystal Composition on Absorbed Dose’. Murray, Garman, Ravelli, J. Appl. Cryst. (2004) 26, 513-522

20
Input/Output made independent of CCP4 libraries
Outputs time to reach experimental dose limit (30 MGy)
Makes a correction related to physics of energy loss
For atoms with Z > 20 after interaction via photo electric effect the electron
can relax via
1. Auger effect
2. X-ray fluorescence
This fluorescence energy
may escape from crystal.
Energy loss from Compton
scattering included.
Improved RADDOSE (2009)

21
Why care about X-ray fluorescence escape ?
If the incident energy is greater than the
absorption edge energy; that atom may
undergo photoelectric excitation
Atom can decay via Auger or X-ray
fluorescence
X-ray fluorescence photon can escape,
depending on its energy, the thickness of
crystal, decreasing the energy lost in the
sample.
May be important for micro crystals
Knowledge of correct dose → correct
estimation of lifetime → planning of the
experiment

22
For C, N, O, S there is low probability of X-ray
fluorescence.
For heavy elements (Z > 20) such as Se there is higher
chance of X-ray fluorescence
The contribution to the anomalous scattering factor (f '')
is directly proportional to the
photoelectric cross-section.
Corrected energy
= deposited energy
– K-shell escape, – LI escape,
– LII escape, – LIII escape
X-ray fluorescence escape:
23
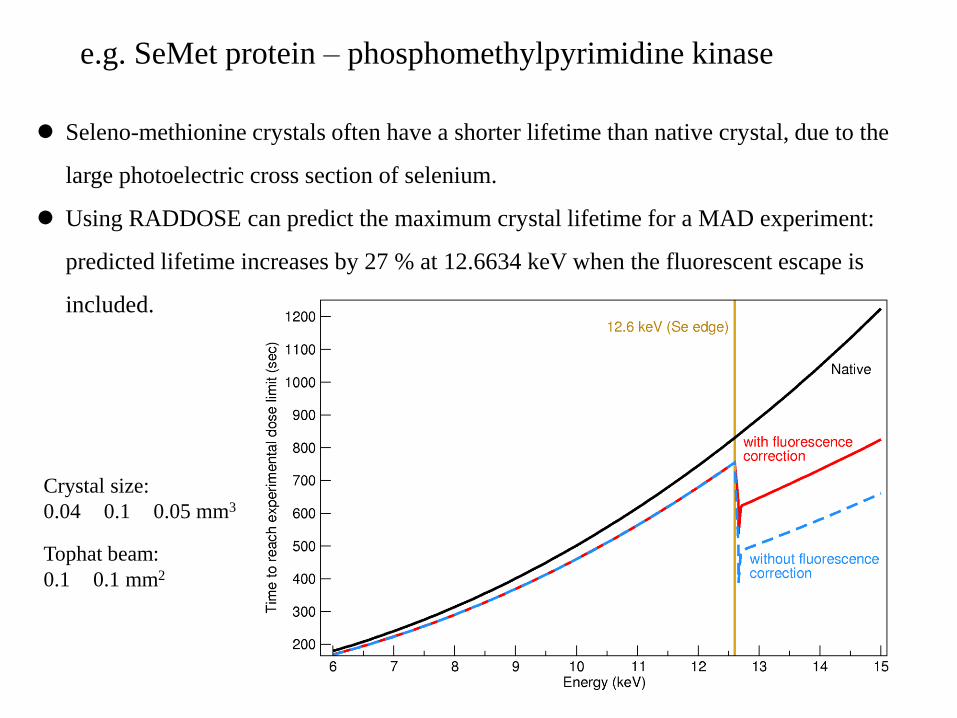
e.g. SeMet protein – phosphomethylpyrimidine kinase
Seleno-methionine crystals often have a shorter lifetime than native crystal, due to the
large photoelectric cross section of selenium.
Using RADDOSE can predict the maximum crystal lifetime for a MAD experiment:
predicted lifetime increases by 27 % at 12.6634 keV when the fluorescent escape is
included.
Crystal size:
0.04 0.1 0.05 mm3
Tophat beam:
0.1 0.1 mm2

24
Inclusion of energy absorption due to Compton scattering
Compton scattering: interaction of a photon with a
`free’ electron (outer shell)
The incoming photon will inelastically scatter and
the electron will recoil at an angle φ
The energy of the recoil electron is deposited in
the crystal itself (contributes to the absorbed dose)
Total energy loss σCompton cross-section Erecoil electron +
σphotoelectric cross-section Ephotoelectric absorption
)21(
2
2
2
2
mc
Emc
EE
incident
incident
electronrecoiled
ScatteredPhoton
Recoilelectron
Incident photon φ
Maximum electron recoil energy:

Effect of Compton scattering energy loss on dose
PPK, 0.04 0.1 0.05 mm3 crystal, tophat beam, 0.05 0.05 mm2,
1012 photons/mm2, 0.2 s/image. 398 residues. 12 seleniums

Diffraction-dose efficiency
• Want to maximise:
Diffracted intensity = IDE
Dose
Iscatt = Iscatt V 2 e-t V2
Dose Energy absorbed Energy absorbed
[Dose=Energy absorbed/mass]
N.B.
)1()1(
22
thicknesseen
thicknesseen
thicknesseVolume
dose
I
Compton
electronCompton
ricphotoelect
incident
attscatt

27
IDE: Is there an optimal energy for a given sized sample ?
Paithankar & Garman, in preparation
Protein:
Phosphomethyl
pyrimidine
kinase P1
(398 residues)
5 sulphur atoms
12 seleniums
Beam: tophat
1012 photons/sec
x,y = 0.3 x 0.3
mm2

IDE : effect of selenium for a 100m thick crystal
FCC
F

IDE: effect of selenium for a 1 m crystal
FC
F
C

IDE: effect of heavy atoms: 500 m crystal
human phosphatase binding protein (HPBP)
C
F
FC

IDE for a 5 m crystal.
human phosphatase binding protein (HPBP)
FCF
C

32
Crystal and beam size corrections
Assume blue box is the X-ray beam
perpendicular to the screen and black arrow
is the rotation axis
For crystals whose dimensions exceed that
of the beam, dose as calculated for a
stationary crystal is not an accurate metric
for the estimation of radiation damage
Taking into account the irradiated volume of
the crystal if the crystal is bigger than the
beam
Knowledge of physical orientation of the
crystal with respect to X-ray beam
X-ray beam

The Plan:
• A metric for Radiation Damage. Dose:
RADDOSE.
• Scavengers: RT and 100K.
• Simultaneous multi-crystal data
collection and data retrieval.


The chemistry:
mobile e- go to electron affinic sitesElectron capture RSSR + e- [RSSR] •- (400 nm peak)
Disproportionation [RSSR] •- RS- + RS•
Protonation [RSSR] •- + H+ RSH + RS•
Electron loss RSSR [RSSR] •+ + e-
Alkyl loss RSSR + e- RSS- + R•
Weik et al (2000) PNAS 97, 623-628
Burmeister (2000), Acta Cryst D56, 328-341.
Ravelli and McSweeney, (2000) Structure 8, 315-328
Specific structural damage
DISULPHIDE BONDS (S-S) MOST SUSCEPTIBLE

Water/solvent chemistry1) Ionization
Ionizing radiation
H2O → H2O+• + e-
2) Electronic excitation
Ionizing radiation
H2O → H2O+-
H2O+• + H2O → H3O
+ + •OH
e- + n H2O → e-aq
H2O+ → H• + •OH
e-aq + H+ → H•
Scavengers at cryotemperatures:
Rationale
• Crystals are usually cooled to 100K to reduce the mobility of free radicals.
• The existence of specific damage at this temperature shows that some species are still mobile (electrons).
• Therefore scavengers may be able to react with these species and reduce their mobility and the reactivity of fixed species, protecting the crystal from specific damage.

Cystine
Ascorbate
Cystine
Quinone
Cystine

(a) HEWL
native dataset1
(b) HEWL
native dataset 6
(c) HEWL
ascorbate
dataset 1
(d) HEWL
ascorbate
dataset 6
Murray, J.M. & Garman, E.F.
JSR (2002) 9, 347-354.

Change in atomic B factors of refined structures
with dose.
No increase in temperature factor
70 % increase in temperature factor
RBG Ravelli & EF Garman
Current Opinion of Structural
Biology (2006) 16, 624-629.
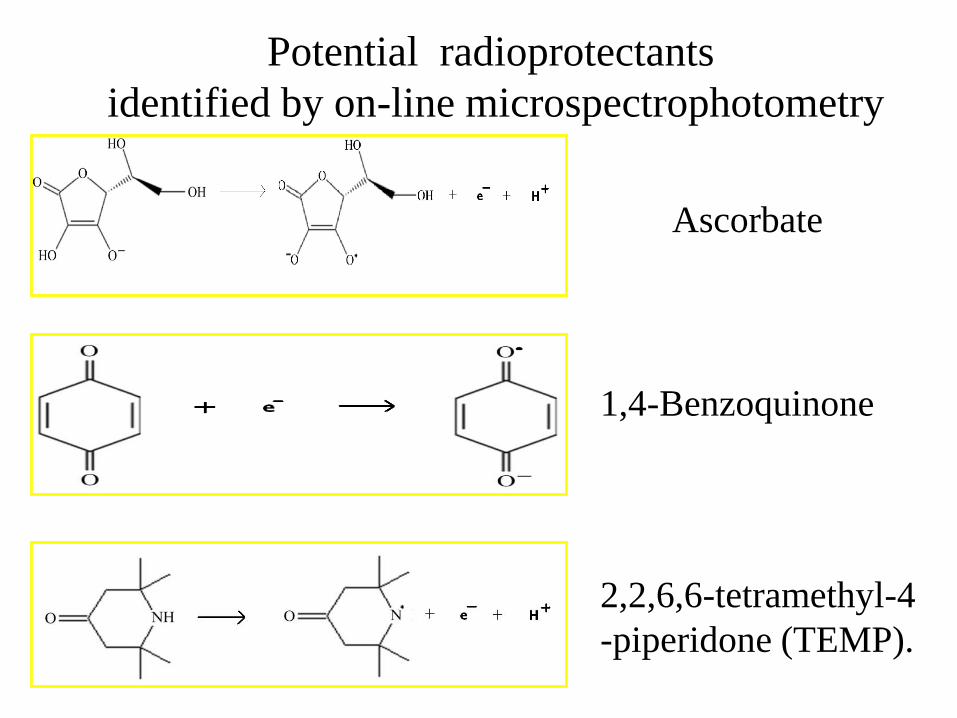
Potential radioprotectants
identified by on-line microspectrophotometry
Ascorbate
1,4-Benzoquinone
2,2,6,6-tetramethyl-4
-piperidone (TEMP).

RT: Ascorbate, co-crystallised 1M
Native–Exponential (1st Order), Ascorbate–Linear (0th Order).
Dose rates (Gy/Sec) = Native 1 – 6, Native 2 – 12.8
Ascorbate 1 – 6.4, Ascorbate 2 – 6.4
Decay of native crystals is linear at 100K – is the RT native exponential decay
dominated by OH radicals?
D1/2 Native = 0.125 MGy
D1/2 Ascorbate = 0.24 MGy

Synchrotron Data
R2 = 0.9646
R2 = 0.9859
0
0.2
0.4
0.6
0.8
1
1.2
0 0.2 0.4 0.6 0.8 1 1.2 1.4 1.6 1.8 2
Dose (MGy)
I/Io
Synchrotron Ascorbate
Synchrotron Native
Expon. (Synchrotron Native)
Linear (Synchrotron Ascorbate)
RT: ascorbate ESRF data: 2800 Gy/s
D1/2 Native = 0.9 MGy (x8)
D1/2 Ascorbate = 2.2 MGy (x9)
De = 2.

D1/2 Native = 0.14 MGy,
D1/2 Quinone = 1.2 MGy
De = 9.
Quinone, soak, 14 days, 1M
Native – Exponential (1st order), Quinone – Linear (0th).
Dose rates (Gy/Sec) = Native 1 – 6.4, Native 2 – 6.0
Quinone 1 – 5.7, Quinone 2 – 5.9
Electron density difference map analysis shows no specific damage.
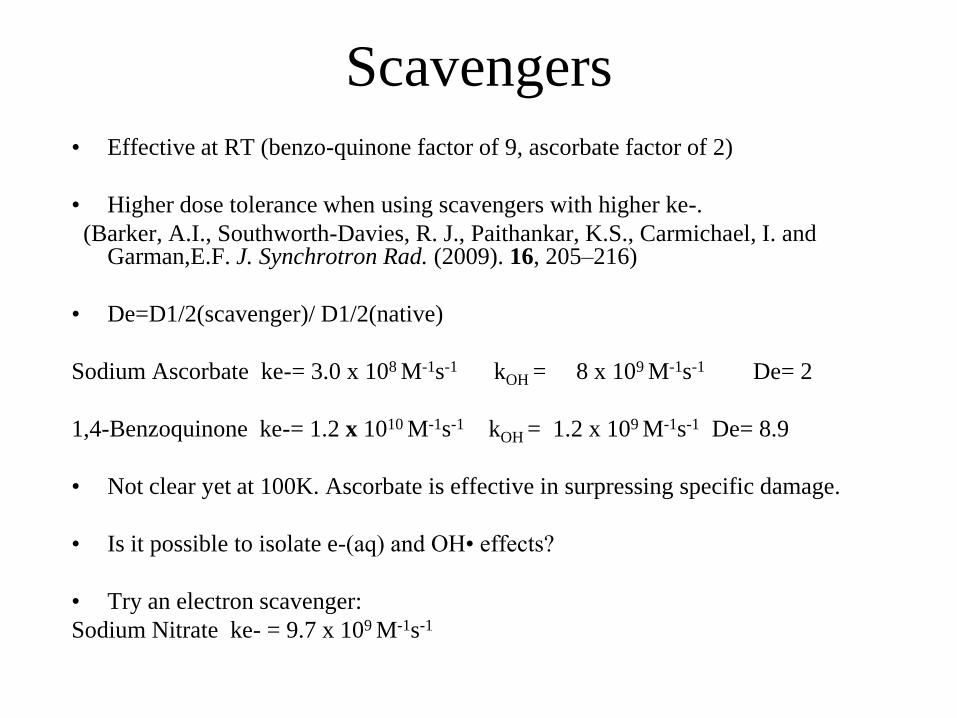
Scavengers
• Effective at RT (benzo-quinone factor of 9, ascorbate factor of 2)
• Higher dose tolerance when using scavengers with higher ke-.
(Barker, A.I., Southworth-Davies, R. J., Paithankar, K.S., Carmichael, I. and Garman,E.F. J. Synchrotron Rad. (2009). 16, 205–216)
• De=D1/2(scavenger)/ D1/2(native)
Sodium Ascorbate ke-= 3.0 x 10⁸ M-1s-1 kOH = 8 x 10⁹ M-1s-1 De= 2
1,4-Benzoquinone ke-= 1.2 x 10¹⁰ M-1s-1 kOH = 1.2 x 10⁹ M-1s-1 De= 8.9
• Not clear yet at 100K. Ascorbate is effective in surpressing specific damage.
• Is it possible to isolate e-(aq) and OH• effects?
• Try an electron scavenger:
Sodium Nitrate ke- = 9.7 x 10⁹ M-1s-1

•100K: Lysozyme solution (NaAc 200mM pH 4.7, 10%w/v NaCl lysozyme 50
mg/mL, 20 % glycerol)
•e-(aq) produced during the first fs of irradiation produced the disulfide radical
anionCys· with a characteristic peak around 400 nm.
time
0
0.02
0.04
0.06
0.08
0.1
0.12
0.14
0.16
0.18
0.2
0 50 100 150 200 250
No
rmalized
ab
sro
pti
on
t (s)
400nm
600nm
750nm
X-rays

time
time
X-rays
e-(aq) scavenged effectively.
No S-S• are observed.
100K: Lysozyme solution + 1M
sodium nitrate

0
0.1
0.2
0.3
0.4
0.5
0.6
0.7
0.8
0.9
1
0 10 20 30 40 50 60 70 80 90 100 110 120 130 140 150
Rd
Dose (MGy)
Native
Ascorbate
Nitratei
Nitrateii
Nitrate8min
Rd
Lysozyme crystal + 1M sodium nitrate
Protects disulfide bonds up to 70 MGy.
De = 3

Radioprotectants: Conclusions
Not yet seen more than a factor of 3 in global damage at
100K, but have seen protection of amino acids so definitely
worth considering for specific cases.
Have potential to make a significant difference at room
temperature.
We are working on trying to understand the changes
from first order to zeroth order kinetics at RT.
The Plan:
• A metric for Radiation Damage. Dose:
RADDOSE.
• Scavengers: RT and 100K.
• Simultaneous multi-crystal data
collection and data retrieval.

51
Objectives
Adapt methods from material sciences to macromolecular crystallography
Use of multiple crystals is routine in chemical crystallography
Take multiple crystals (2, 3, ... n) in a single loop and collect data – oriented
randomly
Index the diffraction pattern and utilize the information from all the crystals
Test the feasibility of the new methods for MX to combat radiation damage
Computationally provide accurate estimate of the maximum dose limit using the
program RADDOSE
Optimise the energy incident for a given crystal size, composition

52
Usual: Collect single crystal dataset for 100
Proposed: collect 20 of data from 5 different crystals simultaneously and combine them
data of 20 5 crystals ~ data of 100
Advantages:
All the 5 crystals are at the beginning of decay
Lower absorbed dose per crystal
Higher quality data
Metal centres, active site preserved
Extract correct biological information
Radiation damage in crystallography even at 100 K
Why ? Specific structural damage
φ rotation

53
Micro crystals used in structure solution
Minimize crystal handling (less mechanical damage)
Multiple micro crystals could be mounted with Crystal catcher system
Animal hairs attached or woven (like triple helices) on the surface of loops could be
used to fish micro-crystals
Streak seeding could be done with such loops and subsequently left in the drop (protein
+ precipitant) to grow crystals on their surface
Potential applications of multiple crystal diffraction
Crystal Catcher: Kitatani et al., (2008) Appl. Phys. Express 1, 370021-3

54
Multi-crystals: abundance of reflections leads to spot overlap
From material science to MX
Resolution: 2.5 Å

55
Overlap fraction with multiple crystals (mosaicity = 0.5º)
Dotted lines → LysozymeSolid lines → Insulin

56
Diffraction patterns with 1, 2, 3 and 4 crystals of lysozyme (top) and insulin (bottom), Δφ = 0.5º
Simulations of diffraction patterns
Lysozyme(unit cell volume: 228158 Å3)
Insulin(unit cell volume:472729 Å3)

57
Overview of the methodology
RADDOSE
Data acquisition
Indexing
CrystalOrientation
Spot
prediction
Harvestreflections
Integratedintensities
hkl, I,
3D – structure MX tools
Material scientists

58
Experiments: Multiple crystals in X-ray beam
Data of crystals from
lysozyme and insulin
collected at ESRF
(ID 14-4)
Insulin Lysozyme

Search for peaks above a certain
threshold and construct an array of
peaks
Indexing with pattern recognition
algorithm - Grainspotter
OUTPUT: orientation of each
crystal in the ensemble
The orientation of each crystal
lattice is provided to MOSFLM by
means of the U (orientation) matrix
and data integrated
Red and green indicate the two
different lattices from two crystal
lysozyme dataset
Data reduction in practice using materials science software
www.totalcryst.dk (all programs released as
open source: www.sf.net

A single lattice from a four crystal Lysozyme dataset

Animation illustrates the four lattices identified uniquely from a dataset obtained from a multiple crystal data collection with four crystals in the beam

62
Summary – TotalCryst
Simulations show spot overlap is not huge problem; due to random overlap and not
systematic overlap
Data were collected with multiple single crystals in a single loop
Possible to index unknown lattice but collecting few exposures with only one crystal or
select an exposure with one strong lattice
Extraction of data from up to 7 crystals achieved
The combination of data from multiple crystals compensates for the loss of redundancy
owing to rejected spots
Need to extend the experiments to microcrystals.
Paithankar, K.S., Sørensen, H.Ø., Poulsen, H. F & Garman, E. F. in preparation
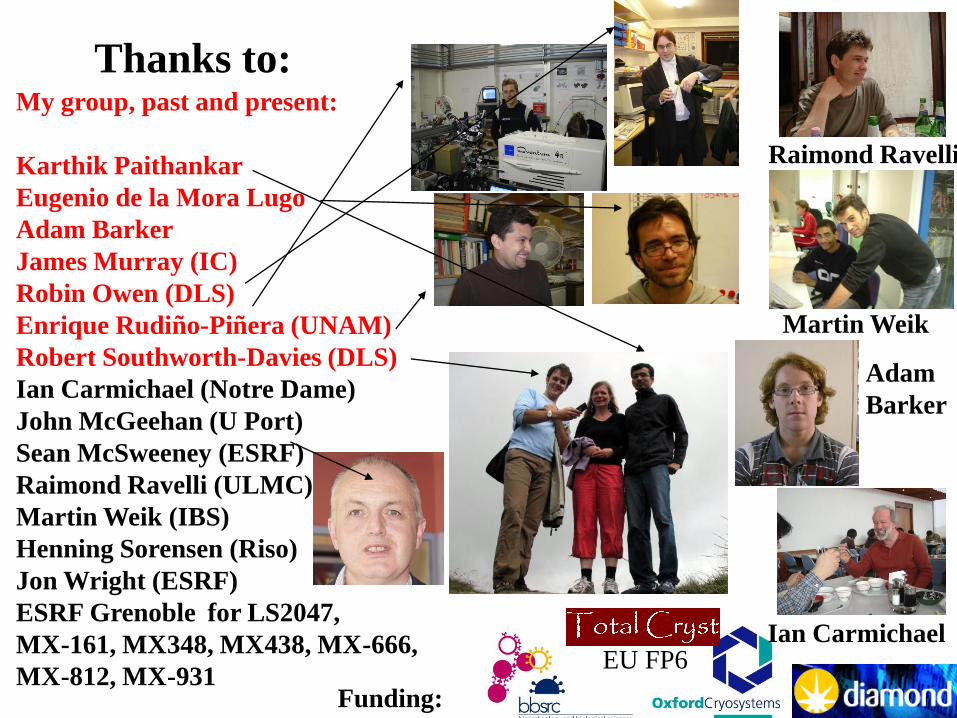
My group, past and present:
Karthik Paithankar
Eugenio de la Mora Lugo
Adam Barker
James Murray (IC)
Robin Owen (DLS)
Enrique Rudiño-Piñera (UNAM)
Robert Southworth-Davies (DLS)
Ian Carmichael (Notre Dame)
John McGeehan (U Port)
Sean McSweeney (ESRF)
Raimond Ravelli (ULMC)
Martin Weik (IBS)
Henning Sorensen (Riso)
Jon Wright (ESRF)
ESRF Grenoble for LS2047,
MX-161, MX348, MX438, MX-666,
MX-812, MX-931
Thanks to:
Raimond Ravelli
Martin Weik
Funding:
Ian Carmichael
Adam
Barker
EU FP6