Parallel In Situ Screening of Remediation Strategies for
72
(ER-200914) Parallel In Situ Screening of Remediation Strategies for Improved Decision Making, Remedial Design, and Cost Savings November 2012
Transcript of Parallel In Situ Screening of Remediation Strategies for

(ER-200914)
Parallel In Situ Screening of Remediation Strategies for Improved Decision Making, Remedial Design, and Cost Savings November 2012

i
COST & PERFORMANCE REPORT Project: ER-200914
TABLE OF CONTENTS
Page
EXECUTIVE SUMMARY ............................................................................................................ 1 OBJECTIVES ..................................................................................................................... 1 TECHNOLOGY DESCRIPTION ...................................................................................... 1 RESULTS ........................................................................................................................... 2 BENEFITS .......................................................................................................................... 2
1.0 INTRODUCTION .............................................................................................................. 5 1.1 BACKGROUND .................................................................................................... 5 1.2 OBJECTIVE OF THE DEMONSTRATION ......................................................... 5 1.3 REGULATORY DRIVERS ................................................................................... 6
2.0 TECHNOLOGY ................................................................................................................. 7 2.1 TECHNOLOGY DESCRIPTION .......................................................................... 7 2.2 ADVANTAGES, RISKS AND LIMITATIONS OF THE
TECHNOLOGY ..................................................................................................... 8
3.0 PERFORMANCE OBJECTIVES .................................................................................... 11
4.0 SITE DESCRIPTION ....................................................................................................... 13 4.1 SITE SELECTION ............................................................................................... 13 4.2 SITE LOCATION AND HISTORY ..................................................................... 13
4.2.1 NASNI, San Diego, CA – OU-20 ............................................................. 13 4.2.2 Industrial Site, Mesa, AZ .......................................................................... 13
4.3 SITE GEOLOGY AND HYDROGEOLOGY...................................................... 14 4.3.1 NASNI, San Diego, CA – OU-20 (Site 1) ................................................ 14 4.3.2 Industrial Site, Mesa, AZ (Site 2) ............................................................. 14
4.4 CONTAMINANT DISTRIBUTION .................................................................... 15 4.4.1 NASNI, San Diego, CA – OU-20 ............................................................. 15 4.4.2 Industrial Site, Mesa, AZ .......................................................................... 15
5.0 TEST DESIGN ................................................................................................................. 17 5.1 CONCEPTUAL EXPERIMENTAL DESIGN ..................................................... 17 5.2 BASELINE CHARACTERIZATION .................................................................. 17
5.2.1 NASNI – Prior Laboratory Treatability Studies ....................................... 17 5.2.2 NASNI – Prior Field-Scale Pilot Study .................................................... 18 5.2.3 Industrial Site – Prior Lab Treatability Studies ........................................ 19 5.2.4 Water Sampling ........................................................................................ 20
5.3 TREATABILITY OR LABORATORY STUDY RESULTS .............................. 20 5.3.1 NASNI – Laboratory Flow-through Experiments .................................... 20 5.3.2 Industrial Site – Laboratory Experiments in Batch................................... 22

TABLE OF CONTENTS (continued)
Page
ii
5.3.3 Industrial Site – Laboratory Experiments in Flow-through Columns .................................................................................................... 23
5.4 DESIGN AND LAYOUT OF TECHNOLOGY COMPONENTS ...................... 25 5.4.1 Outer Shell of the ISMA ........................................................................... 25 5.4.2 Sediment Column Tests ............................................................................ 28 5.4.3 Delivery of Treatment Agent .................................................................... 28 5.4.4 Effluent Capturing .................................................................................... 28
5.5 FIELD TESTING.................................................................................................. 28 5.5.1 DATA ANALYSIS ................................................................................... 29
5.6 SAMPLING RESULTS ........................................................................................ 30 5.6.1 NASNI – ISMA Results............................................................................ 30 5.6.2 Industrial Site – ISMA Results ................................................................. 35
6.0 PERFORMANCE ASSESSMENT .................................................................................. 40 6.1 PERFORMANCE OBJECTIVE: DEMONSTRATE CAPABILITY OF
CONDUCTING MUTUALLY EXCLUSIVE EXPERIMENTS IN THE SAME WELL ....................................................................................................... 40
6.2 PERFORMANCE OBJECTIVE: NO RESIDUE RELEASED INTO MONITORING WELL DURING TESTING ...................................................... 41
6.3 PERFORMANCE OBJECTIVE: DETERMINE POTENTIAL SIDE EFFECTS OF REMEDIATION STRATEGIES .................................................. 41
6.4 PERFORMANCE OBJECTIVES: ISMA STUDY IS COST-EFFECTIVE COMPARED TO A LAB STUDY OF COMPARABLE SCOPE ....................... 41
6.5 PERFORMANCE OBJECTIVES: COMPARE COST OF CONDUCTING ISMA STUDY VS. FIELD TRIAL........................................... 41
6.6 PERFORMANCE OBJECTIVE: REPRODUCE OUTCOME OF PRIOR LAB STUDIES IN THE ISMA ............................................................................ 41 6.6.1 NASNI .......................................................Error! Bookmark not defined. 6.6.2 Industrial Site ............................................................................................ 44
6.7 PERFORMANCE OBJECTIVE: REPRODUCE OUTCOME OF PRIOR FIELD TRIALS IN THE ISMA ........................................................................... 45
7.0 COST ASSESSMENT ...................................................................................................... 46 7.1 COST MODEL ..................................................................................................... 46 7.2 COST DRIVERS .................................................................................................. 48 7.3 COST ANALYSIS................................................................................................ 49
8.0 IMPLEMENTATION ISSUES AND CONCLUSIONS .................................................. 52
9.0 REFERENCES ................................................................................................................. 54 APPENDIX A POINTS OF CONTACT......................................................................... A-1
iii
LIST OF FIGURES
Page Figure 1. Schematic of laboratory column setup. ................................................................. 21 Figure 2. Chlorinated ethenes and ethene detected in effluent of NASNI sediment
columns. ................................................................................................................ 22 Figure 3. Biostimulation of site sediment (well HPA-1) and site groundwater from a
perchlorate-contaminated location incubated in batch bottles with ethyl lactate as a carbon source. ..................................................................................... 23
Figure 4. Concentration of perchlorate in column effluent over the course of the experiment............................................................................................................. 24
Figure 5. Results of quantitative polymerase chain reaction (PCR) targeting the 16S rRNA gene of general bacteria and pcrA.. ............................................................ 25
Figure 6. Detailed schematic of the ISMA device. .............................................................. 26 Figure 7. Performance control experiments ......................................................................... 27 Figure 8. Hexavalent chromium detected in ISMA effluent post in situ incubation............ 31 Figure 9. Chlorinated ethenes and ethene detected in ISMA effluent post in situ
incubation. ............................................................................................................. 31 Figure 10. Column pore water analysis for chlorinated ethenes and ethene after
retrieval and again after 25 days with no flow. ..................................................... 32 Figure 11. Concentrations of primary contaminants detected in the ISMA deployment
well compared to those found in ISMA bypass channels. .................................... 33 Figure 12. Sum of chlorinated ethenes (TCE, cis-DCE, and VC) detected in the
different samples types. ........................................................................................ 34 Figure 13. Concentration of perchlorate in different experimental groups normalized to
influent (bypass).................................................................................................... 35 Figure 14. Relative bacteria distribution in sediment columns .............................................. 36 Figure 15. Anion concentrations in column effluent of different experimental groups ......... 40 Figure 16. Sampling results from a batch bottle microcosm study performed by SiRem,
demonstrating the effectiveness of bioaugmentation with KB-1® for treatment of groundwater from OU-20 at NASNI. ............................................... 43
Figure 17. Cost comparison of treatability study methods. .................................................... 51
iv
LIST OF TABLES
Page Table 1. Overview of principal advantages and limitations of ISMA technology. .............. 9 Table 2. Performance Objectives as stated in the Demonstration Plan. ............................. 11 Table 3. Experimental plan for NASNI (Site 1). ................................................................ 17 Table 4. Experimental plan for Site 2. ................................................................................ 17 Table 5. Experimental plan for Geosyntec laboratory batch study. .................................... 19 Table 6. Groundwater collected during ISMA incubation. Column parameters of
residence time, groundwater linear velocities, and pore volumes exchanged assume a porosity value of 0.4. ............................................................................. 30
Table 7. TCE: calculated first-order degradation constants (k day-1). ................................ 42 Table 8. Cr(VI): calculated first-order degradation constants (k day-1). ............................. 42 Table 9. Variable Sourcing for Rate Calculations at NASNI. ............................................ 44 Table 10. Overview of first-order reduction rates for Site 2. Results from lab and field
experiments are listed. .......................................................................................... 45 Table 11. Direct material costs incurred during NASNI deployment................................... 46 Table 12. Direct costs for sample analyses by commercial laboratory incurred during
NASNI deployment. ............................................................................................. 47 Table 13. Projected labor needs for future deployments. ..................................................... 47 Table 14. Projected ISMA costs. .......................................................................................... 49 Table 15. Feasibility study project costs: OU-20, NASNI. .................................................. 50

This page left blank intentionally.

vi
ACRONYMS AND ABBREVIATIONS ASU Arizona State University bgs below ground surface cis-DCE cis-dichloroethene CERCLA Comprehensive Environmental Response, Compensation, and Liability
Act Cr(VI) hexavalent chromium DNA deoxyribonucleic acid ESTCP Environmental Security Technology Certification Program FID flame ionization detection FTE full-time employment ft2/min square feet per minute GAC granular activated carbon GC gas chromatography HS SPME headspace solid phase microextraction ID inner diameter ISMA in situ microcosm array ITRC Interstate Technology and Regulatory Council LAU Lower Alluvial Unit MAU Middle Alluvial Unit MCL maximum contaminant level MNA monitored natural attenuation msl mean sea level NaBr sodium bromide NASNI Naval Air Station North Island NRC National Research Council OU Operable Unit PCR Polymerase Chain Reaction pcrA perchlorate reductase gene A PEW persulfate extraction well SRS slow-release substrate
ACRONYMS AND ABBREVIATIONS (continued)
vii
TCE trichloroethene TDS total dissolved solids UAU Upper Alluvial Unit USEPA U.S. Environmental Protection Agency VC vinyl chloride VOC volatile organic compound WBO water bore-out ZEP ZEP® Septic Cleaner; Commercial Microbial Culture

Technical material contained in this report has been approved for public release. Mention of trade names or commercial products in this report is for informational purposes only;
no endorsement or recommendation is implied.
viii
ACKNOWLEDGEMENTS We would like to acknowledge the contributions of the following people to the design, development, and manufacturing of the in situ microcosm array (ISMA): Thomas A. Bruton (Graduate Student, Arizona State University [ASU]) David Gillespie (Senior Machinist, Engineering Technical Services Service, ASU) Dennis Golabiewski (Manager, Engineering Technical Services Service) Martin Johnson (Instrument Maker/Designer, Engineering Technical Services Service, ASU) David Mushier (Machinist, Engineering Technical Services Service, ASU) Ben Schwatken (Senior Machinist, Engineering Technical Services Service, ASU) The following people supported laboratory efforts as well as fieldwork: Benjamin Duong (Undergraduate Student, ASU) Isaac Roll (Graduate Student, ASU) Samuel Supowit (Graduate Student, ASU) Rosa Krajmalnik-Brown (Assistant Professor, ASU) Michal Ziv-El (Postdoctoral Associate, ASU) He-Ping (Postdoctoral Associate, ASU) Anca Delgado (Graduate Student, ASU) Mark Holl (Associate Director for Technology Development, ASU Biodesign Institute) We thank the following individuals for site access and support of field operations: Naval Air Station North Island (NASNI): Michael Pound Linda Hollingsworth (Project manager, Sealaska) Brian White Scott Fenby Industrial Site: Anonymous I Anonymous II We also like to thank the following members of the Environmental Security Technology Certification Program (ESTCP) project team: Andrea Leeson Deanne Rider Brittany Wills Katie O’Toole Nancy Ruiz Many thanks to the following individuals for hosting the first field trial and valuable feedback: Vic Madrid Steve Gregory Leslie Ferry

This page left blank intentionally.

1
EXECUTIVE SUMMARY
This report summarizes the development and demonstration of a new tool for remedial design, the in situ microcosm array (ISMA). It may serve potential end users as a general guide on how to utilize the ISMA technology in the design and interpretation of in situ feasibility studies.
OBJECTIVES
Before in situ remediation can be implemented at a hazardous waste site, bench-scale or field-scale feasibility studies are required. These are typically conducted in static batch-bottle microcosms, while an alternative approach, continuous-flow column studies, are rare in the remediation industry. Although scientifically constituting the “gold standard” approach to studying transport and reaction phenomena in saturated media, column studies are avoided due to a combination of factors including: considerable costs; complexity and difficulty in performing multiple replicates; and the requirement of considerable operator time. Although batch bottle tests may be adequate for qualitative screening of remedial design options, they are generally considered to have poor quantitative predictive power. In contrast, column studies are expected to produce both reliable qualitative and quantitative data, as they create a more realistic reflection of subsurface realities and the associated difficulty of delivering the remedial agent to where the contaminants of concern reside. On the small-scale, the ISMA technology answers this challenge by creating a platform for standardized flow-through sediment column experiments, and thus makes the more sophisticated continuous-flow evaluation method more accessible to the Department of Defense and to the environmental restoration industry.
TECHNOLOGY DESCRIPTION
The ISMA is the hybrid of a laboratory treatability study and a field pilot trial. The device contains of all the components necessary for it to autonomously conduct a flow-through sediment column treatability study in the subsurface. All components—columns, pumps, electronics, etc.—have been miniaturized and assembled to fit within a 4-inch groundwater well. During operation, the ISMA is suspended in a well for approximately 4-8 weeks, during which time it operates autonomously collecting groundwater directly from the subsurface formation and feeding it into the array of microcosms. The ISMA can accommodate up to 10 sediment column microcosms, allowing for the side-by-side testing of 10 remediation strategies under truly identical conditions, or the testing of fewer strategies in replicate experiments to assess reproducibility. Throughout the deployment period, all the groundwater entering the ISMA is collected in column-specific, individual effluent capture vessels, which is analyzed in the laboratory after retrieval of the ISMA from the well. The main advantages the ISMA offers are: (i) reduced cost when compared to alternatives; (ii) generated data on field performance of remediation technologies with zero-risk of negative impacts on the aquifer; (iii) screened multiple, mutually exclusive, treatment options in parallel; and (iv) used fresh groundwater when in situ, drew in real time from the subsurface formation, thereby reflecting the ambient hydrogeochemistry and microbiology of the target environment. Limitations of the ISMA technology include that the current embodiment does not enable intermittent or continuous monitoring of conditions prevailing in the device during field

2
incubation. Further, the construction of sediment microcosms may result in experimental bias and potential inactivation of sensitive anaerobic microorganisms. Lastly, as any other small-scale feasibility assessment tool, the ISMA technology is incapable of assessing site heterogeneities that are known to influence the outcome of remediation efforts.
RESULTS
Two demonstration deployment of the ISMA are summarized, one evaluating three different in situ remediation strategies for treatment of perchlorate, and the other evaluating three different strategies for treatment of two co-contaminants, hexavalent chromium [Cr(VI)] and trichloroethene (TCE). Where applicable, ISMA-generated results were compared to and found consistent with complimentary data sets produced from batch-bottle treatability studies, laboratory column studies, and field pilot trials. Results gathered in the course of the project indicate that the ISMA is a cost-effective, and suitable alternative to contemporary treatability or feasibility study methods. Qualitatively, results from ISMA and batch-bottle studies led to similar conclusions: both indicated that bioaugmentation was effective at treating the perchlorate (Site 1) and Cr(VI) and TCE (Site 2). This conclusion is consistent with the results from all relevant site-specific data sets, including (i) data gathered in our laboratory at Arizona State University (ASU) from both complimentary batch-bottle studies and flow-through column studies; (ii) results generated from a batch-bottle study conducted by an outside consulting firm, (iii) and results generated from a field pilot trial. A quantitative comparison of first-order degradation rate constants found that batch bottles overestimated field rates by over an order of magnitude (>10), while the degradation rates observed in the ISMA differed from those observed in the field only by a factor of two (2). This result indicates that the ISMA more accurately reproduces field phenomena, and may potentially be used to quantitatively and accurately assess the field performance of in situ remediation technologies. The report concludes with a cost-analysis of the ISMA demonstration deployments and a cost model for projecting future ISMA deployment costs. The cost-effectiveness evaluation finds that the ISMA costs are similar to a traditional bottle treatability study conducted in static (batch) mode, but notably lower than both a laboratory column test and field pilot trial. Furthermore, the standardized, modular components of the ISMA can be used as a platform for conducting column studies in the lab as well. This usage mode can serve to reduce costs of a laboratory column study, thereby making the more sophisticated flow-through evaluation method more accessible to environmental restoration professionals.
BENEFITS
The ISMA is a new platform for conducting column studies in the laboratory and in the field. The standardized column format allows for the performance of experiments in multiple replicates, which is of great importance because of the large variability associated with microcosm experiments. The technology’s high degree of automation reduces the requirement for constant monitoring by an operator. Its application in the subsurface helps to create quasi-field conditions in the device and eliminates to a large degree the need for maintaining expensive laboratory space; in situ operation may serve to reduce laboratory artifacts introduced by removal of groundwater from the subsurface. In situ operation also yields degradation rates that

3
are more consistent with observed field rates, which will greatly benefit decision-making in the remedial design phase of site cleanup. Furthermore, the cost evaluation performed here showed that an ISMA deployment is only marginally more expensive than a contemporary batch bottle experiment but drastically less expensive than the alternatives, namely a contemporary laboratory column study and a field pilot trial.

This page left blank intentionally.
5
1.0 INTRODUCTION
1.1 BACKGROUND
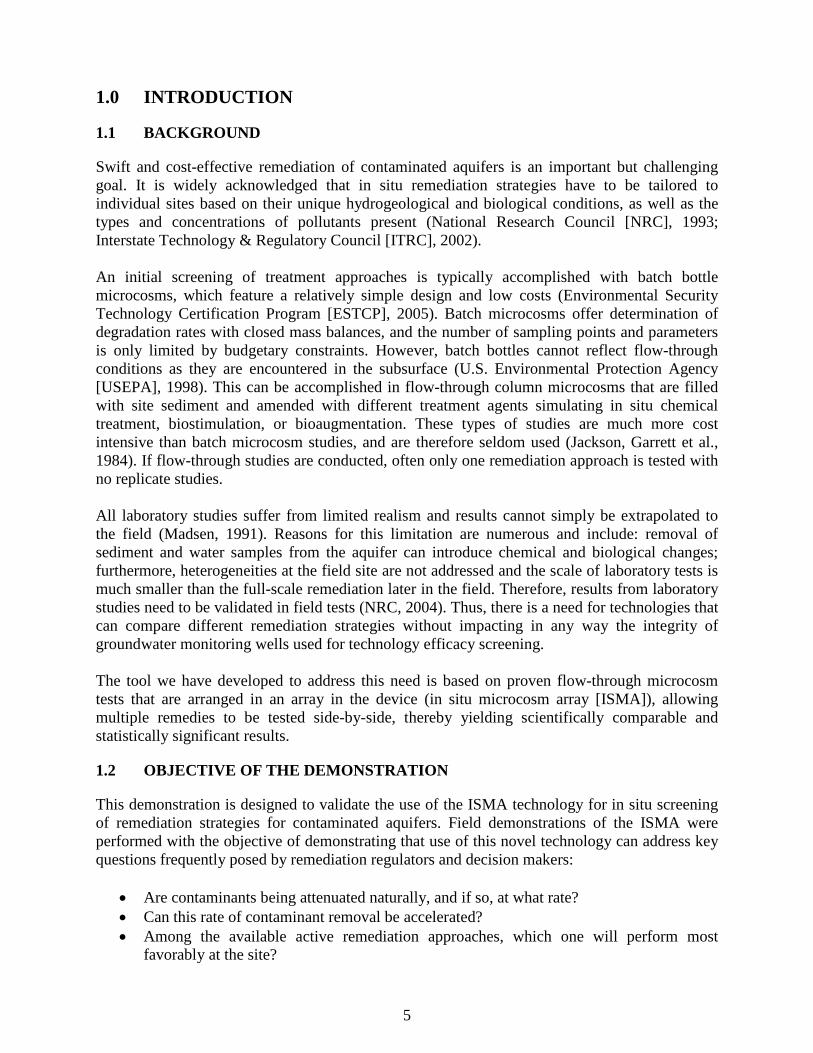
Swift and cost-effective remediation of contaminated aquifers is an important but challenging goal. It is widely acknowledged that in situ remediation strategies have to be tailored to individual sites based on their unique hydrogeological and biological conditions, as well as the types and concentrations of pollutants present (National Research Council [NRC], 1993; Interstate Technology & Regulatory Council [ITRC], 2002). An initial screening of treatment approaches is typically accomplished with batch bottle microcosms, which feature a relatively simple design and low costs (Environmental Security Technology Certification Program [ESTCP], 2005). Batch microcosms offer determination of degradation rates with closed mass balances, and the number of sampling points and parameters is only limited by budgetary constraints. However, batch bottles cannot reflect flow-through conditions as they are encountered in the subsurface (U.S. Environmental Protection Agency [USEPA], 1998). This can be accomplished in flow-through column microcosms that are filled with site sediment and amended with different treatment agents simulating in situ chemical treatment, biostimulation, or bioaugmentation. These types of studies are much more cost intensive than batch microcosm studies, and are therefore seldom used (Jackson, Garrett et al., 1984). If flow-through studies are conducted, often only one remediation approach is tested with no replicate studies. All laboratory studies suffer from limited realism and results cannot simply be extrapolated to the field (Madsen, 1991). Reasons for this limitation are numerous and include: removal of sediment and water samples from the aquifer can introduce chemical and biological changes; furthermore, heterogeneities at the field site are not addressed and the scale of laboratory tests is much smaller than the full-scale remediation later in the field. Therefore, results from laboratory studies need to be validated in field tests (NRC, 2004). Thus, there is a need for technologies that can compare different remediation strategies without impacting in any way the integrity of groundwater monitoring wells used for technology efficacy screening. The tool we have developed to address this need is based on proven flow-through microcosm tests that are arranged in an array in the device (in situ microcosm array [ISMA]), allowing multiple remedies to be tested side-by-side, thereby yielding scientifically comparable and statistically significant results.
1.2 OBJECTIVE OF THE DEMONSTRATION
This demonstration is designed to validate the use of the ISMA technology for in situ screening of remediation strategies for contaminated aquifers. Field demonstrations of the ISMA were performed with the objective of demonstrating that use of this novel technology can address key questions frequently posed by remediation regulators and decision makers:
• Are contaminants being attenuated naturally, and if so, at what rate? • Can this rate of contaminant removal be accelerated? • Among the available active remediation approaches, which one will perform most
favorably at the site?
6
• Will the manipulation of environmental conditions at the site lead to unwanted effects, such as sediment clogging or solubilization of toxic metals?
This document summarizes the design, execution and results of ISMA field demonstrations and may serve for potential end users as a general guide for utilizing the ISMA technology in the design and interpretation of in situ feasibility studies.
1.3 REGULATORY DRIVERS
Regulatory drivers exist on federal and state levels. Sites regulated under the Comprehensive Environmental Response, Compensation, and Liability Act (CERCLA) have substantial requirements that are Operable Unit (OU) specific and that regulate the discharge of any water from a particular OU. This includes treated and untreated groundwater as well as any reagents that have been added for treatment. The regulation also encompasses secondary groundwater contaminants whose concentrations could be affected by subsurface injection of substances for treatment. Regulations for non-CERCLA sites differ by state. Arizona, California, and many other states require that, before injections of reagents into the subsurface are conducted, some type of pilot feasibility study be performed to demonstrate the selected remedy’s suitability, effectiveness, safety, and absence of potential adverse long-term water quality impacts. The ISMA is designed as a state-of-the-art tool for conducting enhanced bioremediation treatability tests under realistic in situ conditions, and to do so in a way that satisfies the pilot study eligibility requirements of state and governmental regulations by providing bench-scale and field testing as well as identifying possible adverse impacts to groundwater beneficial uses. To this extent, the main objectives of this ISMA demonstration project were:
(i) To demonstrate the feasibility of using the ISMA technology to simultaneously test multiple reagents and to determine an optimal reagent that will transform contaminants into benign by-products.
(ii) To demonstrate the feasibility of assessing any unwanted water-quality impacts that could result from injecting a given selected reagent, and to do so without sacrificing a valuable monitoring location or irreversibly altering the water-bearing zone under investigation.
7
2.0 TECHNOLOGY
2.1 TECHNOLOGY DESCRIPTION
Treatability studies for in situ remediation are best accomplished in flow-through column microcosms that are filled with site sediment and amended with different treatment agents simulating in situ chemical treatment, biostimulation, or bioaugmentation. Their main advantage over conventional batch microcosms is the simulation of flow conditions, which govern processes in the subsurface. The ISMA technology is based on the proven column study approach (Drzyzga, El Mamouni et al., 2002) that was miniaturized, such that fully controlled flow-through column experiments can be conducted in the field in situ (Halden, 2004; Halden, 2005). A column treatability study refers to a method of simulating field conditions in a controlled experiment whereby water continuously flows through a packed bed of sediment. The water and sediment can be collected from the actual location (well, subsurface stratum) being simulated or one may use an analog or synthetic substitute prepared in the laboratory or collected elsewhere. Column studies represent the “gold standard” of laboratory treatability studies, owing to the continuous flow conditions they create that are more reflective of the subsurface. The deployment of the ISMA technology encompasses:
(i) the delivery of the self-contained ISMA device into the screened interval of a deployment well,
(ii) incubation of the device for a period of several weeks,
(iii) removal of the device from the deployment well, and
(iv) analysis of the sediment columns contained therein, and of each columns’ effluent that is stored in the device in individual storage containers (effluent vessels) and retrieved from the well together with the ISMA apparatus after testing (Miller, 2005).
The current ISMA device contains an array of up to 10 sediment columns configured to reflect different treatment approaches (e.g., natural attenuation, nutrient injection, bioaugmentation, passive reactive barrier, chemical oxidation, etc.) that may be mutually exclusive (Halden, 2005). The ISMA further contains an intake with a one-way check valve, a 1-to-12 splitting manifold, 2 multi-channel peristaltic pumps regulating flow rates in 12 liquid lines, a step-motor delivering treatment agents, 12 separate liquid effluent capture vessels, 12 sorbent-based in-line cartridges for volatiles capture, secondary liquid containment system, and assorted control electronics and line management systems. The different components of the device are housed in tubular stainless-steel sections that are connected sequentially during field deployment of the device. The connections between modules are load bearing, waterproof and transmit all necessary fluid lines and electrical signals. The device is suspended from a steel cable at the desired depth. Electrical power is supplied from an array of batteries and solar panels in remote locations or from a standard electrical outlet (110 V or more) where available. This enables autonomous operation for the duration of the treatability test.
8
During the in situ test, groundwater is pumped directly from the subsurface formation through a screened intake (100 µm pore size), which is lined up in depth below ground surface (bgs) with the screened interval of the well or, in a well with a longer screen, with the depth where the treatment is to be implemented. Within the ISMA device, the groundwater flow is split into 12 individual lines by a custom manifold and fed through two six-channel peristaltic pumps, which pump the groundwater in an up-flow mode through the sediment-filled glass columns (microcosms). Up-flow operation ensures sediment saturation and allows gas bubbles to escape at the top of each column. Flow rates can be adjusted to achieve microcosm residence times representative of the linear velocity of groundwater in the targeted aquifer stratum at the deployment site. Experiments in the ISMA are typically conducted in triplicate, producing data featuring confidence intervals that help to compare and identify, in a scientifically defensible manner, which treatment works best. The device is designed such that conducted tests should leave no trace behind, do not change the local geochemistry and microbiology, and thus do not preclude technology-deployment wells from continued use as valid compliance monitoring locations (Halden, 2005; Miller, Franklin et al., 2007). The ISMA represents the first tool that allows fully contained in situ flow-through studies with multiple approaches/replicates tested at the same time. The proprietary ISMA technology is designed to inexpensively provide the Department of Defense and other stakeholders with information that cannot be obtained in any other fashion. Information collected by the device on a well-by-well basis includes:
(i) occurrence and in situ rate of natural attenuation,
(ii) identification among multiple (2 or more) treatment approaches that may be mutually exclusive (e.g., aerobic vs. anaerobic treatment), the one that is most effective in a given location,
(iii) determination of the corresponding accelerated rate of contaminant removal,
(iv) information on the extent of sorption and the migration of contaminants, injected nutrients and microorganisms in site sediment,
(v) phenomena occurring as a result of treatment implementation (i.e., increased dissolution of toxic metals from site sediment), and
(vi) information that is essential to conduct a cost analysis to understand which treatment is most economical, based on the gain in contaminant removal rate per volume of treatment agent.
2.2 ADVANTAGES, RISKS AND LIMITATIONS OF THE TECHNOLOGY
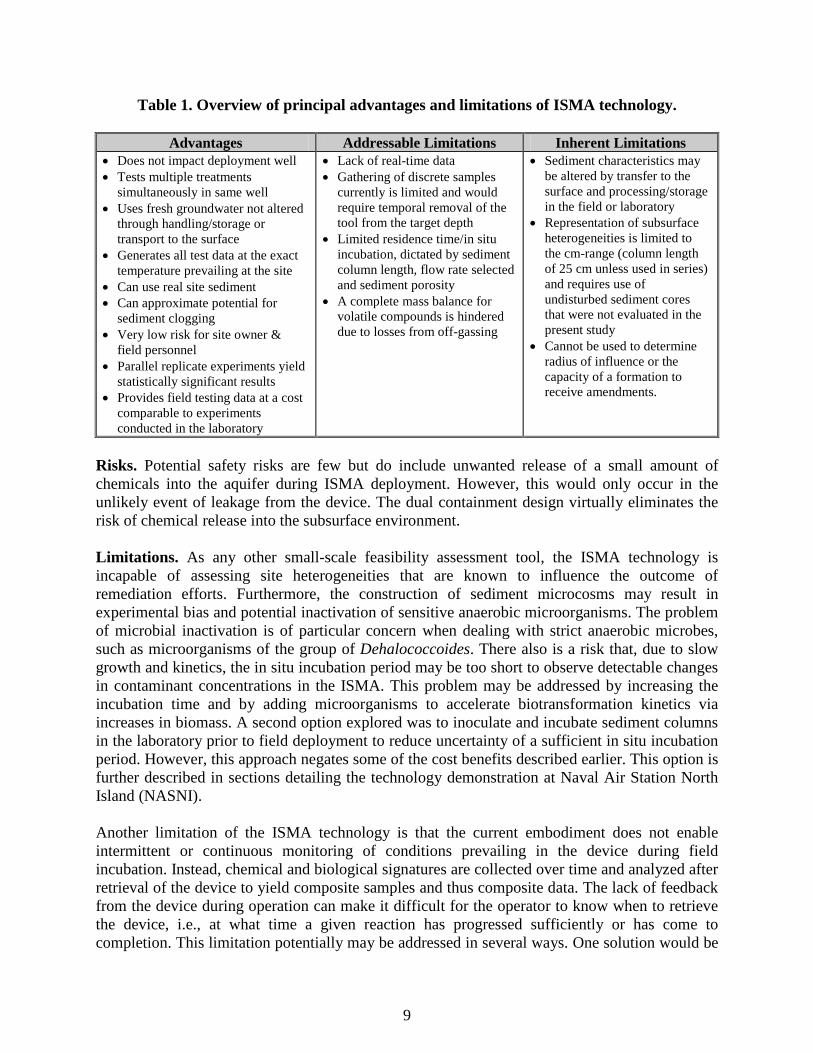
Advantages. The value of the ISMA, as demonstrated here, lies in its ability to test multiple reagents simultaneously under representative subsurface conditions without irreversibly impacting the contaminated water-bearing zone in the vicinity of the well and without sacrificing the well as a monitoring point. The ISMA technology provides multiple benefits (Table 1).
9
Table 1. Overview of principal advantages and limitations of ISMA technology.
Advantages Addressable Limitations Inherent Limitations • Does not impact deployment well • Tests multiple treatments
simultaneously in same well • Uses fresh groundwater not altered
through handling/storage or transport to the surface
• Generates all test data at the exact temperature prevailing at the site
• Can use real site sediment • Can approximate potential for
sediment clogging • Very low risk for site owner &
field personnel • Parallel replicate experiments yield
statistically significant results • Provides field testing data at a cost
comparable to experiments conducted in the laboratory
• Lack of real-time data • Gathering of discrete samples
currently is limited and would require temporal removal of the tool from the target depth
• Limited residence time/in situ incubation, dictated by sediment column length, flow rate selected and sediment porosity
• A complete mass balance for volatile compounds is hindered due to losses from off-gassing
• Sediment characteristics may be altered by transfer to the surface and processing/storage in the field or laboratory
• Representation of subsurface heterogeneities is limited to the cm-range (column length of 25 cm unless used in series) and requires use of undisturbed sediment cores that were not evaluated in the present study
• Cannot be used to determine radius of influence or the capacity of a formation to receive amendments.
Risks. Potential safety risks are few but do include unwanted release of a small amount of chemicals into the aquifer during ISMA deployment. However, this would only occur in the unlikely event of leakage from the device. The dual containment design virtually eliminates the risk of chemical release into the subsurface environment. Limitations. As any other small-scale feasibility assessment tool, the ISMA technology is incapable of assessing site heterogeneities that are known to influence the outcome of remediation efforts. Furthermore, the construction of sediment microcosms may result in experimental bias and potential inactivation of sensitive anaerobic microorganisms. The problem of microbial inactivation is of particular concern when dealing with strict anaerobic microbes, such as microorganisms of the group of Dehalococcoides. There also is a risk that, due to slow growth and kinetics, the in situ incubation period may be too short to observe detectable changes in contaminant concentrations in the ISMA. This problem may be addressed by increasing the incubation time and by adding microorganisms to accelerate biotransformation kinetics via increases in biomass. A second option explored was to inoculate and incubate sediment columns in the laboratory prior to field deployment to reduce uncertainty of a sufficient in situ incubation period. However, this approach negates some of the cost benefits described earlier. This option is further described in sections detailing the technology demonstration at Naval Air Station North Island (NASNI). Another limitation of the ISMA technology is that the current embodiment does not enable intermittent or continuous monitoring of conditions prevailing in the device during field incubation. Instead, chemical and biological signatures are collected over time and analyzed after retrieval of the device to yield composite samples and thus composite data. The lack of feedback from the device during operation can make it difficult for the operator to know when to retrieve the device, i.e., at what time a given reaction has progressed sufficiently or has come to completion. This limitation potentially may be addressed in several ways. One solution would be

10
for the operator to periodically retrieve the device to obtain updates on the extent of chemical and biological reactions taking place in the device. Another option would be to develop a real-time monitoring module that queries the chemistry in the various column effluent lines sequentially. Alternatively, in shallow deployment situations, effluent from the columns may be transported to the surface for monitoring. To address this limitation, new hardware and software solutions for the ISMA technology are being developed at Arizona State University (ASU).
11
3.0 PERFORMANCE OBJECTIVES
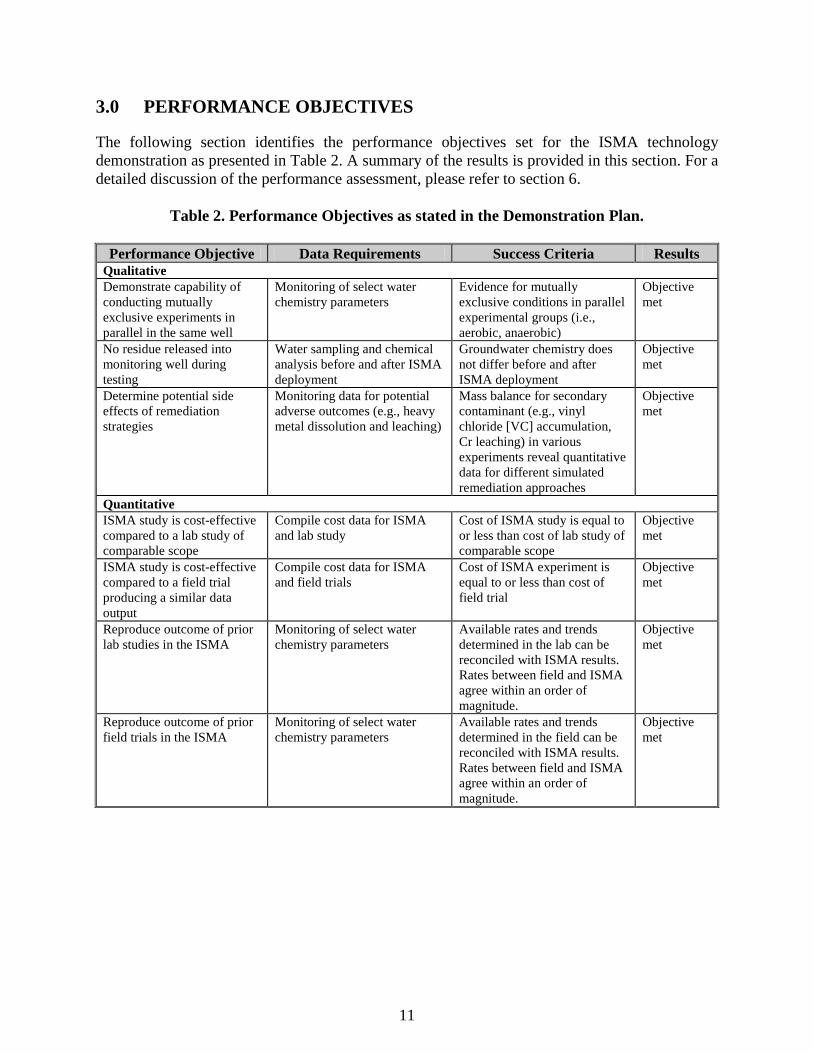
The following section identifies the performance objectives set for the ISMA technology demonstration as presented in Table 2. A summary of the results is provided in this section. For a detailed discussion of the performance assessment, please refer to section 6.
Table 2. Performance Objectives as stated in the Demonstration Plan.
Performance Objective Data Requirements Success Criteria Results Qualitative Demonstrate capability of conducting mutually exclusive experiments in parallel in the same well
Monitoring of select water chemistry parameters
Evidence for mutually exclusive conditions in parallel experimental groups (i.e., aerobic, anaerobic)
Objective met
No residue released into monitoring well during testing
Water sampling and chemical analysis before and after ISMA deployment
Groundwater chemistry does not differ before and after ISMA deployment
Objective met
Determine potential side effects of remediation strategies
Monitoring data for potential adverse outcomes (e.g., heavy metal dissolution and leaching)
Mass balance for secondary contaminant (e.g., vinyl chloride [VC] accumulation, Cr leaching) in various experiments reveal quantitative data for different simulated remediation approaches
Objective met
Quantitative ISMA study is cost-effective compared to a lab study of comparable scope
Compile cost data for ISMA and lab study
Cost of ISMA study is equal to or less than cost of lab study of comparable scope
Objective met
ISMA study is cost-effective compared to a field trial producing a similar data output
Compile cost data for ISMA and field trials
Cost of ISMA experiment is equal to or less than cost of field trial
Objective met
Reproduce outcome of prior lab studies in the ISMA
Monitoring of select water chemistry parameters
Available rates and trends determined in the lab can be reconciled with ISMA results. Rates between field and ISMA agree within an order of magnitude.
Objective met
Reproduce outcome of prior field trials in the ISMA
Monitoring of select water chemistry parameters
Available rates and trends determined in the field can be reconciled with ISMA results. Rates between field and ISMA agree within an order of magnitude.
Objective met

This page left blank intentionally.

13
4.0 SITE DESCRIPTION
4.1 SITE SELECTION
The ISMA demonstrations took place at two sites, one in California and one in Arizona. Information on selection criteria and requirements can be found in the Site Selection Memorandum provided in Appendix C of the Final Report.
4.2 SITE LOCATION AND HISTORY
4.2.1 NASNI, San Diego, CA – OU-20
NASNI is located in San Diego County, California, southwest of the city of San Diego, on the tip of the Silver Strand peninsula with the city of Coronado adjacent and to the east. The remainder of NASNI is surrounded by water, the Pacific Ocean to the south and San Diego Bay on the west and north. North Island was commissioned in 1917 and is currently an active military base. Since 1935, NASNI has been occupied exclusively by the Navy. OU-20 is located in the northeast portion of the island. Industrial processes performed in Buildings 1 and 2 at OU-20 are the likely source of hexavalent chromium (Cr[VI]) in groundwater. Past operations at Building 1 were related to helicopter blade repair and maintenance, as well as the manufacture and repair of fiberglass components. Activities included parts grinding, cleaning, anodizing, paint stripping, and painting. Liquid wastes and rinse waters from these operations were piped to the Industrial Waste Treatment Plant via an industrial waste pipeline that was discovered to have breaks in it (BNI, 2005a). Additional contributions to the subsurface contamination may have included overflow of subsurface pits used for temporary waste storage, and outdoor aircraft fuel tanks washing.
4.2.2 Industrial Site, Mesa, AZ
The industrial site is located outside the city of Mesa in Maricopa County, AZ and is home to an aerospace company that designs, develops, and manufactures aircraft escape rocket motors and rocket catapults for emergency escape and survival systems, including the required propellants, among other products. The company has been located at the site since 1960. Historically, water and solids generated by the processes on site were discharged to two unlined sludge beds, designated as water bore-out (WBO) pits, located approximately one-quarter mile east-northeast of the main Plant #3 facilities. The area of the two pits was approximately 60 ft long and 55 ft wide. WBO operations were conducted in a concrete building located approximately 200 feet northwest of the pits. A suspension of water and solid rocket fuel generated during WBO operations at the building were discharged to the pits. In the late 1990s, surface soil removal and confirmation soil sampling was conducted to facilitate site closure by the Arizona Department of Environmental Quality, followed by backfilling and leveling the area to surrounding grade.

14
4.3 SITE GEOLOGY AND HYDROGEOLOGY
4.3.1 NASNI, San Diego, CA – OU-20 (Site 1)
NASNI is located on relatively flat land with an average elevation of approximately 20 ft above sea level. The island was enlarged beginning in the 1930s through placement of hydraulic fill dredged from San Diego Bay onto tidal flats and nearshore areas. All of NASNI has been graded for development, and the area surrounding Buildings 1 and 2 is covered with asphalt, concrete, or maintained landscaping. The hydraulic fill used to construct much of NASNI consists of medium-grained to coarse-grained, poorly graded sands and silty sands. In some areas, the fill is underlain by organic silts and clays. The groundwater level in OU-20 is approximately 5 ft above mean sea level (msl). The groundwater gradient across the study area is relatively flat and ranges from 0.001 to 0.002 foot per foot. Groundwater flow direction is to the north/northeast and discharges into the San Diego bay. Aquifer transmissivity values calculated from slug and pumping tests in the Building 379 area ranged from 0.5 to 1116 square feet per minute (ft2/min), with an approximate value of 418.5 ft2/min calculated nearest to the ISMA deployment location (well S1-MW-9) (SES-TECH, 2010).
4.3.2 Industrial Site, Mesa, AZ (Site 2)
Industrial facilities are located within the Basin and Range Physiographic Province, which is dominated by a series of northwest-trending mountain ranges and alluvial valleys containing thousands of feet of unconsolidated sediments (Consultants, 1988). The Province was formed during Middle Tertiary time and evolved as a result of complex structural movements and associated erosion and deposition events (Arizona Geological Society, 1987). Groundwater from the regional alluvial deposits is used for irrigation, as well as for industrial and municipal supply purposes. Two water wells and three monitor wells exist within approximately ½ mile of the site. The Salt River Project (Project, 1990) interpreted the direction of regional groundwater flow to be in a southeastern direction, towards a groundwater pumping station located south of Falcon field airport. The depth to groundwater in the regional alluvium is approximately 225 to 275 ft bgs. The site is situated on the eastern edge of the East Salt River Valley Groundwater Basin. The regional hydrostratigraphy consists of the Upper Alluvial Unit (UAU), the fine-grained Middle Alluvial Unit (MAU), and the Lower (Conglomerate) Alluvial Unit (LAU). The MAU is reportedly not present in the vicinity of the former WBO Pits (Basin & Range Hydrogeologists, 1991). The UAU ranges in thickness from about 265 to 685 ft in the vicinity of the site, and the LAU, which overlies granitic basement rocks, ranges from about 100 to 125 ft thick. The geology of impacted zone (UAU) is made up of unconsolidated to moderately well-consolidated sand and gravel, with variable amounts of finer material or larger cobbles and boulders. Groundwater at the site is present under unconfined conditions at depths of about 175 ft bgs, based on wells installed in early 2009 (WBO-1, HPA-1 and NT-1). Groundwater elevation trends in the vicinity of the site indicate increases on the order of 7 to 8 ft per year in recent years

15
(Caldwell, 2009). This trend is also observed on a more regional scale, based on groundwater elevation records maintained by the Arizona Department of Water Resources. The rising water table is attributed in part to the Granite Reef Underground Storage Project, which is located only about 2 miles northwest of Plant #3. Groundwater flow is to the south/southeast, based on localized water level data from the above mentioned wells, larger scale water level surveys (Terranext, 2007) and regional flow modeling. The hydraulic conductivity of the upper-most portion of the subject aquifer is estimated to be about 25 ft/day, based on the hydraulic testing conducted at well WBO-1 in February 2009 (Consultants, 2009).
4.4 CONTAMINANT DISTRIBUTION
4.4.1 NASNI, San Diego, CA – OU 20
The OU-20 volatile organic compound (VOC) (Site 1) and Cr(VI) plumes are located in the northeastern portion of NASNI. The VOC plume originates from the vicinity of Building 379 and extends downgradient to the northeast approximately ½ mile, with several sources contributing. The Cr(VI) plume originates in the vicinity of Building 2, with the former anodizing shop in Building 2 as the most likely source of Cr(VI), and extends downgradient approximately 700 ft. The ISMA deployment well OU-20-persulfate extraction well (PEW)-01 is located on the southwest edge of the chromium plume, in the parking lot located between Buildings 2 and 94. This well was chosen because it was (i) preexisting, (ii) sufficiently sized to accommodate the ISMA, (iii) outside and up-gradient of the field pilot-test areas, and (iv) minimally disruptive to traffic and logistically easy to access due to its location in a parking lot.
4.4.2 Industrial Site, Mesa, AZ
During the installation of monitoring well WBO-1 in 2009, soil samples were collected for detailed delineation of key constituents in vadose zone soils (Consultants, 2009). The results can be summarized as follows:
Perchlorate: Concentrations in the WBO-1 soil samples ranged up to 1525 mg/kg. Peak concentrations were detected within a depth interval of 60 to 90 ft bgs, with concentrations exceeding 200 mg/kg extending from 90 ft bgs to 170 ft bgs, just above the water table. Ammonium: Elevated concentrations of ammonium (up to 2220 mg/kg – as nitrogen) were detected in soil samples collected from a depth interval of 40 to 60 ft bgs. The transport of ammonium has, however, been retarded relative to the transport of perchlorate, as evidenced by the different depths of the peak concentrations of these constituents. Nitrate and Nitrite: Elevated concentrations of nitrate (up to 360 mg/kg – as nitrogen) were detected at depths of 40 to 60 ft bgs, which likely corresponds with the elevated ammonium levels. Below 100 ft bgs, all reported nitrate concentrations were less than 15 mg/kg. Nitrite was not detected in any of the soil samples.

16
pH: The pH of the WBO-1 soil samples ranged from 5.7 to 9.1, with pH generally increasing below the zone of elevated ammonium. It should be noted that a decrease in pH is anticipated during nitrification of ammonia/ammonium.

17
5.0 TEST DESIGN
5.1 CONCEPTUAL EXPERIMENTAL DESIGN
As detailed in Section 3, the performance objectives of the described ISMA demonstrations were related to showcasing the functionality of the ISMA, and the secondary goals were to compare the data output of the ISMA to the extant data sets associated with the two deployment sites. Accordingly, the treatability experiments conducted in the ISMA were designed to be as comparable as possible to the extant lab and field treatability data sets associated with the deployment location. The current version of the ISMA hardware used in these demonstrations has 12 liquid flow channels. Up to 10 of those channels can feed sediment columns, with the remainder of the channels allocated for collection of untreated groundwater to serve as a baseline or control. Furthermore, up to six of the liquid lines can be continuously amended with an in situ agent throughout the deployment period. The 12 lines can be allocated between experimental groups as necessary to optimize between the number of experimental groups (i.e., number of treatments tested) and the number of replicates per experimental group (i.e., statistical significance of results). The demonstrations documented here featured three experimental groups conducted in triplicate, and two experimental groups in quadruplicate (Table 3, Table 4).
Table 3. Experimental plan for NASNI (Site 1).
Experimental Group Replicates Column Medium Inoculum Amendment Natural attenuation 3 Site sediment - - Biostimulation 3 Site sediment - Sodium lactate Bioaugmentation 3 Site sediment KB-1® Sodium lactate Influent control 3 - - -
Table 4. Experimental plan for Site 2.
Experimental Group Replicates Column Medium Inoculum Amendment
Natural attenuation 4 Site sediment - - Bioaugmentation 4 Site sediment Microbial
Consortium Sodium acetate
Influent control 4 - - -
5.2 BASELINE CHARACTERIZATION
5.2.1 NASNI – Prior Laboratory Treatability Studies
The following subsection is a brief summary of the relevant laboratory treatability studies investigating in situ treatments for OU-20 [refer to the Bench Study Report (SES-TECH, 2010) for detailed results and discussions]: SiRem was retained to evaluate five in situ treatments for the Cr(VI) and trichloroethene (TCE) present at OU-20 in bench-scale batch bottle tests. The slow-release substrate (SRS)®–M (Terra
18
Systems Inc., Wilmington, DE) in conjunction with bioaugmentation culture KB-1® (SiRem Inc., Guelph, ON) was identified as the best performing and most cost-effective remediation strategy. Below are the manufacturers’ descriptions of the chosen amendments:
• SRS®-M contains a proprietary food grade reductant compound plus 60% soybean oil, food grade emulsifiers, sodium lactate, and organic and inorganic nutrients including nitrogen, phosphorus, and vitamin B12. Additionally, a reductant reacts directly with hexavalent chromium to reduce it to the trivalent state. SRS®-M provides a readily degradable carbon (lactate) to rapidly generate reducing conditions and a long-lasting carbon source (soybean oil) to maintain the reducing conditions (according to manufacturers specifications).
• KB-1® is a bioaugmentation culture that contains Dehalococcoides, the only group of microorganisms documented to promote the complete dechlorination of chlorinated ethenes to non-toxic ethene (according to manufacturers specifications).
A detailed analysis of lab treatability study results can be found in section 6.6.
5.2.2 NASNI – Prior Field-Scale Pilot Study
A brief summary of the relevant feasibility study objectives is presented here [refer to the Field-scale Pilot Study Report (SES-TECH, 2011) for detailed results and discussions]: Stated objectives of the field-scale pilot test were:
• Evaluate the capacity of the formation to receive the injected amendments.
• Evaluate the distribution and survivability of injected bioaugmentation cultures.
• Evaluate radius of donor delivery.
• Evaluate the effectiveness of the donor in reducing concentrations of Cr(VI) and TCE in groundwater.
• Evaluate the potential for contaminant presence in vadose zone soils and effectiveness of the amendment in reducing contaminant levels in soils.
Pilot Study Conclusions The two injection methods tested - liquid atomized injection and direct-push injection - were both found to be effective at distributing the donor and culture in the aquifer; direct-push injection was chosen as the delivery method based on a cost analysis. Where amendments were distributed, reductions in Cr(VI) and chlorinated ethene concentration were observed within 1 to 3 months. SRS®-M and KB-1® injections were recommended for full-scale implementation. See section 6.6 and 6.7 for a detailed comparison between field-scale, bench-top laboratory, and ISMA results.

19
5.2.3 Industrial Site – Prior Lab Treatability Studies
Geomatrix Consultants, Inc. conducted a laboratory treatability study in 2007 (Geomatrix Consultants, Inc., 2007) to evaluate the potential of biological perchlorate reduction in the vadose zone at Site 2 (vadose zone contains the bulk of perchlorate in the subsurface, as described in 4.4.2). Nine polyethylene columns were filled with soil samples from the WBO area. During the 7-month study, the columns were spiked with perchlorate and amended periodically with moisture and different carbon substrates (hexene, sodium acetate, yeast). The columns were incubated under non-saturated, anaerobic conditions. Perchlorate was reduced to varying extends (35–56%) in the columns that received carbon amendments while the non-amended control column showed 24% reduction in perchlorate (natural attenuation conditions). The reasons for the incomplete perchlorate reduction are likely the low moisture content (7.3–8.5%) and low numbers of microorganisms present. The second part of this laboratory study involved filling open glass containers with perchlorate-contaminated site soil and amending with periodic additions of ethanol, corn syrup, sodium acetate, moisture and/or yeast. The microcosms were incubated under anaerobic conditions and under two moisture contents (20 and 45%). In a second phase, the microcosms were bioaugmented with a microbial culture (ZEP® Septic Cleaner) and anaerobic digester sludge from a wastewater treatment plant as well as a further dose of sodium acetate. Significant perchlorate reduction (>99.98%) was only found in microcosms with 45% moisture content and only after amendment with anaerobic sludge and carbon source, but not in the microcosms with 20% moisture content (with or without bioaugmentation) or control microcosms without any amendment. This supports the finding that the low moisture content and presumably high oxygen tension are inhibiting microbial perchlorate reduction. Geosyntec Consultants conducted another laboratory batch study through SiREM to assess biodegradability of perchlorate in the currently unsaturated zone (Consultants, 2009). They focused on two scenarios that might prove challenging: 1) A zone with perchlorate (hundreds of mg/kg soil) and high ammonium concentration (2200 mg/kg soil – as nitrogen) present; 2) a zone with high concentration of perchlorate (1525 mg/kg soil). Batch microcosms were setup with soil from well WBO-1 soil from these zones, respectively, and deionized water, adding methyl soyate as electron donor to stimulate biodegradation of perchlorate. Details of the experimental setup are listed in Table 5.
Table 5. Experimental plan for Geosyntec laboratory batch study.
Experimental Group Replicates Column Medium Inoculum Electron Donor
Control 3 Site sediment - - High ammonium 3 Soil with perchlorate and 2200 mg/kg
ammonium as nitrogen ZEP in bottle
4 Methyl soyate;
ethanol in bottle 4 High perchlorate 3 Soil with 1525 mg/kg perchlorate ZEP in
bottles 8, 9 Methyl soyate;
ethanol in bottles 8, 9 Perchlorate degradation in these microcosms was highly variable. In two of the three microcosms that received high ammonium soil, perchlorate was completely reduced after 30 days. In the third

20
microcosm with that same soil, perchlorate reduction was not observed over the whole observation period of 100+ days, even after subsequent addition of ethanol as additional electron donor and a commercial microbial culture (ZEP® Septic Cleaner). In two of the three microcosms that received high perchlorate soil, perchlorate was reduced significantly, although not completely, after more than 100 days of observation. No perchlorate reduction was observed in the third microcosm with high perchlorate soil, even after addition of ethanol and the commercial culture. Control microcosms with no electron donor or microbial culture added showed no reduction of perchlorate in all three replicates.
5.2.4 Water Sampling
Prior to deployment of the ISMA, a water sample was retrieved from the deployment well and analyzed for dissolved oxygen, redox potential and pH in the field using a pre-calibrated multi-parameter probe (YSI Inc., Yellow Springs, OH). Further, the water sample was analyzed for its concentration of chlorinated ethenes (TCE, cis-dichloroethene [cis-DCE], vinyl chloride [VC]) as well as concentrations of dissolved metals that are relevant for drinking water (arsenic, chromium, iron, manganese, selenium). Samples were handled using proper chain-of-custody procedures and were analyzed by certified commercial laboratories for the demonstration at NASNI.
5.3 TREATABILITY OR LABORATORY STUDY RESULTS
5.3.1 NASNI - Laboratory Flow-through Experiments
Batch bottle treatability studies conducted by SiRem are summarized in section 5.2.1, and a detailed comparison between those lab results, field pilot-scale, and ISMA results can be found in sections 6.6 and 6.7. The following is a summary of sediment column construction and operation in the laboratory at ASU prior to column deployment in situ at NASNI. Column construction: On August 22, 2011, composite sediment from the drilling of multiple wells the previous week at NASNI was collected into a 5-gallon bucket and transported back to ASU. In the ASU lab, the sediment was transferred into a shallow tray and allowed to air dry in the fume hood over a period of approximately 3 days. Dried sediment was then sifted to collect particles ranging in size from 1000 to 250 µm in diameter that were then packed into nine glass ISMA columns. Column operation and startup: Columns were assembled as shown in Figure 1. To ensure a stable TCE concentration in the influent, a Tedlar bag, filled with air already at equilibrium with the headspace in the groundwater bottle was connected to the groundwater bottle so that it supplied the bottle with air as the groundwater was pumped out. Columns were fed with synthetic groundwater (recipe found in Appendix B of the Final Report) in a pulsed influent-feed cycle, with the pumps on for 90 seconds at a flow rate of 56 µL/min, followed by a 240 second pause, resulting in an effective flow-rate of 0.91 mL/hour, which translates into a residence time of 10.45 hours and a linear velocity of 1.8 ft/day, assuming a porosity of 0.4.

21
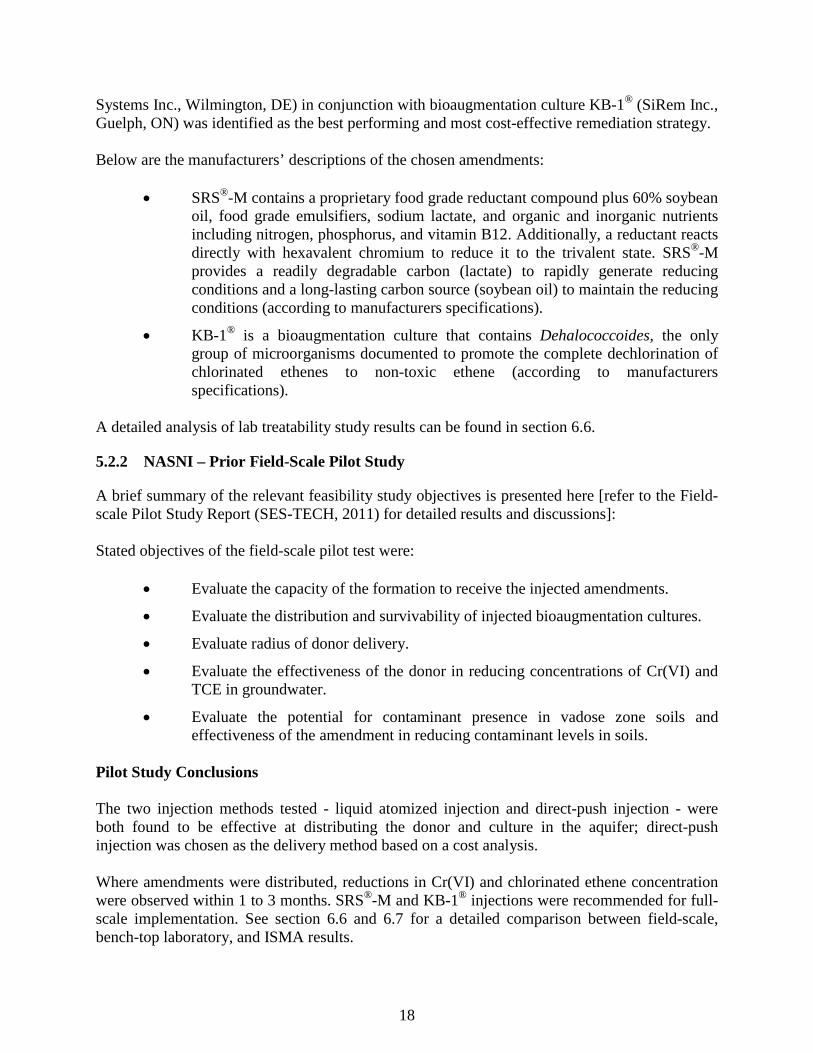
Figure 1. Schematic of laboratory column setup. Column effluent samples were analyzed for chlorinated ethenes and ethane using an automated headspace solid phase microextraction followed by gas chromatography and flame ionization detection method (HS SPME GC-FID) developed in our laboratory that enabled accurate measurements with only 0.2 mL of liquid (Ziv-El, Delgado et al., 2011). After 5 days, once TCE concentrations in column effluent had stabilized and matched the 15 μg TCE/L supplied in influent, the three columns comprising the bioaugmentation experimental group were inoculated w/ KB-1®. Inoculation was carried with a gas-tight syringe by injecting approximately 3 mL of the microbial culture as received from SiRem in a serum bottle into the influent (bottom) port of the column. Immediately after inoculation, the influent of the six columns comprising the bioaugmention and biostimulation experimental groups began to be amended with sodium lactate. The amendment, a 10% w/v sodium lactate solution, was continuously dispensed to each column influent at flowrate of 0.231 μL/min from an array of six 10 mL plastic syringes powered by the ISMA injection module, resulting in an effective concentration of 50 μM lactate in each columns; influent. On Day 12, after complete conversion of influent TCE to cis-DCE was observed in the bioaugmented columns, the columns were reinoculated with KB-1® to ensure presence of viable populations of obligate anaerobes. The results for molar fractions of chlorinated ethenes and ethene detected in column effluent are presented in Figure 2. Each graph represents the average of three columns. For each graph, mass is normalized to the total molar mass of TCE, cis-DCE, VC, and ethene collected at that sampling event. On day 75, 70 days after the initial inoculation event, all bioaugmented columns were successfully converting all influent TCE to ethene. In the same timeframe, biostimulated columns were only converting approximately half of influent TCE to ethene, and unamended columns showed no evidence of reductive dechlorination. After 80 days of operation in the laboratory, columns were transferred in situ to NASNI.
22
Figure 2. Chlorinated ethenes and ethene detected in effluent of NASNI sediment columns.
5.3.2 Industrial Site - Laboratory Experiments in Batch
We were able to reproduce the results from prior laboratory batch experiments (detailed description in section 5.2.3) in our own batch microcosm study with site sediment from well HPA-1. Batch bottle experiments were conducted in 200-mL serum bottles capped with butyl rubber stoppers. Five replicate bottles were filled with 150 mL site groundwater and 5 g dried, well graded, washed sediment (<0.5 mm grain size) from the site. Each bottle was spiked with ethyl lactate (1000 mg/L) and perchlorate (1000 µg/L). No attempts were made to remove oxygen from the bottles at the beginning of the experiments. However, once capped, bottles were sampled periodically using gas-tight techniques to prevent oxygen from getting into the bottles thereby enabling the development of anoxic conditions through microbial activity. Samples were analyzed for perchlorate concentration. Results in Figure 3 show that it took between 6 and 13 days to achieve complete reduction of 1 mg/L perchlorate by biostimulation with ethyl lactate alone. Therefore, Geosyntec Consultants conclusions are accurate that the native microbial population at the site is very heterogeneous. Geosyntec consequently chose to use a known perchlorate-reducing inoculum as a bioaugmentation agent at this site.

23
Figure 3. Biostimulation of site sediment (well HPA-1) and site groundwater from a perchlorate-contaminated location incubated in batch bottles with ethyl lactate as a carbon
source.
5.3.3 Industrial Site - Laboratory Experiments in Flow-through Columns
No flow-through column studies had been conducted previously for this Arizona site. A laboratory column study was conducted to examine: A) monitored natural attenuation (MNA), B) bioaugmentation with perchlorate reducing culture and amendment with ethyl lactate (B1) or sodium acetate (B2). All experiments were conducted in triplicate. As a control, influent groundwater was collected in the same fashion as microcosm effluent over the duration of the experiment without passing through sediment columns. All experiments were conducted simultaneously using the same source of site groundwater. The seed culture for bioaugmentation experiments, a facultative anaerobic microbial consortium enriched from sewage sludge obtained from five different U.S. wastewater treatment plants, was utilized to accelerate the onset and rates of perchlorate reduction. For the purpose of bioaugmentation, 1 mL of seed culture was added to each bioaugmentation microcosm at the beginning of the experiment by injection of the liquid culture at the influent (bottom) of each column. Sodium acetate trihydrate was added at 1100 mg/L influent concentration in experiment (B1), and ethyl lactate at 340 mg/L in experiment (B2). To compare bioaugmentation to the effects of natural attenuation, three columns were operated without addition of carbon source or biomass (Experiment A). All microcosms were operated in up-flow mode at 15 µL/min flow, equivalent to residence time of 10 hours in the column. Microcosms were packed with well graded sediment (0.5 - 1 mm grain size) obtained from drill cuttings from well HPA-1. Site groundwater containing about 500 µg/L perchlorate was used as the microcosm influent for laboratory flow-through experiments. All lab experiments were conducted at room temperature, which is similar to the groundwater temperature of ~23 °C at the deployment site in Arizona. The effluent of all microcosms was collected as a composite sample throughout the duration of the experiment. Effluent was stored at room temperature in individual Teflon® vessels containing a microbial preservative (Kathon®, minimum concentration 0.5 mL/L effluent). In addition, time
0
200
400
600
800
1000
1200
0 100 200 300 400 500 600
Perc
hlor
ate
[ppb
]
Time [hrs]
bottle 1bottle 2bottle 3bottle 4bottle 5
24
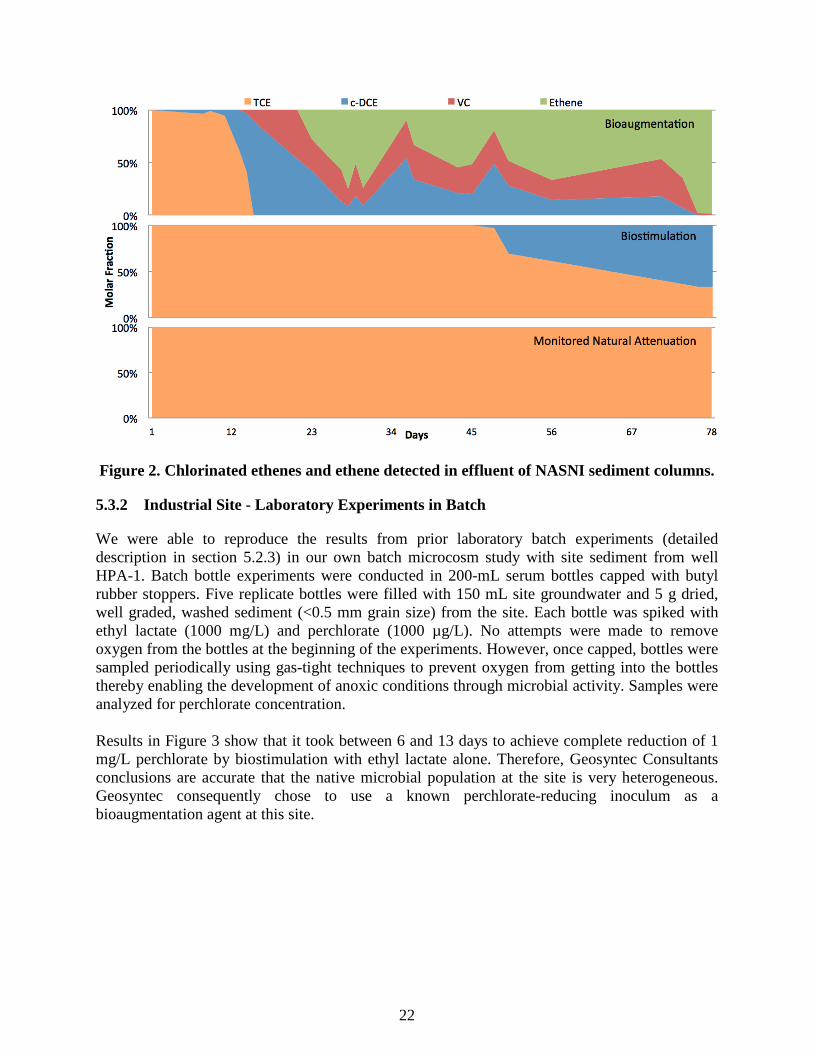
discrete samples of the effluent were collected periodically, filtered through a 0.45 µm polyvinylidene difluoride filter (PALL Life Sciences, Port Washington, NY), and analyzed for pH as well as concentration of perchlorate, nitrate, nitrite and sulfate using established techniques as described below. Experiments were conducted for a period of 3 weeks. After termination of the experiments, composite effluent samples were analyzed for the same parameters as time-discrete samples. In addition, deoxyribonucleic acid (DNA) was extracted from microcosm effluent as well as the column sediment. After bioaugmentation with a seed culture and both carbon amendments (experiment B1 and B2), perchlorate was reduced consistently after an adaptation period of two days (Figure 4), while (MNA – experiment A) did not lead to perchlorate reduction over the course of the experiment.
Figure 4. Concentration of perchlorate in column effluent over the course of the experiment. All experiments were conducted in triplicate, except influent concentration is
measured from one sample at a time. Error bars represent standard deviation. The groundwater also contained around 5 mg/L sulfate and a very low concentration of nitrate (<1 mg/L), both of which could serve as electron acceptors for the microbial community. Nitrate was reduced to <0.01 mg/L for both carbon amendments in less than 2 days, and no nitrate was detected for the remainder of the experiment. Sulfate was completely reduced to <0.01 mg/L in the microcosms with ethyl lactate amendment (B2) after an adaptation period of 16 days. During the adaptation period, sulfate concentrations decreased steadily. In sodium acetate amended microcosms (B1) sulfate concentrations started decreasing after 18 days, but only some sulfate was being reduced at the end of the experiment after 21 days. In MNA microcosms (A), neither nitrate nor sulfate was reduced throughout the experiment. While nitrate is typically reduced before the onset of perchlorate reduction (Chaudhuri, O’Connor et al., 2002) or simultaneously with perchlorate reduction (Herman and

25
Frankenberger, 1999), the presence of sulfate has not been shown to affect the ability of bacteria to reduce perchlorate. Therefore, reduction of sulfate is not desirable for in situ remediation of perchlorate, as it consumes valuable carbon source and may produce hydrogen sulfide, which is toxic to many organisms. DNA analysis of the column effluent and sediment revealed that sodium acetate stimulated the growth of bacteria and specifically of perchlorate-reducing bacteria much more effectively than ethyl lactate. This was evident from gene copy numbers for 16S rRNA genes and perchlorate reductase (pcrA) genes in both effluent and sediment, which were on average 43±74 times higher when sodium acetate rather than ethyl lactate was supplied as a carbon source (Figure 5).
Figure 5. Results of quantitative polymerase chain reaction (PCR) targeting the 16S rRNA gene of general bacteria and pcrA. Shown are sediment results for the influent section of each column, which contained the highest numbers of bacteria compared to mid and effluent section.
N/A = not tested in field experiment. Error bars represent standard deviation.
5.4 DESIGN AND LAYOUT OF TECHNOLOGY COMPONENTS
5.4.1 Outer Shell of the ISMA
1.E-01
1.E+01
1.E+03
1.E+05
1.E+07
1.E+09
1.E+11
[cop
ies/
g]
1.E-01
1.E+01
1.E+03
1.E+05
1.E+07
1.E+09
1.E+11
Lab Field Lab Field
[cop
ies/
mL
]
Bypass MNABioaugmentation - Na acetate Bioaugmentation - Ethyl lactate
General bacteria Perchlorate reductase
Effluent
Soil
26
A
C
B
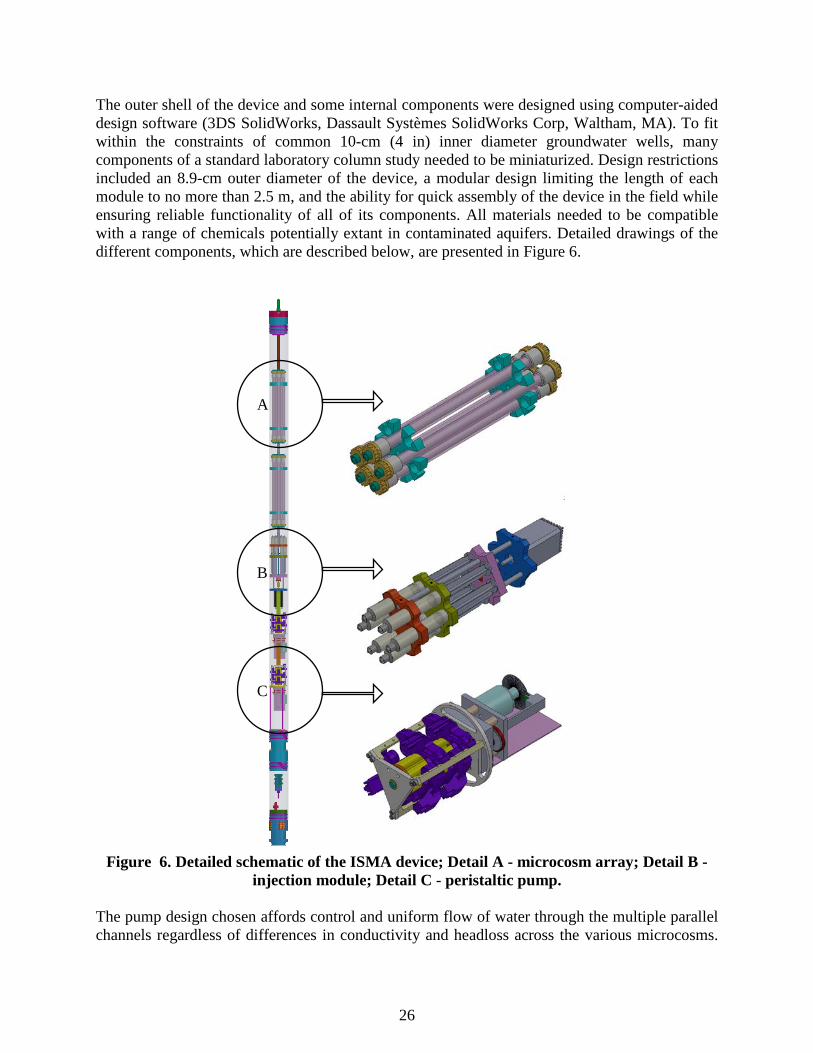
The outer shell of the device and some internal components were designed using computer-aided design software (3DS SolidWorks, Dassault Systèmes SolidWorks Corp, Waltham, MA). To fit within the constraints of common 10-cm (4 in) inner diameter groundwater wells, many components of a standard laboratory column study needed to be miniaturized. Design restrictions included an 8.9-cm outer diameter of the device, a modular design limiting the length of each module to no more than 2.5 m, and the ability for quick assembly of the device in the field while ensuring reliable functionality of all of its components. All materials needed to be compatible with a range of chemicals potentially extant in contaminated aquifers. Detailed drawings of the different components, which are described below, are presented in Figure 6.
Figure 6. Detailed schematic of the ISMA device; Detail A - microcosm array; Detail B - injection module; Detail C - peristaltic pump.
The pump design chosen affords control and uniform flow of water through the multiple parallel channels regardless of differences in conductivity and headloss across the various microcosms.

27
Additionally, none of the reusable parts of the pump hardware can come into contact with contaminated groundwater with the chosen design. Selection of other types of pumps (piston pumps, gear pumps) would have increased the risk of chemical and bacterial cross-contamination when sequentially using the tool in different wells or at different sites. Customizations included re-design of the motor mounting plate as well as the cassettes holding the pump tubing. Pump cassettes that control flow in the pump tubing of the peristaltic pump were manufactured using rapid prototyping technology. The cassette material was chosen for its low surface friction to eliminate rubbing of the tubing material, as well as its rigidity to provide even pressure across the pump tubing. Drawings of the customized pump assembly are shown in Figure 6, Detail C. Performance of the customized pumps was evaluated for long-term stability of delivered flow, accuracy, and inter-channel reproducibility of the flow volume. To test accuracy and inter-channel reproducibility, pumps were mounted in the laboratory and performance tests conducted in triplicate for 4.5 – 5 hrs at flow rates set to 20, 50, 100, and 200 µL/min, respectively (Figure 7). Effluent was collected and measured volumetrically to infer flow rates.
Figure 7. Performance control experiments: A - Pump flow rate accuracy for peristaltic benchtop pump (Ismatec Reglo Digital) and customized peristaltic pump used inside the
ISMA. Tests were conducted for 24 or 12 channels, respectively. B - Flow rate reproducibility between 12 channels for customized pump in the ISMA. Flow rates
[µL/min] were set to 20, 50, 100 and 200, as indicated by the solid lines. Shown is the average of three measurements.
Pump accuracy was also tested for an unmodified comparable pump (Ismatec Reglo Digital, Ismatec, Glattbrugg, Switzerland). The pump was operated in the laboratory with 24 channels at a target flow rate of 79.1 µL/min in duplicate experiments for 0.5 and 2.7 hours, respectively. Results were averaged over all 24 channels and both tests. Results demonstrate that flow rates
0.00
0.20
0.40
0.60
0.80
1.00
1.20
norm
aliz
ed fl
ow r
ate
Benchtop ISMA10
100
1000
1 2 3 4 5 6 7 8 9 10 11 12
flow
rate
mea
sure
d [u
L/m
in]
channel
200 uL/min 100 uL/min50 uL/min 20 uL/min
A B

28
are accurate (<30% standard deviation) and reproducible between multiple channels over a range of 20 – 200 µL/min flow (Final Report ER-200914).
5.4.2 Sediment Column Tests
The ISMA contains an array of up to 10 flow-through microcosms where a range of treatability experiments can be conducted concurrently. The reproducibility of manually packing the microcosms with site sediment was tested by injecting a slug of bromide (40 µL of 5 g/L NaBr) into sediment columns and monitoring effluent bromide concentrations over time. Obtained data show that no preferential flow occurred in the columns. Data also show that, as expected, the residence time in the column is dependent on the grain size of the sediment, due to the lower effective porosity of the smaller vs. the larger grains, which is inversely related to the residence time.
5.4.3 Delivery of Treatment Agent
To deliver a treatment agent (e.g., chemical or biological agent) to the column microcosms the ISMA device contains a customized syringe pump as an injection module (Figure 6, Detail B), which dispenses multiple syringes with a single drive shaft. Different agents can be supplied to each microcosm. The pump rate and concentration of the amendment can be adjusted to simulate different dosing regimens or treatment approaches. Relevant treatment agents can be for example, a carbon source or electron donor to simulate biostimulation at the field scale, active biomass for bioaugmentation, or a chemical oxidizer or reducing agent to simulate in situ chemical treatment.
5.4.4 Effluent Capturing
The ISMA device is completely self-contained, which guarantees no impact on the well where the treatability test is conducted. All groundwater pumped through microcosms as well as an influent control (untreated groundwater) is stored inside the device in custom-made Teflon® sample capture vessels. To ensure that the degradation activity occurred in the column microcosms, these vessels are loaded with a preservative/quenching agent designed to stop all unwanted biological or chemical activity once the effluent enters the sample capture vessel. Design criteria for the microbial preservative were that it needed to be fairly benign to humans upon accidental contact and provide broad-spectrum inhibition of bacteria, fungi, and yeast. The preservative chosen (Kathon® CG/ICP) contains 5-chloro-2-methyl-4-isothiazolin-3-one and 2-methyl-4-isothiazolin-3-one as active ingredients. Experimental data obtained using microbiological tests demonstrated that this preservative was effective in suppressing microbial activity in effluent capture vessels.
5.5 FIELD TESTING
Before the deployment of the ISMA device, the depth to groundwater was determined and a groundwater sample was retrieved for analysis. The individual sections of the device were pre-assembled prior to field-testing. The ISMA was deployed following the procedures described in sections 2.0. The incubation period was 35 days at NASNI and 3 weeks and at Site 2. At NASNI, grid power (110V) was used to power the device, while at Site 2 a combination of batteries and solar panels was used. After the incubation period the ISMA device was retrieved from the well.

29
Effluent samples and sediment columns were retrieved from the device and stored until analysis or sent to the analytical lab.
5.5.1 DATA ANALYSIS
Mass balances are calculated by comparing the chemical mass of interest in the untreated groundwater and the groundwater that passed through columns representing different treatments. Because all experiments are conducted at least in triplicate, a mean and standard deviation can be calculated for each data point. Variability between replicates can originate from variability of analytical methods, including extraction, as well as from biological factors such as differences in bacterial growth in different sediment columns. To determine statistically significant differences between treatments as well as between treatment and non-treated control, a student t-test can be conducted for all relevant datasets. Biological degradation processes generally follow Monod kinetics (Monod, 1949) that describe the utilization of a single rate-limiting substrate (the contaminant) and resulting microbial growth. Monod kinetics is characterized by linear degradation of high concentrations of the rate-limiting substrate. This region can be described by a zero-order approximation and is valid for substrate concentrations at least 10 times larger than the half-saturation constant (KS) of that substrate. For substrate concentrations at least 10 times smaller than KS, Monod kinetics resembles an exponential function, which can be described by a first-order approximation. First-order kinetics is characterized by a linear profile of the natural log transformed concentration data versus time. The first-order degradation rate of a contaminant can be calculated for flow-through experiments in the lab, where time-discrete monitoring of the column effluent provide time-resolved data. First-order degradation rate constant (kDiscrete) are determined using the log transformed contaminant concentration of the influent (Cin) and effluent (Cout) for each experiment, as well as the residence time in the sediment column (RT).
(1)
The first-order degradation rate R is then calculated according to the following equation:
(2)
where Ci is the mean contaminant concentration. For ISMA experiments where time-discrete samples were unavailable, a composite sample collected over the duration of the experiment serves to calculate a time-averaged first-order degradation rate.
(3)
)ln()ln(
ColumnTCCk outin
Discrete ∆−
=
* iDiscreteDiscrete CkR =
* iCompositeComposite CkR =
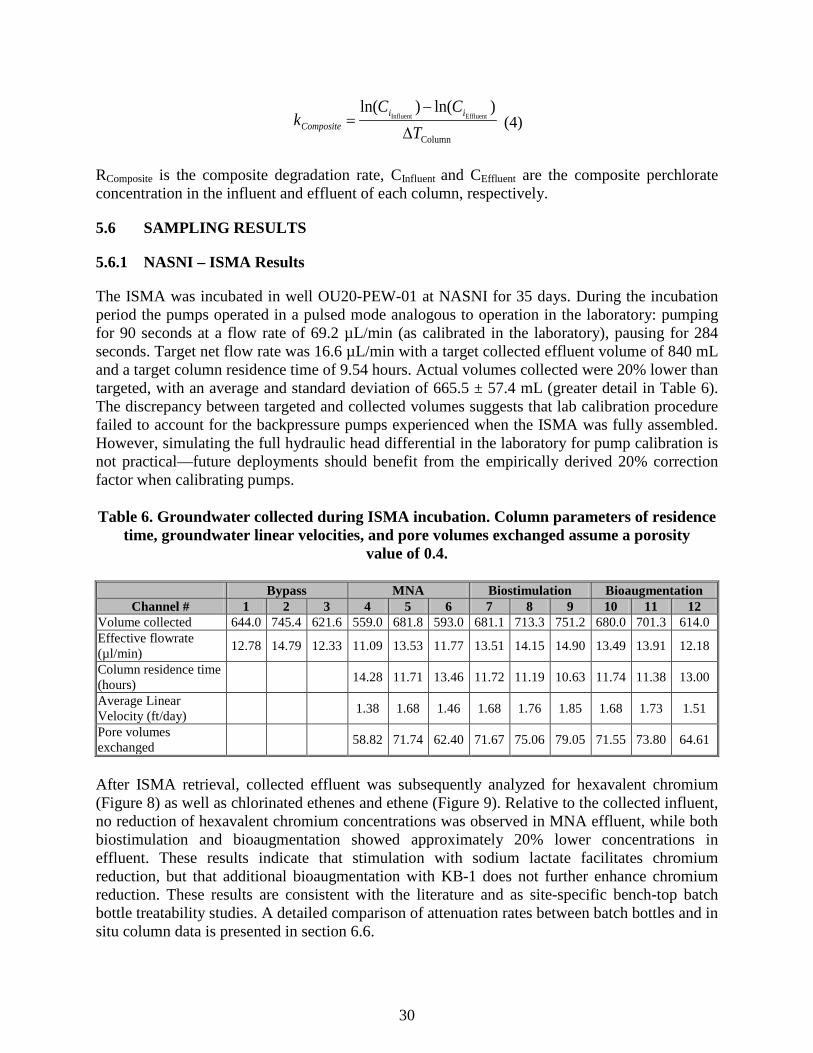
30
(4)
RComposite is the composite degradation rate, CInfluent and CEffluent are the composite perchlorate concentration in the influent and effluent of each column, respectively.
5.6 SAMPLING RESULTS
5.6.1 NASNI – ISMA Results
The ISMA was incubated in well OU20-PEW-01 at NASNI for 35 days. During the incubation period the pumps operated in a pulsed mode analogous to operation in the laboratory: pumping for 90 seconds at a flow rate of 69.2 µL/min (as calibrated in the laboratory), pausing for 284 seconds. Target net flow rate was 16.6 µL/min with a target collected effluent volume of 840 mL and a target column residence time of 9.54 hours. Actual volumes collected were 20% lower than targeted, with an average and standard deviation of 665.5 ± 57.4 mL (greater detail in Table 6). The discrepancy between targeted and collected volumes suggests that lab calibration procedure failed to account for the backpressure pumps experienced when the ISMA was fully assembled. However, simulating the full hydraulic head differential in the laboratory for pump calibration is not practical—future deployments should benefit from the empirically derived 20% correction factor when calibrating pumps. Table 6. Groundwater collected during ISMA incubation. Column parameters of residence
time, groundwater linear velocities, and pore volumes exchanged assume a porosity value of 0.4.
Bypass MNA Biostimulation Bioaugmentation
Channel # 1 2 3 4 5 6 7 8 9 10 11 12 Volume collected 644.0 745.4 621.6 559.0 681.8 593.0 681.1 713.3 751.2 680.0 701.3 614.0 Effective flowrate (µl/min) 12.78 14.79 12.33 11.09 13.53 11.77 13.51 14.15 14.90 13.49 13.91 12.18
Column residence time (hours) 14.28 11.71 13.46 11.72 11.19 10.63 11.74 11.38 13.00
Average Linear Velocity (ft/day) 1.38 1.68 1.46 1.68 1.76 1.85 1.68 1.73 1.51
Pore volumes exchanged 58.82 71.74 62.40 71.67 75.06 79.05 71.55 73.80 64.61
After ISMA retrieval, collected effluent was subsequently analyzed for hexavalent chromium (Figure 8) as well as chlorinated ethenes and ethene (Figure 9). Relative to the collected influent, no reduction of hexavalent chromium concentrations was observed in MNA effluent, while both biostimulation and bioaugmentation showed approximately 20% lower concentrations in effluent. These results indicate that stimulation with sodium lactate facilitates chromium reduction, but that additional bioaugmentation with KB-1 does not further enhance chromium reduction. These results are consistent with the literature and as site-specific bench-top batch bottle treatability studies. A detailed comparison of attenuation rates between batch bottles and in situ column data is presented in section 6.6.
)ln()ln(
Column
EffluentInfluent
TCC
k iiComposite ∆
−=
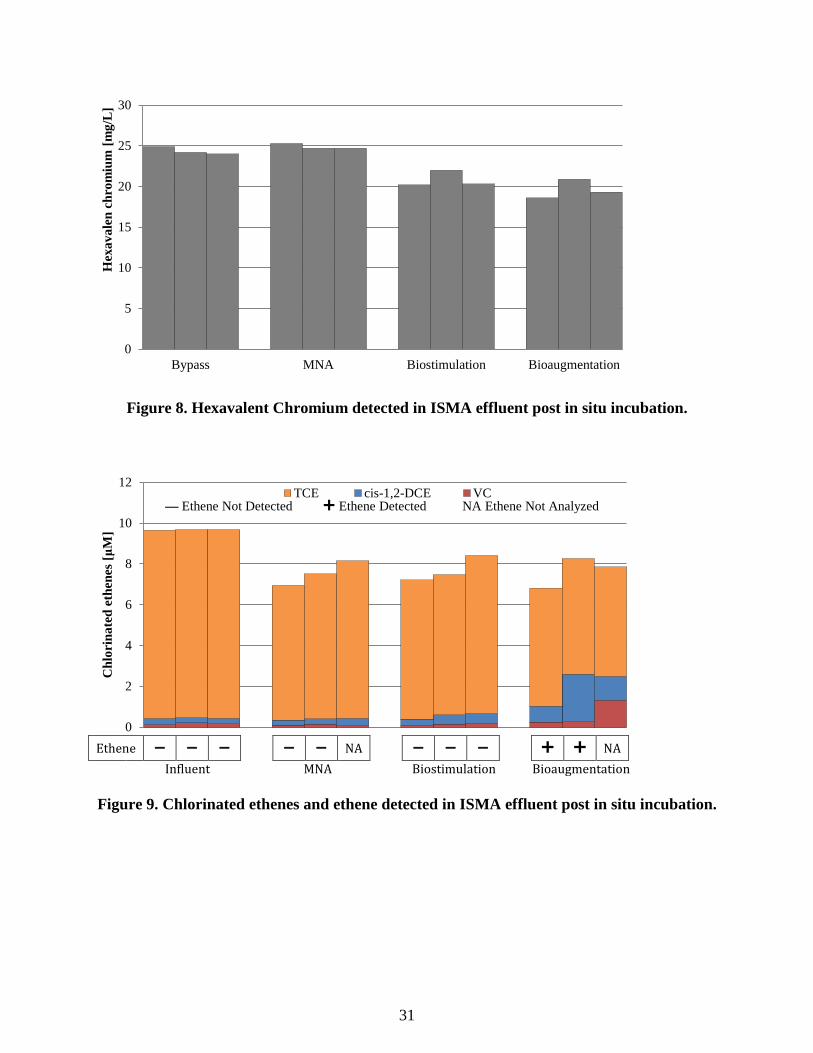
31
Figure 8. Hexavalent Chromium detected in ISMA effluent post in situ incubation.
Ethene − − − − − NA − − − NA
Influent MNA Biostimulation Bioaugmentation Figure 9. Chlorinated ethenes and ethene detected in ISMA effluent post in situ incubation.
0
5
10
15
20
25
30
Bypass MNA Biostimulation Bioaugmentation
Hex
aval
en c
hrom
ium
[mg/
L]
0
2
4
6
8
10
12
Chl
orin
ated
eth
enes
[μM
]
TCE cis-1,2-DCE VC — Ethene Not Detected Ethene Detected NA Ethene Not Analyzed
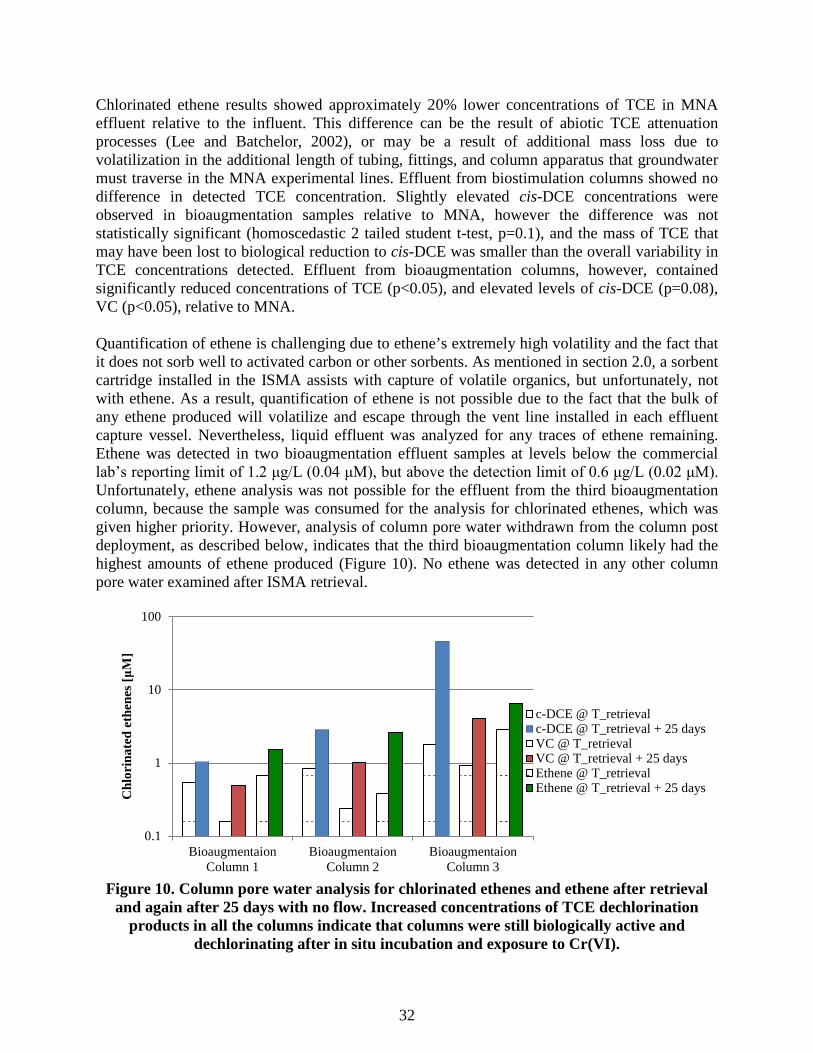
32
Chlorinated ethene results showed approximately 20% lower concentrations of TCE in MNA effluent relative to the influent. This difference can be the result of abiotic TCE attenuation processes (Lee and Batchelor, 2002), or may be a result of additional mass loss due to volatilization in the additional length of tubing, fittings, and column apparatus that groundwater must traverse in the MNA experimental lines. Effluent from biostimulation columns showed no difference in detected TCE concentration. Slightly elevated cis-DCE concentrations were observed in bioaugmentation samples relative to MNA, however the difference was not statistically significant (homoscedastic 2 tailed student t-test, p=0.1), and the mass of TCE that may have been lost to biological reduction to cis-DCE was smaller than the overall variability in TCE concentrations detected. Effluent from bioaugmentation columns, however, contained significantly reduced concentrations of TCE (p<0.05), and elevated levels of cis-DCE (p=0.08), VC (p<0.05), relative to MNA. Quantification of ethene is challenging due to ethene’s extremely high volatility and the fact that it does not sorb well to activated carbon or other sorbents. As mentioned in section 2.0, a sorbent cartridge installed in the ISMA assists with capture of volatile organics, but unfortunately, not with ethene. As a result, quantification of ethene is not possible due to the fact that the bulk of any ethene produced will volatilize and escape through the vent line installed in each effluent capture vessel. Nevertheless, liquid effluent was analyzed for any traces of ethene remaining. Ethene was detected in two bioaugmentation effluent samples at levels below the commercial lab’s reporting limit of 1.2 μg/L (0.04 μM), but above the detection limit of 0.6 μg/L (0.02 μM). Unfortunately, ethene analysis was not possible for the effluent from the third bioaugmentation column, because the sample was consumed for the analysis for chlorinated ethenes, which was given higher priority. However, analysis of column pore water withdrawn from the column post deployment, as described below, indicates that the third bioaugmentation column likely had the highest amounts of ethene produced (Figure 10). No ethene was detected in any other column pore water examined after ISMA retrieval.
Figure 10. Column pore water analysis for chlorinated ethenes and ethene after retrieval
and again after 25 days with no flow. Increased concentrations of TCE dechlorination products in all the columns indicate that columns were still biologically active and
dechlorinating after in situ incubation and exposure to Cr(VI).
0.1
1
10
100
BioaugmentaionColumn 1
BioaugmentaionColumn 2
BioaugmentaionColumn 3
Chl
orin
ated
eth
enes
[μM
]
c-DCE @ T_retrievalc-DCE @ T_retrieval + 25 daysVC @ T_retrievalVC @ T_retrieval + 25 daysEthene @ T_retrievalEthene @ T_retrieval + 25 days
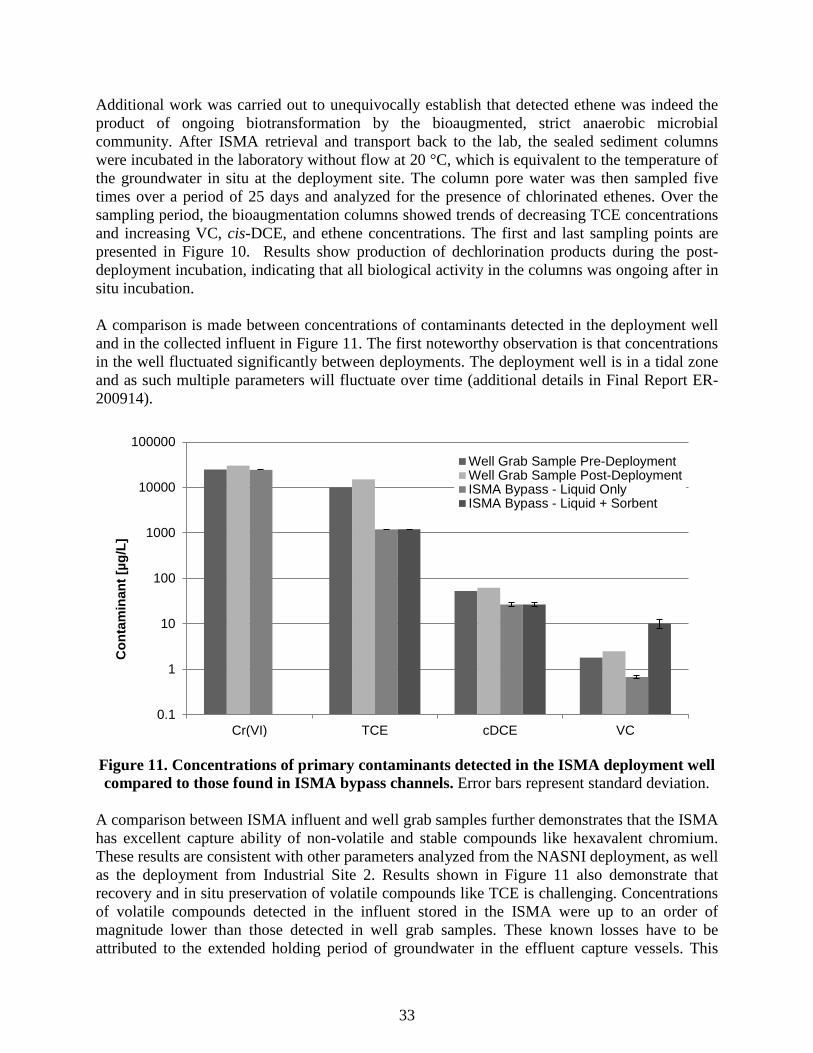
33
Additional work was carried out to unequivocally establish that detected ethene was indeed the product of ongoing biotransformation by the bioaugmented, strict anaerobic microbial community. After ISMA retrieval and transport back to the lab, the sealed sediment columns were incubated in the laboratory without flow at 20 °C, which is equivalent to the temperature of the groundwater in situ at the deployment site. The column pore water was then sampled five times over a period of 25 days and analyzed for the presence of chlorinated ethenes. Over the sampling period, the bioaugmentation columns showed trends of decreasing TCE concentrations and increasing VC, cis-DCE, and ethene concentrations. The first and last sampling points are presented in Figure 10. Results show production of dechlorination products during the post-deployment incubation, indicating that all biological activity in the columns was ongoing after in situ incubation. A comparison is made between concentrations of contaminants detected in the deployment well and in the collected influent in Figure 11. The first noteworthy observation is that concentrations in the well fluctuated significantly between deployments. The deployment well is in a tidal zone and as such multiple parameters will fluctuate over time (additional details in Final Report ER-200914).
Figure 11. Concentrations of primary contaminants detected in the ISMA deployment well compared to those found in ISMA bypass channels. Error bars represent standard deviation.
A comparison between ISMA influent and well grab samples further demonstrates that the ISMA has excellent capture ability of non-volatile and stable compounds like hexavalent chromium. These results are consistent with other parameters analyzed from the NASNI deployment, as well as the deployment from Industrial Site 2. Results shown in Figure 11 also demonstrate that recovery and in situ preservation of volatile compounds like TCE is challenging. Concentrations of volatile compounds detected in the influent stored in the ISMA were up to an order of magnitude lower than those detected in well grab samples. These known losses have to be attributed to the extended holding period of groundwater in the effluent capture vessels. This
0.1
1
10
100
1000
10000
100000
Cr(VI) TCE cDCE VC
Con
tam
inan
t [µg
/L]
Well Grab Sample Pre-DeploymentWell Grab Sample Post-DeploymentISMA Bypass - Liquid OnlyISMA Bypass - Liquid + Sorbent
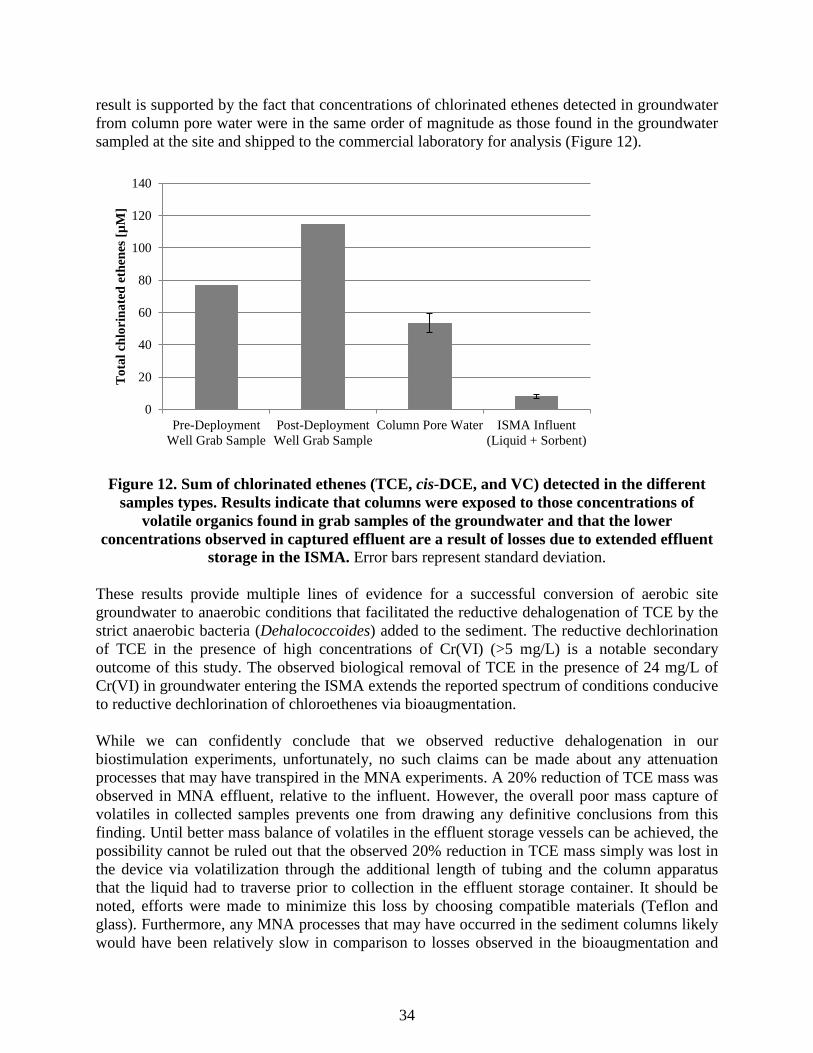
34
result is supported by the fact that concentrations of chlorinated ethenes detected in groundwater from column pore water were in the same order of magnitude as those found in the groundwater sampled at the site and shipped to the commercial laboratory for analysis (Figure 12).
Figure 12. Sum of chlorinated ethenes (TCE, cis-DCE, and VC) detected in the different samples types. Results indicate that columns were exposed to those concentrations of
volatile organics found in grab samples of the groundwater and that the lower concentrations observed in captured effluent are a result of losses due to extended effluent
storage in the ISMA. Error bars represent standard deviation. These results provide multiple lines of evidence for a successful conversion of aerobic site groundwater to anaerobic conditions that facilitated the reductive dehalogenation of TCE by the strict anaerobic bacteria (Dehalococcoides) added to the sediment. The reductive dechlorination of TCE in the presence of high concentrations of Cr(VI) (>5 mg/L) is a notable secondary outcome of this study. The observed biological removal of TCE in the presence of 24 mg/L of Cr(VI) in groundwater entering the ISMA extends the reported spectrum of conditions conducive to reductive dechlorination of chloroethenes via bioaugmentation. While we can confidently conclude that we observed reductive dehalogenation in our biostimulation experiments, unfortunately, no such claims can be made about any attenuation processes that may have transpired in the MNA experiments. A 20% reduction of TCE mass was observed in MNA effluent, relative to the influent. However, the overall poor mass capture of volatiles in collected samples prevents one from drawing any definitive conclusions from this finding. Until better mass balance of volatiles in the effluent storage vessels can be achieved, the possibility cannot be ruled out that the observed 20% reduction in TCE mass simply was lost in the device via volatilization through the additional length of tubing and the column apparatus that the liquid had to traverse prior to collection in the effluent storage container. It should be noted, efforts were made to minimize this loss by choosing compatible materials (Teflon and glass). Furthermore, any MNA processes that may have occurred in the sediment columns likely would have been relatively slow in comparison to losses observed in the bioaugmentation and
0
20
40
60
80
100
120
140
Pre-DeploymentWell Grab Sample
Post-DeploymentWell Grab Sample
Column Pore Water ISMA Influent(Liquid + Sorbent)
Tot
al c
hlor
inat
ed e
then
es [µ
M]

35
biostimulation microcosms. To accurately quantify these processes one would need (A) a complete mass balance of TCE, or an alternative tracer compound to track attenuation, and (B) a longer column residence time, and therefore, a longer deployment time.
5.6.2 Industrial Site – ISMA Results
A flow-through field experiment was conducted with the ISMA testing MNA (experiment A) and bioaugmentation with a seed culture and sodium acetate (experiment B). In addition, an influent control was included in the experiment. Sodium acetate was chosen over ethyl lactate because in lab experiments, the addition sodium acetate resulted in higher numbers of perchlorate-reducing bacteria and did not lead to unwanted sulfate reduction. Perchlorate was reduced over a period of 21 days from 228 ± 1 µg/L to 30 ± 37 µg/L by bioaugmentation (B), while perchlorate concentrations did not decline in MNA experiments (A), compared to the influent control (Figure 13). Sulfate was not reduced significantly in any of the samples (data not shown).
Figure 13. Concentration of perchlorate in different experimental groups normalized to influent (bypass). Data represent composite samples collected over 21 days, representing the whole duration of the experiments. N/A = not tested in field experiment. Error bars represent
standard deviation. By its design, the ISMA allows analysis of microbial communities in column effluent and sediment and to examine their spatial distribution across the columns. Sampling of both habitats has been recognized as essential to provide a complete picture of the microbial community

36
(Alfreider, Krossbacher et al., 1997; Lehman, 2007). DNA analysis of effluent and sediment showed that perchlorate reducers mainly settled onto column sediment (concentration 2 - 3 orders of magnitude higher than in aqueous phase), while general bacteria were found at similar levels on sediment and suspended in the aqueous phase. Results further show that bioaugmentation with nutrient addition led to an increase in gene copy numbers of 16S rRNA (180-fold on average) and perchlorate reductase (pcrA) (690-fold on average), indicators for general bacteria and perchlorate-reducing bacteria, respectively (Figure 5). The column sediment was sectioned in three equal sections (inlet, middle, and outlet) and DNA copy numbers were analyzed. Results show that the majority of bacteria in all columns (lab and in situ) reside in the inlet portion of the sediment columns, which harbors 77±20 % of general bacteria (Figure 14). This is even more pronounced for the columns that were bioaugmented, where around 90 ± 10% of general bacteria were found in the inlet portion of the sediment columns. The reasons for this are likely two-fold, in bioaugmented columns nutrient concentration (carbon source and electron acceptors) at the inlet of the columns is highest, and therefore, provides ideal growth conditions for bacteria leading to their high numbers. This has been found in several flow-through column studies (Bouwer and McCarty, 1982; Hosein, Millette et al., 1997; Schäfer, Schäfer et al., 1998; Giblin, Herman et al., 2000). For MNA columns where no nutrients were added, different sediment filtration mechanisms (McDowellboyer, Hunt et al., 1986; Bolster, Mills et al., 2000) straining the bacteria from the incoming groundwater most likely caused the high DNA copy numbers found near the inlet.
Figure 14. Relative bacteria distribution in sediment columns. Results of quantitative PCR targeting the 16S rRNA gene of general bacteria and pcrA. Shown are relative results for
all column sections.

37

38
While concentrations of general bacteria were similar between lab and field experiments, the concentration of perchlorate-reducing bacteria in the effluent and influent samples was about one order of magnitude lower in situ than in the lab experiment. Similar observations have been reported previously, where bacteria introduced through bioaugmentation were not able to compete with the indigenous community as effectively as predicted by lab studies (Mueller, Resnick et al., 1992; Zhang, Logan et al., 2005) or were subject to grazing by protozoa (Goldstein, Mallory et al., 1985; Ramadan, Eltayeb et al., 1990; England, Lee et al., 1993). These effects play a large role in situ and are one reason why in situ experiments are more valuable than similarly performed laboratory tests. At the same time, perchlorate-reducing bacteria were found in similar concentrations in the sediment for both lab and in situ experiments. This finding, which is in contrast to the differences found in effluent concentrations, supports previous findings that bacteria attached to surfaces (sediment) or residing in small pore spaces are generally better protected from adverse environmental conditions and attack by grazers (Heijnen and Vanveen, 1991; England, Lee et al., 1993; deLeo and Baveye, 1997). Overall, the lower total number of perchlorate-reducing bacteria in situ is in accordance with the lower perchlorate reduction rate found in the field.

This page left blank intentionally.
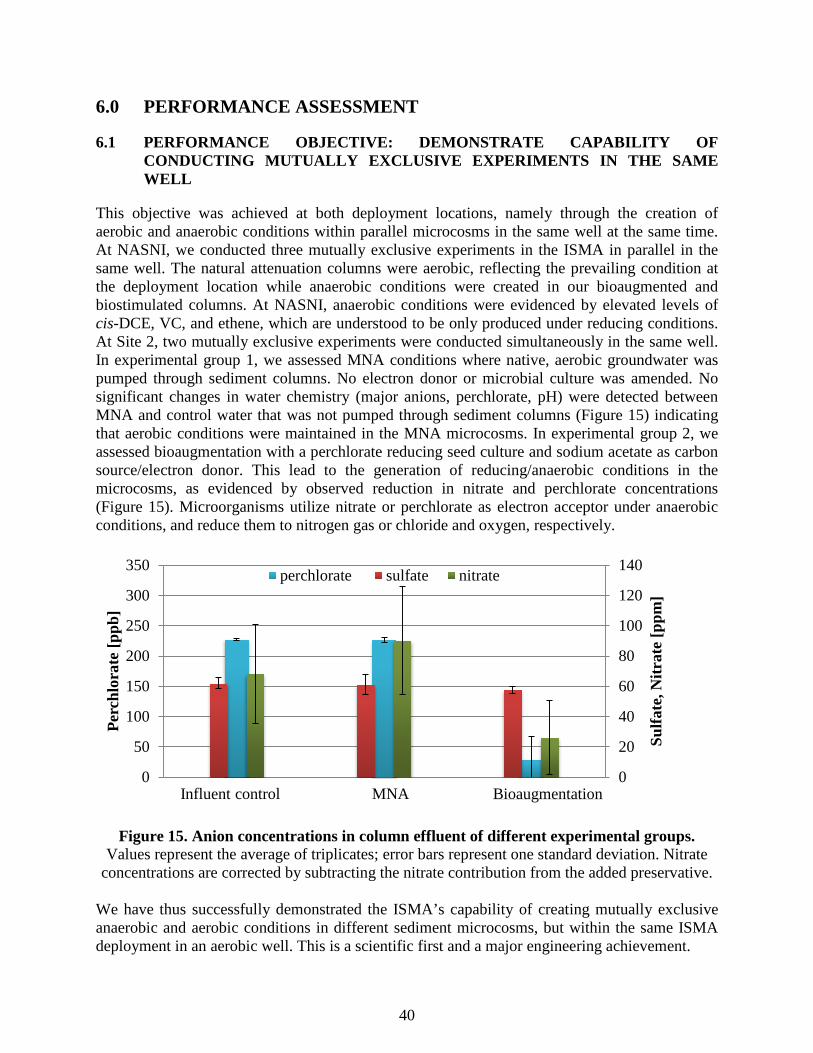
40
6.0 PERFORMANCE ASSESSMENT
6.1 PERFORMANCE OBJECTIVE: DEMONSTRATE CAPABILITY OF CONDUCTING MUTUALLY EXCLUSIVE EXPERIMENTS IN THE SAME WELL
This objective was achieved at both deployment locations, namely through the creation of aerobic and anaerobic conditions within parallel microcosms in the same well at the same time. At NASNI, we conducted three mutually exclusive experiments in the ISMA in parallel in the same well. The natural attenuation columns were aerobic, reflecting the prevailing condition at the deployment location while anaerobic conditions were created in our bioaugmented and biostimulated columns. At NASNI, anaerobic conditions were evidenced by elevated levels of cis-DCE, VC, and ethene, which are understood to be only produced under reducing conditions. At Site 2, two mutually exclusive experiments were conducted simultaneously in the same well. In experimental group 1, we assessed MNA conditions where native, aerobic groundwater was pumped through sediment columns. No electron donor or microbial culture was amended. No significant changes in water chemistry (major anions, perchlorate, pH) were detected between MNA and control water that was not pumped through sediment columns (Figure 15) indicating that aerobic conditions were maintained in the MNA microcosms. In experimental group 2, we assessed bioaugmentation with a perchlorate reducing seed culture and sodium acetate as carbon source/electron donor. This lead to the generation of reducing/anaerobic conditions in the microcosms, as evidenced by observed reduction in nitrate and perchlorate concentrations (Figure 15). Microorganisms utilize nitrate or perchlorate as electron acceptor under anaerobic conditions, and reduce them to nitrogen gas or chloride and oxygen, respectively.
Figure 15. Anion concentrations in column effluent of different experimental groups.
Values represent the average of triplicates; error bars represent one standard deviation. Nitrate concentrations are corrected by subtracting the nitrate contribution from the added preservative.
We have thus successfully demonstrated the ISMA’s capability of creating mutually exclusive anaerobic and aerobic conditions in different sediment microcosms, but within the same ISMA deployment in an aerobic well. This is a scientific first and a major engineering achievement.
0
20
40
60
80
100
120
140
0
50
100
150
200
250
300
350
Sulfa
te, N
itrat
e [p
pm]
Perc
hlor
ate
[ppb
]
perchlorate sulfate nitrate
Influent control MNA Bioaugmentation
41
6.2 PERFORMANCE OBJECTIVE: NO RESIDUE RELEASED INTO MONITORING WELL DURING TESTING
This objective also was achieved. At both deployment locations, no negative water quality impacts were observed resulting from ISMA deployments. Pre- and post-deployment grab samples of the deployment well showed no appreciable differences that may have resulted from the ISMA deployment.
6.3 PERFORMANCE OBJECTIVE: DETERMINE POTENTIAL SIDE EFFECTS OF REMEDIATION STRATEGIES
This objective also was achieved. We demonstrated the ISMA’s ability to determine potential side effects of in situ remediation approaches under investigation and performed at a small scale in the device. At NASNI, we successfully measured numerous parameters that potentially may have been secondary negative impacts of the remediation strategy, including pH and metals, where no negative impacts were found as well as dechlorination byproducts where elevated concentrations of VC were observed in the bioaugmentation experimental group. At Site 2, nitrate concentrations in groundwater were found around 10 ppm, which is below the maximum contaminant level (MCL) of 45 ppm set by the USEPA. Under anaerobic conditions, this nitrate can be reduced to nitrite by denitrifying bacteria, and therefore lead to concentrations above the MCL for nitrite of 5 ppm. Concentrations of nitrite were monitored in column effluents. Results showed that nitrite (2 ppm) was only detected in effluent from one bioaugmentation column, which was below the MCL. Another side effect commonly observed with the addition of organic carbon sources to the subsurface is lowering of the pH through production of carbonic acid. Consequently, pH was determined in all column effluents and well grab samples. No significant changes on the pH (7.7 – 8.7) were detected in any of the samples.
6.4 PERFORMANCE OBJECTIVES: ISMA STUDY IS COST-EFFECTIVE COMPARED TO A LAB STUDY OF COMPARABLE SCOPE
This objective also was met. The ISMA was found to be cost effective to a comparable lab study. Please refer to section 7.0, COST ASSESSMENT, for a detailed analysis.
6.5 PERFORMANCE OBJECTIVES: COMPARE COST OF CONDUCTING ISMA STUDY VS. FIELD TRIAL
This objective also was met. The ISMA was found to be cost effective compared to a field pilot trial. Please refer to section 7.0 for a detailed analysis. Please note, a comparison was possible only for the NASNI Deployment (Site 1) as no comparable field pilot trial was conducted at Site 2.
6.6 PERFORMANCE OBJECTIVE: REPRODUCE OUTCOME OF PRIOR LAB STUDIES IN THE ISMA
This objective also was met. ISMA results from the two deployments are presented.
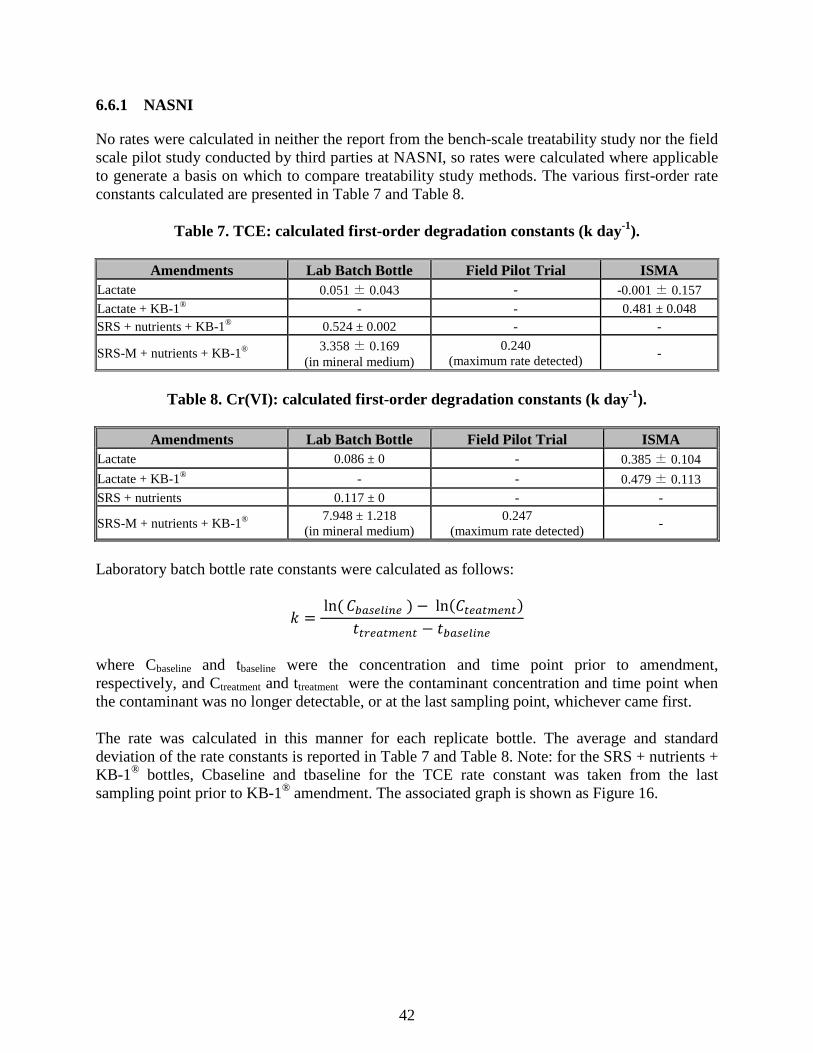
42
6.6.1 NASNI
No rates were calculated in neither the report from the bench-scale treatability study nor the field scale pilot study conducted by third parties at NASNI, so rates were calculated where applicable to generate a basis on which to compare treatability study methods. The various first-order rate constants calculated are presented in Table 7 and Table 8.
Table 7. TCE: calculated first-order degradation constants (k day-1).
Amendments Lab Batch Bottle Field Pilot Trial ISMA Lactate 0.051 ± 0.043 - -0.001 ± 0.157 Lactate + KB-1® - - 0.481 ± 0.048 SRS + nutrients + KB-1® 0.524 ± 0.002 - -
SRS-M + nutrients + KB-1® 3.358 ± 0.169 (in mineral medium)
0.240 (maximum rate detected) -
Table 8. Cr(VI): calculated first-order degradation constants (k day-1).
Amendments Lab Batch Bottle Field Pilot Trial ISMA
Lactate 0.086 ± 0 - 0.385 ± 0.104 Lactate + KB-1® - - 0.479 ± 0.113 SRS + nutrients 0.117 ± 0 - -
SRS-M + nutrients + KB-1® 7.948 ± 1.218 (in mineral medium)
0.247 (maximum rate detected) -
Laboratory batch bottle rate constants were calculated as follows:
𝑘 = ln(𝐶𝑏𝑎𝑠𝑒𝑙𝑖𝑛𝑒 ) − ln(𝐶𝑡𝑒𝑎𝑡𝑚𝑒𝑛𝑡)
𝑡𝑡𝑟𝑒𝑎𝑡𝑚𝑒𝑛𝑡 − 𝑡𝑏𝑎𝑠𝑒𝑙𝑖𝑛𝑒
where Cbaseline and tbaseline were the concentration and time point prior to amendment, respectively, and Ctreatment and ttreatment were the contaminant concentration and time point when the contaminant was no longer detectable, or at the last sampling point, whichever came first. The rate was calculated in this manner for each replicate bottle. The average and standard deviation of the rate constants is reported in Table 7 and Table 8. Note: for the SRS + nutrients + KB-1® bottles, Cbaseline and tbaseline for the TCE rate constant was taken from the last sampling point prior to KB-1® amendment. The associated graph is shown as Figure 16.
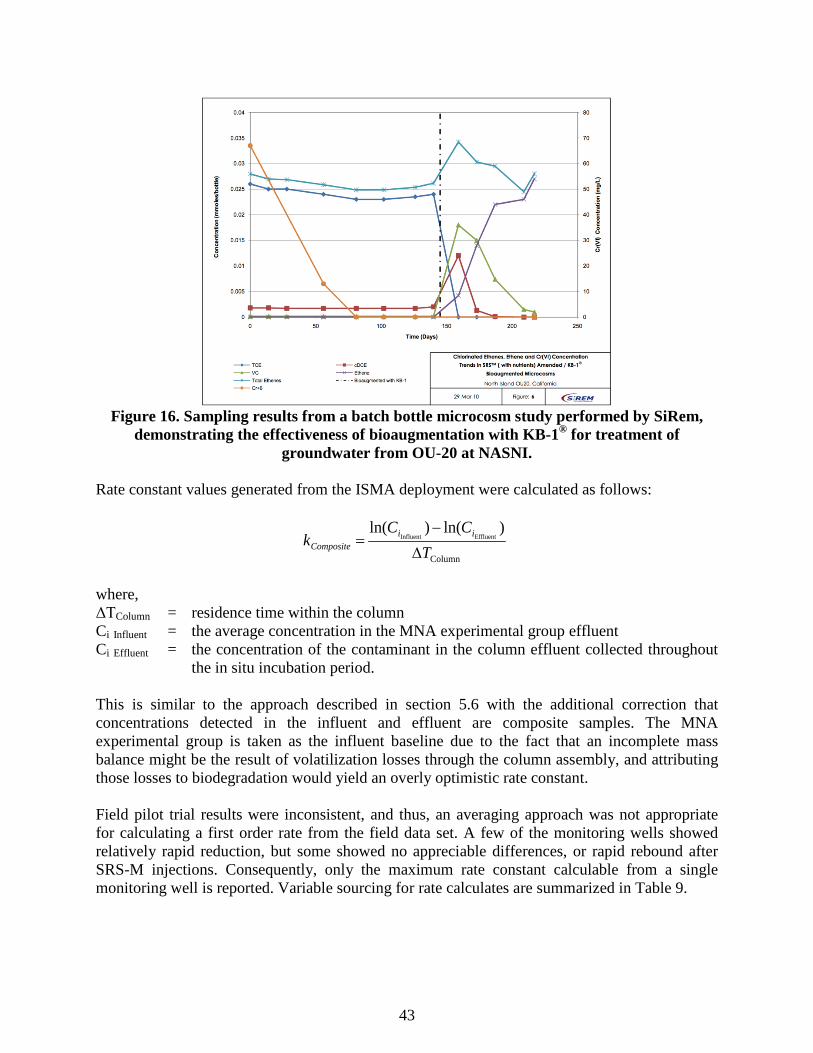
43
Figure 16. Sampling results from a batch bottle microcosm study performed by SiRem,
demonstrating the effectiveness of bioaugmentation with KB-1® for treatment of groundwater from OU-20 at NASNI.
Rate constant values generated from the ISMA deployment were calculated as follows:
where, ΔTColumn = residence time within the column Ci Influent = the average concentration in the MNA experimental group effluent Ci Effluent = the concentration of the contaminant in the column effluent collected throughout
the in situ incubation period. This is similar to the approach described in section 5.6 with the additional correction that concentrations detected in the influent and effluent are composite samples. The MNA experimental group is taken as the influent baseline due to the fact that an incomplete mass balance might be the result of volatilization losses through the column assembly, and attributing those losses to biodegradation would yield an overly optimistic rate constant. Field pilot trial results were inconsistent, and thus, an averaging approach was not appropriate for calculating a first order rate from the field data set. A few of the monitoring wells showed relatively rapid reduction, but some showed no appreciable differences, or rapid rebound after SRS-M injections. Consequently, only the maximum rate constant calculable from a single monitoring well is reported. Variable sourcing for rate calculates are summarized in Table 9.
)ln()ln(
Column
EffluentInfluent
TCC
k iiComposite ∆
−=
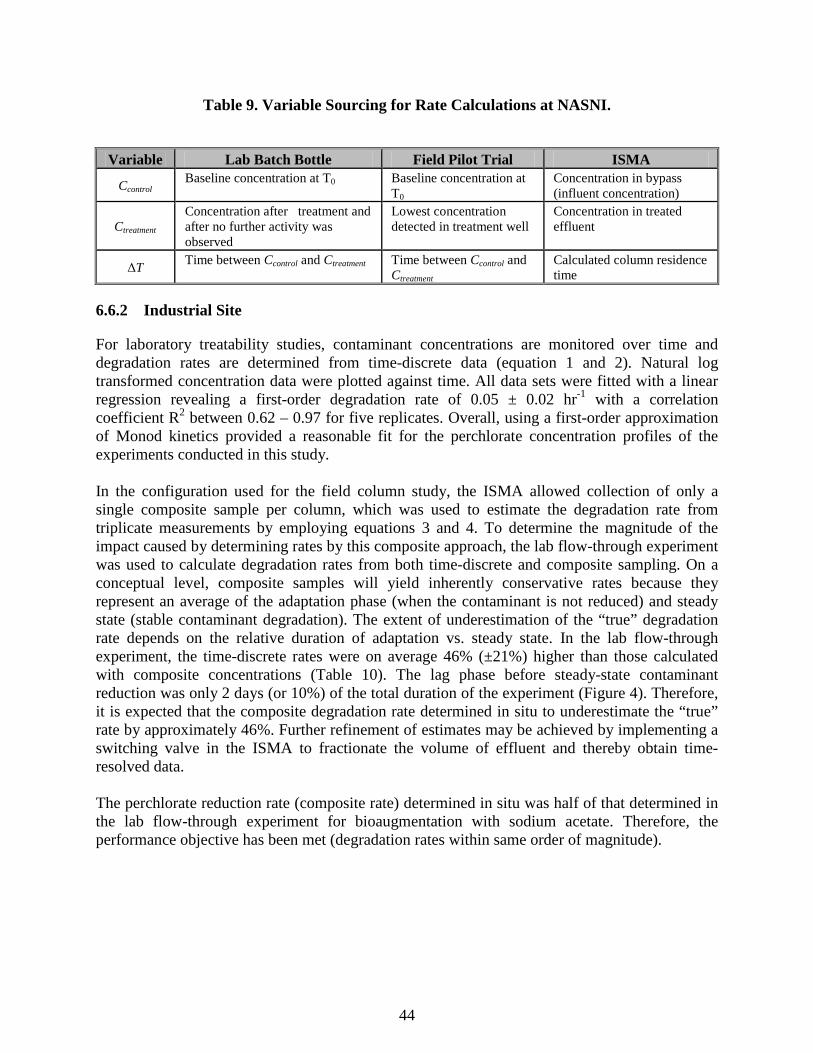
44
Table 9. Variable Sourcing for Rate Calculations at NASNI.
6.6.2 Industrial Site
For laboratory treatability studies, contaminant concentrations are monitored over time and degradation rates are determined from time-discrete data (equation 1 and 2). Natural log transformed concentration data were plotted against time. All data sets were fitted with a linear regression revealing a first-order degradation rate of 0.05 ± 0.02 hr-1 with a correlation coefficient R2 between 0.62 – 0.97 for five replicates. Overall, using a first-order approximation of Monod kinetics provided a reasonable fit for the perchlorate concentration profiles of the experiments conducted in this study. In the configuration used for the field column study, the ISMA allowed collection of only a single composite sample per column, which was used to estimate the degradation rate from triplicate measurements by employing equations 3 and 4. To determine the magnitude of the impact caused by determining rates by this composite approach, the lab flow-through experiment was used to calculate degradation rates from both time-discrete and composite sampling. On a conceptual level, composite samples will yield inherently conservative rates because they represent an average of the adaptation phase (when the contaminant is not reduced) and steady state (stable contaminant degradation). The extent of underestimation of the “true” degradation rate depends on the relative duration of adaptation vs. steady state. In the lab flow-through experiment, the time-discrete rates were on average 46% (±21%) higher than those calculated with composite concentrations (Table 10). The lag phase before steady-state contaminant reduction was only 2 days (or 10%) of the total duration of the experiment (Figure 4). Therefore, it is expected that the composite degradation rate determined in situ to underestimate the “true” rate by approximately 46%. Further refinement of estimates may be achieved by implementing a switching valve in the ISMA to fractionate the volume of effluent and thereby obtain time-resolved data. The perchlorate reduction rate (composite rate) determined in situ was half of that determined in the lab flow-through experiment for bioaugmentation with sodium acetate. Therefore, the performance objective has been met (degradation rates within same order of magnitude).
Variable Lab Batch Bottle Field Pilot Trial ISMA
Ccontrol Baseline concentration at T0 Baseline concentration at
T0 Concentration in bypass (influent concentration)
Ctreatment Concentration after treatment and after no further activity was observed
Lowest concentration detected in treatment well
Concentration in treated effluent
ΔT Time between Ccontrol and Ctreatment Time between Ccontrol and Ctreatment
Calculated column residence time

45
Table 10. Overview of first-order reduction rates for Site 2. Results from lab and field experiments are listed.
Conditions of Lab or Field
Experiments Composite Reduction Rate
[hr-1] Time-discrete Reduction Rate
[hr-1] Laboratory – Batch: Biostim Ethyl Lactate
n/a
0.05 ± 0.02
Laboratory – Flow-through: Natural Attenuation
0.02 ± 0.01
n/a
Bioaug Sodium Acetate 0.55 ± 0.21 0.84 ± 0 Bioaug Ethyl Lactate 0.35 ± 0.06 0.84 ± 0 Field – Flow-through: Natural Attenuation
< 0.003
n/a
Bioaug Sodium Acetate 0.24 ± 0.15 n/a n/a = data not available
6.7 PERFORMANCE OBJECTIVE: REPRODUCE OUTCOME OF PRIOR FIELD TRIALS IN THE ISMA
Please refer to section 6.6 for the relevant discussions regarding the demonstration at NASNI. Please note that a comparison was possible only for the NASNI deployment (Site 1) as no comparable field pilot trial was conducted at Site 2.

46
7.0 COST ASSESSMENT
The following section details some of the costs associated with ISMA field deployments. Where applicable, costs are provided for the ISMA demonstrations detailed but the focus in the cost assessment is to determine projected costs for future ISMA deployments, and to compare them to alternative methods of conducting treatability studies.
7.1 COST MODEL
The cost model has been broken down into three broad categories: materials, sample analysis, and labor.
Table 11. Direct material costs incurred during NASNI deployment.
Cost Element Unit Cost NASNI QTY Total cost NASNI deployment ISMA consumables Viton tubing 0.89 mm ID $105/50 ft 100 ft $210 Viton tubing 3.17 mm ID $44/25 ft 12 ft $22 Effluent containers $40/piece 12 $480 GAC cartridges $68/50 tubes 12 $17
Subtotal $729 Field equipment Cable Ramps $68/3ft/month 60ft for 1 month $1360 YSI meter 450/week 2 weeks $900 Boom truck + operator $100/hr 6 $600
Subtotal $2860 Total $3589
ID = inner diameter ISMA consumables are non-reusable components of the ISMA. The bulk of the ISMA device—including the columns, pumps, motors, internal skeleton, outer shell, and electrical connectors—is reusable. However, to minimize the risk of cross-contamination between deployments, internal components that come into contact with field materials are replaced. These materials are: flexible tubing (used to route groundwater throughout the device), peristaltic pump tubing, tubing connectors and fittings, check valves, syringes for amendment injection, effluent storage containers, and activated carbon sorbent cartridges for capture of volatile organics (if applicable). Field equipment includes the costs associated with storage of ISMA equipment on site; these are site-specific costs. For a deployment location that is secure and sparsely used (our deployment at the industrial site), no such costs exist. At NASNI, where the deployment location was in an active parking lot, cable ramps and a custom well box cover were necessary to avoid any impact on normal traffic flow. Examples of costs that might fall into this category at other locations may include the installation of a temporary shed or fence to protect ISMA equipment. Additional field deployment costs are the rental of a boom-truck and operator. However, the ISMA is compact enough that in the future, deployment may be feasible with only a tri-pod or custom hoist, thereby eliminating the additional expenditure linked to boom truck operation.

47
Table 12. Direct costs for sample analyses by commercial laboratory incurred during NASNI deployment.
Sample Analysis – Method $ / Sample NASNI QTY Total cost NASNI deployment
VOC – 8260B 100 14 $1400 CAM (17) Metals – 6010/7000 150 14 $2100 Anions (3 anions) – 300.0 45 14 $630 pH – 9040 15 14 $210 TDS – 160.1 15 14 $210 VFA – 300 Modified 100 14 $1400 Hexavalent Chromium – 7196 60 14 $840
Subtotal $6790 CAM = California Administrative Manual TDS = total dissolved solid VFA = Volatile Fatty Acids Laboratory Analysis: This category consists of chemical analysis of samples generated during the course of an ISMA deployment. This can be performed by a certified commercial laboratory, by the site owner, or at the research laboratory at ASU. Sample analysis costs will likely differ between deployments based on data needs and relationships with commercial labs. Direct labor costs incurred during the demonstration deployments are not reported or computed, partly due to the difficulty of the quantifying the exact effort expended on any single-deployment. Other reasons include differentiating from efforts for ISMA development and iterative design, and from concurrent associated laboratory studies, but also because such a computation would not be instructive of future costs. With two ISMAs built, and over 10 individual deployments that were used to iteratively improve on the ISMA and identify and correct failure modes, the one-time capital and labor costs have been incurred and future deployments will be significantly less expensive. The next few paragraphs identify the effort that will be required in future deployments and listed the projected personnel time required in Table 13.
Table 13. Projected labor needs for future deployments.
Deployment Activities Project
Manager
Senior Technical Advisor
Environmental Scientist / Engineer ISMA Technician
Prepare ISMA Configuration for Deployment (includes mechanical build, systems check, column conditioning)
4 wk @ 10% 4 wk @ 10% 4 wk @ 20% 4 wk @ 100% FTE
Pack/Ship ISMA to Customer Site 1 wk @ 10% 1 wk @ 80% FTE Receive/Secure ISMA at Customer Site 1 wk @ 10% Deploy ISMA Down-Hole and Initiate Process Run (includes travel time)
1 wk @ 100% 1 wk @ 100%
Stop Process Run; Retrieve ISMA Samples and deliver to commercial laboratory for analysis
1 wk @ 100% 1 wk @ 100%
Data reduction and analysis; Reporting 4 wk @ 25% 4 wk @ 50% 4 wk @ 50% 4 wk @ 55% Subtotal (Person-Months) 0.975 0.6 0.7 2.3
FTE = full-time employment

48
Laboratory Labor: Column microcosm assembly and preparation consists of sediment processing (drying, homogenizing, crushing and sifting, as necessary) and then manually packing the columns with processed sediment. ISMA assembly consists of replacing and installing all the consumable materials, testing all channels for consistent flow rates and leaks, and loading the materials and reagents necessary for the test (in situ treatment technology, preservative, and sediment columns, etc.). Column operation and preconditioning in the laboratory is not included in the labor model of an ISMA deployment due to the fact that it can and should be considered as a stand-alone laboratory column treatability study. It is complementary, but not strictly necessary, to an ISMA deployment. Field Labor: A boom truck and operator are necessary for approximately 2-3 hours during both ISMA deployment and retrieval. Additional support is required is by one ISMA engineer. During deployment, this consists of taking a well grab sample before and after deployment, and determining field parameters with a pre-calibrated multi-parameter probe. The ISMA engineer together with the boom truck operator installs the ISMA in the well, and retrieves it after field incubation. The ISMA engineer ensures that all electronic components (solar panels, battery array, controls for ISMA pumps and motor) function properly. ISMA equipment is stowed on site in such a way that it minimizes impact on site activities and minimizes risk of vandalism or theft. During retrieval, additional tasks include external decontamination of the ISMA, sample extraction from the ISMA, transfer of samples to the containers and currier designated by the commercial lab performing analyses.
7.2 COST DRIVERS
There are relatively few site-specific cost drivers that may increase the cost of an ISMA deployment. Beyond column preparation, and the chosen amendment and quencher, ISMA assembly and preparation is not specifically sensitive to cost variation based on deployment site. The largest site specific cost driver is the type and number of sample analyses that are dependent on the data needs of the customer, which may also include the need for additional ISMA deployments or laboratory studies. An additional cost driver not incurred during the demonstration deployments but recommended for future deployments is the cost of collection of fresh sediment for microcosm construction. This cost of drilling a well and collecting the sediment is highly site-specific, and therefore not enumerated in our cost analysis. One of the largest overall cost drivers for a treatability study that incorporates the ISMA will hinge on the decision of whether to conduct a complementary laboratory study. A laboratory column study prior to field deployment will yield empirically generated column operation parameters. Data generated from such a laboratory study can maximize the utility of a field deployment by informing the field experimental design on dosing requirements, column residence times, and other design parameters. A complementary laboratory column study may also be particularly beneficial if the in situ treatment technology being evaluated is dependent on

49
a slow-growing microbial culture that may require an extended acclimation period in the column before demonstrating significant activity.
7.3 COST ANALYSIS
The calculated projected costs for ISMA deployments in the immediate future, and potential deployment costs once certain process optimizations and economies of scale are realized are listed in Table 14. As mentioned in the previous subsection, there are relatively few site-specific cost drivers, thus the costs listed are representative of those that might be incurred during a typical deployment. Assumptions underlying this claim are that the ISMA study site is similar to the demonstration locations in that:
• A single deployment may satisfy the initial data needs • There is a pre-existing 4”-inner diameter (ID) monitoring well that can
accommodate the ISMA • ISMA surface components can be accommodated safely for the deployment
period
Table 14. Projected ISMA costs.
Cost element Present Future Labor costs $41,515 $20,757 Consumable and Equipment Costs (not including ISMA leasing) $7989 $1000 Laboratory analysis $14,000 $12,000 Travel $4000 $3000 Facility and Administrative costs $43,210 $29,924
Subtotal $110,713 $66,681 Projected future cost reductions can be attributed to:
1. Labor reduction: economies of scale and efficiency will result from having multiple ISMA deployments ongoing concurrently, i.e., it does not take twice as much effort to assemble two ISMAs as opposed to one. The reduced labor costs presented are estimates are based at labor model that assumes three ongoing ISMA deployments at any one time. Similar economies of scale are already realized by other contract laboratories to which the ISMA technology is compared here.
2. Consumables and Equipment Cost: additional engineering effort can lead to refinements and reduced material needs per ISMA deployment. These modifications can be based on a redesigned, and reusable, effluent storage array, as well as hard-wired and easily serviceable liquid flow channels in the ISMA.
3. Laboratory analysis: the modest savings listed are primarily due to a customer-loyalty program and reduced unit cost when ordering a large number of analyses. This number will fluctuate based on customer needs, and is only included as an estimate assuming a standard suite of analyses chemical and microbial analyses
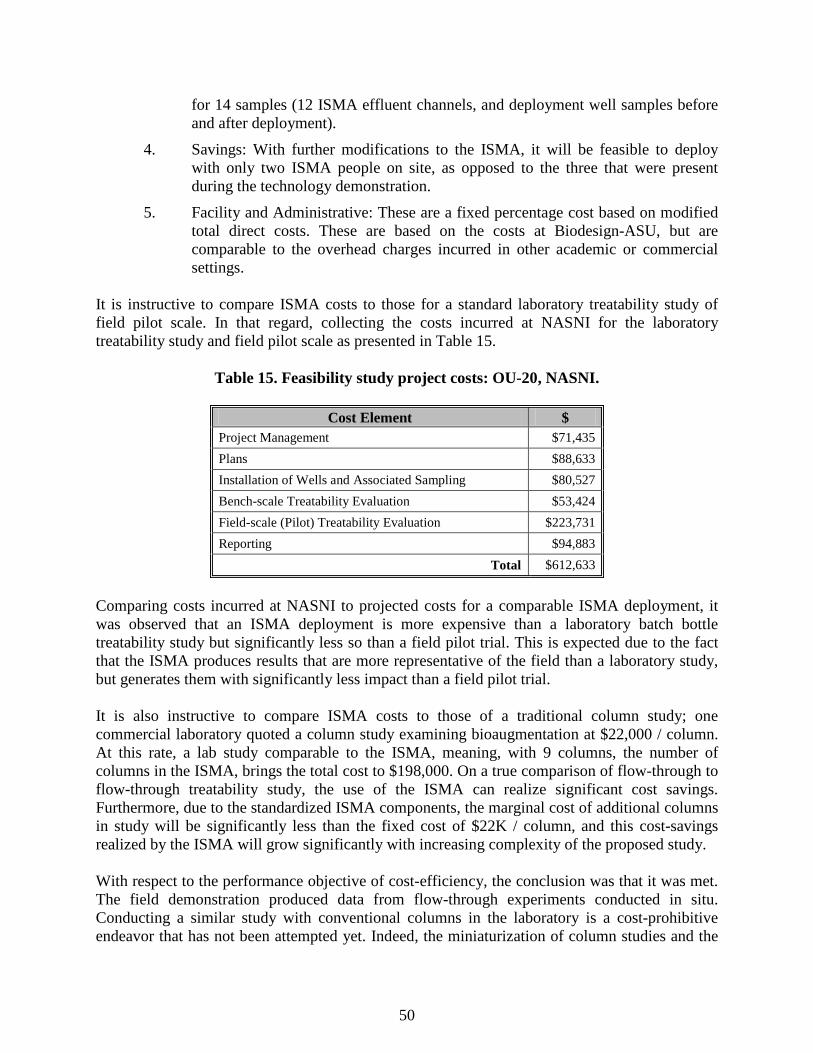
50
for 14 samples (12 ISMA effluent channels, and deployment well samples before and after deployment).
4. Savings: With further modifications to the ISMA, it will be feasible to deploy with only two ISMA people on site, as opposed to the three that were present during the technology demonstration.
5. Facility and Administrative: These are a fixed percentage cost based on modified total direct costs. These are based on the costs at Biodesign-ASU, but are comparable to the overhead charges incurred in other academic or commercial settings.
It is instructive to compare ISMA costs to those for a standard laboratory treatability study of field pilot scale. In that regard, collecting the costs incurred at NASNI for the laboratory treatability study and field pilot scale as presented in Table 15.
Table 15. Feasibility study project costs: OU-20, NASNI.
Cost Element $ Project Management $71,435 Plans $88,633 Installation of Wells and Associated Sampling $80,527 Bench-scale Treatability Evaluation $53,424 Field-scale (Pilot) Treatability Evaluation $223,731 Reporting $94,883
Total $612,633
Comparing costs incurred at NASNI to projected costs for a comparable ISMA deployment, it was observed that an ISMA deployment is more expensive than a laboratory batch bottle treatability study but significantly less so than a field pilot trial. This is expected due to the fact that the ISMA produces results that are more representative of the field than a laboratory study, but generates them with significantly less impact than a field pilot trial. It is also instructive to compare ISMA costs to those of a traditional column study; one commercial laboratory quoted a column study examining bioaugmentation at $22,000 / column. At this rate, a lab study comparable to the ISMA, meaning, with 9 columns, the number of columns in the ISMA, brings the total cost to $198,000. On a true comparison of flow-through to flow-through treatability study, the use of the ISMA can realize significant cost savings. Furthermore, due to the standardized ISMA components, the marginal cost of additional columns in study will be significantly less than the fixed cost of $22K / column, and this cost-savings realized by the ISMA will grow significantly with increasing complexity of the proposed study. With respect to the performance objective of cost-efficiency, the conclusion was that it was met. The field demonstration produced data from flow-through experiments conducted in situ. Conducting a similar study with conventional columns in the laboratory is a cost-prohibitive endeavor that has not been attempted yet. Indeed, the miniaturization of column studies and the
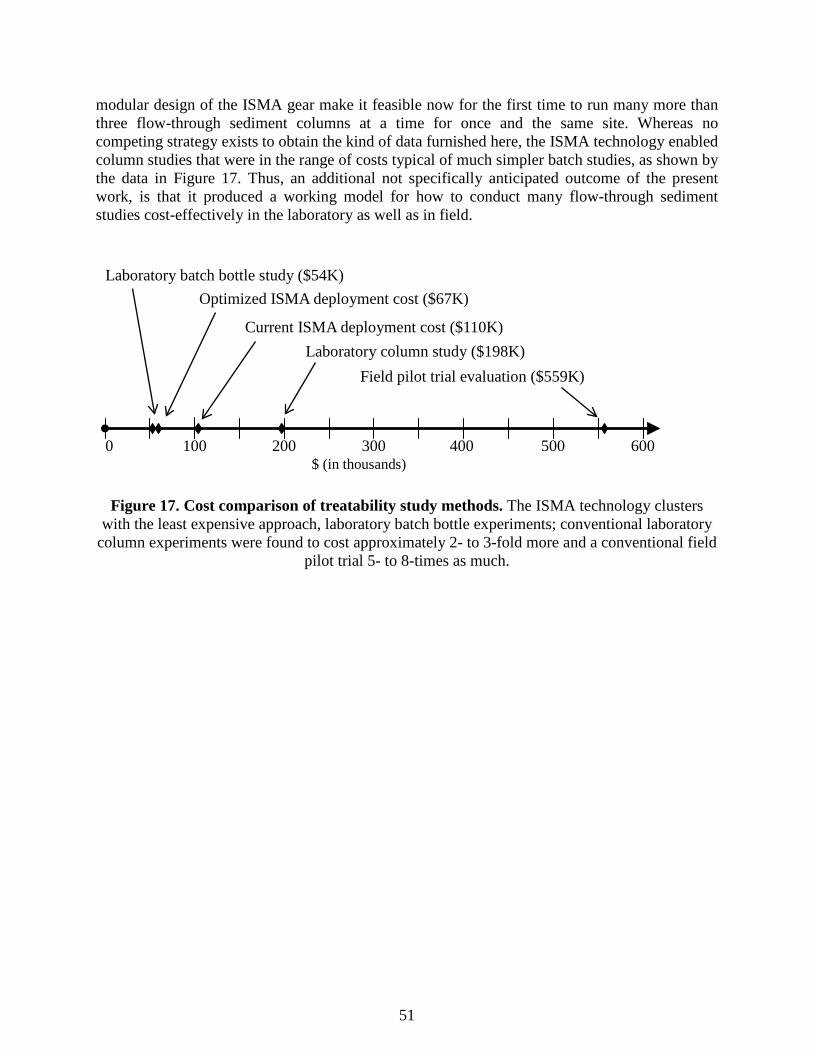
51
modular design of the ISMA gear make it feasible now for the first time to run many more than three flow-through sediment columns at a time for once and the same site. Whereas no competing strategy exists to obtain the kind of data furnished here, the ISMA technology enabled column studies that were in the range of costs typical of much simpler batch studies, as shown by the data in Figure 17. Thus, an additional not specifically anticipated outcome of the present work, is that it produced a working model for how to conduct many flow-through sediment studies cost-effectively in the laboratory as well as in field.
Figure 17. Cost comparison of treatability study methods. The ISMA technology clusters
with the least expensive approach, laboratory batch bottle experiments; conventional laboratory column experiments were found to cost approximately 2- to 3-fold more and a conventional field
pilot trial 5- to 8-times as much.
Laboratory batch bottle study ($54K) Optimized ISMA deployment cost ($67K)
Field pilot trial evaluation ($559K)
Current ISMA deployment cost ($110K)
$ (in thousands) 100 200 300 400 500 600 0
Laboratory column study ($198K)

52
8.0 IMPLEMENTATION ISSUES AND CONCLUSIONS
The ISMA, while conceptually simple, is mechanically complex. With multiple modular components and independent lines, there exist significant opportunities for ISMA failure in the field due to improper assembly from user error in the laboratory. To systematically identify, isolate, and minimize the opportunities for these errors, we have performed a Failure Mode Effects Analysis and installed safeguards where possible to minimize failure modes in the future. As part of these efforts, we have developed a comprehensive checklist that ISMA technicians can use in the future to minimize user-error from minor oversight. Additionally, at the conclusion of this project, there will exist a video training resource that demonstrates all the steps involved with the laboratory assembly and field deployment of the ISMA. Further development of the ISMA may be desired to broaden its applicability. Two high-priority potential ISMA improvements identified in this work are to develop a capability for real-time sensing and to improve the efficiency of capture of VOCs in the ISMA. There are no regulatory barriers we have identified that may impede ISMA field deployment. In light of the fact that the ISMA does not release any compounds into the deployment well, it falls in the same regulatory category as field sampling devices. As such, an ISMA field deployment should not require additional permitting or approval beyond that necessary for field use of groundwater sampling devices. However, additional permitting may be necessary for storage of ISMA surface components. ISMA use in remedial design will have to be subject to approval by site-relevant regulatory agencies. However, in light of the quality and field-relevance of data output, we anticipate no additional difficulties in securing this approval compared to a standard bench-scale treatability study. Our team has engaged potential industrial partners and technology users; further laboratory and field deployments of the ISMA technology will prove helpful in identifying technology-specific benefits and challenges.

This page left blank intentionally.

54
9.0 REFERENCES
Ahn, C., H. Oh, et al. 2009. “Bacterial biofilm-community selection during autohydrogenotrophic reduction of nitrate and perchlorate in ion-exchange brine.” Applied Microbiology and Biotechnology 81(6): 1169-1177.
Alfreider, A., M. Krossbacher, et al. 1997. “Groundwater samples do not reflect bacterial densities and activity in subsurface systems.” Water Research 31(4): 832-840.
Amerson, I. and R. L. Johnson. 2003. “Natural gradient tracer test to evaluate natural attenuation of MTBE under anaerobic conditions.” Ground Water Monitoring and Remediation 23(1): 54-61.
Arizona Geological Society. 1987. Arizona Highway Geologic Map.
Basin & Range Hydrogeologists, 1991.
Bolster, C. H., A. L. Mills, et al. 2000. “Effect of Intra-Population Variability on the Long-Distance Transport of Bacteria.” Ground Water 38(3): 370-375.
Bouwer, E. J. and P. L. McCarty. 1982. “Removal of trace chlorinated organic compounds by activated carbon and fixed-film bacteria.” Environmental Science & Technology 16(12): 836-843.
Caldwell, B. a. 2009. Groundwater Investigation Status Report.
Chaudhuri, S. K., S. M. O'Connor, et al. 2002. “Environmental factors that control microbial perchlorate reduction.” Applied and Environmental Microbiology 68(9): 4425-4430.
Consultants, G. 2009. Appendix B - WBO-1 Microcosm Testing Methods and Results.
Consultants, G. 2009. Work Plan for a Pilot Test of Perchlorate Bioremediation at the Former Water Bore-out Facility.
Consultants, T. E. 1988. Investigation of Metal in Soils Talley Defense Systems, Inc. Mesa, AZ.
Da Silva, M., G. Ruiz-Aguilar, et al. 2005. “Enhanced anaerobic biodegradation of BTEX-ethanol mixtures in aquifer columns amended with sulfate, chelated ferric iron or nitrate.” Biodegradation 16(2): 105-114.
deLeo, P. C. and P. Baveye. 1997. “Factors affecting protozoan predation of bacteria clogging laboratory aquifer microcosms.” Geomicrobiology Journal 14(2): 127-149.
Drzyzga, O., R. El Mamouni, et al. 2002. “Dehalogenation of chlorinated ethenes and immobilization of nickel in anaerobic sediment columns under sulfidogenic conditions.” Environmental Science & Technology 36(12): 2630-2635.

55
England, L. S., H. Lee, et al. 1993. “BACTERIAL SURVIVAL IN SOIL - EFFECT OF CLAYS AND PROTOZOA.” Soil Biology & Biochemistry 25(5): 525-531.
Environmental Security Technology Certification Program (ESTCP). 2005. Bioaugmentation for Remediation of Chlorinated Solvents: Technology Development, Status and Research Needs, ESTCP.
Fernandez-Sanchez, J. M., E. J. Sawvel, et al. 2004. “Effect of Fe0 quantity on the efficiency of integrated microbial-Fe0 treatment processes.” Chemosphere 54(7): 823-829.
Geomatrix Consultants, Inc. 2007. Perchlorate Bench-Scale Summary Report.
Giblin, T. L., D. C. Herman, et al. 2000. “Removal of perchlorate from ground water by hydrogen-utilizing bacteria.” Journal of Environmental Quality 29(4): 1057-1062.
Gillham, R. W., R. C. Starr, et al. 1990. “A DEVICE FOR INSITU DETERMINATION OF GEOCHEMICAL TRANSPORT PARAMETERS .2. BIOCHEMICAL REACTIONS.” Ground Water 28(6): 858-862.
Goldstein, R. M., L. M. Mallory, et al. 1985. “REASONS FOR POSSIBLE FAILURE OF INOCULATION TO ENHANCE BIODEGRADATION.” Applied and Environmental Microbiology 50(4): 977-983.
Halden, R. U. 2004. Method and apparatus for environmental monitoring and bioprospecting.
Halden, R. U. 2005. Innovative Method for Environmental Monitoring and Bioprospecting. Batelle, Baltimore, MD.
Halden, R. U. 2005. Methods and systems for sampling, screening and diagnosis.
Halden, R. U., D. R. Colquhoun, et al. 2005. “Identification and phenotypic characterization of Sphingomonas wittichii strain RW1 by peptide mass fingerprinting using matrix-assisted laser desorption ionization-time of flight mass spectrometry.” Applied and Environmental Microbiology 71(5): 2442-2451.
Heijnen, C. E. and J. A. Vanveen. 1991. “A DETERMINATION OF PROTECTIVE MICROHABITATS FOR BACTERIA INTRODUCED INTO SOIL.” Fems Microbiology Ecology 85(1): 73-80.
Herman, D. C. and W. T. Frankenberger. 1999. “Bacterial reduction of perchlorate and nitrate in water.” Journal of Environmental Quality 28(3): 1018-1024.
Hosein, S. G., D. Millette, et al. 1997. “Catabolic Gene Probe Analysis of an Aquifer Microbial Community Degrading Creosote-Related Polycyclic Aromatic and Heterocyclic Compounds.” Microbial Ecology 34(2): 81-89.
Istok, J. D., M. D. Humphrey, et al. 1997. “Single-well, ''push-pull'' test for in situ determination of microbial activities.” Ground Water 35(4): 619-631.

56
Interstate Technology and Regulatory Council (ITRC). 2002. Technical/Regulatory Guidelines – A Systematic Approach to In Situ Bioremediation in Groundwater.
Jackson, D. R., B. C. Garrett, et al. 1984. “Comparison of batch and column methods for assessing leachability of hazardous waste.” Environmental Science & Technology 18(9): 668-673.
Kalinowski, T., McClellan, K., Bruton, T.A., Halden R. U. 2010. Capabilities of the In Situ Microcosm Array Complex. Partners in Environmental Technology – Technical Symposium & Workshop, Washington, DC.
Kalinowski, T., McClellan, K., Bruton, T.A., Roll, I.B., Halden R. U. 2012. In Situ Microcosm Array: A Novel Tool For Conducting Treatability Studies In Situ. AEHS Foundation Annual Meeting, San Diego, CA.
Kalinowski, T., McClellan, K., Bruton, T.A., Roll, I.B., Krajmalnik-Brown, R., Halden R. U. 2012. Bioremediation of TCE and Hexavalent Chromium Contamination: Comparing Bench-Scale Treatability Studies to the In Situ Microcosm Array. Eighth International Conference on Remediation of Chlorinated and Recalcitrant Compounds, Monterey, CA.
Kazy, S., A. Monier, et al. 2010. “Assessing the correlation between anaerobic toluene degradation activity and <i>bssA</i> concentrations in hydrocarbon-contaminated aquifer material.” Biodegradation 21(5): 793-800.
Kleikemper, J., M. H. Schroth, et al. 2002. “Activity and diversity of sulfate-reducing bacteria in a petroleum hydrocarbon-contaminated aquifer.” Applied and Environmental Microbiology 68(4): 1516-1523.
Lee, W. and B. Batchelor. 2002. “Abiotic, reductive dechlorination of chlorinated ethylenes by iron-bearing soil minerals. 2. Green rust.” Environmental Science & Technology 36(24): 5348-5354.
Lehman, R. M. 2007. “Understanding of aquifer microbiology is tightly linked to sampling approaches.” Geomicrobiology Journal 24(3-4): 331-341.
Madsen, E. L. 1991. “DETERMINING INSITU BIODEGRADATION - FACTS AND CHALLENGES.” Environmental Science & Technology 25(10): 1663-1673.
McClellan, K., Kalinowski, T., Bruton, T. A., Roll, I.B., Halden, R. U. 2011. Bringing the Lab to the Field - the In Situ Microcosm Array. Annual Conference of the NIEHS Superfund Program, Lexington, KY.
McClellan, K., Kalinowski, T., Bruton, T. A., Roll, I.B., Halden, R. U. 2011. In Situ Microcosm Array (ISMA) vs. Standard Laboratory Assessment of Candidate Remediation Technologies – A Perchlorate Case Study. Geological Society of America Annual Meeting & Exhibition, Minneapolis, MN.
57
McClellan, K., Kalinowski, T., Bruton, T. A., Roll, I.B., Halden, R. U. 2012. In Situ Microcosm Array vs. Laboratory Based Feasibility Studies for Remediation Technology Selection. Eighth International Conference on Remediation of Chlorinated and Recalcitrant Compounds. Monterey, CA.
McClellan, K., Kalinowski, T., Bruton, T. A., Roll, I.B., Halden, R. U. 2012. Lowering the Barrier for Novel In Situ Remediation Approaches – The In Situ Microcosm Array. AEHS Foundation Annual Meeting, San Diego, CA.
McClellan, K., Kalinowski, T., Halden, R. U. 2009. ESTCP Project 200914: A New Technology for Remedial Design. Partners in Environmental Technology – Technical Symposium & Workshop, Washington, DC.
McClellan, K., Kalinowski, T., Madrid, V., Verce, A., Sublette, K., Rays, E., Halden, R. U. 2012. Characterizing and Understanding Remediation Processes In Situ: The In Situ Technological Toolbox. Eighth International Conference on Remediation of Chlorinated and Recalcitrant Compounds, Monterey, CA.
McDowellboyer, L. M., J. R. Hunt, et al. 1986. “PARTICLE-TRANSPORT THROUGH POROUS-MEDIA.” Water Resources Research 22(13): 1901-1921.
Miller, T. R. 2005. Enrichment of Xenobiotic-degrading Bacteria Using a New In Situ Device. SETAC, Baltimore, MD.
Miller, T. R., M. P. Franklin, et al. 2007. “Bacterial community analysis of shallow groundwater undergoing sequential anaerobic and aerobic chloroethene biotransformation.” Fems Microbiology Ecology 60(2): 299-311.
Monod, J. 1949. “THE GROWTH OF BACTERIAL CULTURES.” Annual Review of Microbiology 3: 371-394.
Mueller, J. G., S. M. Resnick, et al. 1992. “EFFECT OF INOCULATION ON THE BIODEGRADATION OF WEATHERED PRUDHOE BAY CRUDE-OIL.” Journal of Industrial Microbiology 10(2): 95-102.
Nielsen, P. H., T. H. Christensen, et al. 1996. “Performance of the in situ microcosm technique for measuring the degradation of organic chemicals in aquifers.” Ground Water Monitoring and Remediation 16(1): 130-140.
National Research Council (NRC). 1993. In situ bioremediation - When does it work? C. o. I. S. Bioremediation. Washington, DC, National Academy Press.
NRC. 1997. Innovations in Groundwater and Soil Cleanup - From Concept to Commercialization. Washington, D.C., National Academy Press.
NRC. 2004. Contaminants in the Subsurface: Source Zone Assessment and Remediation. C. o. S. R. o. C. i. t. Subsurface. Washington, DC, The National Academies Press.
58
Oh, B. T. and P. J. Alvarez. 2004. “Removal of Explosives Using an Integrated Iron–Microbial Treatment in Flow-Through Columns.” Bulletin of Environmental Contamination and Toxicology 73(1): 1-8.
Project, S. R. 1990. The Granite Reef Underground Storage and Recovery Project. American Water Works Association 1990 Annual Conference. Cincinnati, OH.
Ptak, T. and G. Teutsch. 1994. “Forced and natural gradient tracer tests in a highly heterogeneous porous aquifer: instrumentation and measurements.” Journal of Hydrology 159(1–4): 79-104.
Ramadan, M. A., O. M. Eltayeb, et al. 1990. “INOCULUM SIZE AS A FACTOR LIMITING SUCCESS OF INOCULATION FOR BIODEGRADATION.” Applied and Environmental Microbiology 56(5): 1392-1396.
Ruiz-Aguilar, G. M. L., J. M. Fernandez-Sanchez, et al. 2002. “Effect of ethanol and methyl-Tert-butyl ether on monoaromatic hydrocarbon biodegradation: Response variability for different aquifer materials under various electron-accepting conditions.” Environmental Toxicology and Chemistry 21(12): 2631-2639.
Schäfer, D., W. Schäfer, et al. 1998. “Simulation of reactive processes related to biodegradation in aquifers: 2. Model application to a column study on organic carbon degradation.” Journal of Contaminant Hydrology 31(1–2): 187-209.
Schroth, M. H., J. Kleikemper, et al. 2001. “In situ assessment of microbial sulfate reduction in a petroleum-contaminated aquifer using push-pull tests and stable sulfur isotope analyses.” Journal of Contaminant Hydrology 51(3-4): 179-195.
SES-TECH. 2010. Enhanced in situ Bioremediation Field-scale Pilot Study Work Plan. San Diego, CA.
SES-TECH. 2010. Report of Laboratory Biotreatability Study to Assess Degradation of Hexavalent Chromium and Chlorinated Ethenes in Groundwater. San Diego, CA.
SES-TECH. 2011. Enhanced in situ Bioremediation Field-scale Pilot Study Report.
Terranext. 2007. Groundwater Monitoring Report. Mesa, AZ.
U.S Environmental Protection Agency (USEPA). 1998. Permeable Reactive Barrier Technologies for Contaminant Remediation. O. ORD.
Vancheeswaran, S., S. Yu, et al. 2003. “Intrinsic remediation of trichloroethene driven by tetraalkoxysilanes as co-contaminants: Results of microcosm and field studies.” Remediation Journal 13(2): 7-25.
Zhang, H., B. E. Logan, et al. 2005. “Molecular Assessment of Inoculated and Indigenous Bacteria in Biofilms from a Pilot-Scale Perchlorate-Reducing Bioreactor.” Microbial Ecology 49(3): 388-398.

59
Ziv-El, M., A. G. Delgado, et al. 2011. “Development and characterization of DehaloR^2, a novel anaerobic microbial consortium performing rapid dechlorination of TCE to ethene.” Applied Microbiology and Biotechnology.

A-1
APPENDIX A
POINTS OF CONTACT
Point of Contact Organization
Phone Fax
E-Mail Role In Project
Rolf Halden The Biodesign Institute at Arizona State University; Center for Environmental Security 781 E. Terrace Road Tempe, AZ 85287-5904
Phone: 480-727-0893 E-mail: [email protected]
Principal Investigator
Kristin McClellan The Biodesign Institute at Arizona State University; Center for Environmental Security 781 E. Terrace Road Tempe, AZ 85287-5904
Phone: 480-727-0698 E-mail: [email protected]
Project Manager / Researcher
Tomasz Kalinowski The Biodesign Institute at Arizona State University; Center for Environmental Security 781 E. Terrace Road Tempe, AZ 85287-5904
Phone: 480-727-0698 E-mail: [email protected]
Researcher

This page left blank intentionally.