
Parallel Changes in Large-Scale Software...
30
Parallel Changes in Large-Scale Software Development: An Observational Case Study DEWAYNE E. PERRY University of Texas at Austin HARVEY P. SIY Lucent Technologies and LAWRENCE G. VOTTA Motorola, Inc. An essential characteristic of large-scale software development is parallel development by teams of developers. How this parallel development is structured and supported has a profound effect on both the quality and timeliness of the product. We conduct an observational case study in which we collect and analyze the change and configuration management history of a legacy system to delineate the boundaries of, and to understand the nature of, the problems encountered in parallel development. The results of our studies are (1) that the degree of parallelism is very high— higher than considered by tool builders; (2) there are multiple levels of parallelism, and the data for some important aspects are uniform and consistent for all levels; (3) the tails of the distributions are long, indicating the tail, rather than the mean, must receive serious attention in providing solutions for these problems; and (4) there is a significant correlation between the degree of parallel work on a given component and the number of quality problems it has. Thus, the results of this study are important both for tool builders and for process and project engineers. Categories and Subject Descriptors: D.2.7 [Software Engineering]: Distribution, Mainte- nance, and Enhancement—Version control; D.2.8 [Software Engineering]: Metrics—Process metrics; D.2.9 [Software Engineering]: Management—Programming teams; Software config- uration management; K.6.3 [Management of Computing and Information Systems]: Software Management—Software development General Terms: Management, Measurement This article is a major revision and expansion of a paper presented at the 1998 International Conference on Software Engineering (ICSE98), Kyoto, Japan. Authors’ addresses: D. E. Perry, Department of Electrical and Computer Engineering, Univer- sity of Texas at Austin, Austin, TX 78712; email: [email protected]; H. P. Siy, Lucent Technologies, 1960 Lucent Lane, Naperville, IL 60566; email: [email protected]; L. G. Votta, Motorola, Inc., 1501 West Shure Drive, MS SE Atrium, Arlington Heights, IL 60004; email: [email protected]. Permission to make digital / hard copy of part or all of this work for personal or classroom use is granted without fee provided that the copies are not made or distributed for profit or commercial advantage, the copyright notice, the title of the publication, and its date appear, and notice is given that copying is by permission of the ACM, Inc. To copy otherwise, to republish, to post on servers, or to redistribute to lists, requires prior specific permission and/or a fee. © 2001 ACM 1049-331X/01/0700 –0308 $5.00 ACM Transactions on Software Engineering and Methodology, Vol. 10, No. 3, July 2001, Pages 308 –337.
Transcript of Parallel Changes in Large-Scale Software...
Parallel Changes in Large-Scale SoftwareDevelopment: An Observational CaseStudy
DEWAYNE E. PERRYUniversity of Texas at AustinHARVEY P. SIYLucent TechnologiesandLAWRENCE G. VOTTAMotorola, Inc.
An essential characteristic of large-scale software development is parallel development byteams of developers. How this parallel development is structured and supported has aprofound effect on both the quality and timeliness of the product. We conduct an observationalcase study in which we collect and analyze the change and configuration management historyof a legacy system to delineate the boundaries of, and to understand the nature of, theproblems encountered in parallel development. The results of our studies are (1) that thedegree of parallelism is very high—higher than considered by tool builders; (2) there aremultiple levels of parallelism, and the data for some important aspects are uniform andconsistent for all levels; (3) the tails of the distributions are long, indicating the tail, ratherthan the mean, must receive serious attention in providing solutions for these problems; and(4) there is a significant correlation between the degree of parallel work on a given componentand the number of quality problems it has. Thus, the results of this study are important bothfor tool builders and for process and project engineers.
Categories and Subject Descriptors: D.2.7 [Software Engineering]: Distribution, Mainte-nance, and Enhancement—Version control; D.2.8 [Software Engineering]: Metrics—Processmetrics; D.2.9 [Software Engineering]: Management—Programming teams; Software config-uration management; K.6.3 [Management of Computing and Information Systems]:Software Management—Software development
General Terms: Management, Measurement
This article is a major revision and expansion of a paper presented at the 1998 InternationalConference on Software Engineering (ICSE98), Kyoto, Japan.Authors’ addresses: D. E. Perry, Department of Electrical and Computer Engineering, Univer-sity of Texas at Austin, Austin, TX 78712; email: [email protected]; H. P. Siy, LucentTechnologies, 1960 Lucent Lane, Naperville, IL 60566; email: [email protected]; L. G. Votta,Motorola, Inc., 1501 West Shure Drive, MS SE Atrium, Arlington Heights, IL 60004; email:[email protected] to make digital / hard copy of part or all of this work for personal or classroom useis granted without fee provided that the copies are not made or distributed for profit orcommercial advantage, the copyright notice, the title of the publication, and its date appear,and notice is given that copying is by permission of the ACM, Inc. To copy otherwise, torepublish, to post on servers, or to redistribute to lists, requires prior specific permissionand / or a fee.© 2001 ACM 1049-331X/01/0700–0308 $5.00
ACM Transactions on Software Engineering and Methodology, Vol. 10, No. 3, July 2001, Pages 308–337.
Additional Key Words and Phrases: Change management, parallel/concurrent changes, paral-lel versions, merging interfering and noninterfering versions, software integration
1. INTRODUCTIONLarge-scale software development presents a number of significant prob-lems and challenges to software engineering and software engineeringresearch. In our pursuit of a deep understanding of how complex large-scale software systems are built and evolved, we must understand howdevelopers work in parallel. Indeed, in any software project with more thanone developer, parallel changes are a basic fact of life. This basic fact iscompounded by four essential [Brooks 1987] problems in software develop-ment: evolution, scale, multiple dimensions of system organization, anddistribution of knowledge.
—Evolution compounds the problems of parallel development because wenot only have parallel development within each release, but amongreleases as well.
—Scale compounds the problems by increasing the degree of paralleldevelopment and hence increasing both the interactions and interdepen-dencies among developers.
—Multiple dimensions of system organization1 [Perry 1996] compounds theproblems by preventing tidy separations of development into indepen-dent work units.
—Distribution of knowledge compounds the problem by decreasing thedegree of awareness in that dimension of knowledge that is distributed.2
Thus, a fundamental and important problem in building and evolvingcomplex large-scale software systems is how to manage the phenomena ofparallel changes. How do we support the people doing these parallelchanges by organizational structures, by project management, by process,and by technology? How can we support this kind of parallel-change effortand maintain the desired levels of quality in the affected software? We areparticularly interested in the problems of technology and process support.
Before we can adequately answer these questions we need to understandthe depth and breadth of the problem and correlate it to the related qualitydata. To explore the dimensions of this phenomena, we take a look at the
1By system organization, we mean the hardware and software components which make up theproduct. It is not to be confused with the developers’ organization.2Here there are two possibilities of knowledge centralization: the knowledge of a part of thesystem, or the knowledge of (part of) the problem to be solved. If one centralizes knowledge ofthe system (for example, by file ownership where only the file owner makes changes) then onemust distribute knowledge of the problems to be solved over the file owners. Conversely, as isdone here, if one centralizes knowledge of the problems (for example, by feature ownership)then one must distribute the knowledge of the system over the feature owners.
Parallel Changes in Large-Scale Software Development • 309
ACM Transactions on Software Engineering and Methodology, Vol. 10, No. 3, July 2001.

history of a subsystem of Lucent Technologies’ 5ESS(R) telephone switch[Martersteck and Spencer 1985] to understand the various aspects ofparallel development in the context of a large software development orga-nization and project.
We use an observational case study method to do this empirical investi-gation. We describe this study as observational, since it captures manyimportant quantitative properties associated with the problem of concur-rent changes to software. We consider it to be a case study because it is onespecific instance of the observed phenomena.
Central to this technique is an extended series of repeated observationsto establish credibility [Yin 1994]. In this way, the method is similar to theones used in astronomy and the social sciences [Judd et al. 1991]. Finally, atheory is built using these observations (e.g., with grounded theory [Glaserand Strauss 1967]) to make predictions (hypotheses) that are tested withfuture studies.
Our strategy for understanding the problem of parallel changes is to lookat the problem from a number of different angles and viewpoints in thecontext of a large-scale, real-time system and a large-scale development.We have three goals in this initial study. First, we provide a basicunderstanding of the parallel-change phenomena that provides the contextfor subsequent studies. For this we provide basic observational data on thenature of parallel changes. Our thesis is that these problems cannot be(and indeed have not been) adequately addressed without quantitative dataillustrating their fundamental nature.
Second, we begin an investigation (which we will continue in subsequentstudies) of an important subproblem: interfering changes. Given the highdegree of parallelism in our study system and the increasing emphasis onshorter development intervals, it is inevitable that some of these changeswill be incompatible with each other in terms of their semantic intent. Herewe look at the prima facie cases where we have changes to changes andchanges made within the same day. In subsequent studies we will explorethe extent to which parallel changes interfere with each other semantically(i.e., they affect the data flow within the same slice).
Third, we explore the relationship between parallel changes and therelated quality data. We have several hypotheses about this relationship.One, interfering changes are more likely to result in quality problems laterin the development than noninterfering changes. Two, files with significantdegrees of parallel changes are likely candidates for code that “decays” overtime. The degree of interference increases this likelihood. Three, currenttechnology supporting the management of these problems addresses onlysuperficial aspects of these problems.
We first summarize the various kinds of tools that are available tosupport parallel development. We then describe the context of this study:the characteristics of the organizational, process, and development environ-ment and the characteristics of the subsystem under investigation. We dothis to provide a background against which to consider the phenomena ofparallel changes. Having set the context for the study, we present our data
310 • D. E. Perry et al.
ACM Transactions on Software Engineering and Methodology, Vol. 10, No. 3, July 2001.

and analyses of the parallel-change phenomena, the extent and magnitudeof interfering changes, correlate the parallel-change phenomena to thequality data, and discuss the construct, internal, and external validity ofour study. Finally, we summarize our findings, evaluate the various meansof technological and process support in the light of our results, and suggestareas for further research and development.
2. RELATED WORK
The problem addressed in this paper is primarily that of merging changesmade in parallel with respect to the software developers and concurrentlywith respect to the change management system. The primary related work,then, is that which addresses the problems of merging versions either aspart of configuration management, or as an independent endeavor. Notquite as central, but important because of the numerous interdependencies,is the issue of build strategies. Of course, related empirical work iscritically important.
We note here that we are not concerned in this study with the problemsof specifying the relationships among versions as one can do in Odin[Clemm and Osterweil 1990], nor are we concerned with the semantics ofsubstitution and interface dependencies such as one finds in the InscapeEnvironment [Perry 1989]. While they are important problems and cer-tainly significant in the context of evolution, we are focused here on themore narrow issue of parallel changes and how they are supported andmanaged.
2.1 Configuration Management
Classic configuration management systems in widespread use today, SCCS[Rochkind 1975] and RCS [Tichy 1982], embody the traditional librarymetaphor where source files are checked out for editing and then checkedback in [Grinter 1997]. They induce a sequential model of software devel-opment. The locking for a checkout operation guarantees that only one usercan change a particular file at a time and blocks other developers frommaking changes until a checkin operation has been done, thereby releasingthe lock on the file. There is no checking for the presence of conflictsbetween successive changes. The purpose of the configuration managementsystem is to guarantee, as in a database, that no changes are lost due torace conditions.
2.2 Management of Parallel Changes
One of the standard features of even the classic configuration managementsystems that enables developers to create parallel versions is the branchingmechanism. Everytime a developer needs to create a new version of thecode, they request the configuration management system to create a newbranch. The different versions are all stored in the same physical file. Theconfiguration management system can isolate changes made to one versionfrom those of other versions by examining the branch identifier associated
Parallel Changes in Large-Scale Software Development • 311
ACM Transactions on Software Engineering and Methodology, Vol. 10, No. 3, July 2001.

with each change. However, since all changes are stored in the same file,only one developer at a time can make changes to the file.
Newer configuration management systems such as Rational’sClearCase(R) [Leblang 1994] and the Adele Configuration Manager [Estub-lier and Casallas 1994] allow developers to work in parallel on the same filewithout waiting for some other developer to release his lock on the file.ClearCase’s views and Adele’s workspaces enable developers to createdifferent versions of the file. Within each view or workspace, a developercan make changes to the code in parallel with other developers.
2.3 Integration of Parallel Changes
The creation and maintenance of parallel versions give rise to another setof problems and issues, depending on whether the versions are permanentor temporary. Permanent versions are “branches in the product develop-ment path that have their own life cycle” [Mahler 1994]. These typicallymean different releases or different members of a software product family.In dealing with permanent versions, problems arise in managing softwareproduct families, in sharing and reusing common code, in propagatingcommon changes across different versions, and in identifying the versionbest suited for a given application. Temporary versions on the other handare meant to be merged eventually and only need to exist for the timeneeded until merging. The problem here is in figuring out how to merge themultiple versions back into a coherent single version, resolving potentialconflicts that might arise in the process. We narrow the scope of this paperto this problem. We examine previous configuration management researchto address this problem. We will also examine related research into two keyissues related to integrating parallel changes that are not addressed byconfiguration management systems: semantic conflicts and logical com-pleteness.
In classic configuration management systems, this merging process hasto be done manually. There are no mechanisms to collapse branches backtogether. Modern configuration management systems provide mechanismsfor automatically merging several versions back together. For example,ClearCase provides support for merging up to 32 versions. Mutuallyexclusive changes are merged automatically. Changes that are not mutu-ally exclusive must be resolved manually, and the merge tool provides aninterface for doing so.
In one project case study [Leblang 1994], ClearCase was able to automat-ically merge over 90% of the changed files. The rest required manualintervention. In about 1% of the cases, the merge tool inappropriately madean automatic decision, but nearly all of those cases were easily detectedbecause they resulted in compiler errors. This data came from an in-housemerge of the Windows port of ClearCase with their UNIX version (D. B.Leblang, 1997, Personal communication). The merge involved several thou-sand files resulting from 9 to 12 months of diverging development effort byabout 10 people.
312 • D. E. Perry et al.
ACM Transactions on Software Engineering and Methodology, Vol. 10, No. 3, July 2001.

Adele provides a mechanism to automatically merge a file in a workspaceinto the current version of the file. However, it is recommended thatfrequent merges be performed by the different workspaces because theprobability of conflicts rapidly increases with the number of changesperformed in all the copies [Estublier and Casallas 1994]. Thus, Adelerequires frequent updating of the changes being made in the other work-spaces to keep the various parallel versions more or less in synch.
2.3.1 Semantic Conflicts. Configuration management systems are onlyable to detect the most simple types of conflicting changes: changes madeon top of other changes, i.e., changes in one version that physically overlapwith changes in another version. There may be many more changes thatindirectly conflict with each other. To detect these, more sophisticatedprogram analysis techniques are needed, e.g., the work of Horwitz, Prins,and Reps on integrating noninterfering versions [Horwitz et al. 1989]. Theydescribe the design of a semantics-based tool that automatically integratesnoninterfering versions, given the base version and two derived but paral-lel versions. The work makes use of dependence graphs and program slicesto determine if there is interference and, if not, to determine the integra-tion results.
2.3.2 Logical Completeness. In trying to synchronize a consistent buildof a system, we have to worry about logical completeness of changes—i.e.,we have to worry about dependencies that are shared across multiplecomponents in the system [Perry 1996]. Cusumano and Selby [1995] notedthis problem in the course of applying Microsoft’s synch and build strategyto Windows NT. Their solution to coordinating changes [Cusumano andSelby 1995] was to post the intent to check in a particular component andfor related files to prepare and coordinate their changes so as to be able tosynchronize a consistent build.
This problem of coordinating changes is certainly an important one in thecontext of large-scale system builds out of separately evolved components.This exacerbates the problem of increasing parallel changes, especially forcentral components which may be indirectly affected by multiple logicalchanges.
2.4 Empirical Evaluation
We have presented some of the past research done to address the problemsof parallel changes. In general, the studies reviewed here have either beenconducted to prove the technical feasibility of specific solutions or todocument observations on effective practices of software development. Wenote a dearth of empirical studies in the literature investigating the scopeand problems due to parallel changes.
The data offered in support of ClearCase are the only data we know ofthat are relevant to the merging of parallel versions.
While no direct data exist about the number of components on averageinvolved in the evolution of Windows NT, data are provided about the
Parallel Changes in Large-Scale Software Development • 313
ACM Transactions on Software Engineering and Methodology, Vol. 10, No. 3, July 2001.

specific case of fixing faults [Cusumano and Selby 1995]: each fault repairusually required changing 3 to 5 files.
In both cases, the data as published are anecdotal in nature. An empiri-cal study on parallel changes is necessary if we are to evaluate thescalability of a certain solution, to weigh the trade-offs in costs, and tounderstand why and in what situation one approach may be better thananother.
3. STUDY CONTEXT
This study is one of several strands of research being done in the context ofthe Code Decay Project [Eick et al. 2001], a multidisciplinary and multiin-stitution project supported in part by NSF. It was conducted in part tounderstand how software systems evolved over time and how parallelchanges played a role in that evolutionary process, to the extent that can bededuced from the change management data recorded over several years.
We describe first the characteristics of the subsystem under study, thenthe change and configuration management data available to the CodeDecay Project, and finally the change and configuration managementprocesses.
RELEASE TIMELINE
RE
LEA
SE
DELTAS PER MONTH
85 86 87 88 89 90 91 92 93 94 95 96
D1D2D3D4D5D6D7D8D9
D10D11
I1I2I3I5I6I7I8I9
I10I11I12I13I14I15
Fig. 1. Timeline of parallel releases. Each histogram represents number of deltas made permonth for one release of the software. The top and bottom halves show releases for theinternational and domestic products, respectively. In this picture, Release I6 shows a peak ofaround 1,800 deltas per month.
314 • D. E. Perry et al.
ACM Transactions on Software Engineering and Methodology, Vol. 10, No. 3, July 2001.

3.1 The Subsystem under Study
The data for this study comes from the complete change and quality historyof a subsystem of the Lucent Technologies’ 5ESS. These data consist of thechange and configuration management history representing a period of 12years from April 1984 to April 1996. This subsystem is one of 50 sub-systems in 5ESS. It was built at a single development site. The develop-ment organization has undergone several changes in structure over theyears, and its size has varied accordingly, reaching a peak of 200 develop-ers and eventually decreasing to the current 50 developers. There are twomain product offerings, one for US customers and another for internationalcustomers. Historically, the two products have separate developmentthreads although they do share some common files.
3.2 The 5ESS Change Management Process
Lucent Technologies uses a two-layered system for managing the evolutionof 5ESS: a change management layer, ECMS [Tuscany 1987], to initiateand track changes to the product, and a configuration management layer,SCCS [Rochkind 1975], to manage the versions of files needed to constructthe appropriate configurations of the product.
All changes are handled by ECMS and are initiated using an InitialModification Request (IMR) whether the change is for fixing a fault,perfecting or improving some aspect of the system, or adding new featuresto the system. Thus an IMR represents a problem to be solved and mayencompass the implementation of all or part of a feature. Features are thefundamental unit of extension to the system, and each feature has at leastone IMR associated with it as its problem statement.
Each functionally distinct set of changes to the code made by a developeris recorded as a Modification Request (MR) by the ECMS. An MR repre-sents all or part of a developer’s contribution to the solution of an IMR. (Adeveloper may split a solution into multiple MRs if it appears to encompassmultiple logical changes.) Multiple MRs may be needed to solve an IMR,especially if multiple developers are involved. A variety of information isassociated with each IMR and MR. For example, for each MR, ECMSincludes such data as the date it was opened, its status, the developer whoopened it, a short text abstract of the work to be done, and the date it wasclosed.
When a change is made to a file in the context of an MR, SCCS keepstrack of the actual lines added, edited, or deleted. This set of changes isknown as a delta. For each delta, the ECMS records its date, the developerwho made it, and the MR where it belongs.
The process of implementing an MR usually goes as follows:
(1) make a private copy of necessary files,
(2) try out the changes within the private copy,
(3) when satisfied, retrieve the files from SCCS, locking them for editing,
Parallel Changes in Large-Scale Software Development • 315
ACM Transactions on Software Engineering and Methodology, Vol. 10, No. 3, July 2001.

(4) commit the changes as deltas in the SCCS, releasing the locks,
(5) retrieve the files again from the SCCS for reading,
(6) put the files through code inspection and unit testing, and
(7) submit the MR for load integration and feature and regression test
There are several observations. In step 3, the developer has to make surethat his changes do not conflict with other recent changes put into the code.In step 6, the code that is inspected contains only the officially approvedbase code plus changes from the developer’s MR. It does not includeunapproved changes made by other developers. Hence, the inspection andtesting may not catch any conflicts when all these different MRs arecombined. It is hoped that any conflicts are caught during load integrationand feature and regression testing.
When all the changes required by an MR have been made, the MR isclosed after all approval has been obtained for all the dependent units.Similarly, when all the MRs for an IMR have been closed, the IMR itself isclosed, and when all IMRs implementing a feature have been closed thefeature is completed.
4. DATA AND ANALYSIS
The change management data provides various different viewpoints fromwhich to delineate the boundaries of, and to understand the nature of, thephenomena of parallel changes. We first discuss the different levels atwhich parallel development takes place, and then explore the effects ofparallel changes at the file level and discuss the basic problem of changeinterference. We conclude this section by analyzing and summarizing thedata about parallelism at the levels of features, IMRs, MRs , and files.
In this section we make liberal use of histograms to provide a clearpicture of the data that would not be evident if we were to report merelythe minimum, mean, and maximum of each distribution. It is important tonotice that the tails of several distributions are long and fall off moreslowly than the Poisson or binomial distributions (classical engineeringdistributions). This is extremely important to consider in designing tools: ifa tool is designed around the mean value, it will not be particularly usefulfor the critical cases that need the support the most, namely, those cases
Table I. Data Summary. This table summarizes the data to be used in analyzing the degreeof parallelism.
Features IMRs MRs
Min Median Mean Max Min Median Mean Max Min Median Mean Max
Active per day 0 23 25.3 86 0 21 21.8 62 1 65 69.3 223Interval (days) 1 201 318.5 3344 , 1 1 14.6 2233 , 1 1 10.1 2191#Files 1 8 31.0 906 1 1 4.3 388 1 1 1.1 15#MRs 1 6 34.6 2188 1 1 2.6 86 n/a n/a n/a n/a#Developers 1 2 4.0 98 1 1 1.1 9 n/a n/a n/a n/a
316 • D. E. Perry et al.
ACM Transactions on Software Engineering and Methodology, Vol. 10, No. 3, July 2001.

represented by the tail of the distribution. For example, in Figure 3 andTable I we note that the median number of MRs per day is 65 but that thetail stretches out to a maximum of 223. If we designed the creation ofworkspaces for parallel changes for MRs using the mean, we might well runinto performance and space problems when the load is a factor of 4 abovethat.
4.1 Levels of Parallel Development
The 5ESS system is maintained as a series of releases, with each releaseoffering new features on top of the existing features in previous releases.The timeline on Figure 1 shows the number of deltas applied every monthto each release of the 5ESS subsystem under study. The top half shows theinternational releases (labeled I1–I15) and the bottom shows the domesticones (labeled D1–D12). It shows for each product line that there may be3–4 releases undergoing development and maintenance at any given time.
Within each release shown in Figure 1, multiple features are underdevelopment. The overlapping time schedule of successive releases suggestthat features for different releases are being developed almost concur-rently. Figure 2 is a timeline showing the density of new feature development
TIME
RE
LEA
SE
FEATURE DENSITY
6/88 1/90 9/91
D1
D2
D3
D4
D5
D6
D7
I2
I3
I6
I7
I10
TIME
IMR DENSITY
6/88 1/90 9/91
TIME
MR DENSITY
6/88 1/90 9/91
Fig. 2. Concurrent development activities in the development interval of Release I6. Thesepanels show the activities being conducted in parallel at the feature, IMR, and MR levelsduring the development interval for Release I6. Release I6 has peaks of approximately 60 openfeatures, 50 open IMRs, and 100 open MRs. The panels also show activities for other releasesduring the same time period.
Parallel Changes in Large-Scale Software Development • 317
ACM Transactions on Software Engineering and Methodology, Vol. 10, No. 3, July 2001.

during the development interval of Release I6.3 At its peak, there was workon about 60 features. It not only shows that multiple features are beingdeveloped concurrently for Release I6, but also shows that 8 other releasesare doing new feature development.
Figure 2 also shows the density of IMRs and MRs developed for ReleaseI6 as well as other releases in the same interval. At its peak, there wereapproximately 50 open IMRs and 100 open MRs.
Thus, we have parallel development going on at different levels in thedevelopment of this subsystem. Releases are being built in parallel with
3We picked Release I6 as an example here because it exhibited a high degree of paralleldevelopment at multiple levels and, thus, was useful for our illustrations.
0 20 40 60 80
020
060
010
00
NUMBER OF FEATURES PER DAY
NU
MB
ER
OF
DAY
S
0 20 40 60
020
060
010
00
NUMBER OF IMRs PER DAY
NU
MB
ER
OF
DAY
S
0 50 100 150 200
010
030
0
NUMBER OF MRs PER DAY
NU
MB
ER
OF
DAY
S
Fig. 3. Feature, IMR, MR distribution per day. These histograms show the distribution ofopen features, IMRs, and MRs per day over the 12-year period under study.
318 • D. E. Perry et al.
ACM Transactions on Software Engineering and Methodology, Vol. 10, No. 3, July 2001.

varying amounts of overlapping development. Features are being developedin parallel both within a single release and in the context of multiplereleases. Typically multiple IMRs are being developed in parallel for eachfeature, and MRs are developed in parallel for each IMR. And, finally, filesare changed in parallel within MRs, IMRs, features, and releases.
4.2 Multilevel Analysis of Parallel Development
To understand the amount of parallelism going on at the different levels,we examine the number of features, IMRs, and MRs being developed perday. We then look at four measures associated with the amount of workwithin each feature, IMR, and MR: their intervals, the number of files
<1 10 20 30 40 50 60 70 80 90 100 200 300 400 500 600 700 800 9001000 >1000
010
2030
4050
FEATURE INTERVAL IN DAYS
NU
MB
ER
OF
FE
ATU
RE
S
<1 1 2 3 4 5 6 7 8 9 10 20 30 40 50 60 70 80 90 100 >100
050
015
0025
00
IMR INTERVAL IN DAYS
NU
MB
ER
OF
IMR
s
<1 1 2 3 4 5 6 7 8 9 10 20 30 40 50 60 70 80 90 100 >100
020
0060
0010
000
1400
0
MR INTERVAL IN DAYS
NU
MB
ER
OF
MR
s
Fig. 4. Interval distributions. These histograms show the development interval distributionsfor features, IMRs, and MRs in number of days.
Parallel Changes in Large-Scale Software Development • 319
ACM Transactions on Software Engineering and Methodology, Vol. 10, No. 3, July 2001.

affected, the number of MRs involved, and the number of developersinvolved. Table I summarizes these data.
Figure 3 shows the frequency distributions of features, IMRs, and MRsbeing worked on per day. The feature and IMR distributions have means of25 and 22, and maximum values of 86 and 62, respectively. On the otherhand, there is a mean of 69 MRs open per day, and a maximum of morethan 200. Note that in all cases the tail is very long with respect to themean.
Figure 4 shows the frequency distributions of development intervals atthe three levels. The intervals are measured by taking the dates of the firstand last delta associated with that feature, IMR, or MR, and computing thedifference. Thus the interval reflects the activity only with respect to
1 2 3 4 5 6 7 8 9 10 20 30 40 50 60 70 80 90 100 >100
020
4060
FILES AFFECTED BY FEATURE
NU
MB
ER
OF
FE
ATU
RE
S
1 2 3 4 5 6 7 8 9 10 20 30 40 50 60 70 80 90 100 >100
050
015
0025
00
FILES AFFECTED BY IMR
NU
MB
ER
OF
IMR
s
1 2 3 4 5 6 7 8 9 10 20 30 40 50 60 70 80 90 100 >100
050
0015
000
2500
0
FILES AFFECTED BY MR
NU
MB
ER
OF
MR
s
Fig. 5. Files touched. These histograms show the distributions of number of files affected perfeature, IMR, and MR.
320 • D. E. Perry et al.
ACM Transactions on Software Engineering and Methodology, Vol. 10, No. 3, July 2001.

coding.4 One observation here is that the shapes of all three distributionsappear to be similar, even though their scales are orders of magnitudeapart. Also, 46% of the IMRs and 50% of the MRs are opened and solved onthe same day. Nevertheless, the tails here are even longer with respect tothe mean than in Figure 3.
Figure 5 shows the frequency distributions on the number of filesaffected in implementing each feature, IMR, or MR. The number of files perfeature exhibits a very large tail distribution; 33% of the features affectedmore than 20 files. On the other hand, 51% of the IMRs and more than 90%of the MRs affect only one file.
Figure 6 shows the frequency distributions on the number of MRs it tookto implement each feature and IMR. The number of MRs per feature againexhibits a large tail; 25% of the features needed more than 20 MRs. The tailfor IMRs, while not as long as that for features, is still significant with amaximum of 86 needed for the largest IMR, while the mean is less than 3.
Figure 7 shows the frequency distributions on the number of developersworking on each feature and IMR.5 The number of developers working on afeature does not have as large a tail as the number of MRs per feature, butthere were still more than 20 features which involved more than 10
4For instance, the feature interval measured excludes other feature activities like estimation,planning, requirements, design, and feature test.5Because of the way MRs are defined and tracked within the software process, there can beonly one developer per MR.
1 2 3 4 5 6 7 8 9 10 20 30 40 50 60 70 80 90 100 >100
020
4060
80
MRs PER FEATURE
NU
MB
ER
OF
FE
ATU
RE
S
1 2 3 4 5 6 7 8 9 10 20 30 40 50 60 70 80 90 100 >100
010
0030
00
MRs PER IMR
NU
MB
ER
OF
IMR
Fig. 6. Number of MRs used. These histograms show the distributions of number of MRsused in implementing each feature and IMR.
Parallel Changes in Large-Scale Software Development • 321
ACM Transactions on Software Engineering and Methodology, Vol. 10, No. 3, July 2001.

developers, with the largest feature involving 98 developers. Similarly, themean is 1.1 developer per IMR, but the tail stretches out to a maximum of9. Note, however, that the percentage of IMRs requiring more than onedeveloper is only 10%.
4.3 Parallel Development within a File
The preceding discussion does not show how these parallel activitiesinteract with each other, particularly in the case when several of themmake changes to the same file. Figure 8 shows the distribution of thenumber of features, IMRs, developers, and MRs affecting each file over thelifetime of the file.
To illustrate further, Figure 9 shows the different levels of ongoingactivity for a certain file. This clearly shows that parallel activities aregoing on at every level.
4.4 Parallel Versions
The set of changes belonging to a feature, IMR, MR, and developer can bethought of as creating different versions of the code. Among these, MRs arethe atomic component. Hence, in the subsequent discussion, we will useparallel MR activity as the basic unit of parallel development.
Figure 10 shows, that in the interval when Release I6 was beingdeveloped, about 60% of the files are touched by multiple MRs. Note also
1 2 3 4 5 6 7 8 9 10 20 30 40 50 60 70 80 90 100 >100
050
100
150
DEVELOPERS PER FEATURE
NU
MB
ER
OF
FE
ATU
RE
S
1 2 3 4 5 6 7 8 9 10 20 30 40 50 60 70 80 90 100 >100
010
0030
0050
00
DEVELOPERS PER IMR
NU
MB
ER
OF
IMR
s
Fig. 7. Number of developers involved. These histograms show the distributions of number ofMRs used in implementing each feature and IMR.
322 • D. E. Perry et al.
ACM Transactions on Software Engineering and Methodology, Vol. 10, No. 3, July 2001.

that the tail of the distribution is significant here—17% of the files aretouched by more than 10 MRs.
Figure 11 is a closeup of Figure 9. It magnifies the MR panel at oneperiod with high activity. It shows that at one time there were as many as8 open MRs affecting this file, with 4 of them having deltas on the sameday. We define PCmax, the maximum number of concurrently open MRs perday over the entire lifetime of the file, as our initial measure of the degreeof parallel change. (For the file in Figure 9, PCmax 5 9.) We computedPCmax for each file in the subsystem. The average PCmax is 1.73, whichtranslates to nearly 2 active variants at a given time. One file had a PCmax
1 2 3 4 5 6 7 8 9 10 20 30 40 50 60 70 80 90 100 >100
020
060
010
00
FEATURES PER FILE
NU
MB
ER
OF
FIL
ES
1 2 3 4 5 6 7 8 9 10 20 30 40 50 60 70 80 90 100 >100
020
040
060
080
0
IMRs PER FILE
NU
MB
ER
OF
FIL
ES
1 2 3 4 5 6 7 8 9 10 20 30 40 50 60 70 80 90 100 >100
010
030
050
0
MRs PER FILE
NU
MB
ER
OF
FIL
ES
1 2 3 4 5 6 7 8 9 10 20 30 40 50 60 70 80 90 100 >100
020
060
0
DEVELOPERS PER FILE
NU
MB
ER
OF
FIL
ES
Fig. 8. Number of features, IMRs, MRs, and developers per file. These histograms show thedistribution of the number of features, IMRs, MRs, and developers affecting each file over thelifetime of the file.
Parallel Changes in Large-Scale Software Development • 323
ACM Transactions on Software Engineering and Methodology, Vol. 10, No. 3, July 2001.
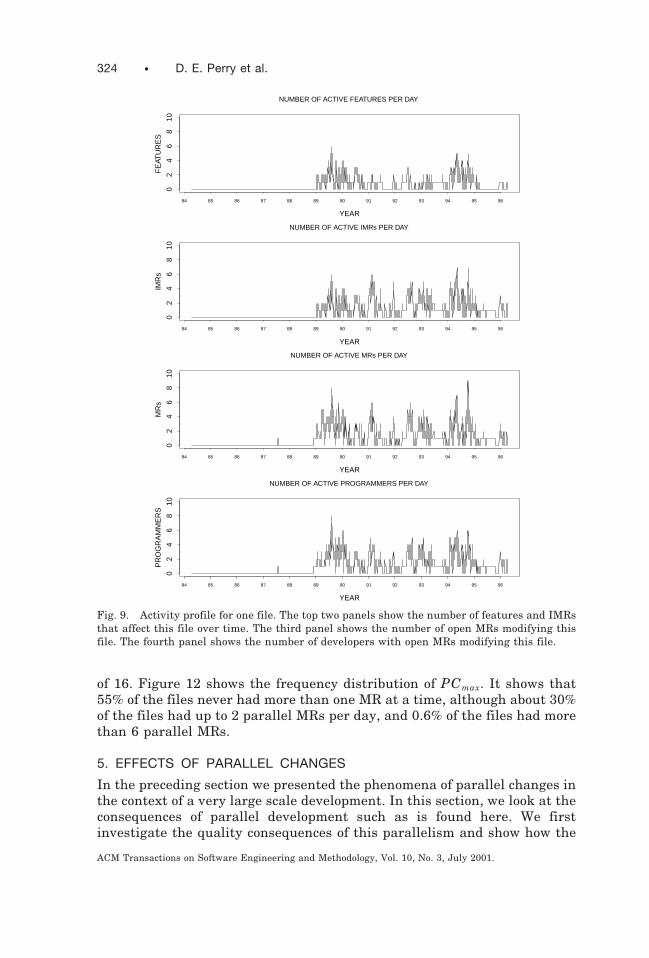
of 16. Figure 12 shows the frequency distribution of PCmax. It shows that55% of the files never had more than one MR at a time, although about 30%of the files had up to 2 parallel MRs per day, and 0.6% of the files had morethan 6 parallel MRs.
5. EFFECTS OF PARALLEL CHANGES
In the preceding section we presented the phenomena of parallel changes inthe context of a very large scale development. In this section, we look at theconsequences of parallel development such as is found here. We firstinvestigate the quality consequences of this parallelism and show how the
YEAR
FE
ATU
RE
S
02
46
810
NUMBER OF ACTIVE FEATURES PER DAY
84 85 86 87 88 89 90 91 92 93 94 95 96
YEAR
IMR
s
02
46
810
NUMBER OF ACTIVE IMRs PER DAY
84 85 86 87 88 89 90 91 92 93 94 95 96
YEAR
MR
s
02
46
810
NUMBER OF ACTIVE MRs PER DAY
84 85 86 87 88 89 90 91 92 93 94 95 96
YEAR
PR
OG
RA
MM
ER
S
02
46
810
NUMBER OF ACTIVE PROGRAMMERS PER DAY
84 85 86 87 88 89 90 91 92 93 94 95 96
Fig. 9. Activity profile for one file. The top two panels show the number of features and IMRsthat affect this file over time. The third panel shows the number of open MRs modifying thisfile. The fourth panel shows the number of developers with open MRs modifying this file.
324 • D. E. Perry et al.
ACM Transactions on Software Engineering and Methodology, Vol. 10, No. 3, July 2001.

higher the degree of parallelism, the higher the number of defects. We thenlook at one of the possible root causes of these quality problems, interferingchanges, and discuss the most obvious cases of interference: changes on topof previous changes, and changes made within very close temporal proxim-ity to each other.
5.1 Implication on Quality
To examine the impact of parallel changes on software quality, we exam-ined the defect distribution of the files for each value of PCmax. We countedas a defect every MR whose purpose is to correct a problem in the file. TheMR classification was done automatically by analyzing the MR descriptionsfor known keywords. The paper by Mockus and Votta [2000] describes theMR classification method in more detail.
In order to avoid double-counting the MRs, we recomputed the paralleldevelopment measure including only MRs opened up to 1994, and weplotted it against the number of defects discovered from 1994 to 1996. Theresults are shown in the boxplot in Figure 13.6 The plot shows that filesthat have high degrees of parallel changes also tend to have more defects.
6Boxplots are a compact way to represent data distributions. Each data set is represented by abox whose height spans the central 50% of the data. The upper and lower ends of the box markthe upper and lower quartiles. The data’s median is denoted by a bold point within the box.The dashed vertical lines attached to the box indicate the tails of the distribution; they extend
0 1 2 3 4 5 6 7 8 9 10 >10
020
040
060
0
NUMBER OF MRs ON THE SAME FILE IN THE INTERVAL OF I6
NU
MB
ER
OF
FIL
ES
25%
17.2%
10.6%
7.2%6.2%
4.6%4.1%
2.5% 2.4% 2.1%1.4%
16.7%
Fig. 10. Distribution of number of MRs touching each file in the development interval ofRelease I6. Bar N shows the number of files which were touched by N MRs during thedevelopment interval of Release I6.
Parallel Changes in Large-Scale Software Development • 325
ACM Transactions on Software Engineering and Methodology, Vol. 10, No. 3, July 2001.

to the standard range of the data (1.5 times the interquartile range). The detached points are“outliers” lying beyond this range [Chambers et al. 1983].
TIME
MR
sMR ACTIVITY
8/1/
89
8/2/
89
8/3/
89
8/4/
89
8/5/
89
8/6/
89
8/7/
89
8/8/
89
8/9/
89
8/10
/89
8/11
/89
8/12
/89
8/13
/89
8/14
/89
8/15
/89
8/16
/89
8/17
/89
8/18
/89
8/19
/89
8/20
/89
8/21
/89
8/22
/89
8/23
/89
8/24
/89
8/25
/89
8/26
/89
8/27
/89
8/28
/89
8/29
/89
8/30
/89
8/31
/89
ABCDEFGHIJKLMN
TIME
OP
EN
MR
s
02
46
810
NUMBER OF ACTIVE MRs PER DAY
8/1/
89
8/2/
89
8/3/
89
8/4/
89
8/5/
89
8/6/
89
8/7/
89
8/8/
89
8/9/
89
8/10
/89
8/11
/89
8/12
/89
8/13
/89
8/14
/89
8/15
/89
8/16
/89
8/17
/89
8/18
/89
8/19
/89
8/20
/89
8/21
/89
8/22
/89
8/23
/89
8/24
/89
8/25
/89
8/26
/89
8/27
/89
8/28
/89
8/29
/89
8/30
/89
8/31
/89
Fig. 11. A closer look at MR activity. This is a closer look at the MR activity during one busyperiod (8/89) of the file in Figure 9. Each line in the top panel shows the lifespan of an MRbeing worked on during this period, from the date it was opened until the date it was closed.The X’s indicate when deltas were made into the file. The solid line in the bottom panel showsthe number of open MRs on each of those days. It is a magnification of the MR panel fromFigure 9. The dotted line shows the number of deltas actually made on each day.
Table II. Analysis of Variance. This table shows the contributions of various factors to thevariance in number of defects. The column of major interest is the last one, which gives thesignificance of the contribution of each factor to the variance. As shown here, every factor is
significant except lifetime.
Degrees ofFreedom
Sum ofSquares
MeanSquares F Value Significance
Number of deltas 1 14379 14379 3288 0.0000File lifetime 1 4 4 1 0.3298Creation date 1 548 548 125 0.0000File size 1 164 164 38 0.0000Past faults 1 241 241 57 0.0000Parallel changes ~PCmax! 1 213 213 50 0.0000Residuals 3266 13936 4
326 • D. E. Perry et al.
ACM Transactions on Software Engineering and Methodology, Vol. 10, No. 3, July 2001.

We then performed an analysis of variance (ANOVA) [Box et al. 1978] toaccount for the effects of other factors believed to contribute to thelikelihood of increasing the number of defects [Graves et al. 2000]. Weexamined the following: file creation date (date the first delta was made),lifetime of file (from file creation date up to 1994 or the date of last delta,whichever came first), total number of deltas made between 1984–1994,size of file at 1994, and past faults found in the file between 1984–1994.The results are shown in Table II. The sum of squares and correspondingsignificance probabilities were computed from the first factor to the last.The table shows, that even after accounting for all of these other factors,the degree of parallel changes PCmax makes a significant contribution tothe variance of the defect distribution. (See the appendix for more detailedexplanation.)
We also ascertained that the results were not an artifact of the measureof degree of parallel changes that we defined. We had been using PCmax,the maximum number of MRs open in parallel, as our degree of parallelchanges (e.g., for the file in Figure 9, PCmax 5 9). Another measure of thedegree of parallel changes is to count, for each file, the number of days inwhich more than one MR was open. We label this as PCdays. Figure 14shows the distribution of PCdays against defect count (cor 5 0.63). When wereplaced PCmax with PCdays in the ANOVA model, the results remainedsignificant.
1 2 3 4 5 6 >6
050
010
0015
0020
00
MAXIMUM NUMBER OF PARALLEL MRs PER FILE
NU
MB
ER
OF
DAY
S55.7%
28.4%
9.2%
3.4%1.9% 0.8% 0.6%
Fig. 12. Maximum number of parallel MRs per file. This histogram shows the distribution ofPCmax, the maximum number of parallel MRs that affected each file in a day.
Parallel Changes in Large-Scale Software Development • 327
ACM Transactions on Software Engineering and Methodology, Vol. 10, No. 3, July 2001.

Yet another measure of parallel changes is to take the number of dayswith more than one open MR and weigh each day by the number of openMRs. We label this as PCwdays. Figure 15 shows the distribution of PCwdays
against defect count (cor 5 0.62). When we used PCwdays in the ANOVAmodel, the results again remained significant. Table III compares the threemeasures of the degree of parallel changes. Of these three, PCdays appearsto be the best measure.
5.2 Interfering Changes
Thus far, we have examined the amount of parallel activities going on andhow it might contribute to quality problems. We have not actually delvedinto the mechanisms by which parallel changes could cause defects. In this
010
2030
4050
60
1 2 3 4 5 6 >6
MAXIMUM MRs PER DAY PER FILE (1984-1994)
NU
MB
ER
OF
FA
ULT
S (
1994
-199
6)
Fig. 13. Parallel development ~PCmax! vs. number of defects. This boxplot shows the numberof defects for each file, grouped by degree of parallel changes.
Table III. Three Measures of Degree of Parallel Changes. This table compares thecontribution of the three measures of the degree of parallel changes. The sum of squares, Fvalues, and significance values are obtained when each one replaces the parallel-changes
entry in the ANOVA table in Table II.
Degrees ofFreedom
Sum ofSquares
MeanSquares F Value Significance
Maximum parallel MRs ~PCmax! 1 213 213 50 0.0000Number of days with parallel MRs ~PCdays! 1 705 705 171 0.0000Weighted number of days ~PCwdays! 1 551 551 132 0.0000
328 • D. E. Perry et al.
ACM Transactions on Software Engineering and Methodology, Vol. 10, No. 3, July 2001.

section, we provide results of our initial investigation into parallel changesthat interfere with each other.
Upon analyzing the delta data, we found that 12.5% of all deltas aremade to the same file by different developers within 24 hours of each other.Given this high degree of parallel development, it seems likely thatchanges by one developer will interfere with changes made by anotherdeveloper. For this study we have looked at the prima facie case wherechanges interfere by one change physically overlapping another. For exam-ple, Figure 16 traces several versions of the file examined in Figure 9, asfive deltas were applied to it during a 24-hour period. Developer A madethree deltas, the first two of which did not affect this fragment of code.Then developer B put in changes on top of A’s changes. Finally some of B’schanges were modified by developer C on the same day.
Across the subsystem, 3% of the deltas made within 24 hours by differentdevelopers physically overlap each others’ changes. Note that physicaloverlap is just one way by which one developer’s changes can interfere withothers. We believe that many more conflicts arise as a result of parallelchanges to the same data flow or program slice—i.e., conflicts arise as aresult of semantic interference.
LOG[NUMBER OF DAYS WITH PARALLEL MRs (1984-1994)]
LOG
[NU
MB
ER
OF
DE
FE
CT
S (
1994
-199
6)]
0 2 4 6
01
23
4
Fig. 14. PCdays (number of days with parallel MRs) vs. number of defects. This scatterplotshows the number of defects for each file, plotted against PCdays, the number of days the filehad parallel MRs. A log transformation was applied to both axes to spread the points. Inaddition, a small random offset was added to each point to expose overlapping points.
Parallel Changes in Large-Scale Software Development • 329
ACM Transactions on Software Engineering and Methodology, Vol. 10, No. 3, July 2001.

6. VALIDITY
In any study, there are three aspects of validity that must be considered inestablishing the credibility of that study: construct validity, internal valid-ity, and external validity. We consider each of these in turn.
We have operationalized the definition of parallel changes in severalways. First, we looked at the level of parallel development with respect todifferent levels (release, feature, IMR, MR, and file). Second, in deriving asummary measure of the degree of parallel development for use in thequality model, we looked at multiple measures and showed that they areconsistent with each other. Thus we argue that we have the necessaryconstruct validity.
As can be seen from the data as we have presented them, we have doneonly the minimal amount of data manipulation and then only to put it intoeasily understood forms of summarization. Also, in the quality study, wehave sought to account for other factors that may affect the number ofdefects in the software. Thus we argue that we have the necessary internalvalidity.
It is in the context of external validity that we must be satisfied witharguments weaker than we would like. We argue from extra data (namely,visualizations of the entire 5ESS system similar to Figure 1) that this
LOG[WEIGHTED NUMBER OF DAYS WITH PARALLEL MRs (1984-1994)]
LOG
[NU
MB
ER
OF
DE
FE
CT
S (
1994
-199
6)]
0 2 4 6 8
01
23
4
Fig. 15. PCwdays (weighted number of days with parallel MRs) vs. number of defects. Thisscatterplot shows the number of defects for each file, plotted against PCwdays, the number ofdays the file had parallel MRs, weighted by the number of parallel MRs per day. Transforma-tions were applied as in Figure 14.
330 • D. E. Perry et al.
ACM Transactions on Software Engineering and Methodology, Vol. 10, No. 3, July 2001.

subsystem is sufficiently representative of the other subsystems to act astheir surrogate.
The primary problem then is the representativeness of 5ESS as anembedded real-time and highly reliable system. In its favor are the factsthat it is built using a common programming language (C) and develop-ment platform (UNIX). Also in its favor are the facts that it is an extremelylarge and complicated system development and that problems encounteredhere are at least as severe as those found in smaller and less complicateddevelopments. Finally, it follows an ISO 9000-compliant process that hasconsistently received a CMM [Paulk et al. 1993] rating of 2 and satisfiesmost of the process areas for levels 3 and 4, the same as, if not better than,a good number of software organizations in the industry. Thus, we arguethat our data have a good level of external validity and are generalizable toother developments of similar domains.
7. SUMMARY AND EVALUATION
In systems such as 5ESS which evolve over a long period of time, theamount of the system that changes remains relatively constant with the
DELTA - DEVELOPER
PR
OG
RA
M L
INE
NU
MB
ER
(M
AG
NIF
IED
VIE
W)
Base 1 A 2 A 3 A 4 B 5 C
7950
7930
7910
7890
7870
7850
Fig. 16. Lines changed per delta. Each vertical line represents a version of the file as it waschanged by a delta (denoted 1–5). The x-axis also encodes the developer who made the delta(denoted A–C). The delta sequence is read from left to right. The lines connecting the verticallines show where lines have been changed from one version to the next. Lines that divergeshow where new code was inserted while lines that converge show where code was deleted.The trapezoids show where code was changed. Note that this figure only shows a fragment ofeach program version, approximately from lines 7850–7950.
Parallel Changes in Large-Scale Software Development • 331
ACM Transactions on Software Engineering and Methodology, Vol. 10, No. 3, July 2001.

result that an increasing amount of the system remains unchanged [Leh-man et al. 1998]. Because of this, the situation has shifted from centraliz-ing knowledge of code, to centralizing knowledge of the features to be added(and thus distributing the knowledge of the code). Furthermore, whilefeatures have become the main unit of organization, their implementationsare not neat, tidy units added to the system, but bits and pieces distributedover existing units of code. Thus, we see that our four essential problems doindeed compound the problems of parallel development.
7.1 Study Summary
This work represents initial empirical investigations to understand thenature of large-scale parallel development. The data show in this sub-system that:
—There are multiple levels of parallel development. Each day, there isongoing work on multiple MRs by different developers solving differentIMRs belonging to different features within different releases of twosimilar products aimed at distinct markets.
—The activities within each of these levels cut across common files. Twelveand one half percent of all deltas are made by different developers to thesame files within a day of each other, and some of these may interferewith each other.
—Over the interval of a particular release (I6), the number of files changedby multiple MRs is 60% which, while not directly concurrent, is concur-rent with respect to the release. These may also have interfering chang-es—though we would expect the degree of awareness of the implicationsof these changes to be higher than those made within one day of eachother.
—There is a significant correlation between files with a high degree ofparallel development and the number of defects. Moreover, even account-ing for lifetime, size, and number of deltas, the degree of parallel changesmakes a significant contribution to the variance of the defect distribu-tion.
The data presented illustrate the problems of evolution, scale, andmultiple dimensions of organization described in Section 1: of evolutionbecause of the increasing number of releases that needed to be maintained;of scale because of the sheer number of parallel activities going on within arelease interval; and of organization because the parallel activities are notindependent, but that at some point they need to coordinate, especially ifthey are modifying common files.
7.2 Evaluation of Current Support
As we mentioned in Subsection 4.2, the histograms provide a criticalpicture of the problems that need to be solved. In particular, the tail valuesof the distributions are the significant factors to consider in technical
332 • D. E. Perry et al.
ACM Transactions on Software Engineering and Methodology, Vol. 10, No. 3, July 2001.

support, not the mean values. In both the cases of workspaces and merging,we claim that those critical factors have not been understood or appreci-ated.
7.2.1 Management of Parallel Changes. The data in Subsection 4.2suggests that if each MR had its own workspace we would then need on theorder of 70 to 200 workspaces per day for this particular subsystem. (Andthis is just one of 50 5ESS subsystems!) Moreover, since 50% of MRs aresolved in less than a day, the cost and complexity of constructing anddestroying workspaces becomes very important. One might reduce thenumber of workspace per day by assuming one workspace per IMR or perfeature. Doing so introduces further coordination problems, since theremay be more than one developer working on the IMR or feature.
Given the multilevel nature of feature development, one might imaginethe need for a hierarchical set of workspaces [Kaiser and Perry 1987] suchthat there is a workspace for each feature, a subset of workspaces for eachIMR for that feature, and then individual workspaces for each MR. Ineither case, further studies are needed to determine the costs and utility ofworkspaces in supporting the phenomena we have found in this study.
7.2.2 Integration of Parallel Changes. The utility of the current state ofmerge support depends on the level of interference versus noninterference.The data in Subsection 4.4 indicate that about 45% of the files can have 2 to16 parallel versions. While ClearCase claims to be able to merge up to 32parallel versions, conflicts still have to be resolved manually. It is not clearhow well current merge technologies will be able to support this degree ofparallel versions if there are interfering changes, as suggested by the defectdata. The data we have uncovered certainly lead us to be sympathetic withAdele’s claim that frequent updates are necessary for coordinated changesand that waiting until commit time will lead to parallel versions thatcannot be merged without some very costly overhead and coordinatedeffort. In fact, their supported strategy is what is left unsupported in thesedevelopments reported here.
Further studies are needed to assess the validity and utility of mergetechnologies. We note in Section 7.5 one such study that will help to assessthis area.
7.2.3 Synchronize and Build. In terms of effort needed to obtain aconsistent build, the synchronize and build strategy poses a scalabilityproblem in this context. To ensure logical completeness of changes, allchanges related to a feature should be checked in together. However,features are too coarse-grained as units of synchronization, since theyfrequently involve a large number of files, with 33% of all features affectingmore than 20 files and a maximum of 906 files as shown in Table I. Thecurrent build process synchronizes at the MR level. This does not pose aproblem, since more than 90% of MRs touch only single files. However, eachMR represents only a partial solution to a problem, and failure to includeall the dependent MRs has been a common cause of build problems. At the
Parallel Changes in Large-Scale Software Development • 333
ACM Transactions on Software Engineering and Methodology, Vol. 10, No. 3, July 2001.

IMR level, 50% touch more than one file, and 15% touch more than 5 files.This increases the likelihood of conflicts, especially for certain central files.Moreover, an IMR may still not be logically complete because IMRssometimes depend on MRs belonging to other IMRs. Further studies areneeded to understand the optimal build strategy.
7.3 Process and Project Management
Because of the direct correlation between the degree of parallelism and anincreased number of defects, process and project management need to takea careful look at how to support the development process at this particularpoint. A study of the software development organization which maintainsthis subsystem yielded two results relevant to parallel development, (1) afocus toward development interval reduction by gradually shifting from acode ownership model—in which a developer was designated to be the“owner” of one or more modules of code—to a feature ownership model—inwhich a developer was authorized to make all the changes necessary toimplement a given feature or fix, and (2) a trend toward features that cutacross an increasingly larger number of modules [Staudenmayer et al.1998]. While the orientation towards feature development has usefulproperties for evolving and marketing the product, the resulting paralleldevelopment by multiple developers compared to that with file ownershipposes significant problems that need to be carefully managed.
As it is very likely that the changes done in parallel conflict with eachother, it is very important that the developers making the concurrentchanges understand what each other is doing and how their changesinteract with each other. This is the area where tool support is needed.Where these interdependencies cannot be managed automatically, theymust be managed manually.
Much of the current coordination is done informally between developerswhere they know there are conflicts. The conceptual distance between thechanges exacerbates the problem and increases the need for explicit coordi-nation—i.e., developers working on the same IMRs are likely to understandhow the changes fit together much better than those working on differentfeatures in different releases.
7.4 Contributions
In our observational case study, we have established that
—parallel development is a significant factor in large-scale software devel-opment;
—current tool, process, and project management support for this level ofparallelism is inadequate; and
—there is a significant correlation between the degree of parallelism andthe number of defects.
334 • D. E. Perry et al.
ACM Transactions on Software Engineering and Methodology, Vol. 10, No. 3, July 2001.

In addition, we have provided a novel form of visualization for thedifferences within a sequence of versions of a file, showing where code hasbeen inserted, deleted, and replaced (see Figure 16).
7.5 Future Directions
We have looked at only the prima facie conflicts, namely, those where thereare changes on changes or changes within a day of each other. A moreinteresting class of conflicts are those which we might term semanticconflicts. These cases arise where changes are made to the same slices ofthe program and hence may interfere with each other logically rather thansyntactically. This phenomena requires us to look very closely at the filesthemselves rather than just the change management data. Our plans forthis analysis include combining the use of dataflow and slicing analysistechniques to determine when semantic interference occurs.
Given the appropriate analysis techniques, we will then look at a subsetof the files to determine the degree of interference associated with variousdegrees of parallelism and to establish the correlation with the existingdefect data.
APPENDIX
REVIEW OF ANOVA
This appendix gives some additional explanations of the ANOVA table inTable II.
The first column gives the source of variation or the factors beingconsidered.
The second column is the degrees of freedom, which is always 1 fornumeric variables. For the residuals, it is the difference between thenumber of points in the analysis and the number of degrees of freedom usedup by the factors being considered.
The third column (sum of squares) is obtained as follows:
(1) for the first factor (e.g., number of deltas), fit a linear regression linebetween that factor and the number of faults; then sum up the squaresof the differences between each of the files’ number of faults and thecorresponding value fitted from the regression;
(2) for the second factor, fit a linear regression line between that factor andthe residuals from the first regression, and repeat the sum of squarescalculation;
(3) for the third factor, fit a linear regression line between that factor andthe residuals from the second regression and repeat the sum-of-squarescalculation;
(4) and so on.
The fourth column is the mean square, which is just the sum of squaresdivided by the degrees of freedom.
Parallel Changes in Large-Scale Software Development • 335
ACM Transactions on Software Engineering and Methodology, Vol. 10, No. 3, July 2001.

The fifth column is the F statistic, which is the ratio of the mean squareof each factor divided by the mean square of the residuals, and can bethought of as a measure of how real the contribution of each factor isrelative to chance (the larger the number, the higher the likelihood of a realeffect).
The last column is the significance of the F statistic (a value less than0.05 is usually considered significant).
Note, that because the factors are not all independent of each other andbecause of the way the sum of squares are computed, the significancevalues are sensitive to the ordering of the factors. In this case, wepurposely put parallel changes at the end to see if they would still besignificant after all the other factors have been considered. As it turnedout, the contribution of parallel changes was significant regardless of itsposition in the ordering.
Introductory explanations of ANOVA can be found in most statisticstextbooks. In addition, there are several online references:
(1) David Stockburger. ANOVA: Why multiple comparisons using t-tests isnot the analysis of choice. http://www.psychstat.smsu.edu/introbook/sbk27.htm,
(2) David Lane. Partitioning the sums of squares. http://www.ruf.rice.edu/˜lane/hyperstat/B83612.html.
ACKNOWLEDGMENTS
The Code Decay Project [Eick et al. 2001 is a multidisciplinary andmultiinstitution project for which a common infrastructure has been cre-ated in support of multiple strands of software engineering research. Wethank several members of the project, Audris Mockus and Todd Graves,who extracted and prepared the change data into a form we could use. Wealso thank Dave Atkins who helped us to better understand the current5ESS software development process.
REFERENCES
BOX, G. E., HUNTER, W. G., AND HUNTER, J. S. 1978. Statistics for Experimenters. John Wileyand Sons, Inc., New York, NY.
BROOKS, F. P. 1987. No silver bullet: Essence and accidents of software engineering. IEEEComputer 20, 4 (Apr.), 10–19.
CHAMBERS, J. M., CLEVELAND, W. S., KLEINER, B., AND TUKEY, P. A. 1983. Graphical Methodsfor Data Analysis. Wadsworth Publ. Co., Belmont, CA.
CLEMM, G. AND OSTERWEIL, L. 1990. A mechanism for environment integration. ACM Trans.Program. Lang. Syst. 12, 1 (Jan.), 2–25.
CUSUMANO, M. A. AND SELBY, R. W. 1995. Microsoft Secrets. The Free Press, New York, NY.EICK, S. G., GRAVES, T. L., KARR, A. F., MARRON, J. S., AND MOCKUS, A. 2001. Does code decay?
Assessing the evidence from change management data. IEEE Trans. Softw. Eng. 27, 1(Jan.), 1–12.
ESTUBLIER, J. 1994. The Adele configuration manager. In Configuration Management, W. F.Tichy, Ed. Trends in Software, vol. 2. John Wiley and Sons, Inc., New York, NY, 99–133.
336 • D. E. Perry et al.
ACM Transactions on Software Engineering and Methodology, Vol. 10, No. 3, July 2001.

GLASSER, B. G. AND STRAUSS, A. L. 1967. The Discovery of Grounded Theory: Strategies forQualitative Research. Aldine-Atherton, Chicago, IL.
GRAVES, T. L., KARR, A. F., MARRON, J. S., AND SIY, H. P. 2000. Predicting fault incidenceusing software change history. IEEE Trans. Softw. Eng. 26, 7 (July), 653–661.
GRINTER, R. E. 1997. Doing software development: Occasions for automation andformalisation. In Proceedings of the Fifth European Conference on Computer SupportedCooperative Work (ECSCW’97), J. Hughes, Ed. Kluwer Academic, Dordrecht, Netherlands.
HORWITZ, S., PRINS, J., AND REPS, T. 1989. Integrating noninterfering versions of programs.ACM Trans. Program. Lang. Syst. 11, 3 (July), 345–387.
JUDD, C. M., SMITH, E. R., AND KIDDER, L. H. 1991. Research Methods in Social Relations.Harcourt Brace Jovanovich College Publishers.
KAISER, G. E. AND PERRY, D. E. 1987. Workspaces and experimental databases: Automatedsupport for software maintenance and evolution. In Proceedings of the 1987 InternationalConference on Software Maintenance (Austin, TX, Sept.). 108–114.
LEBLANG, D. B. 1994. The CM challenge: Configuration management that works. InConfiguration Management, W. F. Tichy, Ed. Trends in Software, vol. 2. John Wiley andSons, Inc., New York, NY, 1–38.
LEHMAN, M. M., PERRY, D. E., AND RAMIL, J. F. 1998. Implications of evolution metrics onsoftware maintenance. In Proceedings of the International Conference on Software Mainte-nance (Nov.). 208–217.
MAHLER, A. 1994. Variants: keeping things together and telling them apart. In ConfigurationManagement, W. F. Tichy, Ed. Trends in Software, vol. 2. John Wiley and Sons, Inc., NewYork, NY, 73–97.
MARTERSTECK, K. AND SPENCER, A. 1985. Introduction to the 5ESSTM switching system.AT&T Tech. J. 64, 6 (July-Aug.), 1305–1314.
MOCKUS, A. AND VOTTA, L. 2000. Identifying reasons for software changes using historicdatabases. In Proceedings of the 2000 International Conference on Software Maintenance(San Jose, CA).
PAULK, M., CURTIS, B., CHRISSIS, M., AND WEBER, C. 1993. Capability maturity model forsoftware: Version 1.1. Tech. Rep. CMU/SEI-93-TR-24. Software Engineering Institute,Carnegie Mellon University, Pittsburgh, PA.
PERRY, D. E. 1989. The Inscape environment. In Proceedings of the 11th InternationalConference on Software Engineering (ICSE ’89, May). IEEE Press, Piscataway, NJ, 2–12.
PERRY, D. E. 1996. System compositions and shared dependencies. In Proceedings of the 6thWorkshop on Software Configuration Management (Berlin, Germany, Mar.).
ROCHKIND, M. J. 1975. The source code control system. IEEE Trans. Softw. Eng. SE-1, 4(Dec.), 364–370.
STAUDENMAYER, N., GRAVES, T., MARRON, J. S., MOCKUS, A., PERRY, D., SIY, H., AND VOTTA,L. 1998. Adapting to a new environment: How a legacy software organization copes withvolatility and change. In Proceedings of the 5th International Product DevelopmentManagement Conference (Como, Italy, May).
TICHY, W. 1982. Design, implementation and evaluation of a revision control system. InProceedings of the 6th International Conference on Software Engineering (ICSE ’82, Tokyo,Japan, Sept.). IEEE Computer Society Press, Los Alamitos, CA, 58–67.
TUSCANY, P. A. 1987. Software development environment for large switching projects. InProceedings of the Conference on Software Engineering for Telecommunications SwitchingSystems.
YIN, R. K. 1994. Case Study Research: Design and Methods. 2nd ed. Sage Publications, Inc.,Thousand Oaks, CA.
Received: September 1998; revised: September 2000; accepted: November 2000
Parallel Changes in Large-Scale Software Development • 337
ACM Transactions on Software Engineering and Methodology, Vol. 10, No. 3, July 2001.


![Large-scale changes in observed daily maximum and minimum ...hadobs.metoffice.gov.uk/hadghcnd/HadGHCND_paper.pdf · [2] Long-term, global-scale, gridded monthly tempera-ture data](https://static.fdocuments.net/doc/165x107/5f01c8a77e708231d4010408/large-scale-changes-in-observed-daily-maximum-and-minimum-2-long-term-global-scale.jpg)


