
ParA - Duke University
145
Structural and Biochemical Characterization of an Archaeal ParA Protein by Jeehyun Lee Department of Biochemistry Duke University Date:_______________________ Approved: ___________________________ Maria A Schumacher, Supervisor ___________________________ David C Richardson ___________________________ Richard G Brennan ___________________________ Harold P Erickson Dissertation submitted in partial fulfillment of the requirements for the degree of Doctor of Philosophy in the Department of Biochemistry in the Graduate School of Duke University 2015
Transcript of ParA - Duke University

Structural and Biochemical Characterization of an Archaeal ParA Protein
by
Jeehyun Lee
Department of Biochemistry
Duke University
Date:_______________________
Approved:
___________________________
Maria A Schumacher, Supervisor
___________________________
David C Richardson
___________________________
Richard G Brennan
___________________________
Harold P Erickson
Dissertation submitted in partial fulfillment of
the requirements for the degree of Doctor
of Philosophy in the Department of
Biochemistry in the Graduate School
of Duke University
2015

ABSTRACT
Structural and Biochemical Characterization of an Archaeal ParA Protein
by
Jeehyun Lee
Department of Biochemistry
Duke University
Date:_______________________
Approved:
___________________________
Maria A Schumacher, Supervisor
___________________________
David C Richardson
___________________________
Richard G Brennan
___________________________
Harold P Erickson
An abstract of a dissertation submitted in partial
fulfillment of the requirements for the degree
of Doctor of Philosophy in the Department of
Biochemistry in the Graduate School of
Duke University
2015

Copyright by
Jeehyun Lee
2015
iv
Abstract
DNA partition or segregation is the process that ensures the stable inheritance of
genomic material. The majority of the bacterial plasmid and some chromosomal
partition systems utilize ParA Walker‐box‐based partition systems. These systems
require three components: a DNA centromere site, the ParA ATPase, and the ParB
centromere binding protein. ParB binds to the centromere to form the partition complex,
which then recruits the motor protein ParA. ParA mediates the partition of replicated
DNA by a still poorly understood mechanism. Notably, recent data indicates that ParA
Walker‐box‐based partition systems are employed not only by bacterial plasmids and
chromosomes but also DNA elements in archaea. The work in this thesis focused on a
homolog of the ParA protein from the first identified archaeal plasmid partition system,
located on the plasmid pNOB8. pNOB8 plasmid is harbored in the thermophilic
archaeaon, Sulfolobus solfataricus. The goals of this work were to structurally and
biochemically characterize the ParA homolog to gain insights into its function.
Towards these goals, the structure of the ParA homolog was solved by X‐ray
crystallography in its apo and ADP bound states to resolutions of 2.45 Å and 2.73 Å,
respectively. The overall structure was similar to bacterial ParA proteins. We next
demonstrated that, similar to bacterial ParA proteins, this ParA homolog harbored ATP‐
dependent nonspecific DNA capabilities by using fluorescence polarization based DNA
binding assays. By mutating the residues in the deviant Walker A motif, we were able to
demonstrate the importance of ATP binding in its DNA binding function. Moreover,
v
characterization of ATP and ADP binding were performed using ITC. Finally, we
observed that ParA was able to form polymers in the presence of ATP, using negative
stain electron microscopy. Our findings provide evidence that ParA Walker‐box‐based
partition systems, which are the most common systems in bacteria, appear to also be
found in archaea.

vi
Contents
Abstract ......................................................................................................................................... iv
List of Tables .................................................................................................................................. x
List of Figures ............................................................................................................................... xi
List of Abbreviations .................................................................................................................xiv
Acknowledgements ...................................................................................................................xvi
1. Introduction ............................................................................................................................... 1
1.1 Introduction to DNA partition ....................................................................................... 1
1.2 Type II partition system: Actin‐like ParM and ParR move plasmid by insertional
polymerization mechanism ................................................................................................... 3
1.3 Type III partition system: Tubulin/FtsZ‐like TubZ and TubR move plasmid by
tram‐like mechanism.............................................................................................................. 5
1.4 Type I partition system .................................................................................................... 6
1.4.1 Role of ParA in Type I partition ................................................................................ 7
1.4.2 ParA has ATP‐dependent polymerization and nonspecific DNA binding
activities ................................................................................................................................. 8
1.4.3 CBP has a critical role in stimulating the ATPase activity of ParA ...................... 9
1.4.4 Models for Type I partitioning ................................................................................ 10
1.4.5 Chromosomal ParA ................................................................................................... 12
1.5 Archaeal DNA partition system ................................................................................... 13
1.5.1 General introduction to Archaea ............................................................................. 13
1.5.2 Sulfolobus solfataricus ................................................................................................. 14
1.5.3 DNA partition machinery in pNOB8 plasmid ...................................................... 15
Chapter 2. Crystallography ....................................................................................................... 31
vii
2.1 Why X‐rays? .................................................................................................................... 31
2.2 Why Crystals? ................................................................................................................. 32
2.3 Symmetry ......................................................................................................................... 32
2.4 How does diffraction happen? ..................................................................................... 33
2.4.1 Bragg’s Law ................................................................................................................ 33
2.4.2 Ewald sphere .............................................................................................................. 34
2.5 How do we go from x‐ray diffraction data to electron density maps? ................... 35
2.6 Phase Determination ...................................................................................................... 37
2.6.1 Isomorphous replacement ........................................................................................ 37
2.6.2 MAD (Multiwavelength Anomalous Dispersion) ................................................ 38
2.6.3 Locating heavy atoms in the unit cell‐ Patterson map ......................................... 41
2.6.4 Molecular Replacement (MR) .................................................................................. 42
2.7 After obtaining the initial map ..................................................................................... 43
Chapter 3. Structural studies on ParA ..................................................................................... 56
3.1 Structure determination of ParA structures ............................................................... 58
3.2 Overall structure of ParA .............................................................................................. 58
3.3 The insert region ............................................................................................................. 59
3.4 ParA shares a set of conserved nucleotide binding motifs with other bacterial
Walker‐type family proteins ............................................................................................... 60
3.5 Dimerization interface ................................................................................................... 61
3.6 Structure of ParA‐ADP .................................................................................................. 61
3.7 ADP binding site ............................................................................................................ 62
3.8 Discussion ........................................................................................................................ 64
3.9 Experimental Procedures .............................................................................................. 65

viii
Chapter 4. Functional studies of ParA ..................................................................................... 81
4.1. ATP‐dependent nonspecific DNA binding studies using fluorescence
polarization based DNA binding assays ........................................................................... 83
4.2. Site‐directed mutagenesis studies ............................................................................... 84
4.2.1 ATP binding site (deviant Walker A motif) ........................................................... 84
4.2.2 Insert region ............................................................................................................... 84
4.2.3 Dimerization interface .............................................................................................. 85
4.3 ATP/ADP binding studies using Isothermal Titration Calorimetry ....................... 85
4.4. ATP‐dependent polymerization of ParA ................................................................... 86
4.5 Effect of DNA on ParA polymer formation ................................................................ 86
4.6 Discussion ........................................................................................................................ 87
4.6.1 DNA binding by ParA and ParA homologs .......................................................... 87
4.6.2 Assembly of proteins in the Walker‐type family of proteins .............................. 89
4.7 Experimental procedures .............................................................................................. 92
Chapter 5. Discussion and Conclusion .................................................................................. 105
5.1 Speculative Model for archaeal ParA mediated partition ...................................... 106
5.2 Comparison with closely related Min System in E. coli ......................................... 106
5.3 ParA‐like ATPases in other processes ....................................................................... 107
5.4 Future Directions .......................................................................................................... 108
Appendix. Protein‐protein interaction studies of RacA and DivIVA ............................... 110
Introduction ......................................................................................................................... 110
Result .................................................................................................................................... 112
Discussion ............................................................................................................................ 113
Experimental Procedures .................................................................................................. 113

ix
References .................................................................................................................................. 119
Biography ................................................................................................................................... 128
x
List of Tables
Table 1. Nomenclatures of ParA and ParB homologs ............................................................ 24
Table 2. Comparison between Type Ia and Type Ib par loci ................................................. 25
Table 3. Seven crystal lattice system ......................................................................................... 48
Table 4. The 14 Bravais lattices .................................................................................................. 49
Table 5. Crystallographic statistics for ParA apo and ParA‐ADP structures ..................... 80
Table 6. DNA binding studies of ParA mutants ..................................................................... 99
Table 7. Primers used for site‐directed mutagenesis ........................................................... 104
xi
List of Figures
Figure 1. General mechanism of DNA partition .................................................................... 18
Figure 2. Genetic organization of par loci ................................................................................ 19
Figure 3. The structures of ParM and ParR‐parC partition complex ................................... 20
Figure 4. The pushing mechanism of plasmid partition by Type II par system ................. 21
Figure 5. Structures of TubZ and TubR ................................................................................... 22
Figure 6. DNA partition by Type III par system ..................................................................... 23
Figure 7. Size comparison between ParA homologs .............................................................. 26
Figure 8. Position of plasmids maintained by Type I par loci ............................................... 27
Figure 9. Pulling mechanism by Type I par system ................................................................ 28
Figure 10. Comparison between two models for Type I DNA partition ............................ 29
Figure 11. Phylogenetic tree of life showing three domains of life ...................................... 30
Figure 12. The overview of X‐ray crystallography ................................................................. 45
Figure 13. Crystal lattice ............................................................................................................. 46
Figure 14. Unit cell ...................................................................................................................... 47
Figure 15. Derivation of Braggʹs Law ....................................................................................... 50
Figure 16. Ewaldʹs sphere describes diffraction in the reciprocal space ............................. 51
Figure 17. Isomorphous Replacement ...................................................................................... 52
Figure 18. Anomalous scattering by the heavy atom ............................................................. 53
Figure 19. Fluorescence scan of the Selenium ......................................................................... 54
Figure 20. A: Harker construction of SIRAS B: Harker construction of MAD. .................. 55
Figure 21. Sequence alignment of pNOB8 ParA and the ParA homolog. ........................... 68
Figure 22. Overall structure of ParA ........................................................................................ 69

xii
Figure 23. Structure comparisons of ParA homologs ............................................................ 70
Figure 24. The insert region ....................................................................................................... 71
Figure 25. Multiple sequence alignment of pNOB8 ParA and other ParA homologs. ..... 72
Figure 26. The Dimerization interface ...................................................................................... 73
Figure 27. Oligomeric state of ParA in solution determined by size exclusion
chromatography .......................................................................................................................... 74
Figure 28. Comparison between apo ParA and Par‐ADP structures .................................. 75
Figure 29. The ADP binding site ............................................................................................... 76
Figure 30. Close up view of the ADP binding site ................................................................. 77
Figure 31. Loop change upon ADP binding ............................................................................ 78
Figure 32. Purification and crystallization of ParA ................................................................ 79
Figure 33. ATP‐dependent nonspecific DNA binding activity of ParA. ............................. 96
Figure 34. Structure based site‐directed mutagenesis studies .............................................. 97
Figure 35. Site‐directed mutagenesis studies on deviant Walker A motif. ......................... 98
Figure 36. ITC isotherms of ATP binding and ADP binding of ParA ............................... 100
Figure 37. ATP‐dependent polymerization of ParA ............................................................ 101
Figure 38. ATP‐dependent polymer formation at 1 μM protein concentration ............... 102
Figure 39. Negative stain electron micrographs of ParA incubated with ATP in the
absence and presence of DNA in vitro. .................................................................................. 103
Figure 40. Schematic figure of the speculative model for archaeal ParA mediated
partition ...................................................................................................................................... 109
Figure 41. Chromosome segregation during sporulation in B. subtilis ............................. 115
Figure 42. Constructs of DivIVA (59‐164) and RacA (70‐184) used for the interaction
studies. ........................................................................................................................................ 116
Figure 43. ITC isotherms of DivIVA and RacA interactions. .............................................. 117

xiii
Figure 44. ITC control experiments. ....................................................................................... 118
xiv
List of Abbreviations
ATP: Adenosine‐5’‐triphosphate
ADP: Adenosine‐5’‐diphosphate
AMP‐PNP: Adenosine‐5’‐(β,γ‐imido)triphosphate, an ATP analog
B834(DE3): Methionine auxotroph for labeling target proteins with selenomethionine
BSA: Buried surface area
BL21(DE3): E. coli expression strain carrying T7 RNA polymerase and lysozyme gene
CBP: Centromere binding protein
DNA: Deoxyribonucleic acid
DTT: Dithiothreitol
E. coli: Escherichia coli
EM: Electron microscopy
FP: Fluorescence polarization
His‐tag: Hexa‐histidine tag
IPTG: Isopropyl‐β‐D‐thio‐galactoside
ITC: Isothermal titration calorimetry
Kd: Dissociation constant
MAD: Multiwavelength anomalous diffraction
MANT‐ATP: 2’(3’)‐O‐(N‐Methylanthraniloyl)‐Adenosine 5’‐Triphosphate
Mg: Magnesium

xv
Ni: Nickel
NTPase: Nucleotide triphosphatase
OD600: Optical density at 600 nm
PDB: Protein data bank
PEG: Polyethylene glycol
pET: Prokaryotic expression vector with T7 promoter and lacI
pH: Power of hydrogen
P‐loop: Phosphate binding loop
RMSD: Root mean square deviation
S75: Superdex‐75
SDS‐PAGE: Sodium dodecyl sulfate‐polyacrylamide gel electrophoresis
xvi
Acknowledgements
I would like to sincerely thank my mentor, Dr. Maria Schumacher, for her
guidance and support. She has encouraged me to be independent and confident as a
scientist. I would also like to thank all my committee members, Dr. Richard Brennan, Dr.
David Richardson, and Dr. Harold Erickson, for their valuable insights and suggestions
for my work.
All the past and present members in the Schumacher Lab have helped me
develop my project and thesis. I would like to acknowledge Dr. Schumacher for
collecting the MAD data and helping with the determination of the ParA apo structure.
And also, this document was thoroughly edited by Dr. Schumacher. Nam had been
helpful with the model building and refinement process. I would like to give him special
thanks for all the support and help he had provided me throughout my years of study.
I was really lucky to have Porsha, Bonnie, and Bob as my lab mates. I feel truly
grateful that I’ve got to spend my years in the lab with such a good people. I would also
like to thank members in the Brennan Lab. In particular, Jungki had been helpful with
all the biochemical experiments in the lab and also been supportive with life at Duke as
an international student.
I would also like to acknowledge Sara Milam and Desmond Moore from the
Erickson Lab for helping and performing the negative stain EM experiments. I would
also like to thank Amy, Margot, Peggy, Betty, Sharon, Ester and Marsha for all the
administrative work that had to be done and just for being so kind and friendly.

xvii
I would like to thank Dr. Ilhwan Kim and Chuljin Sunbae for all the help and
support from the beginning of my studies, and also each step of the way. I would also
like to thank Prof. Sangkee Rhee and Yangshin unnie in Korea for all your support.
Special thanks to friends at Duke, Kyuseon, Jiyeon, Sumi Unnie, Jihyun, Taerog
and friends at Hanmaum Church, especially Pastor Choi, Samonim, Heeeun, Tori Unnie
who were like family to me through the good and bad times, being far away from home.
To my parents, thank you for your constant encouragement and love. I am also
grateful to my sister and my baby brother who have always been supportive. I miss you
guys everyday. Finally, to my loving husband, Namina Paik, I am extremely grateful for
the love and support you have provided me even through the difficult times.

1
1. Introduction
1.1 Introduction to DNA partition
DNA partition is the process that ensures the newly replicated DNA is accurately
distributed to each daughter cell during cell division. This process is essential for the
faithful inheritance of the genome and is necessary for the survival of organisms across
all kingdoms. While the general mechanism behind eukaryotic chromosome segregation
has been well characterized, less has been known about this process in bacteria and
essentially nothing is known about the molecular basis of DNA segregation in archaea.
High copy number plasmids in bacteria rely on passive diffusion. By contrast, low copy
number plasmids in bacteria, as well as bacterial chromosomes, need to be actively
partitioned into daughter cells prior to cell division. The process and machinery
required for bacterial chromosome segregation are not well characterized and appear to
vary significantly from species to species. In contrast, low copy plasmids utilize partition
(par) systems, which require only three components for partitioning: a nucleotide
triphosphatase (NTPase), a centromere binding protein (CBP), and a DNA centromere
site (Schumacher, 2008). The simplicity of these par systems makes them excellent
models to study DNA partition at the molecular level.
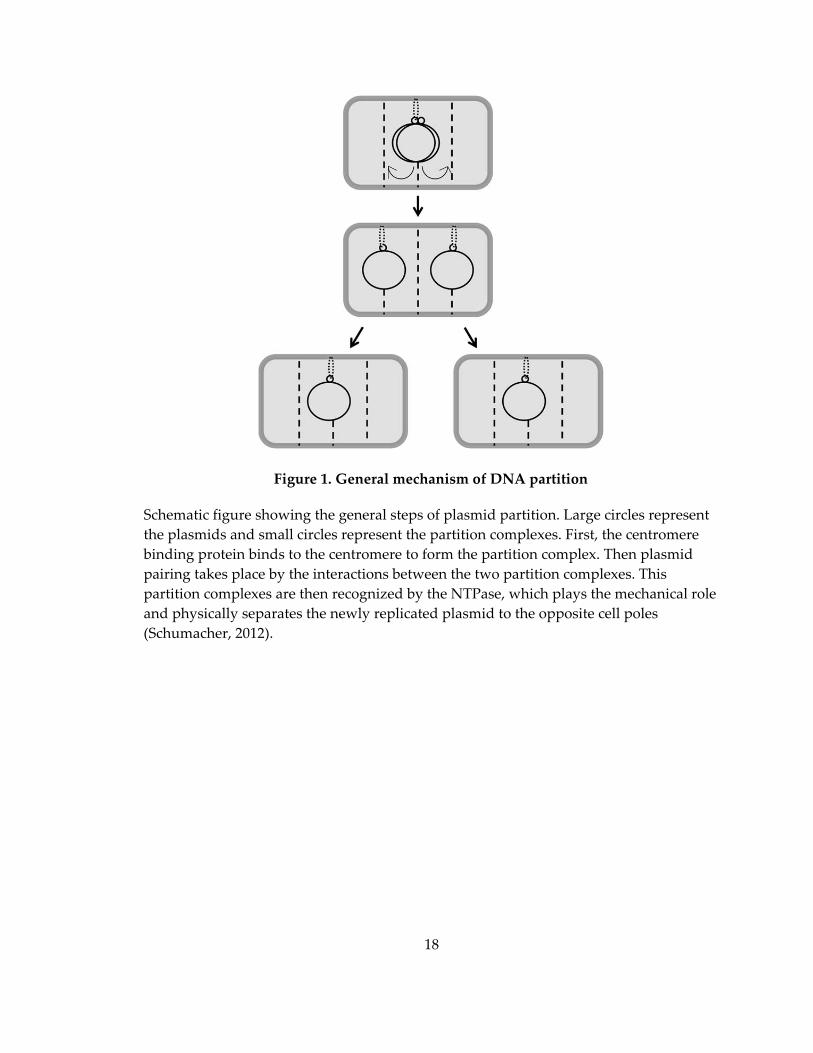
The general mechanism of plasmid partition involves three general steps (Figure
1). First, binding of the CBP to the centromere leads to the formation of the partition
complex. Plasmid pairing then takes place by interactions between two partition
2
complexes. Next, the partition complexes are recognized by the motor protein (NTPase),
which somehow physically separates the replicated plasmids to opposite cell poles. The
timing of plasmid segregation appears to be different depending on the bacterial growth
rate and it may also vary with the type of par system and the plasmid. Hence, this aspect
of DNA segregation remains a subject of debate. Three types of par systems have been
classified according to the nature of the NTPases (Gerdes et al, 2000). Type I systems use
an NTPase called ParA which has a deviant Walker box motif, Type II systems use an
actin‐like proteins called ParM, and Type III systems utilize TubZ, which contains a
tubulin‐like fold. As shown in Figure 2, these par loci share similar genetic organizations.
Notably, all three types of NTPases have been shown to form nucleotide‐dependent
polymers. However, each type of par system utilizes different molecular mechanisms,
which will be discussed in more detail later in this chapter.
The DNA segregation mechanism of archaea, the third domain of life, has been
far less characterized than that of bacteria. Only two partition systems have been
identified in archaea; the cassette driving partition of the pNOB8 archaeal plasmid and
that mediating segregation of the S. solfataricus chromosome. Notably, both employ
putative ParA‐like proteins. My thesis work focused on a homolog of the pNOB8 ParA
protein. This protein contains conserved motifs found in bacterial ParA proteins, so‐
called Walker box motifs, which drive Type I partition. However, before I describe these
systems, I will first introduce the Type II and Type III systems, which are the best
understood from a molecular standpoint. This will be followed by a detailed description

3
of Type I systems, which are notably the most abundant partition systems in bacteria
and also appear to be utilized by archaea.
1.2 Type II partition system: Actin-like ParM and ParR move plasmid by insertional polymerization mechanism
Type II partition systems are the best understood among the three types of
plasmid segregation systems. The ParMRC plasmid partitioning apparatus was
originally identified on the multiple antibiotic resistance plasmid R1 from E. coli (Gerdes
et al, 1985). Type II systems utilize NTPases called ParM and CBPs called ParR.
Although ParM has low sequence identity with actin, its fold and domain arrangements
are very similar to actin. The actin fold is composed of two domains with a nucleotide‐
binding pocket in the interdomain cleft (Figure 3A) (Popp et al, 2008; van den Ent et al,
2002). ParM forms actin‐like filaments in the presence of ATP that are dynamically
unstable (Figure 3B). Indeed, these filaments form and fall apart, unless each filament
end is capped by a ParR‐parC nucleoprotein complex. Once each end is capped, the
ParM filaments grow by the insertional polymerization of additional ParM molecules at
the ParM‐ParR‐parC interface. The bidirectional elongation of ParM filaments between
the two ParR‐parC complexes then push the ParR‐parC bound plasmids to opposite cell
poles (Figure 4) (Campbell & Mullins, 2007; Garner et al, 2004; Moller‐Jensen et al, 2007;
Salje et al, 2009). A recent structural study of the ParR‐centromere partition complex
from pSK41 plasmid revealed key insights into this capture and stabilization mechanism
(Figure 3C) (Schumacher et al, 2007). Specifically, the structure of the first full length
4
partition complex, that of the Type II ParR‐parC complex from the multidrug resistance
plasmid pSK41, revealed that six dimers of dimers of ParR assemble into a continuous
helical structure with the DNA wrapped around its outside. The N‐terminal, basic DNA‐
binding domain of ParR is located at the helix exterior and interacts with the DNA while
the C‐terminal tails, which were shown to bind ParM, face inward toward the center of
the helix. The pore dimensions of this complex are suitable for making interactions with
ParM filaments, explaining how it could act as a filament cap.
The in vitro reconstitution of the Type II partition system from R1 plasmid
demonstrated that the three‐component par system is sufficient for DNA partition
without any additional factors from the host. A DNA fragment containing centromere‐
like region was attached to beads and mixed with ParR and ParM, and filament
assembly was induced by addition of ATP. Short but dynamic ParM filaments were
extended from the parC bead surface, however as soon as the two parC beads came into
proximity, indicating both ends of the ParM filament are interacting with the ParR‐parC
complex, the filament started growing and pushed the two beads apart. It was also
observed that elongation was symmetrical and bipolar and occurred at the interface
between ParM and the ParR‐parC complex (Garner et al, 2007).
The dynamic instability of ParM is reminiscent of eukaryotic tubulin, which
indicates that eukaryotic and prokaryotic cells have evolved functionally in very similar
ways to deal with the essential process of DNA segregation.

5
1.3 Type III partition system: Tubulin/FtsZ-like TubZ and TubR move plasmid by tram-like mechanism
Type III systems are characterized by GTPases called TubZ that have
tubulin/FtsZ like folds (Ni et al., 2010). Further, TubZ has been demonstrated to
polymerize in a GTP‐dependent manner and undergo treadmilling. This phenomenon
occurs when subunits are added at the plus end of the polymer and lost at the minus
end, resulting in the polymer appearing to move across a substratum (Chen & Erickson,
2008). TubR is a centromere binding protein, which forms a highly intertwined dimer
and contains a winged helix‐turn‐helix (HTH) motif (Huffman & Brennan, 2002). Studies
showed that TubR has structural similarity to the ArsR family of winged‐HTH
transcriptional repressors (Ni et al., 2010). However, TubR has an unusual HTH‐DNA
interaction mode. Instead of inserting into the major groove, the recognition helices of
TubR mediate dimerization. Only the N‐termini of the recognition helices appear to
contact DNA with the wings providing most of the contacts to the DNA (Ni et al, 2010).
This is different from other canonical HTH motifs, in which the β‐strand acts as the wing
while the recognition helices insert deeply within the DNA major grooves (Figure 5B)
(Huffman & Brennan, 2002; Pabo & Lewis, 1982).
The crystal structure of TubZ revealed a flexible C‐terminal tail (Figure 5A) and
biochemical studies showed that this basic tail interacts with the acidic TubR dimer face
(Ni et al, 2010). These combined findings led our laboratory to propose a tram‐like
model for Type III partition (Ni et al., 2010) (Figure 6). In this model, the TubR‐plasmid

6
complex attaches to the TubZ filaments via interactions between TubR and the C‐
terminal tail of the TubZ filament. GTP hydrolysis within the TubZ filament causes
treadmilling, leading to elongation at the plus end and retraction at the minus end. This
results in the TubR‐plasmid complex being transported to cell poles. Consistent with
this model, subsequent EM structures of the TubZ polymer revealed double stranded
filaments with the C‐terminal tail exposed to the surface of the filaments, optimal for
interaction with TubR (Aylett et al., 2010).
1.4 Type I partition system
Type I systems are the most common partition systems in bacterial plasmids and
chromosomes. These cassettes encode an ATPase called ParA with a deviant Walker A
box motif and a CBP called ParB. The nomenclature of Type I ATPases is confusing.
Hence, the names of various ParA and ParB homologs are outlined in Table 1. The
Walker‐type family of proteins contain a highly conserved sequence called the Walker A
motif (GxxGxGKS/T), which is involved in ATP binding. The protein sequence forms a
glycine‐rich loop that is often preceded by a β‐strand and followed by a α‐helix. It is also
known as a P‐loop, or a phosphate‐binding loop. A deviant Walker A motif is different
from the classic Walker A motif in that it has a second lysine near the N‐ terminal end of
the motif (xKGGxxKS/T). This second lysine residue is called the signature lysine and is
known to be essential for hydrolysis of ATP (Lutkenhaus & Sundaramoorthy, 2003).
Studies have shown that mutations in the ATP binding motif of different ParA proteins
eliminate partition activities and result in plasmid instability, suggesting that this motif

7
plays a crucial role in DNA segregation (Ebersbach & Gerdes, 2004; Leonard et al, 2005;
Quisel et al, 1999).
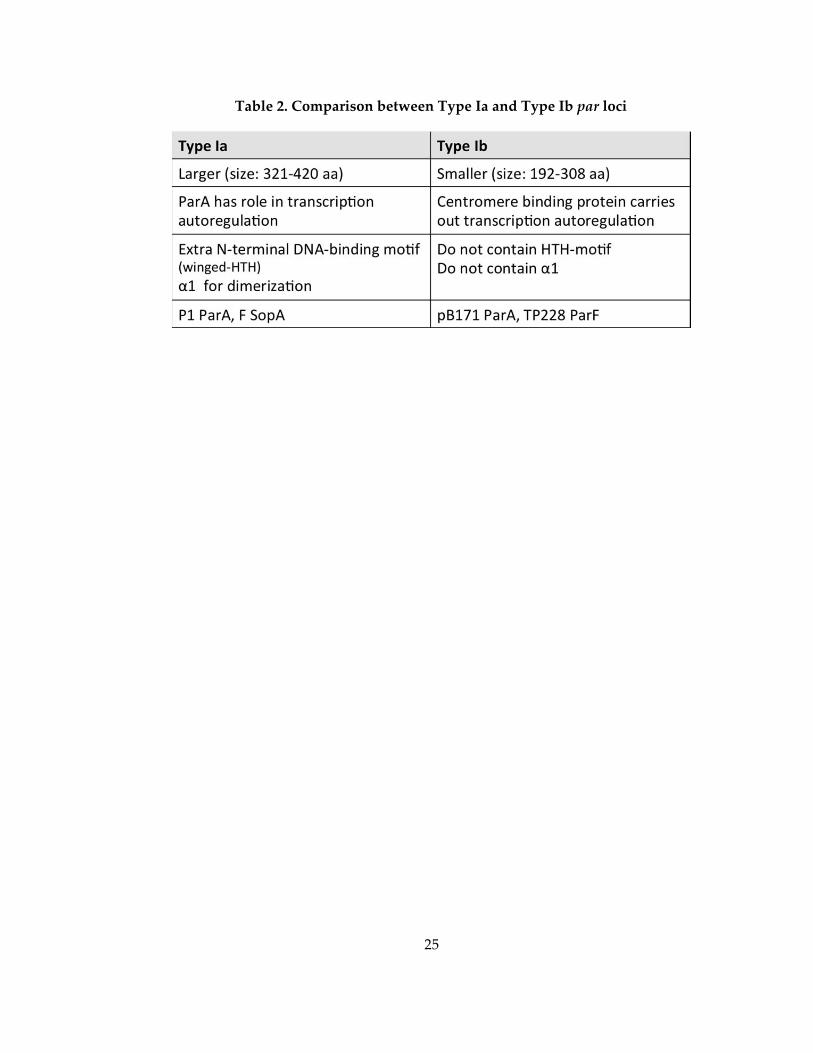
Type I systems can be further divided into two subtypes based on the sizes and
sequences of the ParA and ParB proteins (Schumacher, 2008). Type Ia systems include
large ParA (321‐420 residues) and ParB (312‐342 residues) proteins and Type Ib cassettes
encode small ParA (192‐308 residues) and ParB (46‐ 131 residues) proteins. Type Ia ParA
proteins contain regulatory N‐terminal regions that bind to its promoter, thus
functioning in transcription autorepression (Dunham et al, 2009). In contrast, Type Ib
ParA proteins lack this regulatory N‐terminal DNA binding region (Figure 7). Instead,
the CBP binds to the operon promoter and regulates the transcription of the operon.
These differences between Type Ia and Type Ib par system has been summarized in
Table 2.
1.4.1 Role of ParA in Type I partition
One important characteristic of Type I partition is the resultant equal distribution
and positioning of plasmids in the cell by this system. Plasmids maintained by the Type
I par locus are positioned roughly at midcell or one‐quarter and three‐quarter positions
which are the future division sites of the daughter cells (Figure 8) This equally spaced
positioning of plasmids is observed regardless of the plasmid focus number (Ebersbach
et al, 2006). Studies using immunofluorescence and fluorescent‐protein tagged fusions
have shown co‐localization of different ParA homologs with the nucleoid (Adachi et al,
2006; Ebersbach & Gerdes, 2004; Lim et al, 2005; Marston & Errington, 1999; Quisel et al,

8
1999). Different ParA proteins were also observed to have a dynamic oscillation
property across the nucleoid (Lim et al, 2005; Marston & Errington, 1999; Quisel et al,
1999). Furthermore, it was revealed that a mutation in the Walker box motif prevents
this movement and further leads to destabilization of plasmids (Ebersbach & Gerdes,
2004). These studies suggest a correlation between ParA and the plasmid movement.
ParA seems to play a direct role of movement in plasmid segregation, perhaps by
providing the motive force required for active plasmid segregation. A number of studies
have shown that the function and the behavior of ParA is regulated by its nucleotide
bound state and that the ATP bound form is the active state for partition, which as will
be discussed, involves nonspecific DNA binding. Cycling of different nucleotide‐bound
states seems to allow the dynamic movement of ParA proteins on the nucleoid.
1.4.2 ParA has ATP-dependent polymerization and nonspecific DNA binding activities
Type Ib ParA like proteins are better understood. Indeed, recent structural and
functional studies on the ATPase, ParF showed that it is monomeric in its apo form and
becomes a nucleotide sandwich dimer upon ATP binding (Schumacher et al, 2012). This
has led to a dimer switch mechanism of partition in which ATP binding forms the
partition active dimer. By contrast, Type Ia ATPases are more complex. Studies in our
lab on the P1 ParA and P7 ParA proteins show that they harbor long N‐terminal α‐
helices that function in dimerization in their apo form and ATP binding appears to
stabilize a specific dimeric conformation active for partition (Dunham et al, 2009). Why

9
the ATP bound ParA form is active for partition has been less clear and indeed,
controversial. Early studies demonstrated that several Type I ATPases can form filament
bundles in vitro in the presence of ATP and Mg2+ (Barilla et al, 2005; Bouet et al, 2007;
Bouet & Funnell, 1999; Ebersbach et al, 2006; Lim et al, 2005). This led to the hypothesis
that ATP‐dependent polymerization might drive DNA segregation, but how ParA
polymerization may contribute to partitioning has been less clear. One unusual finding
that has been shown to be incontrovertibly important for Type I partition is the fact that
nonspecific DNA binding by ParA proteins in the presence of ATP is required for
partition (Havey et al, 2012; Vecchiarelli et al, 2010). This nonspecific DNA binding
property allows ParA to bind to the nucleoid DNA, which apparently acts as a track for
ParA movement between cell poles. Mutagenesis studies on the ParA proteins, SopA
and Soj, revealed that inhibition of their DNA binding activities abrogated partition
(Hatano et al, 2007; Hester & Lutkenhaus, 2007).
1.4.3 CBP has a critical role in stimulating the ATPase activity of ParA
ParB proteins bind site specifically and cooperatively to centromeric DNA that
consists of either multiple direct or inverted repeats near the par operon. Multiple ParB
proteins assemble on the centromere repeats to form a higher order nucleoprotein
complex, the partition complex. In contrast to ParA, Type I CBPs show little to no
sequence homology. However, examining the structures of Type Ib CBP, E. coli TP228
ParG and Streptococcus pyogenes pSM19035 ω revealed that both proteins contain RHH
(ribbon‐helix‐helix) folds despite the lack of sequence homology (Golovanov et al, 2003;

10
Murayama et al, 2001). Type Ia CBPs are more complex and consist of three domains: an
N‐terminal NTPase binding domain, a central helix‐turn‐helix (HTH) domain, and a C‐
terminal dimer‐domain (Schumacher & Funnell, 2005).
Several studies revealed that the N‐terminus of the CBP partner stimulates the
ATPase activity of ParA. Type Ib ParG contains a flexible N‐terminal arm with a
conserved arginine that functions in interacting with ParF and stimulating ATP
hydrolysis (Golovanov et al, 2003; Pratto et al, 2008). The role and the mechanism of
ATP hydrolysis of ParA proteins are not well understood (Pratto et al, 2008).
1.4.4 Models for Type I partitioning
Although par loci encoding ATPases with Walker box motifs were discovered
almost 30 years ago, the investigation into the dynamics of how the components work
together to facilitate partitioning has only recently begun. The ability to form filaments
originally suggested that Type I systems may use similar mechanisms for partition as
Type II or Type III systems. However, there is no structural or sequence similarity
between ParA and ParM. And strikingly, nonspecific DNA binding activity has only
been observed for Walker‐type ATPases, and as noted, has been shown to be essential
for their segregation.
Based on the previous studies showing ATP mediated polymerization of ParA
proteins, Gerdes et al. proposed a pulling mechanism (Ringgaard et al, 2009). According
to this model, ATP bound ParA binds the host nucleoid DNA and forms filaments.
When this growing filament encounters the centromere‐bound ParB, its ATPase activity
11
is stimulated by ParB. Conversion of ParA‐ATP to ParA‐ADP causes the
depolymerization and detachment of ParA from the nucleoid. This retracting polymer is
thought to provide the pulling force for plasmid movement (Figure 9). Several studies
appear to support this pulling mechanism (Hatano et al, 2007; Ringgaard et al, 2009;
Sengupta et al, 2010), however, more recent data has called polymerization based Type I
partition mechanisms into question as detailed below.
More recently, a diffusion ratchet mechanism has been proposed for P1 plasmid
segregation (Figure 10B). This model does not rely on ParA polymerization. Instead, P1
ParA undergo a slow, multi‐step conformational transition upon ATP binding that
allows ParA dimers to independently bind to nucleoid DNA. Then ParA‐ATP dimers
tether the plasmids to the nucleoid surface by the interaction with the partition complex.
Once ParB stimulates ParA’s ATPase activity, ParA is released from the nucleoid. The
time delay induced by the slow conformational change combined with the ATP
hydrolysis activity of ParA creates a dynamic concentration gradient of ParA dimers
that provide the motive force for the plasmid movement (Vecchiarelli et al, 2010).
The fundamental difference between two models is the presence and absence of
ParA polymerization (Figure 10). Whether ParA polymerization/depolymerization is
involved or not is still controversial, however both models rely on the ability of ParA to
bind DNA nonspecifically and hydrolyze ATP to facilitate plasmid movement. The role
of ATP hydrolysis seems to be central to the partitioning mechanism.

12
1.4.5 Chromosomal ParA
Many bacterial chromosomes encode Type I par loci. It was shown that
chromosome‐encoded par loci is essential in Caulobacter crescentus (Toro et al, 2008) and
Vibrio cholera (Fogel & Waldor, 2006). However, these loci are generally non‐essential in
other bacteria. In growing cells of B. subtilis, deletion of soj had no effect on chromosome
segregation (Marston & Errington, 1999) and similarly, deletion of the par locus in Gram‐
negative bacteria had only mild defects in chromosome segregation (Lewis et al, 2002).
Although there is no evidence that the chromosomal par locus is required for
segregation of bacterial chromosomes, it has been shown that the locus can be utilized to
maintain unstable plasmids (Yamaichi & Niki, 2000). This suggests that the locus can
still perform partitioning functions.
ParA may not play an essential role in chromosome segregation in the vegetative
growth of B. subtilis, however recent studies have revealed that Soj (ParA homolog in B.
subtilis) plays an indirect role during sporulation by complementing an independent
origin segregation mechanism that involves the RacA protein, which is expressed early
in sporulation. RacA is a DNA binding protein that has been shown to mediate
chromosome segregation. The protein binds to the oriC region of the chromosome and is
recruited to the cell pole by DivIVA, to act as a bridge between the chromosome and the
cell pole. Deletion of both Soj and RacA had deleterious effect on chromosome
segregation, which suggest that RacA and Soj‐Spo0J play redundant roles in the origin
segregation during sporulation. How RacA may play a role in the chromosome

13
segregation process is discussed in the Appendix.
1.5 Archaeal DNA partition system
1.5.1 General introduction to Archaea
In contrast to the amount of knowledge concerning DNA segregation in
eukaryotic and bacterial cells, very little is known about the components and the
mechanisms of this fundamental process in archaea, the third domain of life. Archaea
are highly diverse and abundant. A number of species in archaea are extremophiles that
thrive under conditions of extreme heat, acidity, salinity and/or pressure (Pikuta et al,
2007). They are abundant in harsh environments such as hot springs, inside the digestive
tracts of cows, and in methane‐producing marine life. Surprisingly, they are not only
restricted to extreme environments but also thrive abundantly and globally in different
aquatic and terrestrial environments under non‐extreme conditions (Robertson et al,
2005).
Archaea was not recognized as a major domain of life until quite recently. They
used to be classified as prokaryotes up until 40 years ago when the tripartite tree was
established based on the pioneering work of Carl Woese who utilized sequence
comparisons of the 16S rRNA and 18S rRNA as indicators for molecular evolution
(Woese & Fox, 1977). Figure 11 is the phylogenetic tree that illustrates the three domains
of life, Eukarya, Bacteria, and Archaea. Archaea has unique lipid compositions in the
membrane that distinguishes itself from other life forms. Archaeal membranes contain
ether‐linkages while those of bacteria and eukaryotes contain ester‐linkages.

14
Archaea are also described to have a mosaic of eukaryal and bacterial features.
For example, archaea do not have a nucleus with a nuclear envelope like eukaryotes,
however it has been shown that archaeal proteins that are required for replication,
transcription, and translation are more similar to eukaryal proteins than bacterial
proteins. In contrast, proteins involved in metabolic pathways and regulatory functions
generally are more similar to those in bacteria. This genetic mosaicism makes archaea a
good model to study evolution. Currently, three main branches of archaea have been
recognized at the phylum level: Euryarchaeota, Crenarchaeota, and Korarchaeota
(Brochier‐Armanet et al, 2008; Woese et al, 1990)
1.5.2 Sulfolobus solfataricus
All members of the order Sulfolobales are thermoacidophiles of the crenarchaeal
branch of archaea. It is an aerobic crenarchaeon that grows optimally at 80 °C and pH 2‐
4. The cell walls are composed of surface layer (S‐layer) proteins that have been known
to maintain cell integrity even in harsh growth conditions. Sulfolobus species have
become important model organisms to study hyperthermophiles and archaea in general
for their qualities. Sulfolobus solfataricus is the most widely studied organism and has
been used as a model for research on mechanisms of DNA replication, the cell cycle,
chromosomal integration, and transcription. Importantly, its genome has been
completely sequenced in 2001. The genome is 3 Mb in size and encodes 2,977 proteins.
Among the encoded proteins, 40% were found to be archaeal‐specific, 12% bacterial‐
specific, and 2.3% eukaryal‐specific, and the last one‐third of the proteins currently have

15
no homologs in common with other sequenced genes. The predicted proteins encoded
on the genome also revealed that components putatively required for DNA replication,
DNA repair and recombination, the cell cycle and transcription appear related to their
eukaryotic counterparts. (She et al, 2001).
Light microscopy studies of the nucleoid structure and distribution of Sulfolobus
revealed that the nucleoids are highly organized during exponential growth and are
unstructured during stationary‐phase (Poplawski & Bernander, 1997). Similar to bacteria,
archaea lack a true nucleus for nuclear DNA organization. In Sulfolobus solfataricus, four
nucleoid‐associated proteins (NAPs) have been identified so far (Alba, Sso10a, Cren7,
and Sso7d) for compaction and organization of their genomic DNA (Driessen & Dame,
2011; Edmondson et al, 2004; Guo et al, 2008; Kahsai et al, 2005; Wardleworth et al, 2002).
The same light microscopy studies also observed different localizations of the nucleoid
at different stages of partition. The considerable time intervals between the termination
of chromosome replication and the completion of nucleoid separation appeared similar
to the G2 phase in eukaryotic cells. This suggest that nucleoid processing in Sulfolobus
may display both bacterial and eukaryotic traits (Poplawski & Bernander, 1997).
1.5.3 DNA partition machinery in pNOB8 plasmid
Although plasmids occur widely in the archaeal domain and several have been
isolated and partially characterized, very little is known about their mechanisms of
maintenance, copy number control, or conjugation (Zillig et al. 1996). The first archaeal
conjugative plasmid, pNOB8, was isolated from the thermophilic archaeon Sulfolobus
16
isolate, NOB8H2 (Schleper et al, 1995). The pNOB8 plasmid is a multicopy plasmid,
about 41 kb in size, and contains a well‐conserved cluster of genes involved in the
horizontal gene transmission. The plasmid also harbors genes encoding proteins that
have sequence similarity to bacterial ParA and ParB proteins. Recently, a segregation
cassette on the pNOB8 plasmid was identified and was shown to be required for
plasmid maintenance. This segregation cassette is similar to the bacterial system in that
it encodes putative ParA‐like and ParB‐like proteins. Additionally, the cassette contains
a third required protein component called AspA. AspA encodes a putative DNA‐
binding protein. This archaeal segregation cassette is atypical in that it has a tricistronic
architecture.
It was recently shown that the Sulfolobus solfataricus chromosome harbors a
segregation cassette that encodes two proteins, SegA and SegB. The SegA protein shows
homology to bacterial ParA proteins, while the SegB protein shows no homology to any
known protein (Kalliomaa‐Sanford et al, 2012). These findings suggest that the general
bacterial chromosomal and plasmid partition system may be conserved in the archaeal
system. Studies on these archaeal systems will likely provide important linkages to DNA
segregation in the bacterial and eukaryotic domains of life.
Here, we have focused on studying a homolog of the archaeal pNOB8 ParA. The
aim of this work is to structurally and biochemically characterize the protein. In Chapter
2, I explain some of the basic principles of X‐ray crystallography, which is the main
approach used in this work. In Chapter 3, crystal structures of ParA in its apo state and
17
ADP bound state are analyzed and discussed. These studies provide some insight into
how nucleotide binding affects ParA function. Along with structural studies, we
performed biochemistry studies using fluorescence polarization (FP) based DNA
binding assays and isothermal titration calorimetry (ITC) to characterize the ATP‐
dependent nonspecific DNA binding properties of the protein. These are described in
Chapter 4. Moreover, the ATP‐dependent polymer formation behavior of ParA is
examined in this chapter. In Chapter 5, we discuss the similarities between Walker‐box
based proteins in cellular processes involving transport. Finally, in the Appendix, we
describe our initial investigation of protein‐protein interactions between RacA and
DivIVA using ITC.
18
Figure 1. General mechanism of DNA partition
Schematic figure showing the general steps of plasmid partition. Large circles represent
the plasmids and small circles represent the partition complexes. First, the centromere
binding protein binds to the centromere to form the partition complex. Then plasmid
pairing takes place by the interactions between the two partition complexes. This
partition complexes are then recognized by the NTPase, which plays the mechanical role
and physically separates the newly replicated plasmid to the opposite cell poles
(Schumacher, 2012).

19
Figure 2. Genetic organization of par loci
Green arrows represent genes encoding NTPases and blue arrows represent genes
encoding the centromere‐binding proteins. Centromere‐like DNA is shown as black
solid bars. Solid arcs indicate the regulation of promoter activity and dashed arcs
indicate the formation of partitioning complex (Gerdes et al, 2010).

20
Figure 3. The structures of ParM and ParR‐parC partition complex
A: Monomeric structures of Actin‐ATP (pdb: IYAG) and ParM‐ADP (pdb: 1MWM). The
nucleotides are colored by the element and shown in spheres at the interdomain cleft of
both structures. B: A low‐resolution reconstruction of the ParM filament. Individual
monomers fitted in the map are shown in a ribbon representation (Salje 2010). C: The
structure of ParR/parC partition complex of pSK41. The N‐terminal domain of ParR is
bound to its cognate parC centromere forming a continuous helix consisting of six
dimers‐of‐dimers in one turn. On the right is an electrostatic surface representation of
the partition complex. Blue represents electropositive surfaces and red represents
electronegative surfaces (Schumacher 2007).

21
Figure 4. The pushing mechanism of plasmid partition by Type II par system
ParM polymerizes in the presence of ATP, which either undergoes a catastrophic
disassembly following ATP hydrolysis or becomes capped by a ParR‐parC complex.
Once the ParM filament becomes capped at both ends by the ParR‐parC partition
complexes, it becomes stabilized and then pushes both plasmids to opposite cell poles
by bidirectional elongation (Salje et al, 2010).
22
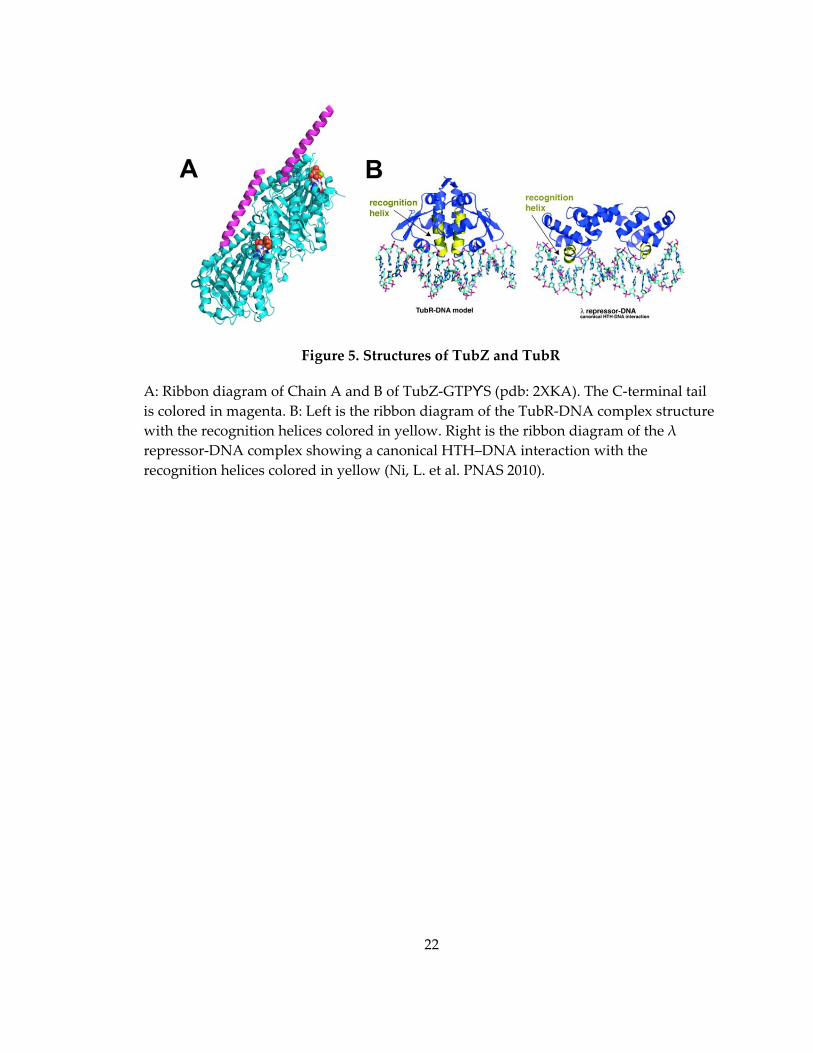
Figure 5. Structures of TubZ and TubR
A: Ribbon diagram of Chain A and B of TubZ‐GTPϒS (pdb: 2XKA). The C‐terminal tail
is colored in magenta. B: Left is the ribbon diagram of the TubR‐DNA complex structure
with the recognition helices colored in yellow. Right is the ribbon diagram of the λ
repressor‐DNA complex showing a canonical HTH–DNA interaction with the
recognition helices colored in yellow (Ni, L. et al. PNAS 2010).
23
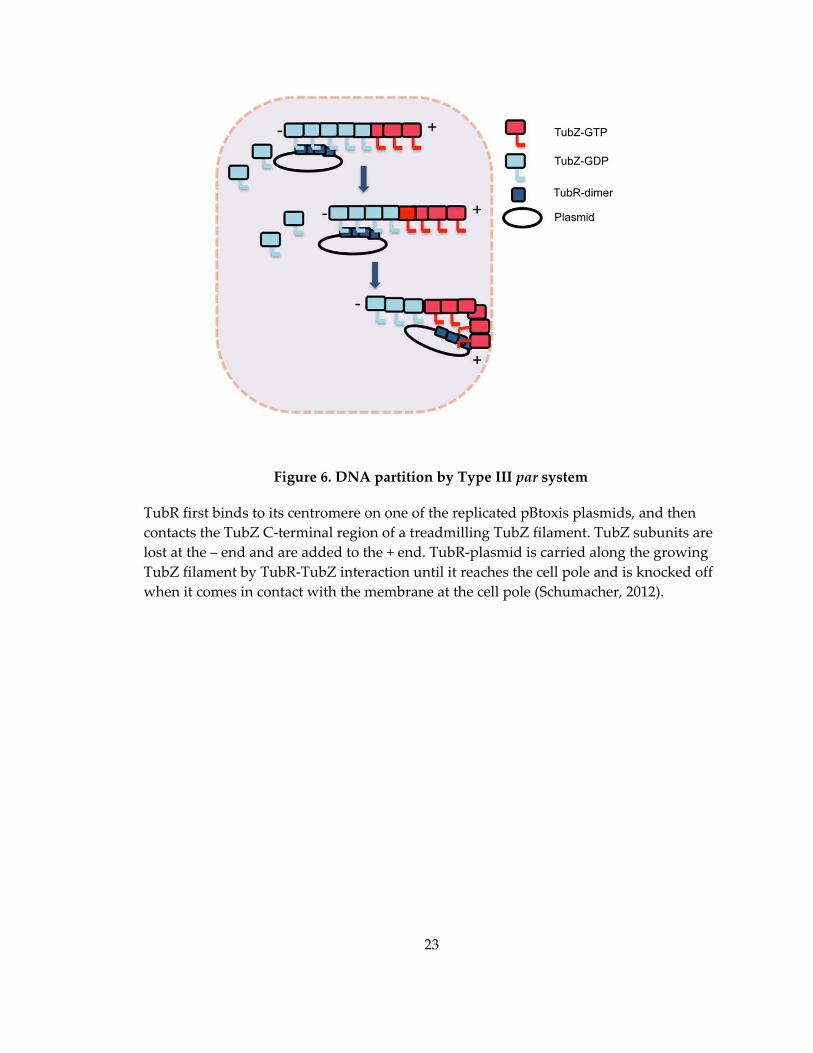
Figure 6. DNA partition by Type III par system
TubR first binds to its centromere on one of the replicated pBtoxis plasmids, and then
contacts the TubZ C‐terminal region of a treadmilling TubZ filament. TubZ subunits are
lost at the – end and are added to the + end. TubR‐plasmid is carried along the growing
TubZ filament by TubR‐TubZ interaction until it reaches the cell pole and is knocked off
when it comes in contact with the membrane at the cell pole (Schumacher, 2012).
24
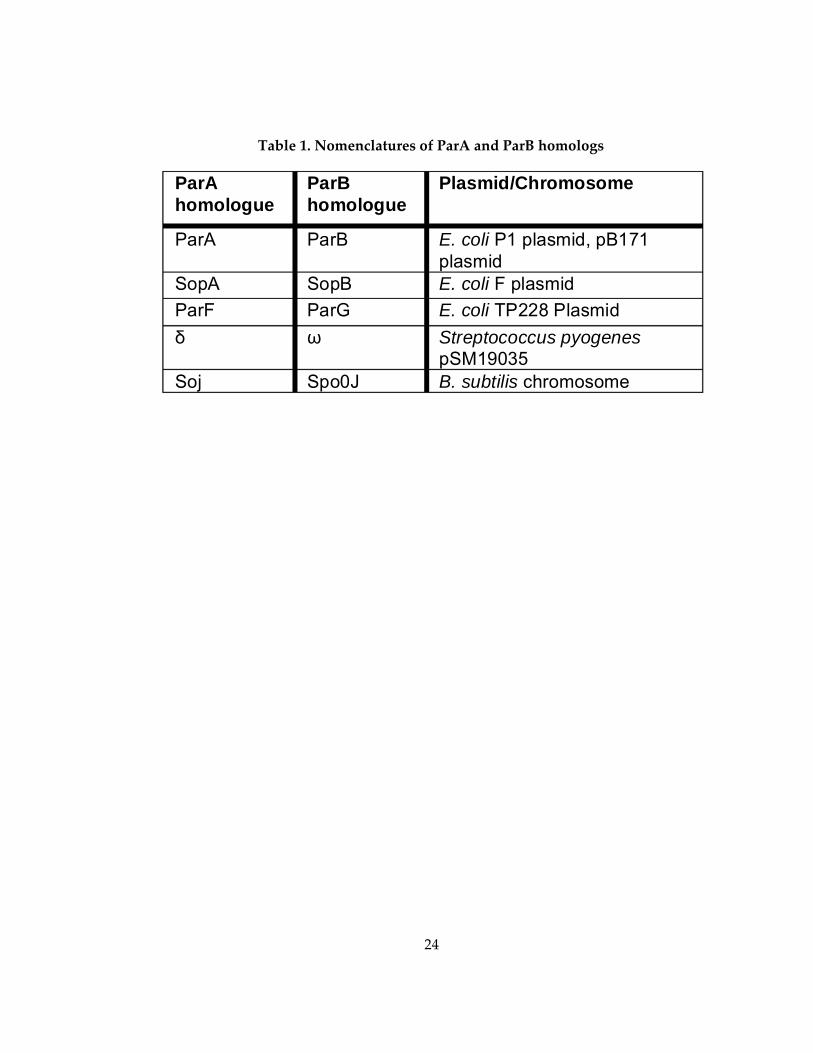
Table 1. Nomenclatures of ParA and ParB homologs
gParA homologue
ParB homologue
Plasmid/Chromosome
ParA ParB E. coli P1 plasmid, pB171 plasmid
SopA SopB E. coli F plasmid
ParF ParG E. coli TP228 Plasmid
δ ω Streptococcus pyogenes pSM19035
Soj Spo0J B. subtilis chromosome
25
Table 2. Comparison between Type Ia and Type Ib par loci

26
Figure 7. Size comparison between ParA homologs
ParA homologs share nucleotide binding motifs, Walker A Box, Walker A’ Box, and
Walker B Box, which are indicated by orange blocks. Type Ia ParA proteins have an N‐
terminal winged‐HTH DNA motif for DNA binding to its promoter, and α1 for
dimerization function, and thus are larger than both Type Ib and chromosomal ParA
homologs.

27
Figure 8. Position of plasmids maintained by Type I par loci
Schematic figure showing equally spaced positioning of plasmids over the nucleoid. A:
The plasmid is localized at mid‐cell in newborn cells B: After replication, the plasmids
migrate to one quarter and three quarter positions of the cell during cell division. C:
Equal distance positioning is observed even after the amplification of the plasmid copy
numbers. (Szardenings et al, 2011).

28
Figure 9. Pulling mechanism by Type I par system
1) ParA‐ATP dimer binds to the nucleoid DNA, leading to the formation of ParA
filaments. 2) Growing filament contacts the plasmid bound ParB (the partition complex).
3) ParB stimulates the ATPase activity of ParA at the end of the filament. ParA‐ADP is
released from the nucleoid DNA, leading to retraction of the polymer. 4) Plasmid can
either drop off or continue to be attached to the end of the depolymerizing filament.
ParA‐ADP subunits released by the partition complex is rejuvenated to ParA‐ATP and
the cycle repeats (Ringgaard et al, 2009).
29
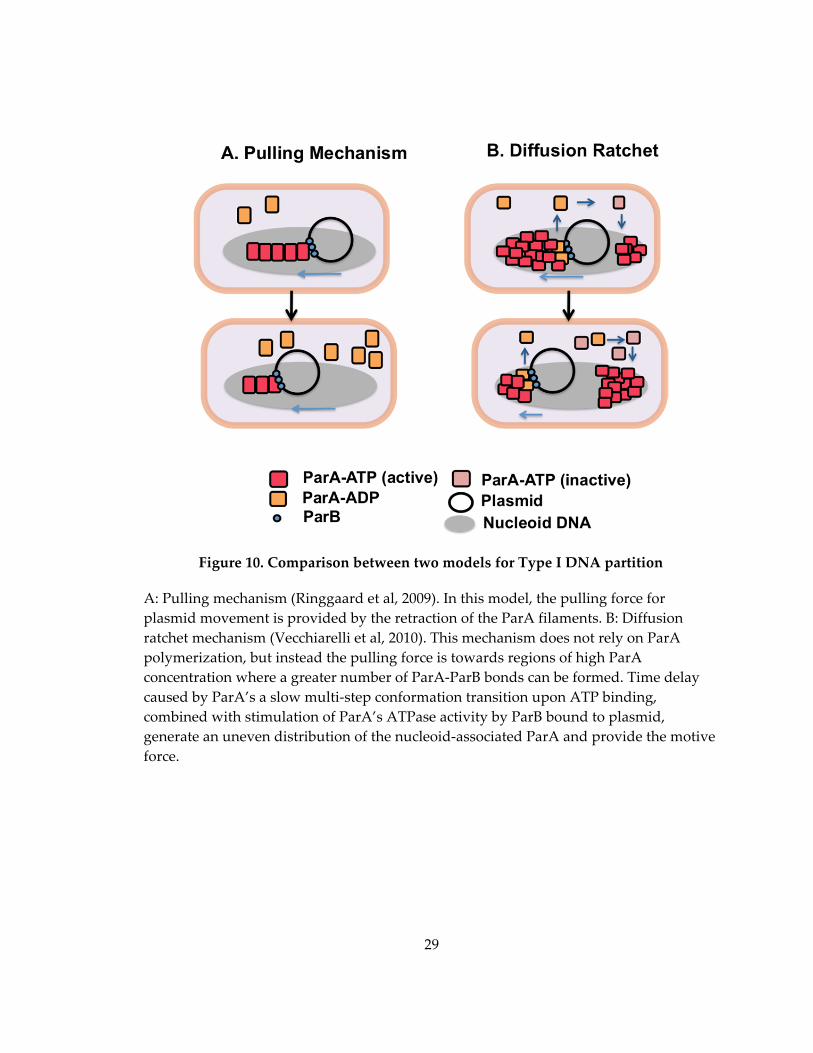
Figure 10. Comparison between two models for Type I DNA partition
A: Pulling mechanism (Ringgaard et al, 2009). In this model, the pulling force for
plasmid movement is provided by the retraction of the ParA filaments. B: Diffusion
ratchet mechanism (Vecchiarelli et al, 2010). This mechanism does not rely on ParA
polymerization, but instead the pulling force is towards regions of high ParA
concentration where a greater number of ParA‐ParB bonds can be formed. Time delay
caused by ParA’s a slow multi‐step conformation transition upon ATP binding,
combined with stimulation of ParA’s ATPase activity by ParB bound to plasmid,
generate an uneven distribution of the nucleoid‐associated ParA and provide the motive
force.
30
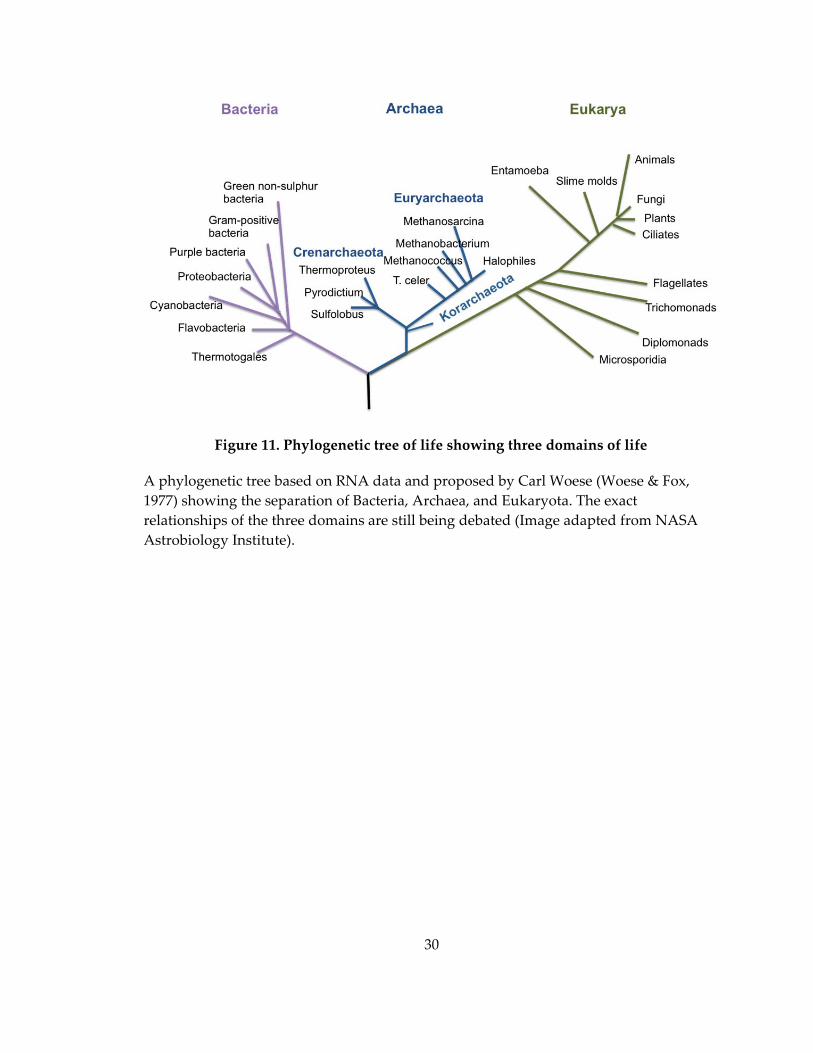
Figure 11. Phylogenetic tree of life showing three domains of life
A phylogenetic tree based on RNA data and proposed by Carl Woese (Woese & Fox,
1977) showing the separation of Bacteria, Archaea, and Eukaryota. The exact
relationships of the three domains are still being debated (Image adapted from NASA
Astrobiology Institute).

31
Chapter 2. Crystallography
X‐ray crystallography is a method used to determine the three dimensional
structure of a macromolecule. The technique can be applied to studying the
macromolecules such as DNA, RNA or assemblies of molecules such as viruses and
ribosomes, however in this chapter, I will refer only to proteins. The method allows a
direct visualization of protein structures with details of individual atoms that can
provide an enhanced understanding of how the protein may function in the cell.
2.1 Why X-rays?
In order for an object to be visualized under a light microscope, there is a limit to
how small an object can be. It cannot be smaller than the wavelength (λ) of the light,
which is the electromagnetic radiation with wavelengths of 400‐700 nm. Thus, to be able
to see the individual atoms in a protein where the atoms are separated by a distance of
only about 0.15 nm (or 1.5 Å), electromagnetic radiation of this wavelength needs to be
used. X‐ray falls in this wavelength range in the electromagnetic spectrum.
When the object is irradiated with light, it causes the incident radiation to be
diffracted. The lens on a microscope focuses the diffracted beam and magnifies it to form
an enlarged image (Figure 12A). However, there are no X‐ray lens available to physically
focus the diffracted X‐rays, so computers are used instead to simulate an image‐
constructing lens. After the X‐ray diffraction is recorded using a detector, the directions
and the intensities of X‐ray beams are analyzed by a computer to produce an image of
the cell’s content, which is then interpreted as an electron density map.
32
Crystallographers can then build the atomic model into the electron density map (Figure
12B).
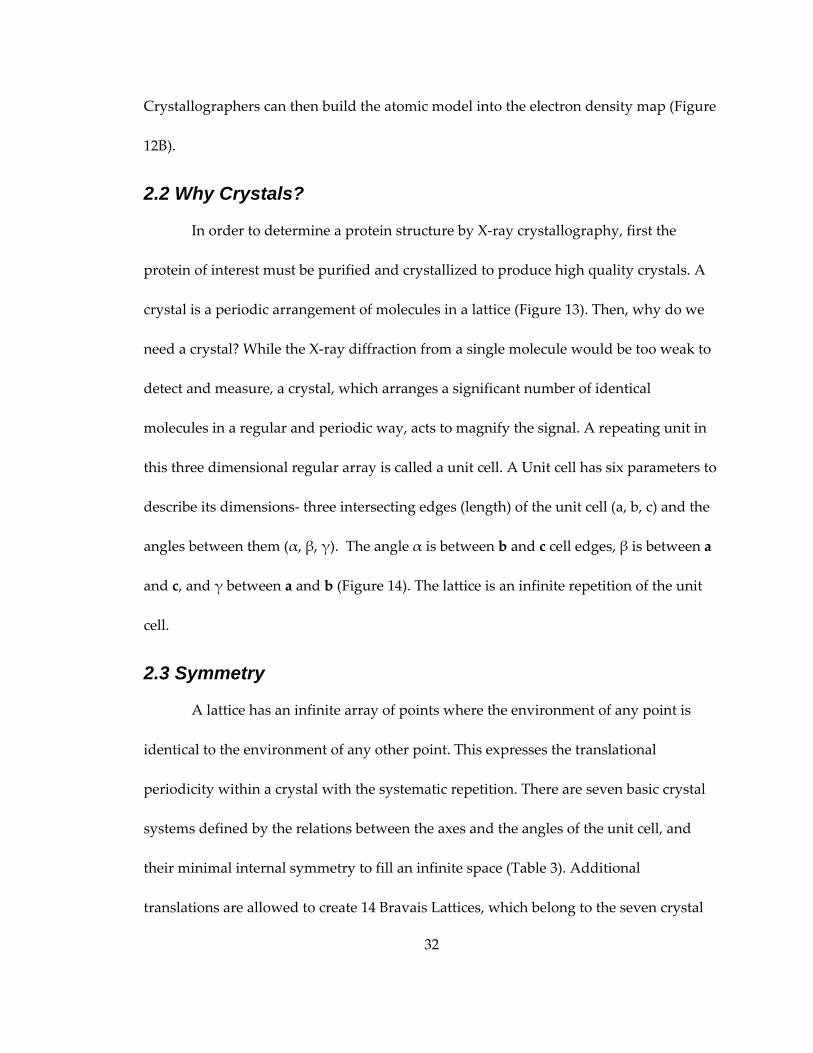
2.2 Why Crystals?
In order to determine a protein structure by X‐ray crystallography, first the
protein of interest must be purified and crystallized to produce high quality crystals. A
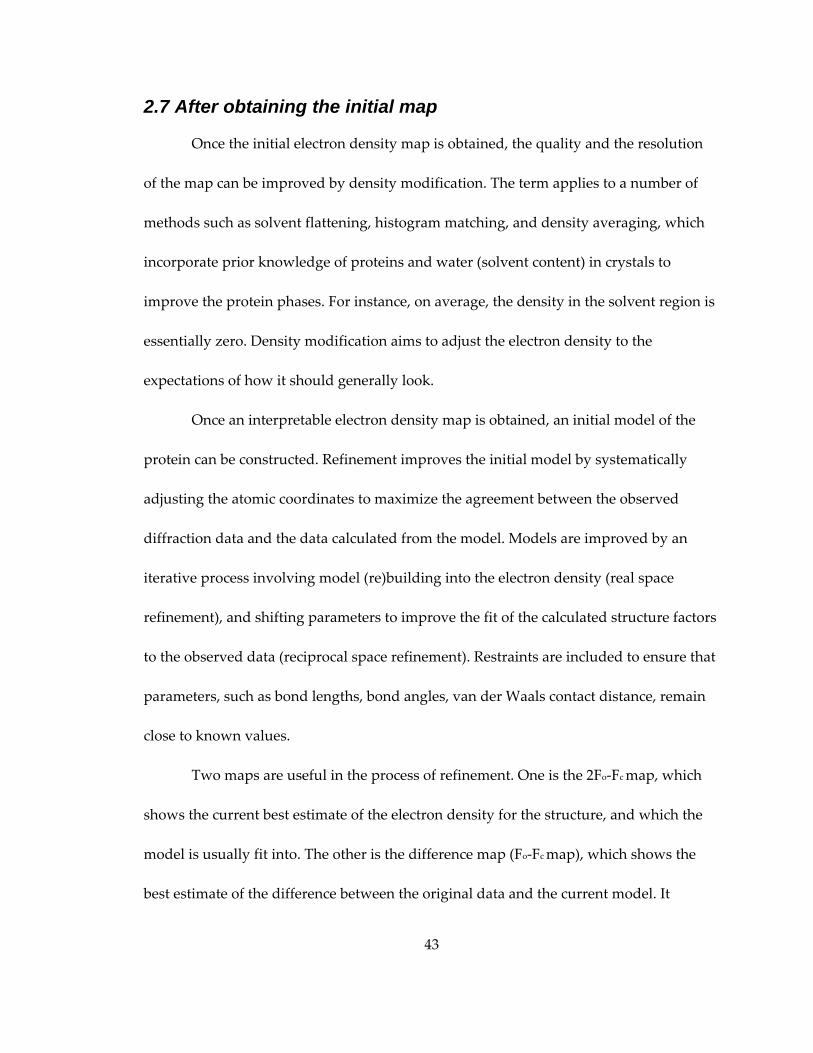
crystal is a periodic arrangement of molecules in a lattice (Figure 13). Then, why do we
need a crystal? While the X‐ray diffraction from a single molecule would be too weak to
detect and measure, a crystal, which arranges a significant number of identical
molecules in a regular and periodic way, acts to magnify the signal. A repeating unit in
this three dimensional regular array is called a unit cell. A Unit cell has six parameters to
describe its dimensions‐ three intersecting edges (length) of the unit cell (a, b, c) and the
angles between them (α, β, γ). The angle α is between b and c cell edges, β is between a
and c, and γ between a and b (Figure 14). The lattice is an infinite repetition of the unit
cell.
2.3 Symmetry
A lattice has an infinite array of points where the environment of any point is
identical to the environment of any other point. This expresses the translational
periodicity within a crystal with the systematic repetition. There are seven basic crystal
systems defined by the relations between the axes and the angles of the unit cell, and
their minimal internal symmetry to fill an infinite space (Table 3). Additional
translations are allowed to create 14 Bravais Lattices, which belong to the seven crystal

33
systems (Table 4). In a primitive lattice, the corners of the unit cell can serve as the
equivalent positions. However, in Bravais lattice system, equivalent points are expanded
to those to C (base‐centered), I (body‐centered), and F (faced‐centered), which give the
additional translational symmetry to the unit cell. The asymmetric unit is the smallest
unit (unique volume) needed to generate the whole entire unit cell only by applying the
symmetry operations. The combination of symmetry operators (rotations and
translations) and the lattices that characterize a crystal is called a space group. Symmetry
operations together with the additional translations allow 230 space groups in total, but
of those only 65 are chiral which is suitable for macromolecules such as proteins.
2.4 How does diffraction happen?
2.4.1 Bragg’s Law
Within the crystal lattice, infinite sets of regularly spaced planes can be drawn
through the lattice points. These planes are considered to be the source of diffraction. A
set of equivalent, parallel lattice planes is designated by a set of three numbers called the
Miller indices (h, k, l). The index h is equivalent to the number of parts into which a set
of planes cut the a edge of each cell. Similarly, the index k and l define the number of
parts into which the b and c edges of each cell are cut. Diffraction takes place when the
scattered X‐rays from successive planes constructively interfere (are in phase). As
illustrated in Figure 15, for the two reflected rays to be in phase, the path difference
between waves scattered by the adjacent lattice planes must be an integral multiple of
the wavelengths. This is referred to as Bragg’s law and is expressed as:
34
n=2dsin
(d: the perpendicular distance between two lattice planes, : wavelength of the incident
wave, : the angle between the incident ray and the lattice planes).
2.4.2 Ewald sphere
A reflection (h, k, l) from diffraction space originates from the set of planes (h, k,
l). Miller indices also specify a vector in reciprocal space perpendicular to these planes in
the real space, with interplanar distance equal to the reciprocal of the spacing between
the Bragg planes (1/dhkl). There is an inverse relationship between the dimensions in real
space and the dimensions in reciprocal space. Lattice in the diffraction pattern
dimensions are inversely proportional to the dimensions of the real lattice. The unit cell
in the reciprocal lattice can be described with axes, a*, b*, and c*. This inverse
relationship can be explained in more detail using the Ewald sphere.
The Ewald sphere is basically a geometric construction and a useful means to
understand the relationship between diffraction and reciprocal space. The Ewald
construction integrates the scalar (Bragg’s law) and the vector (Miller index) description
of the diffraction process (Figure 16). First, draw a sphere with the radius of 1/λ (for
convenience) and imagine the real crystal to sit at the center of the sphere. The X‐ray
beam comes from the left and the unscattered beam passes through the crystal and the
point where it reaches the sphere surface is the origin of the reciprocal space. The
incident ray and the diffracted ray are both at an angle θ from a set of Bragg planes in

35
the crystal. In order for the diffraction in the reciprocal space to occur, the diffracted ray
must contact with the surface of the Ewald sphere. The angle between the incident and
the diffracted ray is 2θ and the vector connecting the reciprocal space origin and the
diffraction point is the diffraction vector S, which satisfies the Bragg equation in vector
form. The length of the vector is 2 (1/λ) sinθ, which equals to 1/d by Bragg’s law, which
is also the length equal to the reciprocal of the spacing between the Bragg planes. A
single recording of diffraction at a fixed crystal orientation only sample a limited
number of reciprocal lattice points. Thus, the crystal needs to be systematically rotated
in order to move more reciprocal lattice points through the Ewald sphere to be sampled.
2.5 How do we go from x-ray diffraction data to electron density maps?
Each reflection in the diffraction pattern is a diffractive contribution from all
atoms in the unit cell which is a wave consisting of amplitude and phase. The structure
factor is a mathematical function describing the amplitude and phase of a wave
diffracted from the crystal lattice planes defined by Miller Indices, (h, k, l).
This equation describes the structure factor as the sum of all atomic scattering
contributions in a unit cell in the direction defined by hkl. In the above equation,
xj,yj,zj are the positional coordinates of the jth atom, fj is the scattering factor of the jth
atom, and αhkl is the phase of the diffracted beam. Since it is the electrons that are

36
scattering x‐rays, the scattering factor can be thought of in terms of the electron density
(ρ) throughout the molecule. Rewriting the equation from the above in terms of ρ:
Here, the structure factors for the various points in the reciprocal lattice
correspond to the Fourier transform of the electron density distribution within the unit
cell of the crystal. Because the Fourier transform is reversible, the electron density can be
regenerated from the structure factors using an inverse Fourier transform.
The goal of the crystallographic experiment is to determine the ρ(x, y, z), the
electron density for all x, y, z in the unit cell, and thus obtain the image of the unit cell
contents. What we measure during the experiment is the positions and the intensities of
the reflections. In the equation, |Fhkl| can be obtained from the experiment because the
amplitude of the structure factors are proportional to the square root of the measured
intensities. However the phase is lost during data collection. In order to determine the
electron density distribution in the crystal, the phase problem needs to be solved.
Some of the methods that are commonly used to determine the phase are Single
Isomorphous Replacement (SIR) / Multiple Isomorphous Replacement (MIR), Single‐
wavelength Anomalous Dispersion (SAD) / Multiwavelength Anomalous Dispersion
(MAD), and Molecular Replacement (MR).
37
2.6 Phase Determination
2.6.1 Isomorphous replacement
This method involves heavy atom substitution of a native crystal or protein to
solve the phase problem. Since different atoms contribute to the scattered intensity in
proportion to the square of the number of electrons they contain, introducing the heavy
atoms into the protein will change the scattered intensity significantly. Heavy‐atom
derivative crystals are prepared by soaking the native protein crystals in a buffer
containing a heavy‐atom compound. The differences in the diffracting intensities of the
data between the native crystal and the derivative crystal will largely reflect the
scattering contribution of the added heavy atoms. The differences between the scattering
powers can be used to compute a difference Patterson map for determination of the
heavy atom locations, which can then be used to calculate their contribution to the
structure factors. A more detailed explanation of how heavy atom sites are determined
will be described later in this chapter.
The native and derivatized crystals should be isomorphous which means that the
heavy atoms must not disturb the crystal packing or the unit cell dimensions. The
structure factor for the derivative crystal (FPH) is equal to the sum of the protein structure
factor (FP) and the heavy atom structure factor (FH) (Figure 17A).
FPH= FP +FH
We can solve this vector equation for FP, and obtain the phases of the protein
structure by using the Harker diagram (Figure 17B). |FPH| and |FP| are already known
38
from the measurement of the reflection intensities IPH and IP. To construct the Harker
diagram, first draw a circle with a radius of |FP|, centered at the origin. The circle
indicates all the vectors that would be obtained with all the possible phase angles for FP.
Next, draw another circle with radius of |FPH| centered at a point offset by vector Fh (the
amplitude and the phase of Fh is already calculated from the positions of the heavy
atoms). The two circles intersect at two points where two possible solutions are given for
the phase values for FP, corresponding to two vectors, FP (a) and FP (b). In principle, the
twofold phase ambiguity can be resolved by preparing a second derivative crystal with
heavy atoms that bind at different sites.
2.6.2 MAD (Multiwavelength Anomalous Dispersion)
MAD is an approach used to solve the phase problem by collecting datasets from
a single crystal at multiple wavelengths in order to maximize the absorption and the
dispersive effects of anomalous scattering atoms. For this reason, it requires a tunable X‐
ray source at the synchrotron. Selenium is a particularly good anomalous scatterer and it
can be incorporated into the proteins by over‐expressing them in strains of E. coli that
are auxotrophic for methionine. The host cells are grown in minimal media
supplemented with amino acids and using selenomethionine in place of methionine.
Absorption curves for heavy elements are not smooth curves, but exhibit distinct,
step‐like features. This sudden change in absorption as a function of wavelength (λ) is
called an absorption edge. Friedel’s Law holds that the intensity of the reflection (h, k, l)
is the same as that of the reflection (‐h, ‐k, ‐l).
39
|FH(hkl)| = |FH(‐h‐k‐l)|
However, as a result of this absorption, a shift in amplitude and phase takes
place and this causes the breakdown of the Friedel’s law. The reflections (h,k,l) and (–h,‐
k,‐l) are no longer equal in intensity and this inequality of symmetry‐related reflections
is called the anomalous scattering or anomalous dispersion. The anomalous difference
between these two reflections (FH = ||FH(hkl)|‐|FH(‐h‐k‐l)||) can be used to locate the
anomalous scatterers (heavy atoms) by the difference Patterson function. Figure 18B
shows the breakdown of the Friedel pair. Anomalous scattering by the heavy atom is
expressed as:
f(λ) = f0(S) + fʹ(λ) + ifʹʹ(λ) (f’: real, f’’: imaginary)
The normal scattering factor fo is independent of the wavelength and is what
contributes to the normal diffraction. The anomalous scattering factors, f’ and f” change
with the wavelength and represent the anomalous scattering that occurs at the
absorption edge. f’ is the dispersive term and f’’ is the absorption term and is 90° in
advance (Figure 18A).
For a successful MAD experiment, three or more consecutive data sets are
collected from the same crystal at different wavelengths around the X‐ray absorption
edge of the anomalous scatterer. Figure 19 shows the absorption edge of Selenium. λ1 is
the inflection point where f’ is the minimum, λ2 is the peak where f’’ is the maximum,
and λ3 is the high energy remote.

40
Once the MAD dataset is collected, we can obtain the information of changes in
the scattering power of the heavy atom as in Isomorphous Replacement, along with the
anomalous scattering differences. In other words, the MAD experiment can be treated
as a SIRAS (Single Isomorphous Replacement with Anomalous Scattering) experiment,
which is a combination of Isomorphous Replacement and anomalous dispersion. Three
datasets must be collected for this kind of experiment:
(1) one for native crystal
(2) one for the heavy‐atom derivative at the same wavelength as (1)
(3) one for the heavy‐atom derivative that results in maximal anomalous scattering
(1) and (2) are used to calculate the difference Patterson to locate the heavy atoms
in the unit cell and then calculate FH. (3) is used to determine FPH from the non‐
equivalent Friedel pair intensities due to anomalous scattering. Protein phases are then
calculated by the relation: Fp=FPH‐FH. However in the MAD experiment, all these datasets
at different wavelengths are collected from a single crystal, which helps overcome the
non‐isomorphism problem, which occurs in MIR when data are collected on separate
crystals for the native and derivative data. In MAD, λ3 and λ1 can be used in Patterson
analyses to extract the dispersive (isomorphous) differences and the Friedel pairs at λ2
can be employed to determine the anomalous heavy atom contributions. Phases for the
protein structure can be determined by the Harker construction, similar to Isomorphous
replacement experiments (Figure 20).

41
2.6.3 Locating heavy atoms in the unit cell- Patterson map
The heavy‐atom coordinates are determined using a Fourier sum called the
Patterson function P(u,v,w).
, , 1
| | cos 2
The Patterson function is a Fourier sum with intensities as coefficients. Since the
Patterson function only requires intensities but not phases, it can be computed from any
crystallographic data set. Patterson maps display peaks at locations corresponding to
vectors between atoms. For a relatively small numbers of atoms, it is possible to work
out the original positions of the atoms that would give rise to the observed Patterson
peaks.
In order to obtain the Patterson function for the heavy atoms in the derivative
crystals, a difference Patterson function can be calculated, in which the amplitudes are
the difference between the structure factor amplitudes with and without the heavy atom.
This reflects the contribution of the heavy atom alone: (| FPH | − | FP |)2. In addition,
when using the anomalous difference to solve the phases, the heavy atom sites can be
located by an anomalous difference Patterson map. The observable anomalous
difference, FH is expressed as FH = ||FH(hkl)|‐|FH(‐h‐k‐l)||, which describes the
difference between the amplitudes of the structure factor for the reflections (h,k,l) and
(‐h,‐k,‐l).

42
2.6.4 Molecular Replacement (MR)
This method relies on having a structure available that is homologous to that you
are trying to solve. The homologous structure is used as a search model and is used to
calculate an initial set of phases. To place the model structure in the correct orientation
and position in the unit cell, the model is first rotated and then translated into the
optimal overlap position. The process of finding the MR solution involves solving for
three rotation angles and three vector values, a total of six parameters. For
computational efficiency, this six‐dimensional problem can be divided into two three‐
dimensional problems: 1) the rotation function and 2) translation function. The optimal
MR solution can be expressed as r’ = Mr + v (r=model coordinates, M=rotation function,
v=translation vector).
First, the Patterson map is calculated from the atomic coordinates of the search
model and then compared to the Patterson map from the experimental intensities. As
mentioned above, the Patterson map is the result of the Fourier transform of only the
intensities, which gives a map of vectors between individual atoms. The intramolecular
vectors provide the rotational relationship between the model and the unknown
structure and so these can be used to solve the rotation function. And once the rotation
function is known, the intermolecular vectors can then be used to solve the translation
function.
43
2.7 After obtaining the initial map
Once the initial electron density map is obtained, the quality and the resolution
of the map can be improved by density modification. The term applies to a number of
methods such as solvent flattening, histogram matching, and density averaging, which
incorporate prior knowledge of proteins and water (solvent content) in crystals to
improve the protein phases. For instance, on average, the density in the solvent region is
essentially zero. Density modification aims to adjust the electron density to the
expectations of how it should generally look.
Once an interpretable electron density map is obtained, an initial model of the
protein can be constructed. Refinement improves the initial model by systematically
adjusting the atomic coordinates to maximize the agreement between the observed
diffraction data and the data calculated from the model. Models are improved by an
iterative process involving model (re)building into the electron density (real space
refinement), and shifting parameters to improve the fit of the calculated structure factors
to the observed data (reciprocal space refinement). Restraints are included to ensure that
parameters, such as bond lengths, bond angles, van der Waals contact distance, remain
close to known values.
Two maps are useful in the process of refinement. One is the 2Fo‐Fc map, which
shows the current best estimate of the electron density for the structure, and which the
model is usually fit into. The other is the difference map (Fo‐Fc map), which shows the
best estimate of the difference between the original data and the current model. It

44
emphasizes the errors in the current model with the positive density indicating where
atoms should be added and the negative density shows where atoms should be removed.
The progress of the refinement process is monitored by the R‐factor, in particular
the R‐free, which is the measure of the agreement between the calculated amplitude and
the observed amplitude.
R = Σ||Fobs‐Fcalc||/Σ|Fobs|
|Fobs| is derived from a measured reflection intensity and each |Fcalc| is the
amplitude of the corresponding structure factor calculated from the current model.
However, the R‐factor can get trapped in local minima giving the false impression of
having a good model. For this reason the free R‐factor (Rfree) is used to validate the
refinement process. Before starting the refinement process, a random subset of about 5‐
10% of the reflection data is set aside. Rfree gives an independent measure of the
refinement process and is an example of statistical cross‐validation.

45
Figure 12. The overview of X‐ray crystallography
A: In microscopy, the lens collects and focuses the diffracted light from the object and
reconstructs a magnified image of the object. B: In X‐ray crystallography, the crystal
diffracts the X‐ray into discrete beams, which produce a spot (reflection) on the detector.
After the data collection, the image of the crystal’s content is produced and interpreted
into the electron density by computer analysis. Adapted from: Rhodes G (2006)
Crystallography made crystal clear: a guide for users of macromolecular models.
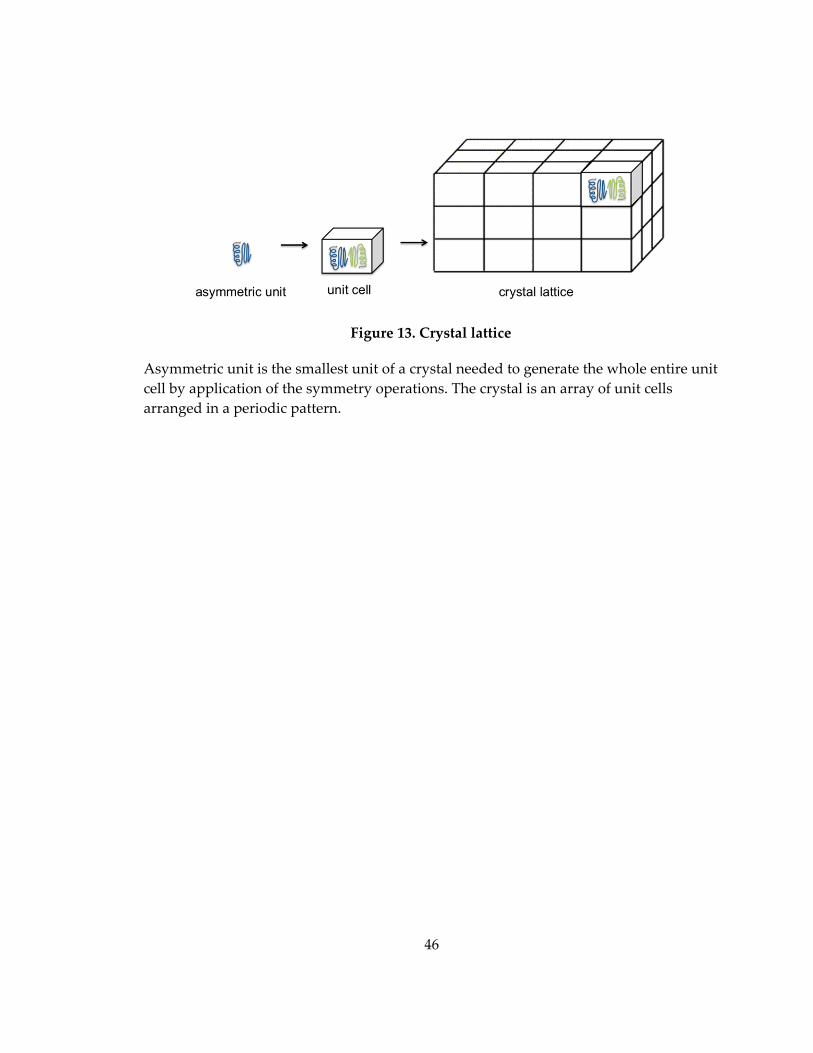
46
Figure 13. Crystal lattice
Asymmetric unit is the smallest unit of a crystal needed to generate the whole entire unit
cell by application of the symmetry operations. The crystal is an array of unit cells
arranged in a periodic pattern.

47
Figure 14. Unit cell
The unit cell has six variables to describe its dimensions, angles α, β, γ, and edges a, b, c.

48
Table 3. Seven crystal lattice system

49
Table 4. The 14 Bravais lattices
Capital letters refer to the lattice type, P: primitive, I: body‐centered, F: face‐
centered, C: base‐centered, and R: rhombohedral.

50
Figure 15. Derivation of Braggʹs Law
Bragg’s Law can be expressed as 2dsinθ=nλ, where d is the perpendicular spacing
between planes in the lattice, θ is the angle between the incident and reflected rays, λ is
the wavelength of the incident wave, and n is an integer. The difference in path length
between the rays diffracted from the adjacent planes is twice the distance l. By simple
trigonometry, distance l is equal to dsinθ. For two rays to diffract in phase, 2l must equal
the integral number of the wavelength (nλ).
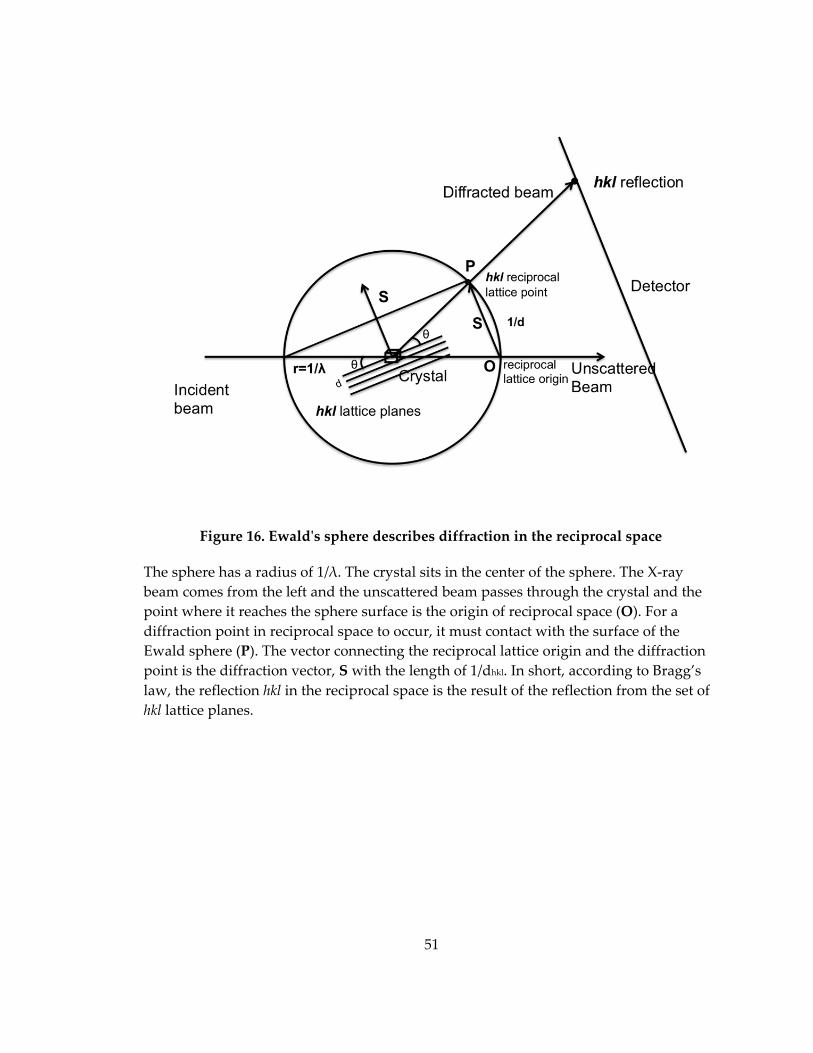
51
Figure 16. Ewaldʹs sphere describes diffraction in the reciprocal space
The sphere has a radius of 1/λ. The crystal sits in the center of the sphere. The X‐ray
beam comes from the left and the unscattered beam passes through the crystal and the
point where it reaches the sphere surface is the origin of reciprocal space (O). For a
diffraction point in reciprocal space to occur, it must contact with the surface of the
Ewald sphere (P). The vector connecting the reciprocal lattice origin and the diffraction
point is the diffraction vector, S with the length of 1/dhkl. In short, according to Bragg’s
law, the reflection hkl in the reciprocal space is the result of the reflection from the set of
hkl lattice planes.
52
Figure 17. Isomorphous Replacement
A: The structure factor for the derivative crystal FPH equals the sum of the protein
structure factor FP and the heavy atom structure factor FH. B: Harker construction of MIR
for determining the native protein phase Φp. It shows the relationship between the
native crystal structure factor FP and that of an isomorphous derivative crystal FH, which
contains a heavy atom that contributes a scattering component FH1. The circles intersect
in two points that represent two solutions for phase of FP. A second heavy atom
derivative crystal structure FPH2 can solve this phase ambiguity.
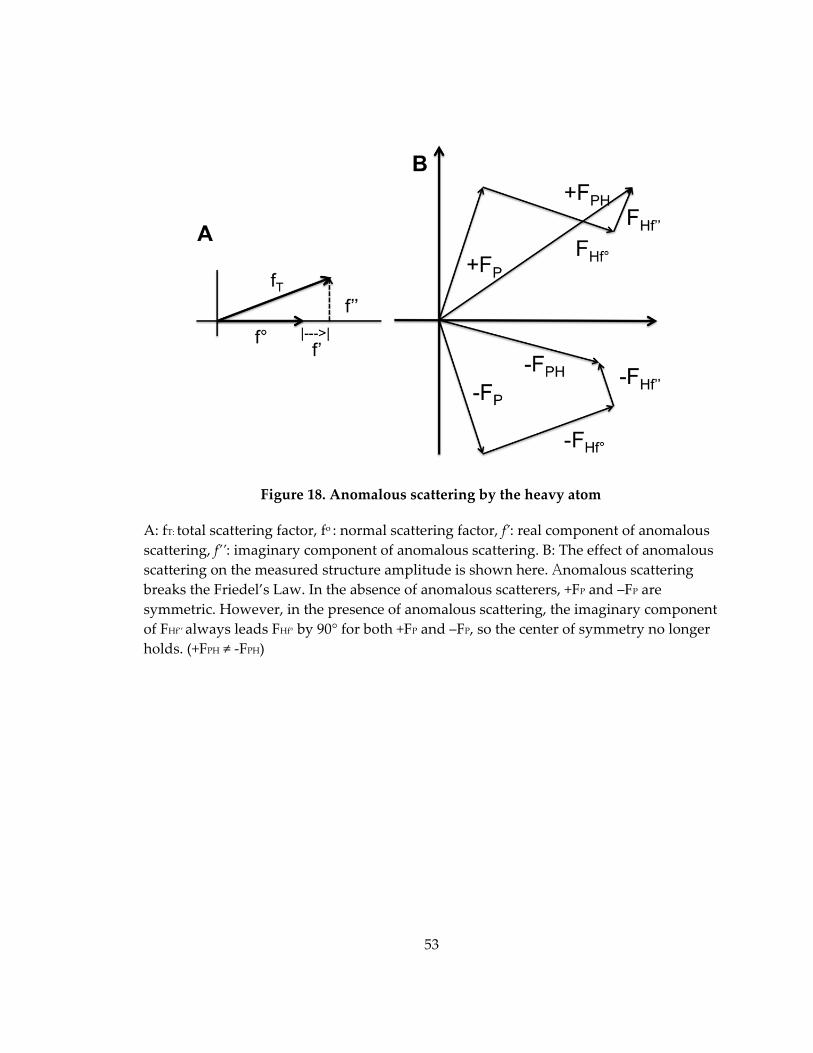
53
Figure 18. Anomalous scattering by the heavy atom
A: fT: total scattering factor, fo : normal scattering factor, f’: real component of anomalous
scattering, f’’: imaginary component of anomalous scattering. B: The effect of anomalous
scattering on the measured structure amplitude is shown here. Anomalous scattering
breaks the Friedel’s Law. In the absence of anomalous scatterers, +FP and –FP are
symmetric. However, in the presence of anomalous scattering, the imaginary component
of FHf’’ always leads FHf° by 90° for both +FP and –FP, so the center of symmetry no longer
holds. (+FPH ≠ ‐FPH)
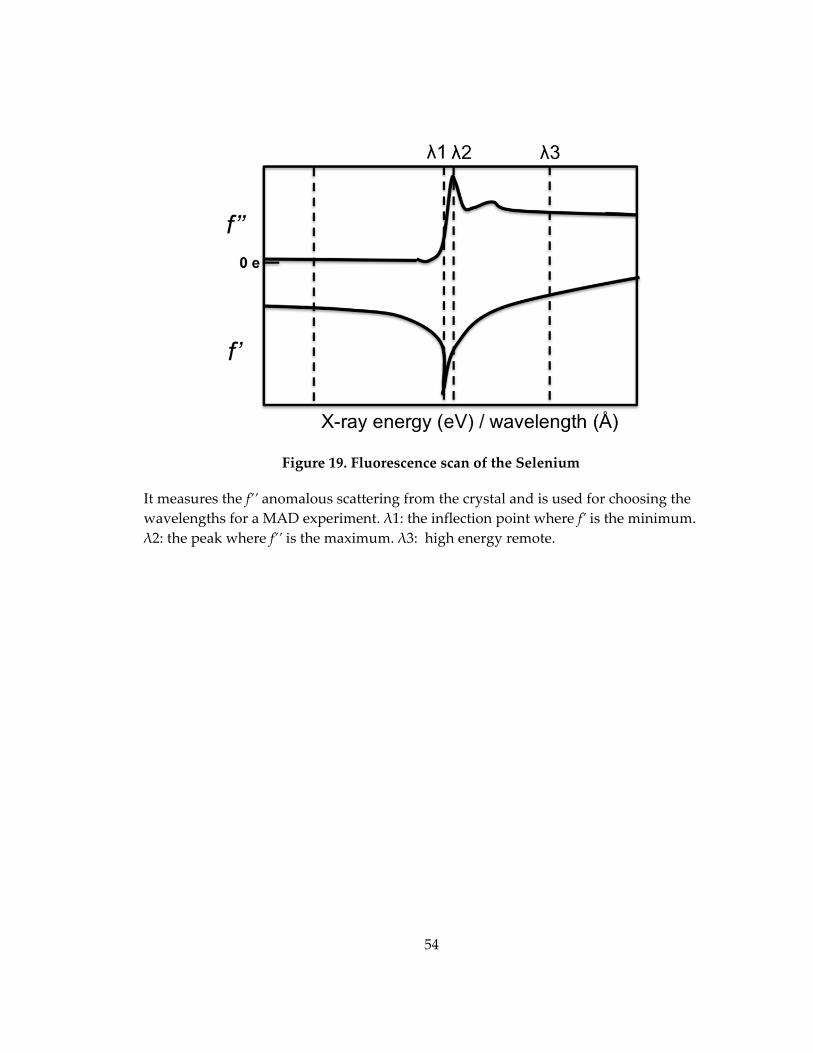
54
Figure 19. Fluorescence scan of the Selenium
It measures the f’’ anomalous scattering from the crystal and is used for choosing the
wavelengths for a MAD experiment. λ1: the inflection point where f’ is the minimum.
λ2: the peak where f’’ is the maximum. λ3: high energy remote.
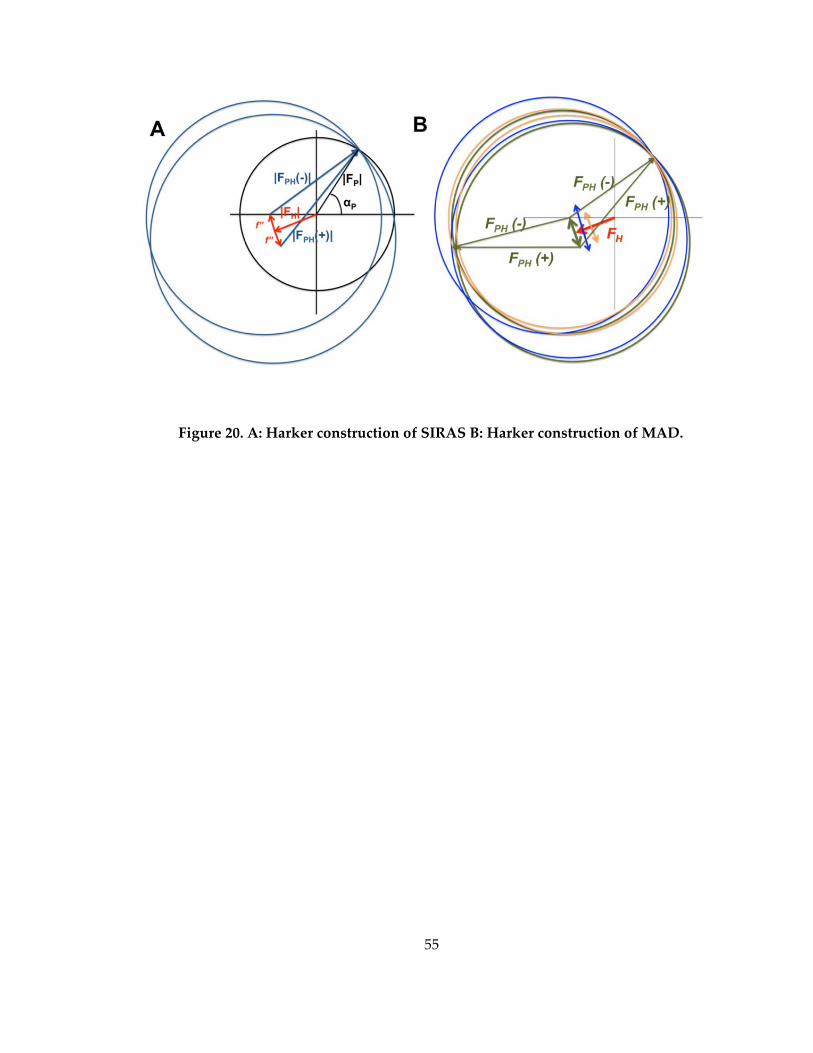
55
Figure 20. A: Harker construction of SIRAS B: Harker construction of MAD.

56
Chapter 3. Structural studies on ParA
ParA is a member of the Walker‐type family of ATPases and is responsible for
the localization and movement of plasmids and in some cases, chromosomes, during
DNA partition. These systems are composed of three components: a DNA centromere
site, the ParA ATPase and the ParB centromere binding protein. ParB binds the
centromere to form a scaffold, which recruits the motor protein, ParA. In the next step,
the ParA protein mediates separation of the replicated DNA. ParA plays an essential
role as a motor protein in the active plasmid partition, perhaps by providing the motive
force for the movement of replicated plasmids. Multiple Fluorescence Microscopy
studies have observed the dynamic movement of ParA over the nucleoid (Ebersbach &
Gerdes, 2004; Hatano et al, 2007; Lim et al, 2005; Marston & Errington, 1999; Pratto et al,
2008). SopA from the F plasmid and ParA from the pB171 plasmid were shown to
display oscillatory behavior on the nucleoid and notably, this movement required the
presence of the cognate centromere binding protein and the centromere‐like DNA site
(Ebersbach & Gerdes, 2004; Lim et al, 2005). These observations suggest that the
dynamic movement of ParA is somehow responsible for DNA partition, however how
ParA dynamics would facilitate plasmid movement during the partitioning process is
not well understood.
Multiple ParA proteins can form polymers in an ATP‐dependent manner in vitro
(Barilla et al, 2005; Dunham et al, 2009; Ebersbach et al, 2006; Leonard et al, 2005; Lim et
al, 2005; Pratto et al, 2008), and they also display ATP‐dependent nonspecific DNA

57
binding activity (Havey et al, 2012; Leonard et al, 2005; Pratto et al, 2008). This suggests
that ParA function is regulated by the nucleotide‐bound state and that the ATP bound
form is the active state in DNA partition. Some studies have suggested that the ATPase
activity of ParA is stimulated by a proposed arginine finger found on its partner ParB
protein (Barilla et al, 2007; Pratto et al, 2008). This indicates that the cycling of ATP
binding and ATP hydrolysis is key to the segregation process.
Notably, this abundant ParA based partition machinery has been shown to
function in segregation of both plasmid and chromosomal archaeal DNA. Our work
focuses on a ParA homolog similar to the ParA protein from the first identified archaeal
plasmid partition system, located on the pNOB8 plasmid harbored in the thermophilic
archaeon, Sulfolobus solfataricus. Later BLAST analyses revealed that this homolog is a
chromosomal ParA from Sulfolobu islandicus. The ParA homolog has 60% sequence
identity and 82% similarity to the pNOB8 protein as shown in Figure 21. This work
focuses on the ParA homolog, which I will simply refer to herein as ParA. The protein
sequence of ParA contains a putative Walker box motif and is highly homologous to
bacterial ParA proteins, which suggest that archaeal DNA partition may use similar
partition mechanisms as bacteria.
To gain insight into the function of ParA in the process of archaeal DNA
partition, we solved its crystal structure in the apo and ADP‐bound states and
performed a series of complementary biochemical studies.

58
3.1 Structure determination of ParA structures
The structure of the apo ParA was determined at 2.45 Å resolution using MAD
phasing of selenomethionine‐substituted protein crystals. The crystals belonged to space
group P3121, with unit‐cell parameters of a=89.1, b=89.1, c=116.6, α, β =90°, γ =120°. The
structure was refined to a crystallographic R‐factor of 19.0% and R‐free of 24.0%.
Subsequently, a ParA‐ADP bound state was crystallized and its structure solved to 2.74
Å resolution by molecular replacement using the apo structure as the search model. The
ParA‐ADP crystal belongs to the space group, P3221 with unit cell dimensions, a, b=90.3,
c=61.6, α, β =90°, γ=120° and was refined to a crystallographic R‐factor of 22.9% and R‐
free of 27.7% (Table 5).
3.2 Overall structure of ParA
The 314 residue apo ParA structure revealed a dimer in the crystal. Each ParA
subunit is composed of a seven‐stranded β‐sheet surrounded by twelve α‐helices with
the topology: β1(residues 4‐8)‐ α1(17‐30)‐ β2(34‐38)‐ α2(44‐49)‐ α3(52‐62)‐ α4(71‐79)‐
β3(84‐91)‐ β4(96‐ 104)‐ α5(17‐30)‐ α6(122‐138)‐ β5(141‐145)‐α7(154‐160)‐ β6(163‐168)‐
α8(172‐190)‐ β7(198‐ 206)‐ α9(211‐227)‐ α10(230‐223)‐ 3101(249‐252)‐ 3102(261‐264)‐
α11(273‐286)‐ α12(298‐313) (Figure 22A). 3102(261‐264) is only shown in Chain B while
this region in Chain A is highly disordered. A structural homology search using DALI
(Holm & Rosenstrom, 2010) revealed that ParA has the strongest structural similarity
with the Soj protein from Thermus thermophilus (PDB: 2bek). The Soj protein contains a
canonical Walker‐type fold and plays an important role in chromosome segregation in

59
collaboration with its CBP Spo0J (Leonard et al, 2005). Although the primary sequence
identity is 25%, ParA and Soj can be maximally superimposed with a root mean square
deviation (RMSD) of 2.3 Å for 208 corresponding Cα atoms.
Superimposition of Soj onto ParA revealed high similarity in their overall
conformations. Both contain seven β‐strands (β7‐β6‐β1‐β5‐β2‐β4‐β3) along with α1, α2,
α7, α8, α9, α13 and the P‐loop between β1 and α1 (Figure 23D). ParA also shows
structural similarity to other Walker‐type family ATPases such as MinD (pdb: 1g3q)
(RMSD= 2.3 Å for 207 corresponding Cα atoms) (Figure 23C), ParF from TP228 plasmid
(pdb: 4e07) (RMSD= 2.3 Å for 194 corresponding Cα atoms) (Figure 23E), and ParA from
the P1 plasmid (pdb: 3ez7) (RMSD= 2.9 Å for 222 corresponding Cα atoms) (Figure 23F).
All these ParA structures have an architecture with six β strands, the P‐loop, and helices
α1, α2, α7, α8, α9, α13. The region where α3, α4, and α5 are located (ParA numbering)
varies among all the structures listed above (Figure 23).
3.3 The insert region
Notably, major differences between ParA homolog structures are found in the
region consisting of β3‐β4 in the archaeal ParA. Indeed, this region is not found in other
bacterial ParA proteins and herein, we call this the insert region (β3‐loop‐β4) (Figure 24).
It is particularly interesting because additional structures of ParA and pNOB8 ParA
determined recently in the Schumacher Lab revealed that the secondary structure of this
region varies depending upon its crystal packing environment (Schumacher et al.,
manuscript under review). This suggests that this region is flexible and may only fold

60
upon binding to another protein or DNA. The sequence of this region is
VENFIHVSKTSKGEVKVSLD and the lysines (in bold) are located in the loop between
the two beta strands, β3 and β4.
3.4 ParA shares a set of conserved nucleotide binding motifs with other bacterial Walker-type family proteins
Walker‐type proteins contain a highly conserved sequence called the Walker A
motif. Moreover, two additional motifs called the Walker A’ and the Walker B are also
highly conserved in the proteins of this family. This set of three motifs mediate
nucleotide‐binding (Koonin, 1993). To investigate whether ParA also contain this set of
nucleotide binding motifs, protein sequences from members of the ParA‐like family
were aligned with that of ParA. ClustalW2 web‐based alignment tools (Robert & Gouet,
2014) were used for analysis of sequence homology and conserved residues of the
protein sequences including TP228 ParF, Soj from T. thermophiles, P1 ParA from E. coli
and MinD from P. furiosus. Figure 25 is the result of the multiple sequence alignment
that shows the conserved sequences in red. Indeed, all Walker A, Walker A’ and Walker
B motifs are shown to be highly conserved among the ParA homologs listed above, and
furthermore, the archaeal ParA also shares this conserved set of nucleotide binding
motifs.
Deviant Walker box proteins, such as partition ParA proteins, contain a variation
of the Walker A motif in which there is an extra lysine, termed the signature lysine, near
the N‐terminal end of the motif. This residue has been shown to play a role in ATP
hydrolysis by these proteins. The structure of the archaeal ParA revealed a clear deviant

61
Walker A motif (residues 11‐18) that forms a glycine rich loop. Moreover, the structure
also revealed a Walker A’ motif (residues 34‐42) and Walker B motif (residues 140‐145)
both of which are also characteristic of Walker box proteins (Figure 22B).
3.5 Dimerization interface
The total buried surface area (BSA) in the archaeal ParA dimer interface is 1907
Å2. This is relatively smaller than the significant BSA observed in the P1 and P7 ParA
dimers. However, this difference is at least partly due to the fact that the P1 and P7 ParA
proteins harbor an extra N‐terminal helix that forms tight dimer contacts. This helix is
absent in the archaeal and type Ib ParA proteins. The residues that are involved in the
dimerization interface of the archaeal ParA are negatively or positively charged and
located primarily on the loops between β6‐α8, β7‐α10 and the loop just before α11
(Figure 26). In particular, there are four salt bridges that seem to stabilize the dimer of
ParA. These interactions occur between residues, Glu173‐Arg55 and Arg209‐Glu269.
Size exclusion chromatography analyses on the archaeal ParA protein revealed a
calculated mass of 70 kDa, supporting that it is dimeric in its apo form (Figure 32)
3.6 Structure of ParA-ADP
The structure of ParA‐ADP contains one subunit in the asymmetric unit and the
dimer is generated by crystallographic symmetry. The structure contains some highly
disordered regions in α4 (residues 69‐81) and α5 (residues 105‐122), and a partial α6
(residues 123‐129). The apo structure and ParA‐ADP dimer superimpose with a root
mean square deviation (RMSD) of 0.7 Å (Figure 28). The total buried surface area of the

62
ParA‐ADP dimer is 1673 Å2, which is approximately 300 Å2 smaller than that of the ParA
apo structure. Based on comparisons of the two structures, the apo and ADP bound
dimers are very similar in their overall structures and oligomeric arrangements.
However, there is a subtle difference in the conformation of the loop region near the
ADP binding site (residues 256‐263). This will be discussed in more detail after the ADP
binding site has been described.
3.7 ADP binding site
In the ParA‐ADP bound structure, ADP sits in a cavity at the surface created by
residues Lys12‐Leu20, Ser44, Asp 145, Pro148, Arg206, Leu254‐Lys258, and Leu261‐
Asp263 (Figure 29). Figure 30 shows a close up view of the ParA ADP binding site. The
loop after α11, composed of residues Ser255‐Ser262, extends around the adenine ring.
The main chain carbonyl of Ser255 forms hydrogen bond with N6 of adenine. N1 of
adenine forms hydrogen bonds with the main chain nitrogen of Asn257 and N7 makes
hydrogen bonds with the side chain of Thr19. Non‐polar interactions are observed with
Leu254, Leu261, and Lys206. The Leu261 side chain extends vertically to the adenine
ring to make a hydrophobic contact while the aliphatic atoms of the Lys206 side chain
also make non‐polar contacts with the adenine moiety. The ribose ring adopts the typical
C3’‐endo conformation. The ADP hydroxyl group at the 2’ position is recognized by the
main chain carbonyls of Leu261 and Ser262.
The phosphate‐binding region reveals the conserved deviant Walker A motif as
is shown in Figure 29 (colored in magenta). The P‐loop located between β1 and α1, is
63
composed of residues 11‐18, and extends around the β phosphate. The main chain amide
nitrogen groups of Gly14‐Thr18 stabilize the α and the β phosphates of the ADP moiety.
The hydroxyl group of the Thr19 side chain and its main chain amide group recognize
the α phosphate. The signature lysine in crystal structures of ParA‐like family proteins
make intersubunit phosphate contacts with the nucleotide bound in the adjacent
subunit. In the ADP bound structure of ParA, the signature lysine (Lys12) is too far from
the ADP bound in the adjacent subunit (distance: 7.56 Å) to make this intersubunit
contact.
The Walker A’ motif, adjacent to Walker A motif, is located at β2 (residues 34‐
42). The, highly conserved Asp40 of this motif interacts indirectly with the Mg ion
through a water molecule. This conserved Asp residue is known to be the sensor of ATP
binding/hydrolysis. The Walker B motif, with the conserved sequence, hhhhD
(h=hydrophobic residues) is known to contain a conserved acidic residue Asp (or Glu)
residue, which also functions in coordinating the Mg ion either directly or indirectly via
a water molecule and is essential for ATP hydrolysis. In the archaeal ParA protein the
Walker B motif consists of residues 140‐145 and contains the conserved acidic residue
Asp145 that contacts the Mg ion.
While no change was detected in the P‐loop near the phosphate moiety of ADP
compared to the apo state, a conformational change was detected in the loop, composed
of residues 252‐262 that surrounds the adenine ring of ADP. In the apo state, residues
261‐264 form a 310 helix where in the ADP bound state, the hydroxyl of the ribose ring
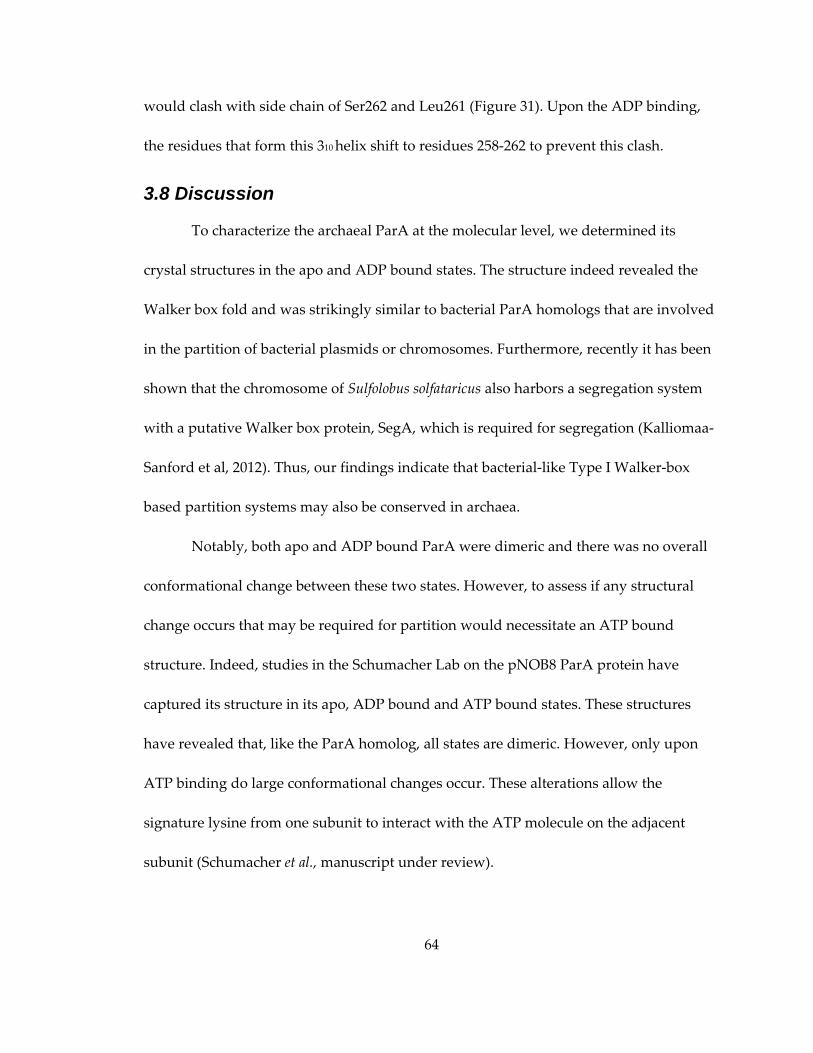
64
would clash with side chain of Ser262 and Leu261 (Figure 31). Upon the ADP binding,
the residues that form this 310 helix shift to residues 258‐262 to prevent this clash.
3.8 Discussion
To characterize the archaeal ParA at the molecular level, we determined its
crystal structures in the apo and ADP bound states. The structure indeed revealed the
Walker box fold and was strikingly similar to bacterial ParA homologs that are involved
in the partition of bacterial plasmids or chromosomes. Furthermore, recently it has been
shown that the chromosome of Sulfolobus solfataricus also harbors a segregation system
with a putative Walker box protein, SegA, which is required for segregation (Kalliomaa‐
Sanford et al, 2012). Thus, our findings indicate that bacterial‐like Type I Walker‐box
based partition systems may also be conserved in archaea.
Notably, both apo and ADP bound ParA were dimeric and there was no overall
conformational change between these two states. However, to assess if any structural
change occurs that may be required for partition would necessitate an ATP bound
structure. Indeed, studies in the Schumacher Lab on the pNOB8 ParA protein have
captured its structure in its apo, ADP bound and ATP bound states. These structures
have revealed that, like the ParA homolog, all states are dimeric. However, only upon
ATP binding do large conformational changes occur. These alterations allow the
signature lysine from one subunit to interact with the ATP molecule on the adjacent
subunit (Schumacher et al., manuscript under review).

65
Another example of ATP locking in a specific state upon ATP binding is
observed in structures of NifH. NifH is a Fe‐protein from Azotobacter vinelandii. In the
NifH structures, the signature lysine is 8.5 Å from the β‐phosphate of ADP. However, in
the presence of ADP∙AlF4‐ (an ATP analogue) and its partner MoFe protein, each of the
monomers of NifH rotates ~13° toward the subunit interface forming a more compact
structure, such that the signature lysines are 2.77 Å from the β‐phosphate (Schindelin et
al., 1997). This rotational movement allows NifH to be active for its function in
catalyzing the reduction of atmospheric nitrogen to ammonia.
Although the ATP hydrolysis property of ParA has not been demonstrated in
this work, the catalytic residues responsible for ATP hydrolysis in the Walker A’ and
Walker B motifs, Asp40 and Asp145, are conserved in the archaeal ParA. The structure
of ADP bound state also revealed both residues to be located at the nucleotide binding
site, suggesting that ParA is at least equipped for an ATPase activity.
3.9 Experimental Procedures
Expression, Purification, and Crystallization A synthetic gene, codon optimized
for E. coli expression of ParA was purchased from Genscript Corporation and subcloned
into the pET15b vector such that a hexa‐His‐tag was expressed for purification
(Piscataway, NJ, USA). This was transformed into E. coli B834(DE3) and expressed in
defined medium supplemented with 90 mg/L of L‐ Selenomethionine. Cells were grown
at 37 ̊C to an OD600 of 0.5‐0.6 and then induced with 1 mM IPTG for 16 hrs at 9 ̊C. His‐
tagged ParA was purified by using Ni‐NTA chromatography and was buffer exchanged
66
using a size exclusion column equilibrated with 25 mM Tris pH 7.5, 200 mM NaCl, and 5
mM DTT. ParA crystals were grown at room temperature using the hanging drop vapor
diffusion method. Crystals were obtained by mixing 2 μl of the protein at 15 mg/ml with
2 μl of the crystallization buffer, which contained 10% (v/v) 2‐propanol, 0.1 M
phosphate‐citrate pH 4.2, and 0.2 M LiSO4. ParA‐ADP crystals were grown using a
crystallization solution consisting of 0.1 M Tris pH 8.5 and 8% w/v PEG 8000 (Figure 32).
Structure Determination The MAD X‐ray intensity data were collected from a
selenomethionine‐containing ParA crystal at the Advanced Light Source (ALS),
beamline 8.3.1 by Dr. Maria Schumacher. The structure was solved by multiwavelength
anomalous diffraction (MAD) to 2.45 Å resolution also with the help of Dr. Schumacher.
The selenium sites were located using SOLVE (Terwilliger & Berendzen, 1999). Model
building was performed by COOT (Emsley et al, 2010), and the model was refined to
Rwork/Rfree= 18.9/24.0 in PHENIX with help of Dr. Tonthat. The data set for the ParA‐
ADP complex crystal was collected at the Advanced Photon Source (APS), beamline ID.
The structure was solved using molecular replacement using the apo structure as a
search model. Model building was performed using COOT and PHENIX was used for
refinement. See Table 5 for final refinement statistics.
Size Exclusion Column Chromatography The oligomeric state of ParA was
determined by size exclusion chromatography. ParA at a concentration of 1 mg/ml was
injected into a Superdex S75 column (Amersham Pharmacia Biotech) with a mobile

67
phase of 25 mM Tris–HCl pH 7.5, and 200 mM NaCl. The elution volume was then
plotted against a standard curve to determine the relative molecular weight of the
sample. Three protein samples were used to calibrate the column: Cytochrome C (Mr 12
400 kDa), carbonic anhydrase (Mr 29 000 kDa), and bovine serum albumin (Mr 66 000
kDa). The KAverage (Kave) was calculated as follow: Kave=(VE – VO)/(VT – VO), where VT, VE
and VO are the total column volume, elution volume and void volume of the column,
respectively. The standard plot was generated by graphing the logarithm of the
molecular weight (Mr) against the Kave. The Kave of each marker as well as the
experimental samples were the average value of three experiments.
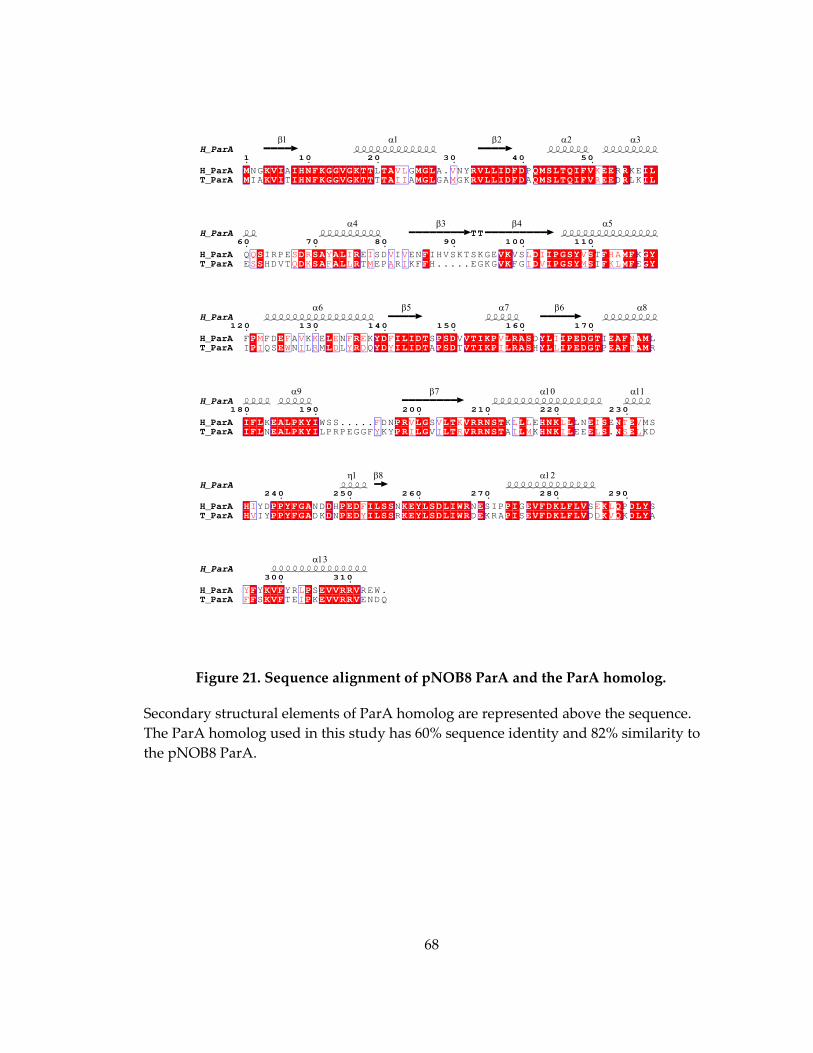
68
Figure 21. Sequence alignment of pNOB8 ParA and the ParA homolog.
Secondary structural elements of ParA homolog are represented above the sequence.
The ParA homolog used in this study has 60% sequence identity and 82% similarity to
the pNOB8 ParA.
H_ParA1 10 20 30 40 50
H_ParA M KVI IHNFKGGVGKTT TA MGL RVLLIDFD QMSLTQIFV EE R IL VL V K NG A L G A. NY P R KE T_ParA M KVI IHNFKGGVGKTT TA MGL RVLLIDFD QMSLTQIFV EE R IL II M R IA T T A GA GK A D LK
TT H_ParA60 70 80 90 100 110
H_ParA S D SA AL R F VK D IPGSY S F MF GY Q S R Y I I V V L I V HA Q IRPE E SD I EN IHVSKTSKGE VS T K T_ParA S D SA AL R F VK D IPGSY S F MF GY S Q K F L M A I I V M KL E HDVT T EP R KF H.....EGKG FG I E
H_ParA120 130 140 150 160 170
H_ParA P E L R YD ILIDT PSD VTIKP LRAS YL IPEDGT EAF AM M F V K E F E F V I N F FD A K E N K S V D I LT_ParA P E L R YD ILIDT PSD VTIKP LRAS YL IPEDGT EAF AM I W I R D Y D Y I L T I QS N L M L Q A T H P R
H_ParA180 190 200 210 220 230
H_ParA IFL EALPKYI PR LG LT VRRNST L HNK L E S N E F V V K L L L I T V K WSS..... DN S K E LN E MST_ParA IFL EALPKYI PR LG LT VRRNST L HNK L E S N E Y I I R I M I L S L N LPRPEGGF KY V A K EE . KD
H_ParA 240 250 260 270 280 290
H_ParA H PPYFGA D PED ILSS KEYLSDLIWR E PI EVFDKLFLV K Q DLY I F E L YD ND H N N SIP G S P ST_ParA H PPYFGA D PED ILSS KEYLSDLIWR E PI EVFDKLFLV K Q DLY V Y D V IY DK N R D KRA S D K A
H_ParA 300 310
H_ParA F KVF P EVVRRV Y L Y YR S REW. T_ParA F KVF P EVVRRV F I S TE K ENDQ

69
Figure 22. Overall structure of ParA
A: Subunit of ParA. The helices are shown as cylinders, colored in light purple and the β
strands are colored as pink arrows. Each secondary structure is labeled. Deviant Walker
A motif is indicated with magenta. B: Ribbon diagram of the overall structure of ParA
dimer. Deviant Walker A motif is colored in magenta, Walker A’ in blue, and Walker B
in cyan.
A B

70
Figure 23. Structure comparisons of ParA homologs
The ribbon diagram of (A) ParA, (B) Soj (pdb: 2bek) (C) MinD (pdb: 1g3q) (D):
superposition of ParA and Soj (E) ParF (pdb: 4e07) (F) P1 ParA (pdb: 3ez7), shown in the
same orientation as (A)
Archaeal ParA
ParF P1 ParA
Soj MinD
Archaeal-Soj
A B C
F E D

71
Figure 24. The insert region
The overlay of ParA with other ParA homologues from both type Ia and Ib revealed that
this region is really unique to ParA. The insert region is colored in magenta. A: Overlay
of ParA with P1 ParA (pdb: 3ez7). B: Overlay of ParA with ParF (pdb: 4e07). C: Overlay
of ParA with Soj (pdb: 2bek).
Archaeal ParA - SojArchaeal ParA - P1 ParA Archaeal ParA - ParF
A B C

72
Figure 25. Multiple sequence alignment of pNOB8 ParA and other ParA homologs.
Secondary structural elements of ParA are represented above the sequence. Amino acid residues considered to be similar are in red
and the red box represents perfect identity. Multiple sequence alignment of ParA and ParA homologs revealed three conserved motif
for ATP binding and ATP hydrolysis, Walker A (indicated in magenta), Walker A’ (indicated in dark blue) and Walker B motif
(indicated in cyan).

73
Figure 26. The Dimerization interface
The residues involved in the dimerization interface are indicated in cyan. The residues
are mostly located in the alpha helices and loops that surround the beta sheet. Four salt
bridge interactions were found in the interface. The residues involved in the interactions
are Arg55, Glu173, Glu269, and Arg209 (indicated in yellow).

74
Figure 27. Oligomeric state of ParA in solution determined by size exclusion
chromatography
The graph illustrates that ParA is dimeric.
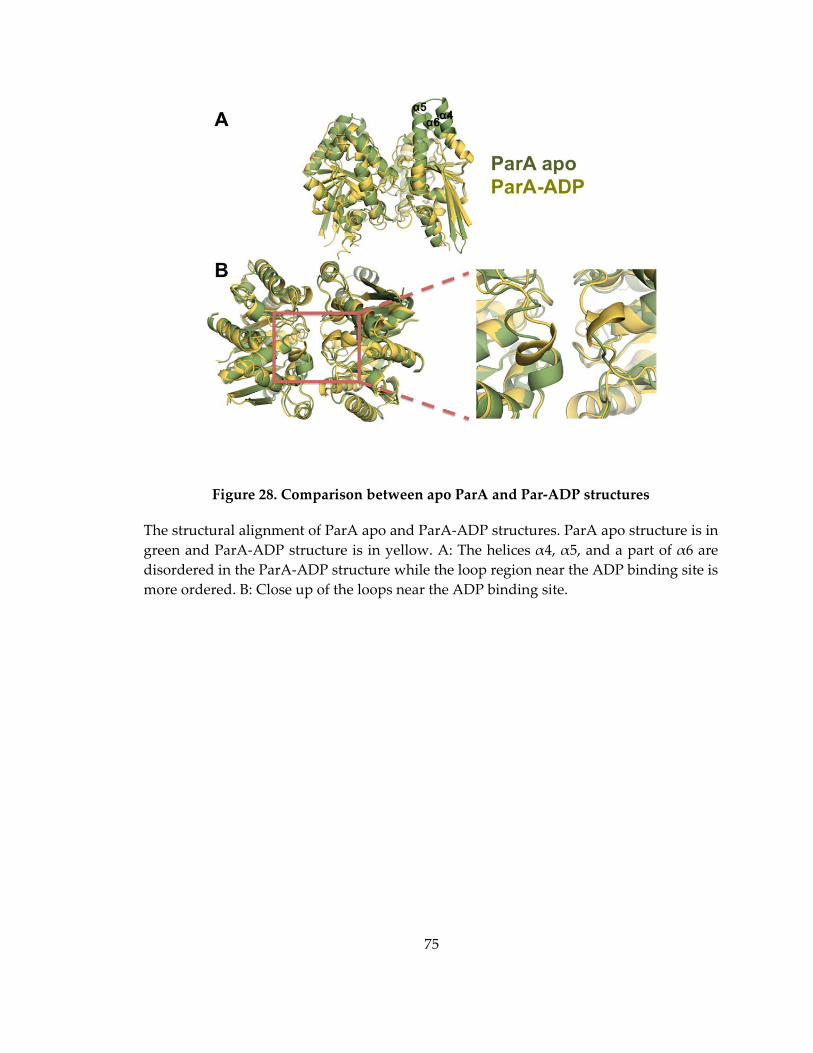
75
Figure 28. Comparison between apo ParA and Par‐ADP structures
The structural alignment of ParA apo and ParA‐ADP structures. ParA apo structure is in
green and ParA‐ADP structure is in yellow. A: The helices α4, α5, and a part of α6 are
disordered in the ParA‐ADP structure while the loop region near the ADP binding site is
more ordered. B: Close up of the loops near the ADP binding site.
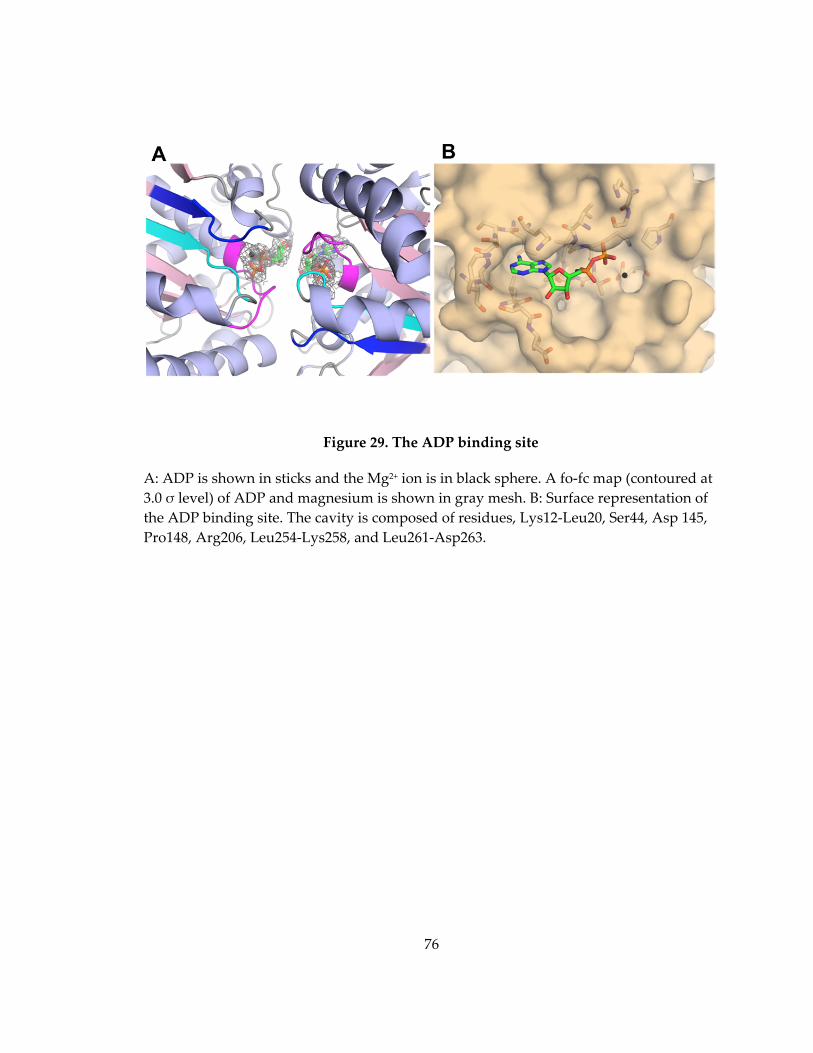
76
Figure 29. The ADP binding site
A: ADP is shown in sticks and the Mg2+ ion is in black sphere. A fo‐fc map (contoured at
3.0 σ level) of ADP and magnesium is shown in gray mesh. B: Surface representation of
the ADP binding site. The cavity is composed of residues, Lys12‐Leu20, Ser44, Asp 145,
Pro148, Arg206, Leu254‐Lys258, and Leu261‐Asp263.

77
Figure 30. Close up view of the ADP binding site
The ADP binding site is composed of residues Lys12‐Leu20, Ser44, Asp 145, Pro148,
Arg206, Leu254‐Lys258, and Leu261‐Asp263. The residues from deviant Walker A motif
are colored in magenta, Walker A’ in blue, and Walker B in cyan.
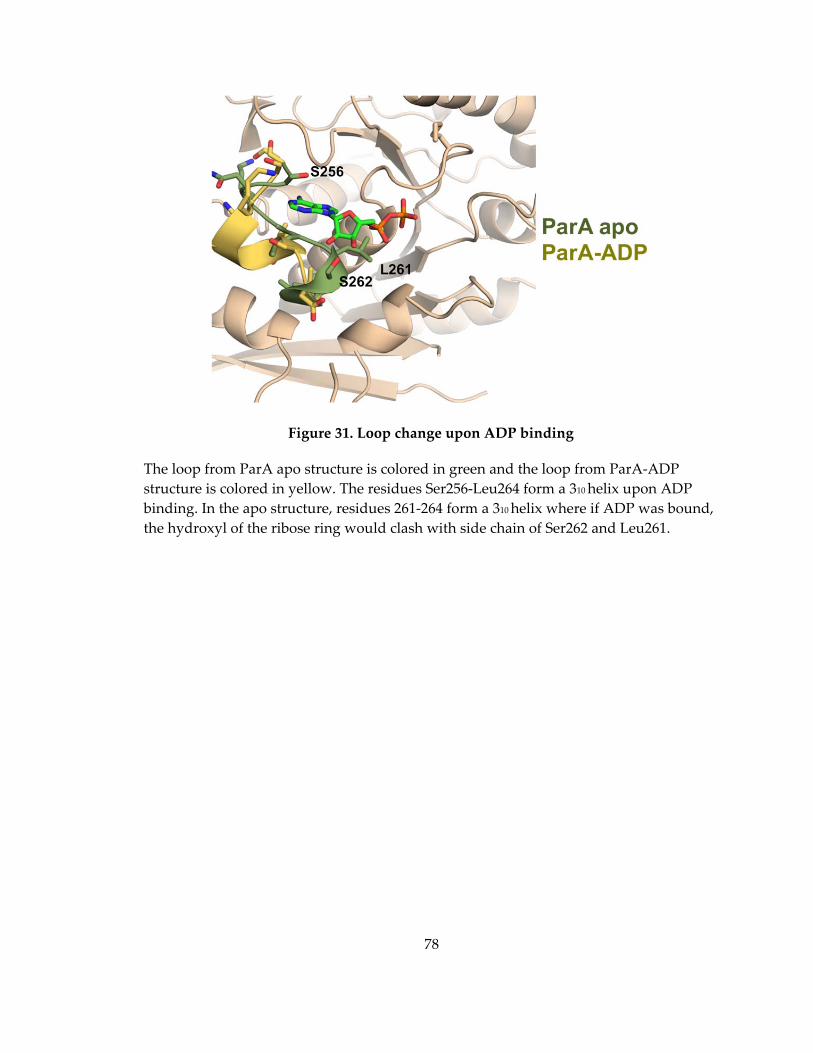
78
Figure 31. Loop change upon ADP binding
The loop from ParA apo structure is colored in green and the loop from ParA‐ADP
structure is colored in yellow. The residues Ser256‐Leu264 form a 310 helix upon ADP
binding. In the apo structure, residues 261‐264 form a 310 helix where if ADP was bound,
the hydroxyl of the ribose ring would clash with side chain of Ser262 and Leu261.
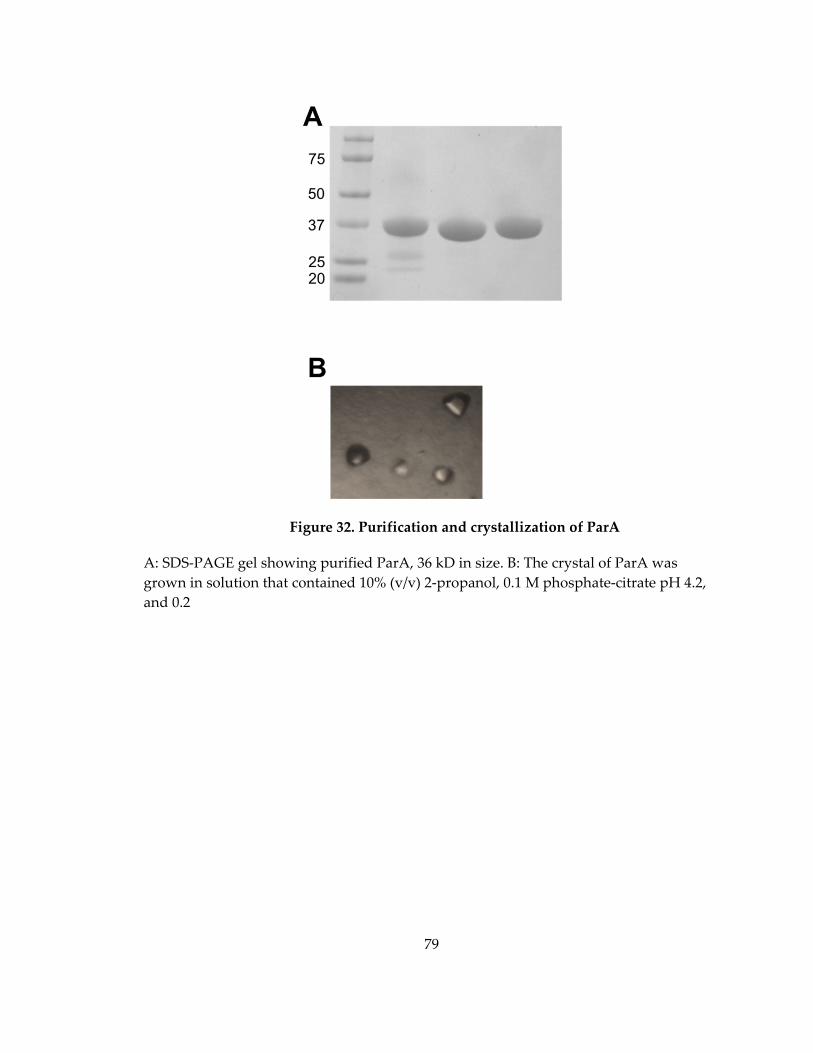
79
Figure 32. Purification and crystallization of ParA
A: SDS‐PAGE gel showing purified ParA, 36 kD in size. B: The crystal of ParA was
grown in solution that contained 10% (v/v) 2‐propanol, 0.1 M phosphate‐citrate pH 4.2,
and 0.2

80
Table 5. Crystallographic statistics for ParA apo and ParA‐ADP structures
ParA apo
ParA‐
ADP
Data Collection Peak Remote Inflection
Space group P3(1)21 P3(1)21 P3(1)21 P3(2)21
a, b, c (Å) 89.1 89.1 89.1 90.3
89.1 89.1 89.1 90.3
116.6 116.6 116.6 61.6
α, β, γ (°) 90, 90, 120 90, 90, 120 90, 90, 120 90, 90, 120
Resolution (Å) 2.45 2.45 2.45 2.74
Unique reflections 20619 20626 20614 7638
Completeness (%) 99.9 99.9 99.8 96.5
Redundancy 10.2 10.1 10.2 3.4
R merge (%) 8.8 8.8 8.5 8.3
MAD phasing
No. of Se sites 12
Figure of merit 0.6063
Refinement
Resolution (Å) 2.45 2.74
Rwork/Rfree (%) 19.0/24.0 22.9/27.7
Ramachandran
Analysis
Most favored (%) 97 97
Disallowed (%) 0 0
RMSD
Bond lengths (Å) 0.9 1.404
Bond angles (Å) 0.005 0.008
aRmerge = ΣhklΣi |Ii(hkl) ‐ I(hkl)|/ΣhklΣi Ii(hkl), where Ii(hkl) is observed intensity and I(hkl) is
the final average value of intensity.bValues in parentheses are for the highest resolution
shell.cFigure of Merit = <|ΣP(α)eiα/P(α)|>, where is the phase and P(α) is the phase probability
distribution. dRwork = Σ||Fobs| ‐ |Fcalc||/Σ|Fobs| and Rfree = Σ||Fobs| ‐ |Fcalc||/F|obs|,
where all reflections belong to a test set of 5% data randomly selected data.

81
Chapter 4. Functional studies of ParA
The stable inheritance of genomic material in bacterial low copy number
plasmids is achieved by the components encoded by par loci: an NTPase, a centromere
binding protein, and a DNA centromere site. Three types of par system have been
defined to date by the nature of the NTPase. Type I systems encode NTPases called
ParA with deviant Walker box motifs, Type II systems use actin‐like proteins called
ParM, and Type III utilizes TubZ proteins with tubulin‐like folds. The partitioning
mechanism of Type II has been fairly well characterized. Bidirectional elongation of
ParM filament capped between two partition complexes pushes the plasmids apart to
opposite cell poles.
The recently recognized Type III partition system has also been suggested to
undergo a filamentous mechanism where the treadmilling TubZ filaments carry the
plasmid to the cell pole. The Type I partition system is the most abundant and common
in bacterial plasmids and chromosomes, however the mechanism of Type I systems is
less understood.
An important characteristic of plasmids maintained by ParA‐type systems is
their regular positioning over the nucleoid (Adachi et al, 2006; Ebersbach et al, 2006;
Hatano et al, 2007; Ringgaard et al, 2009). Studies have shown that ParA dynamically
oscillates across the nucleoid in the presence of ParB and the DNA centromere site. ParA
mutants lacking this property had defects in plasmid partition, suggesting that the
movement of ParA is somehow related to partitioning. However how ParA dynamics

82
facilitate partitioning is still unclear. Studies on different ParA homologs have shown
that they can form polymers in the presence of ATP (Barilla et al, 2005; Bouet et al, 2007;
Bouet & Funnell, 1999; Ebersbach et al, 2006; Lim et al, 2005). Based on the findings that
ParM and TubZ have the ability to form filaments and that their partition functions are
dependent on their nucleotide binding state suggests that the partitioning mechanism of
Type I may resemble that of Type II if ParA polymers are physiologically relevant.
However, ParA is distinct from ParM and TubZ in that it harbors nonspecific DNA
binding activity (Havey et al, 2012; Hester & Lutkenhaus, 2007; Ringgaard et al, 2009;
Vecchiarelli et al, 2010). This in vitro DNA binding activity is consistent with the
nucleoid co‐localization that is observed in vivo. It is speculated that this nonspecific
binding allows ParA proteins to bind to the chromosomal nucleoid and use it as a track
to move between cell poles, carrying the plasmid cargo in its wake.
In the previous chapter, we examined structures of the archaeal ParA and found
that its overall structure is similar to bacterial ParA homologs. This suggests that the
ParA‐type system may be conserved in archaea. In this chapter, we investigate whether
the archaeal ParA shares similar properties with the bacterial ParA homologs using
biochemical analyses. We examined the ATP‐dependent nonspecific DNA binding
activity of ParA by fluorescence polarization based DNA binding assays. Based on our
previously determined crystal structure, we made mutations in the deviant Walker A
motif, the insert region, and the dimerization interface to ascertain their effects on DNA
binding. Furthermore, a characterization of ATP/ADP binding was carried out using
83
ITC. Finally, ATP‐dependent polymer formation of ParA was investigated using
negative stain electron microscopy.
4.1. ATP-dependent nonspecific DNA binding studies using fluorescence polarization based DNA binding assays
In order to examine the DNA binding properties of ParA, fluorescence
polarization based DNA binding studies were carried out. First, we wanted to see
whether the DNA binding property required the presence of ATP. Each assay was
carried out with 1 nM oligonucleotide (23 bp) in the binding buffer containing 25 mM
Tris pH 7.5, 100 mM NaCl, and 2mM of AMPPNP or ADP. The non‐hydrolyzable ATP
analogue, AMPPNP, was used to prevent ATP hydrolysis. The buffer without the
nucleotides was used as a control experiment. During the titration of ParA, binding of
the protein to the fluorescently labeled DNA increases the size of the particle and this
lead to the increase in anisotropy. This change in anisotropy was monitored and
interpreted as a consequence of protein‐DNA complex formation. As shown in Figure
33A, ParA bound DNA nonspecifically only in the presence of 2 mM AMPPNP with a
Kd of 3.8 μM. There was no binding in solution that had 2 mM ADP or no nucleotides.
To confirm whether the binding is nonspecific, another set of experiments was
performed with increasing NaCl concentrations (100 mM, 200 mM, and 300 mM). Since
nonspecific DNA binding typically involves ionic interactions between basic residues
and the acidic DNA phosphate backbone, increasing the salt concentration in the buffer
should reduce the nonspecific DNA binding of ParA. Indeed, in Figure 33B, we
demonstrated that increasing the salt concentration of the binding buffer decreases the

84
DNA binding affinity of ParA. From both sets of experiments, we conclude that ParA
binds DNA nonspecifically in an ATP‐dependent manner.
4.2. Site-directed mutagenesis studies
4.2.1 ATP binding site (deviant Walker A motif)
In order to understand the effect of ATP binding on the nonspecific DNA
binding activity of ParA, mutations on the deviant Walker A motif (KGGxxK[T/S]) were
made (Figure 34). The second residue of the deviant walker box motif, K12 is the
signature lysine of this motif, and is predicted to be crucial for ATP hydrolysis while
K17 is predicted to be responsible for ATP binding. The result showed that the K12 to
alanine mutant retained nonspecific DNA binding activity, while mutating K17 to
alanine completely abrogated the DNA binding activity (Figure 35). These results
suggest that ATP is indeed required for ParA’s nonspecific DNA binding activity.
4.2.2 Insert region
In the previous chapter, we noted a region in the structure that varies
significantly between pNOB8 structures and other ParA homologs. This is the so‐called
insert region, and in the ParA homolog structure consists of two long antiparallel beta
strands that protrude from the structure. This region is nearby the winged HTH region
of P1 ParA after the two structures are superimposed, and moreover, the region was
suggested to be flexible and may only fold upon binding to another protein or DNA. To
test whether this region is involved in DNA binding, we looked for basic residues in the
sequences of this region and found three lysines, K91, K94, and K98, and mutated them
85
to alanine (Figure 34). The result of the DNA binding assays revealed that mutations on
the basic lysine residues, K91, K94, and K98 to alanine had no effect on the DNA binding
activity of ParA (Table 6). This suggests that this insert region does not function in
nonspecific DNA binding.
4.2.3 Dimerization interface
Mutations were made to residues involved in the ParA dimerization interface to
assess their function in DNA binding. The residues that are involved in the dimerization
interface of ParA are negatively or positively charged and mostly located in the loops
between 6‐α8, 7‐α10 and the loop just before α11 (Figure 34). Particularly, there are
four salt bridges that seem to stabilize the dimer of ParA. These interactions are located
between residues, E173‐R55 and R209‐E269. We mutated R55, E173, and E269 to alanine
and tested their affect on DNA binding. The results showed that the DNA binding
affinity of the mutants were the same as wildtype ParA (Table 6). This suggests that
mutating just one residue is not sufficient to break the dimerization interface of ParA.
4.3 ATP/ADP binding studies using Isothermal Titration Calorimetry
To characterize adenine nucleotide binding by ParA, we employed Isothermal
Titration Calorimetry (ITC). Instead of using a non‐hydrolyzable ATP to prevent ATP
hydrolysis in the solution, we used the K12A mutant (ATP non‐hydrolyzable mutant) to
carry out the ATP binding assays. These experiments showed that ParA K12A binds
ATP with a stoichiometry of 1:1 ratio and an equilibrium dissociation constant (Kd) of 3.8
86
μM (Figure 36). The same experiment was carried out to test ADP binding by ParA. The
binding isotherm revealed that ParA K12A binds ADP with a stoichiometry of 1:1 ratio.
The result is consistent with the structural studies in the previous chapter, where ParA‐
ADP dimer structure had two molecules of ADP bound. The equilibrium dissociation
constant for ADP binding by ParA is 2.4 μM.
4.4. ATP-dependent polymerization of ParA
Lastly, negative stain electron microscopy was used to investigate whether ParA
can form polymers in the presence of ATP with the help of Dr. Milam from the Erickson
Lab. The images revealed that ParA at a concentration of 2 μM forms bundles of
filaments in the presence of 1 mM MgCl2 and 2 mM AMPPNP or 2 mM ATP (Figure 37B,
37C), while showing an absence of filament in the presence of 2 mM ADP or no
nucleotide (Figure 37A, 37D). Next, we lowered the concentration to 1 μM. Even at a
lower concentration, we observed bundles of filaments but we also observed individual
filaments in the bundle (Figure 38). This suggests that ParA has the tendency to
polymerize in bundles of filaments in the presence of ATP.
4.5 Effect of DNA on ParA polymer formation
The in vivo substratum of ParA proteins is nucleoid DNA. Thus, we next used the
same approach to examine the effect of DNA on ATP‐dependent polymer formation by
comparing samples that contain ParA‐ATP‐DNA and ParA‐ATP‐no DNA. Recent
studies on different ParA homologs have suggested that DNA appears to have different
effects on ParA polymerization. For example, Soj of Thermus thermophilus and δ of

87
Streptococcus pyogenes pSM19035 only form polymers on DNA while SopA filament
formation seems to be antagonized by its interaction with DNA. However, these studies
used different lengths and sizes of DNA. To try and better mimic the nucleoid, we first
used a linearized pUC9 plasmid, 2.7 kilobase (kb) pairs in size. Interestingly, we find
that ParA still forms polymers in the presence of nonspecific DNA, but there is a striking
difference in the shapes and the pattern of ParA polymers between the sample with
ParA‐ATP (Figure 39A) and that with ParA‐ATP bound to plasmid DNA. The images in
Figure 39B and 39C indicate that in the presence of plasmid DNA, ParA appears to align
along the DNA in a regular pattern. We could not see any sign of regular aggregates or
polymers in the images of ParA‐ATP in the presence of 16 base pairs of DNA
oligonucleotides with random sequences (Figure 39D). These data indicate that the size
of the DNA substrate and possibly its three dimensional structure greatly impacts the
polymerization properties of ParA.
4.6 Discussion
4.6.1 DNA binding by ParA and ParA homologs
Here we demonstrated the ATP‐dependent nonspecific DNA binding activity of
archaeal ParA. In the presence of AMPPNP and Mg2+, ParA showed the ability to bind
DNA nonspecifically. No binding was observed in the presence of ADP or no nucleotide
in the binding buffer. Next, in order to confirm whether ATP binding is really crucial to
ParA’s nonspecific DNA binding activity, we made two mutants on the deviant Walker
A motif. Mutation of K17 to alanine abolished DNA binding suggesting that indeed,

88
ATP binding is critical for DNA binding. Additionally, the K12 to alanine mutation had
no effect on DNA binding, which indicates that ATP hydrolysis is not required for DNA
binding. This ATP‐dependent nonspecific DNA binding activity has been observed in
both Type Ia and Type Ib ParA homologs (Bouet et al, 2007; Pratto et al, 2008; Ringgaard
et al, 2009; Vecchiarelli et al, 2010).
How is this nonspecific DNA binding relevant to DNA partitioning? The in vitro
nonspecific DNA binding is consistent with the co‐localization of ParA with the
nucleoid (Hester & Lutkenhaus, 2007; Leonard et al, 2005; Ringgaard et al, 2009). ParA
may use the nucleoid DNA as a track to move along the axis of the cell from one pole to
the other. This is also supported by the studies that showed dynamic oscillation of ParA
proteins across the nucleoid (Lim et al, 2005; Marston & Errington, 1999; Quisel et al,
1999). Moreover, several studies have shown that nonspecific DNA binding is essential
to the partitioning process. Indeed, when a surface exposed arginine in Soj was mutated
it eliminated DNA binding (Hester & Lutkenhaus, 2007). An F SopA mutant (K340A)
that had a mutation located at the C‐terminus of the protein, was unable to bind DNA
and also had a severe defect in partition in vivo (Castaing et al, 2008). The mutants used
in both of these studies were shown to form dimers and were able to bind and
hydrolyze ATP, indicating the partitioning defect resulted from the abrogation of DNA
binding. Similar to bacteria, archaea also lack a true nucleus and nuclear envelope. Thus,
the nonspecific DNA binding activity of archaeal ParA proteins indicate that they
therefore could utilize the nucleoid DNA as a track for DNA cargo movement.

89
Furthermore, the ATP hydrolysis activity of different ParA proteins has been
shown to be essential for the partition process (Barilla et al, 2005; Fung et al, 2001; Pratto
et al, 2008). For example, the catalytically inactive protein (K36A) was shown to be
defective in plasmid partitioning (Pratto et al, 2008). Several studies have also revealed
that while ParA proteins alone have weak ATPase activity, this activity is significantly
stimulated in the presence of both non‐specific DNA and ParB (Davis et al, 1992;
Watanabe et al, 1992). It was further demonstrated that the ATPase activity of ParA is
stimulated by a putative arginine finger located at the N‐terminus of its partner ParB
protein (Barilla et al, 2007; Pratto et al, 2008). This suggests that ParB proteins promote
the conversion of ParA‐ATP to ParA‐ADP, potentially causing the detachment of ParA
from the nucleoid (Ringgaard et al, 2009; Vecchiarelli et al, 2010). However, how ATPase
activity generates the force for plasmid partition is still unclear.
4.6.2 Assembly of proteins in the Walker-type family of proteins
Here, we observed that ParA form polymers in the presence of AMPPNP or ATP
and magnesium at a physiologically relevant concentration ( 5 M). Moreover, in the
presence of DNA, more regular linear aggregates of structures were observed. This
suggests that ParA does not form a long and discrete filament like ParM, but rather
bundles together to form irregular polymers. It can be speculated that ParA may have
the tendency to form aggregates so it can simultaneously interact with the partition
system for more stability. This is supported by the study on pB171 par locus, where it
was suggested that filament bundling may reduce the detachment rate of the plasmid

90
from the filament end (Ringgaard et al, 2009). This is more optimal for pNOB8 system
since the partition complex has two protein components, ParB and AspA to provide
more stability and strength for numbers of contacts with the ParA polymer.
Polymerization of ParA has been demonstrated in a numbers of studies (Barilla
et al, 2005; Bouet et al, 2007; Dunham et al, 2009; Ebersbach et al, 2006; Havey et al, 2012;
Pratto et al, 2008), although the protein concentrations used in the experiments were far
above physiological relevant concentrations. Hence, whether polymerization is required
for Type I partition is still controversial. However, some studies support a role for
polymerization. For example, discrete linear ParA structures were observed by super‐
resolution fluorescence imaging in Caulobacter crescentus (Ptacin et al., 2010). A study of
the Vibrio cholera chromosome II ParA2 protein showed that it formed helical filaments
on double‐stranded DNA using electron microscopy (Hui et al., 2010). Moreover, in vivo
imaging of fluorescently labeled pB171 ParA revealed helical, filamentous structures
that colocalized with the nucleoid (Ringgaard et al., 2009). In the same study, a pulling
mechanism was proposed. In this mechanism, ParA‐ATP binds to the nucleoid DNA
and polymerizes on the nucleoid. Once ParB stimulates its ATP hydrolysis, ParA starts
to depolymerize and the retraction of the ParA polymer generates the pulling force for
plasmid movement.
In the diffusion ratchet mechanism, ParA‐ATP dimers are though to mediate
partition. Similarly to the polymerization or pulling model, here ParA‐ATP binds to the
nucleoid nonspecifically. In this case, it is thought the ParA dimers form a gradient‐like

91
distribution on the nucleoid. Furthermore, in the study of P1 ParA, a slow
conformational change from ParA‐ATP to ParA‐ATP* was proposed. As a consequence
of this putative conformational change, a time delay is provided between the release of
ParA‐ADP from the nucleoid and rebinding of ParA‐ATP* to the nucleoid. This time
delay generates an uneven distribution of nucleoid bound ParA‐ATP dimers and hence,
according to this model, provides the motive force for plasmid partition (Vecchiarelli et
al, 2010). The dynamic interactions of F‐ and P1‐plasmid partition systems have been
recapitulated in vitro using total internal reflection fluorescence microscopy (TIRFM)
using purified components inside a DNA‐carpeted flow cell as an artificial nucleoid
surface (Hwang et al, 2013; Vecchiarelli et al, 2013). However, the shortcoming of the in
vitro system used in these studies was that the partition complexes were only transiently
tethered to the DNA carpet and the plasmid diffused away from the carpet (Hwang et al,
2013). It was hypothesized that the surface confinement was required to maintain
contact between the plasmid and the DNA carpet. To mimic surface confinement on the
nucleoid, magnetic beads coated with plasmid partition complexes were used and a
magnetic force perpendicular to the DNA‐coated flow cell surface was applied. The
result revealed a directed cargo motion driven by a surface ATPase gradient, which
suggested that physical confinement is another key requirement for ParA‐mediated
plasmid segregation by such a diffusion‐ratchet model (Vecchiarelli et al, 2014). Indeed,
the shortcomings of this model residue in the fact that the characteristics of a magnetic
bead differ from those of a DNA molecule, and the magnetic force used here to confine
92
the beads to the DNA‐carpeted surface may not recapitulate the situation in cells
(Kiekebusch & Thanbichler, 2014).
These findings have called into question the relevance of ParA polymerization in
Type I segregation. However, a recent mathematical modeling study suggested that
rather than localizing all over the nucleoid, ParA‐ATP dimers may be organized in a 1D‐
like structure along the nucleoid. One potential explanation for this was that ParA‐ATP
structures are sensitive to the overall nucleoid architecture (Ietswaart et al, 2014). Thus,
the question of how the chromosomal architecture may affect ParA function also needs
to be addressed.
4.7 Experimental procedures
Expression and Purification of ParA The gene expressing ParA was obtained as
a codon‐optimized gene from Genscript and cloned into pET15b. The resulting construct
was transformed into BL21(DE3). For protein expression, 250 ml of LB medium with 100
g/ml ampicillin was inoculated with one colony of the pET15b‐parA construct and was
grown overnight at 37 ˚C. This 250 ml culture was used to inoculate 9 L of LB. The
resultant cells were grown at 37 ˚C to an OD600 of 0.6 and then induced with 0.5 mM
IPTG for 16 hrs at 9 ˚C and harvested by centrifugation. For purification, cells were
resuspended in buffer A (25 mM Tris pH 7.5, 300 mM NaCl, 2 mM BME, and 5%
glycerol), lysed and centrifuged. The supernatant was loaded onto a Ni‐NTA column
and washed with buffer A containing 7 mM Imidazole. The protein was eluted with

93
buffer A containing 300 mM Imidazole. Buffer exchange and protein concentration were
carried out using Amicon ultra centrifugation filters (Millipore).
DNA binding studies A DNA oligodeoxynucleoide (23 bp) with the sequence, 5’‐
TGC TCT ATG ATT AAC ATA GAG CA ‐3’, labeled with 6‐carboxyfluorescein at the 3′‐
end was used for fluorescence polarization (FP) studies. The labeled DNA was annealed
with the unlabeled complementary strand with the sequence, 5’‐ TGC TCT ATG TTA
ATC ATA GAG CA ‐3’. The DNA binding assay was carried out at 25 °C in 1 ml binding
buffer containing 25 mM Tris pH 7.5, 100 mM NaCl, and 1 mM MgCl2 with 1 nM labeled
DNA and 2 mM of AMPPNP or ADP. The non‐hydrolyzable ATP analogue, AMPPNP,
was used to prevent ATP hydrolysis in the solution. An assay was performed using
buffer without the magnesium and the nucleotides as a control. Samples were excited at
490 nm, and the fluorescence emission was measured at 520 nm. Each assay was carried
out with 1 nM oligonucleotide in the binding buffer and ParA (at 1 mg/ml, 26 μM) was
titrated into the reaction mixture. Changes in fluorescence millipolarization (mP= P∙10−3,
where P is polarization) upon ParA addition were monitored using a Panvera Beacon
2000 (Panvera Corporation). The data were normalized using the equation, (P‐P0)/(Pmax‐
P0), and analysed with KaleidaGraph and fitted to a simple bimolecular binding model
by nonlinear least squares regression using the following equation such that the Kd
values represent the protein concentration at half‐maximal DNA binding (Lundblad et
al, 1996):

94
(A= Measured anisotropy, [L}= ligand concentration, Af= Anisotropy of free fluorescent
molecules, Ab= Anisotropy of bound fluorescent molecules)
Site‐directed mutagenesis Mutagenesis of ParA was performed by following the
instructions provided with the QuickChange site‐directed mutagenesis kit (Stratagene).
PCR was carried out in a 50 μl mixture using 100 ng template plasmid DNA, 200 ng of
each primer, 10 nmol of dNTP mix, and 2.5 U of cloned Pfu DNA polymerase in Pfu
polymerase buffer. Primers used for mutagenesis are listed in Table 7. After PCR, 1 μl of
DpnI was added to the PCR reaction and was incubated at 37 °C for one hour. The
mixture was then transformed into DH5α competent cells. The mutation was verified by
DNA sequencing. All mutants were expressed and purified by the same method as
described above.
Isothermal Titration Calorimetry (ITC) Protein samples were dialyzed into
buffer containing 25 mM Tris pH 7.5 and 150 mM NaCl and thoroughly degassed before
use. The concentration of protein samples was determined by Bradford assay. All ITC
measurements were performed at 25 °C using a VP‐ITC calorimeter (Microcal). 28 5‐μl
injections of the 0.5 mM ATP were automatically injected into 470 μl of 26 μM of ParA
with an interval of 250 sec at a constant stirring rate of 250 rpm or 28 5‐μl injections of
the 0.5 mM ADP were automatically injected into 470 μl of 260 μM of ParA. All data
were collected and analyzed using the manufacturer‐supplied software package, Origin
7.0 (OriginLab Corp.). The resulting isotherms were fit to one‐site independent binding
95
model during iterative fitting until the model best fit the data. Control experiments were
carried out by titrating the binding buffer into the cell containing solution of ParA in the
cell.
Filament Formation and Electron Microscopy ParA at 2 μM was incubated in 25
mM Tris pH 7.5, 100 mM NaCl, 1 mM MgCl2, and 2 mM AMPPNP or 2 mM ATP or 2
mM ADP for 30 minutes at 37 ˚C before application to EM grids. ParA‐DNA polymers in
the presence of ATP were prepared with 1 μM ParA in 25 mM Tris pH 7.5, 100 mM
NaCl, 1 mM MgCl2, and 2 mM ATP with a linearized pUC9 plasmid DNA (2.7 kilobase
pairs) at a ratio of 30:1 (wt/wt). This mixture was incubated at 37 °C for 30 min before
application to EM grids. For negative staining, grids covered with a thin carbon film
were made hydrophilic by exposure to UV light and ozone using a Spectroline 11SC‐1
Pencil shortwave UV lamp (catalog number 11‐992‐30; Fischer Scientific, Pittsburgh, PA)
and UVP Pen‐Ray lamp power supply (catalog number UVP99 0055 01; Fischer
Scientific). The grids were treated for 45 min and negatively stained using three drops of
2% uranyl acetate. Images were collected on a Philips EM420 equipped with a CCD
camera.

96
Figure 33. ATP‐dependent nonspecific DNA binding activity of ParA.
A: Each assay was carried out with 1 nM oligonucleotide in the binding buffer
containing 25 mM Tris pH 7.5, 100 mM NaCl, and 2mM of AMPPNP or ADP or no
nucleotide. B: Salt‐dependent nonspecific DNA binding activity of ParA.

97
Figure 34. Structure based site‐directed mutagenesis studies
The residues of deviant Walker A motif are indicated in magenta, the basic residues
from the insert region are indicated in cyan, the residues in dimerization interface are
indicated in yellow.

98
Figure 35. Site‐directed mutagenesis studies on deviant Walker A motif.
A: Effect of ATP binding on DNA binding activity. B: Effect of ATP binding on DNA
binding activity.
A B K12A K17A
: 2 mM AMPPNP : no nucleotide
: 2 mM AMPPNP : no nucleotide
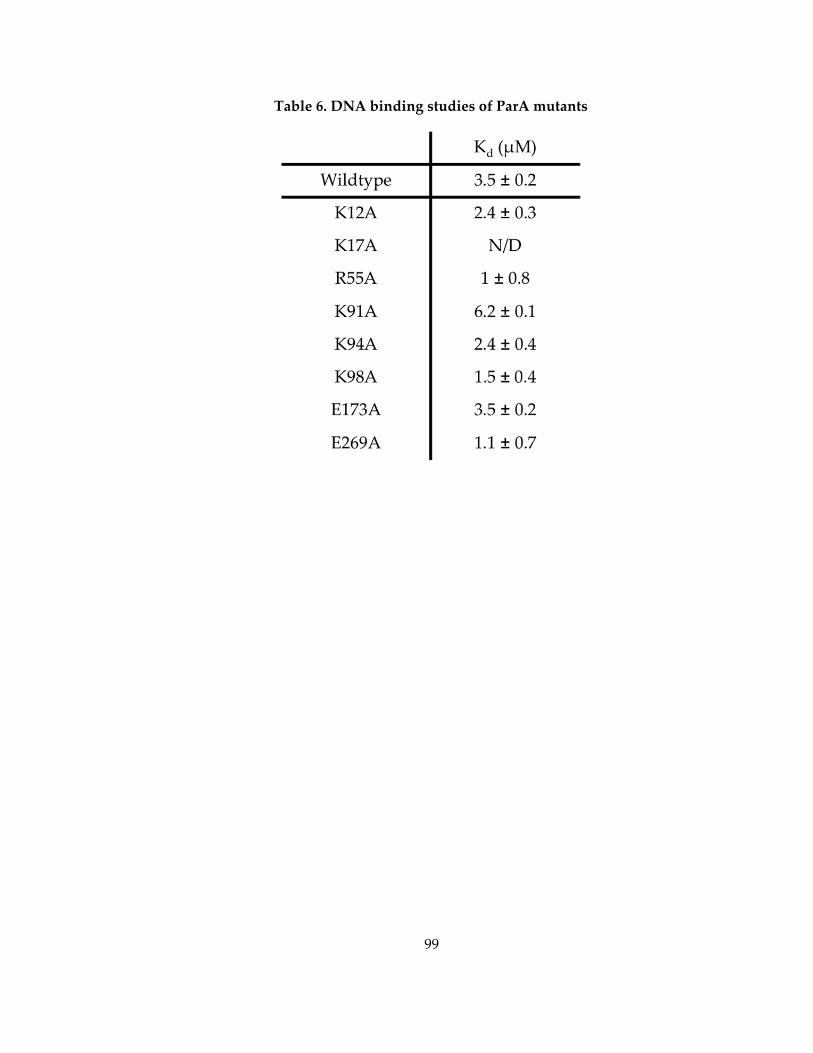
99
Table 6. DNA binding studies of ParA mutants

100
Figure 36. ITC isotherms of ATP binding and ADP binding of ParA
Representative experiments are shown. In each case the heat signal is shown (upper
panels) together with the binding isotherm derived from this signal. A: ParA (26 M) in
the cell, ATP (500 M) in the syringe. B: ParA (26 M) in the cell, ADP (500 M) in the
syringe.
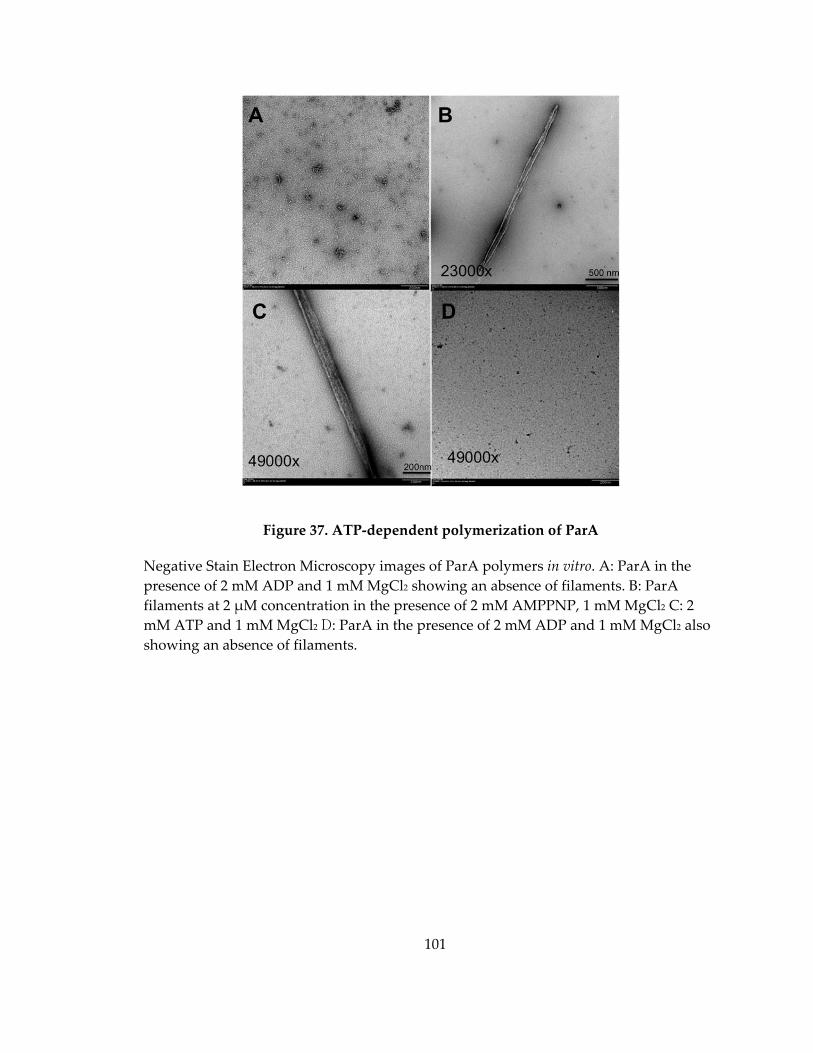
101
Figure 37. ATP‐dependent polymerization of ParA
Negative Stain Electron Microscopy images of ParA polymers in vitro. A: ParA in the
presence of 2 mM ADP and 1 mM MgCl2 showing an absence of filaments. B: ParA
filaments at 2 μM concentration in the presence of 2 mM AMPPNP, 1 mM MgCl2 C: 2
mM ATP and 1 mM MgCl2 D: ParA in the presence of 2 mM ADP and 1 mM MgCl2 also
showing an absence of filaments.

102
Figure 38. ATP‐dependent polymer formation at 1 μM protein concentration
ParA at 1 μM concentration revealed the individual single filaments in the presence of 1
mM MgCl2 and 2 mM AMPPNP.
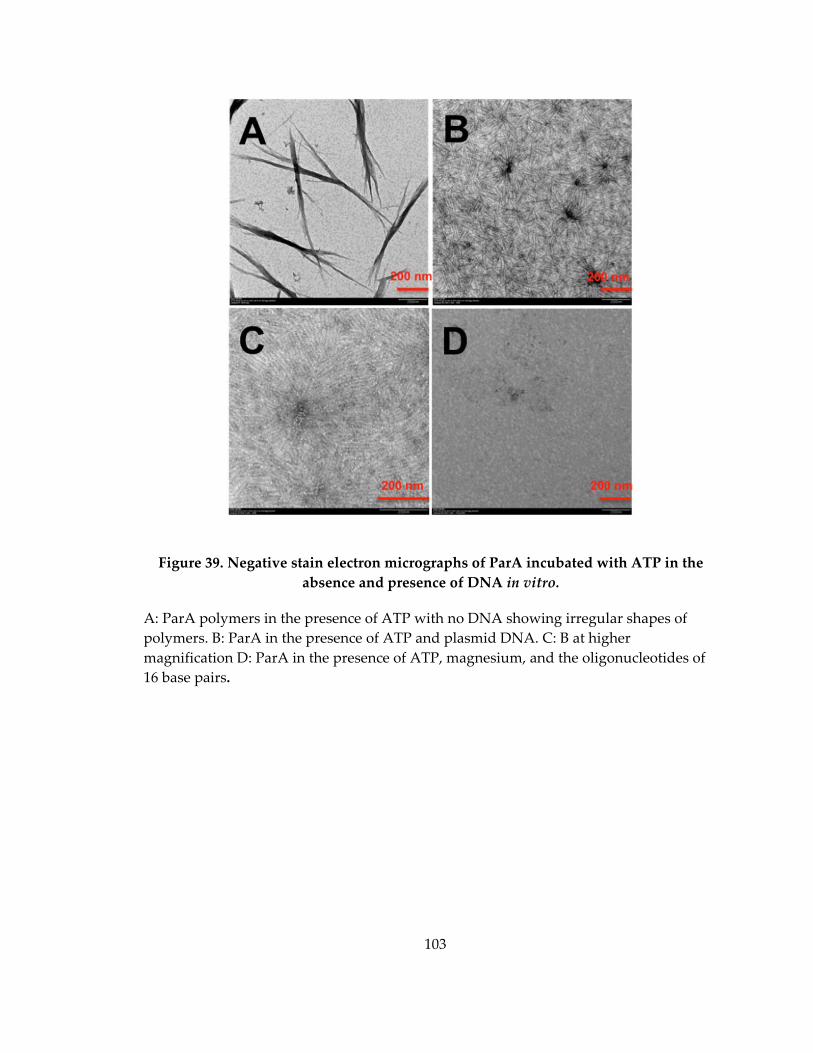
103
Figure 39. Negative stain electron micrographs of ParA incubated with ATP in the
absence and presence of DNA in vitro.
A: ParA polymers in the presence of ATP with no DNA showing irregular shapes of
polymers. B: ParA in the presence of ATP and plasmid DNA. C: B at higher
magnification D: ParA in the presence of ATP, magnesium, and the oligonucleotides of
16 base pairs.

104
Table 7. Primers used for site‐directed mutagenesis
Forward Reverse
K91A CTTCATCCATGTTAGTGCGAC
CTCCAAAGGCGAAG
CTTCGCCTTTGGAGGTCGCACTA
ACATGGATGAAG
K94A CATGTTAGTAAAACCTCCGC
AGGCGAAGTTAAAGTCTCC
GGAGACTTTAACTTCGCCTGCGG
AGGTTTTACTAACATG
K12A GGTAAAGTTATCGCAATCCA
CAATTTCGCAGGCGGTGTTGG
TAAAA
TTTTACCAACACCGCCTGCGAAA
TTGTGGATTGCGATAACTTTACC
K17A CAAAGGCGGTGTTGGTGCAA
CGACGCTGACGGCG
CGCCGTCAGCGTCGTTGCACCA
ACACCGCCTTTG
R55A CCAAATCTTTGTTAAAGAAG
AACGTGCCAAAGAAATTCTG
CAGCAAAGTATC
GATACTTTGCTGCAGAATTTCTT
TGGCACGTTCTTCTTTAACAAAG
ATTTGG
E173A GGAAGATGGCACCATTGCAG
CATTCAACGCTATG
CATAGCGTTGAATGCTGCAATG
GTGCCATCTTCC
E269A GATCTGGCGCAACGCATCCA
TTCCGCCGA
TCGGCGGAATGGATGCGTTGCG
CCAGATC

105
Chapter 5. Discussion and Conclusion
DNA partition is essential for the faithful inheritance of the genome and is
necessary for the survival of organisms across all kingdoms. To date, nothing has been
known at the molecular level regarding the DNA segregation machinery of archaea.
This work has focused on a homolog of the pNOB8 ParA protein. The
segregation cassette on the pNOB8 plasmid is similar to bacterial systems in that it
encodes ParA, a Walker box ATPase, and ParB. Additionally, the cassette contains a
third required protein component called AspA. Thus, this archaeal segregation cassette
is atypical in that it has a tricistronic architecture, unlike the more typical bicistronic
architecture found in bacteria. Here, we have structurally and biochemically
characterized a pNOB8 ParA homolog. The structure of this ParA revealed that it is
structurally similar to the bacterial ParA proteins. Moreover, its abilities to bind DNA
nonspecifically and to form polymers in the presence of ATP were also similar to what
has been observed in bacterial ParA proteins. Recent data has shown that chromosome
of Sulfolobus solfataricus also employs a Walker‐based segregation system. Here the ParA
and ParB homologs have been called SegA and SegB, respectively (Kalliomaa‐Sanford et
al, 2012). Thus, this indicates that Walker‐box‐based partition systems may be widely
conserved in archaea.
While the motor protein of the pNOB8 partition system shows strikingly similar
features to bacteria, there are also some unexpected eukaryotic features in the system.
The crystal structure of the C‐terminal region of ParB was solved in the lab (Schumacher,

106
manuscript under review), and the structure shows strong structural homology to
CenpA. CenpA is a histone H3 variant, which serves to mark the centromere location in
eukaryotes. It is essential for the recruitment and assembly of the eukaryotic
chromosome segregation machinery (Sekulic et al, 2010; Tachiwana & Kurumizaka,
2011).
5.1 Speculative Model for archaeal ParA mediated partition
The structural and biochemical data presented in this work together with other
studies in the Schumacher lab and experiments on other Type I par systems leads to a
speculative model for pNOB8 plasmid segregation. In this model, cycles of assembly
and disassembly of ParA aggregates generates the force that drives movement of the
plasmids over the nucleoid, as shown in Figure 40. In this model ParA would first bind
ATP driving it into an active dimer state, allowing ParA to bind the nucleoid. Once the
ParA aggregates contact the partition complex, ParA ATP hydrolysis activity is
stimulated at the end of the ParA aggregate. This would lead to retraction of ParA and
its movement across the nucleoid. As it moves, it would drag the ParB‐AspA‐plasmid
cargo in its wake. This is a highly speculative model and much remains to be studied to
arrive at a molecular model for partition.
5.2 Comparison with closely related Min System in E. coli
The minCDE locus of E. coli encodes three components required for preventing
FtsZ‐ring formation at the cell poles: MinD is a Walker box protein (ATPase), like
partition ParAs, that oscillates rapidly from one cell pole to the other. MinC inhibits the
107
formation of the FtsZ‐ring, MinE stimulates the ATPase activity of MinD and generates
the dynamic oscillation property of the MinCD complex (Raskin & de Boer, 1999). The
similarities between the Min system of E. coli and ParA‐type partitioning systems are
intriguing. First, ParA and MinD are both deviant Walker‐box ATPases with similar
structures. Both proteins have been observed to have dynamic oscillation properties on a
cellular binding surface (nucleoid and cell membrane, respectively) (Ebersbach &
Gerdes, 2004; Raskin & de Boer, 1999; Ringgaard et al, 2009). Furthermore, the
nucleotide binding state determines the subcellular locations of ParA and MinD, where
ATP‐bound dimers interact with their cellular surface while ATP hydrolysis stimulated
by their partner proteins (ParB and MinE, respectively), releases the proteins from their
surface bound states (Barilla et al, 2007; Dunham et al, 2009; Leonard et al, 2005; Ma et al,
2004; Pratto et al, 2008). The dynamic oscillatory behavior of ParA and MinD somehow
functions to position a specific cellular structure (plasmid and FtsZ ring, respectively)
(Raskin & de Boer, 1999; Ringgaard et al, 2009).
5.3 ParA-like ATPases in other processes
Recent studies have reported a new class of ParA‐like protein to be involved in
protein transport. These proteins have been shown to function in the subcellular
localization of the chemotaxis machinery in Rhodobacter spheroids (Thompson et al, 2006),
cell pole maturation in Vibrio cholerae (Ringgaard et al, 2011), and the mediation of the
accurate distribution of carboxysomes in the cyanobacterium Synechococcus (Savage et al,
2010). The resulting subcellular distributions resemble the equipositioning of plasmids
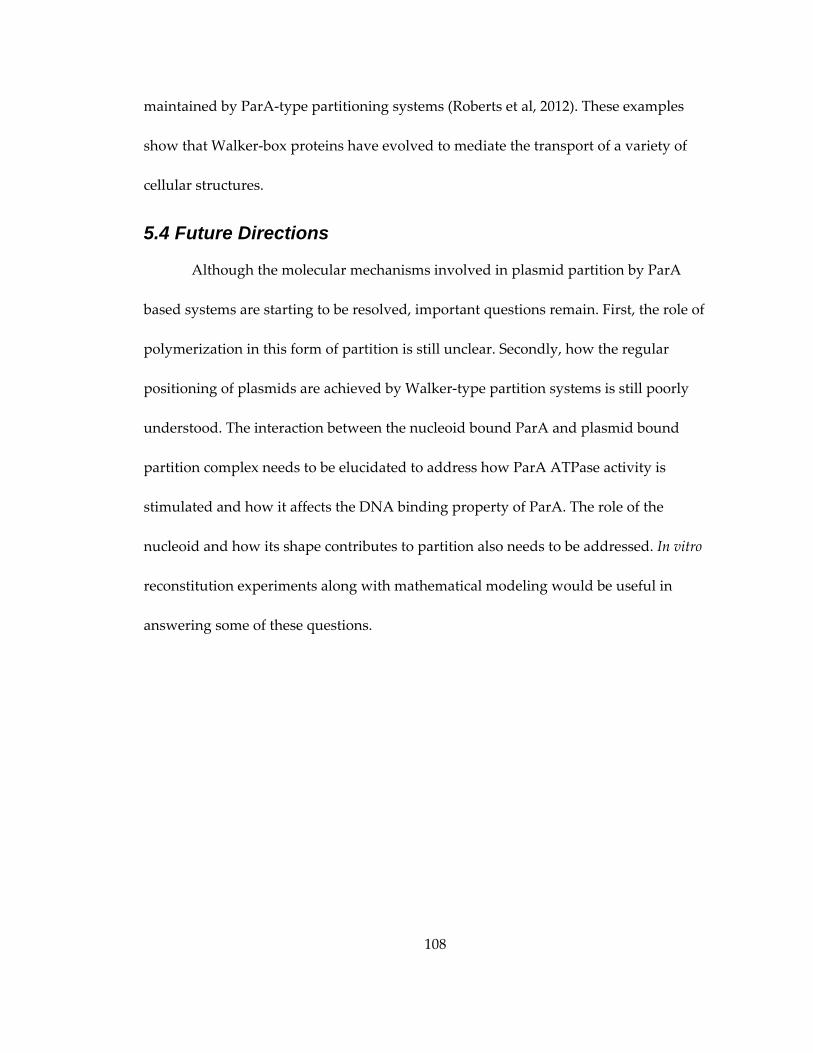
108
maintained by ParA‐type partitioning systems (Roberts et al, 2012). These examples
show that Walker‐box proteins have evolved to mediate the transport of a variety of
cellular structures.
5.4 Future Directions
Although the molecular mechanisms involved in plasmid partition by ParA
based systems are starting to be resolved, important questions remain. First, the role of
polymerization in this form of partition is still unclear. Secondly, how the regular
positioning of plasmids are achieved by Walker‐type partition systems is still poorly
understood. The interaction between the nucleoid bound ParA and plasmid bound
partition complex needs to be elucidated to address how ParA ATPase activity is
stimulated and how it affects the DNA binding property of ParA. The role of the
nucleoid and how its shape contributes to partition also needs to be addressed. In vitro
reconstitution experiments along with mathematical modeling would be useful in
answering some of these questions.

109
Figure 40. Schematic figure of the speculative model for archaeal ParA mediated
partition

110
Appendix. Protein-protein interaction studies of RacA and DivIVA
Introduction
DNA segregation is a process essential for the accurate inheritance of the genetic
material. This is a challenge in the cells that divide asymmetrically, such as B. subtilis.
Cell division in the growing cells of B. subtilis occurs in the mid‐cell by binary fission,
while sporulating cells undergo asymmetric cell division leading to the generation of
two different sized daughter cells, the forespore (the small sized) and the mother cell.
Early in sporulation, the chromosome destined to enter the spore needs to be positioned
to the extreme pole of the cell to ensure both the forespore and the mother cell each
receive a chromosome. The mechanism of chromosome segregation during sporulation
begins with chromosome remodeling. Specifically, chromosomes become condensed to
form an elongated, serpentine‐like structure known as the axial filament (Ryter et al,
1966), which has oriC located at its ends. The axial filament extends from pole to pole,
with the oriC region of each chromosome anchored at each pole (Hauser & Errington,
1995; Pogliano et al, 2002). Then the septum forms near one pole and traps the oriC
region of one chromosome (about one third of the chromosome) into the newly formed
forespore (Wu & Errington, 1994). The SpoIIIE protein assembles at the edge of the
septum into a pore that transverses the septum, and serves to translocate the remaining
portion of the chromosome across the septum into the forespore (Wu & Errington, 1994;
Wu & Errington, 1997) (Figure 41).

111
RacA is 184 residue sporulation‐specific protein that has both specific and
nonspecific DNA binding activity. It binds with high specificity to GC‐rich regions near
the oriC with the consensus, TGACGCCGGCGTCA (Ben‐Yehuda et al, 2003).
Importantly, fluorescence microscopy studies showed that RacA is essential for the
formation of the axial filament, which is required to efficiently trap the chromosome into
the forespore. Moreover, RacA was shown to localize to the cell poles. Its polar
localization function is needed for the anchoring of the segregating chromosome at cell
poles. This polar targeting was suggested to be dependent on its interaction with
DivIVA (Wu & Errington, 2003).
DivIVA is located at mid‐cell during cell division and at the cell poles in mature
cells. DivIVA is also responsible for the polar localization of the cell division inhibitor
MinCD in B. subtilis (Edwards & Errington, 1997; Marston & Errington, 1999). During
sporulation DivIVA acts as an anchor for the oriC region at the cell poles in preparation
for asymmetric cell division (Thomaides et al, 2001). Crystal structures of DivIVA
domains revealed that its N‐terminal lipid‐binding domain (LBD) forms a parallel
coiled‐coil. Mutagenesis studies showed this region is essential for membrane binding.
Although it was at low resolution, the crystal structure of the C‐terminal domain (CTD)
of DivIVA displayed a curved tetramer formed by two parallel coiled‐coils. It was
suggested that this DivIVA domain interacts with other proteins (Oliva et al, 2010).
Our lab has recently determined structures of RacA bound to its cognate DNA
site (Schumacher, manuscript in preparation). Interestingly, these structures showed
112
that the N‐ terminal region of RacA, which contains a HTH domain, binds DNA both
specifically and nonspecifically. Furthermore, these structures unveiled a mechanism for
how RacA forms the axial filament when bound to the chromosome. These findings
combined with previous data from other labs showing that a truncated RacA protein
lacking the HTH domain localized only to the cell suggests that the C‐terminal region of
RacA is responsible for polar localization, probably via interaction with other proteins,
while the N‐terminal domain binds DNA and forms the axial filament (Ben‐Yehuda et
al, 2003). Further support for this model, are data revealing a positive interaction
between DivIVA and RacA by bacterial two‐hybrid interaction assays (Lenarcic et al,
2009). However, to date there are no biochemical data showing a direct interaction
between DivIVA and RacA. To determine if the RacA C‐terminal domain does in fact
bind directly to the DivIVA C‐terminal domain, we employed ITC. Specifically, we
analyzed the ability of the DivIVA C‐terminal region (59‐164) and the RacA C‐terminal
region (70‐184) to interact (Figure 42).
Result
As shown in the Figure 43, the result of ITC experiment demonstrated that
indeed, the RacA and DivIVA C‐terminal regions interact. The molar ratio of the two
binding curves is 0.88 and 0.82, which suggest that RacA and DivIVA interact with a
stoichiometry of 1:1. The Kd of both experiments is 1.9 μM and 1.5 μM.

113
Discussion
Here, we have demonstrated a direct protein‐protein interaction between the
RacA and DivIVA C‐terminal regions using ITC. Previous studies indicated that RacA is
a kinetochore‐like protein, which assembles into an adhesive patch that anchors the oriC
region of the chromosome to the cell pole via an interaction with DivIVA (Ben‐Yehuda
et al, 2003). Our data begin to provide a molecular picture of how this essential cell
division protein, RacA, mediates its unusual functions.
Experimental Procedures
Expression and purification of DivIVA and RacA C‐terminal domains. A gene
encoding the DivIVA C‐terminal domain was obtained from Genscript and subcloned
into pET15b. This construct was transformed into C41(DE3) cells., For protein
expression, 250 ml of LB supplemented with ampicillin was inoculated with one colony
containing the pET15b‐DivIVA construct and was grown overnight at 37 ˚C. This 250 ml
culture was used to inoculate 9 L of LB medium. Cells were grown at 37 ˚C to an OD600
of 0.6 and then induced with 0.5 mM IPTG for 16 hrs at 15 ˚C and harvested by
centrifugation. The cells were resuspended in buffer A (25 mM Tris pH 7.5, 300 mM
NaCl, 2 mM BME, and 5% glycerol), lysed and centrifuged. The supernatant, which
contained the protein, was loaded onto a Ni‐NTA column and washed with A buffer
containing 20 mM imidazole. The protein was eluted with buffer A containing 300 mM
imidazole and was further purified using size exclusion chromatography. The RacA C‐
114
terminal domain was expressed and purified using the same protocol that was
employed for obtaining pure DivIVA C‐terminal domain.
Isothermal Titration Calorimetry (ITC) To carry out the ITC experiments,
protein samples were dialyzed into a buffer containing 25 mM Tris pH 7.5 and 150 mM
NaCl and thoroughly degassed. The concentration of protein samples was determined
by Bradford assays. All ITC measurements were performed at 25 °C using a VP‐ITC
calorimeter (Microcal). 28 5‐μl injections of the 450 μM DivIVA were injected into 470 μl
of 10 μM of RacA with an interval of 250 sec at a constant stirring rate of 250 rpm and 28
5‐μl injections of the 680 μM RacA (DivIVA) were injected into 470 μl of 10 μM of
DivIVA. All data were collected and analyzed using the manufacturer‐supplied
software package, Origin 7.0 (OriginLab Corp.). The resulting isotherms were fit to one‐
site, independent binding models. Control experiments were carried out (Figure 44) by
titrating RacA/DivIVA into binding buffer alone( 25 mM Tris pH 7.5 and 150 mM NaCl).

115
Figure 41. Chromosome segregation during sporulation in B. subtilis
A: The chromosomes become remodeled into axial filament by the action of RacA
(indicated by red circle) with oriC region (indicated by green circle) located at its ends.
B: The axial filament extends from pole to pole, with oriC region of each chromosome
anchored at extreme ends of the sporangium. C: Polar septum forms and traps 1/3 of
chromosome into newly formed forspore, the other 2/3 left in mother cell. SpoIIIE
protein (indicated by blue‐green rectangle) pumps this 2/3 of chromosome across the
septum into the forespore (Errington, 2003).

116
Figure 42. Constructs of DivIVA (59‐164) and RacA (70‐184) used for the interaction
studies.

117
Figure 43. ITC isotherms of DivIVA and RacA interactions.
Representative experiments are shown. In each case the heat signal is shown (upper)
together with the binding isotherm derived from this signal. A: DivIVA(450 M) in the
syringe, RacA (10 M) in the cell. B: RacA (680 M) in the syringe, DivIVA (10 M) in
the cell.
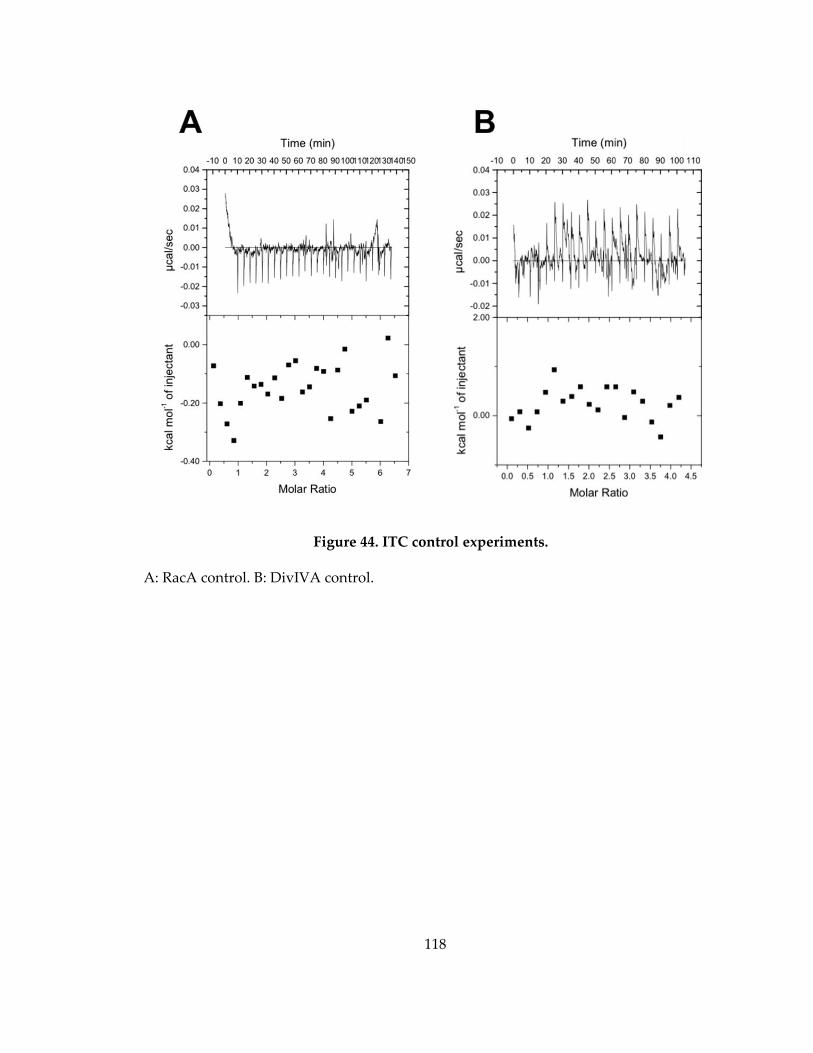
118
Figure 44. ITC control experiments.
A: RacA control. B: DivIVA control.
119
References
Adachi S, Hori K, Hiraga S (2006) Subcellular positioning of F plasmid mediated by
dynamic localization of SopA and SopB. Journal of molecular biology 356: 850‐863
Barilla D, Carmelo E, Hayes F (2007) The tail of the ParG DNA segregation protein
remodels ParF polymers and enhances ATP hydrolysis via an arginine finger‐like motif.
Proceedings of the National Academy of Sciences of the United States of America 104: 1811‐1816
Barilla D, Rosenberg MF, Nobbmann U, Hayes F (2005) Bacterial DNA segregation
dynamics mediated by the polymerizing protein ParF. The EMBO journal 24: 1453‐1464
Ben‐Yehuda S, Rudner DZ, Losick R (2003) RacA, a bacterial protein that anchors
chromosomes to the cell poles. Science 299: 532‐536
Bouet JY, Ah‐Seng Y, Benmeradi N, Lane D (2007) Polymerization of SopA partition
ATPase: regulation by DNA binding and SopB. Molecular microbiology 63: 468‐481
Bouet JY, Funnell BE (1999) P1 ParA interacts with the P1 partition complex at parS and
an ATP‐ADP switch controls ParA activities. The EMBO journal 18: 1415‐1424
Brochier‐Armanet C, Boussau B, Gribaldo S, Forterre P (2008) Mesophilic Crenarchaeota:
proposal for a third archaeal phylum, the Thaumarchaeota. Nature reviews Microbiology 6:
245‐252
Campbell CS, Mullins RD (2007) In vivo visualization of type II plasmid segregation:
bacterial actin filaments pushing plasmids. The Journal of cell biology 179: 1059‐1066
Castaing JP, Bouet JY, Lane D (2008) F plasmid partition depends on interaction of SopA
with non‐specific DNA. Molecular microbiology 70: 1000‐1011
Chen Y, Erickson HP (2008) In vitro assembly studies of FtsZ/tubulin‐like proteins
(TubZ) from Bacillus plasmids: evidence for a capping mechanism. The Journal of
biological chemistry 283: 8102‐8109
Davis MA, Martin KA, Austin SJ (1992) Biochemical activities of the parA partition
protein of the P1 plasmid. Molecular microbiology 6: 1141‐1147
Driessen RP, Dame RT (2011) Nucleoid‐associated proteins in Crenarchaea. Biochemical
Society transactions 39: 116‐121
120
Dunham TD, Xu W, Funnell BE, Schumacher MA (2009) Structural basis for ADP‐
mediated transcriptional regulation by P1 and P7 ParA. The EMBO journal 28: 1792‐1802
Ebersbach G, Gerdes K (2004) Bacterial mitosis: partitioning protein ParA oscillates in
spiral‐shaped structures and positions plasmids at mid‐cell. Molecular microbiology 52:
385‐398
Ebersbach G, Ringgaard S, Moller‐Jensen J, Wang Q, Sherratt DJ, Gerdes K (2006)
Regular cellular distribution of plasmids by oscillating and filament‐forming ParA
ATPase of plasmid pB171. Molecular microbiology 61: 1428‐1442
Edmondson SP, Kahsai MA, Gupta R, Shriver JW (2004) Characterization of Sac10a, a
hyperthermophile DNA‐binding protein from Sulfolobus acidocaldarius. Biochemistry
43: 13026‐13036
Edwards DH, Errington J (1997) The Bacillus subtilis DivIVA protein targets to the
division septum and controls the site specificity of cell division. Molecular microbiology
24: 905‐915
Emsley P, Lohkamp B, Scott WG, Cowtan K (2010) Features and development of Coot.
Acta crystallographica Section D, Biological crystallography 66: 486‐501
Errington J (2003) Regulation of endospore formation in Bacillus subtilis. Nature reviews
Microbiology 1: 117‐126
Fogel MA, Waldor MK (2006) A dynamic, mitotic‐like mechanism for bacterial
chromosome segregation. Genes & development 20: 3269‐3282
Fung E, Bouet JY, Funnell BE (2001) Probing the ATP‐binding site of P1 ParA: partition
and repression have different requirements for ATP binding and hydrolysis. The EMBO
journal 20: 4901‐4911
Garner EC, Campbell CS, Mullins RD (2004) Dynamic instability in a DNA‐segregating
prokaryotic actin homolog. Science 306: 1021‐1025
Garner EC, Campbell CS, Weibel DB, Mullins RD (2007) Reconstitution of DNA
segregation driven by assembly of a prokaryotic actin homolog. Science 315: 1270‐1274

121
Gerdes K, Howard M, Szardenings F (2010) Pushing and pulling in prokaryotic DNA
segregation. Cell 141: 927‐942
Gerdes K, Larsen JE, Molin S (1985) Stable inheritance of plasmid R1 requires two
different loci. Journal of bacteriology 161: 292‐298
Gerdes K, Moller‐Jensen J, Bugge Jensen R (2000) Plasmid and chromosome partitioning:
surprises from phylogeny. Molecular microbiology 37: 455‐466
Golovanov AP, Barilla D, Golovanova M, Hayes F, Lian LY (2003) ParG, a protein
required for active partition of bacterial plasmids, has a dimeric ribbon‐helix‐helix
structure. Molecular microbiology 50: 1141‐1153
Guo L, Feng Y, Zhang Z, Yao H, Luo Y, Wang J, Huang L (2008) Biochemical and
structural characterization of Cren7, a novel chromatin protein conserved among
Crenarchaea. Nucleic acids research 36: 1129‐1137
Hatano T, Yamaichi Y, Niki H (2007) Oscillating focus of SopA associated with
filamentous structure guides partitioning of F plasmid. Molecular microbiology 64: 1198‐
1213
Hauser PM, Errington J (1995) Characterization of cell cycle events during the onset of
sporulation in Bacillus subtilis. Journal of bacteriology 177: 3923‐3931
Havey JC, Vecchiarelli AG, Funnell BE (2012) ATP‐regulated interactions between P1
ParA, ParB and non‐specific DNA that are stabilized by the plasmid partition site, parS.
Nucleic acids research 40: 801‐812
Hester CM, Lutkenhaus J (2007) Soj (ParA) DNA binding is mediated by conserved
arginines and is essential for plasmid segregation. Proceedings of the National Academy of
Sciences of the United States of America 104: 20326‐20331
Holm L, Rosenstrom P (2010) Dali server: conservation mapping in 3D. Nucleic acids
research 38: W545‐549
Huffman JL, Brennan RG (2002) Prokaryotic transcription regulators: more than just the
helix‐turn‐helix motif. Current opinion in structural biology 12: 98‐106
122
Hwang LC, Vecchiarelli AG, Han YW, Mizuuchi M, Harada Y, Funnell BE, Mizuuchi K
(2013) ParA‐mediated plasmid partition driven by protein pattern self‐organization. The
EMBO journal 32: 1238‐1249
Ietswaart R, Szardenings F, Gerdes K, Howard M (2014) Competing ParA structures
space bacterial plasmids equally over the nucleoid. PLoS computational biology 10:
e1004009
Kahsai MA, Vogler B, Clark AT, Edmondson SP, Shriver JW (2005) Solution structure,
stability, and flexibility of Sso10a: a hyperthermophile coiled‐coil DNA‐binding protein.
Biochemistry 44: 2822‐2832
Kalliomaa‐Sanford AK, Rodriguez‐Castaneda FA, McLeod BN, Latorre‐Rosello V, Smith
JH, Reimann J, Albers SV, Barilla D (2012) Chromosome segregation in Archaea
mediated by a hybrid DNA partition machine. Proceedings of the National Academy of
Sciences of the United States of America 109: 3754‐3759
Kiekebusch D, Thanbichler M (2014) Plasmid segregation by a moving ATPase gradient.
Proceedings of the National Academy of Sciences of the United States of America 111: 4741‐4742
Koonin EV (1993) A superfamily of ATPases with diverse functions containing either
classical or deviant ATP‐binding motif. Journal of molecular biology 229: 1165‐1174
Lenarcic R, Halbedel S, Visser L, Shaw M, Wu LJ, Errington J, Marenduzzo D, Hamoen
LW (2009) Localisation of DivIVA by targeting to negatively curved membranes. The
EMBO journal 28: 2272‐2282
Leonard TA, Butler PJ, Lowe J (2005) Bacterial chromosome segregation: structure and
DNA binding of the Soj dimer‐‐a conserved biological switch. The EMBO journal 24: 270‐
282
Lewis RA, Bignell CR, Zeng W, Jones AC, Thomas CM (2002) Chromosome loss from
par mutants of Pseudomonas putida depends on growth medium and phase of growth.
Microbiology 148: 537‐548
Lim GE, Derman AI, Pogliano J (2005) Bacterial DNA segregation by dynamic SopA
polymers. Proceedings of the National Academy of Sciences of the United States of America 102:
17658‐17663
123
Lundblad JR, Laurance M, Goodman RH (1996) Fluorescence polarization analysis of
protein‐DNA and protein‐protein interactions. Mol Endocrinol 10: 607‐612
Lutkenhaus J, Sundaramoorthy M (2003) MinD and role of the deviant Walker A motif,
dimerization and membrane binding in oscillation. Molecular microbiology 48: 295‐303
Ma L, King GF, Rothfield L (2004) Positioning of the MinE binding site on the MinD
surface suggests a plausible mechanism for activation of the Escherichia coli MinD
ATPase during division site selection. Molecular microbiology 54: 99‐108
Marston AL, Errington J (1999) Dynamic movement of the ParA‐like Soj protein of B.
subtilis and its dual role in nucleoid organization and developmental regulation.
Molecular cell 4: 673‐682
Moller‐Jensen J, Ringgaard S, Mercogliano CP, Gerdes K, Lowe J (2007) Structural
analysis of the ParR/parC plasmid partition complex. The EMBO journal 26: 4413‐4422
Murayama K, Orth P, de la Hoz AB, Alonso JC, Saenger W (2001) Crystal structure of
omega transcriptional repressor encoded by Streptococcus pyogenes plasmid pSM19035
at 1.5 A resolution. Journal of molecular biology 314: 789‐796
Ni L, Xu W, Kumaraswami M, Schumacher MA (2010) Plasmid protein TubR uses a
distinct mode of HTH‐DNA binding and recruits the prokaryotic tubulin homolog TubZ
to effect DNA partition. Proceedings of the National Academy of Sciences of the United States
of America 107: 11763‐11768
Oliva MA, Halbedel S, Freund SM, Dutow P, Leonard TA, Veprintsev DB, Hamoen LW,
Lowe J (2010) Features critical for membrane binding revealed by DivIVA crystal
structure. The EMBO journal 29: 1988‐2001
Pabo CO, Lewis M (1982) The operator‐binding domain of lambda repressor: structure
and DNA recognition. Nature 298: 443‐447
Pikuta EV, Hoover RB, Tang J (2007) Microbial extremophiles at the limits of life. Critical
reviews in microbiology 33: 183‐209
Pogliano J, Sharp MD, Pogliano K (2002) Partitioning of chromosomal DNA during
establishment of cellular asymmetry in Bacillus subtilis. Journal of bacteriology 184: 1743‐
1749
124
Poplawski A, Bernander R (1997) Nucleoid structure and distribution in thermophilic
Archaea. Journal of bacteriology 179: 7625‐7630
Popp D, Narita A, Oda T, Fujisawa T, Matsuo H, Nitanai Y, Iwasa M, Maeda K, Onishi
H, Maeda Y (2008) Molecular structure of the ParM polymer and the mechanism leading
to its nucleotide‐driven dynamic instability. The EMBO journal 27: 570‐579
Pratto F, Cicek A, Weihofen WA, Lurz R, Saenger W, Alonso JC (2008) Streptococcus
pyogenes pSM19035 requires dynamic assembly of ATP‐bound ParA and ParB on parS
DNA during plasmid segregation. Nucleic acids research 36: 3676‐3689
Quisel JD, Lin DC, Grossman AD (1999) Control of development by altered localization
of a transcription factor in B. subtilis. Molecular cell 4: 665‐672
Raskin DM, de Boer PA (1999) MinDE‐dependent pole‐to‐pole oscillation of division
inhibitor MinC in Escherichia coli. Journal of bacteriology 181: 6419‐6424
Ringgaard S, Schirner K, Davis BM, Waldor MK (2011) A family of ParA‐like ATPases
promotes cell pole maturation by facilitating polar localization of chemotaxis proteins.
Genes & development 25: 1544‐1555
Ringgaard S, van Zon J, Howard M, Gerdes K (2009) Movement and equipositioning of
plasmids by ParA filament disassembly. Proceedings of the National Academy of Sciences of
the United States of America 106: 19369‐19374
Robert X, Gouet P (2014) Deciphering key features in protein structures with the new
ENDscript server. Nucleic acids research 42: W320‐324
Roberts MA, Wadhams GH, Hadfield KA, Tickner S, Armitage JP (2012) ParA‐like
protein uses nonspecific chromosomal DNA binding to partition protein complexes.
Proceedings of the National Academy of Sciences of the United States of America 109: 6698‐6703
Robertson CE, Harris JK, Spear JR, Pace NR (2005) Phylogenetic diversity and ecology of
environmental Archaea. Current opinion in microbiology 8: 638‐642
Ryter A, Schaeffer P, Ionesco H (1966) [Cytologic classification, by their blockage stage,
of sporulation mutants of Bacillus subtilis Marburg]. Annales de lʹInstitut Pasteur 110:
305‐315

125
Salje J, Gayathri P, Lowe J (2010) The ParMRC system: molecular mechanisms of
plasmid segregation by actin‐like filaments. Nature reviews Microbiology 8: 683‐692
Salje J, Zuber B, Lowe J (2009) Electron cryomicroscopy of E. coli reveals filament
bundles involved in plasmid DNA segregation. Science 323: 509‐512
Savage DF, Afonso B, Chen AH, Silver PA (2010) Spatially ordered dynamics of the
bacterial carbon fixation machinery. Science 327: 1258‐1261
Schleper C, Holz I, Janekovic D, Murphy J, Zillig W (1995) A multicopy plasmid of the
extremely thermophilic archaeon Sulfolobus effects its transfer to recipients by mating.
Journal of bacteriology 177: 4417‐4426
Schumacher MA (2008) Structural biology of plasmid partition: uncovering the
molecular mechanisms of DNA segregation. The Biochemical journal 412: 1‐18
Schumacher MA (2012) Bacterial plasmid partition machinery: a minimalist approach to
survival. Current opinion in structural biology 22: 72‐79
Schumacher MA, Funnell BE (2005) Structures of ParB bound to DNA reveal mechanism
of partition complex formation. Nature 438: 516‐519
Schumacher MA, Glover TC, Brzoska AJ, Jensen SO, Dunham TD, Skurray RA, Firth N
(2007) Segrosome structure revealed by a complex of ParR with centromere DNA. Nature
450: 1268‐1271
Schumacher MA, Ye Q, Barge MT, Zampini M, Barilla D, Hayes F (2012) Structural
mechanism of ATP‐induced polymerization of the partition factor ParF: implications for
DNA segregation. The Journal of biological chemistry 287: 26146‐26154
Sekulic N, Bassett EA, Rogers DJ, Black BE (2010) The structure of (CENP‐A‐H4)(2)
reveals physical features that mark centromeres. Nature 467: 347‐351
Sengupta M, Nielsen HJ, Youngren B, Austin S (2010) P1 plasmid segregation: accurate
redistribution by dynamic plasmid pairing and separation. Journal of bacteriology 192:
1175‐1183
She Q, Singh RK, Confalonieri F, Zivanovic Y, Allard G, Awayez MJ, Chan‐Weiher CC,
Clausen IG, Curtis BA, De Moors A, Erauso G, Fletcher C, Gordon PM, Heikamp‐de
Jong I, Jeffries AC, Kozera CJ, Medina N, Peng X, Thi‐Ngoc HP, Redder P, Schenk ME,

126
Theriault C, Tolstrup N, Charlebois RL, Doolittle WF, Duguet M, Gaasterland T, Garrett
RA, Ragan MA, Sensen CW, Van der Oost J (2001) The complete genome of the
crenarchaeon Sulfolobus solfataricus P2. Proceedings of the National Academy of Sciences of
the United States of America 98: 7835‐7840
Szardenings F, Guymer D, Gerdes K (2011) ParA ATPases can move and position DNA
and subcellular structures. Curr Opin Microbiol 14: 712‐718
Tachiwana H, Kurumizaka H (2011) Structure of the CENP‐A nucleosome and its
implications for centromeric chromatin architecture. Genes & genetic systems 86: 357‐364
Terwilliger TC, Berendzen J (1999) Automated MAD and MIR structure solution. Acta
crystallographica Section D, Biological crystallography 55: 849‐861
Thomaides HB, Freeman M, El Karoui M, Errington J (2001) Division site selection
protein DivIVA of Bacillus subtilis has a second distinct function in chromosome
segregation during sporulation. Genes & development 15: 1662‐1673
Thompson SR, Wadhams GH, Armitage JP (2006) The positioning of cytoplasmic protein
clusters in bacteria. Proceedings of the National Academy of Sciences of the United States of
America 103: 8209‐8214
Toro E, Hong SH, McAdams HH, Shapiro L (2008) Caulobacter requires a dedicated
mechanism to initiate chromosome segregation. Proceedings of the National Academy of
Sciences of the United States of America 105: 15435‐15440
van den Ent F, Moller‐Jensen J, Amos LA, Gerdes K, Lowe J (2002) F‐actin‐like filaments
formed by plasmid segregation protein ParM. The EMBO journal 21: 6935‐6943
Vecchiarelli AG, Han YW, Tan X, Mizuuchi M, Ghirlando R, Biertumpfel C, Funnell BE,
Mizuuchi K (2010) ATP control of dynamic P1 ParA‐DNA interactions: a key role for the
nucleoid in plasmid partition. Molecular microbiology 78: 78‐91
Vecchiarelli AG, Hwang LC, Mizuuchi K (2013) Cell‐free study of F plasmid partition
provides evidence for cargo transport by a diffusion‐ratchet mechanism. Proceedings of
the National Academy of Sciences of the United States of America 110: E1390‐1397
Vecchiarelli AG, Neuman KC, Mizuuchi K (2014) A propagating ATPase gradient drives
transport of surface‐confined cellular cargo. Proceedings of the National Academy of Sciences
of the United States of America 111: 4880‐4885

127
Wardleworth BN, Russell RJ, Bell SD, Taylor GL, White MF (2002) Structure of Alba: an
archaeal chromatin protein modulated by acetylation. The EMBO journal 21: 4654‐4662
Watanabe E, Wachi M, Yamasaki M, Nagai K (1992) ATPase activity of SopA, a protein
essential for active partitioning of F plasmid. Mol Gen Genet 234: 346‐352
Woese CR, Fox GE (1977) Phylogenetic structure of the prokaryotic domain: the primary
kingdoms. Proceedings of the National Academy of Sciences of the United States of America 74:
5088‐5090
Woese CR, Kandler O, Wheelis ML (1990) Towards a natural system of organisms:
proposal for the domains Archaea, Bacteria, and Eucarya. Proceedings of the National
Academy of Sciences of the United States of America 87: 4576‐4579
Wu LJ, Errington J (1994) Bacillus subtilis SpoIIIE protein required for DNA segregation
during asymmetric cell division. Science 264: 572‐575
Wu LJ, Errington J (1997) Septal localization of the SpoIIIE chromosome partitioning
protein in Bacillus subtilis. The EMBO journal 16: 2161‐2169
Wu LJ, Errington J (2003) RacA and the Soj‐Spo0J system combine to effect polar
chromosome segregation in sporulating Bacillus subtilis. Molecular microbiology 49: 1463‐
1475
Yamaichi Y, Niki H (2000) Active segregation by the Bacillus subtilis partitioning system
in Escherichia coli. Proceedings of the National Academy of Sciences of the United States of
America 97: 14656‐14661
128
Biography
Jeehyun Lee was born in Seoul, Korea. She graduated Seoul National University
in 2006 with the degree of Bachelor of Science in Applied Biology and Chemistry. She
then went on and earned the degree of Master of Science in Agricultural Biotechnology,
at Seoul National University in 2008. She came to United States in the fall of 2010 to start
her doctoral studies in Structural Biology and Biophysics program at Duke University.
She joined the Schumacher Lab in the Department of Biochemistry in 2011 and is
currently a member in the lab under the guidance of Dr. Maria A Schumacher.