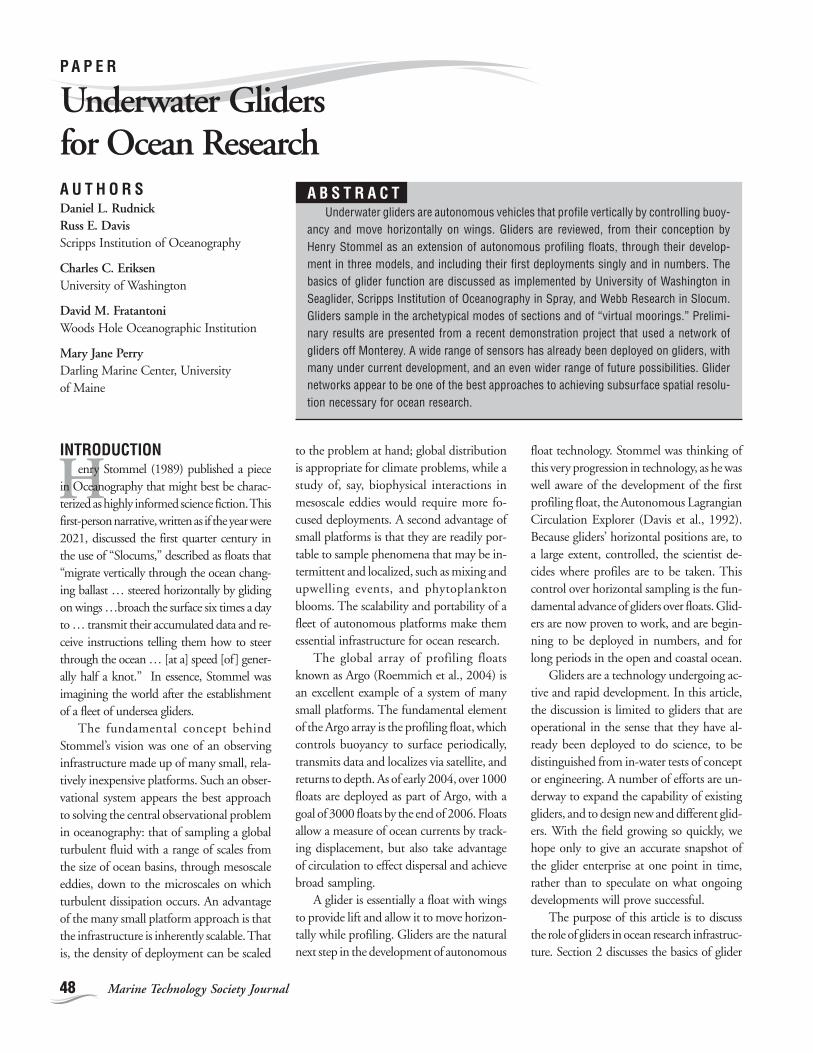
PAPER Underwater Gliders for Ocean Research - CASPOrdavis/publications/MTS_Glider.pdfThere are now...
12
48 Marine Technology Society Journal H INTRODUCTION enry Stommel (1989) published a piece in Oceanography that might best be charac- terized as highly informed science fiction. This first-person narrative, written as if the year were 2021, discussed the first quarter century in the use of “Slocums,” described as floats that “migrate vertically through the ocean chang- ing ballast … steered horizontally by gliding on wings …broach the surface six times a day to … transmit their accumulated data and re- ceive instructions telling them how to steer through the ocean … [at a] speed [of ] gener- ally half a knot.” In essence, Stommel was imagining the world after the establishment of a fleet of undersea gliders. The fundamental concept behind Stommel’s vision was one of an observing infrastructure made up of many small, rela- tively inexpensive platforms. Such an obser- vational system appears the best approach to solving the central observational problem in oceanography: that of sampling a global turbulent fluid with a range of scales from the size of ocean basins, through mesoscale eddies, down to the microscales on which turbulent dissipation occurs. An advantage of the many small platform approach is that the infrastructure is inherently scalable. That is, the density of deployment can be scaled AUTHORS Daniel L. Rudnick Russ E. Davis Scripps Institution of Oceanography Charles C. Eriksen University of Washington David M. Fratantoni Woods Hole Oceanographic Institution Mary Jane Perry Darling Marine Center, University of Maine PAPER Underwater Gliders for Ocean Research ABSTRACT Underwater gliders are autonomous vehicles that profile vertically by controlling buoy- ancy and move horizontally on wings. Gliders are reviewed, from their conception by Henry Stommel as an extension of autonomous profiling floats, through their develop- ment in three models, and including their first deployments singly and in numbers. The basics of glider function are discussed as implemented by University of Washington in Seaglider, Scripps Institution of Oceanography in Spray, and Webb Research in Slocum. Gliders sample in the archetypical modes of sections and of “virtual moorings.” Prelimi- nary results are presented from a recent demonstration project that used a network of gliders off Monterey. A wide range of sensors has already been deployed on gliders, with many under current development, and an even wider range of future possibilities. Glider networks appear to be one of the best approaches to achieving subsurface spatial resolu- tion necessary for ocean research. to the problem at hand; global distribution is appropriate for climate problems, while a study of, say, biophysical interactions in mesoscale eddies would require more fo- cused deployments. A second advantage of small platforms is that they are readily por- table to sample phenomena that may be in- termittent and localized, such as mixing and upwelling events, and phytoplankton blooms. The scalability and portability of a fleet of autonomous platforms make them essential infrastructure for ocean research. The global array of profiling floats known as Argo (Roemmich et al., 2004) is an excellent example of a system of many small platforms. The fundamental element of the Argo array is the profiling float, which controls buoyancy to surface periodically, transmits data and localizes via satellite, and returns to depth. As of early 2004, over 1000 floats are deployed as part of Argo, with a goal of 3000 floats by the end of 2006. Floats allow a measure of ocean currents by track- ing displacement, but also take advantage of circulation to effect dispersal and achieve broad sampling. A glider is essentially a float with wings to provide lift and allow it to move horizon- tally while profiling. Gliders are the natural next step in the development of autonomous float technology. Stommel was thinking of this very progression in technology, as he was well aware of the development of the first profiling float, the Autonomous Lagrangian Circulation Explorer (Davis et al., 1992). Because gliders’ horizontal positions are, to a large extent, controlled, the scientist de- cides where profiles are to be taken. This control over horizontal sampling is the fun- damental advance of gliders over floats. Glid- ers are now proven to work, and are begin- ning to be deployed in numbers, and for long periods in the open and coastal ocean. Gliders are a technology undergoing ac- tive and rapid development. In this article, the discussion is limited to gliders that are operational in the sense that they have al- ready been deployed to do science, to be distinguished from in-water tests of concept or engineering. A number of efforts are un- derway to expand the capability of existing gliders, and to design new and different glid- ers. With the field growing so quickly, we hope only to give an accurate snapshot of the glider enterprise at one point in time, rather than to speculate on what ongoing developments will prove successful. The purpose of this article is to discuss the role of gliders in ocean research infrastruc- ture. Section 2 discusses the basics of glider
Transcript of PAPER Underwater Gliders for Ocean Research - CASPOrdavis/publications/MTS_Glider.pdfThere are now...
48 Marine Technology Society Journal
HINTRODUCTION
enry Stommel (1989) published a piecein Oceanography that might best be charac-terized as highly informed science fiction. Thisfirst-person narrative, written as if the year were2021, discussed the first quarter century inthe use of “Slocums,” described as floats that“migrate vertically through the ocean chang-ing ballast … steered horizontally by glidingon wings …broach the surface six times a dayto … transmit their accumulated data and re-ceive instructions telling them how to steerthrough the ocean … [at a] speed [of] gener-ally half a knot.” In essence, Stommel wasimagining the world after the establishmentof a fleet of undersea gliders.
The fundamental concept behindStommel’s vision was one of an observinginfrastructure made up of many small, rela-tively inexpensive platforms. Such an obser-vational system appears the best approachto solving the central observational problemin oceanography: that of sampling a globalturbulent fluid with a range of scales fromthe size of ocean basins, through mesoscaleeddies, down to the microscales on whichturbulent dissipation occurs. An advantageof the many small platform approach is thatthe infrastructure is inherently scalable. Thatis, the density of deployment can be scaled
A U T H O R SDaniel L. RudnickRuss E. DavisScripps Institution of Oceanography
Charles C. EriksenUniversity of Washington
David M. FratantoniWoods Hole Oceanographic Institution
Mary Jane PerryDarling Marine Center, Universityof Maine
P A P E R
Underwater Glidersfor Ocean Research
A B S T R A C TUnderwater gliders are autonomous vehicles that profile vertically by controlling buoy-
ancy and move horizontally on wings. Gliders are reviewed, from their conception byHenry Stommel as an extension of autonomous profiling floats, through their develop-ment in three models, and including their first deployments singly and in numbers. Thebasics of glider function are discussed as implemented by University of Washington inSeaglider, Scripps Institution of Oceanography in Spray, and Webb Research in Slocum.Gliders sample in the archetypical modes of sections and of “virtual moorings.” Prelimi-nary results are presented from a recent demonstration project that used a network ofgliders off Monterey. A wide range of sensors has already been deployed on gliders, withmany under current development, and an even wider range of future possibilities. Glidernetworks appear to be one of the best approaches to achieving subsurface spatial resolu-tion necessary for ocean research.
to the problem at hand; global distributionis appropriate for climate problems, while astudy of, say, biophysical interactions inmesoscale eddies would require more fo-cused deployments. A second advantage ofsmall platforms is that they are readily por-table to sample phenomena that may be in-termittent and localized, such as mixing andupwelling events, and phytoplanktonblooms. The scalability and portability of afleet of autonomous platforms make themessential infrastructure for ocean research.
The global array of profiling floatsknown as Argo (Roemmich et al., 2004) isan excellent example of a system of manysmall platforms. The fundamental elementof the Argo array is the profiling float, whichcontrols buoyancy to surface periodically,transmits data and localizes via satellite, andreturns to depth. As of early 2004, over 1000floats are deployed as part of Argo, with agoal of 3000 floats by the end of 2006. Floatsallow a measure of ocean currents by track-ing displacement, but also take advantageof circulation to effect dispersal and achievebroad sampling.
A glider is essentially a float with wingsto provide lift and allow it to move horizon-tally while profiling. Gliders are the naturalnext step in the development of autonomous
float technology. Stommel was thinking ofthis very progression in technology, as he waswell aware of the development of the firstprofiling float, the Autonomous LagrangianCirculation Explorer (Davis et al., 1992).Because gliders’ horizontal positions are, toa large extent, controlled, the scientist de-cides where profiles are to be taken. Thiscontrol over horizontal sampling is the fun-damental advance of gliders over floats. Glid-ers are now proven to work, and are begin-ning to be deployed in numbers, and forlong periods in the open and coastal ocean.
Gliders are a technology undergoing ac-tive and rapid development. In this article,the discussion is limited to gliders that areoperational in the sense that they have al-ready been deployed to do science, to bedistinguished from in-water tests of conceptor engineering. A number of efforts are un-derway to expand the capability of existinggliders, and to design new and different glid-ers. With the field growing so quickly, wehope only to give an accurate snapshot ofthe glider enterprise at one point in time,rather than to speculate on what ongoingdevelopments will prove successful.
The purpose of this article is to discussthe role of gliders in ocean research infrastruc-ture. Section 2 discusses the basics of glider
49Spring 2004 Volume 38, Number 1
function, with a summary of the three cur-rent designs. Section 3 addresses basic glidercapabilities, and the survey patterns possibleusing a single glider. The next phase in theevolution of glider observations is the deploy-ment of many gliders in coordinated sam-pling systems; a coastal example of such a sys-tem is covered in Section 4. The sensors usedon gliders, and future possibilities, are dis-cussed in Section 5. The conclusion (Section6) includes a brief summary, and a view ofthe role of gliders in sustained observations.
2. Glider FunctionThere are now three operational under-
water gliders: Seaglider (Eriksen et al., 2001)built at the University of Washington,Slocum Battery manufactured by WebbResearch Corp, and Spray (Sherman et al.,2001) built at Scripps Institution of Ocean-ography. The Slocum Thermal (Webb et al.,2001), which is propelled by extracting heatfrom the ocean’s thermal stratification, wassuccessfully deployed at sea in January 2003but is not yet fully operational. Here we de-scribe the main functional systems of thethree operational vehicles: buoyancy engine,hull, energy storage, attitude sensing andnavigation, gliding control, and communi-cation. Sensors are discussed in a later sec-tion. Table 1 summarizes the specificationsof the three gliders.
Gliders propel themselves by changingbuoyancy and using wings to produce forwardmotion. Buoyancy is changed by varying thevehicle volume typically by O(100 cc) to cre-ate a buoyancy force of about 1 N. Wing liftbalances the across-track buoyant force whilethe forward buoyant force balances drag. Theratio of horizontal speed O(25 cm/s) to verti-cal speed (glide slope) equals lift over drag andis typically 2 to 4, much less than for an aero-nautical glider but comparable to that of aNASA Space Shuttle. Energy for gliding is sup-plied at the bottom of each dive cycle wherework is performed to increase vehicle volume.On an O(1 km) deep dive cycle lasting severalhours, the O(10 kJ) energy used to changebuoyancy implies a power usage for propul-sion of about 0.5W. The saw tooth flight pathsof gliders naturally sample the ocean both ver-tically and horizontally.
The considerable range and duration ofgliders is accomplished by moving slowlyand by keeping down the hotel and sensorload. Since drag is roughly quadratic, halv-ing speed roughly increases range by four.The characteristic that most clearly distin-guishes gliders from other AUVs is not theirmeans of propulsion but rather the fact thattheir very slow speed and consequent lowdrag permit long-duration operations. In thetropics, the energy needed to penetrate buoy-ancy change across the pycnocline is also sig-nificant, so the weak stratification of subpo-lar oceans results in greater range throughthe water. The main factors influencing rangeper unit energy consumption are operatingspeed (fast is inefficient), depth (shallowoperation is inefficient), vehicle hydrody-namic drag, and the combination of oceanstratification and the difference of compress-ibility between the glider hull and seawater.
Electric buoyancy engines for floats andgliders fall in two categories: reciprocatinghydraulic pumps and single-stroke pumps.Reciprocating (multi-stroke) pumps likethose used in Seaglider and Spray are smallerand lighter than single-stroke pumps; andbecause today’s gliders are larger than floatsand operate with a larger diving buoyancydifference, this capability is important, par-ticularly at large maximum operating pres-sures. A disadvantage of small reciprocatingpumps is sensitivity to vapor lock, whichoccurs when the pump cylinder fills withgas and the compression ratio of the pumpis insufficient to raise the pressure of thecompressed gas to the ambient pressure. Ifthis happens to all cylinders of a reciprocat-ing pump, pumping ceases. Single-strokepumps, as used by Slocum, are more robust,do not need the valving that reciprocatingpumps use to provide bi-directional buoy-
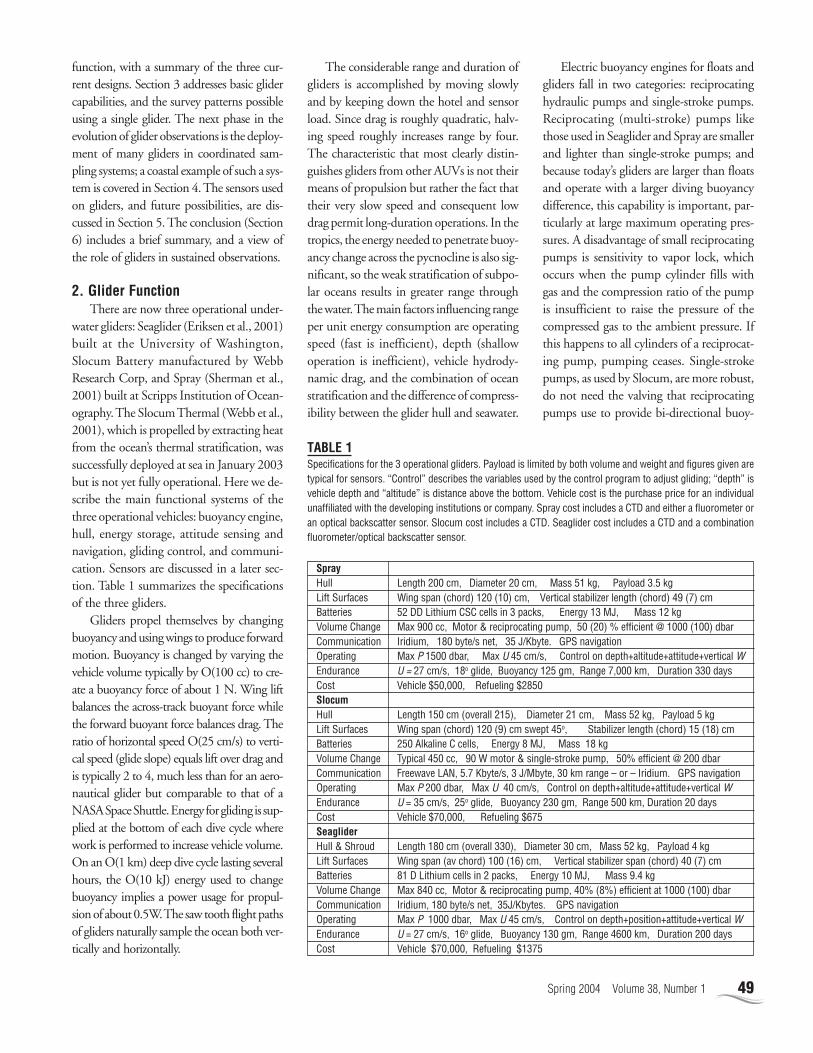
SprayHull Length 200 cm, Diameter 20 cm, Mass 51 kg, Payload 3.5 kgLift Surfaces Wing span (chord) 120 (10) cm, Vertical stabilizer length (chord) 49 (7) cmBatteries 52 DD Lithium CSC cells in 3 packs, Energy 13 MJ, Mass 12 kgVolume Change Max 900 cc, Motor & reciprocating pump, 50 (20) % efficient @ 1000 (100) dbarCommunication Iridium, 180 byte/s net, 35 J/Kbyte. GPS navigationOperating Max P 1500 dbar, Max U 45 cm/s, Control on depth+altitude+attitude+vertical WEndurance U = 27 cm/s, 18o glide, Buoyancy 125 gm, Range 7,000 km, Duration 330 daysCost Vehicle $50,000, Refueling $2850SlocumHull Length 150 cm (overall 215), Diameter 21 cm, Mass 52 kg, Payload 5 kgLift Surfaces Wing span (chord) 120 (9) cm swept 45o, Stabilizer length (chord) 15 (18) cmBatteries 250 Alkaline C cells, Energy 8 MJ, Mass 18 kgVolume Change Typical 450 cc, 90 W motor & single-stroke pump, 50% efficient @ 200 dbarCommunication Freewave LAN, 5.7 Kbyte/s, 3 J/Mbyte, 30 km range – or – Iridium. GPS navigationOperating Max P 200 dbar, Max U 40 cm/s, Control on depth+altitude+attitude+vertical WEndurance U = 35 cm/s, 25o glide, Buoyancy 230 gm, Range 500 km, Duration 20 daysCost Vehicle $70,000, Refueling $675SeagliderHull & Shroud Length 180 cm (overall 330), Diameter 30 cm, Mass 52 kg, Payload 4 kgLift Surfaces Wing span (av chord) 100 (16) cm, Vertical stabilizer span (chord) 40 (7) cmBatteries 81 D Lithium cells in 2 packs, Energy 10 MJ, Mass 9.4 kgVolume Change Max 840 cc, Motor & reciprocating pump, 40% (8%) efficient at 1000 (100) dbarCommunication Iridium, 180 byte/s net, 35J/Kbytes. GPS navigationOperating Max P 1000 dbar, Max U 45 cm/s, Control on depth+position+attitude+vertical WEndurance U = 27 cm/s, 16o glide, Buoyancy 130 gm, Range 4600 km, Duration 200 daysCost Vehicle $70,000, Refueling $1375
TABLE 1Specifications for the 3 operational gliders. Payload is limited by both volume and weight and figures given aretypical for sensors. “Control” describes the variables used by the control program to adjust gliding; “depth” isvehicle depth and “altitude” is distance above the bottom. Vehicle cost is the purchase price for an individualunaffiliated with the developing institutions or company. Spray cost includes a CTD and either a fluorometer oran optical backscatter sensor. Slocum cost includes a CTD. Seaglider cost includes a CTD and a combinationfluorometer/optical backscatter sensor.
50 Marine Technology Society Journal
ancy control, and are effectively immune tovapor lock. Slocum is optimized for shallowand coastal operation where rapid maneu-verability is important and, consequently,uses a more powerful motor than the othergliders for rapid buoyancy control.
Spray and Slocum use simple aluminumhulls to resist external pressure and provide astreamlined hydrodynamic shape. With com-puter controlled machining, this is an eco-nomical approach that produces a robust hull.The compressibility of these simple hulls(3.2´10-6 dbar-1 for Slocum, 3.0´10-6 dbar-1
for Spray) is, however, less than that of sea-water so that extra pumping and energy areneeded at the bottom of a deep dive to com-pensate. The Seaglider uses a compound hullwith a flooded fiberglass fairing providing astreamlined laminar-flow shape while an in-terior aluminum hull resists pressure. The
pressure hull is machined into a fluted pat-tern to match its compressibility to that ofseawater, leading to significant energy savings,particularly at large operating depths. Thiscompound hull increases Seaglider’s volumefrom its 50 liter displacement to a 60 literenclosed volume. Maximum depths of op-eration are 200 m for Slocum, 1000 m forSeaglider, and 1500 m for Spray.
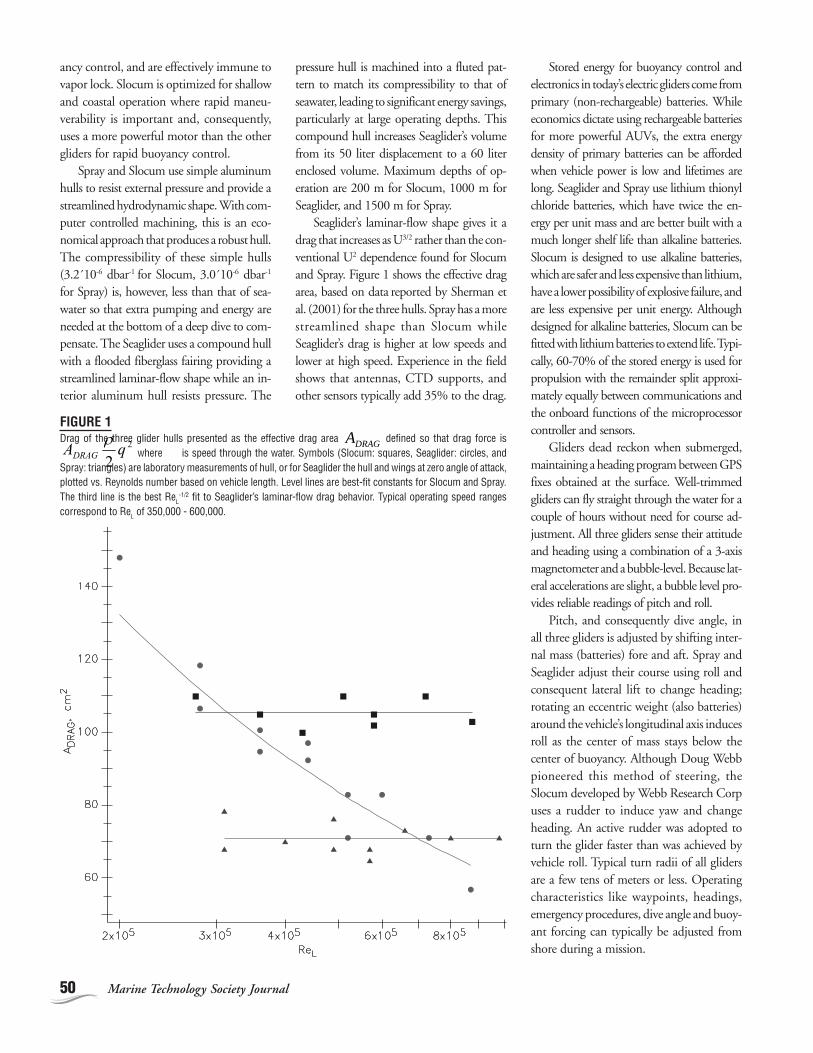
Seaglider’s laminar-flow shape gives it adrag that increases as U3/2 rather than the con-ventional U2 dependence found for Slocumand Spray. Figure 1 shows the effective dragarea, based on data reported by Sherman etal. (2001) for the three hulls. Spray has a morestreamlined shape than Slocum whileSeaglider’s drag is higher at low speeds andlower at high speed. Experience in the fieldshows that antennas, CTD supports, andother sensors typically add 35% to the drag.
Stored energy for buoyancy control andelectronics in today’s electric gliders come fromprimary (non-rechargeable) batteries. Whileeconomics dictate using rechargeable batteriesfor more powerful AUVs, the extra energydensity of primary batteries can be affordedwhen vehicle power is low and lifetimes arelong. Seaglider and Spray use lithium thionylchloride batteries, which have twice the en-ergy per unit mass and are better built with amuch longer shelf life than alkaline batteries.Slocum is designed to use alkaline batteries,which are safer and less expensive than lithium,have a lower possibility of explosive failure, andare less expensive per unit energy. Althoughdesigned for alkaline batteries, Slocum can befitted with lithium batteries to extend life. Typi-cally, 60-70% of the stored energy is used forpropulsion with the remainder split approxi-mately equally between communications andthe onboard functions of the microprocessorcontroller and sensors.
Gliders dead reckon when submerged,maintaining a heading program between GPSfixes obtained at the surface. Well-trimmedgliders can fly straight through the water for acouple of hours without need for course ad-justment. All three gliders sense their attitudeand heading using a combination of a 3-axismagnetometer and a bubble-level. Because lat-eral accelerations are slight, a bubble level pro-vides reliable readings of pitch and roll.
Pitch, and consequently dive angle, inall three gliders is adjusted by shifting inter-nal mass (batteries) fore and aft. Spray andSeaglider adjust their course using roll andconsequent lateral lift to change heading;rotating an eccentric weight (also batteries)around the vehicle’s longitudinal axis inducesroll as the center of mass stays below thecenter of buoyancy. Although Doug Webbpioneered this method of steering, theSlocum developed by Webb Research Corpuses a rudder to induce yaw and changeheading. An active rudder was adopted toturn the glider faster than was achieved byvehicle roll. Typical turn radii of all glidersare a few tens of meters or less. Operatingcharacteristics like waypoints, headings,emergency procedures, dive angle and buoy-ant forcing can typically be adjusted fromshore during a mission.
FIGURE 1Drag of the three glider hulls presented as the effective drag area ADRAG defined so that drag force is2
2qADRAG
ρ where is speed through the water. Symbols (Slocum: squares, Seaglider: circles, and
Spray: triangles) are laboratory measurements of hull, or for Seaglider the hull and wings at zero angle of attack,plotted vs. Reynolds number based on vehicle length. Level lines are best-fit constants for Slocum and Spray.The third line is the best ReL
-1/2 fit to Seaglider’s laminar-flow drag behavior. Typical operating speed rangescorrespond to ReL of 350,000 - 600,000.
51Spring 2004 Volume 38, Number 1
Global low-power satellite communica-tion is a key enabling technology for gliders,making it possible for them to operate world-wide sending data in near real-time. In thepast, gliders have used cellular telephone,System Argos and Orbcomm for data com-munication but today all use two-way Iri-dium communication and Slocum also usesFreewave high-bandwidth Local Area Net-work communication when close to a re-ceiving station. Iridium provides two-waycommunication with throughputs of ~200bytes/s for an energy cost of ~40 J/Kbytesand a monetary cost of ~$0.25-0.50/kbyte.Sample density and data communication aretailored for each application and are easilyadjusted through shore-to-glider communi-cation; Iridium makes it feasible to reportO(1000) samples from various sensors oneach dive cycle for the order of a dollar. Lo-cal communication, like Slocum’s LAN,makes it possible to relay an order of magni-tude more data. Gliders typically haveenough onboard memory to store more datathan is relayed for subsequent analysis.
While the above basic functions oftoday’s gliders are similar, they differ in themissions and characteristics for which theywere optimized.
Seagliders (Figure 2) were designed tooperate most efficiently in the open ocean,with dives to 1 km depth in missions of sev-eral months duration and several thousandkm range. The longest mission to date cov-ered 5 months and 2700 km; Seagliders haveoperated through many winter storms in theGulf of Alaska and the Labrador Sea. To ef-ficiently carry out surveys and to virtuallymoor itself at a target location, Seaglider wasdesigned to operate with pitch angles asgentle as 10° from horizontal and as steep as75°. Seagliders trail a 10 cm long cylindricalantenna mounted on a 1 m stalk behind themain vehicle body. This dual use Iridium/GPS antenna is raised above the air-sea in-terface by pitching the vehicle nose down toobtain navigational fixes and communicate.The buoyancy necessary for propulsion isnormally adequate and additional pumpingis not required at the surface.
Slocum (Figure 3) was optimized to op-erate in shallow coastal waters where highmaneuverability is necessary, a limited rangeand duration is less of an operational hin-drance, and high data rates using local com-munication are possible. It is designed to bereadily manufactured and is available com-mercially. A modular payload bay centeredover the vehicle’s center of buoyancy is de-signed to facilitate sensor integration.Slocum is capable of operating in water asshallow as 5 m. Buoyancy pump gearboxesmay be easily swapped according to the
maximum depth required allowing optimi-zation of torque vs. inflection speed. Suc-cessful experiments to date have includedboth coastal and blue-water deployments infleets as large as 10 vehicles.
Spray (Figure 4) was designed for effi-cient deepwater performance and ease ofmanufacture and maintenance. It combinesa low-drag hull with antennas in the wingsto further reduce drag. When surfacing itrolls 90o to make one wing vertical to ob-tain GPS fixes or communicate through Iri-dium. At wind speeds above 25 knots an-tenna performance degrades and messagesmay be saved for later transmission. The aftsection is a flooded compartment where sen-sors are easily installed. A back-up Argosantenna is often mounted in the vertical sta-bilizer. The main operational difficulties havebeen being run down by surface vessels whileat the surface (a problem common to all glid-ers) and gas bubbles in the hydraulic pump.
3. Glider Surveys3.1 Sections
Repeat hydrography of the upper oceanis routinely carried out using gliders (Fig-ures 5-6). The main operational constraintis that current averaged over the depth ofglider dive cycles is modest compared toglider speed. The main sampling constraintis that the decorrelation time of the surveyedfields is longer than the interval between re-
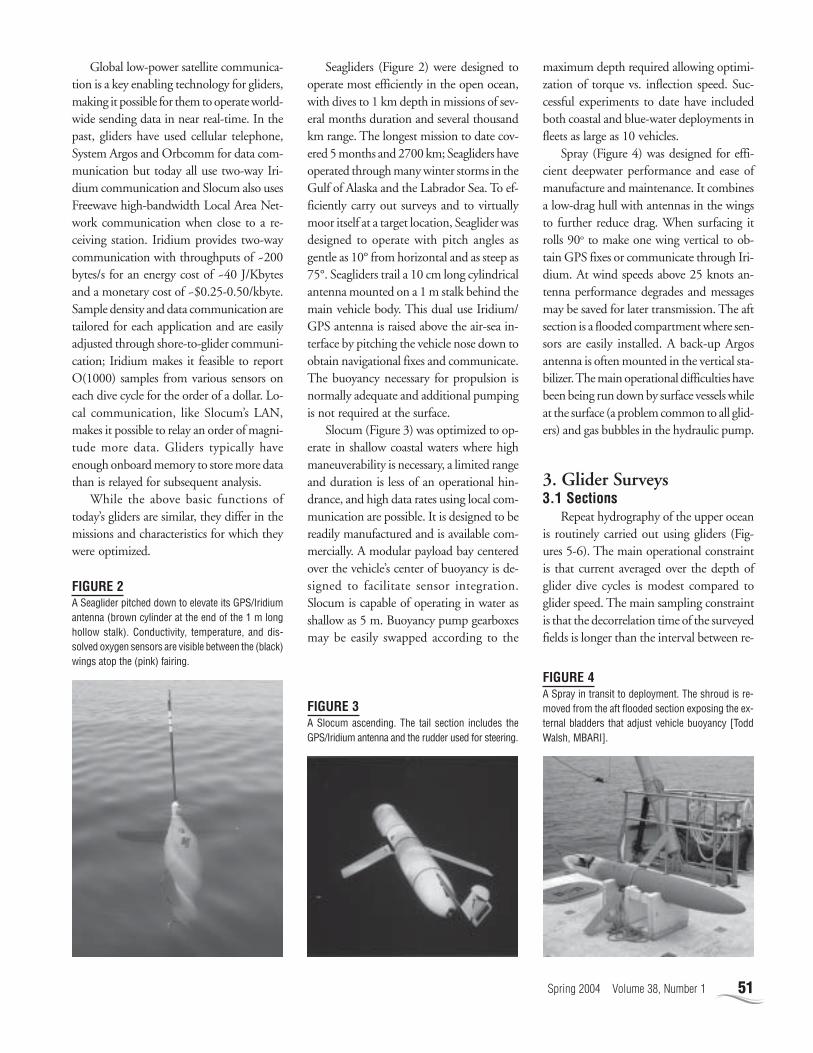
FIGURE 2A Seaglider pitched down to elevate its GPS/Iridiumantenna (brown cylinder at the end of the 1 m longhollow stalk). Conductivity, temperature, and dis-solved oxygen sensors are visible between the (black)wings atop the (pink) fairing.
FIGURE 3A Slocum ascending. The tail section includes theGPS/Iridium antenna and the rudder used for steering.
FIGURE 4A Spray in transit to deployment. The shroud is re-moved from the aft flooded section exposing the ex-ternal bladders that adjust vehicle buoyancy [ToddWalsh, MBARI].
52 Marine Technology Society Journal
peat occupations. While glider economyincreases with mission duration, repeat sec-tion interval is proportional to section lengthand inversely proportional to glider speed.Glider missions in the open deep ocean aremore efficient than, for example, over thecontinental shelf, both because buoyancyengines are more efficient at depth and depthaveraged currents tend to be smaller. Op-erations in strong surface currents presentthe complicating factor that surface driftduring communication may be a significantcomponent of glider displacement over eachdive cycle. While gliders need not necessar-ily surface or communicate after each divecycle, failure to do so introduces uncertaintyin where measurements were made, preventsthe calculation of depth-averaged current,and wastes the energy expended to becomebuoyant. The strategy of using the spatialstructure of current systems to navigationaladvantage may be effective.
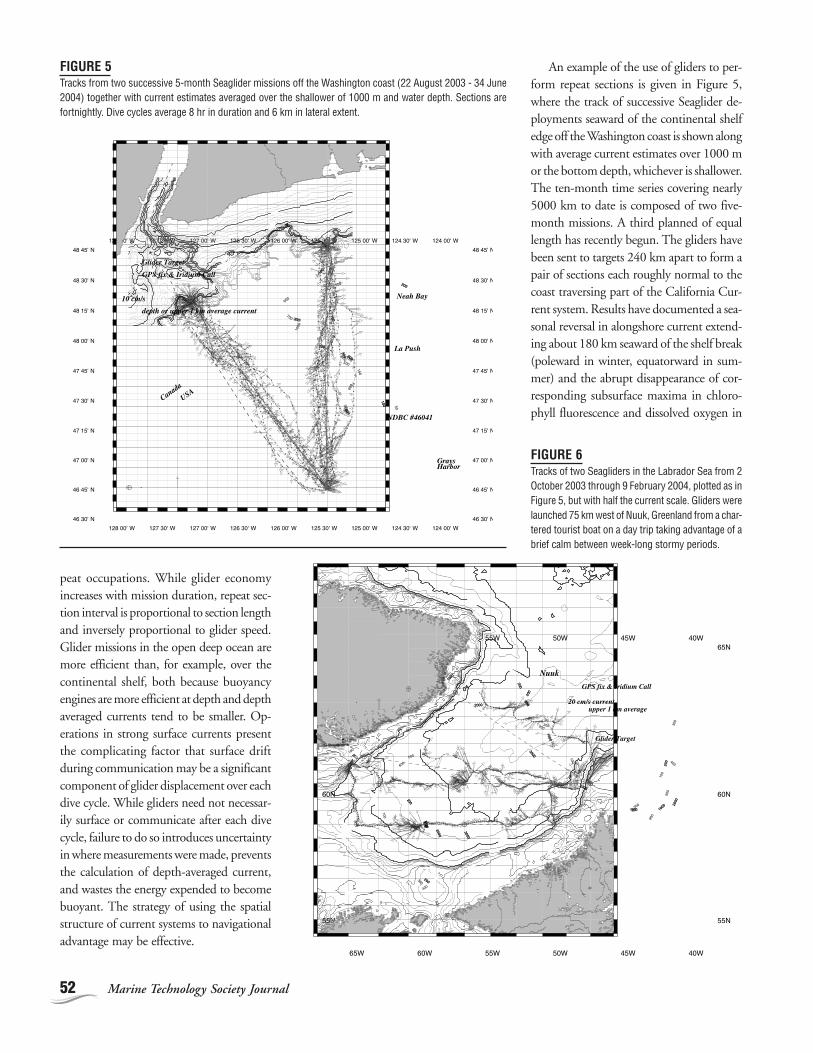
An example of the use of gliders to per-form repeat sections is given in Figure 5,where the track of successive Seaglider de-ployments seaward of the continental shelfedge off the Washington coast is shown alongwith average current estimates over 1000 mor the bottom depth, whichever is shallower.The ten-month time series covering nearly5000 km to date is composed of two five-month missions. A third planned of equallength has recently begun. The gliders havebeen sent to targets 240 km apart to form apair of sections each roughly normal to thecoast traversing part of the California Cur-rent system. Results have documented a sea-sonal reversal in alongshore current extend-ing about 180 km seaward of the shelf break(poleward in winter, equatorward in sum-mer) and the abrupt disappearance of cor-responding subsurface maxima in chloro-phyll fluorescence and dissolved oxygen in
128 00' W
128 00' W
127 30' W
127 30' W
127 00' W
127 00' W
126 30' W
126 30' W
126 00' W
126 00' W
125 30' W
125 30' W
125 00' W
125 00' W
124 30' W
124 30' W
124 00' W
124 00' W
46 30' N 46 30' N
46 45' N 46 45' N
47 00' N 47 00' N
47 15' N 47 15' N
47 30' N 47 30' N
47 45' N 47 45' N
48 00' N 48 00' N
48 15' N 48 15' N
48 30' N 48 30' N
48 45' N 48 45' N
50
100
100
100
150
150
200
200
200
250
300
100
100
100
200
200
200
300400
500
600
600
700
700
800
800
900
900
1000
1000
GPS fix & Iridium Call
10 cm/s
depth or upper 1 km average current
Canada
USA
Neah Bay
Grays Harbor
NDBC #46041
La Push
Glider Target
65W
65W
60W
60W
55W
55W
50W
50W
45W
45W
40W
40W
55N 55N
60N 60N
65N 65N
100
100
100
100
100
200
200
200
200
200
200
200
200
300
300
300
300
300
300
400
400
400
400
400
500
500
500
500
500
600
600
600
600
600
700
700
700
700
800
800
800
800
900
900
900
900
200
200
200
200
200
200
200
200
1000
1000
1000
1000
2000
2000
2000
2000
3000
3000
3000
1000
1000
1000
1000
2000
2000
2000
2000
3000
3000
3000
GPS fix & Iridium Call
20 cm/s currentupper 1 km average
Nuuk
Glider Target
FIGURE 5Tracks from two successive 5-month Seaglider missions off the Washington coast (22 August 2003 - 34 June2004) together with current estimates averaged over the shallower of 1000 m and water depth. Sections arefortnightly. Dive cycles average 8 hr in duration and 6 km in lateral extent.
FIGURE 6Tracks of two Seagliders in the Labrador Sea from 2October 2003 through 9 February 2004, plotted as inFigure 5, but with half the current scale. Gliders werelaunched 75 km west of Nuuk, Greenland from a char-tered tourist boat on a day trip taking advantage of abrief calm between week-long stormy periods.
53Spring 2004 Volume 38, Number 1
autumn and reappearance in spring. Thesegliders have so far not shown evidence ofperformance degradation due to fouling.
An example of a larger scale survey isgiven in Figure 6, where the tracks of twoSeagliders crossing the Labrador Sea in win-ter are shown. While stratification was con-siderably weaker than off the Washingtoncoast, depth averaged currents were some-times strong enough to cause these glidersto deviate substantially from the plannedcourses. Nevertheless, they were successfulin completing a pair of 1000 km long shelf-edge to shelf-edge surveys across the Labra-dor Sea along 55°W and 58°W, respectively,execute a half dozen crossings of the Labra-dor Current, and nearly complete returnsections. The partial section from the La-brador shelf to near the southern tip ofGreenland, in particular, demonstrates howa glider traveling at 0.21 m/s through ed-dies with depth averaged flows sometimesnearly double that can be taken off course.These gliders observed convection deepenthe surface mixed layer by ~300 m over their4 months of operation. Compact flashmemory file corruption errors impaired op-eration during their last month of operationand are suspected of leading eventually tovehicle loss.
3.2 Virtual MooringAs long as currents are not stronger than
glider speed, a glider can be programmed toperform repeated profiles while holdinghorizontal position nearly constant. In thismode of sampling, which has come to beknown as the “virtual mooring,” a glider canhold station as well as the surface buoy of amooring, on the order of 1 km (Weller etal., 1990). A glider may be deployed to tran-sit to a predetermined location, virtuallymoor itself for a time, and later return to bepicked up close to shore. Like a profilingmooring, but unlike a standard mooringwith fixed sensors, a virtually moored gliderprovides profiles essentially continuous indepth. The principal advantages of moor-ings with fixed sensors are that simultaneousmeasurements at different depths allow highfrequency phenomena to be sampled. Otheradvantages of moorings are that large, hy-
drodynamically rough instruments can bedeployed on them, and that surface meteo-rology can be measured from a surface buoy.Sophisticated moorings require more mate-rial resources and labor than a glider to in-stall and operate, mainly due to size anddependence on ship operations.
The few examples of virtual mooringssuggest that the technique holds promise.In an early demonstration of glider perfor-mance in 1999, a Spray was virtually mooredin an underwater canyon off Monterey(Sherman et al., 2001). In 11 days, a total of182 profiles were completed from the sur-face to the 380 m bottom. In another ex-ample, a pair of Seagliders was stationed 1.5km apart across a 3 km wide fjord (part ofPuget Sound) in 2001, from which alongchannel current profiles were calculated geo-strophically. The Seagliders chose course andspeed to maintain their positions based onthe predictions of a Kalman filter that as-similated diurnal and semidiurnal tidal andmean currents from the difference betweendead-reckoned and absolute displacementsover each dive cycle. In May 2004, as a tech-nology demonstration for the U.S. NavalOceanographic Office the WHOI GliderLab ran a fleet of 5 gliders in the westerntropical Pacific 500 km east of Luzon Strait.This is a mid-ocean site near the subtropicalfront rich with mesoscale eddies. Most ofthe vehicles were deployed in a virtualmoored array within a 100 km box. Thistwo-week experiment (whose results are notyet available at the time of the writing ofthis manuscript) continues the demonstra-tion of utility of glider networks.
3.3 Comparison to Other Modes ofSampling
To begin to understand what part of theocean’s temporal and spatial spectrum glid-ers sample, it is useful to compare them toestablished sampling methodologies. In atypical deployment a glider may profile fromthe surface to 500 m at a horizontal speedof 0.25 m s-1, repeating a cycle once every 3km in 3.3 h. The horizontal resolution andvertical range compares to that of the SeaSoar(Pollard, 1986) towed vehicle, which pro-files to a depth of typically 350 m at a tow
speed of 4 m s-1, repeating a cycle every 3km in 0.2 h. Thus, while spatial sampling issimilar from a glider or a SeaSoar, the sur-vey speed and resolved time scales are quitedifferent. SeaSoar observations suggest thatspatial structure tens of kilometers in sizechanges on time scales of days to weeks. Thuseven a relatively short glider section will con-fuse temporal variability as spatial structure,and it is probably not appropriate to con-sider a glider section to be a snapshot ofocean conditions.
The sampling from a glider can also becompared to that of its predecessor technol-ogy, the profiling float. In a typical use, afloat can be programmed to profile continu-ously the upper 500 m in the same 3.3 hoursas a glider. The float moves horizontally withthe 500 m depth-average velocity, yieldinga semi-Lagrangian time series of profiles. Thekey advantage of using a glider in the sameapplication is that the horizontal positionof the glider is, within limits, controllable.Consider an observational program focusedon a specific region of the ocean. While afloat deployed in the region may be advectedoutside the region by ocean currents, a glidermay be programmed to provide profiles atdesired locations within the region. Thusgliders may be appropriately considered asprofiling floats whose horizontal positionsare controllable.
4. A Coastal Glider ArrayThe Autonomous Ocean Sampling Net-
work (AOSN) program is a sustained re-search effort that is responsible for the threeelectric-powered gliders described here.AOSN sprang from the vision of TomCurtin of the Office of Naval Research whosaw Henry Stommel’s concept of buoyancy-driven autonomous vehicles as a path to anetwork of observing platforms linked byreal-time communication to form an arraythat could adapt its strategy according toobservations it made (see Curtin et al.,1993). AOSN has sponsored a number ofexercises (Davis et al., 2003), the most re-cent of which is discussed below.
In the summer of 2003 the AOSN pro-gram mounted an ambitious month-long
54 Marine Technology Society Journal
observational effort spanning an area ofroughly 100 km on a side centered onMonterey Bay that combined a wide varietyof observing assets from ships and high-speed AUVs to slow long-duration under-water gliders. The broad goal was to blendthese assets into an adaptive array reportingphysical and bio-optical parameters to twodata-assimilating numerical models so thatthey could forecast conditions out to a fewdays in advance. Coastal upwelling is vigor-ous along the central California coast in thisseason with upwelling events typically sepa-rated by periods of weak alongshore winds.Warm well-stratified water that accumulatesduring “wind relaxation” periods is sweptoffshore during wind events as the ther-mocline first surfaces at the coast and thenthe surface outcrop moves offshore until thewind slackens. Questions of concern in-cluded how this essentially two-dimensionalprocess develops across the mouth ofMonterey Bay and the substantial bathymet-ric perturbation of the underwater canyon.
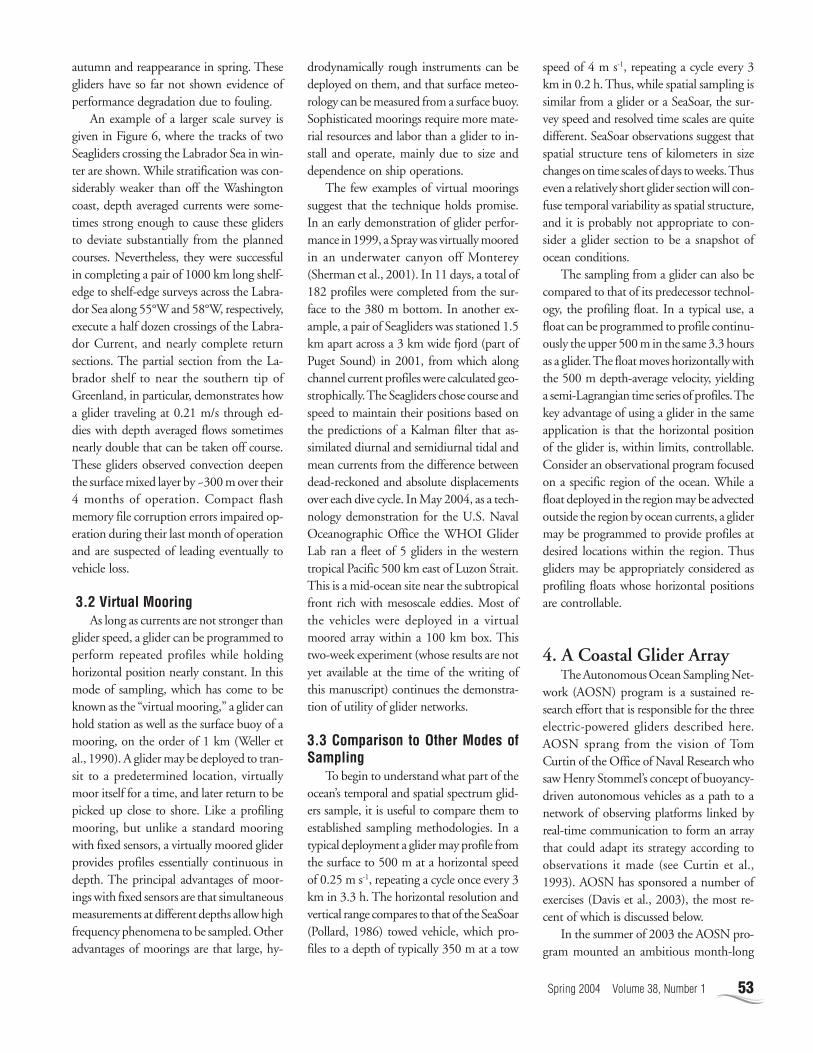
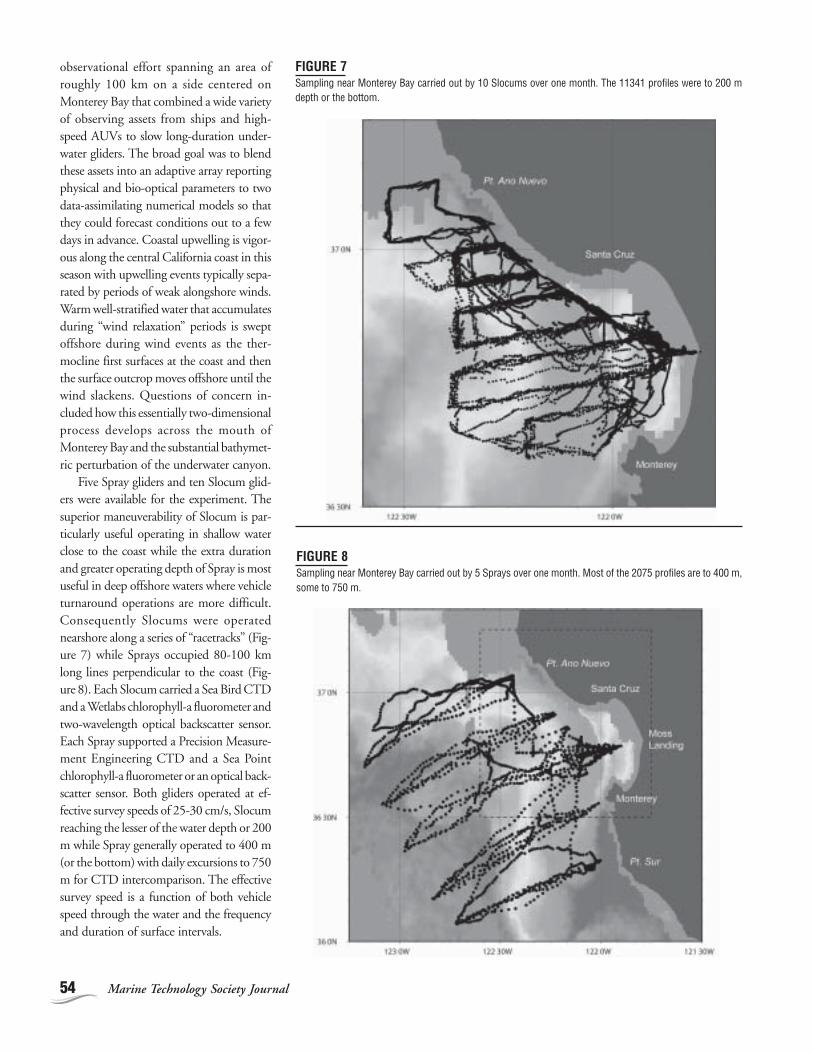
Five Spray gliders and ten Slocum glid-ers were available for the experiment. Thesuperior maneuverability of Slocum is par-ticularly useful operating in shallow waterclose to the coast while the extra durationand greater operating depth of Spray is mostuseful in deep offshore waters where vehicleturnaround operations are more difficult.Consequently Slocums were operatednearshore along a series of “racetracks” (Fig-ure 7) while Sprays occupied 80-100 kmlong lines perpendicular to the coast (Fig-ure 8). Each Slocum carried a Sea Bird CTDand a Wetlabs chlorophyll-a fluorometer andtwo-wavelength optical backscatter sensor.Each Spray supported a Precision Measure-ment Engineering CTD and a Sea Pointchlorophyll-a fluorometer or an optical back-scatter sensor. Both gliders operated at ef-fective survey speeds of 25-30 cm/s, Slocumreaching the lesser of the water depth or 200m while Spray generally operated to 400 m(or the bottom) with daily excursions to 750m for CTD intercomparison. The effectivesurvey speed is a function of both vehiclespeed through the water and the frequencyand duration of surface intervals.
FIGURE 7Sampling near Monterey Bay carried out by 10 Slocums over one month. The 11341 profiles were to 200 mdepth or the bottom.
FIGURE 8Sampling near Monterey Bay carried out by 5 Sprays over one month. Most of the 2075 profiles are to 400 m,some to 750 m.
55Spring 2004 Volume 38, Number 1
Slocum data were acquired and reportedat high resolution (approximately 40 cm inthe vertical and 1 km laterally). The result-ant rapid vertical cycling and significantlyhigher data transmission volume coupledwith a lower stored energy capacity requiredthat Slocums be recovered for re-poweringapproximately every 12-14 days. The Sprays,with more stored energy, lower drag, and alower relayed data rate (approximately 6 mvertical resolution) operated for up to 5weeks while exhausting less than 20% oftheir stored energy.
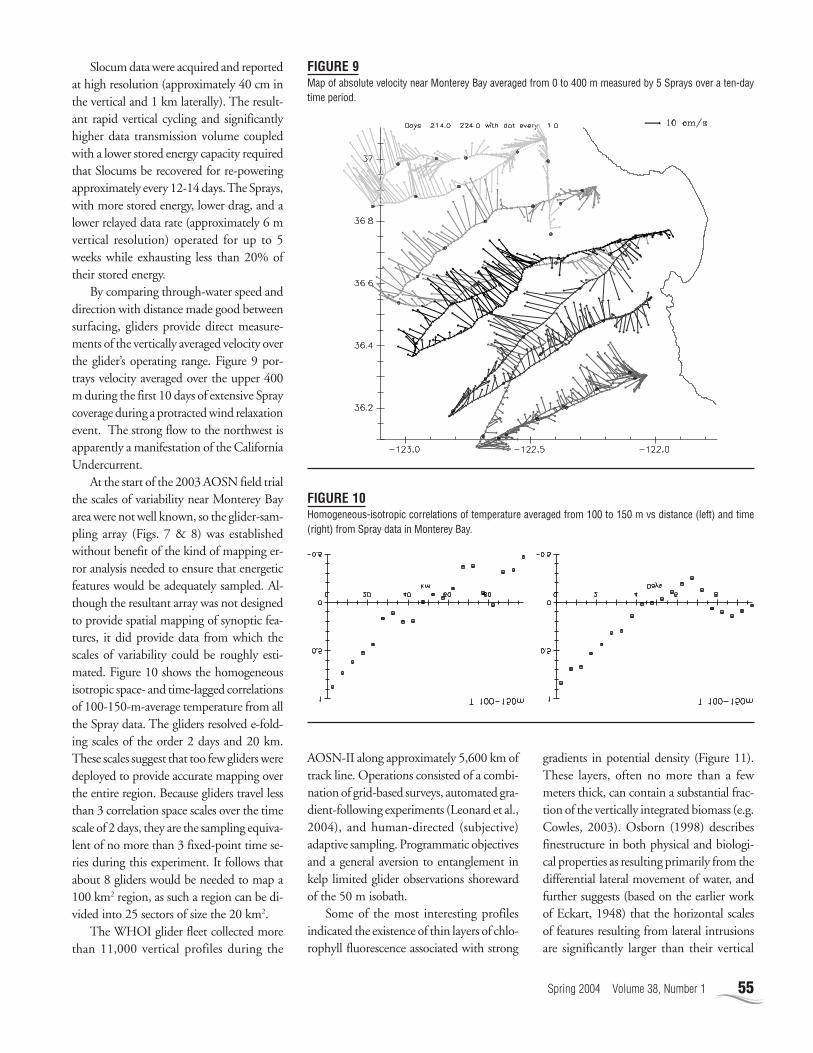
By comparing through-water speed anddirection with distance made good betweensurfacing, gliders provide direct measure-ments of the vertically averaged velocity overthe glider’s operating range. Figure 9 por-trays velocity averaged over the upper 400m during the first 10 days of extensive Spraycoverage during a protracted wind relaxationevent. The strong flow to the northwest isapparently a manifestation of the CaliforniaUndercurrent.
At the start of the 2003 AOSN field trialthe scales of variability near Monterey Bayarea were not well known, so the glider-sam-pling array (Figs. 7 & 8) was establishedwithout benefit of the kind of mapping er-ror analysis needed to ensure that energeticfeatures would be adequately sampled. Al-though the resultant array was not designedto provide spatial mapping of synoptic fea-tures, it did provide data from which thescales of variability could be roughly esti-mated. Figure 10 shows the homogeneousisotropic space- and time-lagged correlationsof 100-150-m-average temperature from allthe Spray data. The gliders resolved e-fold-ing scales of the order 2 days and 20 km.These scales suggest that too few gliders weredeployed to provide accurate mapping overthe entire region. Because gliders travel lessthan 3 correlation space scales over the timescale of 2 days, they are the sampling equiva-lent of no more than 3 fixed-point time se-ries during this experiment. It follows thatabout 8 gliders would be needed to map a100 km2 region, as such a region can be di-vided into 25 sectors of size the 20 km2.
The WHOI glider fleet collected morethan 11,000 vertical profiles during the
FIGURE 9Map of absolute velocity near Monterey Bay averaged from 0 to 400 m measured by 5 Sprays over a ten-daytime period.
FIGURE 10Homogeneous-isotropic correlations of temperature averaged from 100 to 150 m vs distance (left) and time(right) from Spray data in Monterey Bay.
AOSN-II along approximately 5,600 km oftrack line. Operations consisted of a combi-nation of grid-based surveys, automated gra-dient-following experiments (Leonard et al.,2004), and human-directed (subjective)adaptive sampling. Programmatic objectivesand a general aversion to entanglement inkelp limited glider observations shorewardof the 50 m isobath.
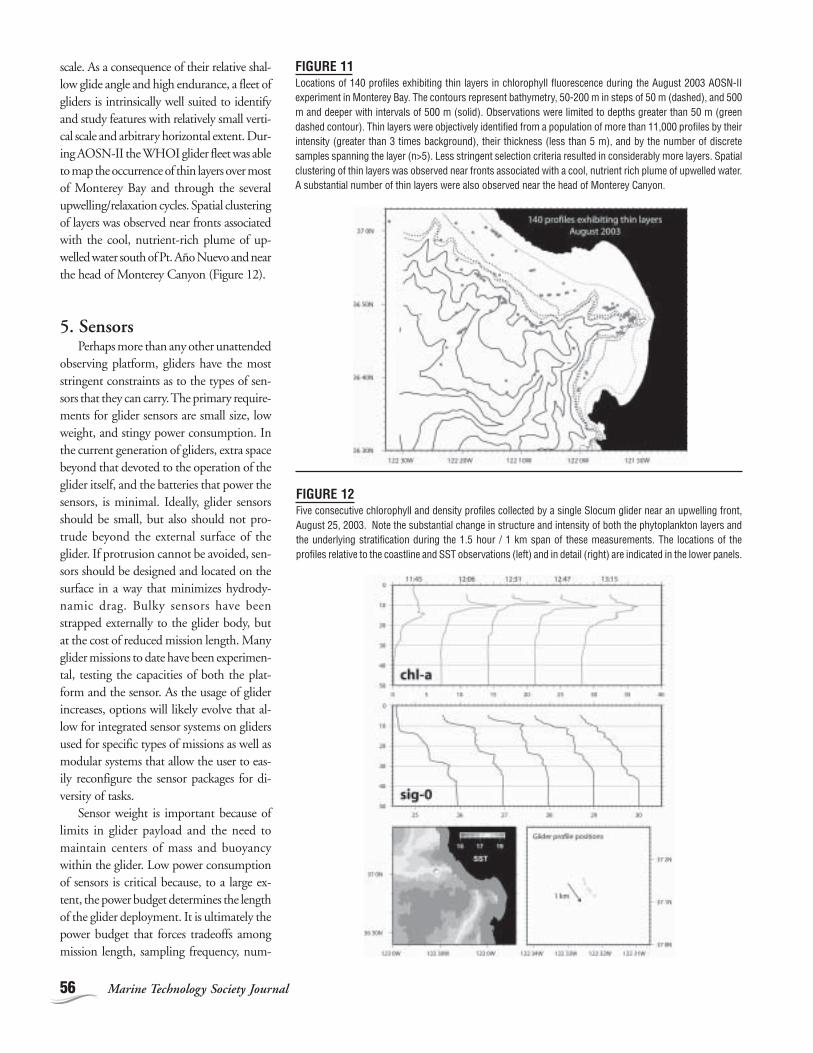
Some of the most interesting profilesindicated the existence of thin layers of chlo-rophyll fluorescence associated with strong
gradients in potential density (Figure 11).These layers, often no more than a fewmeters thick, can contain a substantial frac-tion of the vertically integrated biomass (e.g.Cowles, 2003). Osborn (1998) describesfinestructure in both physical and biologi-cal properties as resulting primarily from thedifferential lateral movement of water, andfurther suggests (based on the earlier workof Eckart, 1948) that the horizontal scalesof features resulting from lateral intrusionsare significantly larger than their vertical
56 Marine Technology Society Journal
scale. As a consequence of their relative shal-low glide angle and high endurance, a fleet ofgliders is intrinsically well suited to identifyand study features with relatively small verti-cal scale and arbitrary horizontal extent. Dur-ing AOSN-II the WHOI glider fleet was ableto map the occurrence of thin layers over mostof Monterey Bay and through the severalupwelling/relaxation cycles. Spatial clusteringof layers was observed near fronts associatedwith the cool, nutrient-rich plume of up-welled water south of Pt. Año Nuevo and nearthe head of Monterey Canyon (Figure 12).
5. SensorsPerhaps more than any other unattended
observing platform, gliders have the moststringent constraints as to the types of sen-sors that they can carry. The primary require-ments for glider sensors are small size, lowweight, and stingy power consumption. Inthe current generation of gliders, extra spacebeyond that devoted to the operation of theglider itself, and the batteries that power thesensors, is minimal. Ideally, glider sensorsshould be small, but also should not pro-trude beyond the external surface of theglider. If protrusion cannot be avoided, sen-sors should be designed and located on thesurface in a way that minimizes hydrody-namic drag. Bulky sensors have beenstrapped externally to the glider body, butat the cost of reduced mission length. Manyglider missions to date have been experimen-tal, testing the capacities of both the plat-form and the sensor. As the usage of gliderincreases, options will likely evolve that al-low for integrated sensor systems on glidersused for specific types of missions as well asmodular systems that allow the user to eas-ily reconfigure the sensor packages for di-versity of tasks.
Sensor weight is important because oflimits in glider payload and the need tomaintain centers of mass and buoyancywithin the glider. Low power consumptionof sensors is critical because, to a large ex-tent, the power budget determines the lengthof the glider deployment. It is ultimately thepower budget that forces tradeoffs amongmission length, sampling frequency, num-
FIGURE 11Locations of 140 profiles exhibiting thin layers in chlorophyll fluorescence during the August 2003 AOSN-IIexperiment in Monterey Bay. The contours represent bathymetry, 50-200 m in steps of 50 m (dashed), and 500m and deeper with intervals of 500 m (solid). Observations were limited to depths greater than 50 m (greendashed contour). Thin layers were objectively identified from a population of more than 11,000 profiles by theirintensity (greater than 3 times background), their thickness (less than 5 m), and by the number of discretesamples spanning the layer (n>5). Less stringent selection criteria resulted in considerably more layers. Spatialclustering of thin layers was observed near fronts associated with a cool, nutrient rich plume of upwelled water.A substantial number of thin layers were also observed near the head of Monterey Canyon.
FIGURE 12Five consecutive chlorophyll and density profiles collected by a single Slocum glider near an upwelling front,August 25, 2003. Note the substantial change in structure and intensity of both the phytoplankton layers andthe underlying stratification during the 1.5 hour / 1 km span of these measurements. The locations of theprofiles relative to the coastline and SST observations (left) and in detail (right) are indicated in the lower panels.
57Spring 2004 Volume 38, Number 1
ber and types of sensors incorporated intoor attached onto gliders. For some applica-tions, endurance is key; for others, the key isthe ability to measure specific variables, evenif the sensors are not optimized for gliders.Power restrictions also influence the qualityof data collected by some sensors. For ex-ample, in traditional applications of conduc-tivity and oxygen sensors, pumps deliverwater to the sensing surface at constant rates.The power consumption of currently avail-able pumps is a serious constraint, but theiruse on gliders is being investigated. Waterflow through sensors depends on glidermotion, and hence is variable, reducing theaccuracy of the data, although efforts areunderway to model the responses of varioussensors on gliders. Some sensors that havebeen flown on gliders are commercially avail-able, while others are in various stages ofdevelopment, or optimization for gliders, atacademic institutions or industry. The natu-ral evolution of oceanographic sensors hasbeen reduction in power and size withoutsacrificing performance, and the extremetechnological challenges of sensing on glid-ers have accelerated the development of anew generation of small sensors specificallydesigned for gliders that will also be highlyapplicable for other autonomous observingplatforms (Rudnick and Perry, 2003).
5.1 Sensors Used to DateDespite the constraints of size, weight,
and power, an impressive diversity of bio-logical, chemical, and physical sensors havealready been deployed on gliders. Tempera-ture, salinity, and pressure sensors form thebasic suite of sensors that have been inte-grated into all gliders; because of the lowpower consumption of these sensors, tem-perature and salinity can be continuouslymonitored. Daly et al. (2004) provide anoverview of chemical and biological sensors,their stage of development, and present ca-pabilities for gliders and other platforms. Inthe last few years a number of optical sen-sors have been developed that meet glidersize and power constraints, and a diversityof optical sensors have been deployed onSeaglider, Slocum, and Spray. Passive radi-ometers measure apparent optical proper-
ties (AOPs) and depend on sunlight as thesource of light; their power consumption islow, but the major disadvantage is that theycannot operate at night or below the photiczone. A small cosine PAR sensor (i.e., Pho-tosynthetically Active Radiation, visiblewavelengths) developed by Fucile at WHOIwas used on Slocum gliders during theAOSN experiment in summer 2003. Sen-sor placement is important, particularly forAOP sensors; scalar irradiance sensors thatmeasure ~ 4 pi steradians many be prefer-able for gliders and obviate the need to cor-rect of variability in glider orientation dur-ing dives. A small prototype biolumines-cence sensor, primarily for detection of di-noflagellate bioluminescence, has been de-ployed on gliders by WHOI. Active opticalsensors, consisting of internal light sourcesand detectors, are able to collect data at nightand below the photic zone, but at the costof greater power consumption relative topassive sensors. The active sensors measureinherent optical properties (IOPs = absorp-tion, scattering, and attenuation coefficients)and fluorescence of chlorophyll, phycoeryth-rin and CDOM (chromophoric dissolvedorganic matter); these variables serve as prox-
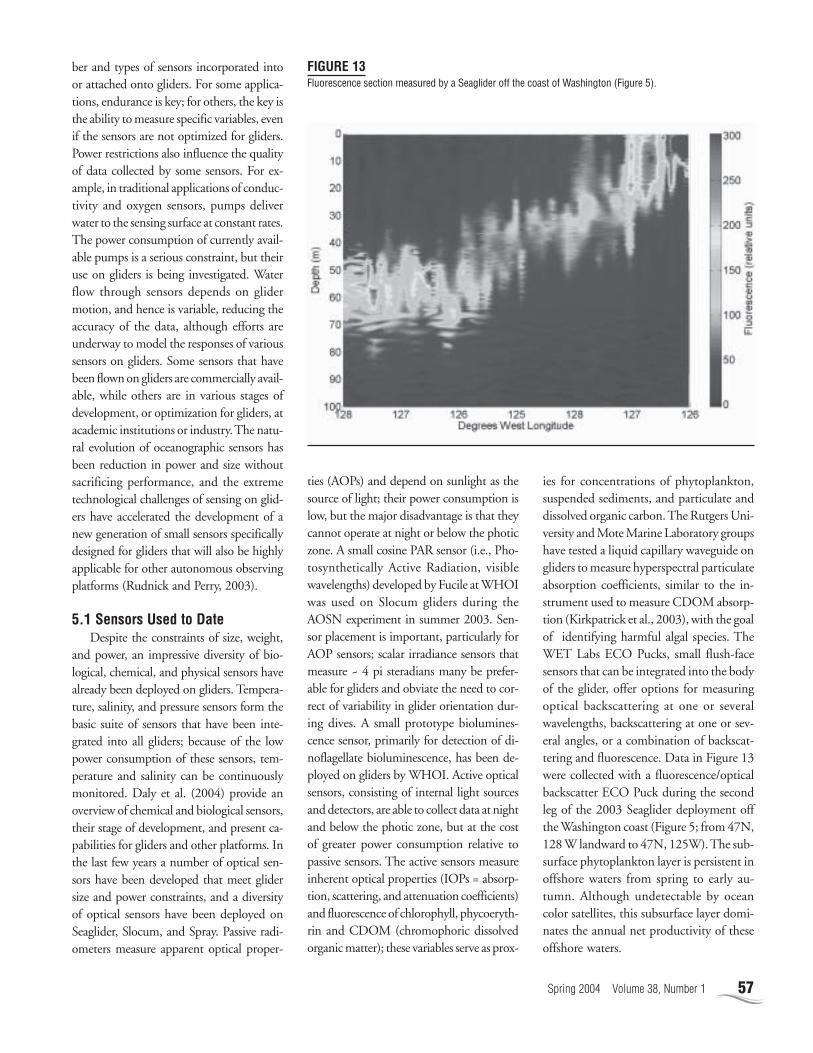
ies for concentrations of phytoplankton,suspended sediments, and particulate anddissolved organic carbon. The Rutgers Uni-versity and Mote Marine Laboratory groupshave tested a liquid capillary waveguide ongliders to measure hyperspectral particulateabsorption coefficients, similar to the in-strument used to measure CDOM absorp-tion (Kirkpatrick et al., 2003), with the goalof identifying harmful algal species. TheWET Labs ECO Pucks, small flush-facesensors that can be integrated into the bodyof the glider, offer options for measuringoptical backscattering at one or severalwavelengths, backscattering at one or sev-eral angles, or a combination of backscat-tering and fluorescence. Data in Figure 13were collected with a fluorescence/opticalbackscatter ECO Puck during the secondleg of the 2003 Seaglider deployment offthe Washington coast (Figure 5; from 47N,128 W landward to 47N, 125W). The sub-surface phytoplankton layer is persistent inoffshore waters from spring to early au-tumn. Although undetectable by oceancolor satellites, this subsurface layer domi-nates the annual net productivity of theseoffshore waters.
FIGURE 13Fluorescence section measured by a Seaglider off the coast of Washington (Figure 5).
58 Marine Technology Society Journal
Oxygen sensor technology and issuesrelated to calibration and stability are re-viewed in Daly et al. (2004). The Sea-Birdoxygen sensor, based on a modified Clarkpolarographic membrane, is currently usedon Seaglider; because water is not pumpedacross the surface of the membrane at a con-stant rate, calibration is more difficult thanfor pumped systems. A completely differ-ent type of oxygen sensor, available commer-cially from Aanderra, will soon be tested ongliders. Optode technology is based on fluo-rescence quenching: the fluorescent emissionof a fluorophore is reduced as a function ofoxygen concentration. The use of oxygenoptodes in the oceanographic communityis relatively new, and assessment of the per-formance of these sensors is an area of activeresearch.
5.2 Current Developments and Pos-sibilities
One genre of sensors that has not yet beendeployed on gliders, because of size and powerrequirements, is the nutrient sensor. Measure-ment of macronutrients—nitrate, nitrite,ammonium, phosphate, silicate—and tracemetals is central to biogeochemical studies aswell as to water quality assessment. In-waternutrient sensor technology is rapidly evolv-ing and the size of wet chemical sensors forquantifying them is diminishing. Recent de-velopments have made it possible to measurenitrate in seawater, without traditional colo-rimetric analysis or pumps, based on its UVabsorption spectrum (Johnson andColetti,2002). Continued advances in opto-electronics, such as UV-light emitting diodes,are necessary to reduce the power consump-tion of the UV nitrate sensor. The develop-ment of low-power pumps is critical to wetchemistry, as well as to the performance ofother sensors. Long-term deployments of glid-ers that carry nutrient sensors will only bepossible if power consumption is reduced byseveral orders of magnitude, and the technol-ogy is moving in that direction (cf. Table 2,Daly et al., 2004).
To date, acoustic methods for zooplank-ton biomass assessment have not been at-tempted on gliders, largely due to the weightand power consumption of these sensors.
The development of high-quality, low-poweracoustic for measuring zooplankton, andfish, are sorely needed for marine food webstudies and to track individuals or schoolsfor extended periods of time. We know rela-tively little about how organisms react tosmall-scale changes in the physical, biologi-cal, and chemical conditions of their habi-tat.
Velocity observations are now derivedfrom gliders by dead-reckoning betweenprofiles. These depth-average velocities areessential to the control of gliders, as well asbeing valuable data. A current developmentis the deployment Acoustic Doppler Cur-rent Profilers (ADCPs) on gliders. ADCPswould provide depth-dependent velocityprofiles, making possible the calculation offluxes of other observed parameters, such asheat, salt, and chlorophyll. A fully success-ful deployment of an ADCP on a glider islikely within the next year or two.
Gliders should be ideal platforms formeasuring turbulence because they moveslowly with little vibration or platform noise.The turbulence sensors now in use on teth-ered and autonomous profilers could bedeployed on gliders. Fast-response ther-mistors and conductivity sensors, opticalsensors, and pitot tubes are all legitimatepossibilities. The high data rates of these sen-sors would call for relatively short deploy-ments with most data recorded internally,but not communicated in real time.
Biofouling remains an issue that affectsthe performance of many sensors. The gen-eral term biofouling encompasses organic,bacterial and microalgal films, macroalge(typically filamentous), barnacles andbivalves. A major question on long-termdeployments is when biofouling began andhow the instrument behavior changed overtime. Glider missions that entail only shal-low dives in biological-rich waters experi-ence heavy biofouling within one to severalweeks. In contrast, gliders that perform onlydeep dives in less productive waters can op-erate for months with minimal fouling. Is-sues of biofouling, long-term stability, andevaluation of changes in unattended sensorperformance with time will require creativesolutions, but the payoff is tremendous as
networks of gliders sense a multiple of physi-cal and biogeochemical state and rate vari-ables on the same space and time scales.
6. ConclusionGliders are a new technology in active
development. Each of the three glider de-signs has proven successful in their ownmanner. Improvements in design are ongo-ing as experience indicates where better per-formance is needed. A variety of sensors hasbeen deployed on gliders, and many moresensors are in the process of being integrated,with great promise for the future. The re-sults so far suggest that gliders will be animportant observational tool in the comingdecade (Schofield et al., 2002).
The three glider designs discussed hereinconstitute only the first generation of thisnew mode of observation. The developmentof new gliding vehicles, including those withsubstantially greater payload capacity, in-creased depth capability, and higher surveyspeed, is ongoing. These future glider de-signs may bear little resemblance to Spray,Seaglider, and Slocum, yet will embrace thesame design challenges of versatility,economy, and endurance.
The next stage in the use of gliders forocean research is the deployment of manyunits in a coordinated fashion matched to thescales of interest. An example of such a de-ployment is the 2003 AOSN exercise in thecoastal waters off Monterey Bay. The first re-sults suggest that gliders can resolve the rel-evant temporal (2 days) and spatial (20 km)scales. A time series of maps was not possiblewith the AOSN glider network, because itwas too sparse, but the requirements for sucha network are being established. Thin layersof chlorophyll coherent with regions of strongdensity stratification, for example, are observ-able with a glider network.
A legitimate, open question is what willgliders eventually contribute to our obser-vational capacity, especially in comparisonto established platforms and techniques. Inthis article, we have offered a few compari-sons to moorings, ship surveys, and floats,but we have not designed performancemetrics (Wilcox et al., 2001), nor made de-
59Spring 2004 Volume 38, Number 1
tailed cost/benefit analyses. Any cost/ben-efit analysis is intricately dependent on theoceanographic process or phenomenon tobe observed. Given the relevant scales of theprocess, the optimum mix of observationalplatforms may be determined, usuallythrough trial and error. The value of gliderswill emerge naturally as they are increasinglyused to do science in the coming years.
Observing the ocean is a challengingendeavor, made difficult by the wide rangeof time and space scales that must be re-solved. Excellent resolution in time (fromseconds to years) has been possible for thepast thirty years, using moorings developedand operated by many institutions. Satel-lites effectively sample the surface ocean,globally and with good spatial resolution.The frontier in ocean observation is adequateand sustained spatial sampling of the sub-surface ocean. Networks of autonomousplatforms, such as floats (Roemmich et al.,2004) and gliders seem the best way to con-quer that frontier.
AcknowledgmentsThe support of the Office of Naval Re-
search (ONR) and the National ScienceFoundation (NSF) is gratefully acknowl-edged through the following grants: NSFOCE0300208, NSF OCE9819530 (DLR);ONR N000140310429 (RED); NSFOCE0095414, NSF OCE9911036, ONRN000140210791 (CCE); ONRN000140210846 (DMF); NSFOCE9911037 (MJP).
ReferencesCowles, T. J. 2003. Planktonic Layers: Physical
and Biological Interactions on the Small Scale.
Handbook of Scaling Methods in Aquatic
Ecology: Measurement, Analysis, Simulation.
CRC Press, in press.
Curtin, T. B., J. G. Bellingham, J. Catipovic
and D. Webb. 1993. Autonomous oceanographic
sampling networks. Oceanography. 3:86-94.
Daly, K. L., R. H. Byrne, A. G. Dickson, S.
M. Gallager, M. J. Perry and M. K. Tivey.
2004. Chemical and biological sensors for
time-series research: Current status and new
directions. Mar Tech Soc J. 38(2):[pages ?].
Davis, R. E., D. C. Webb, L. A. Regier and J.
Dufour. 1992. The Autonomous Lagrangian
Circulation Explorer (ALACE). J Atmos
Oceanic Technol. 9:264-285.
Davis, R. E., C. C. Eriksen and C. P. Jones.
2003. Autonomous buoyancy-driven
underwater gliders. In: Technology and
Applications of Autonomous Underwater
Vehicles, ed. G. Griffiths, pp. 37-58. Taylor
and Francis.
Eckart, C. 1948. An analysis of the stirring and
mixing processes in incompressible fluids. J
Mar Res. 7:265-275.
Eriksen, C. C., T. J. Osse, R. D. Light, T.
Wen, T. W. Lehman, P. L. Sabin, J. W. Ballard
and A. M. Chiodi. 2001. Seaglider: A long-
range autonomous underwater vehicle for
oceanographic research. IEEE J Oceanic Eng.
26:424-436.
Johnson, K. S. and L. J. Coletti. 2002. In situ
ultraviolet spectrophotometry for high
resolution and long term monitoring of
nitrate, bromide and bisulfide in the ocean.
Deep-Sea Res. I, 49:1291-1305.
Kirkpatrick, G. J., C. Orrico, M. A. Moline,
M. Oliver and O. M. Scholfield. 2003.
Continuous hyperspectral absorption
measurements of colored dissolved organic
material in aquatic systems. App Optics.
42:6564-6568.
Leonard, N. E., R. Bachmayer, P. Bhatta, E.
Fiorelli, D. Paley and D. M. Fratantoni. 2004.
Design and implementation of multi-AUV
control methodologies for adaptive sampling
in a dynamic and uncertain environment.
[Proceedings of?] IEEE Oceanic Engineering
Society, Autonomous Underwater Vehicles
2004, Sebasco Estates, ME.
Osborn, T. 1998. Finestructure, microstructure,
and thin layers. Oceanography. 11:36-43.
Pollard, R. 1986. Frontal surveys with a towed
profiling conductivity/temperature/depth
measurement package (SeaSoar). Nature.
323:433-435.
Roemmich, D., S. Riser, R. Davis and Y.
Desaubies. 2004. Autonomous profiling floats;
workhorse for broadscale ocean observations.
Mar Tech Soc J. 38(2):(pages?).
Rudnick, D. L. and M. J. Perry, eds. 2003.
ALPS: Autonomous and Lagrangian Platforms
and Sensors, Workshop Report. 64 pp.
Schofield, O., T. Bergmann, P. Bissett, J. F.
Grassle, D. B. Haidvogel, J. Kohut, M. Moline
and S. M. Glenn. 2002. The long-term
ecosystem observatory: An integrated coastal
observatory. IEEE J Oceanic Eng. 27:146-154.
Sherman, J., R. E. Davis, W. B. Owens, and J.
Valdes, 2001: The autonomous underwater
glider “Spray”. IEEE J Oceanic Eng. 26:437-446.
Stommel, H. 1989. The Slocum mission.
Oceanography. 2:22-25.
Webb, D. C., P. J. Simonetti and C. P. Jones.
2001. SLOCUM: An underwater glider
propelled by environmental energy. IEEE J
Oceanic Eng. 26:447-452.
Weller, R. A., D. L. Rudnick, N. J.
Pennington, R. P. Trask and J. R. Valdes. 1990.
Measuring upper ocean variability from an
array of surface moorings in the subtropical
convergence zone. J Atmos Oceanic Technol.
7:68-84.
Wilcox, J. S., J. G. Bellingham, Y. Zhang and
A. B. Baggeroer. 2001. Performance metrics
for oceanographic surveys with autonomous
underwater vehicles. IEEE J Oceanic Eng.
26:711-725.