PAPER UNDER REVIEW 1 Perceptual Quality Assessment of HEVC ...
9
IEEE TRANSACTIONS ON BROADCASTING - ACCEPTED VERSION 1 Perceptual Quality Assessment of HEVC and VVC Standards for 8K Video Charles Bonnineau, Wassim Hamidouche, Member, IEEE, J´ erˆ ome Fournier, Naty Sidaty, Member, IEEE, Jean-Franc ¸ois Travers and Olivier D´ eforges Abstract—With the growing data consumption of emerging video applications and users’ requirement for higher resolutions, up to 8K, a huge effort has been made in video compression technologies. Recently, versatile video coding (VVC) has been standardized by the moving picture expert group (MPEG), providing a significant improvement in compression performance over its predecessor high efficiency video coding (HEVC). In this paper, we provide a comparative subjective quality evaluation between VVC and HEVC standards for 8K resolution videos. In addition, we evaluate the perceived quality improvement offered by 8K over UHD 4K resolution. The compression performance of both VVC and HEVC standards has been conducted in random access (RA) coding configuration, using their respective reference software, VVC test model (VTM-11) and HEVC test model (HM-16.20). Objective measurements, using PSNR, MS-SSIM and VMAF metrics have shown that the bitrate gains offered by VVC over HEVC for 8K video content are around 31%, 26% and 35%, respectively. Subjectively, VVC offers an average of around 41% of bitrate reduction over HEVC for the same visual quality. A compression gain of 50% has been reached for some tested video sequences regarding a Student’s t-test analysis. In addition, for most tested scenes, a significant visual difference between uncompressed 4K and 8K has been noticed. Index Terms—Subjective quality assessment, compression effi- ciency, VVC, HEVC, 8K, UHD (4K), I. I NTRODUCTION W ITH the latest ultra-high definition television (UHDTV) system [1] deployment, the quality of experience (QoE) of users is expected to improve by introducing new features to the existing high definition television (HDTV) system [2], including high dynamic range (HDR), wider color gamut, high frame-rate (HFR), and higher spatial resolutions, with 4K (3840 × 2160) and 8K (7680 × 4320) [3], [4]. The delivery of these video formats on current broadcast infrastructures is a real challenge and requires efficient compression methods to reach the available bandwidth while ensuring a higher video quality. Contributions to video coding standards like high efficiency video coding (HEVC) [5] or its successor versatile video coding (VVC), finalized in July 2020 as ITU-T H.266 — MPEG-I - Part 3 (ISO/IEC 23090-3) standard [6], [7], enable video signal compression to be continuously improved through the standardization bodies. Although HEVC has brought a significant bitrate reduction for 4K delivery, its efficiency is C. Bonnineau, W. Hamidouche and J. Fournier are with the Institute of Research and Technology (IRT) b<>com, 35510 Cesson S´ evign´ e, France, e-mail: ([email protected]) C. Bonnineau, W. Hamidouche and O. D´ eforges are also with Univ. Rennes, INSA Rennes, CNRS, IETR - UMR 6164, 20 Avenue des Buttes de Coesmes, 35708 Rennes, France, e-mail: ([email protected]). C. Bonnineau, N. Sidaty, J-F. Travers are also with TDF, 35510 Cesson- S´ evign´ e, France. J. Fournier is also with Orange Labs, 35510 Cesson-S´ evign´ e, France. not enough for 8K applications. Several studies have shown that the bitrate required by HEVC for 8K applications in 60Hz and 120Hz (temporally scalable) is around 80Mbps [8]–[10]. In practice, an 8K 120Hz HEVC codec [11], [12] has been used for Japan’s satellite broadcasting by using DVBS2X [13]. In that case, the use of a complete transponder or multiple bonded transponders can reach bandwidth in the range 70-80Mbps. For terrestrial transmission, such bandwidth requirements prevent the deployment of more than one 8K HEVC program per ultra high frequency (UHF) channel, as practical DVB-T2 [14] channels offer bandwidth in the range of 30-40Mbps over an 8MHz channel. Thus, significant compression gains need to be achieved to ensure the successful deployment of 8K video services. This paper provides both subjective and objective quality assessments of the two latest moving picture expert group (MPEG) video coding standards for 8K video coding. We selected 8K sequences with various spatial and temporal characteristics to provide a fair evaluation. The compression points have been generated using the random access (RA) mode of the VVC and HEVC reference software models, called VVC test model (VTM-11) and HEVC test model (HM-16.20), respectively. For subjective quality assessment, we used the double stimulus continuous quality scale (DSCQS) method described in Recommendation BT.500-14 [15] standardized at ITU-R. This study includes rate-distortion (RD) curves, Bjontegaard-Delta (BD) bitrate evaluation, and a Student’s t-test, offering a robust statistical analysis. The contributions of this work are the following: • Assess the compression gain offered by VVC over HEVC for 8K video contents. This gain represents approximately 41% of bitrate saving for the same visual quality, • Determine the required bitrate for transparency, i.e., no visual difference is perceived between the source and decoded video, • Confirm that non-expert viewers can see the difference between 4K and 8K resolutions and measure that differ- ence, • Evaluate several objective quality metrics based on the subjective test statistics collected on the 8K video dataset. The rest of this paper is organized as follows. Section II provides an overview of existing studies for 4K and 8K video quality assessment. Section III describes the subjective test materials, including the test sequences, the codecs configuration, and the subjective test methodology. The results of both the objective and the subjective experiments are given in Section IV. Finally, Section V concludes the paper. arXiv:2109.06555v3 [eess.IV] 20 Dec 2021
Transcript of PAPER UNDER REVIEW 1 Perceptual Quality Assessment of HEVC ...

IEEE TRANSACTIONS ON BROADCASTING - ACCEPTED VERSION 1
Perceptual Quality Assessment of HEVC and VVCStandards for 8K Video
Charles Bonnineau, Wassim Hamidouche, Member, IEEE,Jerome Fournier, Naty Sidaty, Member, IEEE, Jean-Francois Travers and Olivier Deforges
Abstract—With the growing data consumption of emergingvideo applications and users’ requirement for higher resolutions,up to 8K, a huge effort has been made in video compressiontechnologies. Recently, versatile video coding (VVC) has beenstandardized by the moving picture expert group (MPEG),providing a significant improvement in compression performanceover its predecessor high efficiency video coding (HEVC). In thispaper, we provide a comparative subjective quality evaluationbetween VVC and HEVC standards for 8K resolution videos. Inaddition, we evaluate the perceived quality improvement offeredby 8K over UHD 4K resolution. The compression performance ofboth VVC and HEVC standards has been conducted in randomaccess (RA) coding configuration, using their respective referencesoftware, VVC test model (VTM-11) and HEVC test model(HM-16.20). Objective measurements, using PSNR, MS-SSIMand VMAF metrics have shown that the bitrate gains offeredby VVC over HEVC for 8K video content are around 31%, 26%and 35%, respectively. Subjectively, VVC offers an average ofaround 41% of bitrate reduction over HEVC for the same visualquality. A compression gain of 50% has been reached for sometested video sequences regarding a Student’s t-test analysis. Inaddition, for most tested scenes, a significant visual differencebetween uncompressed 4K and 8K has been noticed.
Index Terms—Subjective quality assessment, compression effi-ciency, VVC, HEVC, 8K, UHD (4K),
I. INTRODUCTION
W ITH the latest ultra-high definition television (UHDTV)system [1] deployment, the quality of experience (QoE)
of users is expected to improve by introducing new featuresto the existing high definition television (HDTV) system [2],including high dynamic range (HDR), wider color gamut, highframe-rate (HFR), and higher spatial resolutions, with 4K (3840× 2160) and 8K (7680 × 4320) [3], [4]. The delivery of thesevideo formats on current broadcast infrastructures is a realchallenge and requires efficient compression methods to reachthe available bandwidth while ensuring a higher video quality.
Contributions to video coding standards like high efficiencyvideo coding (HEVC) [5] or its successor versatile videocoding (VVC), finalized in July 2020 as ITU-T H.266 —MPEG-I - Part 3 (ISO/IEC 23090-3) standard [6], [7], enablevideo signal compression to be continuously improved throughthe standardization bodies. Although HEVC has brought asignificant bitrate reduction for 4K delivery, its efficiency is
C. Bonnineau, W. Hamidouche and J. Fournier are with the Institute ofResearch and Technology (IRT) b<>com, 35510 Cesson Sevigne, France,e-mail: ([email protected])
C. Bonnineau, W. Hamidouche and O. Deforges are also with Univ. Rennes,INSA Rennes, CNRS, IETR - UMR 6164, 20 Avenue des Buttes de Coesmes,35708 Rennes, France, e-mail: ([email protected]).
C. Bonnineau, N. Sidaty, J-F. Travers are also with TDF, 35510 Cesson-Sevigne, France.
J. Fournier is also with Orange Labs, 35510 Cesson-Sevigne, France.
not enough for 8K applications. Several studies have shownthat the bitrate required by HEVC for 8K applications in 60Hzand 120Hz (temporally scalable) is around 80Mbps [8]–[10]. Inpractice, an 8K 120Hz HEVC codec [11], [12] has been usedfor Japan’s satellite broadcasting by using DVBS2X [13]. Inthat case, the use of a complete transponder or multiple bondedtransponders can reach bandwidth in the range 70-80Mbps. Forterrestrial transmission, such bandwidth requirements preventthe deployment of more than one 8K HEVC program perultra high frequency (UHF) channel, as practical DVB-T2 [14]channels offer bandwidth in the range of 30-40Mbps over an8MHz channel. Thus, significant compression gains need tobe achieved to ensure the successful deployment of 8K videoservices.
This paper provides both subjective and objective qualityassessments of the two latest moving picture expert group(MPEG) video coding standards for 8K video coding. Weselected 8K sequences with various spatial and temporalcharacteristics to provide a fair evaluation. The compressionpoints have been generated using the random access (RA)mode of the VVC and HEVC reference software models, calledVVC test model (VTM-11) and HEVC test model (HM-16.20),respectively. For subjective quality assessment, we used thedouble stimulus continuous quality scale (DSCQS) methoddescribed in Recommendation BT.500-14 [15] standardizedat ITU-R. This study includes rate-distortion (RD) curves,Bjontegaard-Delta (BD) bitrate evaluation, and a Student’st-test, offering a robust statistical analysis.
The contributions of this work are the following:
• Assess the compression gain offered by VVC over HEVCfor 8K video contents. This gain represents approximately41% of bitrate saving for the same visual quality,
• Determine the required bitrate for transparency, i.e., novisual difference is perceived between the source anddecoded video,
• Confirm that non-expert viewers can see the differencebetween 4K and 8K resolutions and measure that differ-ence,
• Evaluate several objective quality metrics based on thesubjective test statistics collected on the 8K video dataset.
The rest of this paper is organized as follows. Section IIprovides an overview of existing studies for 4K and 8K videoquality assessment. Section III describes the subjective testmaterials, including the test sequences, the codecs configuration,and the subjective test methodology. The results of both theobjective and the subjective experiments are given in Section IV.Finally, Section V concludes the paper.
arX
iv:2
109.
0655
5v3
[ee
ss.I
V]
20
Dec
202
1

IEEE TRANSACTIONS ON BROADCASTING - ACCEPTED VERSION 2
(a) LayeredKimono (b) BodeMuseum (c) OberbaumSpree
(d) Festival2 (e) JapaneseMaple (f) SteelPlant
Fig. 1: Snapshots of the six selected 8K test video sequences.
II. RELATED WORKS
Recently, a study was conducted to evaluate differentscenarios for 8K video delivery with 4K backward compatibilityrelaying on objective quality metrics [16]. It was shown thatVVC offers around 40% of bitrate reduction over HEVC forthe same peak signal to noise ratio (PSNR) quality on 8Kvideo resolution [17]. Although recently developed objectivequality metrics, like video multimethod assessment fusion(VMAF) [18], are more correlated to subjective test scores, itis acknowledged that these quality metrics still lack fidelityregarding the viewing conditions and the human visual system.Thus, rigorous perceptual quality assessment methodologieshave been developed to fairly evaluate compression algorithmsand ensure experiment reproducibility [19], [20].
For instance, Tan et al. [21] have demonstrated that adifference of 15% of compression gain is noticed depending onwhether the objective or subjective quality is considered whenevaluating HEVC over advanced video coding (AVC). Thisevaluation has been conducted using the respective referenceimplementations of both standards for resolutions ranging from480p to 2160p. Another perceptual study has confirmed thata bitrate saving in the range 55-87% for the same perceivedquality is enabled by HEVC over AVC on a bench of sequences,including 4K contents [22]. Regarding VVC and HEVCcomparison, a recent subjective test has validated that VVCoffers around 40% or bitrate reduction for the same perceivedquality targeting 4K and HD contents [23]. In addition toHEVC and VVC, subjective quality assessment of AOMediaVideo 1 (AV1) has been included in the work of Zhang etal. [24] for 4K video resolution. The results have shown that,at the same video bitrate level, AV1 and HM-16.20 are notsignificantly different in terms of perceived quality.
For 4K video resolution broadcasting with HEVC, a studyhas been conducted regarding target bitrates in the range18-36Mbps [25]. This experiment has demonstrated that 4K
TABLE I: Parameters of the 8K test video sequences. Allsequences are in 4:2:0 color sub-sampling format.
Sequence Resolution(W × H)
Frame-rate
Frames Colorspace
Bitdepth Src
BodeMuseum 7680×4320 60fps 600 BT.709 10 HHIOberbaumSpree 7680×4320 60fps 600 BT.709 10 HHILayeredKimono 7680×4320 60fps 300 BT.2020 10 ITEFestival2 7680×4320 60fps 300 BT.2020 10 ITEJapaneseMaple 7680×4320 60fps 300 BT.2020 10 ITESteelPlant 7680×4320 60fps 600 BT.2020 10 ITE
resolution can reach a good perceptual quality at a bitrate of18Mbps using HEVC.
Concerning 8K resolution videos, several studies have shownthat the bitrate required for 8K applications is approximately80Mbps using HEVC [8]–[10]. The QoE of 8K contents hasalso been assessed regarding different use-cases by usingspecific contents [26], e.g., food, people.
In this paper, we provide a subjective evaluation betweenHEVC and VVC for 8K resolution video. To the best of ourknowledge, this is the first quality assessment study basedon those two MPEG standards for 8K. Also, we provide ananalysis on the gain in terms of quality enhancement offeredby 8K over 4K for the uncompressed selected contents.
III. SUBJECTIVE QUALITY ASSESSMENT OF 8KRESOLUTION
This section provides details regarding the test sequences,the subjective test settings, and the experimental environment.
A. Test video sequences
In this study, we selected six test video sequences over mul-tiple videos collected from the Institute of Image Information
IEEE TRANSACTIONS ON BROADCASTING - ACCEPTED VERSION 3
0 50 100 150 200 250 300 350SI (Spatial Information)
0
25
50
75
100
125
150TI
(Tem
pora
l Inf
orm
atio
n)
BodeMuseumOberbaumSpree
SteelPlant
LayeredKimono
JapaneseMaple
Festival2
Fig. 2: SI-TI graph of the tested 8K video sequences.
and Television Engineers (ITE)1 and the Fraunhofer Heinrich-Hertz-Institut (HHI) [27] 8K video databases. The scenes werechosen based on video features like color, movement, texture,and homogeneous content, leading to different behaviors ofthe compression algorithms. We also considered the relevanceof the 8K resolution in the scene selection. The details of the8K test sequences are reported in Table I. Screenshots of theselected scenes are given in Fig. 1. To ensure homogeneity overvideo sequences and keep the same display parameters for thewhole experiment, we performed a color space conversionfrom BT.709 [28] to BT.2020 [29] for BodeMuseum andOberbaumSpree scenes. Also, as the sequences LayeredKimono,Festival2, and JapaneseMaple contain fewer frames than theothers, we played them back in mirror mode after 5 seconds toget 10 seconds videos while preserving the motion continuityof the scene. For those sequences, the motion direction changewas coherent with the initial content.
The spatial and temporal information (SI-TI) [15] of theselected sequences is plotted in Fig. 2. This 2D plan showsthat the contents selected for the study are diverse regardingspatio-temporal features.
Based on these six uncompressed (raw) selected 8K videosequences (scenes), ten processed video sequences (PVSs) aregenerated per scene:• one 8K (7680×4320) hidden reference uncompressed
video.• one 4K (4320×2160) uncompressed video. In that case,
the source signal is first downscaled to 4K and thenrescaled to 8K by using the Lanczos3 [30] filter providedby ffmpeg2 for both operations.
• 8K video encoded at four bitrates with HEVC.• 8K video encoded at four bitrates with VVC.In total, 60 video sequences are evaluated in this study.The Common Test Conditions for VTM-11 [31] and HM-
16.20 [32] in random access (RA) coding mode for main10profile were used to perform a fair rate/distortion evaluation.These software models provide a reference implementation
1https://www.ite.or.jp/content/test-materials/2https://www.ffmpeg.org/
TABLE II: Selected QP and corresponding bitrates (Mbps),for both VTM-11 and HM-16.20 codecs, according to the testsequence.
Sequence Codec R1
(QP/Mbps)R2
(QP/Mbps)R3
(QP/Mbps)R4
(QP/Mbps)
LayeredKimono HEVC 38/1.9 34/3.2 29/6.3 26/11.4VVC 37/1.8 32/3.4 27/6.5 24/10.8
BodeMuseum HEVC 38/4.7 33/9.8 28/22.5 25/45.4VVC 37/4.8 32/10.1 27/22.6 24/42.9
OberbaumSpree HEVC 38/3.3 33/7.4 28/17.5 24/40.5VVC 37/3.6 32/8.1 27/18.6 23/43.9
Festival2 HEVC 39/17.5 34/32.1 29/59.5 24/130.4VVC 37/17.4 32/32.2 27/61.1 22/135.5
JapaneseMaple HEVC 43/15.2 38/34.9 33/76.1 28/168VVC 42/15.9 37/35.7 32/79.8 27/174.9
SteelPlant HEVC 42/19.6 38/40.5 33/86.9 28/175.5VVC 42/18.0 37/42.9 32/91.1 27/180.5
Seq n A
A
BVideo A
BVideo A
Video B
Video B Vote
Time2s 1s 10s 1s 10s
1s 10s 10s1s 5s
Fig. 3: Subjective basic test cell (BTC) structure according tothe DSCQS evaluation methodology.
of the compression standards, representing their upper-boundcoding performance with a moderate optimization level. Forboth codec, a GOP size of 16 and an Intra Period of 64 frameswere used. For each scene, the test points are obtained usingdifferent fixed quantization parameter (QP) values. To cover awide range of visual quality, we determined the highest bitratevalue considering the transparency, i.e., the bitrate for whichdegradation starts to appear, as the highest bitrate point foreach sequence. Also, the bitrates were carefully selected so thateach bitrate Ri is approximately half of the next bitrate Ri+1
and each VVC bitrate RV V Ci is equal to the corresponding
HEVC bitrate RHEV Ci for i ∈ {1, 2, 3, 4}. The used QPs and
bitrates for each sequence are given in Table II. We can notethat the bitrate selected for transparency varies from 11Mbpsto 180Mbps, depending on the test sequence.
B. Subjective testing procedure
In this study, we used the method described in the ITU-R Recommendation BT.500-14 [15], called double stimuluscontinuous quality scale (DSCQS), to collect the video qualityscores from participants. This testing method requires a priorpseudo-random sequencing of the testing videos, as the observerhas no interactivity with the player. Thus, each test sessionof the DSCQS method consists of different random series ofbasic test cells (BTCs) presentations. This method presents thetest videos by pairs (”video A” and ”video B”) separated withannotated mid-greys. For each BTC, both ”video A” and ”video
IEEE TRANSACTIONS ON BROADCASTING - ACCEPTED VERSION 4
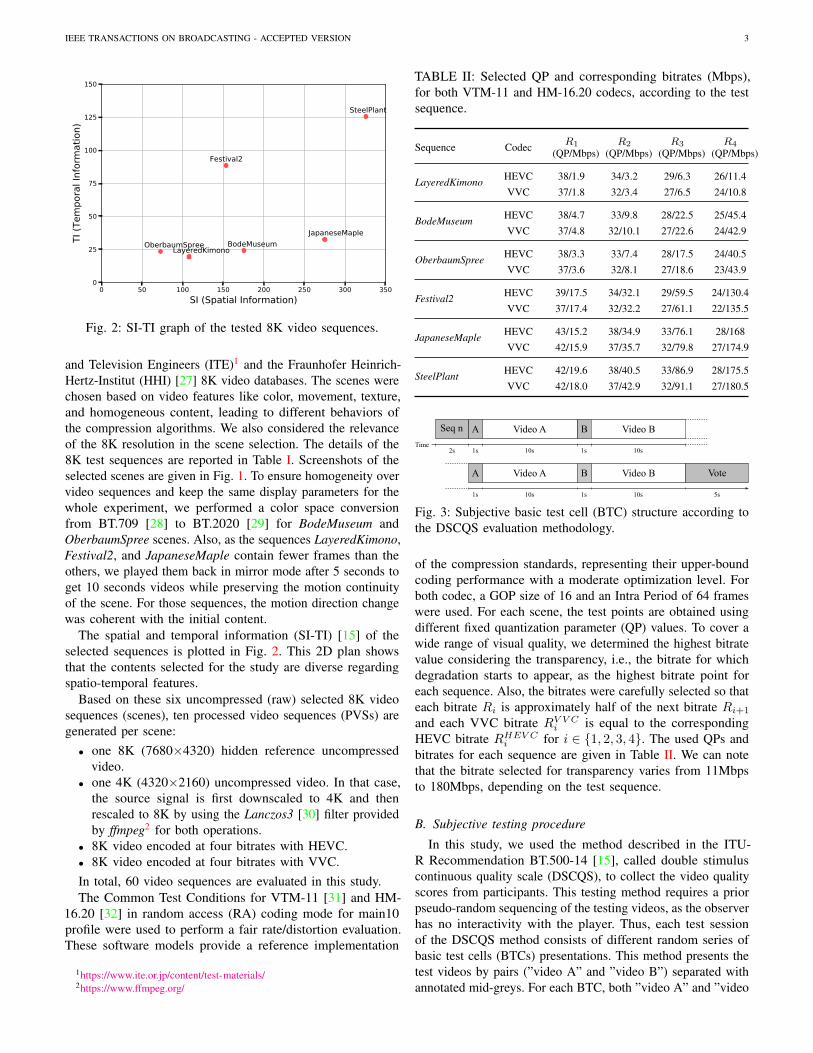
TABLE III: Test logistics.
Monitor SONY 85” KD-85ZGPlayer Zaxel’s Zaxtar 5 8K
Peak luminance 120 cd/m2
Video Format 7680x4320/60p/YUV4:2:0/10bitsViewing distance 0.8H (approximtely 0.8m)
Background color D65 mid-grey
Background luminance 15% of the screen maximumluminance
B” are repeated twice. An example of BTC used for evaluationis illustrated in Fig. 3. Each presented pair contains the implicit8K uncompressed reference and one random PVS over all theten configurations, i.e., the same scene encoded with HEVCor VVC at four bitrates or the uncompressed sequence in 4Kor 8K resolution. Also, to prevent visual fatigue, the test isdivided into three sessions of 20 minutes each. Before eachexperiment, participants receive clear explanations about theevaluation procedures.
After the first ”video A/video B” pair presentation, theparticipant could report his opinion about the perceived videoquality on two vertical lines with the corresponding sequenceindex for both ”video A” and ”video B”. For this testingmethod, the vertical rating lines are divided into five segmentsof the same height and scaled from the lower to the higherquality with the labels Bad, Poor, Fair, Good, and Excellent.After each video pair visualization, participants can vote byannotating both videos along the continuous quality scale. Thescores are then collected by converting the annotations into avalue between 0 and 100.
C. Experimental environmentThis subjective study has been conducted in a controlled
laboratory environment that follows the ITU-R Rec. BT.500-14 [15]. The objective is to offer visualization comfort toparticipants and ensure the reproducibility of the test. Allthe experimental setup details are reported in Table III. Apicture illustrating the test conditions is given in Fig. 4. Atotal of 22 non-expert observers aged from 22 to 53 yearshave taken part in this experiment. All participants have beenscreened for normal visual acuity and color blindness usingthe Ishihara and Snellen vision tests, as described in the ITU-R Recommendation BT.500-14 [15]. To detect outliers, therejection method based on the Kurtosis coefficient from thissame recommendation has been applied and has validated theoverall participant’s reported votes.
D. Subjective quality assessmentAt the end of the subjective test sessions, the results for
each scene are assessed by the differential mean opinionscore (DMOS), corresponding to the average of the differencebetween the hidden reference and the corresponding PVS scorescomputed by:
xa =1
n
n∑i=1
xi,a, (1)
Fig. 4: Illustration of the laboratory environment, compliantwith the ITU-R BT500-13 Recommendation [19].
where n is the total number of valid participants, xa is theDMOS value of the tested configuration a, a ∈ {Rm
j , 4K, 8K(ref)} for j ∈ {1, 2, 3, 4} and m ∈ {V V C,HEV C} and xi,ais the differential score computed as:
xi,a = 100− (yi,ref − yi,a), (2)
with the pair (yi,ref , yi,a) representing the scores attributedby the participant i, i ∈ {1, . . . , n}, to respectively the hiddenreference (8K) and the tested configuration a, i.e. both videosof a given BTC.
To ensure that the vote distributions are normal, the biasreduction technique described in the ITU-T P.913 Recommen-dation [33] has been applied. Thus, from each resulting DMOSxa, the associated confidence intervals at 95% (xa−ca, xa+ca)can be computed as follows:
ca = 1.96sa√n, (3)
where sa is the standard deviation of the tested configurationa computed as:
sa =
√√√√ n∑i=1
(xi,a − xa
)2(n− 1)
, (4)
with xi,a and xa corresponding to the differential score ofthe observer i, i ∈ {1, . . . , n}, and the DMOS score of thetested configuration a, respectively.
In addition, a Student’s t-test with a two-tailed distributionis performed to provide a more rigorous analysis. More detailsare given in Section IV-B
IV. EXPERIMENTAL RESULTS
This section presents and discusses the results of bothobjective and subjective evaluation scores. An assessment ofthe objective metrics performance compared to the subjectivescores for 8K video contents is also investigated.
A. Objective results
In this experiment, objective quality metrics, includingPSNR, multi-scale structural similarity (MS-SSIM) [34], andVMAF [18], are used to measure the distortion between the8K reconstructed signal and the source video. VMAF is an

IEEE TRANSACTIONS ON BROADCASTING - ACCEPTED VERSION 5
0 50 100 150bitrate [Mb/s]
27.5
30.0
32.5
35.0
37.5
40.0
42.5
45.0PS
NR-Y
[dB]
(a) PSNR
0 50 100 150bitrate [Mb/s]
0.90
0.92
0.94
0.96
0.98
MS_
SSIM
(b) MS-SSIM
0 50 100 150bitrate [Mb/s]
40
50
60
70
80
90
100
VMAF
LayeredKimono_vtmBodeMuseum_vtmOberbaumSpree_vtmFestival2_vtmJapaneseMaple_vtmSteelPlant_vtmLayeredKimono_hmBodeMuseum_hmOberbaumSpree_hmFestival2_hmJapaneseMaple_hmSteelPlant_hm
(c) VMAF
Fig. 5: Objective quality comparison, using PSNR, MS-SSIM, and VMAF quality metrics for the 8K test video sequences.
TABLE IV: BD-BR scores of the VTM-11 codec compared to the anchor HM-16.20. The left part of the table represents thebitrate savings (%) for the same quality computed by objective metrics and DMOS. Negative values represent compression gainoffered by VVC over HEVC. The right part of the table illustrates the gain in quality regarding each metric for the same bitrate.Positive values represent a gain in quality (represented in the scale of the considered metric) enabled by VVC over HEVC.
Sequence BD-BR(PSNR)
BD-BR(MS-
SSIM)
BD-BR(VMAF)
BD-BR(DMOS upper and lower
limits)
BD-PSNR
BD-MS-
SSIM
BD-VMAF
BD-DMOS(upper and lower limits)
LayeredKimono -29.77% -21.05% -33.30% -44.99% [-60.92%, -20.04%] +0.61dB +0.003 +4.63 +10.76 [+19.3, +2.22]BodeMuseum -32.75% -25.05% -34.70% -36.43% [-74.71%, +21.12%] +0.88dB +0.002 +3.06 +5.79 [+15.21, -3.63]OberbaumSpree -32.07% -27.00% -33.41% -55.59% [-87.15%, +28.59%] +0.81dB +0.003 +7.55 +7.87 [+18.44, -3.35]Festival2 -36.40% -33.36% -28.24% -28.89% [-59.43%, +37.28%] +1.22dB +0.006 +7.37 +5.13 [+12.98, -2.72]JapaneseMaple -28.33% -23.37% -30.86% -43.36% [-64.42%, -6.69%] +1.04dB +0.009 +6.63 +9.79 [+18.27, +1.31]SteelPlant -28.30% -24.40% -27.57% -37.41% [-67.61%, +13.31%] +0.91dB +0.007 +7.10 +8.83 [+20.40, -2.74]
Average -31.27% -25.7% -35.30% -41.11% [-69.04%, +12.26%] +0.91dB +0.005 +5.48 +8.03 [+17.43, -1.49]
objective metric with reference, based on machine learning(ML) which evaluates the quality between the source and thetested content by giving a score between 0 and 100. Thismetric is trained to produce a score computed from differentfeatures (motion, spatial, texture) that maximize the correlationwith mean opinion score (MOS) scores. Although VMAFwas initially optimized for visual quality estimation of 4Kcontents, we have integrated it into the study as it achieves ahigh correlation with subjective scores. In this experiment, theVMAF scores are computed with the provided set of parametersvmaf v0.6.1.pkl3. The PSNR is assessed on the luma componentonly. The RD curves are depicted in Fig. 5. It can be notedthat the bitrates selected for transparency lead to quite differentPSNR values depending on the sequence. In contrast, for moreperceptually correlated objective metrics like MS-SSIM orVMAF, the predicted quality converges to the maximum valuefor all 8K sequences. Also, those curves confirm the observationmade on the scene complexity with the SI-TI graph in Fig. 2.Three categories of sequences can be distinguished by scenecomplexity: Group 1 includes LayeredKimono, OberbaumSpree,BodeMuseum sequences, Group 2: Festival2, and Group 3:JapaneseMaple, SteelPlants.
We use the Bjontegaard-Delta (BD) computation methoddescribed in [35] to quantify the average gain in bitrate andvisual quality offered by the VTM-11 over the HM-16.20
3https://github.com/Netflix/vmaf
codec. The results are summarized in Table IV. In average,the VTM-11 codec enables around 31%, 26% and 35% ofbitrate saving over the HM-16.20 codec, regarding PSNR, MS-SSIM and VMAF, respectively. However, the area betweenthe interpolated curves covered using the BD-BR approach islimited as the selected bitrates are the same for both VVCand HEVC. Thus, to bring more details on the performanceand consider a wider area between the curves, we computethe gain in quality of the VTM-11 over the HM-16.20 forthe same bitrate using the BD method. By considering thisapproach, 0.91dB, 0.005 and 5.48 of quality improvement isoffered by the VTM-11 over the HM-16.20 codec for the samebitrate, regarding PSNR, MS-SSIM and VMAF quality metrics,respectively.
B. Subjective results
For the subjective quality evaluation, the rectified DMOSscores and their associated 95% confidence interval are col-lected following the method described in Section III-D. Theresulting RD curves are depicted in Fig. 6 for all 8K sequences.These curves also display the scores obtained for the 8K hiddenreference videos and the 4K sequences, with their associated95% confidence interval represented by transparent areas.
In order to confidently evaluate the statistical significanceof the similarity (or not) between different tested sequences,we also performed a two-sample unequal variance Student’st-test with a two-tailed distribution. This study allows us to

IEEE TRANSACTIONS ON BROADCASTING - ACCEPTED VERSION 6
2 4 6 8 10rate [Mb/s]
60
70
80
90
100
DMOS
LayeredKimono
vvchevcref4k
10 20 30 40rate [Mb/s]
60
70
80
90
100
DMOS
BodeMuseum
vvchevcref4k
10 20 30 40rate [Mb/s]
60
70
80
90
100
DMOS
OberbaumSpree
vvchevcref4k
20 40 60 80 100 120 140rate [Mb/s]
60
70
80
90
100
DMOS
Festival2
vvchevcref4k
50 100 150rate [Mb/s]
40
50
60
70
80
90
100
DMOS
JapaneseMaple
vvchevcref4k
50 100 150rate [Mb/s]
30
40
50
60
70
80
90
100
DMOS
SteelPlant
vvchevcref4k
Fig. 6: DMOS-based comparison, with associated 95% confidence interval, for the six selected 8K video sequences.
determine, for each scene, if the perceived quality betweeneach pair of tested configurations is significantly different ornot.
In this experiment, regarding two different tested configu-rations a1 and a2 for a given scene, the null hypothesis, H0,corresponds to the case that a1 and a2 have the same perceivedquality. On the contrary, the alternate hypothesis, Ha, would bethat a difference between the tested configurations a1 and a2is noted. The t-statistic can be estimated to quantify the degreeof significance of the alternate hypothesis Ha. By consideringthe sample populations xa1
and xa2from attributed scores for
the tested configuration a1 and a2, respectively, the t-statisticcan be computed as follows:
ta1,a2 =xa1 − xa2√s2a1na1
+s2a2na2
, (5)
with xaj , s2aj and naj denoting the mean, the variance and
the size of the sample population xaj , with j ∈ {1, 2}.Then, by approximating the t-statistic with a Student’s t-
distribution, a value p, which indicates the degree of correlationbetween the means of the two sample populations, can becomputed from the t-statistic. The higher the p-value is, themore significant the similarity between the distributions of thetwo populations is. A p-value lower than 0.05 indicates thatthere is a statistical significance that the two sample populationsxa1
and xa2have a different perceived quality. Indeed, there is
a low probability of committing a type-I error, i.e., rejecting thenull hypothesis when it is true, meaning that the null hypothesiscan be confidently rejected. On the contrary, if the p-value isgreater than or equal to 0.05, the null hypothesis cannot besafely rejected and both sample populations xa1
and xa2can
be considered to have the same perceived quality. The resultsfor all scenes are given in Table V.
The results demonstrate that the perceived quality betweenuncompressed 8K and 4K formats depends on the scene content.For the sequences JapaneseMaple, SteelPlant, BodeMuseum,and LayeredKimono, the visual quality between both resolutionsis significantly different as the p-value between the configura-tions 4K and REF is lower than 0.05. For those sequences, theglobal motion in the scene is low, which facilitate the samplingof 8K details by sensors. In contrast, for the sequences Festival2and OberbaumSpree, the motion in the scene can explain the 8Kdefinition loss at 60fps. Indeed, the global motion in Festival2video sequence prevents from perceiving the details. For theOberbaumSpree motion blur appears on the scene due to acontinuous horizontal camera traveling. It shows that higherframerates, e.g., 100/120fps, must be considered to fully benefitfrom the 8K resolution.
In complement to the objective study conducted in SectionIV-A, we observe that the bitrate required to obtain transparencywith the uncompressed 8K videos is highly content-dependent.Using VVC, the bitrates needed to reach the reference’s qualityare between 10Mbps to 180Mbps depending on the sequence.For the SteelPlant scene, the quality degradation with the sourceis always perceived on the selected bitrate range. Indeed, thep-values obtained between all RV V C
i and REF configurationsare lower than 0.05 for this sequence. It can be explained bythe smoke in the scene, which is hard to compress and causesblocking artifacts. In comparison, the 8K source quality isobtained only for three scenes using HEVC: BodeMuseum,Festival2, OberbaumSpree. However, two of them are notcritical (Festival2, OberbaumSpree), as no significant differencebetween REF and 4K is perceived (p > 0.05).
In addition, we can notice that, at the same bitrate, VVC

IEEE TRANSACTIONS ON BROADCASTING - ACCEPTED VERSION 7
TABLE V: p-value probabilities resulting from two-sample unequal variance bilateral Student’s t-test on DMOS values for eachpair of tested configurations and each test sequence. p ≥ 0.05 (green) means there is no significant difference between theDMOS value of the row and column labels. In contrast, p < 0.05 (red) indicates that the DMOS value of the row label issignificantly different than the column label. The values referred in Section IV-B are represented in bold.
(a) LayeredKimono
HEVC
VVCR1 R2 R3 R4 4K REF
R1 0.01 0.00 0.00 0.00 0.00 0.00
R2 0.15 0.00 0.00 0.00 0.00 0.00
R3 0.00 0.44 0.00 0.00 0.00 0.00
R4 0.00 0.00 0.79 0.70 0.65 0.01
4K 0.00 0.00 0.88 0.47 1.00 0.01
REF 0.00 0.00 0.02 0.10 0.01 1.00
(b) BodeMuseum
HEVC
VVCR1 R2 R3 R4 4K REF
R1 0.04 0.00 0.00 0.00 0.00 0.00
R2 0.00 0.06 0.00 0.01 0.90 0.00
R3 0.00 0.44 0.13 0.21 0.28 0.07
R4 0.00 0.56 0.98 0.86 0.00 0.62
4K 0.00 0.05 0.00 0.01 1.00 0.00
REF 0.00 0.32 0.58 0.53 0.00 1.00
(c) OberbaumSpree
HEVC
VVCR1 R2 R3 R4 4K REF
R1 0.00 0.00 0.00 0.00 0.00 0.00
R2 0.61 0.04 0.00 0.00 0.04 0.01
R3 0.06 0.74 0.09 0.02 0.16 0.07
R4 0.00 0.23 0.71 0.31 0.85 0.71
4K 0.00 0.23 0.55 0.18 1.00 0.52
REF 0.00 0.10 0.98 0.47 0.52 1.00
(d) Festival2
HEVC
VVCR1 R2 R3 R4 4K REF
R1 0.00 0.00 0.00 0.00 0.00 0.00
R2 0.41 0.00 0.00 0.00 0.00 0.00
R3 0.00 0.34 0.55 0.70 0.73 0.26
R4 0.00 0.42 0.68 0.44 0.53 0.11
4K 0.00 0.21 0.37 0.98 1.00 0.48
REF 0.00 0.02 0.09 0.36 0.48 1.00
(e) JapaneseMaple
HEVC
VVCR1 R2 R3 R4 4K REF
R1 0.00 0.00 0.00 0.00 0.00 0.00
R2 0.33 0.04 0.00 0.00 0.00 0.00
R3 0.00 0.13 0.00 0.00 0.12 0.00
R4 0.00 0.00 0.24 0.00 0.18 0.00
4K 0.00 0.00 0.04 0.00 1.00 0.00
REF 0.00 0.00 0.00 0.14 0.00 1.00
(f) SteelPlant
HEVC
VVCR1 R2 R3 R4 4K REF
R1 0.00 0.00 0.00 0.00 0.00 0.00
R2 0.00 0.11 0.00 0.00 0.00 0.00
R3 0.00 0.55 0.01 0.00 0.00 0.0
R4 0.00 0.00 0.91 0.50 0.07 0.00
4K 0.00 0.00 0.11 0.24 1.00 0.00
REF 0.00 0.00 0.00 0.00 0.00 1.00
TABLE VI: SROCC, PLCC, KROCC and RMSE performanceof the objective quality metrics MS-SSIM, SSIM, VMAF andPSNR on the considered 8K video sequences.
Objective metric SROCC PLCC KROCC RMSE
MS-SSIM 0.887 0.871 0.725 7.409SSIM 0.767 0.777 0.599 9.499VMAF 0.806 0.873 0.603 7.375PSNR 0.754 0.747 0.564 10.042
offers perceived quality closer to the 8K reference video com-paring to HEVC. For both JapaneseMaple and LayeredKimonoscenes, a bitrate reduction of 50% is reached for the samelevel of visual quality. Indeed, we can observe in Table V that,for those two scenes, each VVC test point of bitrate RV V C
i
is statistically similar in terms of visual quality with respectto its corresponding HEVC test point at bitrate RHEV C
i+1 andsignificantly better at bitrate RHEV C
i . Nevertheless, the resultsobtained with the rest of the 8K sequences with lower spatialtextures do not follow this observation.
Finally, we applied the BD-BR method to the DMOS scores.Inspired by [21], we also compute the upper and lower limitsfor the BD-BR based on the confidence intervals. These scoresare computed by comparing DV V C
max with DHEV Cmin and DV V C
min
with DHEV Cmax , respectively, where [Dmin, Dmax] represents the
95% confidence interval. All the results are reported in Table IV.These results demonstrate that VVC offers a compression gainover HEVC for the same perceived quality from 28.89% to55.59% with an average of 41.11% over the whole 8K dataset.
C. Correlation consistency
In this section, the consistency of objective quality metricswith subjective scores is evaluated. Fig. 7 illustrates scatter plots
with nonlinear logistic fitted curves f(x) and correspondingstandard deviations intervals f(x) ± 2σ for PSNR, MS-SSIM, and VMAF quality metrics versus DMOS scores. Theinterpolated curves f(x) are computed using the followinglogistic model:
f(x) = β2 +β1 − β2
1 + e− x−β3|β4|
. (6)
The more the standard deviation intervals are close tothe logistic fitted curve, the more the metric is correlatedto the DMOS score. In order to quantify the correlation ofthe objective metrics with the subjective scores, we use theSpearman’s rank ordered correlation (SROCC), Pearson’s linearcorrelation coefficient (PLCC), Kendall’s rank-order correlationcoefficient (KROCC), and root mean-squared error (RMSE).The results are reported in Table VI. As expected, it showsthat MS-SSIM and VMAF are more correlated to subjectivetest ratings than PSNR, which gets the lowest performanceregarding all indicators. In addition to the three consideredobjective quality metrics, we provide correlation scores with theSSIM metric. This latter shows slightly higher correlation withDMOS compared to PSNR, while it is outperformed by bothMS-SSIM and VMAF. Finally, we can notice that VMAF is arelevant quality metric for 8K resolution evaluation althoughbeing optimized for 4K resolution.
V. CONCLUSION
In this paper, we evaluated the VVC compression perfor-mance over its predecessor HEVC for 8K video resolution.The subjective and objective quality assessments have beenconducted on a selection of 8K video sequences in RAconfiguration. Objective results have demonstrated that theVTM-11 codec enables 31%, 26% and 35% of bitrate saving
IEEE TRANSACTIONS ON BROADCASTING - ACCEPTED VERSION 8
25 30 35 40 45psnr_y [dB]
30
40
50
60
70
80
90
100
110
DMOS
1 = 135.79, 2 = 41584.66, 3 = 99.69, 4 = 20.57f(x)f(x) ± 2
(a) PSNR
0.90 0.92 0.94 0.96 0.98 1.00ms_ssim
30
40
50
60
70
80
90
100
110
DMOS
1 = 316145.66, 2 = 32.03, 3 = 1.5, 4 = 0.06f(x)f(x) ± 2
(b) MS-SSIM
30 40 50 60 70 80 90 100 110vmaf
30
40
50
60
70
80
90
100
110
DMOS
1 = 164.66, 2 = 34309.47, 3 = 544.33, 4 = 103.13f(x)f(x) ± 2
(c) VMAFFig. 7: Scatter plots and nonlinear logistic fitted curves of PSNR, MS-SSIM and VMAF quality metrics versus DMOS scoresof the considered 8K video sequences. The logistic model coefficients are given for each tested objective metric.
over the HM-16.20 codec, for PSNR, MS-SSIM and VMAFquality metrics, respectively. On the subjective side, VVC offers41.11% of bitrate reduction over HEVC for the same visualquality, regarding the BD-BR method. Regarding the Student’st-test results, a bitrate reduction of about 50% is reached fortwo of the overall tested scenes. We have also demonstrated thatthe bitrate required to obtain transparency with the 8K sourceis highly content-dependent. Indeed, for VVC, a bitrate from11Mbps to 180Mbps is needed, depending on the complexityof the scene. In addition, we demonstrated that the participantshad noted a difference between uncompressed 4K and 8Kfor most of the tested sequences. However, sequences withhigh motion do not benefit from the 8K definition at 60fps.Finally, a higher correlation consistency between subjectiveand objective results can be noticed, particularly for the VMAFand MS-SSIM quality metrics.
Future works will focus on evaluating the subjective qualityoffered by recent deep-learning-based tools for 8K videocompression, such as super-resolution, quality enhancement,and learning-based compression methods.
REFERENCES
[1] ITU-R, “Recommendation BT.2020-1: Parameters Values of Ultra-High Definition Television Systems for Production and InternationalProgramme Exchange.”
[2] ——, “Recommendation BT.709-5: Parameters Values for the HDTVStandards for Production and International Programme Exchange.”
[3] M. Nilsson, “Ultra high definition video formats and standardisation,”BT Media and Broadcast Research Paper, 2015.
[4] M. Sugawara and K. Masaoka, “Uhdtv image format for better visualexperience,” Proceedings of the IEEE, vol. 101, no. 1, pp. 8–17, 2012.
[5] G. J. Sullivan, J.-R. Ohm, W.-J. Han, and T. Wiegand, “Overview ofthe high efficiency video coding (hevc) standard,” IEEE Transactions oncircuits and systems for video technology, vol. 22, no. 12, pp. 1649–1668,2012.
[6] B. Bross, J. Chen, J.-R. Ohm, G. J. Sullivan, and Y.-K. Wang,“Developments in international video coding standardization after avc,with an overview of versatile video coding (vvc),” Proceedings of theIEEE, pp. 1–31, 2021.
[7] W. Hamidouche, T. Biatek, M. Abdoli, E. Francois, F. Pescador,M. Radosavljevic, D. Menard, and M. Raulet, “Versatile video codingstandard: A review from coding tools to consumers deployment,” 2021.
[8] Y. Sugito, S. Iwasaki, K. Chida, K. Iguchi, K. Kanda, X. Lei, H. Miyoshi,and K. Kazui, “Video bit-rate requirements for 8k 120-hz hevc/h. 265temporal scalable coding: experimental study based on 8k subjectiveevaluations,” APSIPA Transactions on Signal and Information Processing,vol. 9, 2020.
[9] A. Ichigaya and Y. Nishida, “Required bit rates analysis for a new broad-casting service using hevc/h. 265,” IEEE Transactions on Broadcasting,vol. 62, no. 2, pp. 417–425, 2016.
[10] S. Iwasaki, X. Lei, K. Chida, Y. Sugito, K. Iguchi, K. Kanda, H. Miyoshi,and Y. Uehara, “The required video bitrate for 8k120-hz real-timetemporal scalable coding,” in 2020 IEEE International Conference onConsumer Electronics (ICCE). IEEE, 2020, pp. 1–5.
[11] Y. Sugito, K. Iguchi, A. Ichigaya, K. Chida, S. Sakaida, H. Sakate,Y. Matsuda, Y. Kawahata, and N. Motoyama, “Hevc/h. 265 codec systemand transmission experiments aimed at 8k broadcasting,” 2015.
[12] Y. Sugito, S. Iwasaki, K. Chida, K. Iguchi, K. Kanda, X. Lei, H. Miyoshi,and K. Kazui, “A study on the required video bit-rate for 8k 120-hz hevc/h.265 temporal scalable coding,” in 2018 Picture Coding Symposium (PCS).IEEE, 2018, pp. 106–110.
[13] ESTI, “Digital Video Broadcasting (DVB); Second generation framingstructure, channel coding and modulation systems for Broadcasting,Interactive Services, News Gathering and other broadband satelliteapplications; Part 2: DVB-S2 Extensions (DVB-S2X).”
[14] ——, “Digital Video Broadcasting (DVB); Implementation guidelinesfor a second generation digital terrestrial television broadcasting system(DVB-T2).”
[15] ITU-R, “Recommendation BT.500-14: Methodologies for the SubjectiveAssessment of the Quality of Television Images.”
[16] C. Bonnineau, W. Hamidouche, J.-F. Travers, and O. Deforges, “Versatilevideo coding and super-resolution for efficient delivery of 8k video with4k backward-compatibility,” in ICASSP 2020-2020 IEEE InternationalConference on Acoustics, Speech and Signal Processing (ICASSP). IEEE,2020, pp. 2048–2052.
[17] C. Bonnineau, J.-Y. Aubie, W. Hamidouche, O. Deforges, J. Travers, andN. Sidaty, “An objective evaluation of codecs and post- processing toolsfor 8k video compression,” 2020.
[18] A. A. Zhi Li, “Toward a Practical Perceptual Video Quality Metric,” inNetflix TechBlog, June 2016.
[19] ITU-R, “Recommendation BT.500-13: Methodologies for the SubjectiveAssessment of the Quality of Television Images.”
[20] R. Sotelo, J. Joskowicz, M. Anedda, M. Murroni, and D. D. Giusto,“Subjective video quality assessments for 4k uhdtv,” in 2017 IEEE Inter-national Symposium on Broadband Multimedia Systems and Broadcasting(BMSB). IEEE, 2017, pp. 1–6.
[21] T. K. Tan, R. Weerakkody, M. Mrak, N. Ramzan, V. Baroncini, J.-R.Ohm, and G. J. Sullivan, “Video quality evaluation methodology andverification testing of hevc compression performance,” IEEE Transactionson Circuits and Systems for Video Technology, vol. 26, no. 1, pp. 76–90,2015.
[22] A. Tabatabai, T. Suzuki, P. Hanhart, P. Korshunov, T. Ebrahimi,M. Horowitz, F. Kossentini, and H. Tmar, “Compression performanceanalysis in hevc,” in High Efficiency Video Coding (HEVC). Springer,2014, pp. 275–302.
[23] N. Sidaty, W. Hamidouche, O. Deforges, P. Philippe, and J. Fournier,“Compression performance of the versatile video coding: Hd and uhdvisual quality monitoring,” in 2019 Picture Coding Symposium (PCS).IEEE, 2019, pp. 1–5.
[24] F. Zhang, A. V. Katsenou, M. Afonso, G. Dimitrov, and D. R. Bull,“Comparing vvc, hevc and av1 using objective and subjective assessments,”arXiv preprint arXiv:2003.10282, 2020.
[25] S.-H. Bae, J. Kim, M. Kim, S. Cho, and J. S. Choi, “Assessments ofsubjective video quality on hevc-encoded 4k-uhd video for beyond-hdtvbroadcasting services,” IEEE Transactions on Broadcasting, vol. 59,no. 2, pp. 209–222, 2013.

IEEE TRANSACTIONS ON BROADCASTING - ACCEPTED VERSION 9
[26] Y. Shishikui, “Quality-of-experience evaluation of 8k ultra-high-definitiontelevision,” in 2021 IEEE International Conference on Image Processing(ICIP). IEEE, 2021, pp. 1404–1408.
[27] B. Bross, H. Kirchhoffer, C. Bartnik, and M. Palkow, “Document JVET-Q0791: Multiformat berlin test sequences.” 13-17 January 2020.
[28] ITU-R, “Recommendation BT.709: Parameter Values for the HDTVStandards for Production and International Programme Exchange.”
[29] ——, “Recommendation BT.2020: Parameter Values for the Ultra-High Definition Television Systems for Production and InternationalProgramme Exchange.”
[30] C. E. Duchon, “Lanczos filtering in one and two dimensions,” Journalof applied meteorology, vol. 18, no. 8, pp. 1016–1022, 1979.
[31] F. Bossen, J. Boyce, K. Suehring, X. Li, and V. Seregin, “Jvet commontest conditions and software reference configurations for sdr video,”March 2019.
[32] F. Bossen, “Common test conditions and software reference configura-tions,” May 2012.
[33] ITU-R, “Recommendation BT.913: Methods for the Subjective Assess-ment of Video for Quality, Audio and Audiovisual Quality of InternetVideo and Distribution Quality Television in any Environment.”
[34] Z. Wang, E. P. Simoncelli, and A. C. Bovik, “Multiscale structuralsimilarity for image quality assessment,” in The Thrity-Seventh AsilomarConference on Signals, Systems & Computers, 2003, vol. 2. Ieee, 2003.
[35] G. Bjøntegaard, “Document VCEG-M33 ITU-T Q6/16: Calculation ofAverage PSNR Differences Between RD- Curves,” April 2001.
Charles Bonnineau received the M.Sc. degreein Computer Science at the Ecole SuperieureD’Ingenieurs de Rennes (ESIR) from the Universityof Rennes 1, France, in 2018. He is currently a PhDStudent in Signal and Image Processing jointly withthe National Institute of Applied Sciences of Rennes(INSA), the Intitute of Research and Technologyb<>com, and TDF. His principal research interestsinclude image and video processing, learning-basedpost-processing algorithms for video compression,learning based image and video coding and video
quality assessment.
Wassim Hamidouche received Master’s and Ph.D.degrees both in Image Processing from the Universityof Poitiers (France) in 2007 and 2010, respectively.From 2011 to 2013, he was a junior scientist inthe video coding team of Canon Research Center inRennes (France). He was a post-doctoral researcherfrom Apr. 2013 to Aug. 2015 with VAADER team ofIETR where he worked under collaborative projecton HEVC video standardisation. Since Sept. 2015he is an Associate Professor at INSA Rennes and amember of the VAADER team of IETR Lab. He has
joined the Advanced Media Content Lab of b<>com IRT Research Instituteas an academic member in Sept. 2017. His research interests focus on videocoding and multimedia security. He is the author/coauthor of more than onehundred and forty papers at journals and conferences in image processing, twoMPEG standards, three patents, several MPEG contributions, public datasetsand open source software projects.
Jerome Fournier received the Ph.D. in signal andimage processing from the University of Rennes,France, in 1995. He started his career at Philipsin the field of video communications. In 1997, hejoined Orange Labs (formerly France Telecom) andworked on video codecs like MPEG-4 Part 2 andH.264. From 2004 to 2012, Jerome focused on thedeployment of the Orange TV services, HDTV andstereoscopic 3DTV, as well as on innovative 3DTVdepth-based video formats. From 2012 to 2018, hewas mainly involved in the subjective evaluation and
the ITU-R standardization of Ultra HD video formats including HDR andHFR features. Now, he is contributing to b<>com studies on topics like VFR,view synthesis and 8K.
Naty Sidaty received the Engineer and Masterdegrees in Telecommunications and Electronics fromthe National Engineering School of Tunis, Tunisia2010, and Limoges University, France 2011, respec-tively. He received the Ph.D. degree in Signal andImage Processing from the University of Poitiers in2015. From 2016 to 2019 he has been a ResearchEngineer with IETR Lab/INSA Rennes, Rennes,France, where he worked on the the evaluation andquality assessment of the emerging video codingstandards (JEM, VVC). He is currently a Video
Coding Research & Innovation Expert at TDF group, France. He is activelyinvolved in several standardization groups (DVB, MPEG, IUT). His researchinterests include Visual Attention Modeling, Video Quality Assessment, CloudComputing, Audiovisual Services Innovation and New Formats & CodingTools.
Jean-Francois Travers received the M.Sc. degree insignal and image processing from the University ofRennes I, France, in 1986, and the Engineering degreein information technologies and telecommunicationsfrom ENST Bretagne in 1988. From 1989 to 1998,he was a Research Engineer with the CCETT, DABTechnologies. Since 1999, he has been an Expertin Audiovisual and System Architecture with TDFon several projects like: DTT launch and deploy-ment, MPEG4 migration, HD and DAB+ head-ends,national and international innovative collaboration
projects, and DTT UHD platform. Since 1996, he has been involved instandardization at the ETSI and DVB technical modules groups. Since 2014,project manager for TDF on French experimental DTT UHD platform andUHD demos and new services, and main contributor on new architecture ofDAB+ head-end and service deployment.
Olivier Deforges received the Ph.D. degree in imageprocessing, in 1995. In 1996, he joined the Depart-ment of Electronic Engineering, National Instituteof Applied Sciences of Rennes (INSA), Scienticand Technical University. He is currently a Profes-sor with INSA. He is a member of the Instituteof Electronics and Telecommunications of Rennes(IETR), UMR CNRS 6164. He has authored morethan 200 technical papers. His principal researchinterests include image and video lossy and losslesscompression, image understanding, fast prototyping,
and parallel architectures.