Paper send to Synthesis and Reactivity in Inorganic.pdf
18
For Peer Review Only Characterization and transport properties of mixed ferrite system Mn1-xCuxFe2O4 0.0≤ x ≤ 0.7 Journal: Synthesis and Reactivity in Inorganic, Metal-Organic, and Nano-Metal Chemistry Manuscript ID: Draft Manuscript Type: Original Paper Date Submitted by the Author: n/a Complete List of Authors: Azab, Ali; National Research Center, Keywords: ferrite, Electrical URL: http://mc.manuscriptcentral.com/lsrt E-mail: [email protected] Synthesis and Reactivity in Inorganic, Metal-Organic, and Nano-Metal Chemistry
-
Upload
eidelsayed -
Category
Documents
-
view
227 -
download
2
Transcript of Paper send to Synthesis and Reactivity in Inorganic.pdf
For Peer Review O
nly
Characterization and transport properties of mixed ferrite
system Mn1-xCuxFe2O4 0.0≤ x ≤ 0.7
Journal: Synthesis and Reactivity in Inorganic, Metal-Organic, and Nano-Metal
Chemistry
Manuscript ID: Draft
Manuscript Type: Original Paper
Date Submitted by the Author: n/a
Complete List of Authors: Azab, Ali; National Research Center,
Keywords: ferrite, Electrical
URL: http://mc.manuscriptcentral.com/lsrt E-mail: [email protected]
Synthesis and Reactivity in Inorganic, Metal-Organic, and Nano-Metal Chemistry
Mohab
Highlight

For Peer Review O
nly
1
Characterization and transport properties of mixed
ferrite system Mn1-xCuxFe2O4 0.0≤ x ≤ 0.7
M.A. Ahmeda, A. A. Azabb, E.H. El-Khawasc, E. Abd El Bast c
a:Materials Science lab(1), Physics Department, Faculty of Science, Cairo University, Giza, Egypt.
b: Solid State Electronics Laboratory, Solid State Physics Department, Physics Division, National Research Center, Dokki, Cairo, 12311 Egypt. c: Basic Science Department, Higher Technological Institute, tenth of Ramadan City, Egypt.
Abstract:
A series of Cu doped Mn ferrites with the formula Mn1-xCuxFe2O4 (0.0 ≤x ≤ 0.7)
were synthesized by citrate auto combustion method. The structural characterization and
morphology of the samples were examined by X-ray diffraction (XRD), energy
dispersive X-ray analysis (EDX) and scanning electron microscopy (SEM). XRD and
EDX confirmed the formation of single-phase cubic spinel structure. The electrical
conductivity(σ), dielectric constant (ε′) and dielectric loss factor (ε′′) were studied as a
function of temperature at different frequencies ranged from 100 kHz to 5 MHz.
Increasing is observed in the values of σ, ε′ and ε′′ with substitution of copper up to
x=0.3. Above this value, a decrease in σ, ε′ and ε′′ was detected.
Keywords: Nano ferrite, SEM, EDX, conductivity and dielectric
1. Introduction
Mixed metallic oxides especially spinels having the general formula AB2O4 are
very important materials for technological applications. Mixed copper ferrites have high
electrical resistivities and consequently low eddy currents as well as dielectric losses,
They have several applications such as radio frequency coils, transformer cores, rod
antennas and magnetic cores of read-write heads for high speed digital tapes [1, 2, 3]. The
studies of dielectric properties of ferrites offer much valuable information on the behavior
of localized electrical charge carriers. This leads to a good explanation and also an
understanding of the mechanism involved in dielectric behavior of ferrites. It is well
known that the conductivity and the dielectric properties of ferrites are strongly
Page 1 of 17
URL: http://mc.manuscriptcentral.com/lsrt E-mail: [email protected]
Synthesis and Reactivity in Inorganic, Metal-Organic, and Nano-Metal Chemistry
123456789101112131415161718192021222324252627282930313233343536373839404142434445464748495051525354555657585960

For Peer Review O
nly
2
dependent on frequency and temperature [4, 5]. Hence, the study of such properties at
different frequencies, temperatures and chemical compositions provide valuable
information about the kind and amount of additives required to obtain high quality
materials for many applications. The properties of the nanocrystalline materials are
varied from those of corresponding bulk materials, due to their small grain size. Also in
these materials a large percentage of atoms are available at their grain boundaries and
therefore there are more chances for interaction between the grains [6]. In the present
work we aimed to reach the critical concentration of Cu in the compound at which we optimize
the transport properties to be more applicable.
2. Experimental methods
The spinel ferrite of Mn1-xCuxFe2O4; (x= 0.0, 0.1, 0.3, 0.5, 0.7) was prepared by
citrate auto combustion method[6]. An aqueous solution of; Mn(NO3)2.4H2O,
Cu(NO3)2.3H2O and Fe(NO3)3.9H2O from Aldrich were used. Citrate complexes of the
metal ions components were mixed in stoichiometric ratios of metal nitrates and citric
acid with a ratio (1:1) with constant stirring to form the citrate-precursor mixture. The pH
value of the precursor solution was adjusted to about 7 by using a drop of ammonia
solution. The solution again stirred during heating the sample and then transformed into
Xero-gel; the dried gel burns itself to form the powder, after which the powders were
pressed into pellets using uniaxial press of pressure 1.9 x10⁸ Nm-2. X-ray diffraction
(XRD) were carried out at room temperature on a Proker D8 with Cu kα radiation (k =
1.5418 Å) in 2θ ranged 20–80o. Elemental analysis and surface morphology were
analyzed by EDX spectroscopy and scanning electron microscope (SEM: Model JEOL-
JSM6400 F).
The samples were good polished to obtain uniform parallel surfaces. Contacts on
the sample surface were made by silver paste and then cheked for good conduction. The
real part of dielectric constant (ε′) and the ac conductivity (σ) were measured by the two
probe method using LCR meter model Hioki type 3532 (Japan) as a function of the
temperature from 300 to 750K at different frequencies ranging from 100 kHz to 5MHz.
The dc conductivity was measured for the investigated samples in the same range of
temperature as that of ac conductivity. The temperature of the samples was measured
Page 2 of 17
URL: http://mc.manuscriptcentral.com/lsrt E-mail: [email protected]
Synthesis and Reactivity in Inorganic, Metal-Organic, and Nano-Metal Chemistry
123456789101112131415161718192021222324252627282930313233343536373839404142434445464748495051525354555657585960

For Peer Review O
nly
3
using a K-type thermocouple connected to a digit-sense thermometer (USA) with
junction in contact with the sample.
3. Results and discussion
3.1 Structure characterization
Figure (1) illustrates XRD patternes of Mn1-xCuxFe2O4 (0.0 ≤x ≤ 0.7), it reveals
single phase spinel structure. Details of structure analysis as well as microstructure
were reported in our previously published work [7].
Figure (2) shows SEM micrograph of Mn1-xCuxFe2O4 (0.0 ≤x ≤ 0.7). The data
reveals cluster size variation with increasing Cu 2+ content. From a close look to the
micrograph one find that, there is nearly stable values from 0 ≤ x ≤0.3 after which a
peculiar increase was found at x=0.5. This peculiarity does not appear for all clusters,
while the rest of the clusters have nearly the same size. This can be due to rearrange of
iron ions between A and B sites as well as the migration of Mn2+ (after changing Mn3+) to
B site. It was expected that at higher Cu content, the process is reversible. Also Cu2+
plays role after changing valance to Cu1+. The composition of Cu doped Manganes
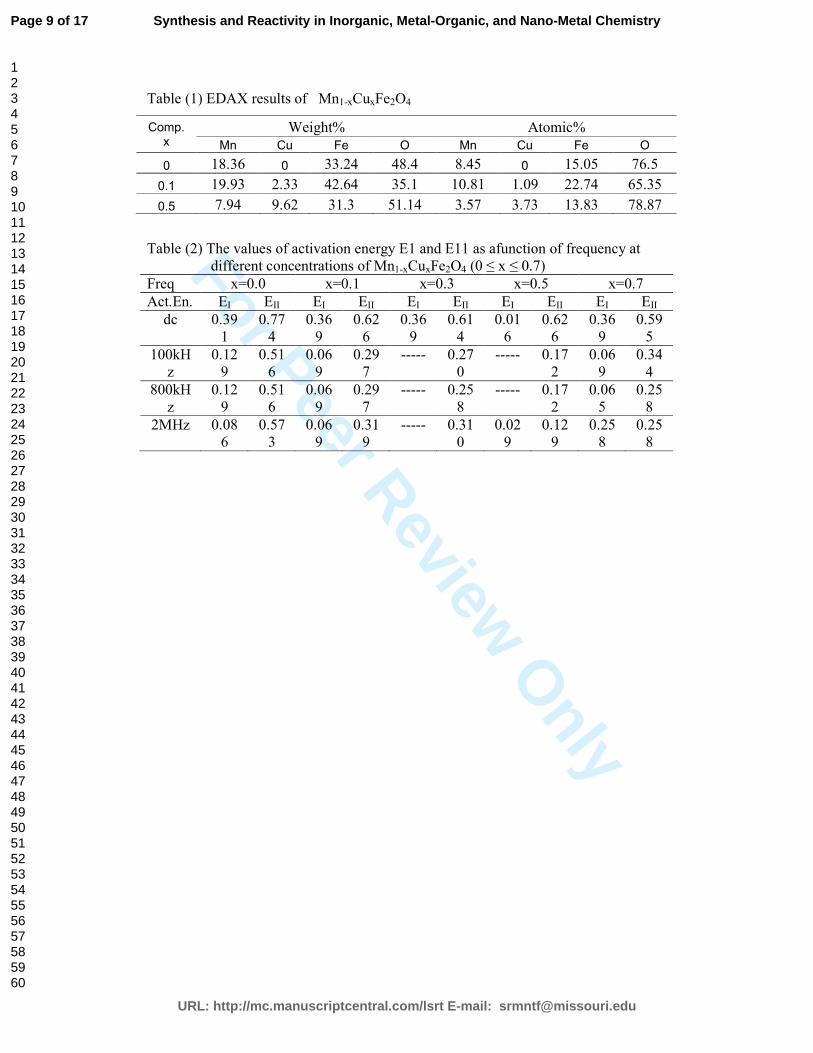
ferrites has been examined using the energy dispersion X-ray analysis (EDX). X-ray
analysis spectra of Mn1-xCuxFe2O4 (x=0, 0.3 and 0.5) samples are shown in Fig.(3). From
the EDX spectrum, the presence of Mn, Cu, Fe and O are confirmed, the appearance of
Pt is due to platinum coating for SEM measurements. The quantitative analysis of EDX
spectrum at table (1) revealed the relative atomic ratio of all elements. These values are
close to the expected for MnFe2O4, Mn0.9Cu0.1Fe2O4 and Mn0.5Cu0.5Fe2O4.
3.2 Electrical properties
Figure (4) shows the dc conductivity of Mn1-xCuxFe2O4 ,(0 ≤ x ≤ 0.7). The
observed increase in dc conductivity with increasing temperature assure semiconducting
like behavior of Mn1-xCuxFe2O4. The increase in electrical conductivity (σdc) with
temperature is ascribed to the increase in the thermally activated mobility of charge
carriers. The activation energy for the thermally activated hopping process was obtained
by fitting the dc conductivity data with the Arrhenius relation [8].
Page 3 of 17
URL: http://mc.manuscriptcentral.com/lsrt E-mail: [email protected]
Synthesis and Reactivity in Inorganic, Metal-Organic, and Nano-Metal Chemistry
123456789101112131415161718192021222324252627282930313233343536373839404142434445464748495051525354555657585960
M Lab
Highlight
M Lab
Highlight
M Lab
Highlight
M Lab
Highlight
M Lab
Text Box
Comment no 2
M Lab
Highlight
M Lab
Highlight
M Lab
Text Box
comment 3
Mohab
Highlight

For Peer Review O
nly
4
σdc (T) = σ0 exp(-ΔE/kBT)
where σ0 is the pre-exponential constant, ∆E is the activation energy for dc
conductivity, T is the absolute temperature and kB is the Boltzmann’s constant. The
activation energy for low temperature region (EI) and high temperate region (EII) are
calculated and listed in table (2). From the reported data it is observed that, the activation
energy EII is higher than EI. This trend is attributed to higher lattice vibrating which
increase the scattering of charge carriers resulting in decreasing conductivity and
increasing EII.
Figure(5) shows ac conductivity of Mn1-xCuxFe2O4(0 ≤ x ≤ 0.7) as a function of
temperature and different frequency. From the reported data it is observed that, the data
reveals that σac increase with both frequency and temperature. The hopping of electron
between Fe2+ and Fe3+ ions on the B sites played role in conduction mechanism in spinel
ferrites [9]. In general, the increase in conductivity with increasing frequency can be
explained on the basis of Maxwell-Wagner theory [10, 11] and Koop’s model [12, 13].
Accordingly the theory of dielectric structure was formed by two conducting layers
separated by ultra thin insulating layer, which forms the grain boundaries. The non-
conducting layer or grain boundary is formed by oxygen ions. These grain boundaries are
more active at lower frequencies, hence the hopping frequency of Fe2+ and Fe3+ ion is less
at lower frequencies. As the applied frequency increases the conductive grains became
more active by promoting the hopping between Fe2+ and Fe3+ cations, thereby increasing
the hopping frequency. Thus, we observe a gradual increase in conductivity with
frequency. The increase in conductivity does not means that the amount of charge carriers
increases, but only the rate of hopping of charge carriers between Fe2+ and Fe3+ ions
increases[14]. As temperature increases the mobility of hopping ions as well as
conductivity.
The dielectric properties can vary widely in ferrites as a function of temperature,
frequency of applied electric field, crystal structure, humidity and other external factors.
The dielectric response of ferrite materials can be described by the dielectric constant as a
complex quantity composed of a real and an imaginary component:
Page 4 of 17
URL: http://mc.manuscriptcentral.com/lsrt E-mail: [email protected]
Synthesis and Reactivity in Inorganic, Metal-Organic, and Nano-Metal Chemistry
123456789101112131415161718192021222324252627282930313233343536373839404142434445464748495051525354555657585960

For Peer Review O
nly
5
ε = ε′ - jε′′
where the first term ε' is the real part of dielectric constant representing the amount of
energy stored in a dielectric material, while the second term ε'' is the imaginary part of
dielectric constant which describes the dissipated energy. Fig.(6) shows the effect of
temperature on dielectric constant (ε') for Mn1-xCuxFe2O4 (0 ≤ x ≤ 0.7) ferrites at different
frequencies. It is clear that ε' increases with temperature to reach maximum value for the
samples x=0.0 ,0.1, 0.3, with the peak value shifted to higher temperature with increasing
frequency. The decrease of dielectric constant with increasing frequency is observed in
the case of copper ferrites and this is a normal behavior of spinel ferrites[15-17]. This
attributed to the Maxwell–Wagner interfacial type of polarization [10, 11], which is in
agreement with Koops phenomenological theory [13]. The decrease in polarization with
increasing of frequency is due to the fact that, beyond a certain frequency of the electric
field, the electronic exchange between Fe2+ and Fe3+ cannot follow the alternating field,
therefore the real part of dielectric constant (ε') decreases with increasing frequency . It
is also noticed from Fig.(6) that the dielectric constant increases with temperature. It is
explained due to thermal activation which enhances the number of dipoles available for
polarization when the sample is at a high temperature.
Figure (7) shows the dielectric loss factor (ε'') of Mn1-xCuxFe2O4 (0 ≤ x ≤ 0.7), ε''
have the same behavior of ε' where ε'' increases with temperature and decreases with
frequency. This is because the dielectric loss arises when the polarization lag behind the
applied alternating field which is caused by the impurities and imperfections in the
crystal. According to the phenomenological Koop’s theory [13], this was explained on
the basis of the fact that, in the low frequency region, where the resistivity is high and the
grain boundary effect is dominant, more energy is required for electron exchange
between Fe2+ and Fe3+ ions, as a result the loss is high. In the high frequency region,
when the resistivity is low and grains themselves have a dominant role, a small energy is
required for electron transfer between the two Fe ions at the octahedral site. The
dielectric loss shows its maximum value (Debye relaxation) at samples x=0, 0.1 and 0.5.
Debye relaxation occurs when hopping frequency of charge carriers becomes
approximately equal to the frequency of an externally applied field [18]. Also at lower
Page 5 of 17
URL: http://mc.manuscriptcentral.com/lsrt E-mail: [email protected]
Synthesis and Reactivity in Inorganic, Metal-Organic, and Nano-Metal Chemistry
123456789101112131415161718192021222324252627282930313233343536373839404142434445464748495051525354555657585960

For Peer Review O
nly
6
frequencies, high dielectric loss may be because of impurities, crystal defects and
moisture.
Figure (8) shows the composition dependence of Mn1-xCuxFe2O4 (0 ≤ x ≤ 0.7) on
the conductivity and dielectric constant values in which they increased up to x=0.3 and
after that they decreased. This is the same behavior of the magnetic properties in the
previous work [7]. The increase of conductivity in ferrite compound is mainly due to the
hopping electron between ions of the same element present at different valence state.
Mn2+ + Fe3+ ↔ Mn3+ + Fe2+
Cu2+ ↔ Cu+ + e+
Also, this may be attributed to the decrease in the lattice parameter with increasing Cu
content [7]. The hopping length L (B–B distance) is affected directly on the conductivity
whenever the length L decreases the conductivity will increase. Another reason for
decreasing the conductivity is the exchange interaction between Mn2+ and Fe3+ at B-site
resulting in decreasing the ratio of Fe3+/Fe2+ .
Conclusion
The X-ray and EDX measurements confirmed synthesis of Mn1-xCuxFe2O4 in
spinel structure by citrate auto combustion method. SEM images showed that the cluster
size increased with increasing Cu2+ up to x=0.5. The ac conductivity, dielectric constant
and dielectric loss factor increase with Cu2+ substitution up to x=0.3 and then decreased.
Page 6 of 17
URL: http://mc.manuscriptcentral.com/lsrt E-mail: [email protected]
Synthesis and Reactivity in Inorganic, Metal-Organic, and Nano-Metal Chemistry
123456789101112131415161718192021222324252627282930313233343536373839404142434445464748495051525354555657585960

For Peer Review O
nly
7
Table (1) EDAX results of Mn1-xCuxFe2O4
Comp. x
Weight% Atomic% Mn Cu Fe O Mn Cu Fe O
0 18.36 0 33.24 48.4 8.45 0 15.05 76.5 0.1 19.93 2.33 42.64 35.1 10.81 1.09 22.74 65.35
0.5 7.94 9.62 31.3 51.14 3.57 3.73 13.83 78.87
Table (2) The values of activation energy E1 and E11 as afunction of frequency at different concentrations of Mn1-xCuxFe2O4 (0 ≤ x ≤ 0.7) Freq x=0.0 x=0.1 x=0.3 x=0.5 x=0.7 Act.En. EI EII EI EII EI EII EI EII EI EII
dc 0.391 0.774 0.369 0.626 0.369 0.614 0.016 0.626 0.369 0.595 100kHz 0.129 0.516 0.069 0.297 ----- 0.270 ----- 0.172 0.069 0.344 800kHz 0.129 0.516 0.069 0.297 ----- 0.258 ----- 0.172 0.065 0.258 2MHz 0.086 0.573 0.069 0.319 ----- 0.310 0.029 0.129 0.258 0.258
Page 7 of 17
URL: http://mc.manuscriptcentral.com/lsrt E-mail: [email protected]
Synthesis and Reactivity in Inorganic, Metal-Organic, and Nano-Metal Chemistry
123456789101112131415161718192021222324252627282930313233343536373839404142434445464748495051525354555657585960

For Peer Review O
nly
8
References:
[1] Raghavender, A.T.; Shirsath, Sagar E.; Vijaya Kumar, K. J. Alloys Compd. 2011,
509, 7004.
[2] Jnaneshwara, D.M.; Avadhani, D.N.; Daruka Prasad B.; Nagabhushana, B.M.;
Nagabhushana, H.; Sharma, S.C.; Prashantha,S.C.; Shivakumara, C. J. Alloys Compd.
2014, 587, 50.
[3] Panda, R.K.; Behera, D. J. Alloys Compd. 2014, 587, 481.
[4] Ahmed, M. A.; Okasha, N.; J. Magn. Magn. Mater. 2014, 321, 3436.
[5] Ahmed, M.A.; Ateia, E.; Salah, L.M.; El-Gamal, A.A. Mater. Chem. Phys. 2005, 92,
310.
[6] N.M. Deraz, M.M. Hessien, J. Alloys Compd. 475 (2009) 832.
[7] Azab, A.; El-Khawas, E.H. Journal of Applied Sciences Research. 2013, 9(3) 1683.
[8] Savic, S. M.; Nikolic, M. V.; Aleksic, O. S.; Slankamenac, M. P.; Zivanov, M. B.;
Nikolic, P. M. Sci. Sinter. 2008, 40, 27.
[9] Younas, M.; Nadeem M.; Atif M.; Grossinger R. J. Appl. Phys. 2011, 109, 93704.
[10] Electricity and Magnetism; Maxwell, J. C. Oxford University Press, New York
1973; p 88.
[11] Wagner, K. W. Archive fur Elektrotechnik 2. 1914, 371.
[12] Muthu, K. S.; Lakshminarasimhan, N. Ceram. Int. 2013, 39, 2309.
[13] Koops, C. G. Phys. Rev. 1951, 83, 121.
[14] Hashim Alimuddin, M.; Shirsath, Sagar E.; Shalendra Kumar; Ravi Kumar,
Shirsath, Aashis S.; Jyoti Shah, Kotnala, R.K. J. Alloys Comp. 2013, 549, 348.
[15] Ahmed, M.A.; Ateia, E.; Salah, L.M.; El-Gamal, A.A. Materials Chemistry and
Physics. 2005, 92, 310.
[16] Ahmed, M.A.; Okasha, N. J. Magn. Magn. Mater. 2009, 321, 3436.
[17] Ahmed, M.A.; Mansour, S.F; Afifi, M. J. Magn. Magn. Mater. 2012, 324, 4.
[18] Cvejic Z.; Rakic, S.; Jankov, S.; Skuban, S.; Kapor, A.; J. Alloys Comp. 2009, 480,
241.
Page 8 of 17
URL: http://mc.manuscriptcentral.com/lsrt E-mail: [email protected]
Synthesis and Reactivity in Inorganic, Metal-Organic, and Nano-Metal Chemistry
123456789101112131415161718192021222324252627282930313233343536373839404142434445464748495051525354555657585960
For Peer Review O
nly
Table (1) EDAX results of Mn1-xCuxFe2O4
Comp. x
Weight% Atomic%
Mn Cu Fe O Mn Cu Fe O
0 18.36 0 33.24 48.4 8.45 0 15.05 76.5
0.1 19.93 2.33 42.64 35.1 10.81 1.09 22.74 65.35
0.5 7.94 9.62 31.3 51.14 3.57 3.73 13.83 78.87
Table (2) The values of activation energy E1 and E11 as afunction of frequency at
different concentrations of Mn1-xCuxFe2O4 (0 ≤ x ≤ 0.7)
Freq x=0.0 x=0.1 x=0.3 x=0.5 x=0.7
Act.En. EI EII EI EII EI EII EI EII EI EII
dc 0.39
1
0.77
4
0.36
9
0.62
6
0.36
9
0.61
4
0.01
6
0.62
6
0.36
9
0.59
5
100kH
z
0.12
9
0.51
6
0.06
9
0.29
7
----- 0.27
0
----- 0.17
2
0.06
9
0.34
4
800kH
z
0.12
9
0.51
6
0.06
9
0.29
7
----- 0.25
8
----- 0.17
2
0.06
5
0.25
8
2MHz 0.08
6
0.57
3
0.06
9
0.31
9
----- 0.31
0
0.02
9
0.12
9
0.25
8
0.25
8
Page 9 of 17
URL: http://mc.manuscriptcentral.com/lsrt E-mail: [email protected]
Synthesis and Reactivity in Inorganic, Metal-Organic, and Nano-Metal Chemistry
123456789101112131415161718192021222324252627282930313233343536373839404142434445464748495051525354555657585960

For Peer Review O
nly
Fig.(1):a)X-ray diffraction pattern of the Mn1-xCuxFe2O4 compound 0.0≤ x ≤0.7.
Page 10 of 17
URL: http://mc.manuscriptcentral.com/lsrt E-mail: [email protected]
Synthesis and Reactivity in Inorganic, Metal-Organic, and Nano-Metal Chemistry
123456789101112131415161718192021222324252627282930313233343536373839404142434445464748495051525354555657585960
Mohab
Highlight

For Peer Review O
nly
Fig. (2): SEM micrograph of the Mn1-xCuxFe2O4 compound 0.0≤ x ≤0.7.
Page 11 of 17
URL: http://mc.manuscriptcentral.com/lsrt E-mail: [email protected]
Synthesis and Reactivity in Inorganic, Metal-Organic, and Nano-Metal Chemistry
123456789101112131415161718192021222324252627282930313233343536373839404142434445464748495051525354555657585960

For Peer Review O
nly
Fig. (3): EDX spectrum of the Mn1-xCuxFe2O4 compound at x= 0.0, 0.1, 0.5.
Page 12 of 17
URL: http://mc.manuscriptcentral.com/lsrt E-mail: [email protected]
Synthesis and Reactivity in Inorganic, Metal-Organic, and Nano-Metal Chemistry
123456789101112131415161718192021222324252627282930313233343536373839404142434445464748495051525354555657585960

For Peer Review O
nly
Fig. (4): The dependence of dc conductivity on the reciprocal
temperature ofMn1-xCuxFe2O4 compound.
Page 13 of 17
URL: http://mc.manuscriptcentral.com/lsrt E-mail: [email protected]
Synthesis and Reactivity in Inorganic, Metal-Organic, and Nano-Metal Chemistry
123456789101112131415161718192021222324252627282930313233343536373839404142434445464748495051525354555657585960

For Peer Review O
nly
Fig(5): Variation of ac conductivity with the reciprocal of absolute temperature as
a function of frequency of Mn1-xCuxFe2O4 compound 0.0≤ x ≤0.7.
Page 14 of 17
URL: http://mc.manuscriptcentral.com/lsrt E-mail: [email protected]
Synthesis and Reactivity in Inorganic, Metal-Organic, and Nano-Metal Chemistry
123456789101112131415161718192021222324252627282930313233343536373839404142434445464748495051525354555657585960

For Peer Review O
nly Fig(6): Variation of dielectric constant ε
’ with the absolute temperature as a
a function of frequency of Mn1-xCuxFe2O4 compound 0.0≤ x ≤0.7.
Page 15 of 17
URL: http://mc.manuscriptcentral.com/lsrt E-mail: [email protected]
Synthesis and Reactivity in Inorganic, Metal-Organic, and Nano-Metal Chemistry
123456789101112131415161718192021222324252627282930313233343536373839404142434445464748495051525354555657585960

For Peer Review O
nly
Fig(7): Variation of dielectric loss factor ε” with the absolute temperature as a
function of frequency of Mn1-xCuxFe2O4 compound 0.0≤ x ≤0.7.
Page 16 of 17
URL: http://mc.manuscriptcentral.com/lsrt E-mail: [email protected]
Synthesis and Reactivity in Inorganic, Metal-Organic, and Nano-Metal Chemistry
123456789101112131415161718192021222324252627282930313233343536373839404142434445464748495051525354555657585960

For Peer Review O
nly
Fig.(8a-c) :(a) Variation of dc conductivity with Cu
2+ content.
(b,c) Variation of ac conductivity and dielectric constant with
Cu2+
content at two absolute temperatures 323K, 373K
And frequency 100 kHz of Mn1-xCuxFe2O4 compound 0.0≤ x ≤0.7.
Page 17 of 17
URL: http://mc.manuscriptcentral.com/lsrt E-mail: [email protected]
Synthesis and Reactivity in Inorganic, Metal-Organic, and Nano-Metal Chemistry
123456789101112131415161718192021222324252627282930313233343536373839404142434445464748495051525354555657585960