Paper 4: Hydro-Hydraulic Model - JICA
116
VOLUME II PAPER IV DEVELOPMENT OF HYDRO-HYDRAULIC MODEL FOR THE CAMBODIAN FLOODPLAINS FINAL REPORT MARCH 2004 WUP-JICA TEAM
Transcript of Paper 4: Hydro-Hydraulic Model - JICA

VOLUME II
PAPER IV
DEVELOPMENT OF HYDRO-HYDRAULIC MODEL FOR THE CAMBODIAN
FLOODPLAINS
FINAL REPORT
MARCH 2004
WUP-JICA TEAM

Vol. II: Supporting Report, Paper IV: Development of Hydro-Hydraulic Model for the Cambodian Floodplains; WUP-JICA, March 2004
TABLE OF CONTENTS
1. BACKGROUND .............................................................................................. IV-1
2. PROCESS OF MODEL DEVELOPMENT .................................................. IV-1
2.1 Chaktomouk Project Model ................................................................... IV-1
2.2 WUP-JICA Model ................................................................................... IV-2
2.3 Relationship with Tonle Sap Lake and Vicinities Project Model............ IV-2
3. WUP-JICA MODEL COMPONENTS.......................................................... IV-4
3.1 Rainfall-Runoff Model ............................................................................ IV-4
3.1.1 Model Concept........................................................................... IV-4
3.1.2 Sub-catchment Description and Delineation ............................. IV-5
3.1.3 Rainfall and Evaporation ........................................................... IV-5
3.1.4 Analysis of Runoff in the Tonle Sap Basin ............................... IV-7
3.1.5 Calibration and Verification of the Rainfall-Runoff Model ...... IV-14
3.1.6 Computation of Runoff Input for River Model.......................... IV-22
3.2 Hydraulic River and Floodplain Model................................................... IV-22
3.2.1 Model Concept........................................................................... IV-22
3.2.2 Topographical and Structural Data ............................................ IV-23
3.2.3 Hydraulic Data........................................................................... IV-27
3.2.4 Water Use Data.......................................................................... IV-27
3.2.5 Other Data.................................................................................. IV-28
3.2.6 Model Area and Schematisation ................................................ IV-28
3.2.7 Calibration and Verification of the River Model....................... IV-32
4. CONCLUSION ................................................................................................ IV-36
REFERENCES ............................................................................................................. IV-37
IV - i

Vol. II: Supporting Report, Paper IV: Development of Hydro-Hydraulic Model for the Cambodian Floodplains; WUP-JICA, March 2004
LIST OF TABLES
Table 3.1 Sub-catchments in the Cambodian Part of Mekong Basin for Rainfall-Runoff Modelling................................................................ IV-5
Table 3.2 Rainfall Stations used for the Rainfall-Runoff Modelling ................ IV-6 Table 3.3 Monthly Averaged Daily Evaporation Rates (mm/day) used
for the Rainfall-Runoff Modelling .................................................... IV-7 Table 3.4 Sub-catchments in the Tonle Sap Lake Basin ................................. IV-8 Table 3.5 Rainfall Stations used to Derive Mean Area Rainfall for Each
Catchment ......................................................................................... IV-16 Table 3.6 Sources of Topographical Data Applied for Various Parts of
the Model .......................................................................................... IV-24 Table 3.7 Relation between Elevation (Hatien MSL) and Surface Area
and Volume of Tonle SapLake.......................................................... IV-25 Table 3.8 Key Data on Important Bridges in the Study Area ........................... IV-26 Table 3.9 Stations with Data in the Period 1998-2002...................................... IV-27 Table 3.10 Estimated Water Abstraction for Irrigation (m3/s) ............................ IV-28 Table 3.11 Number of Branches and Cross Sections in the MIKE 11
Model Set-up..................................................................................... IV-30
LIST OF FIGURES Fig. 2.1 One-dimensional Model area of the Chaktomouk Project Overlaid
with Branches and Cross Sections of Flood Plains .......................... IV-38 Fig. 2.2 Summary of ADCP Survey Results during the Chaktomouk Project,
year 2000 ......................................................................................... IV-38 Fig. 3.1 Schematic Overview of the NAM Model.......................................... IV-39 Fig. 3.2 Sub-catchments and Tributaries in Cambodia considered in the
Rainfall Runoff Modelling .............................................................. IV-40 Fig. 3.3 Available Rainfall Stations in 1998 .................................................. IV-41 Fig. 3.4 Available Rainfall Stations in 1999 .................................................. IV-41 Fig. 3.5 Available Rainfall Stations in 2000 .................................................. IV-42 Fig. 3.6 Available Rainfall Stations in 2001 .................................................. IV-42 Fig. 3.7 Variation of Monthly Averaged Daily Evaporation using data
from 1962 : Phnom Penh, Kompong Cham, Siem Reap, Battambang and Krakor stations and in2000,2001,2002 of MRCS at Phnom Penh ..................................................................... IV-43
Fig. 3.8 Gauge Height versus Square Root of Discharge for Determination of Rating Curve: Stung Chinit at Kompong Thmar ......................... IV-44
Fig. 3.9 Derived Rating Curve with data: Stung Chinit at Kompong Thmar . IV-44 Fig. 3.10 Observed Gauge Height at Kompong Thmar .................................. IV-45 Fig. 3.11 Rated and Observed Discharge at Kompong Thmar ........................ IV-45 Fig. 3.12 Gauge Height versus Square Root of Discharge for Determination
of Rating Curve: Stung Sen at Kompong Thom ............................. IV-46
IV - ii

Vol. II: Supporting Report, Paper IV: Development of Hydro-Hydraulic Model for the Cambodian Floodplains; WUP-JICA, March 2004
Fig. 3.13 Derived Rating Curve with data: Stung Chinit at Kompong Thom.. IV-46 Fig. 3.14 Observed Gauge Height at Kompong Thom and Panha Chi ........... IV-47 Fig. 3.15 Rated and Observed Discharge at Kompong Thom ......................... IV-47 Fig. 3.16 Gauge Height versus Square Root of Discharge for Determination
of Rating Curve: Stung Staung at Kompong Chen .......................... IV-48 Fig. 3.17 Derived Rating curve with data: Stung Staung at Kompong Chen .. IV-48 Fig. 3.18 Observed Gauge Height at Kompong Chen .................................... IV-49 Fig. 3.19 Rated and Observed Discharges in Stung Staung at Kompong Chen IV-49 Fig. 3.20 Gauge Height versus Square Root of Discharge for Stung Chikreng
at Kompong Kdey ............................................................................. IV-50 Fig. 3.21 Derived Rating Curve with data: Stung Chikreng at Kompong Kdey IV-50 Fig. 3.22 Observed Gauge Height at Kompong Kdey...................................... IV-51 Fig. 3.23 Rated and Observed Discharge at Kompong Kdey........................... IV-51 Fig. 3.24 Gauge Height versus Square Root of Discharge: Stung Seam Reap
at Untac Bridge ................................................................................. IV-52 Fig. 3.25 Derived Rating Curve with data: Stung Seam Reap at Untac Bridge IV-52 Fig. 3.26 Observed Gauge Height at Untac Bridge on Stung Seam Reap. ...... IV-53 Fig. 3.27 Rated and Observed Discharges at Untac Bridge
on Stung Seam Reap ......................................................................... IV-53 Fig. 3.28 Gauge Height versus Square Root of the Discharge divided by
Square Root of the Fall: Stung Sreng at Kralanh.............................. IV-54 Fig. 3.29 Derived Rating Curve with data: Stung Sreng at Kralanh ................ IV-54 Fig. 3.30 Observed Gauge Height at Kralanh and at Bac Prea ........................ IV-55 Fig. 3.31 Observed and Rated Discharges at Kralanh on Stung Sreng ............ IV-55 Fig. 3.32 Gauge Height versus Square Root of Discharge divided by Square
Root of the Fall for determination of Discharge Rating Curve for Stung Sisophon ................................................................................. IV-56
Fig. 3.33 Derived Rating Curve with data: Stung Sisophon at Sisophon......... IV-56 Fig. 3.34 Observed Gauge Height at Sisophon and Bac Prea .......................... IV-57 Fig. 3.35 Rated and Observed Discharge at Sisophon ..................................... IV-57 Fig. 3.36 Gauge Height versus Square Root of Discharge divided by Square
Root of Fall between Mongkol Borey and Bac Prea......................... IV-58 Fig. 3.37 Derived Rating Curve with data: Stung Mongkol Borey at
Mongkol Borey ................................................................................. IV-58 Fig. 3.38 Observed Gauge Height at Mongkol Borey and Bac Prea................ IV-59 Fig. 3.39 Rated and Observed Discharge at Mongkol Borey........................... IV-59 Fig. 3.40 Determination of Rating Curve for Stung Sangker at Battambang... IV-60 Fig. 3.41 Derived Rating Curve together with data: Stung Sangker at
Battambang ....................................................................................... IV-60 Fig. 3.42 Observed Gauge Height at Battambang and Bac Prea...................... IV-61 Fig. 3.43 Rated and Observed Discharge at Battambang................................. IV-61 Fig. 3.44 Determination of Rating Curve for Stung Dauntry at Maung
using data from year 2001................................................................. IV-62 Fig. 3.45 Derived Rating Curve with data: Stung Dauntri at Maung............... IV-62
IV - iii

Vol. II: Supporting Report, Paper IV: Development of Hydro-Hydraulic Model for the Cambodian Floodplains; WUP-JICA, March 2004
Fig. 3.46 Observed Discharge Data at Stung Dauntri ...................................... IV-63 Fig. 3.47 Determination of Rating Curve at Stung Pursat at Bak Trakoun ...... IV-64 Fig. 3.48 Derived Rating Curve with data: Stung Pursat at Bak Trakoun........ IV-64 Fig. 3.49 Observed Gauge Height at Bak Trakoun on Stung Pursat ................ IV-65 Fig. 3.50 Rated and Observed Discharges at Bak Trakoun at Stung Pursat..... IV-65 Fig. 3.51 Determination of Rating Curve for Stung Boribo at Boribo ............. IV-66 Fig. 3.52 Derived Rating Curve with data: Stung Baribo at Baribo................. IV-66 Fig. 3.53 Observed Gauge Height at Stung Boribo .......................................... IV-67 Fig. 3.54 Rated and Observed Discharges at Boribo........................................ IV-67 Fig. 3.55 Observed Mean Area Rainfall (daily basis)
for Stung Chinit Sub-cathment.......................................................... IV-68 Fig. 3.56 Observed Mean Area Rainfall (daily basis)
for Stung Sen Sub-cathment.............................................................. IV-68 Fig. 3.57 Observed Mean Area Rainfall (daily basis)
for Stung Staung Sub-cathment......................................................... IV-68 Fig. 3.58 Observed Mean Area Rainfall (daily basis)
for Stung Chikreng Sub-cathment..................................................... IV-69 Fig. 3.59 Observed Mean Area Rainfall (daily basis)
for Stung Seam Reap Sub-cathment.................................................. IV-69 Fig. 3.60 Observed Mean Area Rainfall (daily basis)
for Stung Sreng Sub-cathment .......................................................... IV-69 Fig. 3.61 Observed Mean Area Rainfall (daily basis)
for Stung Sisophon Sub-cathment..................................................... IV-70 Fig. 3.62 Observed Mean Area Rainfall (daily basis)
for Stung Mongkol Borey Sub-cathment .......................................... IV-70 Fig. 3.63 Observed Mean Area Rainfall (daily basis)
for Stung Sangker Sub-cathment....................................................... IV-70 Fig. 3.64 Observed Mean Area Rainfall (daily basis)
for Stung Dauntri Sub-cathment ....................................................... IV-71 Fig. 3.65 Observed Mean Area Rainfall (daily basis)
for Stung Pursat Sub-cathment.......................................................... IV-71 Fig. 3.66 Observed Mean Area Rainfall (daily basis)
for Stung Boribo Sub-cathment......................................................... IV-71 Fig. 3.67 Observed Mean Area Rainfall (daily basis)
for Prek Thnoat Sub-cathment .......................................................... IV-72 Fig. 3.68 Observed Mean Area Rainfall (daily basis)
for Prek Chhlong Sub-cathment ........................................................ IV-72 Fig. 3.69 Observed Mean Area Rainfall (daily basis)
for Siem Bok Sub-cathment .............................................................. IV-72 Fig. 3.70 Observed Mean Area Rainfall (daily basis)
for Delta Sub-cathment ..................................................................... IV-73 Fig. 3.71 Observed Mean Area Rainfall (daily basis) for the Great Lake........ IV-73 Fig. 3.72 Observed, Rated and Simulated Discharges for Stung Chinit........... IV-74 Fig. 3.73 Accumulated Observed and Simulated Discharge for Stung Chinit . IV-74 Fig. 3.74 Observed, Rated and Simulated Discharges for Stung Sen............... IV-75
IV - iv

Vol. II: Supporting Report, Paper IV: Development of Hydro-Hydraulic Model for the Cambodian Floodplains; WUP-JICA, March 2004
Fig. 3.75 Observed and Simulated Discharges for Stung Staung..................... IV-75 Fig. 3.76 Observed and Simulated Discharges for Stung Chikreng................. IV-76 Fig. 3.77 Observed and Simulated Discharges for Stung Seam Reap.............. IV-76 Fig. 3.78 Observed, Rated and Simulated Discharges for Stung Sreng ........... IV-77 Fig. 3.79 Observed and Simulated Discharges for Stung Sisophon................. IV-77 Fig. 3.80 Observed, Rated and Simulated Discharge
for Stung Mongkol Borey ................................................................. IV-78 Fig. 3.81 Observed and Simulated Discharge for Stung Sangker .................... IV-78 Fig. 3.82 Observed and Simulated Discharge at Stung Dauntri....................... IV-79 Fig. 3.83 Observed, Rated and Simulated Discharge at Stung Pursat.............. IV-79 Fig. 3.84 Observed and Rated Discharge together with Simulation Results
at Stung Boribo using Stung Chinit parameters ................................ IV-80 Fig. 3.85 Observed, Rated and Simulated Discharge at Stung Boribo............. IV-80 Fig. 3.86 Computed Runoff from Stung Chinit 1998-2002 ............................. IV-81 Fig. 3.87 Computed Runoff from Stung Sen 1998-2002 ................................. IV-81 Fig. 3.88 Computed Runoff from Stung Staung 1998-2002 ............................ IV-81 Fig. 3.89 Computed Runoff from Stung Chikreng 1998-2002 ........................ IV-82 Fig. 3.90 Computed Runoff from Stung Seam Reap 1998-2002 ..................... IV-82 Fig. 3.91 Computed Runoff from Stung Sreng 1998-2002 .............................. IV-82 Fig. 3.92 Computed Runoff from Stung Sisophon 1998-2002 ........................ IV-83 Fig. 3.93 Computed Runoff from Stung Mongkol Borey 1998-2002.............. IV-83 Fig. 3.94 Computed Runoff from Stung Sangker 1998-2002 .......................... IV-83 Fig. 3.95 Computed Runoff from Stung Dauntri 1998-2002 ........................... IV-84 Fig. 3.96 Computed Runoff from Stung Pursat 1998-2002 ............................. IV-84 Fig. 3.97 Computed Runoff from Stung Boribo 1998-2002 ............................ IV-84 Fig. 3.98 Computed Runoff from Prek Thnoat 1998-2002 .............................. IV-85 Fig. 3.99 Computed Runoff from Prek Chhlong 1998-2002............................ IV-85 Fig. 3.100 Computed Runoff from Siem Bok Catchment 1998-2002................ IV-85 Fig. 3.101 Computed Runoff from Delta Catchment 1998-2002....................... IV-86 Fig. 3.102 Computed Direct Precipitation on the Great Lake 1998-2002.......... IV-86 Fig. 3.103 Simulated total Runoff from Great Lake Tributaries for the years
1998-2002 showing Daily, Weekly Averaged and Monthly values . IV-86 Fig. 3.104 Cross sectional arrangement of the Tonle Sap Lake Overlaid on
the Data Sources from CHO (1999) and Philippine Map (1963)...... IV-87 Fig. 3.105 Level-Area and Level-Volume relation for the Great Lake.............. IV-87 Fig. 3.106 Various Topographical Data Sources available
for Model Construction..................................................................... IV-88 Fig. 3.107a Individual Bridges Incorporated in the Model .................................. IV-89 Fig. 3.107b Individual bridges Incorporated in the Model................................... IV-89 Fig. 3.107c Individual bridges Incorporated in the Model................................... IV-90 Fig. 3.108 Location of stations with Water Levels and Discharge Measurements IV-90 Fig. 3.109 Principle of Flood Plain Discretisation ............................................. IV-91
IV - v
Vol. II: Supporting Report, Paper IV: Development of Hydro-Hydraulic Model for the Cambodian Floodplains; WUP-JICA, March 2004
Fig. 3.110 Detailed View of the Quasi-two-dimensional Network
for the Flood Plains, with Cross Sections Overlaid (right) ............... IV-92 Fig. 3.111 Detailed View of the Branch and Cross Section Layout of the Area
around Phnom Penh .......................................................................... IV-92 Fig. 3.112 Model Setup showing Alignment of River and Floodplain Channels
and their Connections, including Examples of Cross Sections in Channels and Flood Plains as well as Longitudinal Profile of Bed Level ...................................................................................... IV-93
Fig. 3.113 Schematic Representation of Link between Rainfall-Runoff Model and the River and Floodplain Model................................................. IV-94
Fig. 3.114 Location and Type of Applied Boundary Conditions ....................... IV-94 Fig. 3.115a Water Level Boundary Condition at Kratie (1998-2001).................. IV-95 Fig. 3.115b Water Level Boundary at Tan Chau and Chau Doc
(hourly, 1998-2001) .......................................................................... IV-96 Fig. 3.115c Derived Water Level Boundary on the Southern Floodplains
East and West of the Mekong River (daily, 1998-2001)................... IV-97 Fig. 3.116 Simulated and Observed Discharge at Kompong Cham (Top),
Chrui Changvar (Middle) and Koh Norea (Bottom) ......................... IV-98 Fig. 3.117 Simulated and Observed Discharge at Neak Luong (Top),
Bassac Chaktomouk (Middle) and Koh Khel (Bottom) .................... IV-99 Fig. 3.118 Simulated and Observed Discharges at: Prek Kdam (Top),
Phnom Penh Port (Middle) and Spean Tras on Road No. 6 (Bottom) .......................................... IV-100
Fig. 3.119 Simulated and Observed Discharge at Tanchau. April 1999 ............ IV-101 Fig. 3.120 Simulated and Observed Discharge at Tanchau. April 2000 ............ IV-102 Fig. 3.121 Simulated and Observed Water Levels at Kompong Cham (Top),
Chrui Changvar (Middle) and Neak Luong (Bottom)....................... IV-103 Fig. 3.122 Simulated and Observed Water Levels at Kompong Luong (Top),
Kompong Chhnang (Middle) and Prek Kdam (Bottom)................... IV-104 Fig. 3.123 Simulated and Observed Water Levels at Phnom Penh Port (Top),
Bassac Chaktomouk (Middle) and Koh Khel (Bottom) .................... IV-105 Fig. 3.124 Model Verification for year 2002: Simulated and Observed (ADCP)
Discharge at Kompong Cham (Top) and the Chaktomouk Junction (Bottom) ........................................... IV-106
Fig. 3.125 Model Verification for year 2002: Simulated and Observed (ADCP) Discharge at Phnom Penh Port and Prek Kdam (Top), Monivong Bridge and Koh Khel (Middle) and Spean Dach (Bottom)........................... IV-107
Fig. 3.126a Simulated (left) and Observed (right) Flood Extent of the 2000 Flood (Peak Monsoon) ....................................................... IV-108
Fig. 3.126b Simulated (left) and Observed (right) Flood Extent of the Peak of the 1999 flood................................................................. IV-108
Fig. 3.126c Simulated (left) and Observed (right) Flood Extent on October 14, 2002............................................................................... IV-109
Fig. 3.126d Details of Simulated and Observed Flood Extent on October 14, 2002............................................................................... IV-109
IV - vi

Vol. II: Supporting Report, Paper IV: Development of Hydro-Hydraulic Model for the Cambodian Floodplains; WUP-JICA, March 2004
1. BACKGROUND
This Paper 4, Development of Hydro-Hydraulic Model for the Cambodian Floodplain, outlines all modelling activities carried out during the entire study period of the WUP-JICA Project. It presents a brief description of the first study on the Mekong in which MIKE 11 was applied, as well as the link to another project that had the title “Consolidation of Hydro-meteorological Data and Multifunctional Hydrologic Role of Tonle Sap Lake and its Vicinities” (in short, the Tonle Sap Lake & Vicinities Project or the TSLV Project), a parallel study at the MRCS in which the model was used for detailed flood analysis.
This report explains the concepts of the two model systems applied, the rainfall-runoff model and the hydraulic river and floodplain model, as well as the coupling between these two models. A detailed description of the topographic and structural data used for model construction is given. The hydrological and hydraulic data applied for model calibration/verification are described and, further, the detailed layout of the models together with the calibration/verification results for the years 1998 to 2002 is presented.
2. PROCESS OF MODEL DEVELOPMENT
2.1 Chaktomouk Project Model
As part of the Chaktomouk Project (ref. /1/), a MIKE 11 model was established for the Mekong-Tonle Sap-Bassac river system. The purpose of the MIKE 11 model was to provide boundary conditions for a detailed two-dimensional morphological river model (MIKE 21C) set up for the Chaktomouk junction. The two-dimensional model was thus the main modelling tool in the project, which was supported by the one-dimensional river model MIKE 11 with information that could not be obtained by data alone.
The MIKE 11 model was setup with upstream boundary at Kratie on the Mekong, and downstream boundaries at Tan Chau on the Mekong and Chau Doc on Bassac River in Vietnam. The model included the Tonle Sap River and the Great Lake. The reasons for this extent of the model were: (1) that records of water level and discharge did not exist in the four river branches close to the Chaktomuk junction; and (2) that the boundaries of the MIKE 11 should be unaffected by the changes in the junction caused by the various options studied with the two-dimensional model. Fig. 2.1 show the model layout of the MIKE 11 model used in the Chaktomouk project.
Given the above, the focus of the one-dimensional model was to obtain agreement between model results and observations in the four river branches close to the Chaktomuk junction as well as some distance away from the junction. The latter was because it was recognised that the exchange of water with the flood plains was significant and hence necessary to represent this in the model. However, since the details of the flows on the floodplains were not a focus in the project, the flood plains were schematised in a relatively coarse manner. This approach was valid since the model philosophy implied that if the model could simulate the conditions near the junction and some distance away from the junction, then the overall exchange with the flood plains would implicitly be represented with the model.
The access to rainfall data was limited in the study and also there were no discharge measurements available on the tributaries to carry out a direct calibration of the rainfall-runoff model. The calibration of this part of the model was therefore implicitly part of the river model calibration. Altogether 5 rainfall stations were used for the rainfall-runoff simulations.
IV - 1

Vol. II: Supporting Report, Paper IV: Development of Hydro-Hydraulic Model for the Cambodian Floodplains; WUP-JICA, March 2004
During the Chaktomouk project, an extensive measurement campaign was carried out to obtain bathymetry, discharge, and sediment data and information. Advanced technology such as ADCP for velocity and discharge measurements was applied. The data was applied for model construction and for calibration/verification of the models. For calibration of the one-dimensional model, the ADCP discharge measurements at the junction and at far distance from the junction taken in the pre-flood, the flood, and the post-flood periods were used. This was the first time in recent years that discharge data have been obtained simultaneously at a number of stations in Cambodia. It was also the first time in recent years that an advanced modelling system was used by applying such data. Fig. 2.2 shows the main output from the ADCP measurement campaign carried out during the Chaktomouk Project in year 2000.
2.2 WUP-JICA Model
The MIKE 11 model developed in this present WUP-JICA study is based on the model constructed for the Chaktomouk Project. This means that some of the model elements such as the schematisation of main river branches were adopted from the Chaktomouk Model. However, extensive modifications/additions were made to meet the specific purposes of the WUP-JICA study. The improvements to the model were made in a continuous process as data and information became available during Field Surveys 1 to 4 of the WUP-JICA study. These modifications/additions for model improvement are described thoroughly in Section 3 of this Chapter.
The overall purposes of the modelling component of the WUP-JICA study are:
(1) Study of the flow regime in the Mekong river system in Cambodia
Activities under this task include:
Data gap filling Flow regime analysis Water balance study Downstream flow prediction
(2) Support to preparation of water sharing rules
Activities include:
Assessment of average monthly flow conditions at key locations Study of natural reverse flow conditions in the Tonle Sap river
The purposes above require basically that the model can simulate full hydrological years and that the model can give accurate predictions of the hydraulic conditions throughout the Mekong, Bassac, Tonle Sap River and the Tonle Sap Lake (the Great Lake) in Cambodia. The Chaktomouk model has therefore undergone a revision, and improved with regard to schematisation of rivers, bridges, floodplains and the Great Lake. Besides this, the model has been updated with a detailed calibration of rainfall-runoff in the Great Lake tributaries. The model is at present able to simulate full hydrological years ranging from historical dry to wet years.
The model has been calibrated/verified on events from 1998 to 2002, and has been used for some of the specific tasks mentioned under items (1) and (2) above.
2.3 Relationship with Tonle Sap Lake and Vicinities Project Model
The TSLV Project was carried out at MRCS in parallel with this WUP-JICA study. The first project phases are reported in ref./9/. Further, the outcomes of the first project phases were published in a scientific article in the International Journal of River Basin Management, ref./13/.
IV - 2

Vol. II: Supporting Report, Paper IV: Development of Hydro-Hydraulic Model for the Cambodian Floodplains; WUP-JICA, March 2004
The main purpose of the TSLV Project was to collect information and analyse the functionality of the various floodplain areas in Cambodia. The project describes in quantitative terms the dynamics of filling and release of floodwaters on the floodplains, the exchange of flow between river and floodplain as well as between floodplain compartments. The direct outcome was a water balance assessment for the floodplain and river system.
The project goals were achieved by a combination of basic data collection, data analysis and hydraulic modelling. The data collection comprised continuous measurements of water level at 20 stations distributed on the floodplains, as well as discharge measurements on important tributaries using both conventional methods and the advanced ADP measurement technique. Altogether, nine satellite images of the Lower Mekong Basin were acquired through the project. The satellite images were taken from July 2002 to January 2003 at 3 to 4 weeks interval, and show the gradual process of flooding and draining of the floodplains.
A substantial part of the project involved hydrological/hydraulic modelling. The purpose of the modelling was to provide the functional relationships for the floodplain dynamics studied, i.e., volume change, filling/release of floodplain water, and to support the water balance assessment for the floodplains.
The MIKE 11 model developed under the WUP-JICA project was used for the purpose of the TSLV Project. The model was updated with regard to schematisation of the floodplains, and the links between the main rivers and the floodplains.
The TSLV and WUP-JICA projects ran in parallel with each other and hence the modelling work was carried out for both projects. Since both projects would benefit from the development made in each project, the goal was to develop one common model, which will suit the purposes of both projects. The present model represents the combined effort from the two projects and can thus be applied for the purposes of both.
IV - 3

Vol. II: Supporting Report, Paper IV: Development of Hydro-Hydraulic Model for the Cambodian Floodplains; WUP-JICA, March 2004
3. WUP-JICA MODEL COMPONENTS
3.1 Rainfall-Runoff Model
A major portion of the annual flow volume in the Mekong-Bassac-Tonle Sap river system within Cambodia originates from upstream. However, the local rainfall in Cambodia contributes significantly to the total flow volume in the initial and final stages of the monsoon season. During the peak monsoon the local contribution is less.
Given this, it is clear that there is a need to include the local rainfall in a model description of the main river and lake system in Cambodia. The contribution of local rainfall can be divided into two components. One is the direct rainfall occurring on the open water bodies, i.e., on the inundated floodplains, river branches and on the Great Lake itself, and the other component is the runoff from tributaries, mainly located around the Great Lake, which also stem from local rainfall. Whereas the former can easily be accounted for by converting observed precipitation to a volume contribution over time, the latter is more difficult since it requires long records of observed runoff and/or a calibrated rainfall-runoff model, which take the hydrological catchment characteristics into account and thus provide the necessary runoff information on the basis of observed rainfall.
Until very recently, both rainfall and runoff data in Cambodia have been limited in scope. With the improvement of the rainfall network system, since year 2000, the amount and quality of rainfall data has been increasing. At the same time a measuring campaign during 2001 (MRCS project under Technical Support Division) involving discharge measurements in all of the tributaries around the Great Lake had added new and valuable information to the hydrology in the area. For the first time since the 1960s it has been possible to derive rating curves for the tributaries and, further, to perform a direct calibration of the rainfall-runoff model.
The rainfall-runoff sub-model of the WUP-JICA model is described in detail below. The model concept behind the rainfall-runoff model is presented prior to the description of the actual model schematisation and calibration. A separate section on derivation of rating curves for the tributaries around the Tonle Sap Lake is included. Finally, the computed runoff to the river model is presented.
3.1.1 Model Concept
MIKE 11 includes several rainfall-runoff models. The most appropriate model for the Cambodian floodplains is the NAM model. The NAM model is a so-called lumped-conceptual type of model for continuous simulation. The term “conceptual” model implies that the hydrological cycle in nature is conceptualised to a number of interconnected reservoirs in the model, as outlined in Fig. 3.1. “Lumped” means that the physical properties of the area modelled (a catchment or a sub-catchment) are amalgamated into a few characteristic or nominal quantities and parameters. The term “continuous modelling” is used because the model in principle accounts continuously for the water content in the surface (soil moisture) and groundwater reservoirs.
The input to the NAM model consists of a time series of rainfall and evaporation and a number of model parameters. The output is a time series of run-off [distributed on surface run-off, interflow and groundwater (or base) flow] and net precipitation (i.e., rainfall minus evaporation). The net precipitation is applied directly to the water covered areas in the MIKE 11 HD (hydrodynamic) model and the simulated run-off to areas not covered by water.
IV - 4

Vol. II: Supporting Report, Paper IV: Development of Hydro-Hydraulic Model for the Cambodian Floodplains; WUP-JICA, March 2004
3.1.2 Sub-catchment Description and Delineation
The Cambodian part of the Mekong river basin from Kratie down to the Vietnamese border is divided into a number of sub-catchments. The sub-catchments reflect physical watersheds with the main tributaries included. The main data source used for the catchment delineation is the MRCS spatial database. However, the JICA Map, ref. /2/, and the French study in 1963-64, ref. /3/, were also used as information source for the sub-catchment delineation and characteristics.
Fig. 3.2 and Table 3.1 show the name and locations of the delineated sub-catchments and their areas.
Table 3.1 Sub-catchments in the Cambodian Part of Mekong
Basin for Rainfall-Runoff Modelling Sub-catchment Name Total Catchment Area (km2)
Stung Chinit 8236 Stung Sen 16359 Stung Staung 4357 Stung Chikreng 2714 Stung Seam Reap 3619 Stung Sreng 9986 Stung Sisophon 4310 Stung Mongkol Borey 10656 Stung Sangker 6052 Stung Dauntri 3695 Stung Pursat 5965 Stung Boribo 7153 Prek Thnoat 6123 Siem Bok 4425 Stung Chhlong 5957 Delta 13822 Lake (dry season) 2887
A few comments to the catchment delineation are needed. The sub-catchment ‘Siem Bok’ has a total area of 8851 km2 and follows the right bank of the Mekong up to the same level as Stung Treng. However, since the model area has its upper boundary at Kratie, the area of the sub-catchment is correspondingly reduced.
The Stung Sangker sub-catchment and the small catchment east of it are lumped together to describe the runoff from Stung Sangker (in some accounts called Stung Battambang). The sub-catchment called “Delta” reaches from upstream of Kompong Cham on the left bank of Mekong down to the Cambodia-Vietnam border. It also includes the flood plains between the Mekong and Bassac rivers and the area west of Bassac River.
3.1.3 Rainfall and Evaporation Data
(1) Rainfall
Rainfall data were obtained from the Hymos database at MRCS and supplemented with data from the TSD Section of MRCS, which requested the data from DHRW of the Ministry of Water Resources. The number of rainfall stations in Cambodia has been increasing since 1998, as shown in Figs. 3.3 to 3.6. The figures show the location of the stations with annual. Rainfall stations in Cambodia amounted to 13 in 1998, 22 in 1999, 81
IV - 5

Vol. II: Supporting Report, Paper IV: Development of Hydro-Hydraulic Model for the Cambodian Floodplains; WUP-JICA, March 2004
in 2000 and 137 in 2001. However, not all stations had a reliable data. Data of each station were investigated, and the stations with obvious errors or missing data were disqualified. Similarly, if two neighbouring stations had a difference of 1000 mm or more in their annual total rainfall, and if one of the stations at the same time has an annual total lower than 1000 mm, the latter station was disqualified. This reduced the total number of stations to 69.
Table 3.2 gives a list of the stations with reliable data in the years 1998 to 2001, which were utilised in the rainfall-runoff modelling The total number of stations with reliable data were 20 for 1998, 27 for 1999, 28 for 2000, 59 for 2001 and 32 for 2002.
Table 3.2 Rainfall Stations used for the Rainfall-Runoff Modelling
Station ID Station Name 1998 1999 2000 2001 2002 100419 Angkor Borei O 100505 Chau Doc O 110404 Kg.Speu O O 110409 Takhmao O 110413 PhnomSrouch O O O O 110415 Oudong O O O O 110416 Sre Khlong O 110423 Thnal Totung O O O O 110428 Tboung Khmoun O O O O 110429 Boeung Leach O O 110430 Samaki Meanchey O O O O O 110515 Pongnhea Krek O 110517 Peam Chikang O 110525 Pear Raing O O 120205 Chamlong Kuoy O 120213 Rattanak Mondol O 120301 Tuol Krous O 120302 Beoung Kantuot O 120303 Maung Russey O O O O 120309 Talo O 120311 Cheang Meanchey O 120312 Kravanh O O O 120313 Peam O O 120320 Boeung Kantuot O 120401 Kg.Chhnang O O O O O 120402 Staung O O O O 120403 Krakor O O O 120404 Kg Thom O O O O 120406 Bamnak O 120416 Rolear Pear O O O O 120418 Pong Ro O O 120419 Krang Tamoung O O 120420 Tuk Phos O O O O O 120422 Prasat Balaing O O 120423 Chinit O O O O 120424 Kandol Chras O O 120425 Prey Prous O O O O O 120426 Beoung Khnar O 120502 Stung Trang O 120503 Baray O O O O O 120504 Kg Cham O 120508 Chhlong O O 120509 Chamcar Leu O 120516 Prasat Sambo O O O 120517 Taing kok O O O 120518 Taing Krassaing O O O
IV - 6

Vol. II: Supporting Report, Paper IV: Development of Hydro-Hydraulic Model for the Cambodian Floodplains; WUP-JICA, March 2004
Table 3.2 Rainfall Stations used (cont’d.)
120519 Krouch Thmar O 120520 Cham Bac O 130202 Sisophon O 130301 Banan 130306 Siem Reap O O O 130307 Kralanh O O O O O 130311 Sdar Sdam O O 130313 Tuol Samraung O 130316 Pranet Preah O 130317 Thmar Pork O 130319 Thmar Kol O O O 130320 Angkor Chum O O O 130321 Prasat Bakong O O O O 130323 Khum Lvear O O 130324 Phnom Krom O O 130326 Srey Snam O O 130327 Svay Leu O O 130328 Varin O O 130403 Phnom Koulen O O 130404 Dam dek O O O O 130405 Kompong Kdei O O 130505 Sadan O O O O 520101 Mongkol Borey O O 580101 Pursat O O O 581102 Svay Donkeo O
(2) Evaporation
There are very few recent evaporation measurements in the Tonle Sap basin. Monthly averaged daily evaporation data exist from 1962 for 9 stations in Cambodia, see ref. /3/. From these stations 5 are within the model area and were judged relevant for the study. These stations are Phnom Penh, Kompong Cham, Siem Reap, Battambang, and Krakor. Daily evaporation data of the Phnom Penh Station from year 2000 until 2002 are available at MRCS . The present data have been converted into monthly averaged daily values and pooled with the data from 1962. Variations of mean value of the monthly averaged daily evaporation (mm/day) used for the rainfall-runoff modelling are given in Table 3.3 below. The data in Table 3.3 are plotted in Fig. 3.7.
Table 3.3 Monthly Averaged Daily Evaporation Rates (mm/day)
used for the Rainfall-Runoff Modelling January February March April May June 3.9 ± 0.4 4.3 ± 0.5 4.6 ± 0.8 4.8 ± 0.5 4.0 ± 0.7 3.7 ± 0.6 July August September October November December 3.7 ± 0.8 2.9 ± 0.4 2.9 ± 0.5 2.9 ± 0.7 3.6 ± 0.6 4.1 ± 0.5
3.1.4 Analysis of Runoff in the Tonle Sap Basin
(1) Introduction
A recent a study (ref. /4/) had analysed hydrological data from year 1998 to 2001 collected at stations in the sub-catchments of the Great Lake. There are no runoff data available from the other tributaries in Cambodia. The study had provided the basis for establishment of discharge rating curves for the tributaries to the Great Lake based on the recent data. It should be mentioned, however, that many of the stations have data for only one year, typically year 2001. Further, the measurements were carried out mostly from August to
IV - 7

Vol. II: Supporting Report, Paper IV: Development of Hydro-Hydraulic Model for the Cambodian Floodplains; WUP-JICA, March 2004
December. Thus the rating curves reflect the present characteristics of the rivers, and only in a part of the hydrological year. On this basis there is scope for improvement of the rating curves and associated formulas. However, the practical usage of rating curves is that they enable a computation of discharges based on past (historical) records of water levels. Hence by using the rating curves to produce discharges for the period 1998-2001, it was inherently assumed that the characteristics of the rivers have not changed. For most stations this is not possible to verify, since there are limited records of water levels and discharges.
In the WUP-JICA study, the generation of runoff from the sub-catchments had the purpose to provide the quantification of runoff from sub-catchments in the Tonle Sap Lake basin, which was needed for the water balance study. Since the established mathematical model (reported in ref. /5/) was the main supporting tool for the water balance study, the second purpose of generation of sub-catchment runoff was to provide an improved basis for calibration of the rainfall-runoff model, which was part of the established mathematical model.
The quantification of sub-catchment runoff presented herein starts with the construction of the rating curves based on the analysis in ref/4/ and data obtained from MRCS. Subsequently the reliability of observed water levels in the years 1998-2001 was evaluated to identify the periods for which discharges can be generated. By this process it became clear which sub-catchments and periods should rely on discharges generated from the rainfall-runoff model. The sub-catchments and specifications are shown in Table 3.4, while their extents are shown in Fig. 3.2.
Table 3.4 Sub-catchments in the Tonle Sap Lake Basin
(Catchment areas are those at the monitoring station and as reported in ref. /4/) Sub-catchment
given by river name Monitoring Station Total Catchment Area [km2]
Stung Chinit Kompong Thmar 4130 Stung Sen Kompong Thom 14000 Stung Staung Kompong Chen 1895 Stung Chikreng Kompong Kdey 1920 Stung Seam Reap Untac Bridge 670 Stung Sreng Kralanh 8175 Stung Sisophon Sisophon 4310 Stung Mongkol Borey Mongkol Borey 4170 Stung Sangker Battambang 3230 Stung Dauntri Maung 835 Stung Pursat Bak Trakoun 4480 Stung Boribo Boribo 869
The rating curves that are constructed are of the form:
Q (If no backwater effect) ( bHHa 0−⋅= )
or
( )
Auxiliary
b
HHFwhere
HHaF
Q
−=
−= 0 (If backwater effect is present)
IV - 8

Vol. II: Supporting Report, Paper IV: Development of Hydro-Hydraulic Model for the Cambodian Floodplains; WUP-JICA, March 2004
The theoretical value of the exponent b above is 1.67 as described in ref. /6/. In real rivers the exponent b usually ranges between 1.3 and 1.8; however, the value as high as 2 could be observed. When using the data to derive the actual equations, it is quite convenient to assume that b=2. With the limited data available for construction of the rating curves it is judged that this assumption would give a sufficient accurate result. Only when more data becomes available that it is worthwhile to derive different values of b.
For each sub-catchment there are references to figures of the data available for construction of the rating curve, the observed water levels and the rated discharge together with the observed.
(2) Tributary Analysis
The item contains an analysis of the flow and water level data for each individual sub-catchment in the Tonle Sap Lake basin.
(a) Stung Chinit
Altogether 16 discharge measurements have been carried out at Kompong Thmar in 2001. Ref. /4/ mentions that the rating curve is of the type Q=f(H) where H is water level at Kompong Thmar. Analysis of the data has led to the derivation of a rating curve with the formula
( )23243.09372.7 −⋅= KgThmarHQ
Where HKgThmar is the raw water level data from Kompong Thmar.
Fig. 3.8 and 3.9 show the water level and discharge data together with the derived rating curve. Fig. 3.10 shows the observed water level at Kompong Thmar in the period 1998-2001. It is seen that only a few gaps exist in the data. Generally the data look good, and it is judged that the discharge can be rated on the basis of water level data. The rated discharge is shown together with the observed discharge (year 2001) in Fig. 3.11.
In principle it is not necessary to calibrate the rainfall-runoff model for the Stung Chinit sub-catchment, since almost the whole period from 1998-2001 can be rated on the basis of recorded water level. Thus the rated discharge becomes a direct input to the river and lake model. However, a calibration is carried out for the purpose of deriving calibration parameters for catchments with less or poor data.
(b) Stung Sen
In total 40 discharge measurements were made in the period 1998 to 2001 at Kompong Thom. The station is affected by backwater; hence, an additional water level station is needed for construction of a rating curve. The rating curve is of the type Q/sqrt(F) = f(H), where F is the slope between two stations, in this case between Kompong Thom and Panha Chi. The fall must be adjusted for difference in datum. The fall adjustment is 2.951 m.
Analysis of the data has led to derivation of the rating curve
( )951.2
7906.996.32
hom
2hom.
+−=
−⋅=
PanhaChiKgT
TKg
HHFwhere
HF
Q
IV - 9

Vol. II: Supporting Report, Paper IV: Development of Hydro-Hydraulic Model for the Cambodian Floodplains; WUP-JICA, March 2004
Fig. 3.14 shows the observed water levels at Kompong Thom and at Panha Chi. Since the observation period for Panha Chi is shorter than at Kompong Thom, a rated discharge can only be generated for the common period. The water level data in the common period are of reasonable quality; hence the discharge rating curve is made for the entire period.
The rated and observed discharges are seen in Fig. 3.15.
(c) Stung Staung
Altogether 15 discharges were made in year 2001. It is estimated (ref. /4/) that the rating curve is of the type Q = f(H). The rating curve has the formula
( )22813.19524.7 −⋅= KgChenHQ
Fig. 3.16 shows the data for derivation of the rating curve. Fig. 3.17 shows the rating curve plotted together with the data. Fig. 3.18 shows the recorded water level at Kompong Chen from 1998 to 2001. The water level from 1999 seems unrealistic high compared to the other years. In general the water levels exhibit some fluctuations, which could be doubtful. In any event, the rated discharge has been plotted on Fig. 3.19. Again there are some fluctuations in the discharges. It is judged that the rated discharges should not be used directly as input to the river model, but that the rainfall-runoff simulation should be calibrated against the observed data only.
(d) Stung Chikreng
There has been measured discharge 16 times at Kompong Kdey on Stung Chikreng in 2001. Ref. /4/ suggests that rating curves are of the type Q = f(HKgKdey, HKgLuong). Hence a series of rating curves representing various levels at Kg.Luong should be produced. In Fig. 3.20 the observed water levels at Kompong Kdey have been plotted against the square root of the discharge. The data fit well a straight line, so for practical purposes a rating curve of the type Q=f(H) has been assumed in the present study. The rating curve derived has the formula
( )20076.21156.4 −⋅= KgKdeyHQ
Fig. 3.21 shows the derived rating curve together with the data. The observed water levels are presented in Fig. 3.22. In general there are spikes and fluctuations (especially year 2000) as well as a low water datum difference from 1998 to the other years. It is difficult to assess whether these irregularities have occurred or not. Fig. 3.23 show that a good agreement exists between observations and the rated discharge in year 2001. However, as the rated discharge for the other years reflect the fluctuating water level, the rated discharge should be used with care.
(e) Stung Seam Reap
A total of 23 discharge measurements have been carried out in year 2001. Data are also available from 1998 and 1999. Each year has its own rating curve of the type Q=f(H), ref. /4/. Fig. 3.24 shows the water level plotted against the square root of discharges for the 2001 data only. On this basis a rating curve has been derived (for 2001) with the formula
IV - 10

Vol. II: Supporting Report, Paper IV: Development of Hydro-Hydraulic Model for the Cambodian Floodplains; WUP-JICA, March 2004
( )20936.01059.4 −⋅= eUntacBridgHQ .
However, as can be seen from Fig. 3.25, the rating is not very accurate, and also data are lacking to cover the upper range. Together with the conclusions drawn from Fig. 3.26, that the water level is fluctuating unrealistically, a rated discharge should be omitted. Fig. 3.27 shows in the result if a rating is performed on the basis of recorded water levels. There are unacceptable fluctuations, hence only the direct measurements should be used for calibration.
(f) Stung Sreng
There are no reported recent discharge data on Stung Sreng at Kralanh in ref. /4/. Despite this, ref. /4/ suggests that a rating curve can be derived for 1962-63 data with the form Q/sqrt(F) = f(H), where the fall F is H_Kralanh - H_BacPrea. However, discharge and water level data for Kralanh from 1998, 1999 and 2001 have been obtained from MRCS. For Bac Prea water level data from 1999 and 2000 have likewise been obtained. Since both stations are needed for establishment of a rating curve, the only common period is 1999. Fig. 3.28 shows a plot of the data from 1962, 1963 and 1999. It is of course quite uncertain to use both old and new data for derivation of a rating curve. Doing so, it is inherently assumed that the characteristics of the river have not changed. However, the scatter in the data from 1999 in Fig. 3.29 is not significantly different from the scatter in the 1962 and 1963 data. Hence it is attempted to create a rating curve based on all data, see Fig. 3.29. The rating curve has the formula
( )
04.3
9275.03418.2
Pr
2
+−=
−⋅=
eaBacKralanh
Kralanh
HHFwhere
HF
Q
Fig. 3.30 shows the observed water levels at Kralanh and at Bac Prea. The observations at both stations look good. Since both stations are needed to generate a rated discharge, the only period in which the discharge could be derived was one time period in 1999 and one in 2000, see Fig. 3.31. Fig. 3.31 also shows the observed discharge data in 1998 and 2001.
(g) Stung Sisophon
From Stung Sisophon there are discharge data from 1997, 1998, 1999 and 2001 besides the older data from 1962-63. The station is subjected to backwater (ref. /4/) and a rating curve is of the form Q/sqrt(F) = f(HSisophon ), where F = H_Sisophon - H_BacPrea. There are almost continuous water level measurements from 1998-001 for Sisophon. It was initially tested whether a rating curve of the type Q=f(H) could be constructed for the years to be simulated, but the outcome was not very good. This gave support to the earlier finding, which states that backwater effect was significant, and that water level from another station (Bac Prea) should also be used. However, the water level data from Bac Prea cover only 1999 and 2000. Hence a rated discharge can only be made for part of 1999 and 2000.
Because of the dependency of the water level at Bac Prea, the construction of a rating curve can only use data from 1962-63 and 1999. It is of course an assumption that the old and new data sets can be pooled. Fig. 3.32 shows the data from 1962-63 and 1999 used for derivation of the rating curve. Fig. 3.33 shows the derived rating curve together with the data. The formula of the rating curve is
IV - 11

Vol. II: Supporting Report, Paper IV: Development of Hydro-Hydraulic Model for the Cambodian Floodplains; WUP-JICA, March 2004
( )71.3
0056.576.37
Pr
2
+−=
−⋅=
eaBacSisophon
Sisophon
HHFwhere
HF
Q
Fig. 3.34 shows the observed water levels at Sisophon and at Bac Prea for the period 1998-2001. Both data sets look good. Fig. 3.35 shows the rated and the observed discharges from 1998-2001.
(h) Stung Mongkol Borey
Apart from the discharge data from 1962-63, Mongkol Borey has discharge data in 1997, 1998, 1999 and 2001. As for Stung Sisophon, the station is also affected by backwater (ref. /4/) and an additional station is therefore needed (Bak Prea). The rating curve is of the type Q/sqrt(F) = f(HMongkolBorey). Mongkol Borey station has almost continuous water level data from 1998-2001. Since the Bac Prea station has only data from 1999 and 2000, the common period for which a discharge can be rated is therefore those two years. Fig. 3.36 shows the data plotted for derivation of the discharge rating curve. It is judged that the data sets from 1999 can be merged with the data from 1962-63 for derivation of a rating curve. The formula for the rating curve is
( )40.5
1371.02753.1
Pr
2
+−=
−⋅=
eaBaceyMongkolBor
eyMongkolBor
HHFwhere
HF
Q
Fig. 3.37 shows the derived rating curve together with the data. It is seen that the rating curve gets uncertain for water levels above 6 m at Mongkol Borey. Fig. 3.38 shows the observed water levels at Mongkol Borey and at Bac Prea. The water levels at Mongkol Borey show some smaller fluctuations, but in general the data are judged to be usable. The rated and observed discharges are shown in Fig. 3.39.
(i) Stung Sangker
In recent years discharge measurements have been made in 1998-2001. These years are not mentioned in ref. /4/ which only reports data from 1962-63. Battambang water level station is affected by backwater; hence an additional station is needed. Ref. /4/ mentions that Bac Prea can be used as auxiliary station, and that the rating curve is of the type Q/sqrt(F)=f(HBattambang), where F=(HBattambang - HBacPrea + 3.57). From initial plots of water level versus discharges, it was judged that the data from recent years could be used together with the 1962-63 data for derivation of a rating curve. The reason why it is not sufficient to use data from recent years is that only 1999 provide a common time interval for the stations.
Fig. 3.40 shows the data from 1962-63 and 1999 used for derivation of the rating curve. Fig. 3.41 shows the derived rating curve together with the data. The formula for the rating curve is
( )57.3
64.06435.5
Pr
2
+−=
−⋅=
eaBacBattambang
Battambang
HHFwhere
HF
Q
The water level data from Battambang and Bac Prea are presented in Fig. 3.42. The water levels at Battambang are fluctuating to a large degree. Some of the spikes in
IV - 12

Vol. II: Supporting Report, Paper IV: Development of Hydro-Hydraulic Model for the Cambodian Floodplains; WUP-JICA, March 2004
the hydrograph are judged unrealistic. Therefore the rated discharge (Fig. 3.43) shows some unrealistic high values, and should therefore not be used.
(j) Stung Dauntri
Stung Dauntri is not reported in ref. /4/. However, discharge has been measured in the river in 1962-93 and in 2001. In ref. /3/ it is mentioned that the rating curve for the river is of the form Q=f(H). Fig. 3.44 shows the data from 2001 where the water level is plotted against the square root of the discharge. Fig. 3.45 shows the derived rating curve together with the data.
The rating curve based on 2001 data has the formula
( )22439.14.12 −⋅= MaungHQ
There are no water level measurements from 1998-2001 from Stung Dauntri at Maung. Hence a rated discharge could not be made for this period. Fig. 3.46 shows the observed discharge in year 2001.
(k) Stung Pursat
Stung Pursat at Pursat has data from 1962-63. In 1998, 1999 and 2001, discharge have been measured at Bak Trakoun, which is farther upstream. There are no reports on this station neither in ref./3/ nor in ref. /4/, but since Pursat in ref. /3/ is reported to be of the type Q=f(H), it is suggested that this will be the case for Bak Trakoun also.
Fig. 3.47 shows the water level versus the square root of discharge at Bak Trakoun for the data from 1998-2001. It is seen that a very good fit is obtained. The derived rating curve is shown in Fig. 3.48, and the formula is
( )20856.05.25 −⋅= BakTrakounHQ
Fig. 3.49 shows the observed water level at Bak Trakoun. The levels show some fluctuations and should therefore be used with some caution. It has been attempted though to rate the discharge for the period where water levels are available. This is seen in Fig. 3.50, in which the observed discharges are also presented.
(l) Stung Boribo
Altogether 29 discharge measurements have been made at Stung Boribo in 1998, 1999 and 2001. Ref. /4/ suggests on basis of data from 1962-63 that the rating curve is of the type Q=f(H). Fig. 3.51 shows the data from the three years plotted for derivation of a rating curve. The derived rating curve is seen in Fig. 3.52. The formula for the rating curve is
( )22588.056.23 −⋅= BoriboHQ
The observed water level at Boribo is seen on Fig. 3.53. There are some fluctuations in the water level. Despite this, there is a good relation between rated and observed discharge as seen in Fig. 3.54.
IV - 13

Vol. II: Supporting Report, Paper IV: Development of Hydro-Hydraulic Model for the Cambodian Floodplains; WUP-JICA, March 2004
(3) Conclusion on analysis of runoff data
The foregoing subsection have shown that rating curves can be produced for all sub-catchments. It is not known whether the river characteristics have changed in the period 1998-2001, but it is assumed that the rating curves are reasonably valid for the entire period. The data basis for the rating curves varies and so does the accuracy. But equally important is the accuracy and availability of water level records from which the discharges will be rated. In most sub-catchments the water levels appear to be the limiting factor in the generation of discharges in the period 1998-2001.
The best station in terms of quality and period of data is Stung Chinit. Stung Sreng, Stung Sisophon and Stung Mongkol have also reasonable records, but their limitation is their dependency on the water level at Bac Prea. The latter covers only 1999 and 2000. Despite some fluctuations, the water level and hence the rated discharges at Stung Boribo can be used. The remaining stations show fluctuations or irregularities in the observed water levels which lead to less reliable rated discharges.
There are obvious differences between the catchments north of the lake and the catchments south and west of the lake. The catchments on the northern side show less fluctuation in the water levels than those on the southern side. The reason could be found in the catchment size (larger size means longer response time), catchment topography as well as in the rainfall pattern. The catchments to the south receive runoff from the Cardamom Mountains, and it can be expected that the rainfall is more intense and also that the annual amount is larger. Also the catchment sizes are smaller to the south, and a shorter response time can be expected, resulting in larger fluctuations in water levels and discharges. In contrast to this, the catchments north of the lake receive less rainfall. They are also generally larger, so the response time is longer leading to less fluctuating water levels and discharges. A good example of this difference between the catchments north and south of the lake is a comparison between the observed water levels at Stung Chinit and at Stung Boribo. The differences between the discharges in the northern catchments and those to the south was clearly demonstrated in ref./3/.
The present analysis shows that there are only two sub-catchments for which a discharge can be rated for the full period 1998-2001. Those are Stung Chinit and Stung Boribo. The remaining catchments can be rated for a maximum 1-2 years and in some cases for none because of poor data. It is therefore necessary to make use of the rainfall-runoff model in order to provide the runoff from most of the catchments.
3.1.5 Calibration and Verification of the Rainfall-Runoff Model
(1) Introduction
A rainfall runoff model of the Tonle Sap basin has already been established as part of the Chaktomouk project, ref./1/ as well as in the early stages of the present study, ref. /5/. However, until recently a direct calibration of the model has not been possible due to lack of runoff data. Therefore the rainfall-runoff model has been calibrated indirectly through the calibration of the river model. Although the annual local rainfall and runoff in the Tonle Sap basin is minor compared to the annual flow volume from upstream (e.g. at Kratie), the local rainfall becomes important especially in the transition from dry to flood season and vice versa. Hence for a water balance to be established for the area on a weekly or monthly basis, it is important to have a runoff description, which is as realistic as possible.
The constructed rating curves and rated discharges presented in the foregoing paragraph serve together with the measured discharges as the basis for a direct calibration of the
IV - 14

Vol. II: Supporting Report, Paper IV: Development of Hydro-Hydraulic Model for the Cambodian Floodplains; WUP-JICA, March 2004
rainfall-runoff model. The data are not equally good for all sub-catchments, that is both the quality and the amount of data varies from one catchment to the other. Therefore, the calibration parameters from the more successfully calibrated sub-catchments are applied in the neighbouring sub-catchments. This procedure involves of course some uncertainty, but it is considered the only possible alternative.
(2) Calibration of Sub-catchments
The sub-catchment Stung Chinit has been selected as the main calibration catchment on the northern side of the lake. Stung Sen and Stung Sreng have been used as secondary calibration catchments since the period with rated discharge is shorter than Stung Chinit. On the southern side the catchment Stung Boribo is the main calibration catchment supported by Stung Pursat and Stung Sangker.
For the setting up of a rainfall-runoff model of the present type (lumped, conceptual and physically based) basic data on rainfall and evaporation is needed. Besides this, a number of parameters, used for the physical process descriptions (e.g. water storage on surface and in the root zone, overland flow, infiltration, interflow and base flow as well as groundwater recharge), are needed. These parameters are usually obtained by trial and error or automatic calibration. However, the very first activity is to evaluate the discharge hydrographs, and clarify features such as peak flow, minimum flow, distributions between direct runoff (overland flow) and base flow, etc. Such an evaluation is very important for the initial selection of the model parameters.
The most complete discharge hydrographs are the rated discharges from Stung Chinit and Stung Boribo, seen Fig. 3.11 and 3.54. In both catchments the relative difference between low and high flows is large. The recession period appears to be shorter and 'steeper' for Stung Boribo than for Stung Chinit. The peaks (or spikes) during the monsoon are direct runoff from the catchments and they appear in both catchment types, but are mostly pronounced for Stung Boribo. Stung Chinit has a larger proportion of flow, which is in-between base flow and direct runoff. This flow is interflow and occurs in the upper rootzone.
(a) Rainfall
The available rainfall data within the model area has been discussed in Subsection 3.1.3. Rainfall data have been evaluated for the years 1998-2001. Some stations show significantly lower annual rainfall than the neighbouring stations, and have subsequently been discarded. In some years, especially 1998 and 1999 it has been necessary to apply a few stations from the neighbouring catchments. After selection of appropriate stations for the catchments, a simple mean area rainfall has been calculated with each station having equally weight. With the relative large uncertainty in some of the rainfall data as well as the non-uniform distribution of rainfall network, it has not been attempted to apply any sophisticated weighting of the individual stations.
Ideally the rainfall stations applied for runoff simulation in each sub-catchment are located within the sub-catchment itself. However, due to the reasons mentioned, it has been necessary to use some of the rainfall data from neighbouring catchments. The rainfall stations used for each individual sub-catchment are shown in Table 3.5.
IV - 15

Vol. II: Supporting Report, Paper IV: Development of Hydro-Hydraulic Model for the Cambodian Floodplains; WUP-JICA, March 2004
Table 3.5 Rainfall Stations used to Derive Mean Area Rainfall for Each Catchment Catchment Rainfall stations in
1998 Rainfall stations in
1999 Rainfall stations in
2000 Rainfall stations in
2001
Stung Chinit 130505, 120423, 120503
130505, 120423, 120503
130505, 120423, 120503
130505, 120423, 120503, 120509, 120502
Stung Sen 120404, 120425, 120402, 120503, 120423, 130404
120404, 120425, 120503, 120423, 130404
120404, 120402, 120503, 120516, 130505
120425, 120402, 120503, 120516, 130505
Stung Staung 120402, 120425, 120517
120402, 120425, 130405, 130404
120402, 120425, 120518,
120402, 120425, 130405, 120424, 120518, 120517, 120422, 130404
Stung Chikreng 120402, 120425 120402, 120425, 120402, 120425, 130405
120402, 120425, 130405
Stung Seam Reap 130306, 130307, 130320, 130321, 120425
130306, 130307, 130405, 130321, 120425
130307, 120425
130307, 130405, 130320, 130321, 130323, 130327, 130403, 130324, 130425
Stung Sreng 130306, 130307 520101, 130405, 130306 520101, 130307
130328, 130311, 130326, 130317, 130316, 130327, 130307
Stung Sisophon 130306, 120303, 130307
130306, 120303, 130307, 130316
120303, 130319, 130313
130307, 130316, 130202, 120205
Stung Mongkol Borey
130306, 120303, 130307
130306, 120303, 130307, 130316
120303, 130319, 130313
130307, 130316, 130202, 120205
Stung Sangker 120303 120303, 30319 120303, 130319 120311, 120213, 120205
Stung Dauntri 120303, 120401 120303, 120403, 120401
120303, 581102, 120309, 120403, 120401
120302, 120403, 120401
Stung Pursat 120302, 20303 120302, 120303, 120312, 120309, 120403
120302, 120403, 581102, 20309, 120312, 120313, 120320
120302, 81102, 120313, 120320, 120406, 120312
Stung Boribo 120401, 110430, 120416, 110415, 110423
120401, 110430, 120420, 120416, 110415, 120403, 110423, 120302
120401, 110430, 120420, 120416, 110415, 120403, 110423
120401, 120301, 110430, 120419, 120416, 120418, 110429, 120420, 110415, 120403, 110423, 120302
Prek Thnoat 110413, 110423 110413, 110423 110413 ,110423, 110404
110413, 110423, 110404, 110416
Siem Bok 120503, 10428 120503, 120508, 110428 120503, 110428
120503, 120508, 110517, 110428, 120502, 120504, 120509, 120519, 120520
Stung Chhlong 120503, 110428 120503, 120508, 110428 120503, 110428
120503, 120508, 110517, 110428, 120502, 120504, 120509, 120519, 120520
Delta 110423, 120503, 120401
110423, 120503, 120401, 120508
110423, 120503, 120401
110423, 120503, 120401, 120508, 110517, 120519, 110515, 110525, 100419, 120504, 110409
Lake
120401, 120302, 120303, 130306, 130307, 120402, 120404
120401, 120302, 120303, 130306, 130307, 120402, 120404
120401, 120302, 120303, 120402, 120404
120401, 120302, 130307, 120402
Note: Figures indicate the identification numbers of rainfall stations. The other catchments applied model parameters from the nearest calibrated catchment.
The mean area rainfalls (on daily basis) for each sub-catchment using the stations above are presented in Figs. 3.55 to 3.71.
IV - 16

Vol. II: Supporting Report, Paper IV: Development of Hydro-Hydraulic Model for the Cambodian Floodplains; WUP-JICA, March 2004
(b) Evaporation
The available evaporation data have been discussed in Subsection 3.1.3. The mean value of the monthly averaged daily evaporation rates has been used for all sub-catchments modeled.
(c) Model parameters
On basis of the evaluation of the discharge hydrographs, the initial values of the model parameters have been approximated. Hereafter a fine-tuning of the parameters was carried out in order to obtain the best match between observations and model predictions. The model parameters are related to the model concept and description. Hence it will require a thorough description of the rainfall-runoff model, in order to interpret the various parameters. It has been chosen not to go to this level of detail in the present description.
(d) Modelling results – Stung Chinit
The MIKE 11 NAM model has been set up for each individual sub-catchment. The rainfall and evaporation input described in the foregoing sections was used in the model together with initial choice of model parameters. Through an iterative process with result evaluation and fine-tuning of model parameters, the Stung Chinit sub-catchment was calibrated for the period 1998-2001. The results are seen in Fig. 3.72 and 3.73.
Fig. 3.72 shows the observed, rated and simulated discharges from Stung Chinit in the period 1998-2001. In general there is a good match between all three data sets. Peak levels, minimum levels as well as the model simulates the shape of especially the recession part. Some of the direct runoff peaks during the monsoon are not picked up precisely. This could not be expected either, since only few rainfall stations have been used, see in Table 3.5. Moreover, the dotted line is a rated discharge, and it is subject to some uncertainty. But in general it is demonstrated that the rated discharge represents the runoff pattern from the catchment, since peak levels, recession pattern from 2001 measurements and the monsoon duration are simulated quite well.
The accumulated rated discharge as well as the accumulated simulated discharge is shown in Fig. 3.73. The deviation between observations and simulations is minimal.
The Stung Chinit calibration shows that the lumped conceptual modeling approach is useful for rainfall-runoff modeling in the sub-catchments of the Tonle Sap lake basin. It also shows that the model can be calibrated to a reasonable degree with relatively few rainfall stations.
(e) Modelling results – Stung Sen
Stung Sen has a shorter record of rated discharge than Stung Chinit. But the station has more spot measurements of discharges. The catchments are judged to have more or less similar characteristics (basin slope, soil types, and vegetation cover) as the Stung Chinit catchment. Hence the parameters from the Stung Chinit calibration were used initially for the calibration of the Stung Sen catchments. A small adjustment in one of the model parameters was needed to model the timing of the recession period correct.
The calibration results for Stung Sen are shown in Fig. 3.74.
IV - 17
Vol. II: Supporting Report, Paper IV: Development of Hydro-Hydraulic Model for the Cambodian Floodplains; WUP-JICA, March 2004
The match between simulation results and observations/ratings is not as good as for Stung Chinit, but still acceptable. There has been no further attempt to tune other parameters to improve the calibrations for Stung Sen and Stung Sreng.
The main conclusion is that the model parameters from one catchment of the northern part of the lake can be applied for the neighbouring catchments and still give a reasonable accuracy. However, smaller changes to the parameters are likely to improve the calibration of those neighbouring catchments, and it is also possible that the results will be improved if there were rainfall stations available in the northern part of Stung Sen and Stung Sreng catchments.
(f) Modelling results – Stung Staung
The catchment characteristics of Stung Staung are judged to be similar to those of Stung Sen. The simulation of Stung Staung therefore initially used the same model parameters as Stung Sen. Fig. 3.75 shows the simulated and observed discharge at Kompong Chen. The rated discharge has not been used for comparison with model results because the fluctuations in water level at Kompong Chen results in unrealistic spikes of the discharge hydrograph, see Figs. 3.18 and 3.19.
By comparing the observations from 2001 with the model results it is observed that the peak value as well as the shape of the recession period are well reproduced. However, the timing of the recession period is poorer than for Stung Chinit and Stung Sen. Various combinations of parameter settings did not improve this significantly. It is therefore concluded that the difference in observations must be due to the quality of the rainfall data.
(g) Modelling results – Stung Chikreng
The Stung Chikreng catchment is quite similar in size to the Stung Staung sub-catchment. However the observed discharge in year 2001 are somewhat smaller for Stung Chikreng (compare Fig. 3.75 and Fig. 3.76). The reason for this is that during the periods with high flows there were no measurements in the Stung Chikreng. The results for Stung Chikreng are shown together with the observations in Fig. 3.75.
(h) Modelling results – Stung Seam Reap
Simulated and observed discharge for Stung Seam Reap is shown in Fig. 3.77. Generally the model does not pick up the low flow period, and the matching of the single peak value during 2001 is not sufficient for a proper calibration. There are some indications, that Siem Reap town influences the Stung Seam Reap. The water level plot on Fig. 3.26 shows a lot of fluctuations, and it is possible that the activities inside Siem Reap town influence the water level and runoff pattern. The study team has no information on gates or storage facilities, which may be in operation during high flows. Also there is no information on the water consumption from the river. The hydrological/hydraulic conditions in Stung Seam Reap in the town is likely to be more complex than first thought, and much more local information and data is needed for setting up a local runoff model. However, the total contribution to the Great Lake from Stung Seam Reap is not large. On this ground the simulated runoff can be used as inflow to the river model.
(i) Model results – Stung Sreng
Stung Sreng has a shorter record of rated discharge than Stung Chinit. But they both have more spot measurements of discharges. The catchments are judged to have
IV - 18

Vol. II: Supporting Report, Paper IV: Development of Hydro-Hydraulic Model for the Cambodian Floodplains; WUP-JICA, March 2004
more or less similar characteristics (basin slope, soil types, and vegetation cover) as the Stung Chinit catchment. Hence the parameters from the Stung Chinit calibration were used initially for the calibration of the Stung Sreng catchments. Some adjustment was needed in order to match the observed discharges.
The calibration results for Stung Sreng are shown in Fig. 3.78. The calibration of the Stung Sreng catchment is not as good as for Stung Chinit and Stung Sen. The observed water levels seem accurate (Fig. 3.30), but unfortunately there has not been any discharge measurements in the period where water levels in the auxiliary station are available, i.e., in year 1999 and 2000. Hence the rating curve is constructed mainly on basis of 1962-63 data. The comparison between the rated discharge with the model simulations in Fig. 3.77 should therefore not be given much weight. Comparison with the direct discharge observations shows that the model simulates the general level during low and high flow. The number of rainfall stations in this area is few. An increased number of stations will most likely improve a model calibration.
(j) Model results – Stung Sisophon
The observed water levels in Stung Sisophon (Fig. 3.34) are reliable. But as the rating curve is mainly constructed on 1962-63 data (only few available in 1999), the rated discharge should not be used directly in comparison with the simulated discharge.
Therefore the simulated discharge is only compared with the direct observations in Fig. 3.79). It is seen that the general level as well as the recession in year 2001 is reasonably reproduced. However, there are some differences, especially in 1998 and 1999, which can be due to the quality coverage of the rainfall data.
(k) Model results – Stung Mongkol Borey
Mongkol Borey has a similar lack of recent data for rating curve generation as Sisophon and Stung Sreng. The rating curve produced (Fig. 3.37) may be inaccurate at high flow levels. Nevertheless the rated discharge has been plotted together with the observed discharge and the simulated discharge in Fig. 3.80. It is seen that the observed recession period after the 1998 and the 2001 monsoons as well as the rated recession period after the 1999 monsoon are reasonably reproduced. The peak values of the simulations are higher than the observations. It is, however, not possible to obtain information if the observations actually include the peak discharges.
(l) Model results – Stung Sangker
The fluctuations of the observed water levels at Stung Sangker lead to spikes in the rating curve (see Fig. 3.42 and 3.43). Therefore, the rated discharge has not been used for the comparison between simulated and observed discharges in Fig. 3.81. The simulated discharges match reasonably well with the observations, (see Fig. 3.81).
It should be noted that on the southern side of the lake, the sub-catchment of Stung Boribo has been calibrated first. The reason is that the water levels and the observed discharge make it possible to make a rating curve for a long period. The rated discharge for Stung Boribo leads to the idea that the catchments south of the lake and those to the north have different runoff characteristics. Hence it is assumed that Stung Sangker has similar model parameters as Stung Boribo.
IV - 19

Vol. II: Supporting Report, Paper IV: Development of Hydro-Hydraulic Model for the Cambodian Floodplains; WUP-JICA, March 2004
(m) Model results – Stung Dauntri
There are no water level data available in the period 1998-2001 except those observed during the discharge measurements in 2001. Although the catchment has a smaller slope than, e.g., the upper part of Stung Sangker catchment, it has been assumed that the model parameters be the same as those of the Stung Sangker.
Fig. 3.82 shows the simulated and observed discharge in Stung Dauntri. It is seen that there is a reasonable match between observations and simulations, although the peak is not captured. However, it is not possible to assess whether the peak is actually captured by the observations.
(n) Model results – Stung Pursat
The station used for Stung Pursat is located quite a distance upstream in the catchment. The location ensures that there is no backwater effect. Fig. 3.49 shows that the water levels at Bac Trakoun are fluctuating. Because several catchments on the south side of the lake have fluctuating water levels, it is judged that this fluctuation can not only be attributed to inaccurate measurements, but that the levels reflect a faster catchment response as well as a different rainfall pattern on the south side.
As a consequence the rated discharge (Fig. 3.50) has fluctuating discharges. However, the fluctuations are not reaching beyond the observed discharges, and it is judged that the rated discharge can be used for comparison with the simulated.
Fig. 3.83 shows the observed, the rated and the simulated discharge for Stung Pursat. It is seen that the general level as well as the recession during 2001 is well reproduced. In year 2000 the simulated spike in the discharges seem a bit too high, whereas the simulated discharge in year 2001 are somewhat too low. Since the model parameters are kept the same for each year, the only plausible reason for this is the observed rainfall. This is confirmed by the relative low average rainfall during 2001, see Fig. 3.65.
(o) Model results – Stung Boribo
As mentioned previously, the sub-catchments on the southern side of the lake exhibit larger fluctuations in water level and discharges. This is due to the local rainfall pattern in combination with the shape of the terrain.
As a demonstration of the model sensitivity to the choice of parameters, the Stung Boribo has initially been simulated with the same parameters as the Stung Chinit. The results are seen in Fig. 3.84. It is seen that the maximum levels are not reached and that the observed spikes in the discharge hydrograph are not produced. The explanation is that the choice of parameters favours interflow and base flow rather that overland flow.
From the rated discharges it is clear that a substantial proportion of the flow is direct catchment runoff, and also that the catchment has a short response time. This discharge pattern is also seen in ref. /3/, not only for Stung Boribo, but also for most of the catchments south of the lake.
The calibration results for Stung Boribo are seen in Fig. 3.85. It is seen that the observed runoff pattern is reasonably well reproduced by the model. Both the peaks and the recession pattern in year 2001 are well reproduced. For the other years, the
IV - 20

Vol. II: Supporting Report, Paper IV: Development of Hydro-Hydraulic Model for the Cambodian Floodplains; WUP-JICA, March 2004
recession period is less accurately simulated when compared to the rated discharge. A reason for this could be that the rated discharges are not accurate for the recession period. This can be seen in year 2001 where both observations and rated discharge are available. If the dry season flow for the years 1999 and 2000 should be increased, then it is necessary to have a larger rainfall volume. Otherwise, an increased dry season flow in the model will be on the expense of the direct runoff. It is therefore likely that not all rainfall is captured and that some rainfall stations in the hilly area of the catchment would improve this situation.
However, the calibration of the Stung Boribo shows that it is possible to reproduce the runoff pattern, which is characteristic for the catchments south of the lake.
(3) Remarks on Calibration and Application of the Rainfall-Runoff Model
The calibration of catchments in the Tonle Sap basin has firstly shown that the applied model concept is suitable for modelling the rainfall-runoff pattern. It has also shown that the runoff characteristics are different from the catchments north of the lake and the catchments south of the lake. Finally, the simulations have shown that model parameters can be transferred with reasonable accuracy to neighbouring catchments as long as this is done within the catchments on either the northern or southern side of the lake. For detailed model calibration, the parameters differ slightly among the catchments. It should be mentioned that for full validation of the rainfall runoff model, continued measurements of discharge is required and extended to cover also the rising part of the monsoon. Further, an improvement in the model calibration requires an increased accuracy of the rainfall data and data collected from as many stations as possible.
The catchments in Kandal, Prey Veng and Kompong Cham provinces do not have runoff measurements. Because of their small catchment slopes, they are likely to be more similar to the catchments north of the lake than those south of the lake. Hence model parameters for these catchments will be similar to those catchments.
In order to use the rainfall runoff model for generation of input to the river model, it is necessary to expand the calibrated sub-catchments around the lake to include the total sub-catchment areas. For example the sub-catchment area of Stung Sen represents the area at Kompong Thom. The catchment is somewhat larger, and the model needs to be re-run with an increased catchment size to provide inflow from the whole catchment.
Further it is necessary to include the sub-catchments, which have no measurements of tributaries discharges. Those catchments are the ones in Kandal, Kompong Cham and Prey Veng provinces. These sub-catchments will either be simulated with the model parameters used for the catchments north of the lake or with those of the southern catchments, dependent on the catchment characteristics.
The next subsection describes the computation of runoff from the sub-catchments to be used as input for the river model.
3.1.6 Computation of Runoff Input for River Model
The sub-catchment areas, which were used for the rainfall-runoff calibration, represent the areas at the gauged stations. Because runoff from the whole area of the catchments is needed, the rainfall-runoff model has been re-run with the total areas of the sub-catchments, but with the calibration parameters unchanged. The total area of the sub-catchments is approximately 37% larger than the sub-areas used for calibration. Therefore the total volumes of runoff is correspondingly higher. The runoff results are seen in Fig. 3.86 to 3.102. Besides the runoff from the sub-catchments, the
IV - 21

Vol. II: Supporting Report, Paper IV: Development of Hydro-Hydraulic Model for the Cambodian Floodplains; WUP-JICA, March 2004
direct rainfall/evaporation of the lake area is computed and included as input to the river model. This particular contribution is shown in Fig. 3.102.
Fig. 3.103 shows the sum of inflows of the tributaries to the lake itself. Thus the sub-catchments outside the Tonle Sap Lake catchment are omitted. It is important to realise that the total areas of the sub-catchments have been used for this computation, thus the area of the lake corresponds to the dry season area. In reality the surface area of the lake increases during the wet season, whereby some of the simulated catchment runoff should be direct rainfall on the lake instead. In the modelling it has not been attempted to model changing size of the sub-catchment areas. The reason for this is that the sum of the total runoff from the catchments and the total direct rainfall on the lake is the same whether the lake area is assumed to be that of the dry season or the wet season. This means that as long as the computed runoff and direct rainfall is only used as input to the hydraulic river and lake model the total inflow to the lake will be correctly represented. If the sub-catchment runoff is to be used for other purposes, the total runoff must be modified to account for the changing lake surface area.
3.2 Hydraulic River and Floodplain Model
The main model component of the WUP-JICA model is the hydraulic river and flood plain model. The rainfall-runoff model described in the foregoing chapter serves only to provide inflow to the river model from local rainfall and tributary runoff.
As described in Chapter 2, the construction of the WUP-JICA model takes offset in the model developed for the Chaktomouk Project, ref./1/. However, the latter was too simple for the purposes of the WUP-JICA study, and needed particular improvement on the description of the floodplains as well as the links between river and floodplains.
The present paragraph describes the data basis for the modelling, the discretisation of the model itself, as well as the calibration/verification of the model. The starting point is, however, a short description of the model concept.
3.2.1 Model Concept
This subsection describes briefly the model system applied and the model philosophy behind the actual model setup.
(1) Model System
The model system applied is MIKE 11, a one-dimensional mathematical model, which is generalised for modelling of flow in rivers, canals, flood plains, lakes and estuaries. The model has been continuously developed and maintained since the mid-eighties by DHI - Water & Environment, Denmark. The model package includes modules for rainfall-runoff, flood forecasting, transport of dissolved substances, water quality, sediment transport. The model system was developed for Windows and the applied 32-bit compiler technology makes the system fast and efficient. The system has interface to ArcGIS, which is used for creation of floodmaps.
MIKE 11 is one out of a series of model systems developed at DHI under the shell termed MIKE Zero. Other systems include MIKE 21 for two-dimensional flows, MIKE 3 for three-dimensional flows, MIKE SHE for detailed simulation of the hydrological cycle, MIKE Basin for overall water resource planning simulations, just to mention some. One of the prime assets of the MIKE Zero system is that the models are dynamically interfaced, meaning that models can be constructed with elements of them all. For example a model consisting of a one-dimensional (MIKE 11) and a two-dimensional (MIKE 21) part can be
IV - 22
Vol. II: Supporting Report, Paper IV: Development of Hydro-Hydraulic Model for the Cambodian Floodplains; WUP-JICA, March 2004
set up for a river-floodplain system in which both one- and two-dimensional flow phenomena are important, and hence run simultaneously.
(2) Actual Model Setup
The river and flood plain system consisting of Mekong, Bassac, Tonle Sap River and the lake including the adjacent flood plains is a complex hydrological and hydraulic water body. The description of the transients in flow over a hydrological year is not possible by means of simple tools and approaches. The process of evaluating and properly understanding the water system starts with a detailed model, which is calibrated/validated against direct observations, and ends eventually with a simpler approach derived from the results of the detailed model.
An example of this is a water balance of the Great Lake. Rainfall data are daily, and the response time of the sub-catchments is within hours or days. If we model such a system using monthly averaged data we may loose important information in our description and understanding of how the exchange of flows between rivers and flood plains occurs. The response of the main river system is also within days. Thus in order to properly describe the dynamics of the system, the model should operate on a daily time scale, at minimum. In the present system the tide has effect far distances upstream in the system. For accurate model description during the dry season, it is therefore important to resolve the tidal variation, which basically means that the model system should operate on a time scale, which is less than one hour.
The spatial scale of a model system of the Mekong is likewise important. Obviously the spacing between the computational points should allow for a correct description of the travel time of a water wave in the system. But certain elements such as bridges, location of interconnecting channels etc. are also important to include in the model. The flood plains between the main rivers Mekong, Bassac and Tonle Sap River must be described in a way that allows for flow exchange with the main river. In order to give correct local depths and discharges on the flood plains, and also correct changes in discharge along the main stream the exchange locations (links) must resemble the real system. It is not necessary to include every bridge and culvert, but links should be established at least between locations on mainstream where measurements exist, and also at locations where it is know that the major portion of the flow exchange occurs.
The actual model setup includes the Mekong from Kratie in Cambodia to Tan Chau in Vietnam, the Bassac from Phnom Penh to Chau Doc in Vietnam, the Tonle Sap River and the lake. The set up includes the river channels as well as the surrounding flood plains.
A significant portion of the available time for modelling in the project has been devoted the collection and evaluation of topographical, infrastructure, and hydrological/hydraulic data for proper schematisation. This is necessary for a proper model calibration/verification and hence its applications.
The following subsections describe the data of individual model elements of the river and floodplain model.
3.2.2 Topographical and Structural Data
(1) Topographical Data
The model established covers the Mekong-Bassac-Tonle Sap Rivers and Tonle Sap Lake from Kratie on the Mekong to Tan Chau and Chau Doc on the Mekong and Bassac respectively. The model covers the river channels and associated flood plains.
IV - 23

Vol. II: Supporting Report, Paper IV: Development of Hydro-Hydraulic Model for the Cambodian Floodplains; WUP-JICA, March 2004
The data sources for the topography are from different periods in time and have different accuracy. Table 3.6 presents the available sources for topographical/cross-sectional data. Not all of these data were used for the modelling since they have different accuracy and reliability. Table 3.7 shows the actual data that has been selected for the modelling.
Table 3.6 Sources of Topographical Data Applied for Various Parts of the Model
Mekong River from Kratie to Tan Chau; Tonle Sap River; Bassac River
Cambodian Hydrographic Office (CHO) survey, 1998
Tonle Sap Lake 1999 CHO survey for the lake Philippine Map (1963), for the floodplains
Floodplains in the Cambodian Delta Sogreah Map (1963)
(a) Rivers
The source of data for the river cross sections has been the bathymetrical surveys carried out by the Cambodian Hydrographic Office (CHO) in 1998. The outcome of the survey was hardcopied survey maps, which are located in the Documentation Centre of the MRCS. The accuracy of the survey maps is judged to be good. The resolution in the data along and across the rivers is acceptable. The shortcoming of the data source is that it is solely a water survey, hence the river bank levels are not included in the transects. On the maps there are spot heights in the vicinity of the river, but they are only given at 1-m level intervals and the measurement locations are not very close. However, the spot levels are the best recent indication of the near bank heights, and also judged to be more accurate than the maps from the Canadian Colombo Plan data source.
At the initial stage of the project there was some uncertainty regarding the accuracy of the cross-sectional data of the Bassac River. Also it was argued that large differences existed between the general topography levels in Vietnam and Cambodia in the vicinity of the border. In order to come to this uncertainty closer, a leveling campaign from Hatien to Kompong Loung through Chau Doc and Prek Kdam was carried out in 2001. Cambodia being lower than Vietnam, the main conclusion from the survey was that the maximum difference between the levels in Cambodia and Vietnam is 0.25 m. On this ground it was not found worthwhile to change the cross sections in the Bassac River or anywhere else, as there would still remain some questions regarding the adjustment at different locations.
(b) Tonle Sap Lake
Merging of two data sources has derived the topography for the Tonle Sap Lake: the CHO survey in 1999 and the Philippine Map from 1963. There seems to be no major inconsistency between the two data sources in relation to datum levels, since there is a smooth transition from plain to lake. The merged data set has been used to derive topographical information in parallel cross sections with spacing of 2 km, see Fig. 3.104.
Based on the merged data sets a level-volume and a level-area relation have been derived for the lake as a whole. The result is shown in Fig. 3.105, and the numbers are given in Table 3.8 below. Different attempts have been made in the past for deriving such curves (e.g. ref./7/), but the present is the first one to combine a complete bathymetry survey of lake with the topography of the floodplains. The southern border of the lake is assumed to be located at Kompong Chhnang.
IV - 24

Vol. II: Supporting Report, Paper IV: Development of Hydro-Hydraulic Model for the Cambodian Floodplains; WUP-JICA, March 2004
Table 3.7 Relation between Elevation (Hatien MSL) and Surface Area and Volume of Tonle Sap Lake Elevation Area (km2) Volume (MCM)
0.5 0 0 0.6 21 1 0.8 666 70 1.0 1,379 274 1.2 1,874 600 1.4 2,125 999 1.6 2,325 1,444 2.0 3,611 2,631 3.0 4,671 6,772 4.0 5,828 12,022 5.0 7,218 18,545 6.0 8,518 26,413 7.0 9,690 35,517 8.0 10,935 45,830 9.0 12,198 57,397
10.0 13,352 70,172 11.0 14,330 84,013 12.0 15,243 98,800
(c) Floodplains
Contour lines of the various data sources covering the floodplains are shown in Fig. 3.106. From the plains along the Mekong, Tonle Sap and Bassac rivers, the Sogreah Data (1963) are the most reliable. From the Sogreah data of the Cambodian Delta, a Digital Elevation Model (DEM) with a grid cell size of 100 by 100 meters has been created.
Besides the DEM, the JICA map, ref./2/, produced for the Ministry of Transportation, has been used to obtain important information on the floodplains. This information is, for example, location of embankments and roads, location of connected wet areas, location and extent of natural embankment lowering, etc.
(2) Structural Data
(a) Bridges
The large bridges crossing the main rivers are the Koizumi Bridge in Kompong Cham, the Chrui Changvar Bridge on the Tonle Sap River and the Monivong Bridge on the Bassac River. The pillars of these bridges diminish the cross section area of the river at those locations besides with the effect of increasing the water levels upstream of the bridges as well as the velocities at the bridges. These bridges do not act as control points in the same manner as the bridges on the flood plains, as the flow is confined to the river channels. Opposite to this the bridges on the flood plains act as entry/exit points for flow to and from large inundated areas. Data for the large bridges have on the above grounds not been obtained for the modeling.
The bridges in the model area have either been incorporated individually in the model or lumped together with other bridges. The bridges which are described individually comprise important flow control points, and discharge have been measured at these sites during the 2001/2002 monsoons through the TSLV Project, ref./9/.
IV - 25

Vol. II: Supporting Report, Paper IV: Development of Hydro-Hydraulic Model for the Cambodian Floodplains; WUP-JICA, March 2004
The position of the other bridges in the area as well as width has been observed through the TSLV Project, ref./9/. For the modelling purpose these bridges have been lumped together at appropriate locations along the main stream. The locations of the lumped bridges correspond largely to the observed entry/exit point of water between the rivers and the flood plains.
The bridges that have been included individually in the model area are:
(i) Bridge No.14, 17, 23 and 24 on Road No. 6
(ii) Bridge F1, F2, No. 2 and F3 on Road No. 6
(iii) Moat Khmung Bridge on Road No. 7 near Kompong Cham
(iv) The bridge on the stream Dac on Road No. 70 (near Boeng Thom Lake)
(v) The bridges on the tributaries Prek Banam, Stung Sloat, Prek Ampil on the floodplain close to Neak Luong
Fig. 3.107 show the location of these bridges. The remaining bridges are more than 100 and are scattered around the area along the banks of the Mekong.
Table 3.9 below shows the key data needed for the modeling on the above-mentioned bridges.
Table 3.8 Key Data on Important Bridges in the Study Area Bridge Width (bottom/top) Invert Level Top Level
14 120 - - 17 36 - - 22 112.0 / 122.0 5.7 10.79 23 61 - - 24 72.0 / 84.0 2.75 11.46 F1 43.5 / 53.5 7.60 11.60 F2 39.0 / 53.5 6.60 11.60
No. 2 149.4 / 156.4 6.63 11.63 F3 33.5 / 53.5 5.10 11.60
Moat Chumming 140.0 / 210.0 4.00 16.90 Spean Dach 120.5 - -
Bridge A4, Prek Banam 122 - - Bridge A1, Stung Sloat 146 - - Bridge A2, Prek Trabek 62.5 - -
The main source of information for the bridges has been the road improvement projects carried out by JICA in recent years, ref./10/ and ref./11/. From the reports and design drawings of these projects, it has been possible to achieve information about the bridges and embankment heights along National Road No. 6, 6A and 7. The bridges on Road No. 6 are important control points for the flow between the Mekong and the Tonal Sap rivers.
Through the TSLV Study, ref./9/, information about the width of the various bridges connecting the Mekong with the right and left bank flood plains has been obtained. Likewise, information on bridge dimension on tributaries of the Mekong left bank flood plain south of Neak Loung has been obtained through the TSLV study.
IV - 26

Vol. II: Supporting Report, Paper IV: Development of Hydro-Hydraulic Model for the Cambodian Floodplains; WUP-JICA, March 2004
3.2.3 Hydraulic Data
The hydraulic data necessary for the modelling is divided into data for boundary conditions and data for internal model calibration. At the model boundaries either water levels or discharges are needed. For internal model calibration/verification of a system like the Mekong-Bassac-Tonle Sap both water levels and discharges are needed.
The data examined are from 1998-2002. Water levels have been obtained from the Hymos Database (MRCS) and DHRW. The discharge measurements available are the ADCP/ADP measurements from campaigns carried out during 2000, 2001 and 2002. Table 3.10 show the stations from which data are available. Besides the ADCP/ADP discharges mentioned in Table 3.10, the ADCP discharges measured during the WUP-JICA study in year 2002 have also been used. The accompanying paper on hydrological monitoring describes those data thoroughly. Fig. 3.108 shows the location of the stations mentioned in Table 3.10.
Table 3.9 Stations with Data in the Period 1998-2002
Station Name Station Code Water Levels ADCP Discharge
ADP Discharge
Conventional Discharge
Kratie 14901 1998-2002 - - - Kg.Cham 19802 1998-2002 2000 2001 -
Chruy Changvar 19801 1998-2002 2000 2001 - Koh Norea - - 2000 2001 -
Neak Loung 19806 1998-2002 2000 2001 -
Tan Chau 1998-2001*, 2002 - - 1998-2001 *
Kompong Luong - 1998-2001 - - - Kompong Chhnang - 1998-2001 - - -
Prek Kdam 20102 1998-2001 2000 2001 - Phnom Penh Port 20101 1998-2002 2000 2001 -
Bassac Chaktomouk 33401 1998-2002 2000 2001 -
Koh Khel 33402 1998-2001 2000 2001 -
Chau Doc 1998-2001 *, 2002 - - 1998-2001 *
Spean Tras (No.2 bridge, road 6) - 2001-2002 - - 2001-2002
Note *: Hourly Data
3.2.4 Water Use Data
Water use data is one of the elements of the hydrological cycle, which lacks most in Cambodia. The WUP-JICA Team has not come across any data or study newer than those produced through the Irrigation Rehabilitation Study in Cambodia (Halcrow 1994).
On basis of the 1994 study, a simple estimation of the water usage for irrigation has been made. The estimation gives for each province in the basin a total required flow rate (in m/s) on a monthly basis. The flow rates are the water requirement minus the water returned to the river. The result of the estimation is seen in Table 3.11.
IV - 27

Vol. II: Supporting Report, Paper IV: Development of Hydro-Hydraulic Model for the Cambodian Floodplains; WUP-JICA, March 2004
Table 3.10 Estimated Water Abstraction for Irrigation (m3/s) Province/month Jan Feb Mar Apr May June July Aug Sep Oct Nov DecBanteay Meanchey 0.1 0.2 0.2 0.1 2.5 9.8 9.3 7.7 0.6 0.0 0.0 0.1Battambang 0.8 1.1 1.1 0.2 6.5 25.7 24.4 20.5 1.6 0 0 0.5Pursat 0 0 0 0 1.2 4.6 4.4 3.7 0.3 0 0 0Kompong Chhnang 1.1 1.5 1.6 0.4 1.6 6.1 5.7 4.8 0.4 0 0 0.7Kompong Speu 1.1 1.6 1.7 0.4 5 19.9 18.9 15.8 1.2 0 0 0.7Takeo 65.3 87.1 94.7 22 3.4 13.4 12.7 10.6 0.8 0 0 38.6Kandal 33.3 44.3 48.2 11.2 3.2 12.4 11.8 9.8 0.8 0 0 19.6Prey Veng 27.2 36.2 39.4 9.1 2.2 8.7 8.2 6.9 0.5 0 0 16Kompong Cham 5.2 7 7.6 1.7 6.6 26 24.7 20.7 1.6 0 0 3.1Kompong Thom 2.2 2.9 3.1 0.7 8.9 35.2 33.3 27.9 2.1 0 0 1.3Siem Reap 18.4 24.6 26.7 6.2 3.9 15.3 14.5 12.1 0.9 0 0 10.9
The actual location and size of the individual irrigation schemes is not needed for the modelling. Hence the flow abstraction rates in Table 3.11 have been applied at estimated locations in the various river branches. The abstraction rates are assumed to be applicable for each of the years simulated.
3.2.5 Other Data
(1) Satellite images
For verification of the hydraulic river and flood plain model, processed satellite images showing flood extent at different periods is useful. Such data exist at MRCS, in the Technical Support Division’s GIS Database. The data within the years studied comprise RADARSAT images consisting of:
Dry season image of March 16 & 26, 1999 Early flood image of September 24, 1999 Peak flood image of October 21 & 25, 1999 Early flood image of August 25 and September 4, 2000 Peak flood image of September 23 and October 5, 2000 Post flood image of October 19 & 22, 2000 Early flood image of August 30, 2001 Peak flood image of September 23, 2001 Post flood image of October 17, 2001
3.2.6 Model Area and Schematisation
This subsection describes the schematisation of the river model on the basis of data described in the foregoing subsection.
(1) Topographical Model Elements
(a) Rivers
The hydrographic survey maps described in the previous section were digitised as part of the Chaktomouk Project, ref./1/, and incorporated in the MIKE 11 model at that time. The cross sections have been used unchanged for the present study. The cross sections cover the Mekong from Kratie to Tan Chau, the Tonle Sap River and the Bassac from Phnom Penh to Chau Doc.
IV - 28

Vol. II: Supporting Report, Paper IV: Development of Hydro-Hydraulic Model for the Cambodian Floodplains; WUP-JICA, March 2004
(b) Tonle Sap Lake
From the lake data described in Subsection 3.2.1, cross-sections covering the entire width of the lake and plain have been extracted for every 2 km in parallel lines. These cross sections have subsequently been incorporated into the cross sectional database of the MIKE11 model and used for the modelling. This activity is an improvement of the model compared to the Chaktomouk Project, ref./1/. In the Chaktomouk Project, the lake was modelled with artificial cross sections in up- and downstream end. The cross sections were derived by the use of a level-area relation for the lake as a whole made by Nedeco, ref. /8/. In the present study the lake is still modelled as a single branch, but the number of cross sections and the accuracy of those have increased. The improvement of the lake cross section is necessary for accurate production of maps of flood extent.
(c) Floodplains
The floodplains surrounding the main rivers in Cambodia are inundated every year during the monsoon. The floodplains serve as storage of floodwater during the rising and main period of the monsoon, and release the water to the river system again during the recession period of the monsoon. Besides this, the floodplains in Cambodia serve to convey flow between the main rivers as well as between the floodplain compartments.
The functioning of the floodplains is not completely understood, mainly due to lack of data. It is not the main focus of the present study to understand and analyse the functioning of the floodplains. However, the discretisation of the floodplains is made as accurate as possible for description of the flow, exchange and storage mechanisms. By doing so the model can easily be used for detailed studies on the floodplains.
It is clear from the available data that there is a significant slope of the surface level on the floodplains. This is concluded from the gradient in water levels on the mainstream during the periods in which floodplains and rivers are connected. Further, the TSLV study, ref./9/, in which water levels at 20 stations on the floodplains were observed, concludes that there is a noteworthy water level slope on the floodplains. With a slope on the plains it follows that there is a flow across the plains. The velocity of this flow will be lower than the velocity in the main stream. Two conclusions can be made on this basis: one is that the rivers and floodplains must be dealt with and described separately with appropriate links to the main river system. The other is that a simple flood cell approach in which the flood plains are assumed to have horizontal water level slope is not suitable. There will naturally be parts of the floodplains that can be assumed to have a horizontal water level and which exchanges flow with the river system at single locations such as bridge openings and smaller channels. Such area can be modelled with the flood cell approach. However, the major part of the floodplains convey flow and it is necessary to construct a system of channels in a quasi-two-dimensional network in order to correctly model the flow on the plains as well as the exchange of flow with the river system.
The floodplains have been schematised as branches, which are linked together and also with the river channels in a looped network. For the delineation of the various compartments of the floodplains, the map prepared by JICA for the Ministry of Transportation has been extremely useful. From the map it was possible to point out individual floodplain areas, the locations of embankments separating the individual flood plains and also to determine the location of connecting points with the main
IV - 29

Vol. II: Supporting Report, Paper IV: Development of Hydro-Hydraulic Model for the Cambodian Floodplains; WUP-JICA, March 2004
rivers. The TSLV Study, ref./9/, has obtained information about dimensions, flow direction and significance of approximately 100 bridges located on the channels which link the main rivers with the flood plains. This information has been used in the present WUP-JICA study to improve the description of the floodplains and the links to the main river system.
From the DEM derived on basis of contour lines, a number of cross sections for description of the floodplains have been extracted and distributed on the quasi-two-dimensional network of floodplains. Fig. 3.109 shows the DEM with the location of the cross sections extracted overlaid.
Fig. 3.110 shows in more detail the network on the floodplains as well as the location and extent of the cross sections.
Fig. 3.111 show in detail the schematisation of river and floodplain branches together with cross sections for the area around Phnom Penh.
(d) Bridges
The bridges mentioned in the previous paragraph have been schematised in the model with the information available on width, slide slopes, invert level, top level from the design drawings in ref./10/ and ref./11/. At the locations in the model where bridges are introduced, the flow equations are substituted with an energy equation thus providing a head loss.
(2) Model Setup
The model elements described in the previous section form together the topographical/structural part of the MIKE 11 river and floodplain model.
The model contains altogether 73 branches. Each branch has a number of cross sections depending on the available data and on the need for resolution. Altogether 643 cross sections have been implemented and distributed on the river network as seen below.
Table 3.11 Number of Branches and Cross Sections in the
MIKE 11 Model Set-up Location No. of Branches No. of Cross Sections
Mekong 1 168 Bassac 1 32 Tonle Sap River 1 88 Tonle Sap Lake 1 115 Floodplain channels 18 161 Channels linking flood plains and rivers 42 84
Other Channels 9 18 Total 72 666
MIKE 11 uses a staggered grid, meaning that water levels and discharges are computed alternately. Cross sections are located in computational points for water levels. It is possible to introduce more computational points between two cross sections. In that case the hydraulic parameters (area, width, hydraulic radius, conveyance, etc.) are computed by linear interpolation of the nearby cross sections. The total number of computational points in the model amounts to 1,214. At present there has been no attempt to optimise the model
IV - 30

Vol. II: Supporting Report, Paper IV: Development of Hydro-Hydraulic Model for the Cambodian Floodplains; WUP-JICA, March 2004
set-up, i.e., to reduce the number of cross sections and computational points while maintaining the accuracy of the model.
A plan view of the model schematisation of the river and flood plain network is seen in Fig. 3.112. The longitudinal profile covering Tonle Sap Lake and Tonle Sap River down to Phnom Penh is also presented in Fig. 3.112. Finally a few selected cross sections from the river system are shown in Fig. 3.112.
Fig. 3.111 shows the layout of the river and floodplain branches including the locations of cross sections in the area between the Mekong and Tonle Sap rivers near Phnom Penh. On the figure the location and extent of the cross sections are seen as orthogonal lines to the branches. Computational points are marked with dots.
(a) Catchment delineation for rainfall-runoff modelling
The computation of rainfall-runoff from the sub-catchments has been described in Section 3.1. The simulated runoff serves as an input to the river and floodplain model. The computed inflow is transferred to the river model in either a single computational point (e.g. the tributaries around the Great Lake), or over a longer reach (which is the case for floodplains).
Fig. 3.113 shows in a schematic presentation of which part of the sub-catchment-runoff enters the river model at single points, and which areas have distributed inflow.
(b) Boundary conditions
The river and floodplain model needs boundary conditions at upstream and downstream ends. These boundary conditions are either water level or discharges dependent on availability. Fig. 3.114 shows the model layout with indication of the boundary location and type. The following boundary conditions are applied:
Kratie : Upstream boundary on the Mekong. Due to lack of discharge data, a water level boundary has been applied. Daily values were used.
Great Lake : The boundary condition at the upper end of the lake was covered by the runoff from sub-catchments Sisophon and Mongkol Borey.
Tan Chau : Downstream boundary on the Mekong. Hourly water levels were applied.
Chau Doc : Downstream boundary on the Bassac River. Hourly water levels were applied.
Flood Plain Tributaries : The 6 branches of the floodplain in the model near the Vietnamese border were all described with a daily water level boundary.
These branches cover in extent not only the known channels (e.g. Prek Trabaek), but also the surrounding floodplain. It has not been possible to obtain water level data for all of these locations. A time series of daily water level has only been obtained
IV - 31

Vol. II: Supporting Report, Paper IV: Development of Hydro-Hydraulic Model for the Cambodian Floodplains; WUP-JICA, March 2004
from Xuan To, which is on the right bank floodplain of the Bassac River. A comparison of the water levels here with those of Tan Chau and Chau Doc clearly showed that there is a water level slope between the stations. Through the information from the Vietnamese analysis of the 2000 flood, ref./12/, it was confirmed that a pronounced water level slope exists on the floodplains from east to west along the border to Cambodia. Using this information together with the observed water levels at Xuan To, Chau Doc and Tan Chau led to the derivation of the water levels at the remaining boundaries by using linear interpolation.
Fig. 3.115a, 3.115b and 3.115c show the water level boundary conditions applied for the period 1998-2001.
Besides the boundary conditions at the ends of the branches, the model has lateral inflows (internal boundaries) from the tributaries around the Great Lake as well as from Stung Chhlong and Prek Thnoat. Further, the direct rainfall on the Great Lake and on the floodplains are internal boundary conditions for the model.
3.2.7 Calibration and Verification of the River Model
The river and floodplain model has been calibrated for year 2000, and verified for the years 1998, 1999 and 2001. The boundary conditions for the simulations have been presented in the previous section.
In general the roughness coefficient (Manning number) in the system is the main calibration factor, and is usually adjusted until an acceptable result is achieved on water levels and flow distribution (in case of a bifurcated system). In the present model system the upstream boundary condition is a water level boundary. The model then computed the discharge at the upper boundary using the information on roughness coefficient and the flow equations. The inflowing discharge is thus dependent on the choice of roughness coefficient (Manning number). However, it is fortunate that discharge measurements exist downstream on Mekong mainstream at Kompong Cham, since there is no major loss of water from Kratie to Kompong Cham. The approach adopted herein is therefore: to apply the observed water level at Kratie as the upper boundary, adjust the roughness coefficient until both water level and observed discharge at Kompong Cham are acceptable.
In most calibration situations, the water balance (e.g. in a bifurcated system) is obtained first. Hereafter the water levels are matched. In the present system there are complications which in using this approach. The main reason is that the invert levels of many bridges and tributary streams in the model area are not known. The bridges and streams carry water to the floodplains from the mainstream, and are therefore important for the water balance. But the magnitude of the water diverted is dependent on the invert level and on the water level in the mainstream, which in turn is dependent on the roughness coefficient. Moreover the diverted volume will adjust the water levels in the mainstream. The calibration task therefore becomes an iterative process where invert levels and roughness coefficients are adjusted until both water balance and water levels are matched. The only guide at hand are the ranges that can be set for invert level variation and variation of roughness coefficient.
(1) Results
(a) Discharges
The simulated and observed discharges for the years 1998-2001 are seen in Fig. 3.116 to 3.120. Discharge measurements first started in year 2000, but the years 1998-1999 are plotted for comparison and because water levels exist for the entire period 1998-2001. In general the simulated discharges match well the measured discharges. It should be mentioned that there are only few discharge measurements
IV - 32

Vol. II: Supporting Report, Paper IV: Development of Hydro-Hydraulic Model for the Cambodian Floodplains; WUP-JICA, March 2004
available in year 2000, although they are taken as important points in time, i.e. before, under and after the monsoon.
The discharges match in the mainstream of Mekong as well as in the Tonle Sap and Bassac rivers. Hence the model is able to reproduce the diversion of the flow into the floodplains along the Mekong as well as the flow reversal of the Tonle Sap River. The diversion of the flow into the plains is clearly seen from the time series on Fig. 3.116 top and middle. Note that the diverted discharge is almost zero in the dry year 1998. The flow reversal in Tonle Sap River is seen on Fig. 3.118 top and middle.
Only in 2001 that discharge measurements started to be made on the tributaries on the floodplains. The most important location for flow exchange between Mekong and Tonle Sap rivers is Bridge No. 2 on Road No. 6. The bridge crosses here the river Tras, and is therefore also called Spean Tras. Fig. 3.118 bottom show the simulated and observed discharge at this bridge. It is seen that the flow from Mekong to Tonle Sap (positive values) is accurately reproduced. The flow reversal at this site is not accurately reproduced (negative flow).
Hourly discharge measurements are available for Tan Chau and Chau Doc for the years 1997-2001. The downstream boundary condition on the Mekong in the model is water level at Tan Chau. Thus a verification of the model is a comparison between simulated and observed discharges at Tan Chau. The tidal effect is mostly pronounced in the dry season, where the largest effect is in April. A comparison between observed and simulated discharge in the month of April is made for 1999 and 2000, see Fig. 3.119 and 3.120. It is seen that the magnitude of the discharge in both directions is reasonably reproduced. The simulation results are somewhat more accurate in 2000 than in 1999.
(b) Water levels
The simulated and observed water levels are shown in Fig. 3.121 to 3.123. It is seen that both water levels in the main stream Mekong as well as the Tonle Sap are accurately reproduced (see Fig. 3.121, Fig. 3.122 middle and bottom, and Fig. 3.123 top).
The water level in the Great Lake (at Kompong Luong) is also reasonably well reproduced, see Fig. 3.122 top. This shows that the topography of the lake is well described in the model and also that the total inflowing volume during the wet season is reproduced.
The water level at Koh Khel in the Bassac River is not well reproduced (see Fig. 3.122). Because the discharges are well reproduced (see Fig. 3.117 bottom) and that both discharges and water levels at Bassac Chaktomouk are well simulated, the reason for this can be attributed to the measured water level itself or the river geometry at this location. The river has a local highly elevated bottom in the area of Koh Khel, which may account for some of the water level difference if the river has scoured since 1998. Moreover, the river cross-sections are not accurate between the bank top and the riverbed. Lastly, the discharge measurements may be inaccurate. In any case the poor match is not so important because the flow distribution at the junction is accurately reproduced.
IV - 33

Vol. II: Supporting Report, Paper IV: Development of Hydro-Hydraulic Model for the Cambodian Floodplains; WUP-JICA, March 2004
(c) Flood Extent
The flood extent is estimated by the use of satellite images (RADARSAT) of the Mekong River and Delta. In the present WUP-JICA study the images have been used to verify that the simulated flood extent is matching the observed extent. In the present study it has not been attempted to accurately model the flood depths and flood plain function in detail. The parallel TSLV study was devoted to this task.
However, a comparison between simulated and observed flood extent for the years 2000, 1999 and 2002 has been made (see Fig. 3.126a, 3.126b and 3.126c respectively). It is seen that the extent of the flooding is well reproduced for the peak flood in year 2000 (Fig. 3.126a). The flooded area caused by backwater effect in Stung Sen at Kompong Thom is not reproduced, since this river is not schematised as a river branch.
The flood extent of year 1999 was smaller than the extreme flood of 2000. The simulated and observed flood extent of the peak flood is seen in Fig. 3.126b. It is seen that in general there is a good match between observations and simulations.
The model verification on year 2002 has already been made (see next section). Through the TSLV project satellite images have been acquired on monthly intervals throughout the monsoon season. The images do not cover the entire lake (see Fig. 3.126c). The model predicts well the dynamics of the flood extent throughout the monsoon. As an example from the TSLV project the observed and simulated flood extent on the 14th of October 2002 is shown in Fig. 3.126c.
(d) Verification on year 2002
Model verification has been carried out for year 2002. The WUP-JICA Team carried out Intensive discharge measurements using ADCP in year 2002. The measurements were carried out on weekly or bi-weekly basis and covered a number of stations along the Mekong, Tonle Sap and Bassac rivers.
Besides being used for construction of discharge rating curves, the measurements were extremely useful for verification of the river model. The reason is that a more detailed picture of the flow conditions in space and time has been obtained.
Through the TSLV project, the model was refined to better describe the flow between rivers and floodplains, and to describe the flood plains in more detail. Hence link channels between rivers and floodplains as well as the floodplain schematisation has been updated. The updated model represents an improvement of the previous setup reported in ref./5/. Because the 2002 monsoon data was used for calibration of the model in the TSLV project, those data could not be used for verification. The updated model was run for the year 2000, which is considered the main calibration event until now. Since it gave acceptable results, it was subsequently used for verification for years 1998, 1999 and 2001. The results were discussed in the previous paragraph.
The simulation results for year 2002 from some of the important stations in the system are presented in Fig. 3.124 and 3.125. It is seen from Fig. 3.124 (top) that a good match between observed and simulated discharge exists at Kompong Cham. This confirms that the water level at Kratie can be applied as a boundary condition, and also that the roughness of the river between Kratie and Kompong Cham is accurately described.
IV - 34

Vol. II: Supporting Report, Paper IV: Development of Hydro-Hydraulic Model for the Cambodian Floodplains; WUP-JICA, March 2004
Likewise the discharge results at Chrui Changvar, Koh Norea, Monivong Bridge and Phnom Penh Port are well reproduced [see Fig. 3.124 (bottom)]. These model results demonstrate that the model can represent the unique flow dynamics and the balance of the Chaktomouk junction.
Fig. 3.125 (top) shows the simulated and observed discharge at Prek Kdam and Phnom Penh Port. The figure shows that the model predicts well the flow dynamics at these two stations. An interesting detail is that the model predicts well the observed transition period in which flow is towards Chaktomouk at Phnom Penh and towards the Great Lake at Prek Kdam (around end of September).
There are significant changes in discharges in the Bassac River from Monivong Bridge to Koh Khel [see Fig. 3.125 (middle)]. The reason is that flow is diverted into the floodplains (mainly via a tributary of Prek Thnot and the numerous colmatage canal systems). It is seen that the diverted flow is not returned to the river along this reach.
The model predicts the hydraulic conditions well at various scales. As an example of a smaller scale discharge (in comparison with the Mekong discharges), the simulated and observed discharge at Spean Dach (Bridge Dach on the embankment of Road No. 70 near Kompong Cham) is shown in Fig. 3.125 (bottom). Compared to the flows in the main river system, flows occur in a shorter time frame through the bridge. It is seen that there is an excellent match between observations and simulation results. The implication of this is that the water balance and flood extent on the floodplain in the Beung Thom area (upstream of Spean Dach) can be accurately simulated.
IV - 35
Vol. II: Supporting Report, Paper IV: Development of Hydro-Hydraulic Model for the Cambodian Floodplains; WUP-JICA, March 2004
4. CONCLUSION
A hydrological and hydraulic model has been developed as part of the WUP-JICA project The model is a refinement and significant improvement of the MIKE 11 developed for the Chaktomouk project, ref./1/. In parallel with the WUP-JICA project, the Tonle Sap Lake & Vicinities project TLSV Project), ref./9/, made use of the same model. Since hydrological and infrastructural data were collected in both studies, both projects contributed to a continuous model improvement, and the model was as such useful for both projects.
The established model consists of: (1) a rainfall-runoff sub-model; and (2) a river and lake model. The primary purpose of the rainfall-runoff model was to provide input to the hydraulic model of the rivers and lake system. The work presented herein has shown that it is possible to establish a sub-catchment based rainfall-runoff model for Cambodia, despite the lack of long records of good data.
The model has demonstrated in quantitative terms the complex hydraulic behaviour of the Mekong river system and associated floodplains in Cambodia. The hydraulic behaviour for the years 1998-2002 has been studied, which years contain both extreme dry and extreme wet hydrological years. Over those years an increasing amount of data has become available and been collected. The number of rainfall stations has increased significantly in Cambodia since year 2000. Particular improvement in discharge data has been obtained from the WUP-JICA study in 2002. In 2002 a comprehensive measuring campaign collecting discharges and water levels in the floodplains has been obtained in connection with the TSLV Project, ref./9/. Together with monthly satellite images of flood extent at monthly intervals as well as the WUP-JICA ADCP discharge measurements, the combined data set represents the most comprehensive collection to date. These data have been of profound value for the modelling work.
The model developed is able to simulate the dynamics of the flows and water levels in the river system in wet and dry season, the water levels and inundation on the floodplains, as well as the exchange of flows between rivers and flood plains. The model is therefore very useful for a variety of studies such as: flood analysis, flood impact studies, water balance studies, and dry-season flow investigations.
IV - 36

Vol. II: Supporting Report, Paper IV: Development of Hydro-Hydraulic Model for the Cambodian Floodplains; WUP-JICA, March 2004
REFERENCES
/1/ DHI Wate,r & Environment in association with HAECON N.V. for the Mekong River Commission, funded by the Government of Japan: A Comprehensive Study on the Chaktomouk Area, Environment, Hydraulics and Morphology, Phase 1, 2002
/2/ Ministry of Public Works and Transport: JICA Map of Cambodia, 1:100.000, 1997
/3/ J.P Carbonnel and J. Guiscafre. Ministiere des Affaires Etrangeres, Gouvernement Royal du Cambodge: Grand Lac du Cambodge. Sedimentologie et Hydrologie, 1962-63
/4/ Le van Sanh, Phnom Penh: Mission Report, Analysis of Hydrological Data at Stations around the Great Lake and on Mekong, Bassac Rivers in 1960s and from 1998 to 2001, June 2002
/5/ The Study on Hydro-Meteorological Monitoring for Water Quantity Rules in Mekong River Basin. WUP-JICA Progress Report , February 2002.
/6/ World Meteorological Organization , Operational Hydrology, Report No. 13: Manual on Stream Gauging, Volume II, Computation of Discharge,1980
/7/ Sogreah: Mathematical Model of Mekong Delta, Comprehensive report of the different determinations on the Grand Lac Capacity, Cambodia., February 1999
/8/ Cambodia National Mekong Committee: Final Report, Volume 1: Main Report, Natural Resource-Based Development Strategy for the Tonle Sap Area, Cambodia, May 1998
/9/ CTI Engineering International Co., Ltd. and DHI- Water & Environment: Main Report; Consolidation of Hydro-Meteorological Data and Multi-functional Hydrologic Roles of Tonle Sap Lake and its Vicinities (Basinwide), August 2003.
/10/ JICA: Basic Design Study Report on The Project for Rehabilitation of National Roads Route 6 and 7 in The Kingdom of Cambodia, Prepared by Oriental Consultants Co. Ltd., 1997
/11/ JICA: Final Report; The Basic Design Study on The Project for The Rehabilitation of National Road No. 7, Kompong Cham in The Kingdom of Cambodia, Prepared by Nippon Koei Co., Ltd. And Pacific Consultants International, January 2001
/12/ TONG CUC KHI TUONG THUY VAN. BAO CAO. BUOC DAU DANH GIA VE LU LUT NAM 2000 O DONG BANG SONG CUU LONG. Dong Thap 10-11-2000.
/13/ Fujii, H.; Garsdal, H.; Ward, P.; Ishii, M., Morishita, K.; Boivin, T.: Hydrological roles of the Cambodian Floodplain of the Mekong River (Published in Intl. J. River Basin Management , Vol. 1, No. 3 (2003), pp 1-14)
IV - 37

Vol. II: Supporting Report, Paper IV: Development of Hydro-Hydraulic Model for the Cambodian Floodplains; WUP JICA, March 2004
Fig. 2.1 One-dimensional Model Area of the Chaktomouk Project
Overlaid with Branches and Cross Sections of Flood Plains (Links with Flood Plains and the Main Rivers are shown with Red Colour)
Fig. 2.2 Summary of ADCP Survey Results during the Chaktomouk Project, year 2000
IV-38

Vol. II: Supporting Report, Paper IV: Development of Hydro-Hydraulic Model for the Cambodian Floodplains; WUP JICA, March 2004
Fig. 3.1 Schematic Overview of the NAM Model
IV-39

Vol. II: Supporting Report, Paper IV: Development of Hydro-Hydraulic Model for the Cambodian Floodplains; WUP JICA, March 2004
Fig. 3.2 Sub-catchments and tributaries in Cambodia considered in the Rainfall Runoff Modelling
[Top: Main tributaries, Bottom: Catchments names]
IV-40

Vol. II: Supporting Report, Paper IV: Development of Hydro-Hydraulic Model for the Cambodian Floodplains; WUP JICA, March 2004
Fig. 3.3 Available Rainfall Stations in 1998
Fig. 3.4 Available Rainfall Stations in 1999
IV-41

Vol. II: Supporting Report, Paper IV: Development of Hydro-Hydraulic Model for the Cambodian Floodplains; WUP JICA, March 2004
Fig. 3.5 Available Rainfall Stations in 2000
Fig. 3.6 Available Rainfall Stations in 2001
IV-42

Vol. II: Supporting Report, Paper IV: Development of Hydro-Hydraulic Model for the Cambodian Floodplains; WUP JICA, March 2004
Fig. 3.7 Variations of Monthly Averaged Daily Evaporation using data from 1962 of Phnom Penh, Kompong Cham, Siem Reap, Battambang
and Krakor Stations and in 2000, 2001, 2002 of MRCS at Phnom Penh
IV-43

Vol. II: Supporting Report, Paper IV: Development of Hydro-Hydraulic Model for the Cambodian Floodplains; WUP JICA, March 2004
Determination of rating curve for Stung Chinit at Kg. Thmar
Sqrt(Q) = 2.8173*H - 0.9136 -> Q = 7.9372*(H - 0.3243) 2̂
R2 = 0.984
-5
0
5
10
15
20
25
-2.00 -1.00 0.00 1.00 2.00 3.00 4.00 5.00 6.00 7.00 8.00
Gauge height [m]
sqrt
(Q)
Fig. 3.8 Gauge Height versus Square Root of Discharge for Determination
of Rating Curve: Stung Chinit at Kompong Thmar
Rating curve for Stung Chinit at Kg.ThmarQ=f(H), data from 2001
1.00
2.00
3.00
4.00
5.00
6.00
7.00
0.00 50.00 100.00 150.00 200.00 250.00 300.00 350.00
Q [m3/s]
Gau
ge h
eigh
t [m
]
Fig. 3.9 Derived Rating Curve with data: Stung Chinit at Kompong Thmar
IV-44

Vol. II: Supporting Report, Paper IV: Development of Hydro-Hydraulic Model for the Cambodian Floodplains; WUP JICA, March 2004
Observed gauge height at Kompong Thmar
0
1
2
3
4
5
6
7
01-01-1998 01-01-1999 01-01-2000 01-01-2001
Gau
ge h
eigh
t [m
]
Fig. 3.10 Observed Gause Height at Kompong Thmar
Rated and observed discharge, Stung Chinit at Kg.Thmar(full line = rated, dots = observed)
0
50
100
150
200
250
300
350
01-01-1998 01-01-1999 01-01-2000 01-01-2001
Q[m
3/s]
Fig. 3.11 Rated and Observed Discharge at Kompong Thmar
IV-45

Vol. II: Supporting Report, Paper IV: Development of Hydro-Hydraulic Model for the Cambodian Floodplains; WUP JICA, March 2004
Determination of rating curve for Stung Sen at Kg.Thom
Sqrt(Q/sqrt(F)) = 6.1616*H_KgThom - 60.326-> Q/sqrt(F) = 37.96*(H_KgThom - 9.7906) 2̂
where F = H_KgThom - H_PanhaChi + 2.951
R2 = 0.948
0
5
10
15
20
25
9 10 11 12 13 1
Gauge height [m]
sqrt
( Q
/sqr
t(F) )
4
Fig. 3.12 Gauge Height versus Square Root of Discharge for Determination
of Rating Curve: Stung Sen at Kompong Thom
Rating curve for Stung Sen at Kg.ThomQ/sqrt(F)=f(H), where F=H_KompongThom-H_PanhaChi, fall adjustment : +
2.951
8
9
10
11
12
13
14
0 100 200 300 400 500 600 700
Q/sqrt(F)
Gau
ge h
eigh
t [m
]
Fig. 3.13 Derived Rating Curve with data: Stung Sen at Kompong Thom
IV-46

Vol. II: Supporting Report, Paper IV: Development of Hydro-Hydraulic Model for the Cambodian Floodplains; WUP JICA, March 2004
Observed gauge height at Kg.Thom and Panha Chi
4
5
6
7
8
9
10
11
12
13
14
15
01-01-1998 01-01-1999 01-01-2000 01-01-2001
Gau
ge h
eigh
t [m
]
Kg.Thom Panha Chi
Fig. 3.14 Observed Gause Height at Kompong Thom and Panha Chi
Rated and observed discharge, Stung Sen at
0
200
400
600
800
1000
1200
01-01-1998 01-01-1999 01-01-2000 01-01-2001
Q[m
3/s]
Observed Rated
Fig. 3.15 Rated and Observed Discharge at Kompong Thom
IV-47
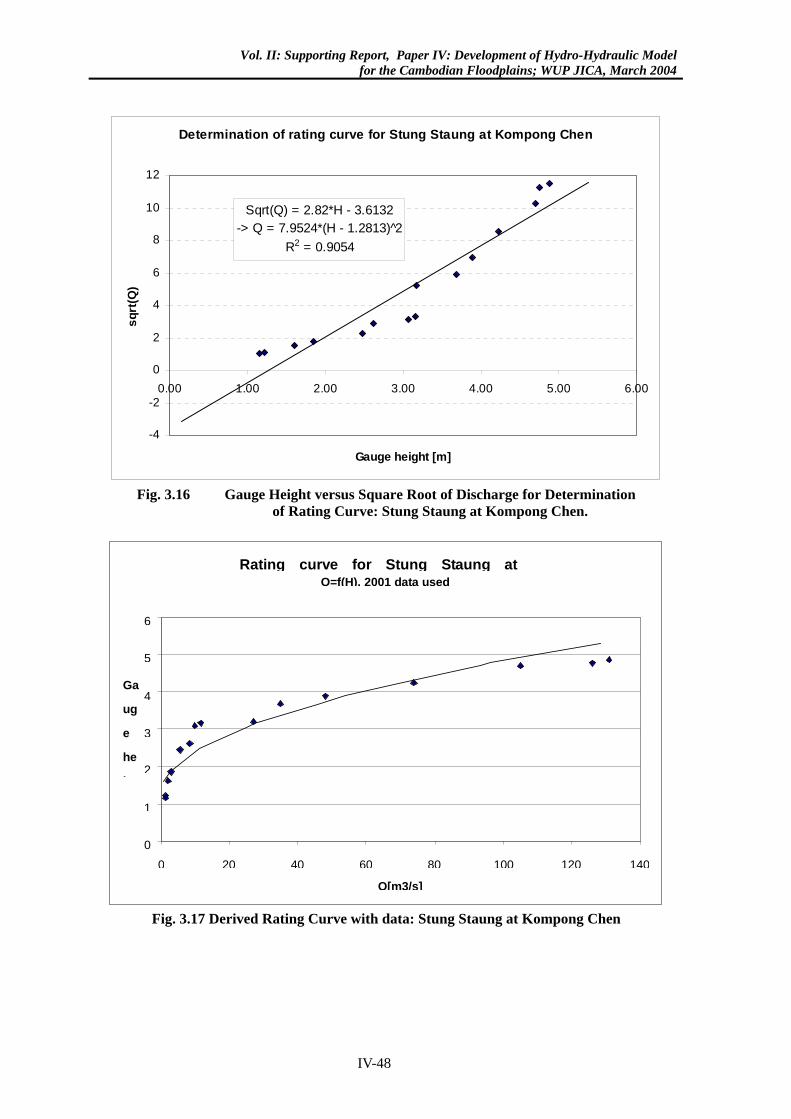
Vol. II: Supporting Report, Paper IV: Development of Hydro-Hydraulic Model for the Cambodian Floodplains; WUP JICA, March 2004
Determination of rating curve for Stung Staung at Kompong Chen
Sqrt(Q) = 2.82*H - 3.6132-> Q = 7.9524*(H - 1.2813) 2̂
R2 = 0.9054
-4
-2
0
2
4
6
8
10
12
0.00 1.00 2.00 3.00 4.00 5.00 6.00
Gauge height [m]
sqrt
(Q)
Fig. 3.16 Gauge Height versus Square Root of Discharge for Determination
of Rating Curve: Stung Staung at Kompong Chen.
Rating curve for Stung Staung at
Q=f(H), 2001 data used
0
1
2
3
4
5
6
0 20 40 60 80 100 120 140 Q[m3/s]
Ga
ug
e
he
i
Fig. 3.17 Derived Rating Curve with data: Stung Staung at Kompong Chen
IV-48

Vol. II: Supporting Report, Paper IV: Development of Hydro-Hydraulic Model for the Cambodian Floodplains; WUP JICA, March 2004
Observed gauge height at Kg.Chen
0
1
2
3
4
5
6
7
8
9
10
01-01-1998 01-01-1999 01-01-2000 01-01-2001
Gau
ge h
eigh
t [m
]
Fig. 3.18 Observed Gause Height at Kompong Chen
Rated and observed discharge, Stung Staung at Kg.ChenRating for 1999 omitted
0
20
40
60
80
100
120
140
160
01-01-1998 01-01-1999 01-01-2000 01-01-2001
Q [m
3/s]
Fig. 3.19 Rated and Observed Discharges in Stung Staung at Kompong Chen
IV-49

Vol. II: Supporting Report, Paper IV: Development of Hydro-Hydraulic Model for the Cambodian Floodplains; WUP JICA, March 2004
Determination of rating curve for Stung Chikreng at Kg.Kdey
Sqrt(Q) = 2.0287*H_KgKdey - 4.0728-> Q = 4.1156*(H_KgKdey - 2.0076) 2̂
R2 = 0.9813
0
2
4
6
8
10
2 3 4 5 6 7
Gauge height [m]
sqrt
(Q)
Fig. 3.20 Gauge Height versus Square Root of Discharge
for Stung Chikreng at Kompong Kdey
Rating curve Stung Chikreng at Kg.KdeyQ=f(H_KgKdey, H_Kg_Loung), but Q=f(H) assumed, 2001 data used
1
2
3
4
5
6
7
0 10 20 30 40 50 60 70 80 90
Q[m3/s]
Gau
ge h
eigh
t [m
]
Fig. 3.21 Derived Rating Curve with data: Stung Chikreng at Kompong Kdey
IV-50

Vol. II: Supporting Report, Paper IV: Development of Hydro-Hydraulic Model for the Cambodian Floodplains; WUP JICA, March 2004
Observed gauge height at Kompong Kdey
0
1
2
3
4
5
6
7
8
9
10
01-01-1998 01-01-1999 01-01-2000 01-01-2001
Gau
ge h
eigh
t [m
]
Fig. 3.22 Observed Gause Height at Kompong Kdey
Rated and observed discharge, Stung Chikreng at Kg.Kdey
0
50
100
150
200
250
01-01-1998 01-01-1999 01-01-2000 01-01-2001
Q [m
3/s]
Fig. 3.23 Rated and Observed Discharge at Kompong Kdey
IV-51

Vol. II: Supporting Report, Paper IV: Development of Hydro-Hydraulic Model for the Cambodian Floodplains; WUP JICA, March 2004
Determination of rating curve for Stung Seam Reap at Untac Bridge
Sqrt(Q) = 2.0263*H_UntacBridge + 0.1896-> Q = 4.1059*(H_UntacBridge - 0.0936) 2̂
R2 = 0.9408
0
1
2
3
4
5
6
7
0.0 0.50 1.0 1.50 2.0 2.50 3.0
Gauge height [m]
sqrt
(Q)
Fig. 3.24 Gauge Height versus Square Root of Discharge: Stung Seam Reap
at Untac Bridge
Rating curve for Stung Siem Reap at Untac BridgeQ=f(H)
0.0
0.50
1.0
1.50
2.0
2.50
3.0
3.50
4.0
0.0 10.0 20.0 30.0 40.0 50.0 60.0
Q[m3/s]
Gau
ge h
eigh
t[m]
2001 1998 1999
Fig. 3.25 Derived Rating Curve with data: Stung Seam Reap at Untac Bridge
IV-52
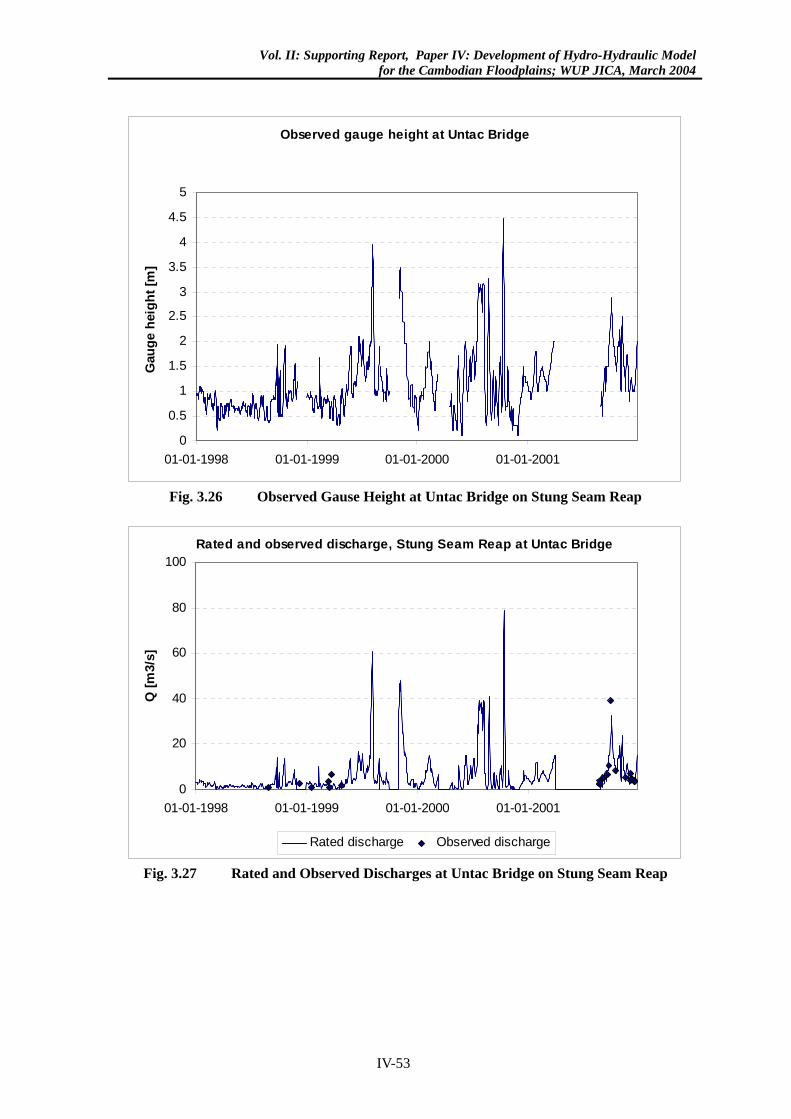
Vol. II: Supporting Report, Paper IV: Development of Hydro-Hydraulic Model for the Cambodian Floodplains; WUP JICA, March 2004
Observed gauge height at Untac Bridge
0
0.5
1
1.5
2
2.5
3
3.5
4
4.5
5
01-01-1998 01-01-1999 01-01-2000 01-01-2001
Gau
ge h
eigh
t [m
]
Fig. 3.26 Observed Gause Height at Untac Bridge on Stung Seam Reap
Rated and observed discharge, Stung Seam Reap at Untac Bridge
0
20
40
60
80
100
01-01-1998 01-01-1999 01-01-2000 01-01-2001
Q [m
3/s]
Rated discharge Observed discharge
Fig. 3.27 Rated and Observed Discharges at Untac Bridge on Stung Seam Reap
IV-53

Vol. II: Supporting Report, Paper IV: Development of Hydro-Hydraulic Model for the Cambodian Floodplains; WUP JICA, March 2004
Determination of rating curve for Stung Sreng at Kralanh
Sqrt(Q/sqrt(F)) = 1.5303*H_Kralanh - 1.4193-> Q/sqrt(F) = 2.3418*(H_Kralanh - 0.9275)^2
R2 = 0.9392
0
2
4
6
8
10
12
14
0.00 1.00 2.00 3.00 4.00 5.00 6.00 7.00 8.00 9.00
Gauge height [m]
sqrt
(Q/s
qrt(F
))
Fig. 3.28 Gauge Height versus Square Root of the Discharge divided
by Square Root of the Fall: Stung Sreng at Kralanh
Rating curve for Stung Sreng at KralanhQ/sqrt(F)=f(H), where F=H_Kralanh-H_BacPrea, fall adjustment : + 3.04
0.00
1.00
2.00
3.00
4.00
5.00
6.00
7.00
8.00
9.00
0 20 40 60 80 100 120 140 160
Q/sqrt(F)
Gau
ge h
eigh
t [m
]
1962, 1963 1999
Fig. 3.29 Derived Rating Curve with data: Stung Sreng at Kralanh
IV-54

Vol. II: Supporting Report, Paper IV: Development of Hydro-Hydraulic Model for the Cambodian Floodplains; WUP JICA, March 2004
Observed gauge height at Kralanh and Bac Prea
0
2
4
6
8
10
12
01-01-1998 01-01-1999 01-01-2000 01-01-2001
Gau
ge h
eigh
t [m
]
Kralanh Bac Prea
Fig. 3.30 Observed Gause Height at Kralanh and at Bac Prea
Rated and observed discharge, Stung Sreng at
0.00
50.00
100.00
150.00
200.00
250.00
300.00
01-01-1998 01-01-1999 01-01-2000 01-01-2001
Q [m
3/s]
Fig. 3.31 Observed and Rated Discharges at Kralanh on Stung Sreng
IV-55

Vol. II: Supporting Report, Paper IV: Development of Hydro-Hydraulic Model for the Cambodian Floodplains; WUP JICA, March 2004
Determination of rating curve for Stung Sisophon
sqrt(Q/sqrt(F)) = 6.1447*H_Sisophon - 30.758->Q/sqrt(F) = 37.76*(H_Sisophon - 5.0056)^2
R2 = 0.861
0
2
4
6
8
10
12
14
16
18
4.00 4.50 5.00 5.50 6.00 6.50 7.00 7.50 8.00
Gauge height [m]
sqrt
(Q/s
qrt(F
))
Fig. 3.32 Gauge Height versus Square Root of Discharge divided by Square Root of the
Fall for Determination of the Discharge Rating Curve for Stung Sisophon
Rating curve for Stung Sisophon at SisophonQ/sqrt(F)=f(H), where F=H_Sisophon-H_BacPrea, fall adjustment : + 3.71
5.00
5.50
6.00
6.50
7.00
7.50
8.00
0 50 100 150 200 250 300
Q/sqrt(F)
Gau
ge h
eigh
t [m
]
1962, 1963 1999
Fig. 3.33 Derived Rating Curve with data: Stung Sisophon at Sisophon
IV-56

Vol. II: Supporting Report, Paper IV: Development of Hydro-Hydraulic Model for the Cambodian Floodplains; WUP JICA, March 2004
Observed gauge height at Sisophon and Bac Prea
0
2
4
6
8
10
12
01-01-1998 01-01-1999 01-01-2000 01-01-2001
Gau
ge h
eigh
t [m
]
Sisophon Bac Prea
Fig. 3.34 Observed Gause Height at Sisophon and Bac Prea
Rated and observed discharge, Stung Sisophon at Sisophon
0.00
50.00
100.00
150.00
200.00
250.00
300.00
350.00
400.00
01-01-1998 01-01-1999 01-01-2000 01-01-2001
Q [m
3/s]
Fig. 3.35 Rated and Observed Discharge at Sisophon
IV-57

Vol. II: Supporting Report, Paper IV: Development of Hydro-Hydraulic Model for the Cambodian Floodplains; WUP JICA, March 2004
Determination of rating curve for Stung Mongkol Borey
Sqrt(Q/sqrt(F)) = 1.1293*H_Sisophon - 0.1548->Q/sqrt(F) = 1.2753*(H_Sisophon - 0.1371)^2
R2 = 0.9434
0
1
2
3
4
5
6
7
8
9
0.00 1.00 2.00 3.00 4.00 5.00 6.00 7.00 8.00
Gauge height [m]
Sqrt
(Q/s
qrt(F
))
Fig. 3.36 Gauge Height versus Square Root of Discharge divided by Square Root of Fall
between Mongkol Borey and Bac Prea
Rating Curve for Stung Mongkol Borey at Mongkol BoreyQ/sqrt(F) = f(H), F=H_MongkolBorey-H_BacPrea,
fall adjustment : +5.40 m
0.00
1.00
2.00
3.00
4.00
5.00
6.00
7.00
8.00
0 10 20 30 40 50 60 70 80
Q/sqrt(F)
Gau
ge h
eigh
t [m
]
1962, 1963 1999
Fig. 3.37 Derived Rating Curve with data: Stung Mongkol Borey at Mongkol Borey
IV-58

Vol. II: Supporting Report, Paper IV: Development of Hydro-Hydraulic Model for the Cambodian Floodplains; WUP JICA, March 2004
Observed gauge height at Mongkol Borey and Bac Prea
0
2
4
6
8
10
12
01-01-1998 01-01-1999 01-01-2000 01-01-2001
Gau
ge h
eigh
t [m
]
Mongkol Borey Bac Prea
Fig. 3.38 Observed Gause Height at Mongkol Borey and Bac Prea
Rated and observed discharge, Stung Mongkol Borey at Mongkol Borey
0
10
20
30
40
50
60
70
80
90
01-01-1998 01-01-1999 01-01-2000 01-01-2001
Q [m
3/s]
Fig. 3.39 Rated and Observed Discharge at Mongkol Borey
IV-59

Vol. II: Supporting Report, Paper IV: Development of Hydro-Hydraulic Model for the Cambodian Floodplains; WUP JICA, March 2004
Determination of rating curve for Stung Sangker at Battambang
Sqrt(Q/sqrt(F) = 2.3756*H - 1.5205Q/sqrt(F) = 5.6435*(H_Battambang - 0.64) 2̂
R2 = 0.91720
2
4
6
8
10
12
14
16
0.00 1.00 2.00 3.00 4.00 5.00 6.00 7.00 8.00
Gauge height [m]
sqrt
(Q/s
qrt(F
))
Fig. 3.40 Determination of Rating Curve for Stung Sangker at Battambang
Rating curve for Stung Sangker at BattambangQ/sqrt(F) = f(H), F=H_Battambang - H_BacPrea, fall adjustment : +
3.57 m
0.00
1.00
2.00
3.00
4.005.00
6.00
7.00
8.00
9.00
0 50 100 150 200 250Q/sqrt(F)
Gau
ge h
eigh
t [m
]
1962, 1963 1999
Fig. 3.41 Derived Rating Curve together with data: Stung Sangker at Battambang
IV-60

Vol. II: Supporting Report, Paper IV: Development of Hydro-Hydraulic Model for the Cambodian Floodplains; WUP JICA, March 2004
Observed gauge height at Battambang and Bac Prea
0
2
4
6
8
10
12
01-01-1998 01-01-1999 01-01-2000 01-01-2001
Gau
ge h
eigh
t [m
]
Battambang Bac Prea
Fig. 3.42 Observed Gause Height at Battambang and Bac Prea
Rated and observed discharge, Stung Sangker at Battambang
0
200
400
600
800
1000
1200
01-01-1998 01-01-1999 01-01-2000 01-01-2001
Q [m
3/s]
Rated discharge Observed discharge
Fig. 3.43 Rated and Observed Discharge at Battambang
IV-61

Vol. II: Supporting Report, Paper IV: Development of Hydro-Hydraulic Model for the Cambodian Floodplains; WUP JICA, March 2004
Determination of rating curve for Stung Dauntri at Maung
Sqrt(Q) = 3.5211*H_Maung - 4.3799-> Q = 12.4*(H_Maung - 1.2439) 2̂
R2 = 0.9241
0
0.5
1
1.5
2
2.5
3
3.5
4
4.5
5
1.4 1.6 1.8 2. 2.2 2.4 2.6
Gauge height [m]
Sqrt
(Q)
Fig. 3.44 Determination of Rating Curve for Stung Dauntri at Maung
using data from year 2001
Rating curve Stung Dauntri at Maung, Q=f(H)
0.
0.5
1.
1.5
2.
2.5
3.
0 5 10 15 20
Q [m3/s]
Gau
ge h
eigh
t [m
]
Fig. 3.45 Derived Rating Curve with data: Stung Dauntri at Maung
IV-62

Vol. II: Supporting Report, Paper IV: Development of Hydro-Hydraulic Model for the Cambodian Floodplains; WUP JICA, March 2004
Observed discharge, Stung Dauntri at
0
5
10
15
20
01-01-98 01-01-99 01-01-00 01-01-01
Q
[m
Fig. 3.46 Observed Discharge data at Stung Dauntri
IV-63

Vol. II: Supporting Report, Paper IV: Development of Hydro-Hydraulic Model for the Cambodian Floodplains; WUP JICA, March 2004
Determination of rating curve at Stung Pursat at Bak Trakoun
sqrt(Q) = 5.0501*H_BakTrakoun - 0.4321-> Q = 25.5*(H_BakTrakoun - 0.0856) 2̂
R2 = 0.9939
0
5
10
15
20
25
30
0.00 1.00 2.00 3.00 4.00 5.00 6.00
Gauge height [m]
sqrt
(Q)
Fig. 3.47 Determination of Rating Curve at Stung Pursat at Bak Trakoun
Rating curve Stung Pursat at Bak TrakounQ=f(H), data from 1998,1999, 2001
0.00
1.00
2.00
3.00
4.00
5.00
6.00
0.00 100.00 200.00 300.00 400.00 500.00 600.00
Q [m3/s]
Gau
ge h
eigh
t [m
]
Fig. 3.48 Derived Rating Curve with data: Stung Pursat at Bak Trakoun
IV-64

Vol. II: Supporting Report, Paper IV: Development of Hydro-Hydraulic Model for the Cambodian Floodplains; WUP JICA, March 2004
Observed gauge height at Bak Trakoun
0
1
2
3
4
5
6
01-01-1998 01-01-1999 01-01-2000 01-01-2001
Gau
ge h
eigh
t [m
]
Fig. 3.49 Observed Gause Height at Bak Trakoun on Stung Pursat
Observed and rated discharge, Stung Pursat at Bac Trakoun
0.00
100.00
200.00
300.00
400.00
500.00
600.00
01-01-1998 01-01-1999 01-01-2000 01-01-2001
Q[m
3/s]
Observed discharge Rated discharge
Fig. 3.50 Rated and Observed Discharges at Bak Trakoun at Stung Pursat
IV-65

Vol. II: Supporting Report, Paper IV: Development of Hydro-Hydraulic Model for the Cambodian Floodplains; WUP JICA, March 2004
Determination of rating curve for Stung Boribo
sqrt(Q) = 4.854*H_Boribo + 1.1707-> Q = 23.56*(H_Boribo - 0.2588)^2
R2 = 0.9664
0
2
4
6
8
10
12
0.00 0.50 1.00 1.50 2.00
Gauge height [m]
sqrt
(Q)
Fig. 3.51 Determination of Rating Curve for Stung Boribo at Boribo
Rating curve for Stung Boribo at BoriboQ=f(H), data from 1998,1999, 2001
0.00
0.50
1.00
1.50
2.00
2.50
0.00 20.00 40.00 60.00 80.00 100.00 120.00
Q [m3/s]
Gau
ge h
eigh
t [m
]
Fig. 3.52 Derived Rating Curve with data: Stung Boribo at Boribo
IV-66

Vol. II: Supporting Report, Paper IV: Development of Hydro-Hydraulic Model for the Cambodian Floodplains; WUP JICA, March 2004
Observed gauge height at Boribo
0
0.5
1
1.5
2
2.5
3
01-01-1998 01-01-1999 01-01-2000 01-01-2001
Gau
ge h
eigh
t [m
]
Fig. 3.53 Observed Gause Height at Stung Boribo
Rated and observed discharge, Stung Boribo at Boribo
0
20
40
60
80
100
120
140
160
180
200
220
01-01-1998 01-01-1999 01-01-2000 01-01-2001
Q [m
3/s]
Fig. 3.54 Rated and Observed Discharges at Boribo
IV-67

Vol. II: Supporting Report, Paper IV: Development of Hydro-Hydraulic Model for the Cambodian Floodplains; WUP JICA, March 2004
Average rainfall for Stung Chinit
0
10
20
30
40
50
60
70
1998 1999 2000 2001 2002
[mm
]
Fig. 3.55 Observed Mean Area Rainfall (daily basis) for Stung Chinit Sub-catchment
Average rainfall for Stung Sen
0
10
20
30
40
50
60
70
1998 1999 2000 2001 2002
[mm
]
Fig. 3.56 Observed Mean Area Rainfall (daily basis) for Stung Sen Sub-catchment
Average rainfall for Stung Staung
0
10
20
30
40
50
60
70
1998 1999 2000 2001 2002
[mm
]
Fig. 3.57 Observed Mean Area Rainfall (daily basis) for Stung Staung Sub-catchment
IV-68

Vol. II: Supporting Report, Paper IV: Development of Hydro-Hydraulic Model for the Cambodian Floodplains; WUP JICA, March 2004
Average rainfall for Stung Chikreng
0
10
20
30
40
50
60
70
1998 1999 2000 2001 2002
[mm
]
Fig. 3.58 Observed Mean Area Rainfall (daily basis) for Stung Chikreng Sub-catchment
Average rainfall for Stung Seam Reap
0
10
20
30
40
50
60
70
1998 1999 2000 2001 2002
[mm
]
Fig. 3.59 Observed Mean Area Rainfall (daily basis) for Stung Seam Reap
Sub-catchment
Average rainfall for Stung Sreng
0
10
20
30
40
50
60
70
1998 1999 2000 2001 2002
[mm
]
Fig. 3.60 Observed Mean Area Rainfall (daily basis) for Stung Sreng Sub-catchment
IV-69

Vol. II: Supporting Report, Paper IV: Development of Hydro-Hydraulic Model for the Cambodian Floodplains; WUP JICA, March 2004
Average rainfall for Stung Sisophon
0
10
20
30
40
50
60
70
1998 1999 2000 2001 2002
[mm
]
Fig. 3.61 Observed Mean Area Rainfall (daily basis) for Stung Sisophon Sub-catchment
Average rainfall for Stung Mongkol Borey
0
10
20
30
40
50
60
70
1998 1999 2000 2001 2002
[m
]
Fig. 3.62 Observed Mean Area Rainfall (daily basis)
for Stung Mongkol Borey Sub-catchment
Average rainfall for Stung Sangker
0
10
20
30
40
50
60
70
1998 1999 2000 2001 2002
[mm
]
Fig. 3.63 Observed Mean Area Rainfall (daily basis) for Stung Sangker Sub-catchment
IV-70

Vol. II: Supporting Report, Paper IV: Development of Hydro-Hydraulic Model for the Cambodian Floodplains; WUP JICA, March 2004
Average rainfall for Stung Dauntri
0
10
20
30
40
50
60
70
1998 1999 2000 2001 2002
[mm
]
Fig. 3.64 Observed Mean Area Rainfall (daily basis) for Stung Dauntri Sub-catchment
Average rainfall for Stung Pursat
0
10
20
30
40
50
60
70
1998 1999 2000 2001 2002
[mm
]
Fig. 3.65 Observed Mean Area Rainfall (daily basis) for Stung Pursat Sub-catchment
Average rainfall for Stung Boribo
0
10
20
30
40
50
60
70
1998 1999 2000 2001 2002
[mm
]
Fig. 3.66 Observed Mean Area Rainfall (daily basis) for Stung Boribo Sub-catchment
IV-71

Vol. II: Supporting Report, Paper IV: Development of Hydro-Hydraulic Model for the Cambodian Floodplains; WUP JICA, March 2004
Average rainfall for Prek Thnoat
0
10
20
30
40
50
60
70
1998 1999 2000 2001 2002
[mm
]
Fig. 3.67 Observed Mean Area Rainfall (daily basis) for Prek Thnoat Sub-catchment
Average rainfall for Prek Chhlong
0
10
20
30
40
50
60
70
1998 1999 2000 2001 2002
[mm
]
Fig. 3.68 Observed Mean Area Rainfall (daily basis) for Prek Chhlong Sub-catchment
Average rainfall for Siem Bok
0
10
20
30
40
50
60
70
1998 1999 2000 2001 2002
[mm
]
Fig. 3.69 Observed Mean Area Rainfall (daily basis) for Siem Bok Sub-catchment
IV-72
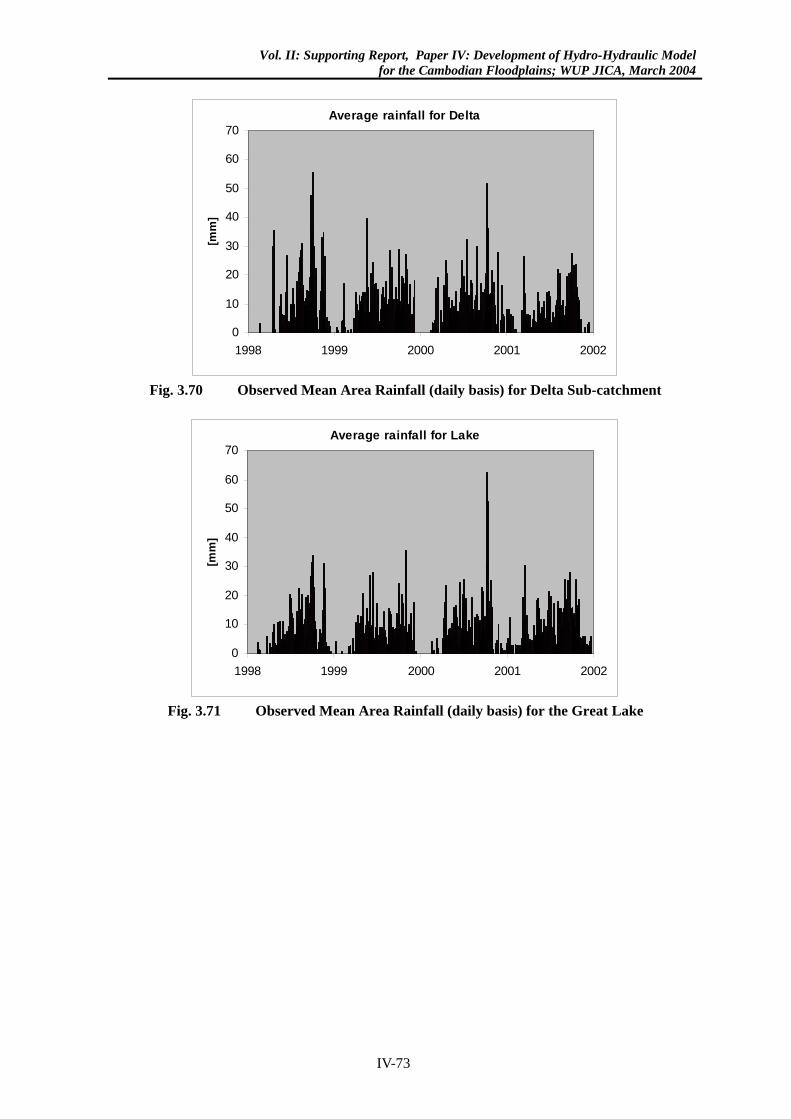
Vol. II: Supporting Report, Paper IV: Development of Hydro-Hydraulic Model for the Cambodian Floodplains; WUP JICA, March 2004
Average rainfall for Delta
0
10
20
30
40
50
60
70
1998 1999 2000 2001 2002
[mm
]
Fig. 3.70 Observed Mean Area Rainfall (daily basis) for Delta Sub-catchment
Average rainfall for Lake
0
10
20
30
40
50
60
70
1998 1999 2000 2001 2002
[mm
]
Fig. 3.71 Observed Mean Area Rainfall (daily basis) for the Great Lake
IV-73

Vol. II: Supporting Report, Paper IV: Development of Hydro-Hydraulic Model for the Cambodian Floodplains; WUP JICA, March 2004
Stung Chinit at Kompong Thmar
0.0
50.0
100.0
150.0
200.0
250.0
300.0
350.0
400.0
01-01-98 01-01-99 01-01-00 01-01-01 01-01-02
Dis
char
ge [m
3/s]
ObservedSimulatedRated
Fig. 3.72 Observed, Rated and Simulated Discharges for Stung Chinit
0
20000
40000
60000
80000
100000
120000
01-01-98 01-01-99 01-01-00 01-01-01 01-01-02
Acc
umul
ated
dis
char
ge [m
3/s]
ObservedSimulated
Fig. 3.73 Accumulated Observed and Simulated Discharge for Stung Chinit
IV-74

Vol. II: Supporting Report, Paper IV: Development of Hydro-Hydraulic Model for the Cambodian Floodplains; WUP JICA, March 2004
Stung Sen at Kompong Thom
0.0
200.0
400.0
600.0
800.0
1000.0
1200.0
1400.0
01-01-98 01-01-99 01-01-00 01-01-01 01-01-02
Dis
char
ge [m
3/s]
ObservedSimulatedRated
Fig. 3.74 Observed, Rated and Simulated Discharges for Stung Sen
Stung Staung at Kompong Chen
0.0
20.0
40.0
60.0
80.0
100.0
120.0
140.0
160.0
180.0
200.0
01-01-98 01-01-99 01-01-00 01-01-01 01-01-02
Dis
char
ge [m
3/s]
SimulatedObserved
Fig. 3.75 Observed and Simulated Discharges for Stung Staung
IV-75

Vol. II: Supporting Report, Paper IV: Development of Hydro-Hydraulic Model for the Cambodian Floodplains; WUP JICA, March 2004
Stung Chikreng at Kompong Kdei
0.0
10.0
20.0
30.0
40.0
50.0
60.0
70.0
80.0
90.0
100.0
01-01-98 01-01-99 01-01-00 01-01-01 01-01-02
Dis
char
ge [m
3/s]
SimulatedObserved
Fig. 3.76 Observed and Simulated Discharges for Stung Chikreng
Stung Seam Reap
0.0
5.0
10.0
15.0
20.0
25.0
30.0
35.0
40.0
45.0
01-01-98 01-01-99 01-01-00 01-01-01 01-01-02
Dis
char
ge [m
3/s]
SimulatedObserved
Fig. 3.77 Observed and Simulated Discharges for Stung Seam Reap
IV-76

Vol. II: Supporting Report, Paper IV: Development of Hydro-Hydraulic Model for the Cambodian Floodplains; WUP JICA, March 2004
Stung Sreng at Kralanh
0.0
50.0
100.0
150.0
200.0
250.0
300.0
350.0
1997-06-19 1998-01-05 1998-07-24 1999-02-09 1999-08-28 2000-03-15 2000-10-01 2001-04-19 2001-11-05 2002-05-24
Dis
char
ge [m
3/s]
ObservedSimulatedRated
Fig. 3.78 Observed, Rated and Simulated Discharges for Stung Sreng
Stung Sisophon at Sisophon
0.0
50.0
100.0
150.0
200.0
250.0
300.0
350.0
400.0
1997-06-19 1998-01-05 1998-07-24 1999-02-09 1999-08-28 2000-03-15 2000-10-01 2001-04-19 2001-11-05 2002-05-24
Dis
char
ge [m
3/s]
SimulatedObserved
Fig. 3.79 Observed and Simulated Discharges for Stung Sisophon
IV-77

Vol. II: Supporting Report, Paper IV: Development of Hydro-Hydraulic Model for the Cambodian Floodplains; WUP JICA, March 2004
Stung Mongkol Borey at Mongkol Borey
0.0
50.0
100.0
150.0
200.0
250.0
1997-06-19 1998-01-05 1998-07-24 1999-02-09 1999-08-28 2000-03-15 2000-10-01 2001-04-19 2001-11-05 2002-05-24
Dis
char
ge [m
3/s]
SimulatedObservedRated
Fig. 3.80 Observed, Rated and Simulated Discharge for Stung Mongkol Borey
Stung Sangker at Battambang
0.0
100.0
200.0
300.0
400.0
500.0
600.0
01-01-98 01-01-99 01-01-00 01-01-01 01-01-02
Dis
char
ge [m
3/s]
ObservedSimulated
Fig. 3.81 Observed and Simulated Discharge for Stung Sangker
IV-78

Vol. II: Supporting Report, Paper IV: Development of Hydro-Hydraulic Model for the Cambodian Floodplains; WUP JICA, March 2004
Stung Dauntri a Maung
0.0
20.0
40.0
60.0
80.0
100.0
120.0
140.0
01-01-98 01-01-99 01-01-00 01-01-01 01-01-02
Dis
char
ge [m
3/s]
SimulatedObserved
Fig. 3.82 Observed and Simulated Discharge at Stung Dauntri
Stung Pursat at Bak Trakoun
0.0
100.0
200.0
300.0
400.0
500.0
600.0
700.0
800.0
900.0
1000.0
01-01-98 01-01-99 01-01-00 01-01-01 01-01-02
Dis
char
ge [m
3/s]
ObservedSimulatedRated
Fig. 3.83 Observed, Rated and Simulated Discharge at Stung Pursat
IV-79
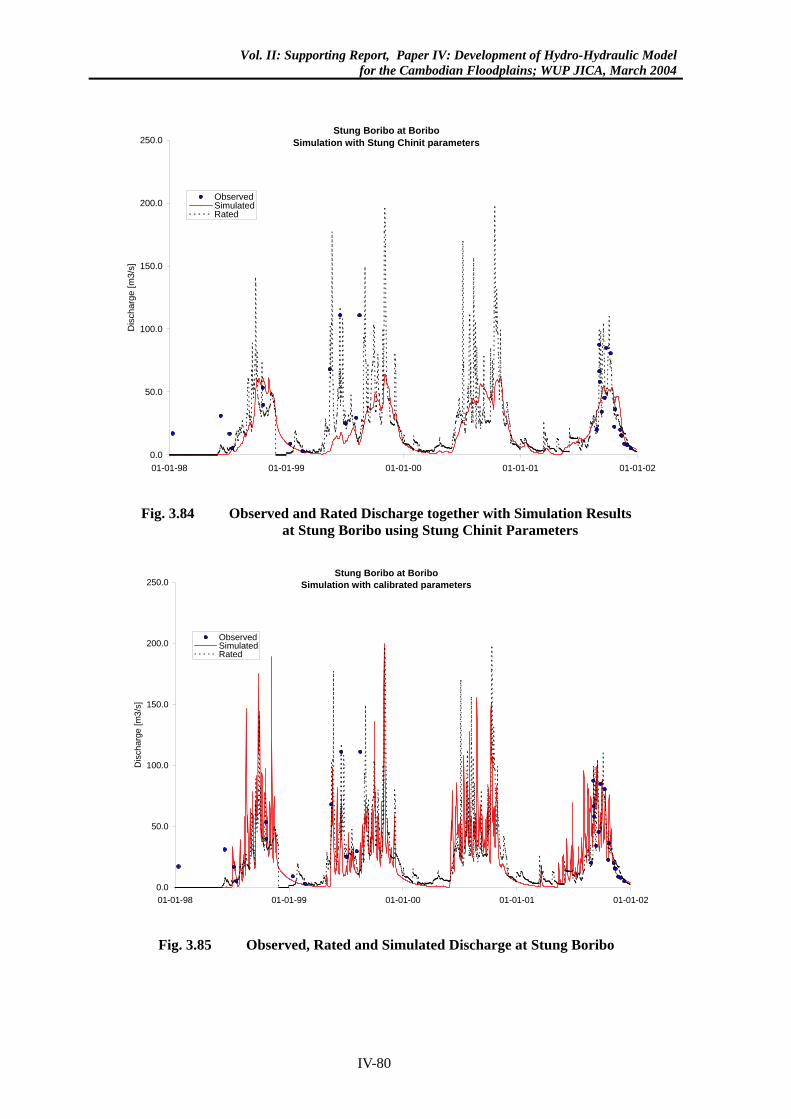
Vol. II: Supporting Report, Paper IV: Development of Hydro-Hydraulic Model for the Cambodian Floodplains; WUP JICA, March 2004
Stung Boribo at BoriboSimulation with Stung Chinit parameters
0.0
50.0
100.0
150.0
200.0
250.0
01-01-98 01-01-99 01-01-00 01-01-01 01-01-02
Dis
char
ge [m
3/s]
ObservedSimulatedRated
Fig. 3.84 Observed and Rated Discharge together with Simulation Results at Stung Boribo using Stung Chinit Parameters
Stung Boribo at BoriboSimulation with calibrated parameters
0.0
50.0
100.0
150.0
200.0
250.0
01-01-98 01-01-99 01-01-00 01-01-01 01-01-02
Dis
char
ge [m
3/s]
ObservedSimulatedRated
Fig. 3.85 Observed, Rated and Simulated Discharge at Stung Boribo
IV-80

Vol. II: Supporting Report, Paper IV: Development of Hydro-Hydraulic Model for the Cambodian Floodplains; WUP JICA, March 2004
Chinit
Fig. 3.86 Computed Runoff from Stung Chinit 1998-2002 [unit:m3/s]
Sen
Fig. 3.87 Computed Runoff from Stung Sen 1998-2002 [unit:m3/s]
Staung
Fig. 3.88 Computed Runoff from Stung Staung 1998-2002 [unit:m3/s]
IV-81

Vol. II: Supporting Report, Paper IV: Development of Hydro-Hydraulic Model for the Cambodian Floodplains; WUP JICA, March 2004
Chikreng
Fig. 3.89 Computed Runoff from Stung Chikreng 1998-2002 [unit:m3/s]
Seam Reap
Fig. 3.90 Computed Runoff from Stung Seam Reap 1998-2002 [unit:m3/s]
Sreng
Fig. 3.91 Computed Runoff from Stung Sreng 1998-2002 [unit:m3/s]
IV-82

Vol. II: Supporting Report, Paper IV: Development of Hydro-Hydraulic Model for the Cambodian Floodplains; WUP JICA, March 2004
Sisophon
Fig. 3.92 Computed Runoff from Stung Sisophon 1998-2002 [unit:m3/s]
Mongkol Borey
Fig. 3.93 Computed Runoff from Stung Mongkol Borey 1998-2002 [unit:m3/s]
Sangker
Fig. 3.94 Computed Runoff from Stung Sangker 1998-2002 [unit:m3/s]
IV-83

Vol. II: Supporting Report, Paper IV: Development of Hydro-Hydraulic Model for the Cambodian Floodplains; WUP JICA, March 2004
Dauntri
Fig. 3.95 Computed Runoff from Stung Dauntri 1998-2002 [unit:m3/s]
Pursat
Fig. 3.96 Computed Runoff from Stung Pursat 1998-2002 [unit:m3/s]
Boribo
Fig. 3.97 Computed Runoff from Stung Boribo 1998-2002 [unit:m3/s]
IV-84

Vol. II: Supporting Report, Paper IV: Development of Hydro-Hydraulic Model for the Cambodian Floodplains; WUP JICA, March 2004
Prek Thnoat
Fig. 3.98 Computed Runoff from Prek Thnoat 1998-2002 [unit:m3/s]
Prek Chhlong
Fig. 3.99 Computed Runoff from Prek Chhlong 1998-2002 [unit:m3/s]
Siem Bok
Fig. 3.100 Computed Runoff from Siem Bok Catchment 1998-2002 [unit:m3/s]
IV-85

Vol. II: Supporting Report, Paper IV: Development of Hydro-Hydraulic Model for the Cambodian Floodplains; WUP JICA, March 2004
Delta
Fig. 3.101 Computed Runoff from Delta Catchment 1998-2002 [unit:m3/s]
Net precipitation on the Great Lake converted to flow rate
-2500
250500750
100012501500175020002250
1998 1999 2000 2001 2002 2003
Dis
char
ge [m
3/s]
Fig. 3.102 Computed Direct Precipitation on the Great Lake 1998-2002 [unit:m3/s]
Simulated runoff from Tonle Sap Lake basin (1998-2002)
0.00
1000.00
2000.00
3000.00
4000.00
5000.00
6000.00
7000.00
augoktdecfebaprjunaugoktdecfebaprjunaugoktdecfebaprjunaugoktdecfebaprjunaugoktdecfebaprjunaugoktdecfebapr
[m3/
s]
Daily values Weekly average values Monthly average values
Fig. 3.103 Simulated Total Runoff from Great Lake Tributaries for the Years 1998-2002 showing Daily, Weekly Averaged and Monthly Averaged Values
IV-86

Vol. II: Supporting Report, Paper IV: Development of Hydro-Hydraulic Model for the Cambodian Floodplains; WUP JICA, March 2004
Fig. 3.104 Cross Sectional Arrangement of the Tonle Sap Lake Overlaid
on the Data Sources from CHO (1999) and Philippine Map (1963)
Level-Area and Level-Volume relation for Great Lake
0
2000
4000
6000
8000
10000
12000
14000
16000
18000
20000
0.0 2.0 4.0 6.0 8.0 10.0 12.0 14.0
Level [m MSL]
Are
a [s
q.km
]
0
10000
20000
30000
40000
50000
60000
70000
80000
90000
100000
Volu
me
][MC
M]
Level-Area Level-Volume
Fig. 3.105 Level-Area and Level-Volume Relation for the Great Lake
IV-87

Vol. II: Supporting Report, Paper IV: Development of Hydro-Hydraulic Model for the Cambodian Floodplains; WUP JICA, March 2004
Hydrographic survey (CHO 1998/99)
Philipine Survey Map (1963)
Sogreah Data (1963)
Canadian ColomboPlan (1959/60)
Fig. 3.106 Various Topographical Data Sources Available for Model Construction
IV-88

Vol. II: Supporting Report, Paper IV: Development of Hydro-Hydraulic Model for the Cambodian Floodplains; WUP JICA, March 2004
Fig. 3.107a and 3.107b Individual Bridges Incorporated in the Model
IV-89

Vol. II: Supporting Report, Paper IV: Development of Hydro-Hydraulic Model for the Cambodian Floodplains; WUP JICA, March 2004
Fig. 3.107c Individual Bridges Incorporated in the Model
Fig. 3.108 Location of Stations with Water Level and Discharge Measurements
IV-90

Vol. II: Supporting Report, Paper IV: Development of Hydro-Hydraulic Model for the Cambodian Floodplains; WUP JICA, March 2004
Fig. 3.109 Principle of Flood Plain discretisation Top left: DEM Top right: DEM plus Model Branch system Overlaid Lower left: Location of Cross Sections for extraction of Flood Plain topography Lower right: Model Branch system, Flood Plain Cross Sections and Flood Extent year 2000)
IV-91

Vol. II: Supporting Report, Paper IV: Development of Hydro-Hydraulic Model for the Cambodian Floodplains; WUP JICA, March 2004
Fig. 3.110 Detailed view of the Quasi-two-dimensional Network for the Flood Plains, with Cross Sections Overlaid (right)
Fig. 3.111 Detailed View of the Branch and Cross Section Layout of the Area around Phnom Penh
IV-92

Vol. II: Supporting Report, Paper IV: Development of Hydro-Hydraulic Model for the Cambodian Floodplains; WUP JICA, March 2004
Fig. 3.112 Model Setup showing Alignment of River and Floodplain Channels and their Connections, including Examples of Cross Sections
in Channels and Flood Plains as well as Longitudinal Profile of Bed Level
IV-93
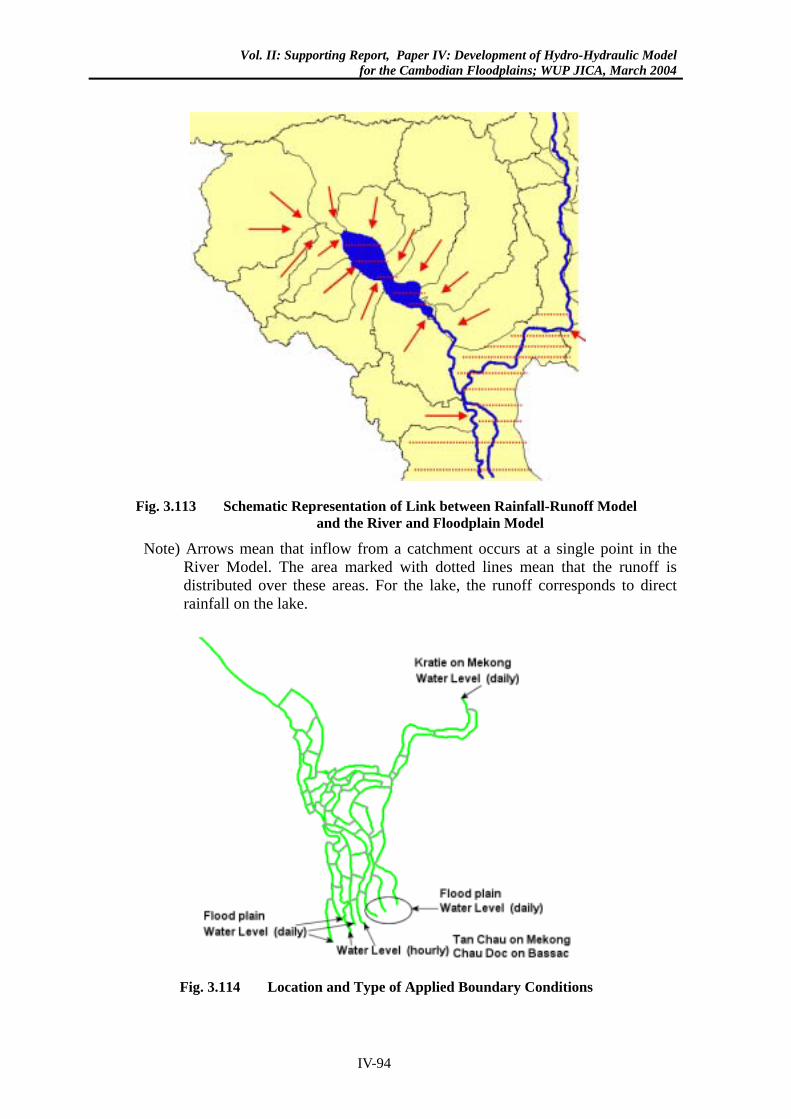
Vol. II: Supporting Report, Paper IV: Development of Hydro-Hydraulic Model for the Cambodian Floodplains; WUP JICA, March 2004
Fig. 3.113 Schematic Representation of Link between Rainfall-Runoff Model and the River and Floodplain Model
Note) Arrows mean that inflow from a catchment occurs at a single point in the River Model. The area marked with dotted lines mean that the runoff is distributed over these areas. For the lake, the runoff corresponds to direct rainfall on the lake.
Fig. 3.114 Location and Type of Applied Boundary Conditions
IV-94

Vol. II: Supporting Report, Paper IV: Development of Hydro-Hydraulic Model for the Cambodian Floodplains; WUP JICA, March 2004
Fig. 3.115a Water Level Boundary Condition at Kratie (1998-2001)
IV-95

Vol. II: Supporting Report, Paper IV: Development of Hydro-Hydraulic Model for the Cambodian Floodplains; WUP JICA, March 2004
Water level boundary at Tan Chau
-1
0
1
2
3
4
5
6
Apr-98 Jul-98 Oct-98 Jan-99 Apr-99 Jul-99 Oct-99 Jan-00
Water level boundary at Tan Chau
-1
0
1
2
3
4
5
6
Apr-00 Jul-00 Oct-00 Jan-01 Apr-01 Jul-01 Oct-01 Jan-02
Water level boundary at Chau Doc
-1
0
1
2
3
4
5
6
Apr-98 Jul-98 Oct-98 Jan-99 Apr-99 Jul-99 Oct-99 Jan-00
Water level boundary at Chau Doc
-1
0
1
2
3
4
5
6
Apr-00 Jul-00 Oct-00 Jan-01 Apr-01 Jul-01 Oct-01 Jan-02
Fig. 3.115b Water Level Boundary at Tan Chau and Chau Doc (hourly, 1998-2001)
IV-96

Vol. II: Supporting Report, Paper IV: Development of Hydro-Hydraulic Model for the Cambodian Floodplains; WUP JICA, March 2004
Water level boundary on Mekong left bank flood plain
0
1
2
3
4
5
6
Apr-98
Jul-98
Oct-98
Jan-99
Apr-99
Jul-99
Oct-99
Jan-00
Apr-00
Jul-00
Oct-00
Jan-01
Apr-01
Jul-01
Oct-01
Jan-02
Apr-02
Eastern plain (WL1) Central plain (WL2) Western Plain (WL3)
Water level boundary on Mekong right bank
0
1
2
3
4
5
6
Apr-98
Jul-98
Oct-98
Jan-99
Apr-99
Jul-99
Oct-99
Jan-00
Apr-00
Jul-00
Oct-00
Jan-01
Apr-01
Jul-01
Oct-01
Jan-02
Apr-02
Eastern plain (WL4) Central Plain (WL5) Western Plain (WL6)
Fig. 3.115c Derived Water Level Boundary on the Southern Floodplains
East and West of the Mekong River (daily, 1998-2001)
IV-97

Vol. II: Supporting Report, Paper IV: Development of Hydro-Hydraulic Model for the Cambodian Floodplains; WUP JICA, March 2004
Fig. 3.116 Simulated and Observed Discharge at Kompong Cham (Top), Chrui Changvar (Middle) and Koh Norea (Bottom)
IV-98

Vol. II: Supporting Report, Paper IV: Development of Hydro-Hydraulic Model for the Cambodian Floodplains; WUP JICA, March 2004
Fig. 3.117 Simulated and Observed Discharge at Neak Luong (Top), Bassac Chaktomouk (Middle) and Koh Khel (Bottom)
IV-99

Vol. II: Supporting Report, Paper IV: Development of Hydro-Hydraulic Model for the Cambodian Floodplains; WUP JICA, March 2004
Figure 3.118 Simulated and Observed Discharges at Prek Kdam (Top ), Phnom Penh Port (Middle) and Spean Tras on Road No. 6 (Bottom)
IV-100

Vol. II: Supporting Report, Paper IV: Development of Hydro-Hydraulic Model for the Cambodian Floodplains; WUP JICA, March 2004
Simulated and observed discharge at Tan Chau, April 1999
-4000
-3000
-2000
-1000
0
1000
2000
3000
4000
5000
6000
31-Mar-99
1-Apr-99
2-Apr-99
3-Apr-99
4-Apr-99
5-Apr-99
6-Apr-99
7-Apr-99
8-Apr-99
9-Apr-99
10-Apr-99
11-Apr-99
12-Apr-99
13-Apr-99
14-Apr-99
15-Apr-99
16-Apr-99
17-Apr-99
18-Apr-99
19-Apr-99
20-Apr-99
21-Apr-99
22-Apr-99
23-Apr-99
24-Apr-99
25-Apr-99
26-Apr-99
27-Apr-99
28-Apr-99
29-Apr-99
30-Apr-99
[m3/
s]SimulatedObserved
Simulated and observed discharge at Tan Chau, April 1999
-4000
-3000
-2000
-1000
0
1000
2000
3000
4000
5000
6000
12-Apr-99
13-Apr-99
14-Apr-99
15-Apr-99
16-Apr-99
17-Apr-99
18-Apr-99
19-Apr-99
20-Apr-99
21-Apr-99
22-Apr-99
[m3/
s]
SimulatedObserved
Fig. 3.119 Simulated and Observed Discharge at Tanchau, April 1999
IV-101

Vol. II: Supporting Report, Paper IV: Development of Hydro-Hydraulic Model for the Cambodian Floodplains; WUP JICA, March 2004
Simulated and observed discharge at Tan Chau, April 2000
-2000
-1000
0
1000
2000
3000
4000
5000
6000
2-Apr-00
3-Apr-00
4-Apr-00
5-Apr-00
6-Apr-00
7-Apr-00
8-Apr-00
9-Apr-00
10-Apr-00
11-Apr-00
12-Apr-00[m
3/s]
SimulatedObserved
Simulated and observed discharge at Tan Chau, April 2000
-2000
-1000
0
1000
2000
3000
4000
5000
6000
30-Mar-00
31-Mar-00
1-Apr-00
2-Apr-00
3-Apr-00
4-Apr-00
5-Apr-00
6-Apr-00
7-Apr-00
8-Apr-00
9-Apr-00
10-Apr-00
11-Apr-00
12-Apr-00
13-Apr-00
14-Apr-00
15-Apr-00
16-Apr-00
17-Apr-00
18-Apr-00
19-Apr-00
20-Apr-00
21-Apr-00
22-Apr-00
23-Apr-00
24-Apr-00
25-Apr-00
26-Apr-00
27-Apr-00
28-Apr-00
29-Apr-00[m
3/s]
SimulatedObserved
Fig. 3.120 Simulated and Observed Discharge at Tanchau, April 2000
IV-102

Vol. II: Supporting Report, Paper IV: Development of Hydro-Hydraulic Model for the Cambodian Floodplains; WUP JICA, March 2004
Simulated and observed water level at Neak Luong (1998-2001)
0
1
2
3
4
5
6
7
8
9
Jan-98
Apr-98
Jul-98
Oct-98
Jan-99
Apr-99
Jul-99
Oct-99
Jan-00
Apr-00
Jul-00
Oct-00
Jan-01
Apr-01
Jul-01
Oct-01
[m]
SimulatedObserved
Simulated and observed water level at Kompong Cham (1998-2001)
0
2
4
6
8
10
12
14
16
Jan-98
Apr-98
Jul-98
Oct-98
Jan-99
Apr-99
Jul-99
Oct-99
Jan-00
Apr-00
Jul-00
Oct-00
Jan-01
Apr-01
Jul-01
Oct-01
[m]
SimulatedObserved
Simulated and observed water level at Chrui Changvar (1998-2001)
0
2
4
6
8
10
12
Jan-98
Apr-98
Jul-98
Oct-98
Jan-99
Apr-99
Jul-99
Oct-99
Jan-00
Apr-00
Jul-00
Oct-00
Jan-01
Apr-01
Jul-01
Oct-01
[m]
SimulatedObserved
Figure 3.121 Simulated and Observed Water Levels at Kompong Cham (Top), Chrui Changvar (Middle) and Neak Luong (Bottom)
IV-103

Vol. II: Supporting Report, Paper IV: Development of Hydro-Hydraulic Model for the Cambodian Floodplains; WUP JICA, March 2004
Simulated and observed water level at Kompong Chhnang (1998-2001)
0
2
4
6
8
10
12
Jan-98
Apr-98
Jul-98
Oct-98
Jan-99
Apr-99
Jul-99
Oct-99
Jan-00
Apr-00
Jul-00
Oct-00
Jan-01
Apr-01
Jul-01
Oct-01
[m]
SimulatedObserved
Simulated and observed water level at Kompong Luong (1998-2001)
0
2
4
6
8
10
12
Jan-98
Apr-98
Jul-98
Oct-98
Jan-99
Apr-99
Jul-99
Oct-99
Jan-00
Apr-00
Jul-00
Oct-00
Jan-01
Apr-01
Jul-01
Oct-01
[m]
SimulatedObserved
Simulated and observed water level at Prek Kdam (1998-2001)
0
2
4
6
8
10
12
Jan-98
Apr-98
Jul-98
Oct-98
Jan-99
Apr-99
Jul-99
Oct-99
Jan-00
Apr-00
Jul-00
Oct-00
Jan-01
Apr-01
Jul-01
Oct-01
[m]
SimulatedObserved
Figure 3.122 Simulated and Observed Water Levels at Kompong Luong (Top), Kompong Chhnang (Middle) and Prek Kdam (Bottom)
IV-104

Vol. II: Supporting Report, Paper IV: Development of Hydro-Hydraulic Model for the Cambodian Floodplains; WUP JICA, March 2004
Simulated and observed water level at Phnom Penh Port (1998-2001)
0
2
4
6
8
10
12
Jan-98
Apr-98
Jul-98
Oct-98
Jan-99
Apr-99
Jul-99
Oct-99
Jan-00
Apr-00
Jul-00
Oct-00
Jan-01
Apr-01
Jul-01
Oct-01
[m]
SimulatedObserved
Simulated and observed water level at Koh Khel (1998-2001)
0
1
2
3
4
5
6
7
8
9
Jan-98
Apr-98
Jul-98
Oct-98
Jan-99
Apr-99
Jul-99
Oct-99
Jan-00
Apr-00
Jul-00
Oct-00
Jan-01
Apr-01
Jul-01
Oct-01
[m]
SimulatedObserved
Simulated and observed water level at Bassac Chaktomouk (1998-2001)
0
2
4
6
8
10
12
Jan-98
Apr-98
Jul-98
Oct-98
Jan-99
Apr-99
Jul-99
Oct-99
Jan-00
Apr-00
Jul-00
Oct-00
Jan-01
Apr-01
Jul-01
Oct-01
[m]
SimulatedObserved
Figure 3.123 Simulated and Observed Water Levels at Phnom Penh Port (Top), Bassac Chaktomouk (Middle) and Koh Khel (Bottom)
IV-105

Vol. II: Supporting Report, Paper IV: Development of Hydro-Hydraulic Model for the Cambodian Floodplains; WUP JICA, March 2004
Observed and simulated discharge at Kompong Cham, 2002
0
10000
20000
30000
40000
50000
60000
01-Jul08-Jul15-Jul22-Jul29-Jul05-Aug12-Aug19-Aug26-Aug02-Sep09-Sep16-Sep23-Sep30-Sep07-O
ct14-O
ct21-O
ct28-O
ct04-N
ov11-N
ov18-N
ov25-N
ov02-D
ec09-D
ec16-D
ec23-D
ec30-D
ec06-Jan13-Jan20-Jan27-Jan
Dis
char
ge [m
3/s]
Simulated Observed
Observed and simulated discharge at Chaktomouk Junction, 2002
-10000
-5000
0
5000
10000
15000
20000
25000
30000
35000
40000
01-Jul08-Jul15-Jul22-Jul29-Jul05-Aug12-Aug19-Aug26-Aug02-Sep09-Sep16-Sep23-Sep30-Sep07-O
ct14-O
ct21-O
ct28-O
ct04-N
ov11-N
ov18-N
ov25-N
ov02-D
ec09-D
ec16-D
ec23-D
ec30-D
ec06-Jan13-Jan20-Jan27-Jan
Dis
char
ge [m
3/s]
Simulated Chrui Changvar Observed Chrui Changvar
Simulated Koh Norea Observed Koh Norea
Simulated Phnom Penh Port Observed Phnom Penh Port
Simulated Monivong Bridge Observed Monivong Bridge
Chrui Changvar
Koh Norea
Phnom Penh Port
Monivong bridge
Fig. 3.124 Model Verification for Year 2002: Simulated and Observed (ADCP) Discharge
at Kompong Cham (Top) and the Chaktomouk Junction (Bottom)
IV-106

Vol. II: Supporting Report, Paper IV: Development of Hydro-Hydraulic Model for the Cambodian Floodplains; WUP JICA, March 2004
Observed and simulated discharge at Phnom Penh Port and Prek Kdam, 2002
-10000-8000-6000-4000-2000
02000400060008000
10000
01-Jul08-Jul15-Jul22-Jul29-Jul05-Aug12-Aug19-Aug26-Aug02-Sep09-Sep16-Sep23-Sep30-Sep07-O
ct14-O
ct21-O
ct28-O
ct04-N
ov11-N
ov18-N
ov25-N
ov02-D
ec09-D
ec16-D
ec23-D
ec30-D
ec06-Jan13-Jan20-Jan27-Jan
Dis
char
ge [m
3/s]
Observed and simulated discharge at Monivong Bridge and Koh Khel, 2002
010002000
3000400050006000
70008000
01-Jul08-Jul15-Jul22-Jul29-Jul05-Aug12-Aug19-Aug26-Aug02-Sep09-Sep16-Sep23-Sep30-Sep07-O
ct14-O
ct21-O
ct28-O
ct04-N
ov11-N
ov18-N
ov25-N
ov02-D
ec09-D
ec16-D
ec23-D
ec30-D
ec06-Jan13-Jan20-Jan27-Jan
Dis
char
ge [m
3/s]
Simulated Observed Simulated Observed
Observed and simulated discharge at Spean Dach, 2002
0100200300400500600700800
01-Jul08-Jul15-Jul22-Jul29-Jul05-Aug12-Aug19-Aug26-Aug02-Sep09-Sep16-Sep23-Sep30-Sep07-O
ct14-O
ct21-O
ct28-O
ct04-N
ov11-N
ov18-N
ov25-N
ov02-D
ec09-D
ec16-D
ec23-D
ec30-D
ec06-Jan13-Jan20-Jan27-Jan
Dis
char
ge [m
3/s]
Simulated Observed
Phnom Penh Port
Prek Kdam
Koh Khel
Monivong bridge
Fig. 3.125 Model Verification for Year 2002: Simulated and Observed (ADCP) Discharge at Phnom Penh Port and Prek Kdam (Top), Monivong Bridge
and Koh Khel (Middle) and Spean Dach (Bottom)
IV-107

Vol. II: Supporting Report, Paper IV: Development of Hydro-Hydraulic Model for the Cambodian Floodplains; WUP JICA, March 2004
Fig. 3.126a Simulated (left) and Observed (right) Flood Extent of the 2000 Flood ( Peak Monsoon)
Fig. 3.126b Simulated (left) and Observed (right) Flood Extent of the Peak of the 1999 Flood
IV-108

Vol. II: Supporting Report, Paper IV: Development of Hydro-Hydraulic Model for the Cambodian Floodplains; WUP JICA, March 2004
Fig. 3.126c Simulated (left) and Observed (right) Flood Extent on October 14, 2002
Depth [m]
Fig. 3.126d Details of Simulated and Observed Flood Extent on October 14, 2002
IV-109