pantry Morgan_Keegan_2008_Equity_Conference
26
The Pantry, Inc. Morgan Keegan 2008 Equity Conference September 5, 2008
-
Upload
finance34 -
Category
Economy & Finance
-
view
220 -
download
0
Transcript of pantry Morgan_Keegan_2008_Equity_Conference
The Pantry, Inc.
Morgan Keegan 2008 Equity Conference
September 5, 2008
1
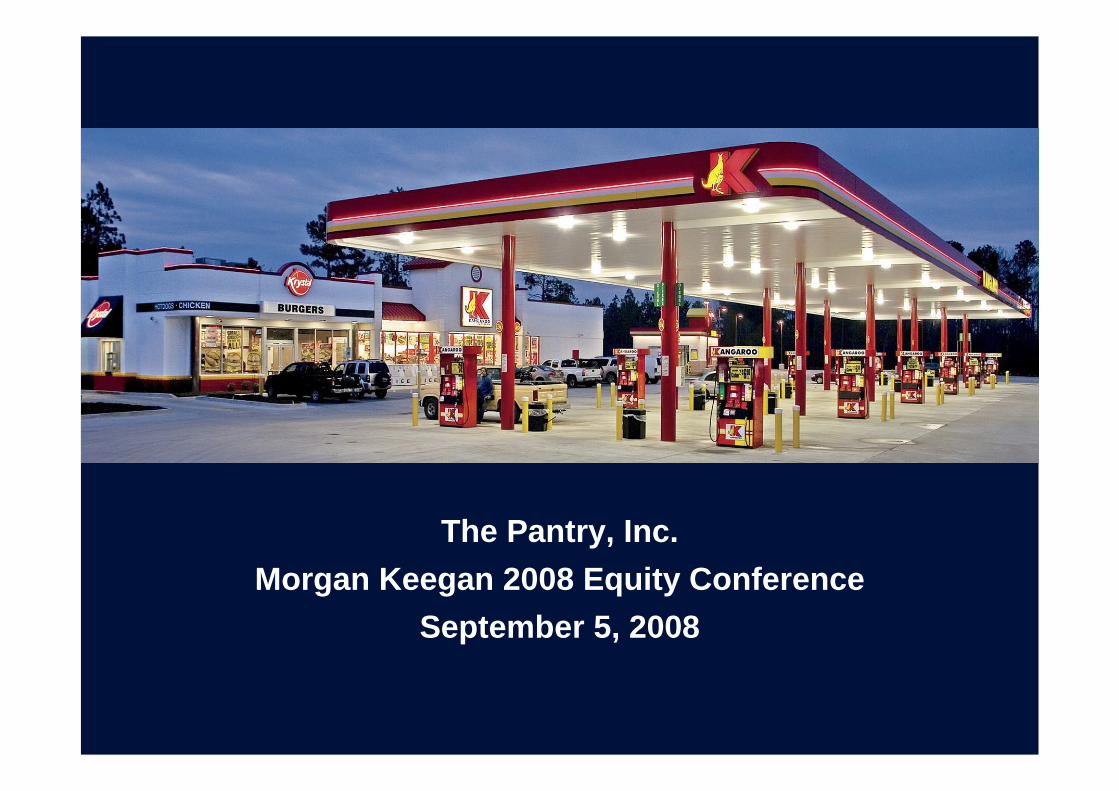
Safe Harbor Statement
Some of the statements in this presentation constitute “forward-lookingstatements” within the meaning of the Private Securities Litigation Reform Act
of 1995. All statements other than those of historical facts included herein,including those related to the company’s financial outlook, goals, business
strategy, projected plans and objectives of management for future operationsand liquidity, are forward-looking statements. These forward-looking
statements are based on the company’s plans and expectations and involve anumber of risks and uncertainties that could cause actual results to vary
materially from the results and events anticipated or implied by such forward-looking statements. Please refer to the company’s Annual Report on Form
10-K and its other filings with the SEC for a discussion of significant riskfactors applicable to the company. In addition, the forward-looking
statements included in this presentation are based on the company’sestimates and plans as of the date of this presentation. While the companymay elect to update these forward-looking statements at some point in the
future, it specifically disclaims any obligation to do so.
2
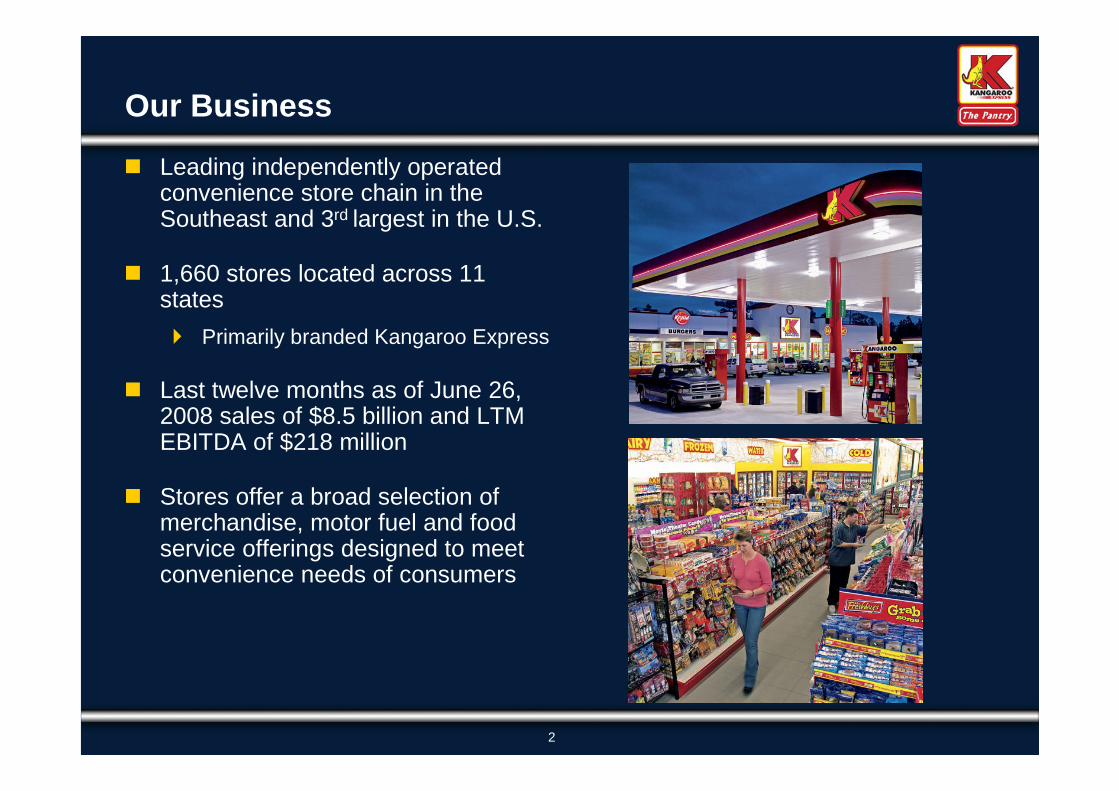
Our Business
Leading independently operatedconvenience store chain in theSoutheast and 3rd largest in the U.S.
1,660 stores located across 11states
Primarily branded Kangaroo Express
Last twelve months as of June 26,2008 sales of $8.5 billion and LTMEBITDA of $218 million
Stores offer a broad selection ofmerchandise, motor fuel and foodservice offerings designed to meetconvenience needs of consumers

3
Leading market positions in attractive Southeastern markets
Significant scale advantages vs. primary competitors
Benefiting from consumer trends toward convenience formats
Leveraging infrastructure to drive profitability and future growth
Attractive sector growth and consolidation potential
Key Investment Highlights
Strong Cash Flow Generation to Reinvest in Our Business, DeStrong Cash Flow Generation to Reinvest in Our Business, De--lever and Drive Earnings Growthlever and Drive Earnings Growth
4
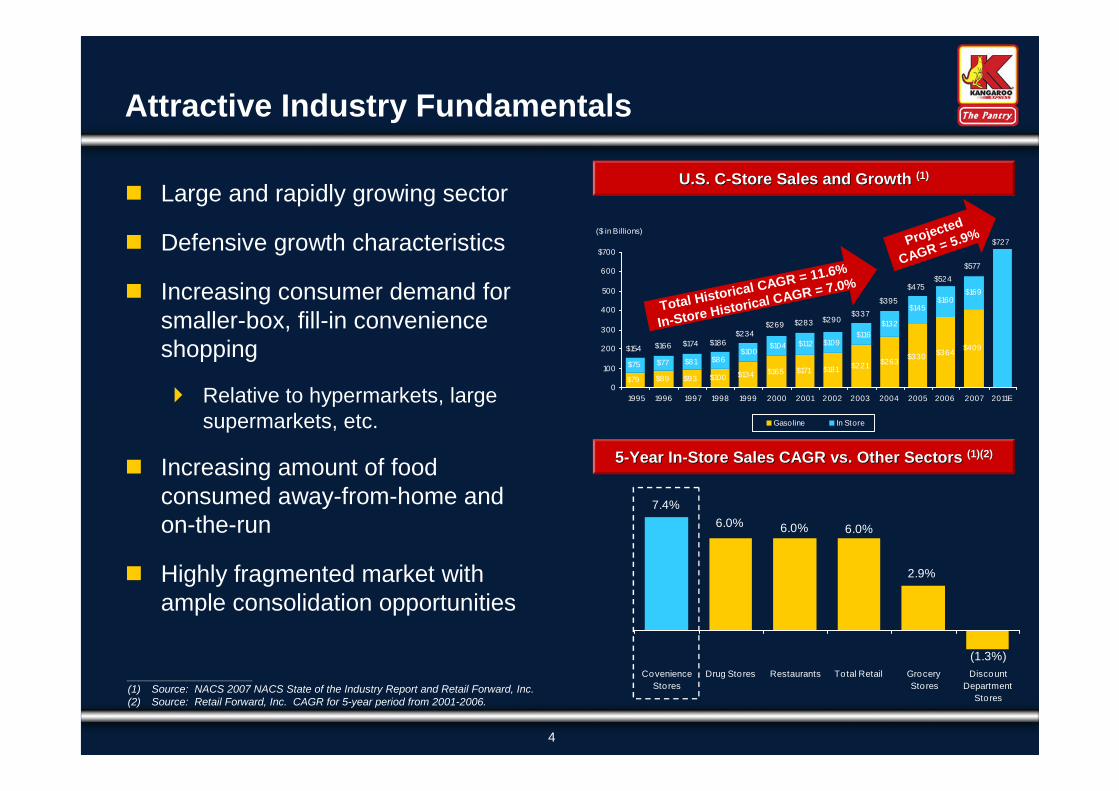
U.S. CU.S. C--Store Sales and GrowthStore Sales and Growth (1)(1)
_____________________(1) Source: NACS 2007 NACS State of the Industry Report and Retail Forward, Inc.(2) Source: Retail Forward, Inc. CAGR for 5-year period from 2001-2006.
Attractive Industry Fundamentals
Large and rapidly growing sector
Defensive growth characteristics
Increasing consumer demand forsmaller-box, fill-in convenienceshopping
Relative to hypermarkets, largesupermarkets, etc.
Increasing amount of foodconsumed away-from-home andon-the-run
Highly fragmented market withample consolidation opportunities
$79 $89 $93 $100 $134 $165 $171 $181 $221$75 $77 $81 $86
$409$364
$330$263
$109$112$104$100
$116
$132
$160$169
$145
$727
$577
$524$475
$395
$337$290$283$269
$234$186$174$166$154
0
100
200
300
400
500
600
$700
1995 1996 1997 1998 1999 2000 2001 2002 2003 2004 2005 2006 2007 2011E
($ in Billions)
Gasoline In Store
Projected
CAGR = 5.9%
2.9%
(1.3%)
6.0%6.0%6.0%
7.4%
Covenience
Stores
Drug Stores Restaurants Total Retail Grocery
Stores
Discount
Department
Stores
Total Historical CAGR = 11.6%
In-Store Historical CAGR = 7.0%
55--Year InYear In--Store Sales CAGR vs. Other SectorsStore Sales CAGR vs. Other Sectors (1)(2)(1)(2)
5
PA0021GM_1.WOR
IndianaIndianaIndianaIndianaIndianaIndianaIndianaIndianaIndiana
North CarolinaNorth CarolinaNorth CarolinaNorth CarolinaNorth CarolinaNorth CarolinaNorth CarolinaNorth CarolinaNorth Carolina
VirginiaVirginiaVirginiaVirginiaVirginiaVirginiaVirginiaVirginiaVirginiaKentuckyKentuckyKentuckyKentuckyKentuckyKentuckyKentuckyKentuckyKentucky
TennesseeTennesseeTennesseeTennesseeTennesseeTennesseeTennesseeTennesseeTennessee
MississippiMississippiMississippiMississippiMississippiMississippiMississippiMississippiMississippi
LouisianaLouisianaLouisianaLouisianaLouisianaLouisianaLouisianaLouisianaLouisiana
FloridaFloridaFloridaFloridaFloridaFloridaFloridaFloridaFlorida
AlabamaAlabamaAlabamaAlabamaAlabamaAlabamaAlabamaAlabamaAlabama
GeorgiaGeorgiaGeorgiaGeorgiaGeorgiaGeorgiaGeorgiaGeorgiaGeorgia
SouthSouthSouthSouthSouthSouthSouthSouthSouth
CarolinaCarolinaCarolinaCarolinaCarolinaCarolinaCarolinaCarolinaCarolina
IndianapolisIndianapolisIndianapolisIndianapolisIndianapolisIndianapolisIndianapolisIndianapolisIndianapolis
RaleighRaleighRaleighRaleighRaleighRaleighRaleighRaleighRaleigh
FrankfortFrankfortFrankfortFrankfortFrankfortFrankfortFrankfortFrankfortFrankfort
JacksonJacksonJacksonJacksonJacksonJacksonJacksonJacksonJackson
TallahasseeTallahasseeTallahasseeTallahasseeTallahasseeTallahasseeTallahasseeTallahasseeTallahassee
Baton RougeBaton RougeBaton RougeBaton RougeBaton RougeBaton RougeBaton RougeBaton RougeBaton Rouge
RichmondRichmondRichmondRichmondRichmondRichmondRichmondRichmondRichmond
MontgomeryMontgomeryMontgomeryMontgomeryMontgomeryMontgomeryMontgomeryMontgomeryMontgomery
AtlantaAtlantaAtlantaAtlantaAtlantaAtlantaAtlantaAtlantaAtlanta
ColumbiaColumbiaColumbiaColumbiaColumbiaColumbiaColumbiaColumbiaColumbia
DurhamDurhamDurhamDurhamDurhamDurhamDurhamDurhamDurham
ChesapeakeChesapeakeChesapeakeChesapeakeChesapeakeChesapeakeChesapeakeChesapeakeChesapeake
PaducahPaducahPaducahPaducahPaducahPaducahPaducahPaducahPaducah
ClintonClintonClintonClintonClintonClintonClintonClintonClintonVicksburgVicksburgVicksburgVicksburgVicksburgVicksburgVicksburgVicksburgVicksburg
MeridianMeridianMeridianMeridianMeridianMeridianMeridianMeridianMeridian
TampaTampaTampaTampaTampaTampaTampaTampaTampa
OrlandoOrlandoOrlandoOrlandoOrlandoOrlandoOrlandoOrlandoOrlando
GulfportGulfportGulfportGulfportGulfportGulfportGulfportGulfportGulfport
NorfolkNorfolkNorfolkNorfolkNorfolkNorfolkNorfolkNorfolkNorfolk
HamptonHamptonHamptonHamptonHamptonHamptonHamptonHamptonHampton
ArlingtonArlingtonArlingtonArlingtonArlingtonArlingtonArlingtonArlingtonArlington
WilmingtonWilmingtonWilmingtonWilmingtonWilmingtonWilmingtonWilmingtonWilmingtonWilmington
St. PetersburgSt. PetersburgSt. PetersburgSt. PetersburgSt. PetersburgSt. PetersburgSt. PetersburgSt. PetersburgSt. Petersburg
Daytona BeachDaytona BeachDaytona BeachDaytona BeachDaytona BeachDaytona BeachDaytona BeachDaytona BeachDaytona Beach
JacksonvilleJacksonvilleJacksonvilleJacksonvilleJacksonvilleJacksonvilleJacksonvilleJacksonvilleJacksonville
NashvilleNashvilleNashvilleNashvilleNashvilleNashvilleNashvilleNashvilleNashville
Boca RatonBoca RatonBoca RatonBoca RatonBoca RatonBoca RatonBoca RatonBoca RatonBoca Raton
MiamiMiamiMiamiMiamiMiamiMiamiMiamiMiamiMiami
Bowling GreenBowling GreenBowling GreenBowling GreenBowling GreenBowling GreenBowling GreenBowling GreenBowling Green
CovingtonCovingtonCovingtonCovingtonCovingtonCovingtonCovingtonCovingtonCovington
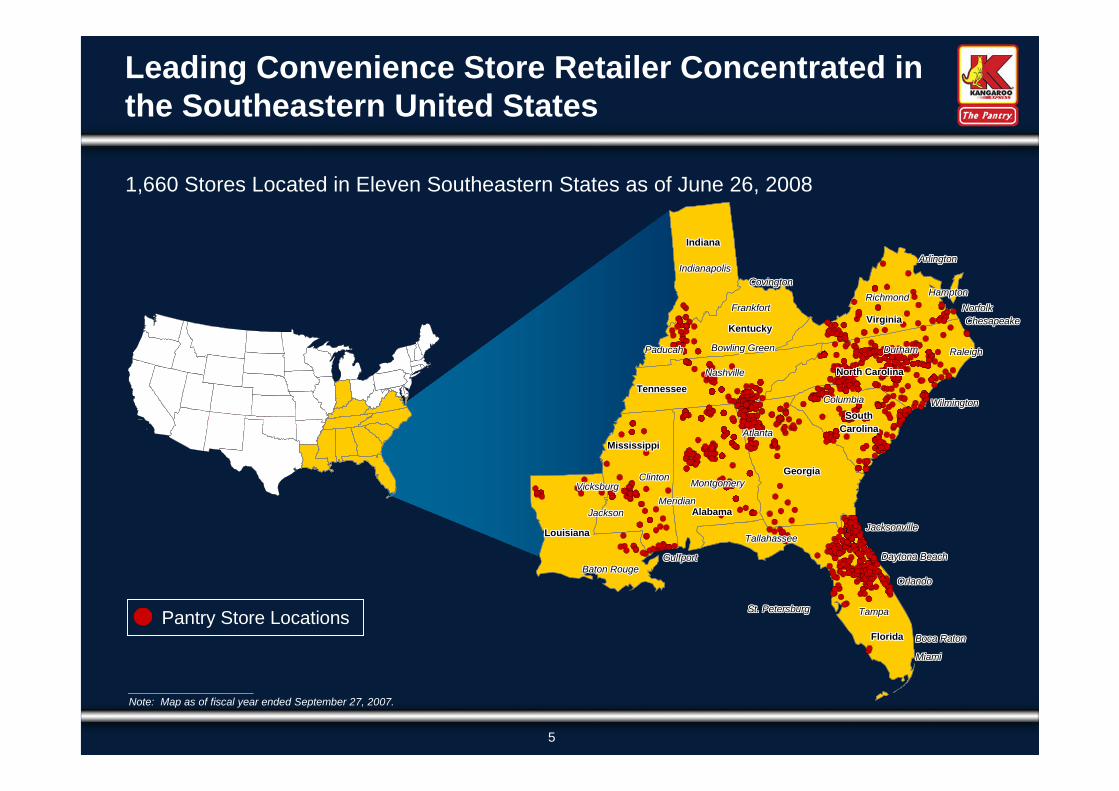
1,660 Stores Located in Eleven Southeastern States as of June 26, 2008
Leading Convenience Store Retailer Concentrated inthe Southeastern United States
NY0010DP_1.WOR
Pantry Store Locations
_____________________Note: Map as of fiscal year ended September 27, 2007.
6
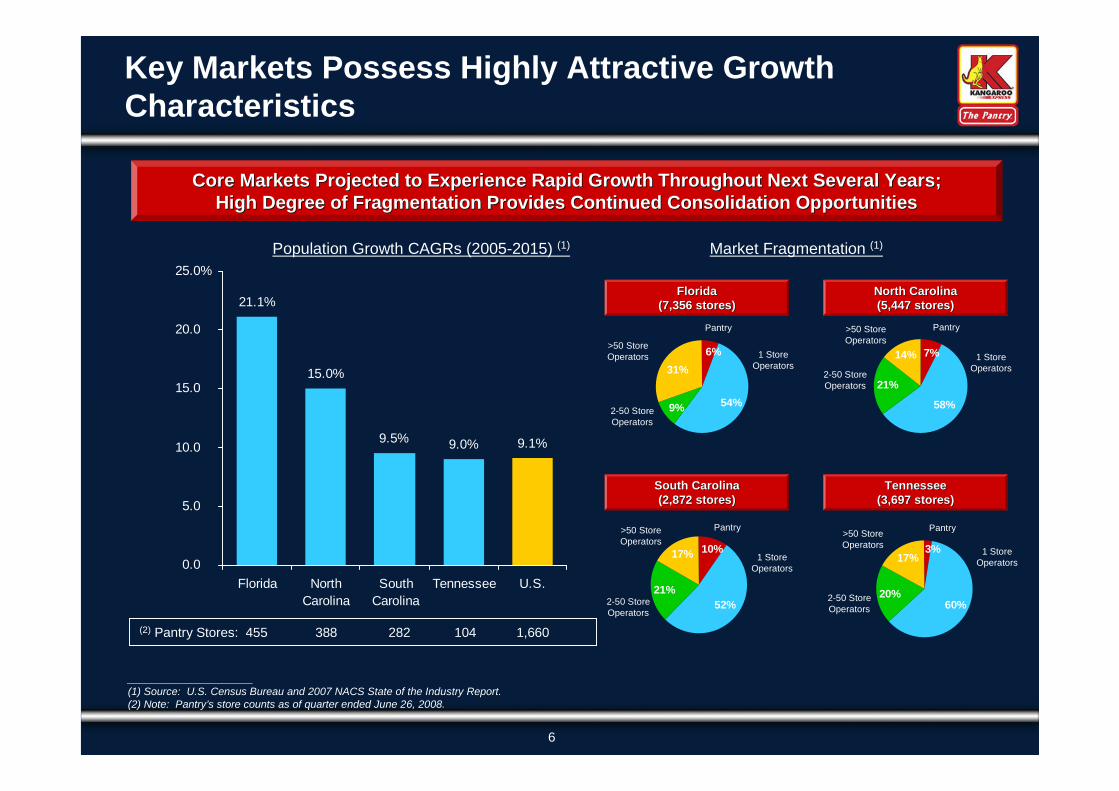
Key Markets Possess Highly Attractive GrowthCharacteristics
_____________________(1) Source: U.S. Census Bureau and 2007 NACS State of the Industry Report.(2) Note: Pantry’s store counts as of quarter ended June 26, 2008.
Core Markets Projected to Experience Rapid Growth Throughout NexCore Markets Projected to Experience Rapid Growth Throughout Next Several Years;t Several Years;High Degree of Fragmentation Provides Continued Consolidation OpHigh Degree of Fragmentation Provides Continued Consolidation Opportunitiesportunities
21.1%
15.0%
9.5% 9.0% 9.1%
0.0
5.0
10.0
15.0
20.0
25.0%
Florida North
Carolina
South
Carolina
Tennessee U.S.
54%9%
31%
6%
58%
21%
14% 7%
52%
21%
17% 10%
60%20%
17%3%
Pantry
1 StoreOperators
2-50 StoreOperators
>50 StoreOperators
Pantry
1 StoreOperators
2-50 StoreOperators
>50 StoreOperators
Pantry
1 StoreOperators
2-50 StoreOperators
>50 StoreOperators
Pantry
1 StoreOperators
2-50 StoreOperators
>50 StoreOperators
FloridaFlorida(7,356 stores)(7,356 stores)
North CarolinaNorth Carolina(5,447 stores)(5,447 stores)
South CarolinaSouth Carolina(2,872 stores)(2,872 stores)
TennesseeTennessee(3,697 stores)(3,697 stores)
Population Growth CAGRs (2005-2015) (1)
(2) Pantry Stores: 455 388 282 104 1,660
Market Fragmentation (1)
7
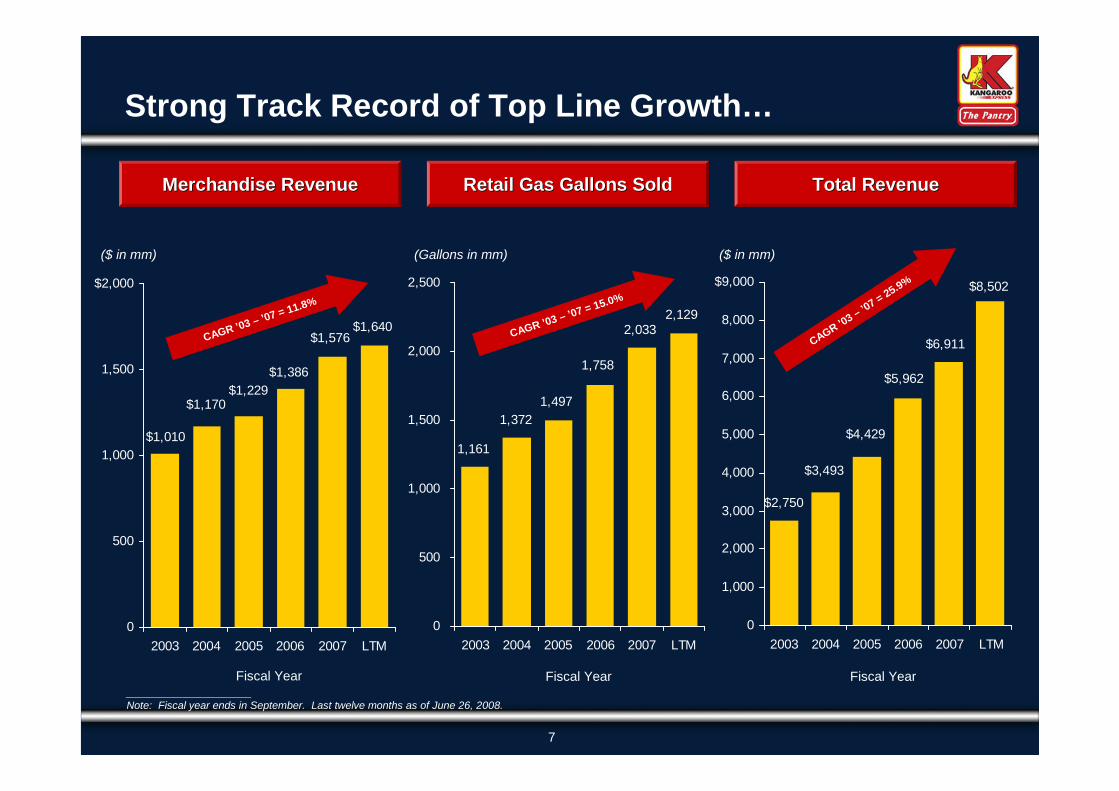
$1,640$1,576
$1,386
$1,229$1,170
$1,010
0
500
1,000
1,500
$2,000
2003 2004 2005 2006 2007 LTM
Merchandise RevenueMerchandise Revenue
2,1292,033
1,758
1,497
1,372
1,161
0
500
1,000
1,500
2,000
2,500
2003 2004 2005 2006 2007 LTM
($ in mm) (Gallons in mm)
CAGR ’03 – ’07 = 11.8%
CAGR ’03 – ’07 = 15.0%
Fiscal Year Fiscal Year_____________________Note: Fiscal year ends in September. Last twelve months as of June 26, 2008.
$8,502
$6,911
$5,962
$4,429
$3,493
$2,750
0
1,000
2,000
3,000
4,000
5,000
6,000
7,000
8,000
$9,000
2003 2004 2005 2006 2007 LTM
($ in mm)
Retail Gas Gallons SoldRetail Gas Gallons Sold Total RevenueTotal Revenue
Fiscal Year
Strong Track Record of Top Line Growth…
CAGR’03 – ’07 = 25.9%
8
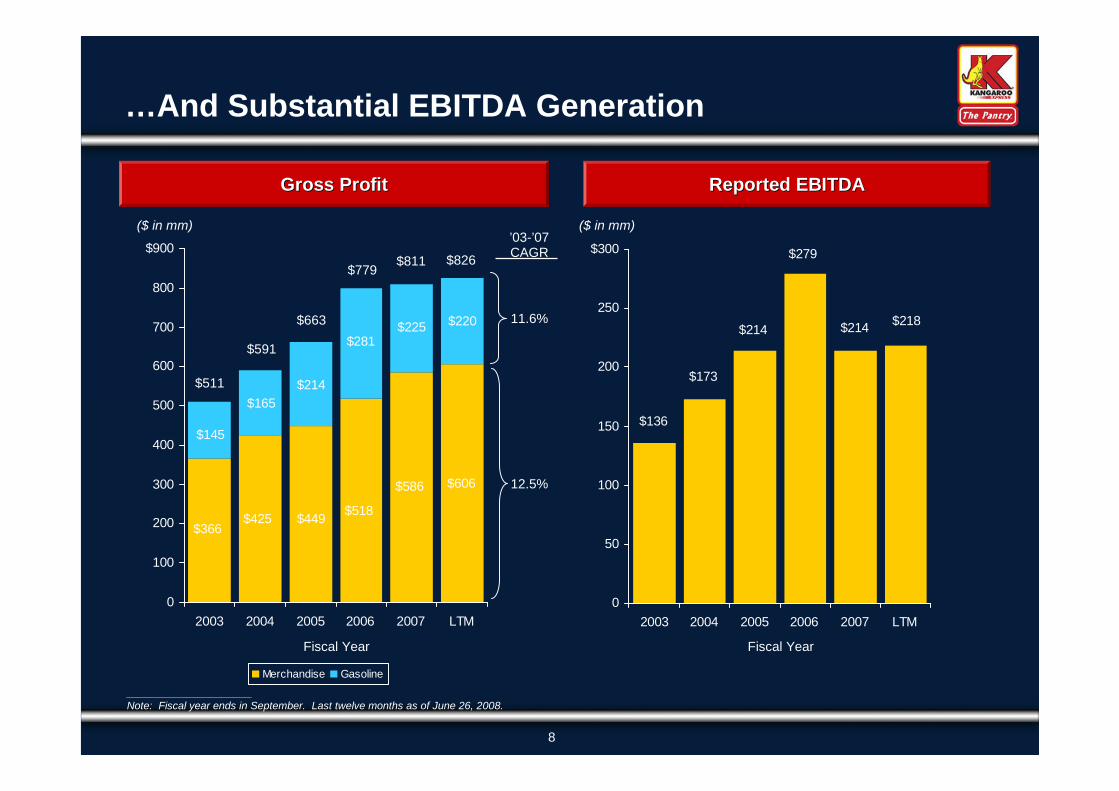
$586
$518$449$425
$366
$606
$220
$145
$225$281
$214
$165
0
100
200
300
400
500
600
700
800
$900
2003 2004 2005 2006 2007 LTM
Merchandise Gasoline
Reported EBITDAReported EBITDAGross ProfitGross Profit
$218
$136
$173
$214
$279
$214
0
50
100
150
200
250
$300
2003 2004 2005 2006 2007 LTM
$511
$591
$663
$779$811 $826
Fiscal Year Fiscal Year
_____________________Note: Fiscal year ends in September. Last twelve months as of June 26, 2008.
($ in mm) ($ in mm)
…And Substantial EBITDA Generation
’03-’07CAGR
11.6%
12.5%
9
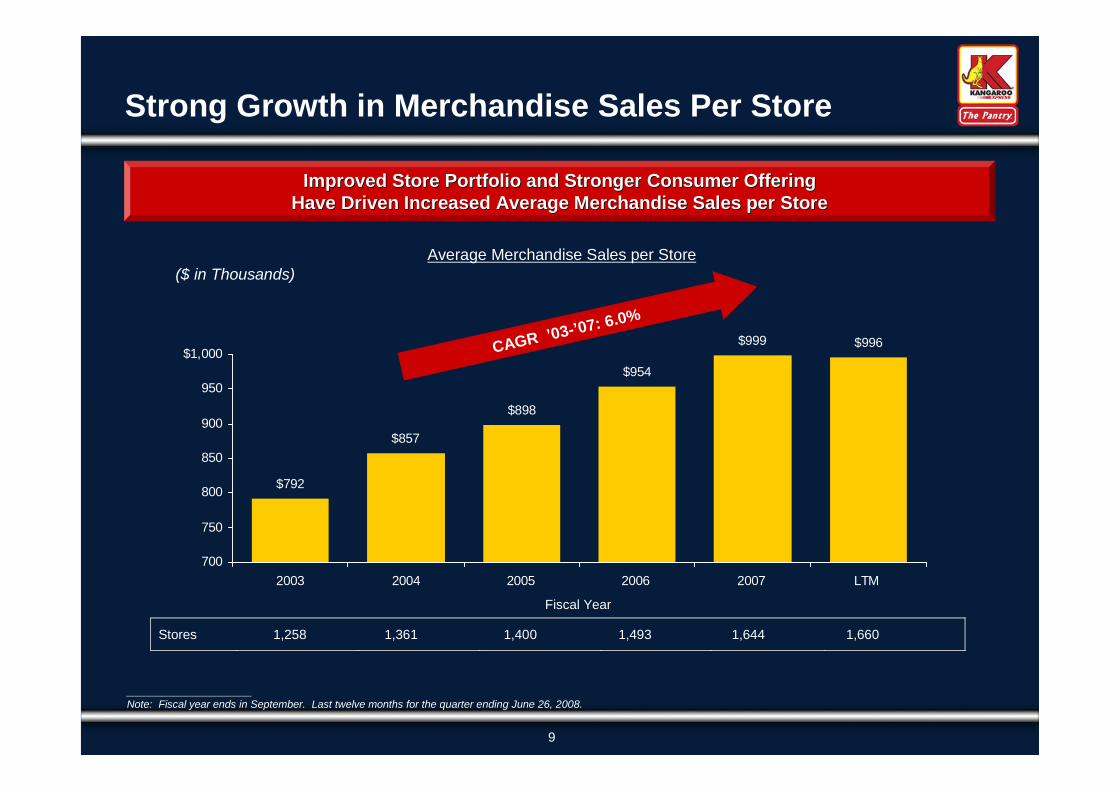
$792
$857
$898
$954
$999 $996
700
750
800
850
900
950
$1,000
2003 2004 2005 2006 2007 LTM
Average Merchandise Sales per Store($ in Thousands)
Improved Store Portfolio and Stronger Consumer OfferingImproved Store Portfolio and Stronger Consumer OfferingHave Driven Increased Average Merchandise Sales per StoreHave Driven Increased Average Merchandise Sales per Store
_____________________Note: Fiscal year ends in September. Last twelve months for the quarter ending June 26, 2008.
Fiscal Year
Strong Growth in Merchandise Sales Per Store
Stores 1,258 1,361 1,400 1,493 1,644 1,660
CAGR ’03-’07: 6.0%
10
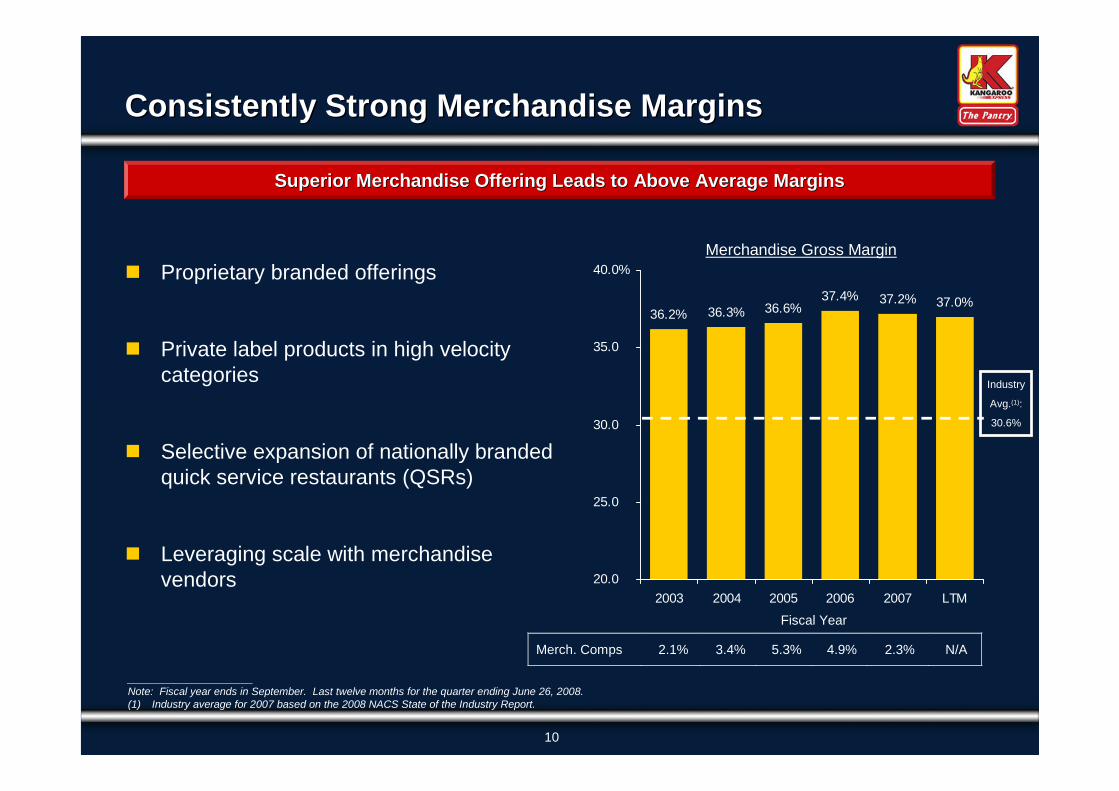
36.2% 36.3% 36.6%37.4% 37.2% 37.0%
20.0
25.0
30.0
35.0
40.0%
2003 2004 2005 2006 2007 LTM
Merchandise Gross Margin
Fiscal Year
Superior Merchandise Offering Leads to Above Average MarginsSuperior Merchandise Offering Leads to Above Average Margins
Industry
Avg.(1):
30.6%
_____________________Note: Fiscal year ends in September. Last twelve months for the quarter ending June 26, 2008.(1) Industry average for 2007 based on the 2008 NACS State of the Industry Report.
Consistently Strong Merchandise MarginsConsistently Strong Merchandise Margins
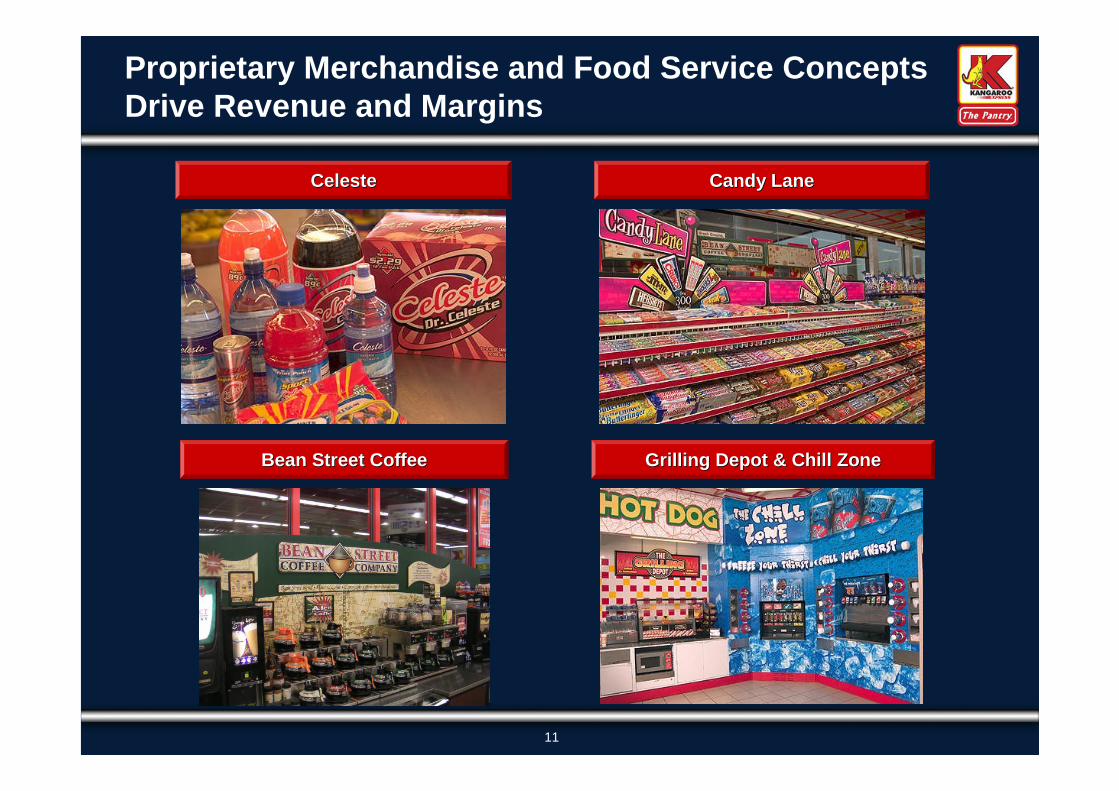
Proprietary branded offerings
Private label products in high velocitycategories
Selective expansion of nationally brandedquick service restaurants (QSRs)
Leveraging scale with merchandisevendors
Merch. Comps 2.1% 3.4% 5.3% 4.9% 2.3% N/A
11
CelesteCeleste
Bean Street CoffeeBean Street Coffee
Proprietary Merchandise and Food Service ConceptsDrive Revenue and Margins
Candy LaneCandy Lane
Grilling Depot & Chill ZoneGrilling Depot & Chill Zone
12
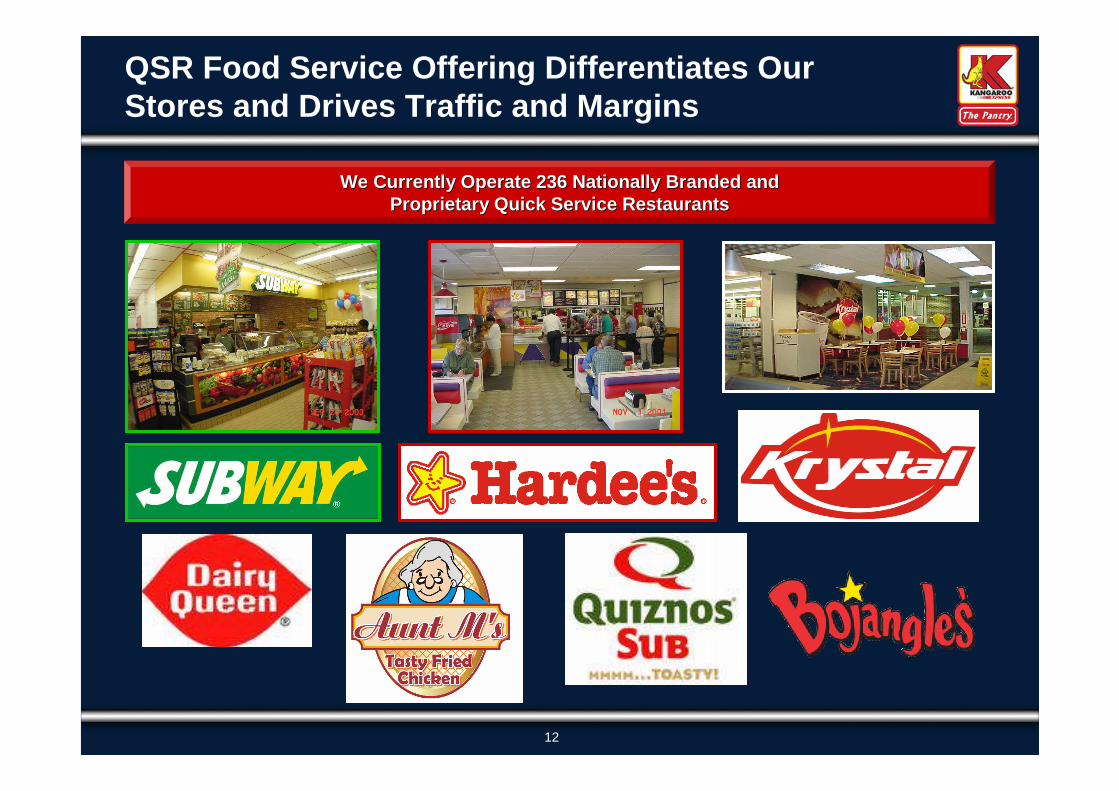
We Currently Operate 236 Nationally Branded andWe Currently Operate 236 Nationally Branded andProprietary Quick Service RestaurantsProprietary Quick Service Restaurants
QSR Food Service Offering Differentiates OurStores and Drives Traffic and Margins
13
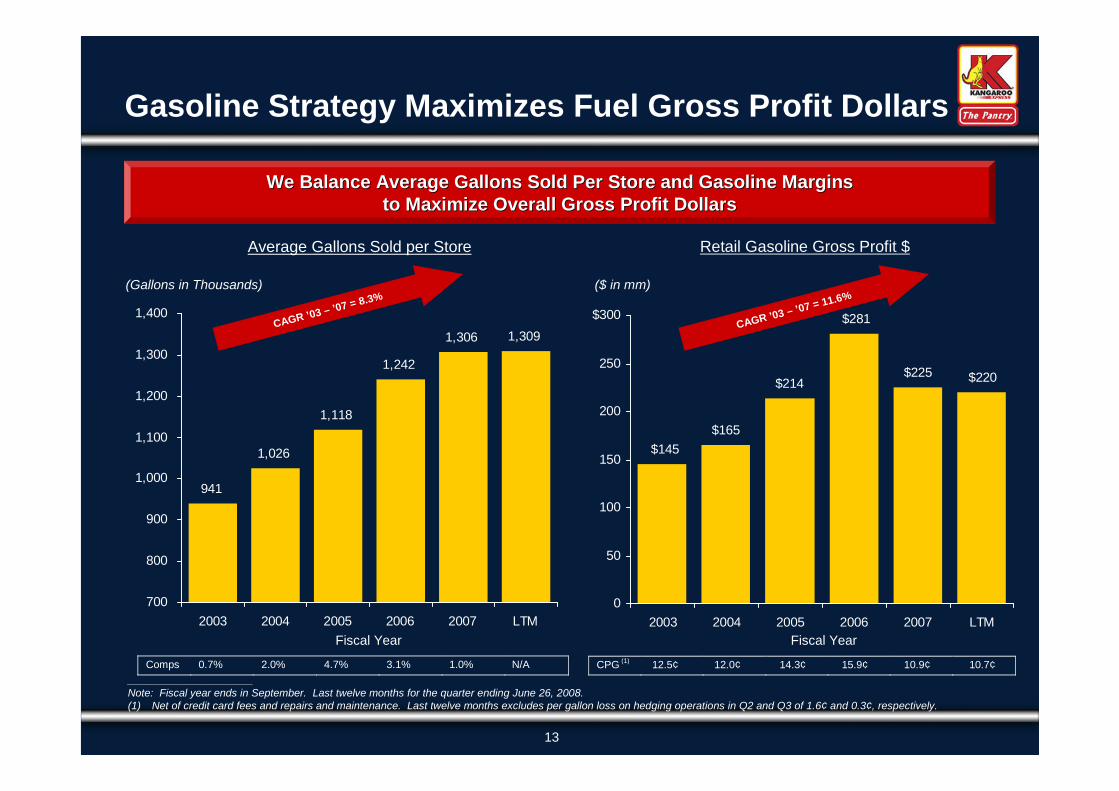
$165
$214$225
$145
$220
$281
0
50
100
150
200
250
$300
2003 2004 2005 2006 2007 LTM
941
1,026
1,118
1,242
1,306 1,309
700
800
900
1,000
1,100
1,200
1,300
1,400
2003 2004 2005 2006 2007 LTM
We Balance Average Gallons Sold Per Store and Gasoline MarginsWe Balance Average Gallons Sold Per Store and Gasoline Marginsto Maximize Overall Gross Profit Dollarsto Maximize Overall Gross Profit Dollars
Gasoline Strategy Maximizes Fuel Gross Profit Dollars
Average Gallons Sold per Store Retail Gasoline Gross Profit $
Fiscal Year Fiscal Year
_____________________Note: Fiscal year ends in September. Last twelve months for the quarter ending June 26, 2008.(1) Net of credit card fees and repairs and maintenance. Last twelve months excludes per gallon loss on hedging operations in Q2 and Q3 of 1.6¢ and 0.3¢, respectively.
(Gallons in Thousands) ($ in mm)
Comps 0.7% 2.0% 4.7% 3.1% 1.0% N/A CPG(1)
12.5¢ 12.0¢ 14.3¢ 15.9¢ 10.9¢ 10.7¢
CAGR ’03 – ’07 = 8.3%
CAGR ’03 – ’07 = 11.6%
14
$58.74
$90.61
$97.59
$146.65
$109.71
$75.13$60.13
$63.34 $63.82 $65.44
$60.74$70.89$70.95
$124.47
$53.58$50.03
0.00
25.00
50.00
75.00
100.00
125.00
$150.00
Q2 Q3 Q4 Q1 Q2 Q3 Q4 Q1 Q2 Q3 Q4 Q1 Q2 Q3 7/11/08Current
Avg.
Cru
de
Oil
Price
per
Barr
el
1.00
2.00
3.00
4.00
$5.00A
vg.
Reta
ilP
rice
per
Gasolin
eG
allo
n
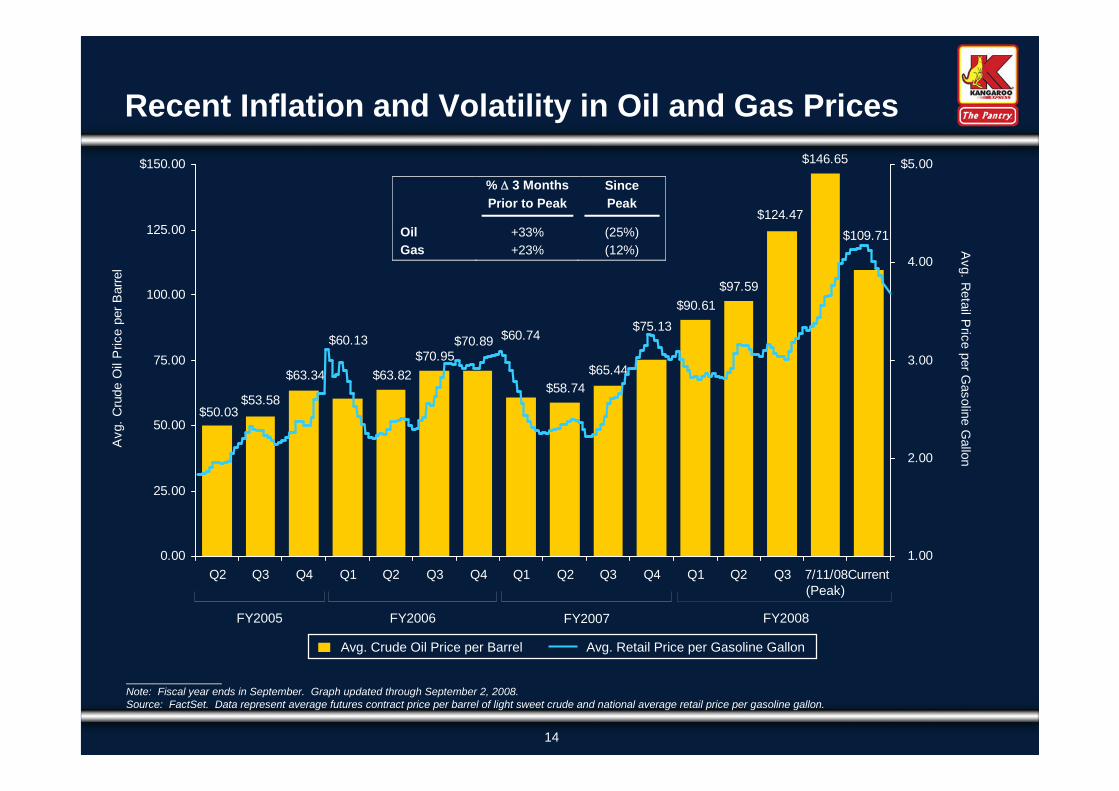
Note: Fiscal year ends in September. Graph updated through September 2, 2008.Source: FactSet. Data represent average futures contract price per barrel of light sweet crude and national average retail price per gasoline gallon.
FY2005 FY2006 FY2007 FY2008
Recent Inflation and Volatility in Oil and Gas Prices
(Peak)
Avg. Crude Oil Price per Barrel Avg. Retail Price per Gasoline Gallon
% 3 Months
Prior to Peak
Since
Peak
Oil +33% (25%)
Gas +23% (12%)
15
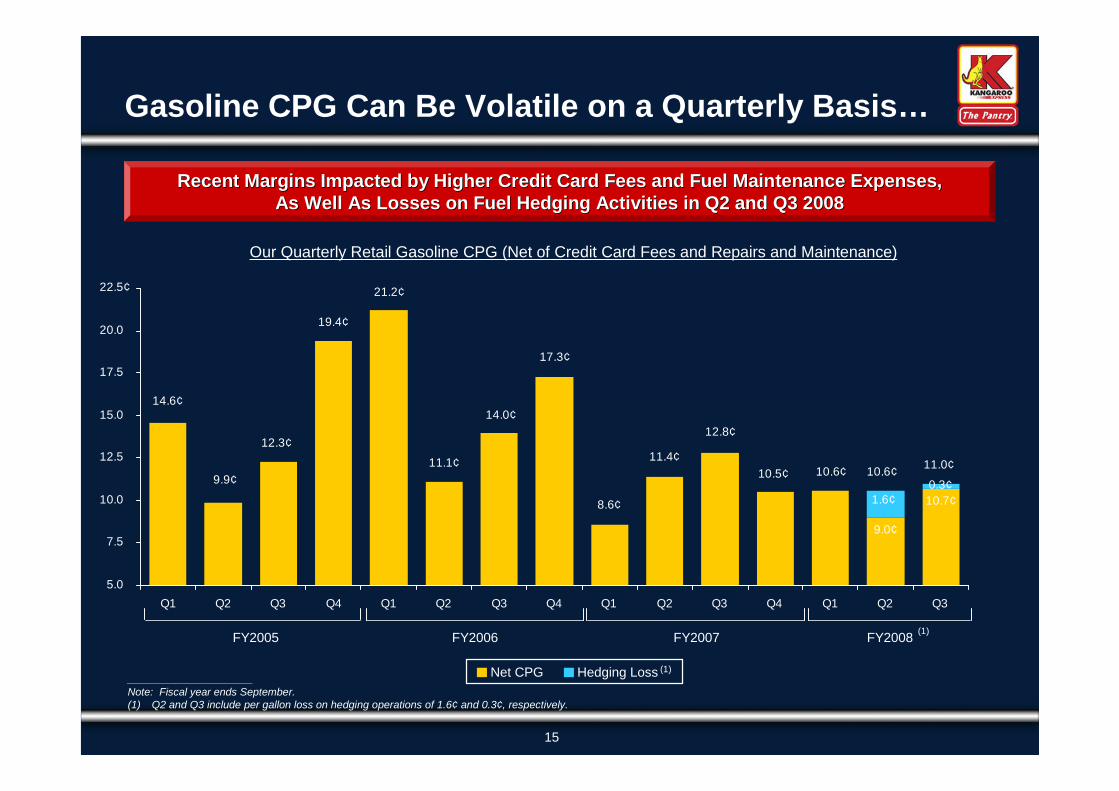
9.0¢
10.7¢
0.3¢10.5¢
12.8¢
11.4¢
8.6¢
14.0¢14.6¢
9.9¢
12.3¢
19.4¢
21.2¢
11.1¢10.6¢
17.3¢
1.6¢
5.0
7.5
10.0
12.5
15.0
17.5
20.0
22.5¢
Q1 Q2 Q3 Q4 Q1 Q2 Q3 Q4 Q1 Q2 Q3 Q4 Q1 Q2 Q3
10.6¢11.0¢
Recent Margins Impacted by Higher Credit Card Fees and Fuel MainRecent Margins Impacted by Higher Credit Card Fees and Fuel Maintenance Expenses,tenance Expenses,As Well As Losses on Fuel Hedging Activities in Q2 and Q3 2008As Well As Losses on Fuel Hedging Activities in Q2 and Q3 2008
Our Quarterly Retail Gasoline CPG (Net of Credit Card Fees and Repairs and Maintenance)
FY2005 FY2006 FY2007 FY2008
_____________________Note: Fiscal year ends September.(1) Q2 and Q3 include per gallon loss on hedging operations of 1.6¢ and 0.3¢, respectively.
Gasoline CPG Can Be Volatile on a Quarterly Basis…
(1)Net CPG Hedging Loss
(1)
16
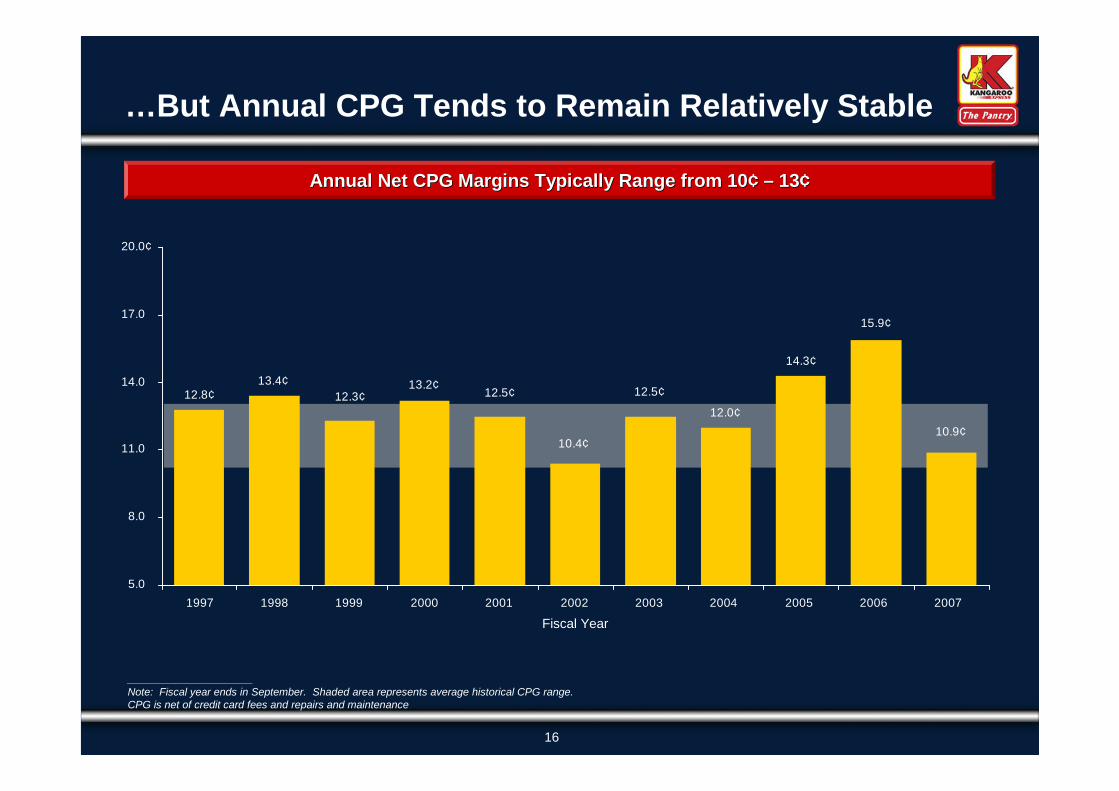
12.0¢
10.4¢
12.5¢13.2¢
12.3¢
13.4¢12.8¢ 12.5¢
14.3¢
15.9¢
10.9¢
5.0
8.0
11.0
14.0
17.0
20.0¢
1997 1998 1999 2000 2001 2002 2003 2004 2005 2006 2007
Fiscal Year
_____________________Note: Fiscal year ends in September. Shaded area represents average historical CPG range.CPG is net of credit card fees and repairs and maintenance
…But Annual CPG Tends to Remain Relatively Stable
Annual Net CPG Margins Typically Range from 10Annual Net CPG Margins Typically Range from 10¢¢ –– 1313¢¢
17
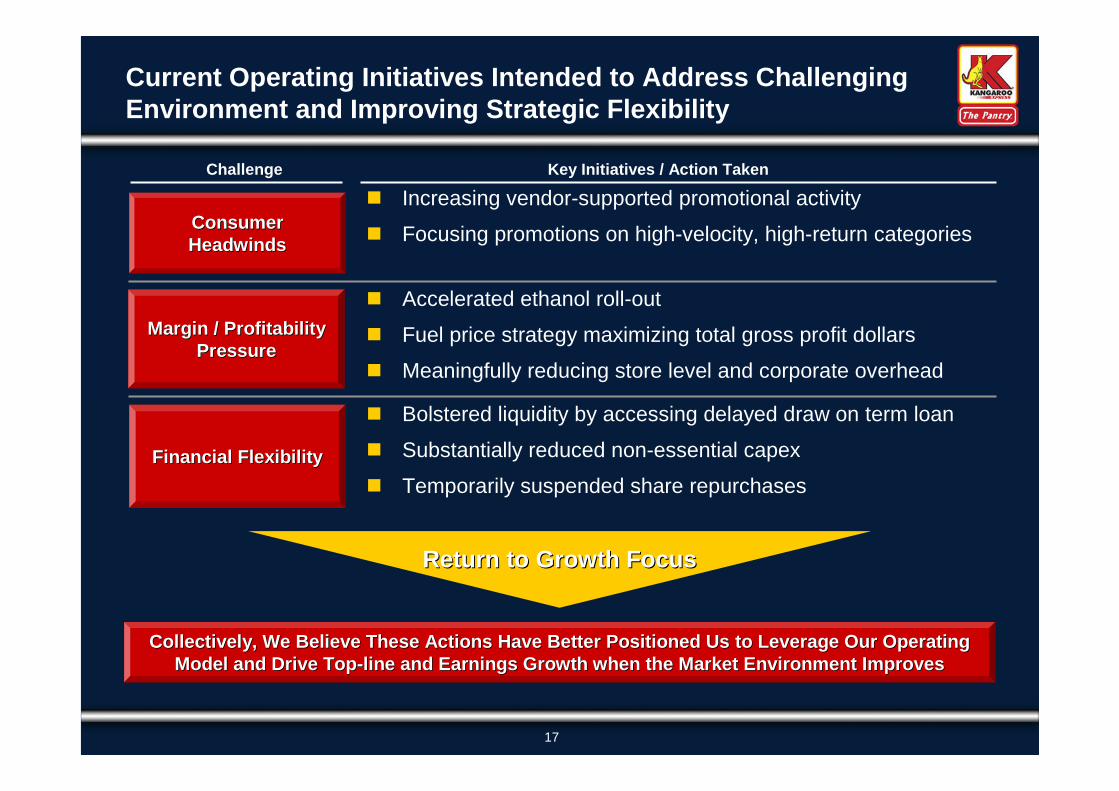
Current Operating Initiatives Intended to Address ChallengingEnvironment and Improving Strategic Flexibility
Return to Growth FocusReturn to Growth Focus
Collectively, We Believe These Actions Have Better Positioned UsCollectively, We Believe These Actions Have Better Positioned Us to Leverage Our Operatingto Leverage Our OperatingModel and Drive TopModel and Drive Top--line and Earnings Growth when the Market Environment Improvesline and Earnings Growth when the Market Environment Improves
ConsumerConsumerHeadwindsHeadwinds
Increasing vendor-supported promotional activity
Focusing promotions on high-velocity, high-return categories
Margin / ProfitabilityMargin / ProfitabilityPressurePressure
Financial FlexibilityFinancial Flexibility
Accelerated ethanol roll-out
Fuel price strategy maximizing total gross profit dollars
Meaningfully reducing store level and corporate overhead
Bolstered liquidity by accessing delayed draw on term loan
Substantially reduced non-essential capex
Temporarily suspended share repurchases
Challenge Key Initiatives / Action Taken
18
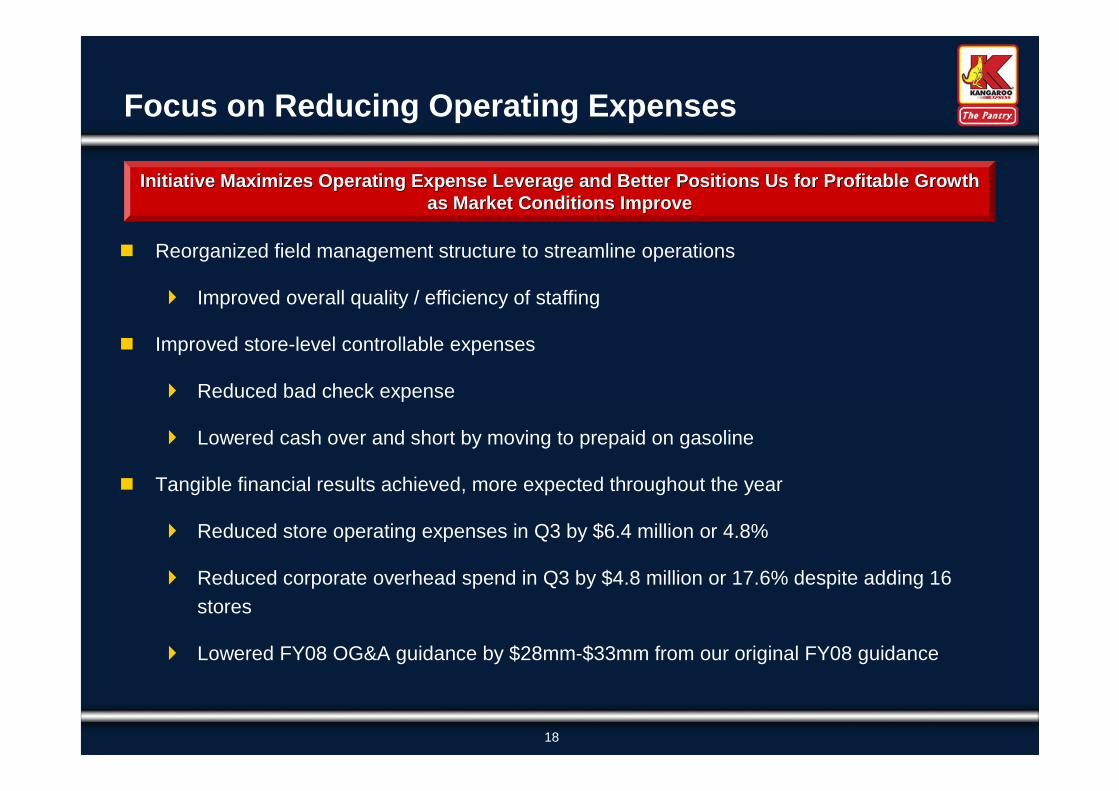
Reorganized field management structure to streamline operations
Improved overall quality / efficiency of staffing
Improved store-level controllable expenses
Reduced bad check expense
Lowered cash over and short by moving to prepaid on gasoline
Tangible financial results achieved, more expected throughout the year
Reduced store operating expenses in Q3 by $6.4 million or 4.8%
Reduced corporate overhead spend in Q3 by $4.8 million or 17.6% despite adding 16
stores
Lowered FY08 OG&A guidance by $28mm-$33mm from our original FY08 guidance
Initiative Maximizes Operating Expense Leverage and Better PositInitiative Maximizes Operating Expense Leverage and Better Positions Us for Profitable Growthions Us for Profitable Growthas Market Conditions Improveas Market Conditions Improve
Focus on Reducing Operating Expenses
19
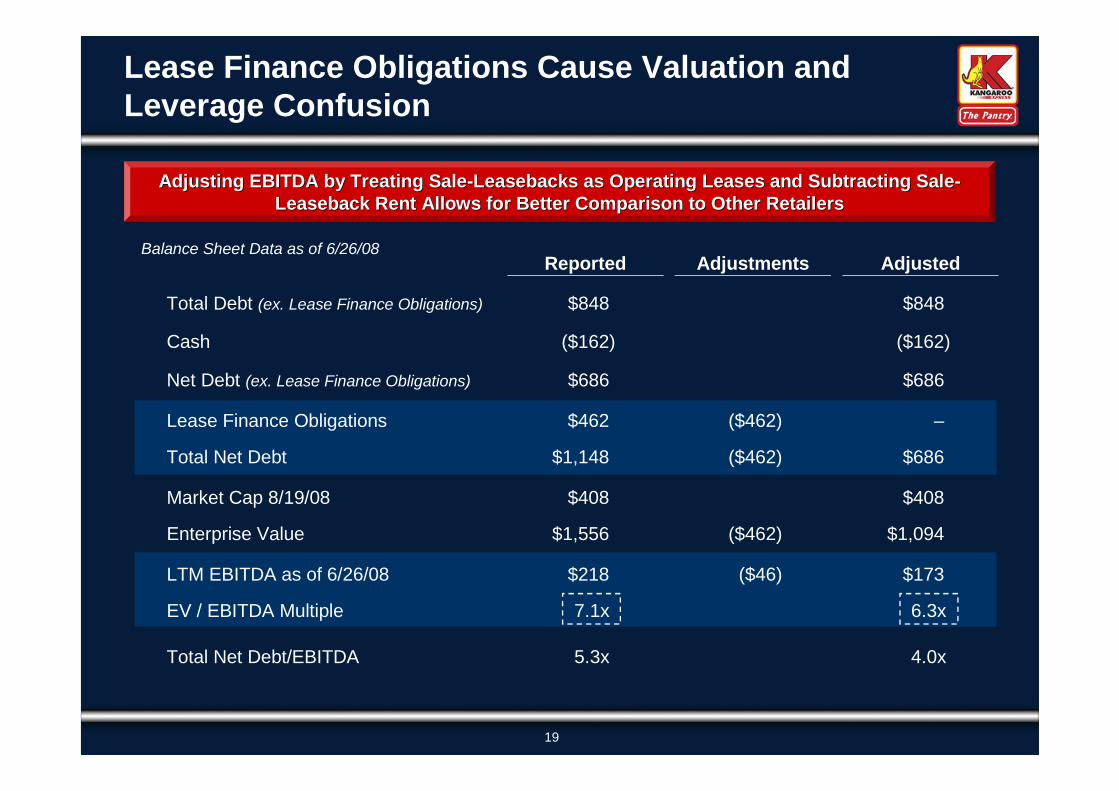
Lease Finance Obligations Cause Valuation andLeverage Confusion
Adjusting EBITDA by Treating SaleAdjusting EBITDA by Treating Sale--Leasebacks as Operating Leases and Subtracting SaleLeasebacks as Operating Leases and Subtracting Sale--Leaseback Rent Allows for Better Comparison to Other RetailersLeaseback Rent Allows for Better Comparison to Other Retailers
Balance Sheet Data as of 6/26/08Reported Adjustments Adjusted
Total Debt (ex. Lease Finance Obligations) $848 $848
Cash ($162) ($162)
Net Debt (ex. Lease Finance Obligations) $686 $686
Lease Finance Obligations $462 ($462) –
Total Net Debt $1,148 ($462) $686
Market Cap 8/19/08 $408 $408
Enterprise Value $1,556 ($462) $1,094
LTM EBITDA as of 6/26/08 $218 ($46) $173
EV / EBITDA Multiple 7.1x 6.3x
Total Net Debt/EBITDA 5.3x 4.0x
20
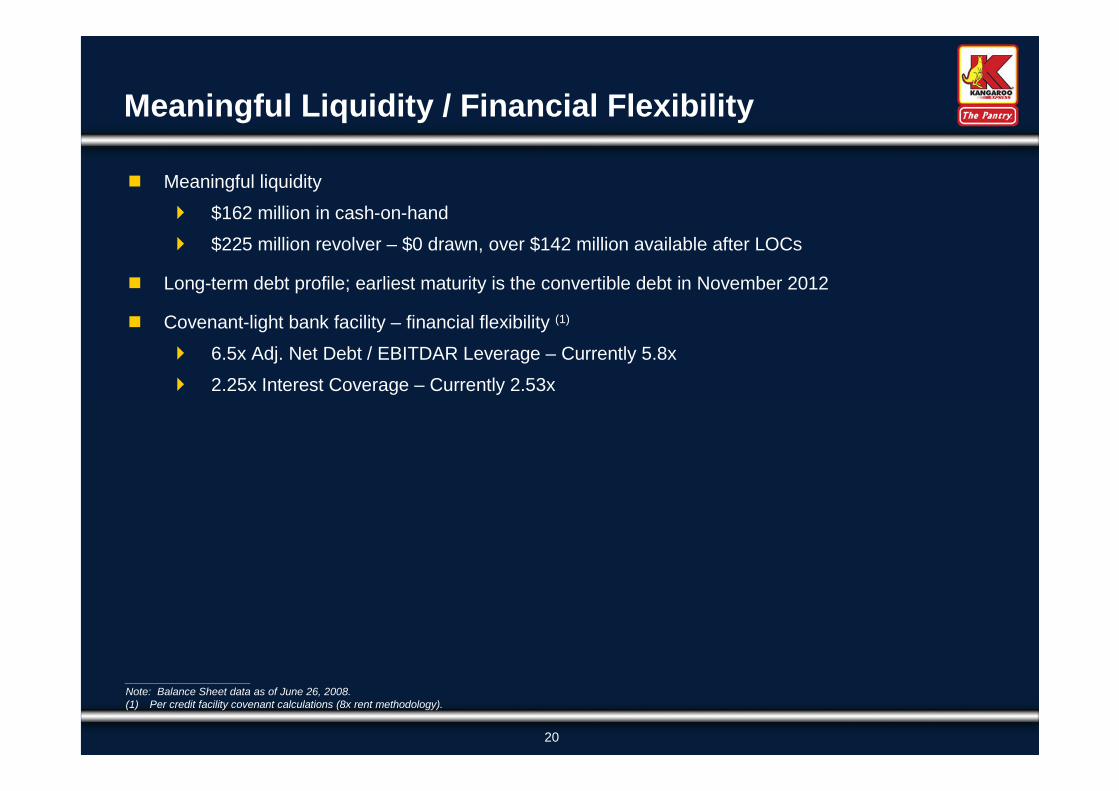
Meaningful liquidity
$162 million in cash-on-hand
$225 million revolver – $0 drawn, over $142 million available after LOCs
Long-term debt profile; earliest maturity is the convertible debt in November 2012
Covenant-light bank facility – financial flexibility (1)
6.5x Adj. Net Debt / EBITDAR Leverage – Currently 5.8x
2.25x Interest Coverage – Currently 2.53x
_____________________Note: Balance Sheet data as of June 26, 2008.(1) Per credit facility covenant calculations (8x rent methodology).
Meaningful Liquidity / Financial Flexibility
21
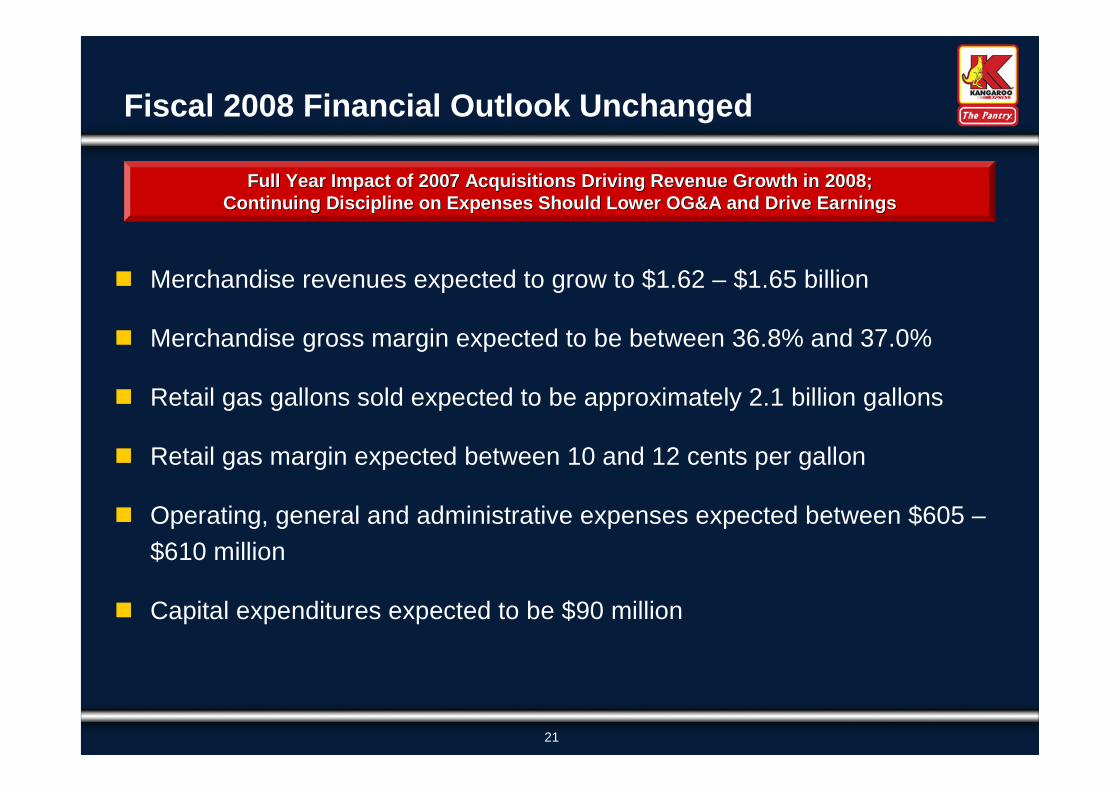
Merchandise revenues expected to grow to $1.62 – $1.65 billion
Merchandise gross margin expected to be between 36.8% and 37.0%
Retail gas gallons sold expected to be approximately 2.1 billion gallons
Retail gas margin expected between 10 and 12 cents per gallon
Operating, general and administrative expenses expected between $605 –
$610 million
Capital expenditures expected to be $90 million
Full Year Impact of 2007 Acquisitions Driving Revenue Growth inFull Year Impact of 2007 Acquisitions Driving Revenue Growth in 2008;2008;Continuing Discipline on Expenses Should Lower OG&A and Drive EaContinuing Discipline on Expenses Should Lower OG&A and Drive Earningsrnings
Fiscal 2008 Financial Outlook Unchanged
22
Leading market positions in attractive Southeastern markets
Significant scale advantages vs. primary competitors
Benefiting from consumer trends toward convenience formats
Leveraging infrastructure to drive profitability and future growth
Attractive sector growth and consolidation potential
Key Investment Highlights
Strong Cash Flow Generation to Reinvest in Our Business, DeStrong Cash Flow Generation to Reinvest in Our Business, De--lever and Drive Earnings Growthlever and Drive Earnings Growth
23
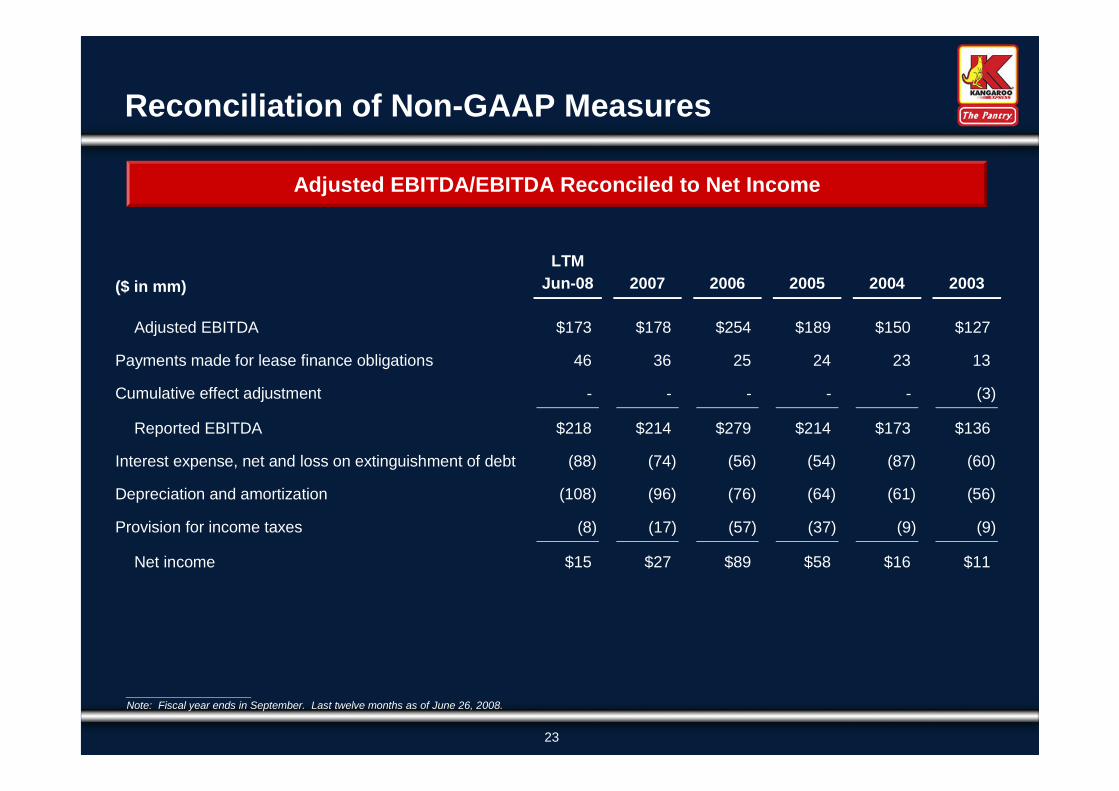
($ in mm)
LTM
Jun-08 2007 2006 2005 2004 2003
Adjusted EBITDA $173 $178 $254 $189 $150 $127
Payments made for lease finance obligations 46 36 25 24 23 13
Cumulative effect adjustment - - - - - (3)
Reported EBITDA $218 $214 $279 $214 $173 $136
Interest expense, net and loss on extinguishment of debt (88) (74) (56) (54) (87) (60)
Depreciation and amortization (108) (96) (76) (64) (61) (56)
Provision for income taxes (8) (17) (57) (37) (9) (9)
Net income $15 $27 $89 $58 $16 $11
Adjusted EBITDA/EBITDA Reconciled to Net Income
_____________________Note: Fiscal year ends in September. Last twelve months as of June 26, 2008.
Reconciliation of Non-GAAP Measures
24
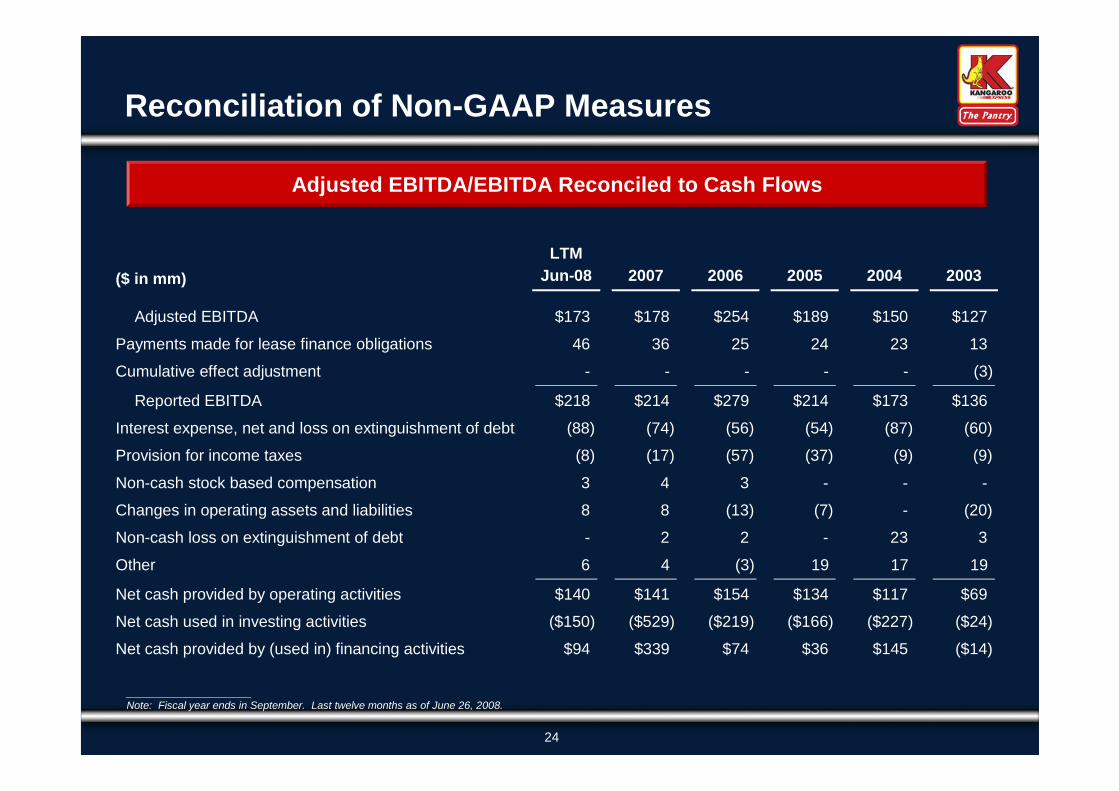
($ in mm)
LTM
Jun-08 2007 2006 2005 2004 2003
Adjusted EBITDA $173 $178 $254 $189 $150 $127
Payments made for lease finance obligations 46 36 25 24 23 13
Cumulative effect adjustment - - - - - (3)
Reported EBITDA $218 $214 $279 $214 $173 $136
Interest expense, net and loss on extinguishment of debt (88) (74) (56) (54) (87) (60)
Provision for income taxes (8) (17) (57) (37) (9) (9)
Non-cash stock based compensation 3 4 3 - - -
Changes in operating assets and liabilities 8 8 (13) (7) - (20)
Non-cash loss on extinguishment of debt - 2 2 - 23 3
Other 6 4 (3) 19 17 19
Net cash provided by operating activities $140 $141 $154 $134 $117 $69
Net cash used in investing activities ($150) ($529) ($219) ($166) ($227) ($24)
Net cash provided by (used in) financing activities $94 $339 $74 $36 $145 ($14)
Adjusted EBITDA/EBITDA Reconciled to Cash Flows
_____________________Note: Fiscal year ends in September. Last twelve months as of June 26, 2008.
Reconciliation of Non-GAAP Measures
25
The Pantry, Inc.
Morgan Keegan 2008 Equity Conference
September 5, 2008