Panic disorder: an integrative assessment of brain, body ...€¦ · Panic Disorder: An Integrative...
28
i Panic Disorder: An Integrative Assessment of Brain, Body and Cognitive Function A Thesis Presented for the Degree of Doctor of Philosophy Vikki Wise Bachelor of Science (Hons.) School of Population Health and Clinical Practice Faculty of Health Science The University of Adelaide, South Australia July , 2012
Transcript of Panic disorder: an integrative assessment of brain, body ...€¦ · Panic Disorder: An Integrative...

i
Panic Disorder: An Integrative Assessment of Brain, Body
and Cognitive Function
A Thesis Presented for the Degree of Doctor of Philosophy
Vikki Wise
Bachelor of Science (Hons.)
School of Population Health and Clinical Practice
Faculty of Health Science
The University of Adelaide, South Australia
July , 2012

Table of Contents
ii
Table of Contents
Title Page.......................................................................................................................... i
Table of Contents............................................................................................................. ii
Abstract............................................................................................................................. xiv
Declaration....................................................................................................................... xvi
Acknowledgements.......................................................................................................... xvii
List of Tables.................................................................................................................... xviii
List of Figures................................................................................................................... xx
List of Abbreviations....................................................................................................... xxiii
Overview of Thesis........................................................................................................... xxvi
Chapter 1 PANIC DISORDER…...…..………………………………………..….... 1
1.1 Overview of Chapter…..……………………………………………...…. 1
1.2 Panic Disorder Clinical Phenomenology…..……………….....………... 2
1.2.1 Panic Attacks……....……………………………………...…………… 3
1.2.2 Panic Disorder……...…….……………………………………………. 7
1.2.2.1 Panic Attacks in Panic Disorder…………………………….……… 10
1.2.2.2 Perception of Unpredictability and Uncontrollability……………… 13
1.2.2.3 Anticipatory Anxiety………………….………………………….… 15
1.2.2.4 Agoraphobia…...….…………….………….………………….…… 18
1.2.3 Prevalence of Panic Disorder…...…………….……………………….. 23
1.2.4 Comorbidity in Panic Disorder……………………………………….... 25
1.2.5 Course of Panic Disorder………………………………………………. 28
1.2.6 Quality of Life…...………………………....………………………….. 29
1.2.7 Treatment of Panic Disorder…...………….………………..………….. 32
1.2.7.1 Prediction of Treatment Response…………...……………………... 36
1.2.8 Panic Disorder Diagnostic Issues…………………………...…………. 37

Table of Contents
iii
1.2.9 Summary: Panic Disorder Clinical Phenomenology…………………... 40
1.3 Panic Disorder Aetiology..……………….…………………………...…. 40
1.3.1 Theories of PD Aetiology..…………………………………………….. 40
1.3.2 Genetic and Environmental Factors..………………………………….. 43
1.3.2.1 Relative Contribution of Genotype versus Environment…..….…… 43
1.3.2.2 Genetic Risk Factors.……………………………………………...... 44
1.3.2.3 Environmental Risk Factors…………..…………………………..... 46
1.3.3 Toward an Integrative Aetiology of Panic Disorder…………………... 49
1.4 Summary of Chapter….………………………………………………..... 52
Chapter 2 FEAR & ANXIETY: AN EVOLUTIONARY PERSPECTIVE............ 56
2.1 Overview of Chapter…….………………………………………………. 56
2.2 An Evolutionary Perspective: Proximate versus Ultimate
Explanations……………………………………………………………... 57
2.3 Sensory Information Appraisal and Detection of Threat....…………... 61
2.3.1 Significance and Attention………...…………………………………... 61
2.3.2 The Neural Circuitry of Threat Detection……………………………... 64
2.4 Defensive Responses…..…………………………………………………. 66
2.4.1 Ethological Studies………………...…………………………………... 67
2.4.2 Human Behavioural Findings.................................................................. 72
2.4.3 Conditioning Studies.…...…………………………………………....... 73
2.4.4 Human versus Non–Human Defensive Responses……...……….......... 75
2.4.5 Summary: Defensive Responses…….…………….…………………... 78
2.5 Adaptive versus Maladaptive Human Fear and Anxiety........................ 80
2.5.1 Regulation of Defences........................................................................... 83
2.5.2 Environmental Mismatch........................................................................ 85
2.6 Neural Organisation of Fear and Anxiety….….....…………………….. 86
2.6.1 Central Nervous System.......................................................................... 86
2.6.2 Autonomic Nervous System.................................................................... 89
2.7 Summary of Chapter…..………………………………………………… 95

Table of Contents
iv
Chapter 3 RESEARCH BACKGROUND………………………………………….. 97
3.1 Overview of Chapter……..……………………………………………… 97
3.2 The Extant Literatures…..………………………………………………. 98
3.3 The Present Research…..……………………………………………....... 101
3.4 Research Rationale…………..………………………………………....... 102
3.4.1 Between–Subjects Design…………………………...………………… 102
3.4.2 Study of Panic Disorder in the Inter–Panic versus Panic State………... 104
3.4.3 The Strong/Weak Situation Distinction…..……………………..…..…. 107
3.4.4 Subject Selection and Numbers………………………………………... 110
3.4.5 Data Integration…………………………………...………………….... 110
3.5 Summary of Chapter…………………………………………………….. 113
Chapter 4 OVERALL METHODOLOGY…………………………………...……. 114
4.1 Overview of Chapter…………………………………………………….. 114
4.2 Participants……………..………………………………………….…...... 115
4.2.1 Clinical participants………………..…………………………..………. 115
4.2.1.1 Inclusion and Exclusion Criteria for Clinical Participants…….....… 115
4.2.1.2 Recruitment of Clinical Participants……………………………...… 116
4.2.2 Control Participants………………………………………………….… 117
4.2.2.1 Inclusion and Exclusion Criteria for Control Participants………...... 117
4.2.2.2 Recruitment of Control Participants……………………………...… 117
4.2.3 Ethics Committee Approval and Informed Consent…………………… 118
4.2.4 Subject Numbers…......………………………………………………… 119
4.3 Overall Procedure……..…………………………………………………. 119
4.3.1 Overall Procedure: Web–based Questionnaires..…………………….... 119
4.3.2 Overall Procedure: Laboratory Assessment………………………….... 120
4.3.2.1 Psychophysiological Assessment…………………………………... 120
4.3.2.2 Cognitive Assessment………………………………………………. 122
4.3.3 Overall Procedure: Clinical Assessment………………………………. 122
4.4 Stimulus Materials……………………………………………………….. 123

Table of Contents
v
4.4.1 Stimulus Materials: Web–based Questionnaires………………………. 123
4.4.1.1 Handedness…………………………………………………………. 123
4.4.1.2 Depression Anxiety Stress Scales (DASS)…………………………. 124
4.4.2 Stimulus Materials: Laboratory Assessment…………………………... 124
4.4.3 Stimulus Materials: Clinical Assessment……………………………… 124
4.4.3.1 Comorbidity………………………………………………………… 124
4.4.3.2 Medication Use……………………………………………………... 125
4.4.3.3 Symptom Severity………………………………………………….. 125
4.4.3.3.1 Panic Disorder Severity Scale…………………………………… 125
4.4.3.3.2 State–Trait Anxiety Inventory…………………………………….. 126
4.4.3.3.3 Beck Depression Inventory–Second Edition……………………… 127
4.4.3.3.4 Body Sensations Questionnaire…………………………………... 127
4.4.3.3.5 Sheehan Disability Scale…………………………………………. 127
4.4.3.3.6 Sensory Gating Inventory………………………………………… 128
4.4.3.3.7 Panic Attack Diary……………………………………………….. 128
4.5 Data Cleaning…………………………………………………………….. 129
4.6 Data Reduction.………………………………………………………….. 130
4.7 Statistical Analyses………………………………………………………. 131
4.7.1 Statistical Analyses: Chapter 5................................................................ 132
4.7.2 Statistical Analyses: Chapters 6 – 8........................................................ 133
4.8 Summary of Chapter…………………………………………………….. 133
Chapter 5 DEMOGRAPHICS AND CLINICAL SEVERITY…………...……….. 135
5.1 Overview of Chapter………..……………………….…………………... 135
5.2 Data Cleaning……………………..……………………………………… 136
5.2.1 Demographic Data…………………………………..…………………. 136
5.2.2 DASS Data…………………………………….………………..……... 137
5.2.3 Clinical Data…………………………………………………………… 137
5.3 Statistical Analyses………………………………………………………. 137
5.3.1 Demographic Data……………………………………………………... 137
Table of Contents
vi
5.3.2 DASS Data…………………………….………………………………. 137
5.3.3 Clinical Data………………………………………………………….... 138
5.4 Results: Comparison of Patients and Controls….....…………………... 138
5.4.1 Demographics Check…………………………………………………... 138
5.4.2 Depression Anxiety Stress Scales (DASS)...……………………….….. 139
5.5 Results: Clinical Severity…….………………………………….………. 140
5.5.1 Descriptive Statistics………………………………………………....... 140
5.5.1.1 PD Diagnosis……………………………………………..………… 140
5.5.1.2 Panic Frequency and Panic Symptoms…………………..…………. 140
5.5.1.3 Clinical Severity Questionnaires……………………….…………... 140
5.5.1.4 Comorbidity……..………………...…………………...…………… 142
5.5.1.5 Medication…………………………………..……………………… 142
5.5.1.6 Summary: Descriptive Statistics.…………………………………… 144
5.5.2 Comparison of Patient Subgroups…………….………………….......... 145
5.5.2.1 Comparison 1: Males vs. Females with PD………..………….……. 145
5.5.2.2 Comparison 2: Younger vs. Older PD................................................ 145
5.5.2.3 Comparison 3: PDA vs. PD without Agoraphobia............................. 147
5.5.2.4 Comparison 4: Medicated vs. Unmedicated PD…………………..... 148
5.5.2.5 Comparison 5: Patients with vs. without Current Comorbidity…..… 148
5.5.2.6 Comparison 6: Patients with vs. without Depersonalization…….…. 149
5.5.2.7 Comparison 7: Shorter vs. Longer PD Duration…………………..... 149
5.5.2.8 Summary: Patient Subgroups……..………..…………………...….. 151
5.6 Summary of Chapter…………………………………………….………. 153
Chapter 6 STUDY 1. BRAIN AND BODY FUNCTION ‘AT REST’….....………. 155
6.1 Overview of Chapter…………………………………………………….. 155
6.2 Study Background……………………...……………………………...… 156
6.2.1 Psychophysiological Measures………………………………………… 156
6.2.1.1 Quantitative Electroencephalography………………………………. 156
6.2.1.2 Autonomic Measures……………………………………………….. 159

Table of Contents
vii
6.2.1.2.1 Cardiovascular Measures…..…………………………………… 159
6.2.1.2.2 Electrodermal Measures…...………………………………......... 160
6.2.2 Resting State Findings…………………………………………………. 162
6.2.2.1 QEEG Findings……………………………………………….......... 162
6.2.2.2 Autonomic Findings………………………………………………... 163
6.2.3 Defining ‘at rest’…...…………………………………...……………… 165
6.3 The Present Study………………………………………………………... 167
6.4 Method…………………………………………………………………..... 169
6.4.1 Participants……………………………………………………………... 169
6.4.2 Stimulus Materials and Procedure……………………………………... 169
6.4.3 Psychophysiology Data Acquisition, Artefact Correction, and Data
Reduction………………………………………..……………………... 170
6.4.3.1 Electroencephalography………...………………………………...... 170
6.4.3.2 Electrocardiography………………...……………………………..... 173
6.4.3.3 Electrodermal Activity………………………………...………….... 174
6.4.4 Data Cleaning…………………………………………………...……... 175
6.4.5 Statistical Analyses…………………………………………………….. 176
6.5 Results…………………………………………………………………….. 177
6.5.1 Panic Disorder vs. Matched Controls………………………………….. 177
6.5.1.1 Spectral Power……………………………………………………… 177
6.5.1.1.1 Spectral Power Summary Data…………………………………. 178
6.5.1.1.2 Theta…………………………………………………………….. 178
6.5.1.1.3 Alpha–1………………………………………………………….. 178
6.5.1.1.4 Alpha–2………………………………………………………….. 183
6.5.1.1.5 Beta……………………………………………………………… 185
6.5.1.2 Alpha Peak Amplitude……………………………………………… 185
6.5.1.3 Alpha Peak Frequency……………………………………………… 185
6.5.1.4 Frontal Alpha Asymmetry………………………………………….. 188
6.5.1.5 Autonomic Function………………………………………………... 189
6.5.2 Relationship of Clinical and Psychophysiological Measures………….. 190
6.6 Discussion……..………………………………………………………...... 191
Table of Contents
viii
6.6.1 Study Findings….……………………………………………………… 194
6.6.1.1 Spectral Power.................................................................................... 194
6.6.1.2 Alpha–1 Spectral Power…………..................................................... 195
6.6.1.3 Beta Spectral Power............................................................................ 196
6.6.1.4 Frontal Alpha Asymmetry………………………………………….. 199
6.6.1.5 Autonomic Findings….......………………………………………… 200
6.6.1.6 Clinical Severity and Psychophysiology…...………………………. 202
6.6.2 Study Limitations.................................................................................... 204
6.6.3 Conclusions and Future Directions………......………..……………….. 205
6.7 Summary of Chapter…………………………………………………….. 206
Chapter 7 STUDY 2. SENSORY INFORMATION PROCESSING…................... 209
7.1 Chapter Overview……...………………………………………………… 209
7.2 Study Background………...……………………………………………... 210
7.2.1 Auditory Oddball Task…………………...……………………………. 211
7.2.2 Event–Related Potentials……..…………………………...…………… 212
7.2.3 Empirical Findings…………………………………………………..… 214
7.2.3.1 ERP Findings……………………………………………………….. 214
7.2.3.2 Study 1 Findings……………………………………………………. 215
7.2.3.3 Depersonalization…………………………………………………... 216
7.2.3.4 Sensory Gating and Perceptual Phenomena………………………... 218
7.3 The Present Study………………………………………………………... 219
7.4 Method……………………………………………………………………. 221
7.4.1 Participants…………………………………………………………....... 221
7.4.2 Stimulus Materials and Procedure……………………………………... 221
7.4.3 Data Acquisition, Artefact Correction, and Data Reduction…………... 222
7.4.3.1 EEG Recording...…….……………………………………………... 222
7.4.3.2 ERP Measurement ……………………………………...………….. 222
7.4.3.3 Electrodermal Activity……………………………………………... 223
7.4.3.4 Performance Measures……………………………………………... 224

Table of Contents
ix
7.4.4 Data Cleaning………………………………………………………….. 224
7.4.5 Statistical Analyses…………………………………………………….. 224
7.5 Results…………………………………………………………………...... 225
7.5.1 Event–Related Potentials……………………………...……………. 225
7.5.1.1 ERP Summary Data……………………………………………... 225
7.5.1.2 N1……………………………………………………………….. 233
7.5.1.3 P2………………………………………………………………... 237
7.5.1.4 N2……………………………………………………………….. 237
7.5.1.5 P3………………………………………………………………... 237
7.5.2 Electrodermal Activity….………………………………………….. 241
7.5.3 Performance Measures…………………………………….……….. 241
7.5.4 Relationship of Clinical Measures with Auditory Oddball Measures…. 241
7.5.4.1 Clinical Severity……………………………………………………. 241
7.5.4.2 Comorbidity and Medication……..………………………………… 242
7.5.4.3 Depersonalization and Event–Related Potentials...…..…………….. 243
7.5.4.4 Sensory Gating……………………………………………………... 243
7.6 Discussion……………………………………………………………........ 244
7.6.1 Study 2 Findings...................................................................................... 244
7.6.1.1 N1 Amplitude and Topography……..……………………………... 245
7.6.1.2 P3 Amplitude and Latency...……………………………………….. 246
7.6.1.3 N2 and P2…...……………………………………………………… 249
7.6.1.4 Electrodermal and Behavioural Findings…………………………... 250
7.6.2 Study Limitations.................................................................................... 251
7.6.3 Conclusions and Future Directions…………........…………………….. 252
7.7 Summary of Chapter…………………………………………………….. 253
Chapter 8 STUDY 3. COGNITIVE FUNCTION………………………………….. 255
8.1 Overview of Chapter…………………………………………………….. 255
8.2 Study Background……………………………………………………….. 256
8.2.1 Cognitive Domains…………………………………………………….. 256
Table of Contents
x
8.2.1.1 Attention……………………………………………………………. 256
8.2.1.2 Memory…………………………………………………………….. 258
8.2.1.3 Executive Functions………………………………………………... 259
8.2.2 Neuropsychological Assessment….………………………………….... 260
8.2.3 Empirical Findings…………………………………………………….. 262
8.2.3.1 Neuropsychological Findings………………………………………. 262
8.2.3.2 Study 1 Findings……………………………………………………. 270
8.2.3.3 Study 2 Findings……………………………………………………. 272
8.2.3.4 Clinical Observations and Self–Reports…………………………..... 273
8.2.3.5 Empirical Findings: Summary……………………………………… 274
8.3 The Present Study………………………………………………………... 276
8.4 Method……………………………………………………………………. 277
8.4.1 Participants…………………………………………………………….. 277
8.4.2 Procedure………………………………………………………………. 277
8.4.3 Stimulus Materials…………………………………………………...… 279
8.4.3.1 Tapping Test…………………………………………………….. 279
8.4.3.2 Choice Reaction Time (CRT)…………………………………… 279
8.4.3.3 Verbal Learning………………..………………………………... 280
8.4.3.4 Span of Visual Memory…………………………………………. 280
8.4.3.5 Digit Span……………………………………………………….. 281
8.4.3.6 Verbal Interference……………………………………………… 281
8.4.3.7 Spot the Real Word……………………………………………… 282
8.4.3.8 Switching of Attention…………………………………………... 282
8.4.3.9 Word Generation………………………………………………... 283
8.4.3.10 Continuous Performance Test (CPT).…………………………... 283
8.4.3.11 Executive Maze…………………………………………………. 284
8.4.4 Data Cleaning………………………………………………………….. 284
8.4.5 Statistical Analyses………………………………………….…………. 285
8.5 Results..………………………………………………………………........ 287
8.5.1 Panic Disorder vs. Matched Controls……...…………………………... 287

Table of Contents
xi
8.5.1.1 Information Processing Speed……………………………………… 287
8.5.1.2 Verbal Memory……………………………………………………... 287
8.5.1.3 Working Memory Capacity………………………………………… 288
8.5.1.4 Sustained Attention…………………………………………………. 288
8.5.1.5 Sensorimotor Function….………………………………………….. 288
8.5.1.6 Verbal Processing…………………………………………………... 289
8.5.1.7 Executive Function…………………………………………………. 289
8.5.1.8 Estimated Intelligence……………………………………………… 290
8.5.2 Relationship of Clinical and Cognitive Function Measures.................... 290
8.5.2.1 Clinical Severity……………………………………………………. 290
8.5.2.2 Comorbidity and Medication……..………………………………… 290
8.6 Discussion…………………………………………………………...…..... 291
8.6.1 Study 3 Findings...................................................................................... 291
8.6.1.1. Information Processing Speed………………....………………….... 291
8.6.1.2 Verbal Memory……………………………….…………….............. 294
8.6.1.3 Working Memory Capacity……………..….………………………. 295
8.6.1.4 Sustained Attention…………...........….……………………………. 296
8.6.1.5 Sensorimotor Function….…………….…..…………………...…… 298
8.6.1.6 Verbal Processing……….......….…………………………………... 299
8.6.1.7 Executive Function……………………………………………......... 300
8.6.2 Study Limitations.................................................................................... 301
8.6.3 Conclusions and Future Directions……........…..............…………………. 302
8.7 Summary of Chapter…….………………………………………………. 304
Chapter 9 OVERALL CONCLUSIONS..………………………………………….. 306
9.1 Overview of Chapter.................................................................................. 306
9.2 Recapitulation of Findings......................................................................... 307
9.2.1 Study 1..................................................................................................... 307
9.2.2 Study 2..................................................................................................... 308
9.2.3 Study 3..................................................................................................... 309

Table of Contents
xii
9.2.4 Summary: Recapitulation of Findings..................................................... 309
9.3 Implications of Findings: Risk Factors, Maintenance Factors or
Intermediate Phenotypes?......................................................................... 311
9.3.1 Spectral Power......................................................................................... 312
9.3.1.1 Trait vs. State–Dependence................................................................ 312
9.3.1.2 Risk Factor or Consequence............................................................... 313
9.3.1.3 Malleability......................................................................................... 313
9.3.1.4 Treatment Response Prediction.......................................................... 314
9.3.1.5 Intermediate Phenotype...................................................................... 315
9.3.2 Frontal Asymmetry.................................................................................. 316
9.3.2.1 Trait vs. State–Dependence................................................................ 316
9.3.2.2 Risk Factor or Consequence............................................................... 318
9.3.2.3 Malleability......................................................................................... 319
9.3.2.4 Intermediate Phenotype...................................................................... 319
9.3.3 Heart Rate Variability.............................................................................. 321
9.3.3.1 Trait vs. State–Dependence................................................................ 321
9.3.3.2 Risk Factor or Consequence............................................................... 322
9.3.3.3 Malleability......................................................................................... 324
9.3.3.4 Intermediate Phenotype...................................................................... 326
9.3.4 Summary: Implications of Findings........................................................ 327
9.4 Integrating the Findings............................................................................. 330
9.4.1 Attention.................................................................................................. 330
9.4.2 Diminished Physiological Flexibility...................................................... 335
9.5 Research Limitations.................................................................................. 338
9.6 Future Directions……………………………………………………...…. 342
Appendices........................................................................................................................ 346
Appendix A Inclusion and Exclusion Criteria for Clinical Participants......................... 346
Appendix B Information Flyer for Patients.................................................................... 347
Appendix C Inclusion and Exclusion Criteria for Control Participants......................... 349
Appendix D Patient Information Sheet........................................................................... 350
Table of Contents
xiii
Appendix E Participant Information Sheet: Controls..................................................... 354
Appendix F Informed Consent Declaration: Clinical Participants................................. 359
Appendix G Informed Consent Declaration: Control Participants................................. 361
Appendix H Web–Based Questionnaires....................................................................... 363
Appendix I Recent Medication Questionnaire.............................................................. 366
Appendix J Panic Attack Diary..................................................................................... 367
Appendix K Grand Averaged Waveforms for Patients with and without
Depersonalization....................................................................................... 369
Appendix L Wise et al. (2010) Article. An integrative assessment of brain and body
function ‘at rest’ in panic disorder: a combined quantitative
EEG/autonomic function study………………………………………….. 371
Appendix M Wise et al. (2009) Article. Event–related potential and autonomic signs
of maladaptive information processing during an auditory oddball task
in panic disorder......................................................................................... 382
References......................................................................................................................... 393

xiv
Abstract
Panic disorder is a highly generalised anxiety disorder in the sense that, even in the
absence of panic, it is associated with wide–ranging abnormalities across multiple levels
of function (e.g., central and peripheral physiology, behaviour, cognition, affect)
(Friedman, 2007). Although the extant research literature has typically examined
responses to explicitly threat–related stimuli in PD, it is increasingly recognised that
panic disordered individuals differ from unaffected controls in their response to
normatively non–threatening events, including ‘resting state’ paradigms (Grillon, 2008).
In comparison to less integrative research designs, multivariate, multi–level research
may more comprehensively characterise function during the disorder’s tonic, between–
panic manifestation. The present research therefore examined PD in the between–panic
state with an integrative psychophysiological and neuropsychological assessment
comprising a range of normatively non–threatening paradigms.
Clinical participants with current PD (n = 53) and demographically–matched healthy
control participants (n = 106) completed an extensive laboratory–based assessment of
brain, body and cognitive function, the results of which are reported as three studies. In
Study 1, quantitative electroencephalography and autonomic (cardiovascular and
electrodermal) measures were concomitantly recorded during two resting state
conditions. The findings of this study demonstrate multiple abnormalities of brain and
body function at rest in PD. Findings of note include diminished synchronised
electrocortical activity within the alpha–1 frequency range, increased heart rate and
decreased beat–to–beat heart rate modulation (i.e. heart rate variability) in PD compared
to controls. In Study 2, event–related potential (ERP), autonomic and behavioural

xv
measures were obtained during performance of an auditory oddball task, to examine
sensory information processing and the allocation of attention to goal–relevant, non–
threatening stimuli in PD. Patients and controls differed on numerous ERP and
behavioural indices. ERP findings of note include reduced P3 amplitude to infrequent
auditory tones in PD compared to controls, and increased N1 amplitude to frequent,
irrelevant tones. Study 3 examined cognitive function in PD with an extensive
neuropsychological test battery comprising tests selected to assess the core cognitive
domains of attention, memory, executive functions, language and sensory–motor
function. The results support a selective deficit in the cognitive domain of sustained
attention, but normative function in the other assessed cognitive domains.
Considered together, many of the research findings indicate either impaired attentional
processing or diminished capacity for attentional processing in PD. The findings also fit
a theoretical model of diminished physiological flexibility, which proposes that in
generalised anxiety disorders such as PD there is less physiological differentiation of
baseline activity and stress–related reactivity to minor everyday and laboratory stressors
(Thayer & Lane, 2000; Friedman, 2007; Hoehn–Saric, 2007). The integrative
assessment identified numerous differences between patients and controls (i.e. disorder
markers) spanning multiple levels of function. As different types of disorder markers
(e.g., risk factors versus maintenance factors) may differentially benefit clinical practice
and research (Zvolensky et al. 2006c), future research is needed to classify the
identified markers so that their potential utility may be realised.

xvi
DECLARATION
This work contains no material which has been accepted for the award of any other
degree or diploma in any university or other tertiary institution to Vikki Wise and, to
the best of my knowledge and belief, contains no material previously published or
written by another person, except where due reference has been made in the text.
I give consent to this copy of my thesis, when deposited in the University Library,
being made available for loan and photocopying, subject to the provisions of the
Copyright Act 1968.
I also give permission for the digital version of my thesis to be made available on the
web, via the University’s digital research repository, the Library catalogue, and also
through web search engines, unless permission has been granted by the University to
restrict access for a period of time.
xvii
ACKNOWLEDGEMENTS
Firstly, I would like to thank the clinical research participants with panic disorder
who volunteered to participate in the present research, and without whose support
the present research would not have been possible. I also thank the control
participants who gave their time to take part in the database.
Also, I wish to thank to my supervisors, Professors Alexander (Sandy) McFarlane
and Richard Clark for their time, advice and support during this project.
I acknowledge the support of the Brain Resource International Database (under the
auspices of Brain Resource Ltd. www.brainresource.com) for use of the normative
and clinical data. Access to the database for scientific purposes is overseen by a
scientific network (BRAINnet; www.brainnet.net.org.au), which is coordinated
independently of the commercial operations of Brain Resource Ltd.
Finally, to my mum, my partner, and to those friends who made a difference –
THANK YOU.
List of Tables
xviii
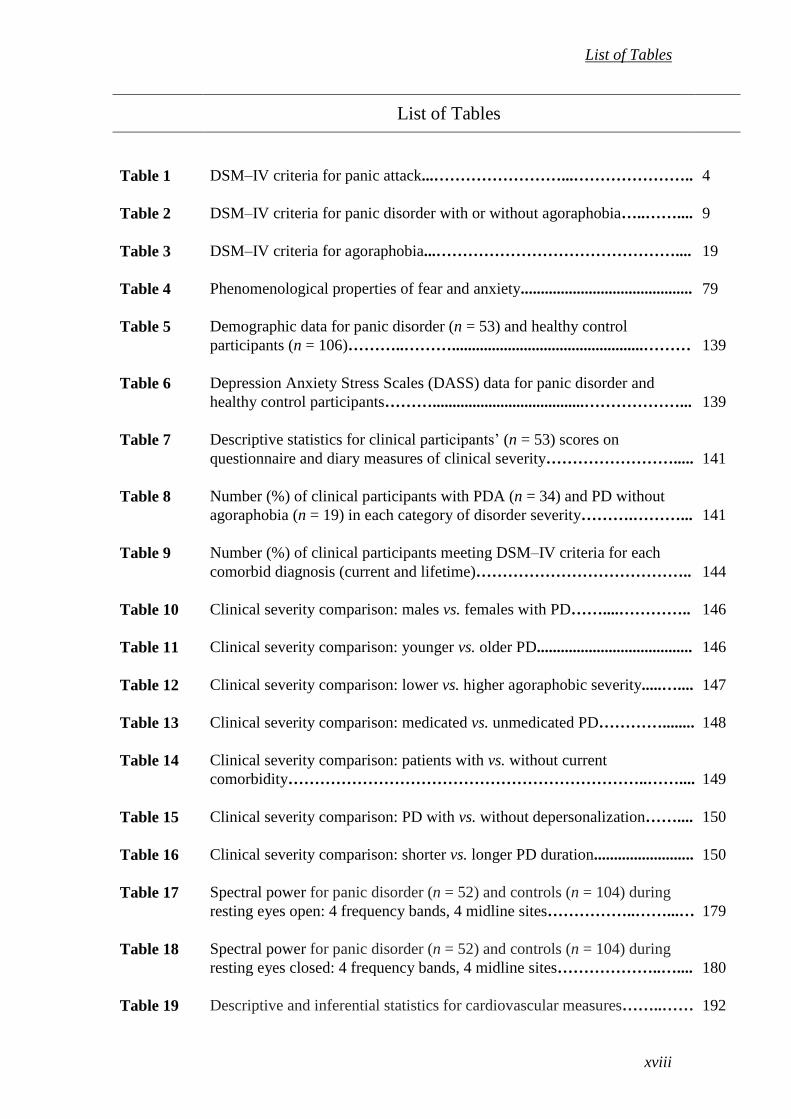
List of Tables
Table 1 DSM–IV criteria for panic attack...……………………...………………….. 4
Table 2 DSM–IV criteria for panic disorder with or without agoraphobia…..…….... 9
Table 3 DSM–IV criteria for agoraphobia...……………………………………….... 19
Table 4 Phenomenological properties of fear and anxiety........................................... 79
Table 5 Demographic data for panic disorder (n = 53) and healthy control
participants (n = 106)………..………................................................……… 139
Table 6 Depression Anxiety Stress Scales (DASS) data for panic disorder and
healthy control participants………......................................………………... 139
Table 7 Descriptive statistics for clinical participants’ (n = 53) scores on
questionnaire and diary measures of clinical severity……………………..... 141
Table 8 Number (%) of clinical participants with PDA (n = 34) and PD without
agoraphobia (n = 19) in each category of disorder severity……….………... 141
Table 9 Number (%) of clinical participants meeting DSM–IV criteria for each
comorbid diagnosis (current and lifetime)………………………………….. 144
Table 10 Clinical severity comparison: males vs. females with PD……....………….. 146
Table 11 Clinical severity comparison: younger vs. older PD....................................... 146
Table 12 Clinical severity comparison: lower vs. higher agoraphobic severity.....….... 147
Table 13 Clinical severity comparison: medicated vs. unmedicated PD…………........ 148
Table 14 Clinical severity comparison: patients with vs. without current
comorbidity…………………………………………………………..…….... 149
Table 15 Clinical severity comparison: PD with vs. without depersonalization…….... 150
Table 16 Clinical severity comparison: shorter vs. longer PD duration......................... 150
Table 17 Spectral power for panic disorder (n = 52) and controls (n = 104) during
resting eyes open: 4 frequency bands, 4 midline sites……………..……...… 179
Table 18 Spectral power for panic disorder (n = 52) and controls (n = 104) during
resting eyes closed: 4 frequency bands, 4 midline sites………………..….... 180
Table 19 Descriptive and inferential statistics for cardiovascular measures……..…… 192

List of Tables
xix
Table 20 Descriptive and inferential statistics for electrodermal measures…..……..... 193
Table 21 ERP group mean amplitudes for target tones at Sites Fz, Cz, and Pz……..... 226
Table 22 ERP group mean amplitudes for standard tones at Sites Fz, Cz, and Fz…..... 227
Table 23 ERP group mean latencies for target tones at sites Fz, Cz, and Pz…..……... 228
Table 24 ERP group mean latencies for standard tones at sites Fz, Cz, and Pz…….… 229
Table 25 Descriptive statistics for SCR frequency during auditory oddball task.......... 241
Table 26 Descriptive and inferential statistics for performance measures…………..... 242
Table 27 Principal components analysis–defined cognitive domains and tests............. 286
Table 28 Descriptive statistics for Information Processing Speed measures................. 287
Table 29 Descriptive statistics for Verbal Memory measures........................................ 287
Table 30 Descriptive statistics for Working Memory Capacity measures..................... 288
Table 31 Descriptive statistics for Sustained Attention measures................................. 288
Table 32 Descriptive statistics for Sensorimotor Function measures............................ 289
Table 33 Descriptive statistics for Verbal Processing measures.................................... 289
Table 34 Descriptive statistics for Executive Function measures.................................. 289
Table 35 Effect sizes for significant between–group differences.................................. 310
List of Figures
xx
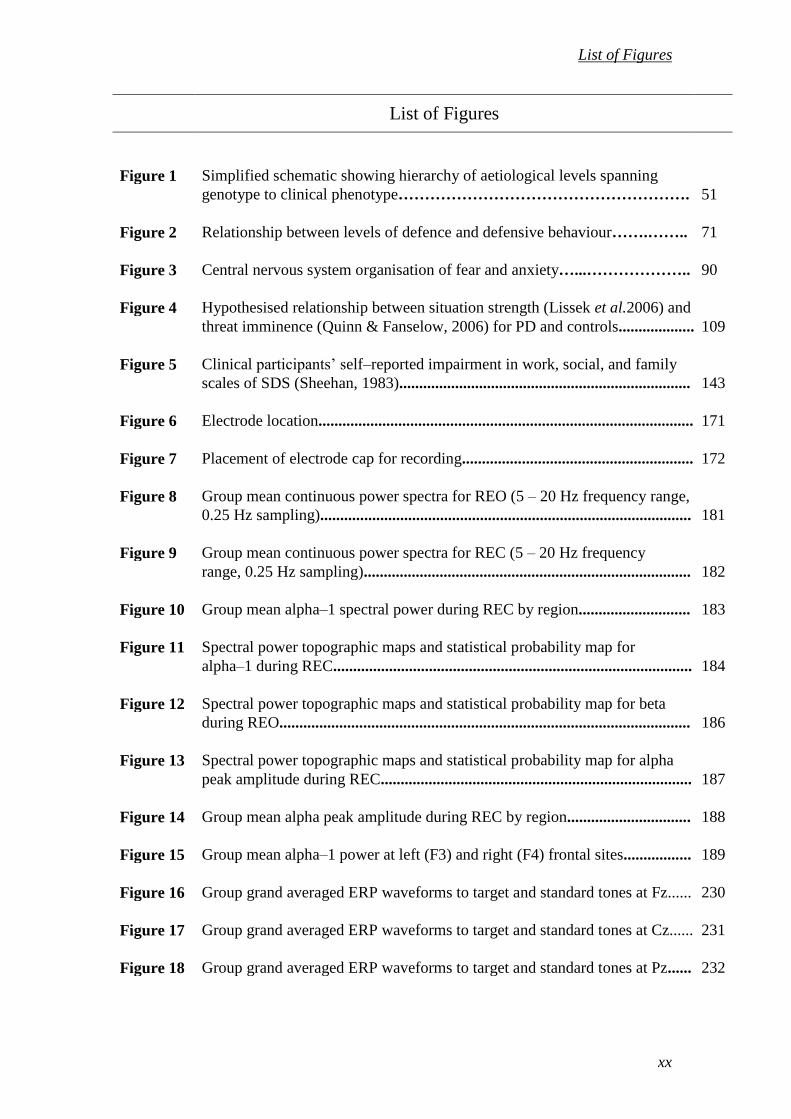
List of Figures
Figure 1 Simplified schematic showing hierarchy of aetiological levels spanning
genotype to clinical phenotype………………………………………………. 51
Figure 2 Relationship between levels of defence and defensive behaviour…….…….. 71
Figure 3 Central nervous system organisation of fear and anxiety…...……………….. 90
Figure 4 Hypothesised relationship between situation strength (Lissek et al.2006) and
threat imminence (Quinn & Fanselow, 2006) for PD and controls................... 109
Figure 5 Clinical participants’ self–reported impairment in work, social, and family
scales of SDS (Sheehan, 1983)......................................................................... 143
Figure 6 Electrode location.............................................................................................. 171
Figure 7 Placement of electrode cap for recording.......................................................... 172
Figure 8 Group mean continuous power spectra for REO (5 – 20 Hz frequency range,
0.25 Hz sampling)............................................................................................. 181
Figure 9 Group mean continuous power spectra for REC (5 – 20 Hz frequency
range, 0.25 Hz sampling).................................................................................. 182
Figure 10 Group mean alpha–1 spectral power during REC by region............................ 183
Figure 11 Spectral power topographic maps and statistical probability map for
alpha–1 during REC.......................................................................................... 184
Figure 12 Spectral power topographic maps and statistical probability map for beta
during REO....................................................................................................... 186
Figure 13 Spectral power topographic maps and statistical probability map for alpha
peak amplitude during REC.............................................................................. 187
Figure 14 Group mean alpha peak amplitude during REC by region............................... 188
Figure 15 Group mean alpha–1 power at left (F3) and right (F4) frontal sites................. 189
Figure 16 Group grand averaged ERP waveforms to target and standard tones at Fz...... 230
Figure 17 Group grand averaged ERP waveforms to target and standard tones at Cz...... 231
Figure 18 Group grand averaged ERP waveforms to target and standard tones at Pz...... 232

List of Figures
xxi
Figure 19 Group mean N1 amplitudes to target stimuli at sites Fz, Cz and Pz................. 234
Figure 20 Group mean N1 amplitudes to standard stimuli at sites Fz, Cz and Pz............. 234
Figure 21 Group mean topographic maps and statistical probability map for N1 target
amplitudes.......................................................................................................... 235
Figure 22 Group mean topographic maps and statistical probability map for N1
standard amplitudes........................................................................................... 236
Figure 23 Group mean P3 amplitudes at sites Fz, Cz and Pz............................................ 238
Figure 24 Group mean P3 latencies at sites Fz, Cz and Pz................................................ 238
Figure 25 Group mean topographic maps and statistical probability map for P3
amplitudes.......................................................................................................... 239
Figure 26 Group mean topographic maps and statistical probability map for P3
latencies............................................................................................................. 240
Figure 27 The cognitive test battery touch–screen............................................................ 278

List of Abbreviations
xxiii
List of Abbreviations
APF alpha peak frequency
ANS autonomic nervous system
APA American Psychiatric Association
BLA basolateral nucleus of the amygdala
BMI body mass index
BNST bed nucleus of the stria terminalis
BRID Brain Resource International Database
BSQ Body Sensations Questionnaire
CA central nucleus of the amygdala
CAN Central Autonomic Network
CBT cognitive–behavioural therapy
CNS central nervous system
COWA Controlled Oral Word Association test
CPT Continuous Performance Test
CR conditioned response
CRT Choice Reaction Time
CS conditioned stimulus
CVD cardiovascular disease
CVLT California Verbal Learning Test
DASS Depression Anxiety Stress Scales
DPF diminished physiological flexibility
DSM Diagnostic and Statistical Manual of Mental Diseases
DV dependant variable
ECG electrocardiogram
List of Abbreviations
xxiv
EDA electrodermal activity
EEG electroencephalogram
EMG electromyography
EOG electrooculogram
ERP event–related potential
FAA frontal alpha asymmetry
fMRI functional magnetic resonance imaging
GABA gamma–aminobutyric acid
GAD generalised anxiety disorder
G–G Greenhouse–Geisser correction
H–F Huynh–Feldt correction
HF high frequency
HR heart rate
HRV heart rate variability
ICD International Classification of Diseases
LF low frequency
LSA limited symptom (panic) attack
LTM long term memory
MDD major depressive disorder
mPFC medial prefrontal cortex
MTL medial temporal lobe
NS.SCR non–specific skin conductance response
OCD obsessive–compulsive disorder

List of Abbreviations
xxv
OR orienting reflex
PD panic disorder
PDA panic disorder with agoraphobia
PDSS Panic Disorder Severity Scale
PFC prefrontal cortex
PNS parasympathetic nervous system
PTSD post–traumatic stress disorder
QEEG quantitative electroencephalography
REC Resting Eyes Closed
REO Resting Eyes Open
RT reaction time
SAD social anxiety disorder
SCL skin conductance level
SCR skin conductance response
SDS Sheehan Disability Scale
SEM standard error of mean
SGI Sensory Gating Inventory
SNS sympathetic nervous system
SNRI serotonin and noradrenaline reuptake inhibitor
SSRI selective serotonin reuptake inhibitor
STAI State–Trait Anxiety Inventory
TMT Trail Making Test
UCS unconditioned stimulus
xxvi
Overview of Thesis
This thesis presents an integrative assessment of brain, body and cognitive function in
Panic Disorder (PD). The thesis content, broadly speaking, comprises two parts. The
first part of the thesis (Chapters 1 and 2) presents background information of a general
nature. The purpose of these two chapters is to provide a comprehensive overview of
PD, and of fear and anxiety – the two emotions which, iteratively, define its course. The
second part of the thesis (Chapters 3 – 9) presents the research conducted for this thesis.
The content of each thesis chapter is now briefly described.
Chapter 1 presents a comprehensive overview of PD. The focus of Chapter 1 is twofold.
The primary focus is on the clinical phenomenology of PD. Thus the chapter includes
discussions of the disorder’s diagnostic criteria, prevalence, comorbidities, prototypical
course, personal and societal costs, and treatment. Panic disorder aetiology is the
chapter’s secondary focus. Various aetiological models of PD are discussed, as are
genetic and environmental risk factors for PD.
Chapter 2 discusses fear and anxiety. This discussion places these two, distinct emotions
within a broad evolutionary context. Evolution–based disciplines make a fundamental
distinction between ultimate and proximate explanations of a given trait or disorder
(Nesse, 1999). Put briefly, proximate explanations concern individual differences in
illness vulnerability (Nesse, 1999). Thus the original research presented in Chapters 3 –
9 represents a proximate approach in that it aims to identify patient–control differences.
By contrast, ultimate explanations consider why all members of a species share a
vulnerability to a particular disorder (Nesse, 1999). Chapter 2 emphasises ultimate

xxvii
explanations of human fear and anxiety, as these two, complementary levels of
explanation are viewed as essential to a comprehensive, integrative account of human
vulnerability to a given disease (Gluckman et al. 2011; Nesse, 2011). Much of Chapter
2 is devoted to defensive responses, which are the phylogenetically ancient foundations
of human fear and anxiety. Other topics covered include sensory information appraisal
and threat detection mechanisms; adaptive versus maladaptive fear and anxiety, and; the
CNS and ANS organisation of fear and anxiety.
Chapter 3 introduces the research conducted for this thesis. Because this research is
presented as three separate studies in Chapters 6 – 8, and each of these chapters presents
empirical and conceptual background information of specific pertinence to that study,
Chapter 3 discusses the present research in necessarily broad terms. The first major
chapter section characterises the extant PD literatures of relevance to the present research.
The other major chapter section explicates the rationale for the present research, with
reference to five key research features. These are: 1) between–subjects design; 2) focus
on tonic as opposed to phasic PD; 3) comparison of PD and healthy controls in a ‘weak’
situation; 4) subject selection and subject numbers, and 5); data integration.
Chapter 4 presents the overarching methodology of the research conducted for this
thesis. As the three experimental chapters incorporate a Method section describing
aspects of the research methodology of specific relevance to that study (e.g., data
collection procedures, stimulus materials, statistical analyses), Chapter 4’s description
of the methodology is necessarily restricted to those elements that are common to all
three studies. Thus the chapter presents the respective study criteria for clinical and
control participants and discusses the methods of participant recruitment. Chapter 4 also

xxviii
describes the overall data collection procedure and stimulus materials in common to
each study. Notably, clinical measures are described. Finally, the chapter describes the
data cleaning, data reduction and statistical analysis methodologies in common to each
study.
Chapter 5 presents demographic and clinical data for the respective research samples.
The chapter presents three types of data, relating to: between–group demographic
comparisons; clinical severity measures, and; clinical heterogeneity within the panic
disordered sample.
Chapter 6 presents Study 1: Brain & Body Function ‘at Rest’. Before presenting the
study methodology and results, the chapter describes the psychophysiological
techniques used to derive indices of brain and body resting state function for Study 1,
and reviews quantitative electroencephalography and autonomic findings for PD. This is
followed by a discussion of the ‘resting state’, specifically, those elements of the
psychophysiology laboratory environment which may exert a differential effect on panic
disordered and healthy control subjects. The results of Study 1 have previously been
published in substantially similar form (Wise et al. 2010, see Appendix L).
Chapter 7 presents Study 2: Sensory Information Processing. Before presenting the
study methodology and results, the chapter presents background information relating to
adaptive sensory information processing, sensory gating, the auditory oddball task and
event–related potentials. This is followed by a discussion of empirical findings of
relevance for Study 2. The results of Study 2 have previously been published in
substantially similar form (Wise et al. 2009, see Appendix M).

xxix
Chapter 8 presents Study 3: Cognitive Function. The chapter begins by defining the
major cognitive domains encompassed by the neuropsychological assessment, and
reviewing empirical findings of relevance to the study. Following this background
information, the Study 3 research methodology and results are presented.
Chapter 9 presents the overall thesis conclusions. The chapter brings together findings
from Studies 1 – 3 and discusses the possible implications of the overall pattern of
results. Given the theoretical and clinical importance of distinguishing different types of
disorder markers (e.g., risk vs. maintenance factors, state vs. trait markers) (Kraemer et
al. 2001; Zvolensky et al. 2006c), evidence for a possible role of the observed patient–
control differences in PD aetiology and maintenance, where available, is discussed.
Finally, the chapter concludes with a discussion of several research strategies for future
PD research which may yield useful information for PD theory and clinical practice.