Panel Data Estimation of Labour Supply Equations …ageconsearch.umn.edu/bitstream/234636/2/Ooms et...
18
Panel Data Estimation of Labour Supply Equations for Dutch Dairy Farmers D.L. (Daan) Ooms 1 and A.R. (Alastair) Hall 2 1 Agricultural Economics and Rural Policy, Social Sciences Group, Wageningen University, Wageningen, The Netherlands 2 Economics Department, North Carolina State University, Raleigh NC, USA Contribution appeared in Arfini, F. (Ed.) (2005) “Modelling Agricultural Policies: State of the Art and New Challenges”, proceedings of the 89 th EAAE Seminar, pp. 893 - 909 February 2-5, 2005 Parma, Italy Copyright 2005 by D.L. (Daan) Ooms and A.R. (Alastair) Hall. All rights reserved. Readers may make verbatim copies of this document for non-commercial purposes by any means, provided that this copyright notice appears on all such copies.
Transcript of Panel Data Estimation of Labour Supply Equations …ageconsearch.umn.edu/bitstream/234636/2/Ooms et...
Panel Data Estimation of Labour Supply Equations for Dutch Dairy Farmers
D.L. (Daan) Ooms1 and A.R. (Alastair) Hall2
1 Agricultural Economics and Rural Policy, Social Sciences Group, Wageningen University, Wageningen, The Netherlands
2 Economics Department, North Carolina State University, Raleigh NC, USA
Contribution appeared in Arfini, F. (Ed.) (2005) “Modelling Agricultural Policies: State of the Art and New Challenges”, proceedings of the 89th EAAE Seminar, pp. 893 - 909
February 2-5, 2005
Parma, Italy
Copyright 2005 by D.L. (Daan) Ooms and A.R. (Alastair) Hall. All rights reserved. Readers may make verbatim copies of this document for non-commercial purposes by any means, provided that this copyright notice appears on all such copies.
893
Panel Data Estimation of Labour Supply Equations
for Dutch Dairy Farmers
D.L. (Daan) Ooms* and A.R. (Alastair) Hall **
Abstract
This research focuses on the estimation of labour supply equations for Dutch dairy farmers.
Off-farm labour supply is characterised by the fact that only half of the farm households sup-
ply off-farm labour. This results in a sample selection estimation problem that has to be taken
into account in estimation. In this research we use the panel data sample selection estimation
method of Wooldridge (1995) to estimate the off-farm labour supply equation. Simulation re-
sults suggest that the decoupledness assumption of direct income paymenst in CAP reform
might hold. At least there is a negligible effect through labour supply.
Introduction
This research focuses on the estimation of on- and off-farm labour supply equations for Dutch
dairy farmers. Off-farm labour supply of Dutch dairy farmers is characterised by the fact that
only half of the farm households supply off-farm labour. We assume that the farmers that sup-
ply off-farm labour is not a representative sample from the Dutch dairy farmers’ population.
This results in a sample selection estimation problem that has to be taken into account in esti-
mation. The Dutch Agricultural Research Institute (LEI) collects data for Dutch farm house-
holds. Every year a group of farm households leaves the data set and a new group enters. The
farm households are in the data set for a number of subsequent years. This results in a rotating
panel data set. A panel data set gives information on changes over time within the households
in the panel. Panel data estimation methods use this information in estimation. In this research
we use the panel data sample selection estimation method of Wooldridge (1995) to estimate
the off-farm labour supply equation. This estimation method is based on the fixed effects
panel data estimation method for linear models of Mundlak (1978). We will use this method to
estimate the linear on-farm labour supply equation. On June 26 2003 the European ministers
of agriculture agreed on a reform of the Common Agricultural Policy (CAP) (European Com-
mission, 2003). The reform entails a reduction in intervention prices for skimmed milk powder
of 15% (in three yearly steps of 5% from 2004 to 2006) and 25% for butter (three yearly steps
* Agricultural Economics and Rural Policy, Social Sciences Group, Wageningen University, Wageningen, The Nether-lands. ** Economics Department, North Carolina State University, Raleigh NC, USA.
Modelling Agricultural Policies: State of the Art and New Challenges
894
of 7% from 2004 to 2006 and 4% in 2007). Moreover, a prolongation of the milk quota sys-
tem until 2014/15 is agreed in combination with a milk quota increase (in the Netherlands) of
1.5% in three yearly steps of 0.5% starting in 2006. There will be no further quota increases,
but a market report to look at further quota increases will be presented once the reform is fully
implemented. As a further precaution against a possible surge in butter intervention post EU
enlargement, a new butter intervention ceiling was set at 70,000t in 2004/05, with an annual
cut of 10,000t until it reaches 30,000t in 2008/09. Finally, a decoupled direct income payment
of €35.50 per tonne is proposed. In the Netherlands there is a strong interest in the possible
effects of dairy policy reform given the economic importance of the dairy industry. The effects
of this policy change is simulated with the estimated on- and off-farm labour supply equations.
The remainder of this paper contains the following. First, a theoretical derivation of on-
and off-farm labour supply equations is given. After that we describe a general panel data sam-
ple selection model en explain the estimation method for it introduced by Wooldridge (1995).
The LEI data set does not contain all variables needed based on the theoretical derivation. We
describe how we deal with these data limitations. After that we give a description of the data
we do have at our disposal. Next we describe the empirical analyses and policy simulations
based on the estimated on- and off-farm labour supply equations. Finally, we give a brief
summary and some conclusions.
Theore t i ca l mode l
The following theoretical model is based on the household utility model of Huffman (1980). Labour supply decisions of dairy farm household i at time t are assumed to be the result of maximising utility (
itu ) received from a vector of consumption goods and services (
itc ) and
home time (ith
t,
) given a vector of utility shifting household characteristics (u,itz ) and a vector
of other variables influencing the households’ decision making environment (ito ),
( )
itu,ith,ititit,o;z,tcuu = (1)
where ( )u is a utility function that is the same for all households. Differences between the
utility levels of households come from the different choices made with respect to the elements of the utility function. Total time endowment ( 0
itt ) is allocated between farm labour (
itft ,), off-
farm labour (itoft ,
) and home time. Which results in the time constraint:
0,
,,,,
0!++= itofithitofitfit ttttt (2)
The time constraint is a strict equality because home time is defined to be the difference be-tween total time and labour time. Home time consists of leisure, household work, etc. A non-negativity constraint is imposed on off-farm labour because it may be zero. The value of household consumption is defined as the product of consumption goods and services with the
10. Modelling CAP Reform on Dairy Sector
895
price of consumption goods and services (c,tp ). We assume prices to be the same for all
households and only differ between time periods. Consumption is constrained by total income. Total income consists of income from the farm (
itfy ,), off-farm labour income (
itofy ,) and
other, non-farm non-labour income (ito
y,
).
itc,to,itof,itf,it 'cpyyy =++ (3)
Farm income is defined as production (
itq ) times output price (
tp ) minus variable input (
itg )
times variable input price (tv ) minus paid fixed costs associated with production (
itk ):
itittittf,it k'gv'qpy !!= (4)
Off-farm labour income is defined as off-farm labour time times off-farm wage (
itofw ,):
itofitofitof twy,,,
= (5)
Notice that we assume wages to be farm and time specific. Farm output (
itq ) is produced us-
ing household labour, variable inputs and fixed inputs (q,itz ):
( )
q,ititf,itit ;z,gtfq = (6)
( )f is a vector production function. Combining equations (3) to (6) results in:
( )
itc,to,itof,itof,ititittq,ititf,itt 'cpytwk'gv;z,gt'fp =++!! (7)
We assume the household maximises (1) subject to (7) and (2) by choosing the elements of the choice set
itof,itf,ith,itit g,,tt,t,c . The Kuhn-Tucker first-order conditions are:
!
"u
"cit= #
1pc,t
, (8)
2
,
!="
"
itht
u , (9)
!
"1pt'#qit
#t f,it$ "
2= 0, (10)
( ) 0,0,02,1,,2,1=!"#! $$$$ itofitofitofitof wttw , (11)

Modelling Agricultural Policies: State of the Art and New Challenges
896
!
"1
#qit#git
pt' $ vt%
& '
(
) * = 0 (12)
plus equations (7) and (2) where
1! is the marginal utility of income and
2! is the marginal
utility of time. If an interior solution exists (i.e. off-farm labour supply is non-zero) the first part of equation (11) holds as equality. This together with equation (10) can be solved to yield:
itof
tc
ith
it
w
p
tu
cu
,
,
,
!=""
"" (13)
and
itoft
it
it w'pg
q,
=!
! (14)
Equation (13) implies that the marginal rate of substitution between leisure and consumption goods is equal to the ratio of the consumption good price to the wage rate. Equation (14) im-plies that the marginal product of farm labour is equal to off-farm wage. A corner solution in this research occurs if off-farm labour supply is zero. Because for this research there is a par-ticular interest in labour decisions, we apply the solution approach for the system of Kuhn-Tucker conditions of Kimhi and Lee (1996). They carried out two steps. First, they expressed the two endogenous labour time variables (
itoft , and
itft ,) as a function of the other endoge-
nous variables (in our case: ith,itit g,t,c and the Lagrange multipliers). Second, they inserted the
reduced-form equations of the other endogenous variables into the structural endogenous la-bour supply equations. We assume that Dutch dairy farmers make their labour decisions recur-sive by first choosing the amount of labour needed on the farm and dividing remaining time between off-farm labour and leisure. Therefore we add a third step to the two steps of Kimhi and Lee (1996) in which the reduced form equation for off-farm labour supply is inserted in the on-farm labour supply equation. This results in the following recursive system of supply equations for off-farm labour (
ofs ) and on-farm labour (fs ).
( )0, ititq,itu,ito,ititttc,tof,itf,itofof,it to,z,z,y,k,v,p,p,w,tst = (15)
( )0, ititq,itu,ito,ititttc,tof,itff,it t,oz,z,y,k,v,p,p,wst = (16)
( )ofs and ( )fs are the off-farm and farm labour supply functions, respectively. Not all farm-
ers in western agriculture supply off-farm labour. It is assumed that the group of farmers that do supply off-farm labour is not a representative sample of all farmers. This, together with the availability of panel data, calls for panel data sample selection estimation methods.
10. Modelling CAP Reform on Dairy Sector
897
Pane l data sample se le ct ion
This section gives, first, a description of a general panel data sample selection model. After that
the panel data sample selection estimation methods of Wooldridge (1995) is described. This
method is a fixed effects extension of the sample selection estimation method for cross-section
data introduced by Heckman (1979). A simple extension in which a fixed effect estimator is
used for both steps in the Heckman approach does not produce consistent estimates (Woold-
ridge (2002) pp. 582-583).
A panel data sample selection model
The following gives a description of a general panel data sample selection model that is useful
for the explanation of panel data sample selection methods and for the empirical application in
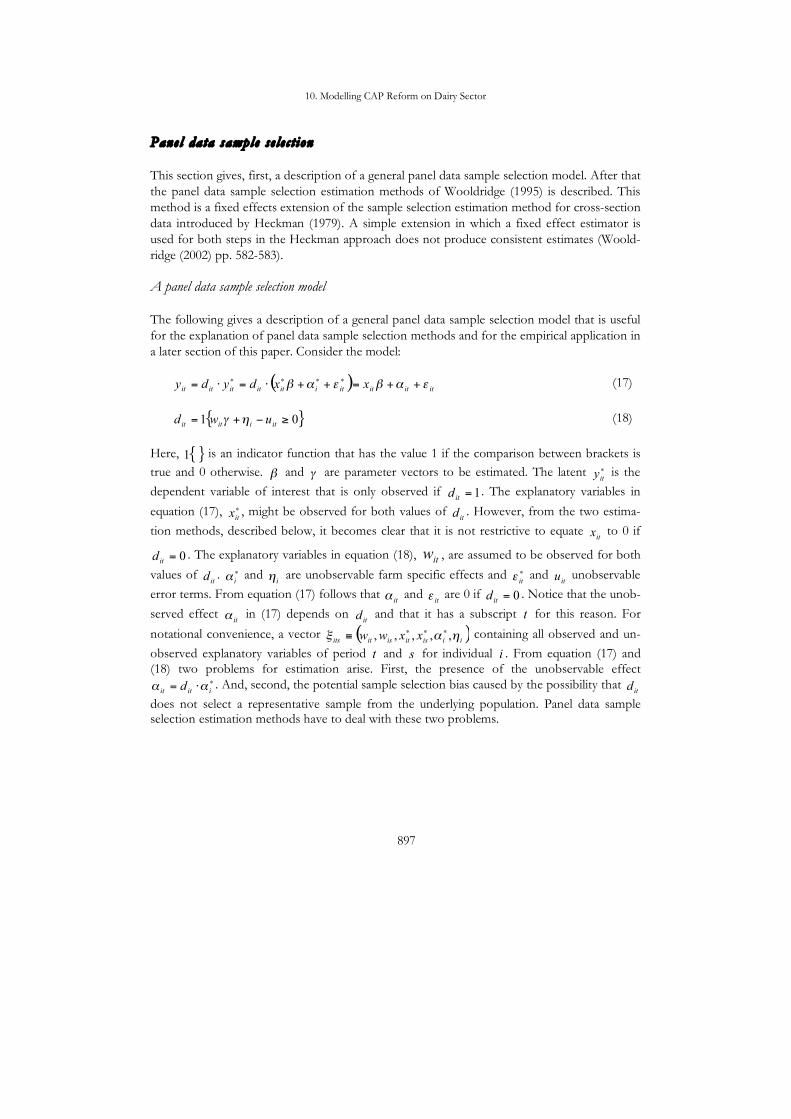
a later section of this paper. Consider the model:
( ) ititititiititititit xxdydy !"#!"# ++=++$=$= %%%% (17)
{ }01 !"+=
itiitituwd #$ (18)
Here, {}1 is an indicator function that has the value 1 if the comparison between brackets is
true and 0 otherwise. ! and ! are parameter vectors to be estimated. The latent !
ity is the
dependent variable of interest that is only observed if 1=itd . The explanatory variables in
equation (17), !
itx , might be observed for both values of
itd . However, from the two estima-
tion methods, described below, it becomes clear that it is not restrictive to equate itx to 0 if
0=itd . The explanatory variables in equation (18),
itw , are assumed to be observed for both
values of itd . !
i" and
i! are unobservable farm specific effects and !
it" and
itu unobservable
error terms. From equation (17) follows that it
! and it! are 0 if 0=
itd . Notice that the unob-
served effect it
! in (17) depends on itd and that it has a subscript t for this reason. For
notational convenience, a vector ( )iiisitisitits
xxww !"# ,,,,,$$$% containing all observed and un-
observed explanatory variables of period t and s for individual i . From equation (17) and (18) two problems for estimation arise. First, the presence of the unobservable effect
!"=
iititd ## . And, second, the potential sample selection bias caused by the possibility that
itd
does not select a representative sample from the underlying population. Panel data sample selection estimation methods have to deal with these two problems.
Modelling Agricultural Policies: State of the Art and New Challenges
898
Wooldridge (1995)
The panel data sample selection estimation method considered in this research is based on
Wooldridge (1995). This paragraph provides a short description of this estimator1. We men-
tioned before that a simple extension of the Heckman approach to a fixed effect panel data
situation does not work. Wooldridge (1995) shows that an extension based the panel data ap-
proach of Chamberlain (1980) does work. He also suggests the use of simplifications of
Chamberlain’s approach. One of these simplifications is the approach of Mundlak (1978).
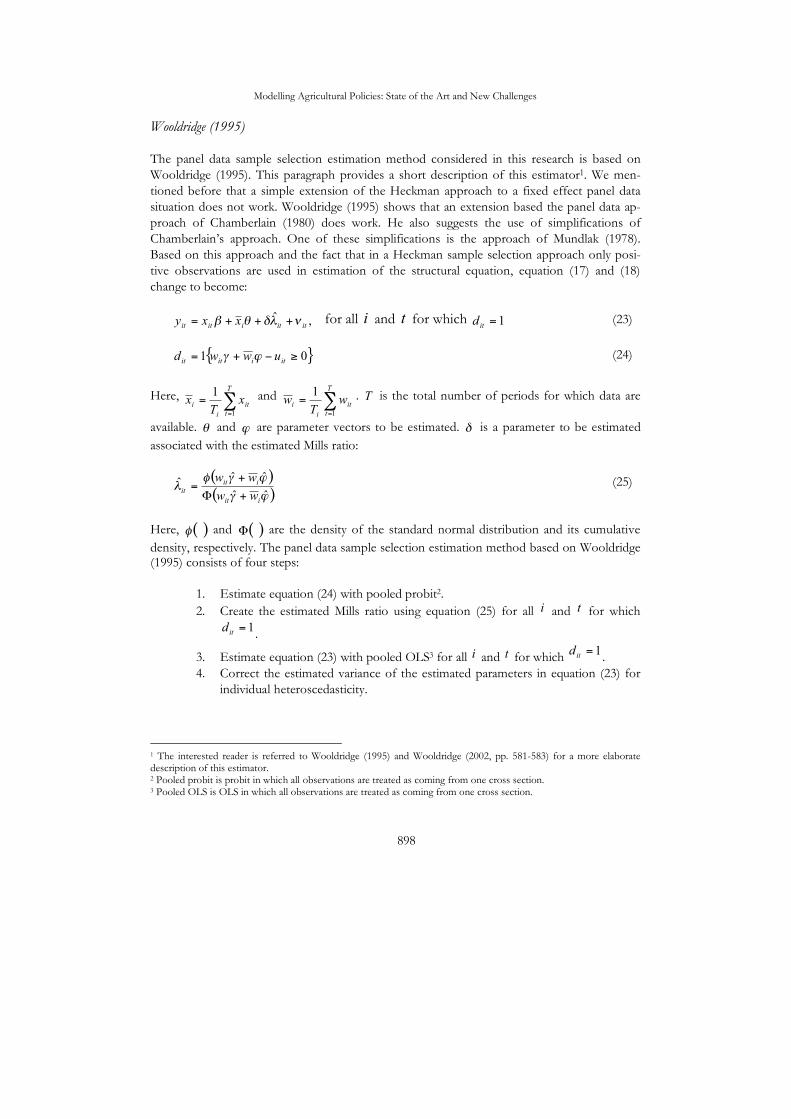
Based on this approach and the fact that in a Heckman sample selection approach only posi-
tive observations are used in estimation of the structural equation, equation (17) and (18)
change to become:
,ˆititiitit
xxy !"#$% +++= for all i and t for which 1=itd (23)
{ }01 !"+=
itiitituwwd #$ (24)
Here, !=
=T
t
it
i
ix
Tx
1
1 and !=
=T
t
it
i
iw
Tw
1
1 . T is the total number of periods for which data are
available. ! and ! are parameter vectors to be estimated. ! is a parameter to be estimated
associated with the estimated Mills ratio:
( )( )!"
!"#$
ˆˆ
ˆˆˆ
iit
iit
it
ww
ww
+%
+= (25)
Here, ( )! and ( )! are the density of the standard normal distribution and its cumulative
density, respectively. The panel data sample selection estimation method based on Wooldridge (1995) consists of four steps:
1. Estimate equation (24) with pooled probit2.
2. Create the estimated Mills ratio using equation (25) for all i and t for which
1=itd
.
3. Estimate equation (23) with pooled OLS3 for all i and t for which 1=
itd
.
4. Correct the estimated variance of the estimated parameters in equation (23) for
individual heteroscedasticity.
1 The interested reader is referred to Wooldridge (1995) and Wooldridge (2002, pp. 581-583) for a more elaborate description of this estimator. 2 Pooled probit is probit in which all observations are treated as coming from one cross section. 3 Pooled OLS is OLS in which all observations are treated as coming from one cross section.
10. Modelling CAP Reform on Dairy Sector
899
The last step is necessary because pooled OLS does not explicitly take the panel structure of
the data into account. This does not influence the parameter estimates in the Mundlak (1978)
approach, but it does influence the estimated variance of the estimated parameters. Appendix
A gives the formulas for the variance correction.
Data l imitations
Equation (17) and (18) show that labour supply is expressed in time units and is, amongst oth-
ers, explained by individual wages. The data set of Dutch dairy farmers at our disposal contains
on-farm hours. However, it does not contain off-farm hours and individual wages. This section
explains how we deal with these limitations.
Off-farm labour supply
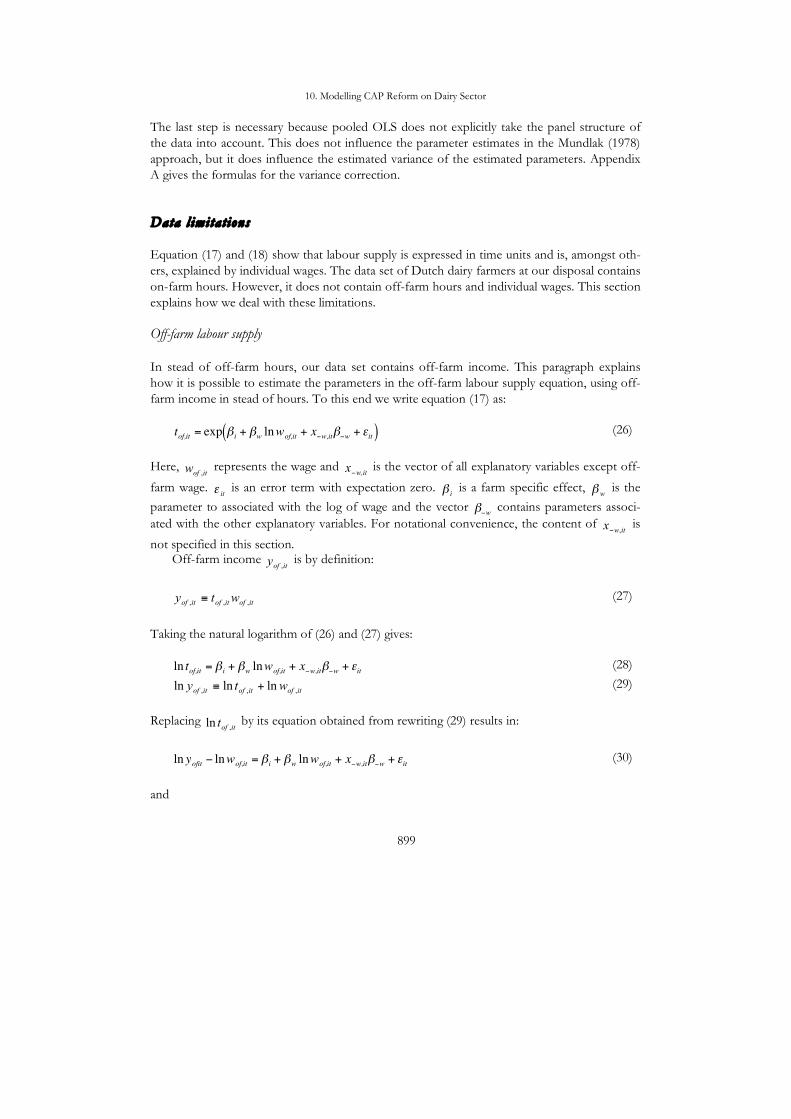
In stead of off-farm hours, our data set contains off-farm income. This paragraph explains
how it is possible to estimate the parameters in the off-farm labour supply equation, using off-
farm income in stead of hours. To this end we write equation (17) as:
!
tof,it = exp " i + "w lnwof,it + x#w,it"#w + $it( ) (26)
Here,
itofw , represents the wage and
w,itx! is the vector of all explanatory variables except off-
farm wage. it! is an error term with expectation zero.
i! is a farm specific effect,
w! is the
parameter to associated with the log of wage and the vector
!
"#w contains parameters associ-
ated with the other explanatory variables. For notational convenience, the content of itw
x,!
is
not specified in this section. Off-farm income
itofy , is by definition:
itofitofitof wty,,,
! (27)
Taking the natural logarithm of (26) and (27) gives:
!
ln tof,it = " i + "w lnwof,it + x#w,it"#w + $it (28)
itofitofitof wty ,,, lnlnln +! (29)
Replacing
itoft ,ln by its equation obtained from rewriting (29) results in:
!
ln yofit " lnwof,it = #i + #w lnwof,it + x"w,it#"w + $it (30)
and
Modelling Agricultural Policies: State of the Art and New Challenges
900
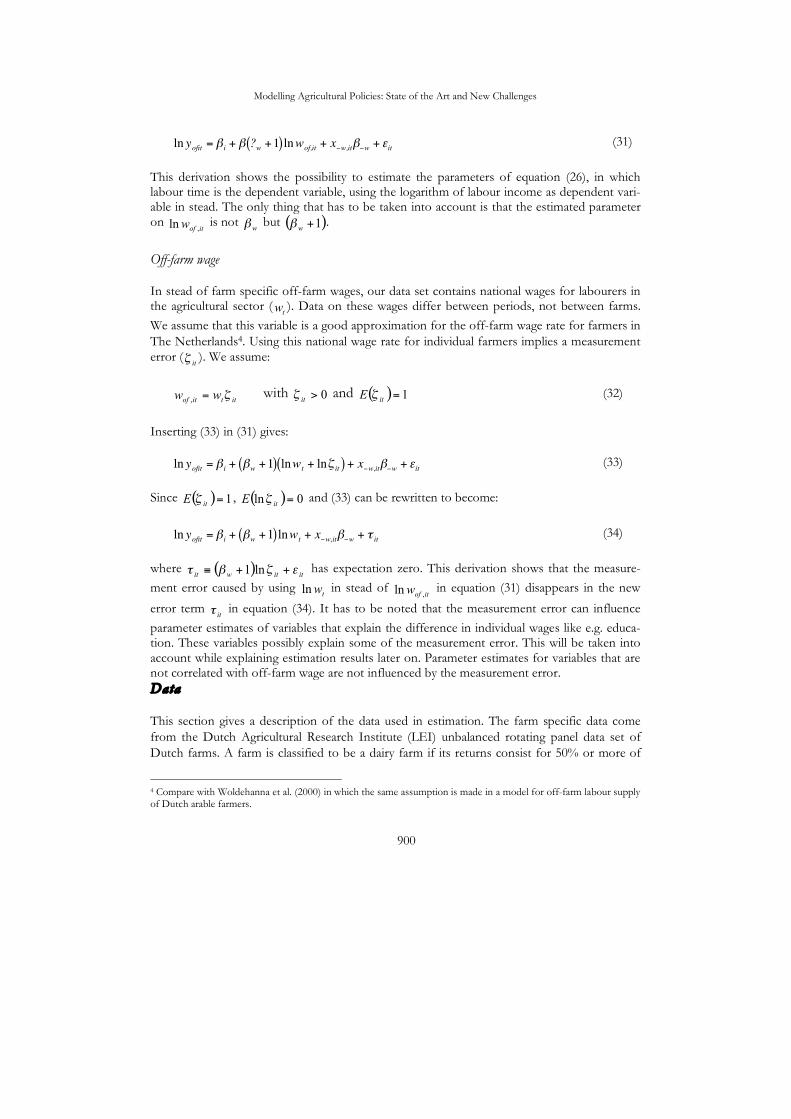
!
ln yofit = " i + " ?w +1( ) lnwof,it + x#w,it"#w + $it (31)
This derivation shows the possibility to estimate the parameters of equation (26), in which labour time is the dependent variable, using the logarithm of labour income as dependent vari-able in stead. The only thing that has to be taken into account is that the estimated parameter on
itofw ,ln is not w
! but ( )1+w
! .
Off-farm wage
In stead of farm specific off-farm wages, our data set contains national wages for labourers in the agricultural sector (
tw ). Data on these wages differ between periods, not between farms.
We assume that this variable is a good approximation for the off-farm wage rate for farmers in
The Netherlands4. Using this national wage rate for individual farmers implies a measurement error (
it! ). We assume:
ittitof ww !=,
with 0>it
! and ( ) 1=it
E ! (32)
Inserting (33) in (31) gives:
!
ln yofit = " i + "w +1( ) lnwt + ln# it( ) + x$w,it"$w + %it (33)
Since ( ) 1=
itE ! , ( ) 0ln =
itE ! and (33) can be rewritten to become:
!
ln yofit = " i + "w +1( ) lnwt + x#w,it"#w + $ it (34)
where ( )
ititwit!"#$ ++% ln1 has expectation zero. This derivation shows that the measure-
ment error caused by using twln in stead of
itofw ,ln in equation (31) disappears in the new
error term it! in equation (34). It has to be noted that the measurement error can influence
parameter estimates of variables that explain the difference in individual wages like e.g. educa-tion. These variables possibly explain some of the measurement error. This will be taken into account while explaining estimation results later on. Parameter estimates for variables that are not correlated with off-farm wage are not influenced by the measurement error.
Data
This section gives a description of the data used in estimation. The farm specific data come
from the Dutch Agricultural Research Institute (LEI) unbalanced rotating panel data set of
Dutch farms. A farm is classified to be a dairy farm if its returns consist for 50% or more of
4 Compare with Woldehanna et al. (2000) in which the same assumption is made in a model for off-farm labour supply of Dutch arable farmers.
10. Modelling CAP Reform on Dairy Sector
901
milk revenues. The data set consists of 6338 observations on 1307 farms. The period investi-
gated is from 1987/88 until 1999/00. National data come from Statistics Netherlands (CBS).
Off-farm labour is represented by off-farm income. The total number of family hours worked
on the farm represents on-farm labour. Off-farm wage is represented by the national index of
wages for agricultural hired labour. 1991 is the base year for this and subsequent indices. Price
variables, influencing farm income, are the milk price index; a Thornqvist price index for other
output and a Thornqvist index for non-factor input. Other output contains marketable crops,
veal, pigs, poultry and other farm revenues. Non-factor input contains, amongst others, feed
and veterinary costs. Paid factor costs contain paid rent and other costs of financing. Non-
farm non-labour income is a monetary value. It includes, amongst other, income from exter-
nally allocated capital and income from social allowances. Land is expressed in the number of
hectares used by the farmer. Machinery is the average value of machinery over the year divided
by the Thornqvist price index for machinery. Debt is the total value of short and long-term
debt. Assets are represented by their value calculated by the LEI. Unemployment is expressed
as the national unemployment rate. From the LEI data set it is possible to derive the impor-
tance of different activities as a percentage of total activity. This is based on output and the
allocation of resources. The percentage for milk production is used as the specialisation rate of
dairy farmers. Household variables used are number of household members; a dummy for the
presence of a successor and a dummy variable indication the education level of the head of the
household. See Appendix B for summary statistics of the data.
Empirica l analys is
This section gives estimation results for the off-farm labour supply equation and the on-farm
labour supply equation. The estimation method for the off-farm labour decision and off-farm
labour supply equation is described above in the panel data sample selection section. Since all
farm households supply labour to the farm, the on-farm labour supply equation (16) can be
estimated by linear panel data estimation methods. Equation (15) and (16) constitute a recur-
sive system of equations. We choose to estimate equation (16) in a way that is based on the
same idea as the way equation (15) is estimated. The Wooldridge (1995) approach we use is
based on pooled OLS where the farm specific unobserved effect is approximated in the way of
Mundlak (1978). We also estimate equation (16) with pooled OLS where the farm specific ef-
fect is approximated in the way of Mundlak (1978). The estimated variance of the parameter
estimates is adjusted for farm specific heterogeneity in the same way as is done in the Woold-
ridge (1995) estimation method. An advantage of the munlak approach is that it allows for time
invariant explanatory variables. This is not the case in the more well known fixed effects esti-
mation methods.
We perform a Hausman test5 to test our assumption of exogeneity of on-farm labour sup-
ply in the off-farm labour supply equation. The Hausman test requires that we have at least
one explanatory variable in the on-farm labour supply equation that does not appear in the off-
5 See e.g. Wooldridge (2002, p.119) for a description of this test.
Modelling Agricultural Policies: State of the Art and New Challenges
902
farm labour supply equation. We choose to use the on-farm specialisation rate for milk pro-
duction as the variable that does appear in the on-farm labour supply and the off-farm labour
decision equation, but not in the off-farm labour supply equation. The results of Weiss and
Briglauer (2000) suggest that off-farm labour is a diversification choice in the reduction of risk.
A high on-farm specialisation might increase the propensity to work off-farm to reduce risk.
We assume that this effect works mainly through the diversification decision. Based on this
assumption we only include on-farm specialisation in the off-farm labour decision equation
and not in the off-farm labour supply equation. A negative effect of labour specialisation on
on-farm labour use is an often-found result in economic research.
Results
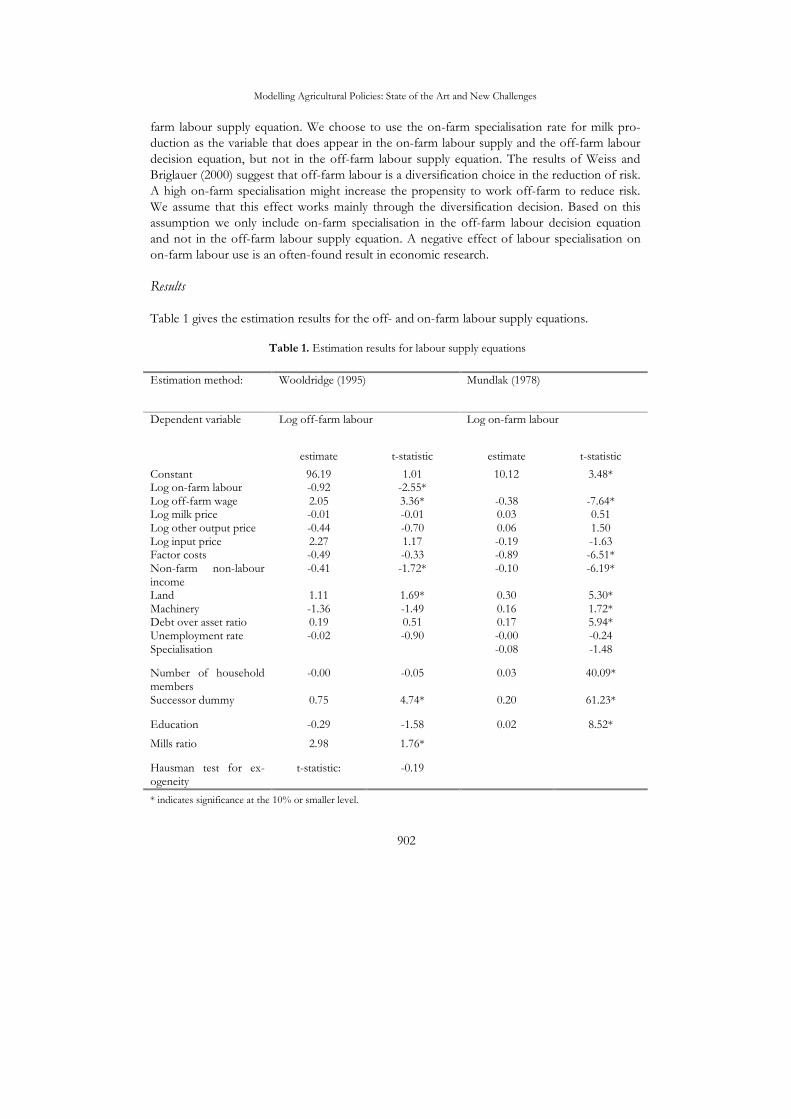
Table 1 gives the estimation results for the off- and on-farm labour supply equations.
Table 1. Estimation results for labour supply equations
Estimation method: Wooldridge (1995) Mundlak (1978)
Dependent variable Log off-farm labour Log on-farm labour
estimate t-statistic estimate t-statistic
Constant 96.19 1.01 10.12 3.48* Log on-farm labour -0.92 -2.55* Log off-farm wage 2.05 3.36* -0.38 -7.64* Log milk price -0.01 -0.01 0.03 0.51 Log other output price -0.44 -0.70 0.06 1.50 Log input price 2.27 1.17 -0.19 -1.63 Factor costs -0.49 -0.33 -0.89 -6.51* Non-farm non-labour income
-0.41 -1.72* -0.10 -6.19*
Land 1.11 1.69* 0.30 5.30* Machinery -1.36 -1.49 0.16 1.72* Debt over asset ratio 0.19 0.51 0.17 5.94* Unemployment rate -0.02 -0.90 -0.00 -0.24 Specialisation -0.08 -1.48
Number of household members
-0.00 -0.05 0.03 40.09*
Successor dummy 0.75 4.74* 0.20 61.23*
Education -0.29 -1.58 0.02 8.52*
Mills ratio 2.98 1.76*
Hausman test for ex-ogeneity
t-statistic: -0.19
* indicates significance at the 10% or smaller level.
10. Modelling CAP Reform on Dairy Sector
903
Before describing the estimation results we focus on two assumptions made in the theoretical
model section. First, we focus on the assumption that the group of farmers that supply off-
farm labour is not a representative sample of all farmers. Based on this assumption we choose
to use sample selection estimation methods. The Mills ratio used for sample selection correc-
tion is significant at the 10% level. Therefore, we conclude that our sample selection assump-
tion is correct. Second, we focus on the assumption that Dutch dairy farmers make their la-
bour decisions recursive by first choosing the amount of labour needed on the farm and divid-
ing remaining time between off-farm labour and leisure. This assumption implies exogeneity of
on-farm labour supply in the on-farm labour supply equation. The Hausman test statistic is not
significant. Therefore, the exogeneity assumption of on-farm labour in the off-farm labour
equation can not be rejected.
Now we know that two major assumptions we made are justified, we can focus on the pa-
rameter estimates. The parameter estimate for on-farm labour supply in the off-farm labour
supply equation is negative and significant. Since both the on-and off-farm labour variables are
expressed in logarithmic form the parameter estimate is an elasticity. The parameter estimate
indicates that, ceteris paribus, 92% of decrease in on-farm labour is allocated to off-farm la-
bour. Off-farm wage is significant and has an expected sign. The variables determining income
from farming all have expected signs in the on-farm labour equation. However, only the pa-
rameter for factor costs is significant. The fact that changes in milk price do not have a signifi-
cant impact on on-farm labour supply even though milk is the major output is not unexpected.
Since milk is produced under a production quota, the shadow price for labour does not depend
on output price changes. It can depend on input price changes through a substitution or com-
plementarity effect. However, apparently this effect either does not exist or the inputs are both
substitutes and complements to labour and the effect is cancelled in estimation. In the off-farm
labour supply equation, the parameter for factor costs has an unexpected sign. However this
parameter is not significant and, therefore, the sign does not matter. The parameter for non-
farm non-labour income is negative in both equations. This reflects the effect of an increase in
the consumption of leisure if income increases. Non-farm non-labour income has a larger ef-
fect on off-farm labour supply than on on-farm labour supply and its parameters are signifi-
cant. Land has a significantly positive impact on on-farm labour supply. It has a significantly
positive effect on off-farm labour supply. This indicates that larger farms supply more off-farm
labour and is in correspondence with other estimation results for off-farm labour supply (see
e.g. Goodwin and Holt (2002) and Ahituv and Kimhi (2002)). Also machinery has a signifi-
cantly positive impact on on-farm labour supply. Interesting to see is that machinery has a sig-
nificantly negative effect on off-farm labour supply. Apparently large farmers (based on the
amount of land) that supply off-farm labour have a relatively small amount of machinery. This
can be explained by the broad use of agricultural contract workers in The Netherlands that can
be hired with machinery. Apparently large farmers that supply off-farm work, make more use
of these contract workers. The debt over asset ratio has a significantly positive effect on on-
farm labour indicating that farmers work harder on-farm when debt increases. However, this
effect can not be found for off-farm labour supply. Apparently Dutch dairy farmers do no use
off-farm income to relieve debt. The unemployment rate does not have a significant effect on
labour supply. Specialisation in milk production has a negative effect on on-farm labour input,
Modelling Agricultural Policies: State of the Art and New Challenges
904
as expected. However, this effect is not significantly different from zero. Number of house-
hold members, the existence of a successor and education level have a significantly positive
effect on on-farm labour supply. For off-farm labour supply only the existence of a successor
has an effect significantly different from zero. This effect is positive. This can be explained by
the existence of Dutch dairy farms on which farm income is not enough for both the owner
family and the successor (and his family).
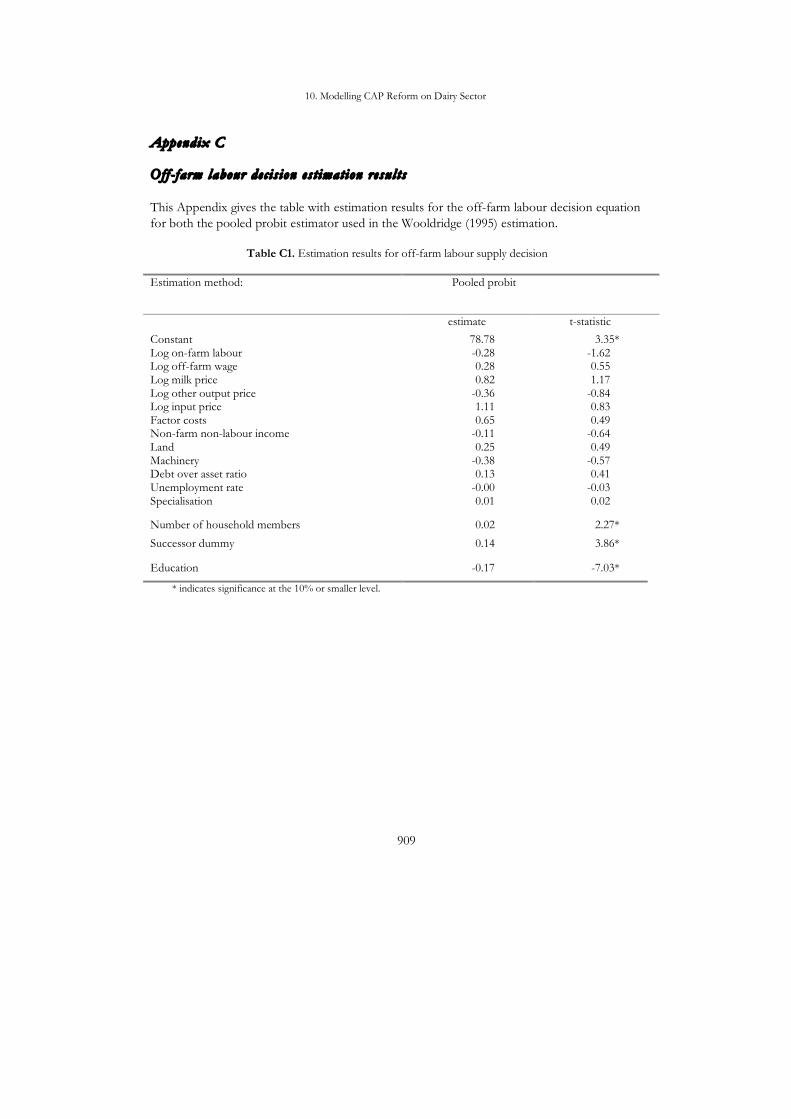
Appendix C gives the parameter estimates for the off-farm labour decision equation for
the pooled probit estimator used in the Wooldridge (1995) estimation. These results are not of
primary interest in this paper. Therefore, we do not describe them extensively. The overall
impression is that there are not many significant parameters. None of the parameters associ-
ated with time varying variables are significantly different from zero. On the other hand, all
parameters associated with time invariant variables are significant. From these estimations and
the estimations for the labour supply equations, follows that these time invariant household
variables are important for labour supply.
Pol icy Simulations
On June 26 2003 the European ministers of agriculture agreed on a reform of the Common
Agricultural Policy (CAP) (European Commission, 2003). The reform entails a reduction in
intervention prices for skimmed milk powder of 15% (in three yearly steps of 5% from 2004 to
2006) and 25% for butter (three yearly steps of 7% from 2004 to 2006 and 4% in 2007).
Moreover, a prolongation of the milk quota system until 2014/15 is agreed in combination
with a milk quota increase (in the Netherlands) of 1.5% in three yearly steps of 0.5% starting in
2006. There will be no further quota increases, but a market report to look at further quota
increases will be presented once the reform is fully implemented. As a further precaution
against a possible surge in butter intervention post EU enlargement, a new butter intervention
ceiling was set at 70,000t in 2004/05, with an annual cut of 10,000t until it reaches 30,000t in
2008/09. Finally, a decoupled direct income payment of €35.50 per tonne is proposed. In the
Netherlands there is a strong interest in the possible effects of dairy policy reform given the
economic importance of the dairy industry.
With the model estimated in this research, it is only possible to simulate a change at ones
of the milk price and the direct income payments. This is a limitation of the model. Later on
quota will be introduced in the model as an explanatory variable. This is a small deviation from
the theoretical model, but gives the opportunity to simulate the effect of the quota increase.
Simulating the price change and the direct income payments change leads to an on average
decrease of on farm labour of 8.26% and an on average increase of off-farm labour of 11.28%.
This last figure is the on average increase of farmers that are already supplying off-farm labour.
Output price theoretically does not have an impact on the shadow price of labour. We also do
not find an effect of milk price on labour supply. Therefore, it is a bit strange to simulate the
effect of a milk price cut on labour supply. Only simulating the effect of a change in direct
payments results in an average on-farm labour decrease of 0.09% and an average off-farm la-
bour supply decrease of 0.28%. This indicates that the change in direct income payment have a
10. Modelling CAP Reform on Dairy Sector
905
very small effect on labour supply. This is interesting since the payments are assumed decou-
pled. From this simulation follows that this assumption could hold. At least there is a negligible
effect through labour supply.
Summary and conclus ions
This research focuses on the estimation of on- and off-farm labour supply equations for Dutch
dairy farmers. Off-farm labour supply of Dutch dairy farmers is characterised by the fact that
only half of the farm households supply off-farm labour. We assume that the farmers that sup-
ply off-farm labour is not a representative sample from the Dutch dairy farmers’ population.
This results in a sample selection estimation problem that has to be taken into account in esti-
mation. The Dutch Agricultural Research Institute (LEI) collects data for Dutch farm house-
holds. Every year a group of farm households leaves the data set and a new group enters. The
farm households are in the data set for a number of subsequent years. This results in a rotating
panel data set. A panel data set gives information on changes over time within the households
in the panel. Panel data estimation methods use this information in estimation. In this research
we use the panel data sample selection estimation method of Wooldridge (1995) to estimate
the off-farm labour supply equation. This estimation method is based on the fixed effect panel
data estimation method for linear models of Mundlak (1978). We will use this method to esti-
mate the linear on-farm labour supply equation. The effects of CAP reform policy changes for
labour supply of Dutch dairy farmers is simulated with the estimated on- and off-farm labour
supply equations. The income compensation part of the policy change is assumed decoupled
from production decisions. Simulation results suggest that this assumption could hold. At least
there is a negligible effect through labour supply.
Reference s Ahituv A. and Kimhi A. (2002): “Off-Farm Work and Capital Accumulation Decisions of
Farmers Over the Life-Cycle: The Role of Heterogeneity and State Dependence”, Jour-nal of Development Economics, 68: 329-353.
CBS/LEI-DLO (2000): Landbouwcijfers, Landbouw-Economisch Instituut/Centraal Bureau voor de Statistiek, 's-Gravenhage/Voorburg.
Chamberlain G. (1980): “Analysis of Covariance with Qualitative Data”, Review of Economic Studies, 47: 225-238.
European Commission (2003): Press Release: EU fundamentally reforms its farm policy to accomplish sustainable farming in Europe, Brussels, European Commission DN: IP/03/898 Date: 26/06/2003.
(http://europa.eu.int/comm/agriculture/). Goodwin B.K. and Holt M.T. (2002): “Parametric and Semiparametric Modeling of the
Off-Farm Labor Supply of Agrarian Households in Transition Bulgaria”, American Jour-nal of Agricultural Economics, 84:184-209.
Modelling Agricultural Policies: State of the Art and New Challenges
906
Heckman J.J. (1979): “Sample Selection Bias as a Specification Error”, Econometrica, 47: 153-161.
Huffman W.E. (1980): “Farm and Off-Farm Work Decisions: The Role of Human Capi-tal”, Review of Economics and Statistics, 62: 14-23.
Kimhi A. and Lee M. (1996): “Off-farm Work Decisions of Farm Couples”, American Jour-nal of Agricultural Economics, 78: 687-698.
Mundlak Y. (1978): “On the Pooling of Time Series and Cross Section Data”, Econometrica, 46: 69-85.
Weiss C.R. and Briglauer W. (2000): “Determinants and Dynamics of Farm Diversificati-on”, FE-Working Papers, Kiel, University of Kiel.
Woldehanna T., Oude Lansink A. and Peerlings J. (2000): “Off-Farm Work Decisions on Dutch Cash Crop Farms and the 1992 and Agenda 2000 CAP Reforms”, Agricultural Economics, 22:163-171.
Wooldridge J.M. (1995): “Selection Corrections for Panel Data Models under Conditional Mean Independence Assumptions”, Journal of Econometrics, 68: 115-132.
Wooldridge J.M. (2002): Econometric analysis of cross section and panel data, Cambridge and London, MIT Press.
10. Modelling CAP Reform on Dairy Sector
907
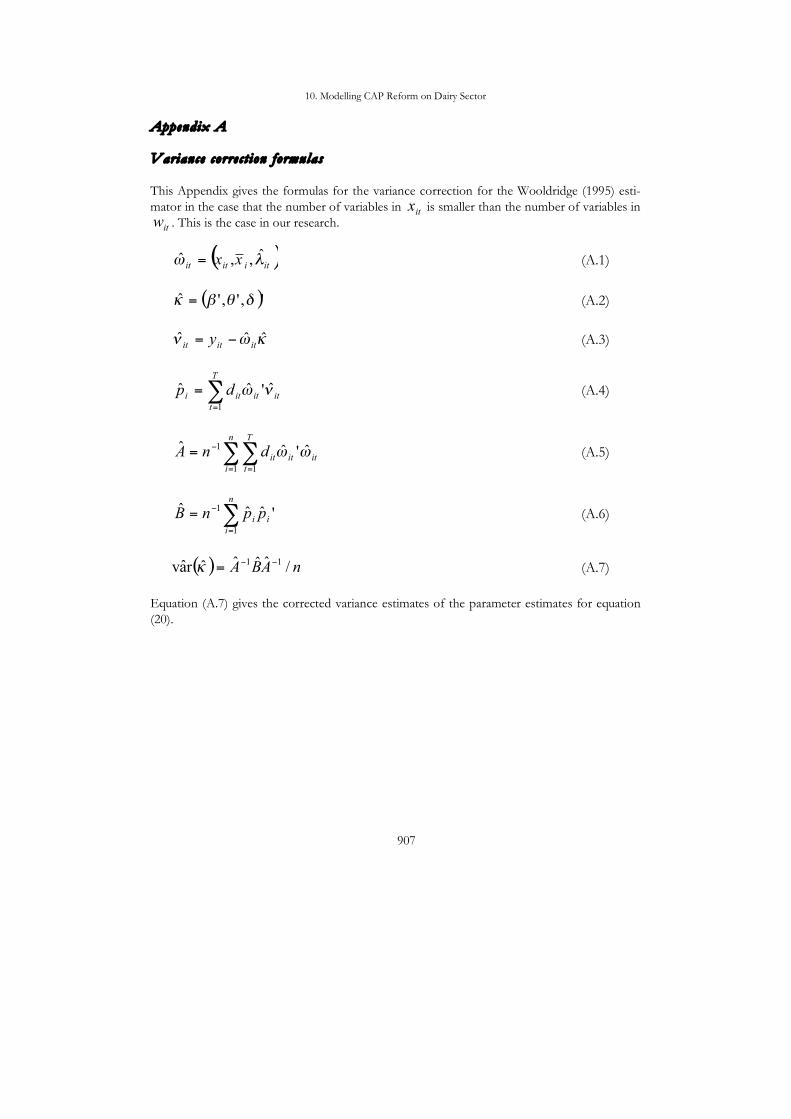
Appendix A Variance cor re ct ion formulas
This Appendix gives the formulas for the variance correction for the Wooldridge (1995) esti-
mator in the case that the number of variables in itx is smaller than the number of variables in
itw . This is the case in our research.
( )itiitit
xx !" ˆ,,ˆ = (A.1)
( )',','ˆ !"#$ = (A.2)
!"# ˆˆˆititit
y $= (A.3)
!=
=T
t
itititi dp1
ˆ'ˆˆ "# (A.4)
!!= =
"=
n
i
T
t
itititdnA
1 1
1ˆ'ˆˆ ## (A.5)
!=
"=
n
i
ii ppnB1
1'ˆˆˆ (A.6)
( ) nABA /ˆˆˆˆrav11 !!=" (A.7)
Equation (A.7) gives the corrected variance estimates of the parameter estimates for equation
(20).
Modelling Agricultural Policies: State of the Art and New Challenges
908
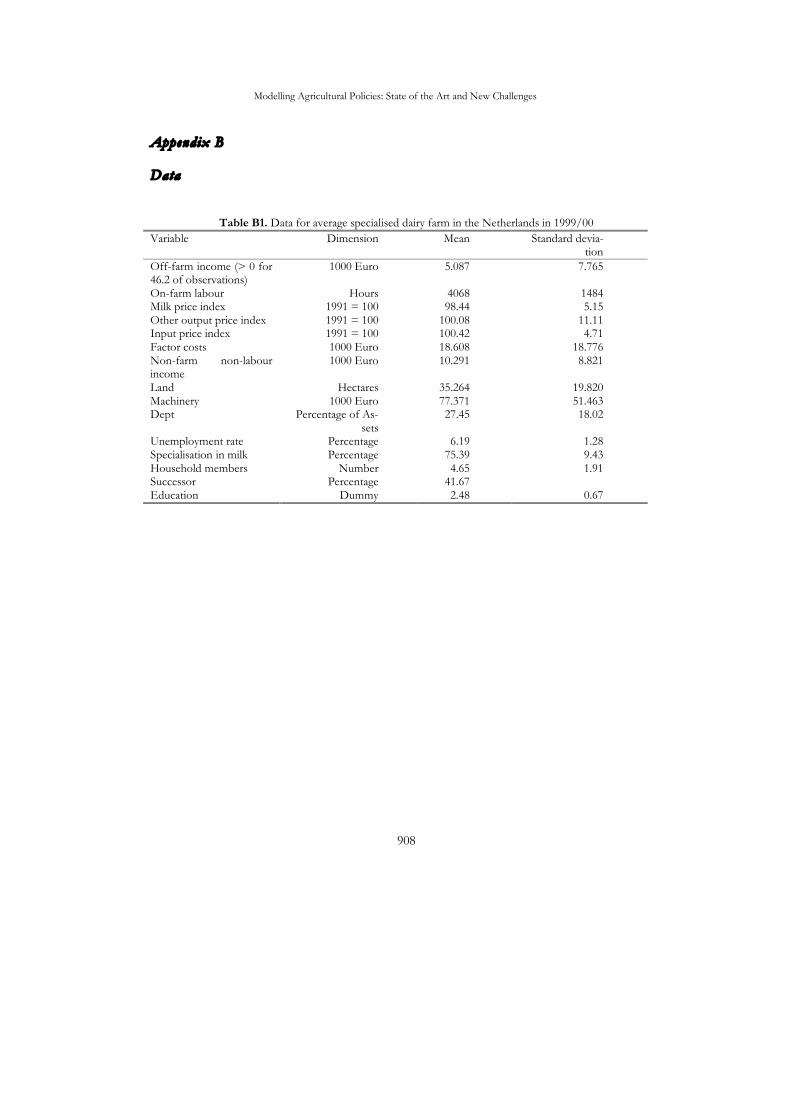
Appendix B Data
Table B1. Data for average specialised dairy farm in the Netherlands in 1999/00
Variable Dimension Mean Standard devia-tion
Off-farm income (> 0 for 46.2 of observations)
1000 Euro 5.087 7.765
On-farm labour Hours 4068 1484 Milk price index 1991 = 100 98.44 5.15 Other output price index 1991 = 100 100.08 11.11 Input price index 1991 = 100 100.42 4.71 Factor costs 1000 Euro 18.608 18.776 Non-farm non-labour income
1000 Euro 10.291 8.821
Land Hectares 35.264 19.820 Machinery 1000 Euro 77.371 51.463 Dept Percentage of As-
sets 27.45 18.02
Unemployment rate Percentage 6.19 1.28 Specialisation in milk Percentage 75.39 9.43 Household members Number 4.65 1.91 Successor Percentage 41.67 Education Dummy 2.48 0.67
10. Modelling CAP Reform on Dairy Sector
909
Appendix C Of f - farm labour de cis ion e s t imation re sul ts
This Appendix gives the table with estimation results for the off-farm labour decision equation
for both the pooled probit estimator used in the Wooldridge (1995) estimation.
Table C1. Estimation results for off-farm labour supply decision
Estimation method: Pooled probit
estimate t-statistic
Constant 78.78 3.35* Log on-farm labour -0.28 -1.62 Log off-farm wage 0.28 0.55 Log milk price 0.82 1.17 Log other output price -0.36 -0.84 Log input price 1.11 0.83 Factor costs 0.65 0.49 Non-farm non-labour income -0.11 -0.64 Land 0.25 0.49 Machinery -0.38 -0.57 Debt over asset ratio 0.13 0.41 Unemployment rate -0.00 -0.03 Specialisation 0.01 0.02
Number of household members 0.02 2.27*
Successor dummy 0.14 3.86*
Education -0.17 -7.03*
* indicates significance at the 10% or smaller level.