PANAJI SOLAR CITY MASTER PLAN
122
PANAJI SOLAR CITY MASTER PLAN Submitted by Sep 2014
Transcript of PANAJI SOLAR CITY MASTER PLAN

PANAJI SOLAR CITY
MASTER PLAN
Submitted by
Sep 2014

Solar City Master Plan PANAJI
i
PROJECT DETAILS
Project Name:
Master Plan for Development of Panajim City as a solar city under Solar City
Program of Ministry of New & Renewable Energy, Govt. of India
Client:
Goa Energy Development Agency (GEDA)
Corporation of the City of Panaji
Goa
Work Order No. and Date:
81/P.Pr. V./S.C./N.N.M/2009, October 05, 2009
Submission History:
Draft Master Plan report submitted on March 31, 2010
Present Report Checking Mechanism:
Initiator(s):
Sachin Singh Yadav, Senior Associate
Sunita Awadh, Assistant Vice President
Checker(s):
Mr. Pradeep Kumar, Associate Vice President
Approver(s):
Mr. Yogendra Naik, Head- Infrastructure advisory
Solar City Master Plan PANAJI
ii
Acknowledgement
Darashaw & Co. Pvt. Ltd., Mumbai places on record its profound appreciation to
Ministry of New & Renewable Energy (MNRE), Goa Energy Development Agency
(GEDA) and Corporation of the City of Panaji (CCP) for conceiving this unique
assignment of “Panaji Solar City”.
Darashaw & Co. is extremely thankful to the CCP and GEDA officials for entrusting
Darashaw & Co. in carrying out this prestigious assignment and their coordination
and support throughout the study:
Sr. No. Name Organization
1 Shree Sanjit Rodrigues Commissioner, Corporation of the City of Panaji
2 Dr. Pramod Pathak Member Secretary, GEDA
3 Mr. Lawande Executive Engineer, Corporation of the City of Panaji
4 Mrs. Prashila Salkar Project coordinator
The Darashaw & Co. Study team is indebted to all the Officers of CCP for their
invaluable guidance and support throughout the study.
We take this opportunity to express our appreciation for the excellent support
provided by Local Service Providers, and Equipment Suppliers for their active
involvement and their valuable inputs in making the program successful and in
completion of the Solar City Master Plan.
Thanking You
Pradeep Kumar
Assistant Vice President
Darashaw & Company Pvt. Ltd.
6th Floor, Express Building,
14th “E” Road, Churchgate (West),
Mumbai 400 020

Solar City Master Plan PANAJI
iii
E X E C U T I V E S U M M A R Y
The programme of ‘Development of Solar City’ by the Ministry of New and
Renewable Energy (MNRE), Government of India is aimed to promote the use of
Renewable Energy in Urban Areas by providing support to the Urban Local Bodies
(ULBs) for preparation and implementation of a Road Map to develop their cities as
Solar Cities. The target set for the cities under the scheme is to reduce the
consumption of fossil fuel to the extent of 10% in the coming five years. This
target would be achieved through a mix of various Renewable Energy and Energy
Efficiency Projects. This Master Plan is an outcome of the scheme and is prepared
to envision and implement the scheme as per the guidelines of MNRE.
The Master Plan begins with an introduction to the current status of the energy
scenario in cities of the modern world and emphasis on the need of sustainable
practices in the form of renewable energy and energy efficiency. The 2nd chapter
talks about the approach and methodology adopted by the consultant for
preparation of the master plan. 3rd chapter talks about the international case
studies on the success stories of similar Solar Cities throughout the world.
The 4th chapter talks about the stakeholder committee meeting and the views,
points and suggestions raised by the various stakeholders during the first
stakeholder committee meeting.
The 5th chapter draws the present energy baseline of CCP and highlights the energy
consumption pattern of the last five years.
The 6th chapter talks about the Energy consumption, Forecasting and target setting
of the city. Electricity consumption in the base year 2013-14 was as follows
Consumption of Energy Sources in Year 2013-14
Energy
Source
Electricity
(MU) Petrol (KL)
Diesel
(KL)
Kerosene
(KL) LPG (MT)
Consumption 92 9008 7780 798 1246
Now if we convert these sources of energy into a common denomination, we can
arrive at equivalent million units of electricity for all these different sources of
Solar City Master Plan PANAJI
iv
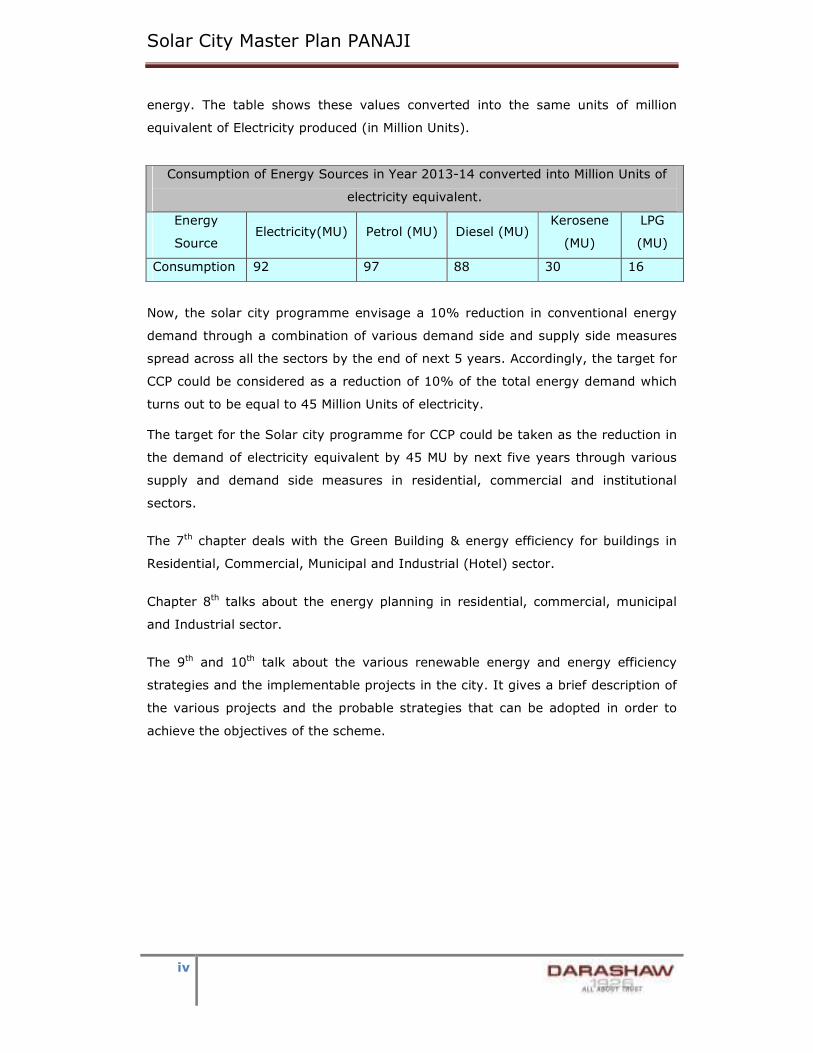
energy. The table shows these values converted into the same units of million
equivalent of Electricity produced (in Million Units).
Consumption of Energy Sources in Year 2013-14 converted into Million Units of
electricity equivalent.
Energy
Source Electricity(MU) Petrol (MU) Diesel (MU)
Kerosene
(MU)
LPG
(MU)
Consumption 92 97 88 30 16
Now, the solar city programme envisage a 10% reduction in conventional energy
demand through a combination of various demand side and supply side measures
spread across all the sectors by the end of next 5 years. Accordingly, the target for
CCP could be considered as a reduction of 10% of the total energy demand which
turns out to be equal to 45 Million Units of electricity.
The target for the Solar city programme for CCP could be taken as the reduction in
the demand of electricity equivalent by 45 MU by next five years through various
supply and demand side measures in residential, commercial and institutional
sectors.
The 7th chapter deals with the Green Building & energy efficiency for buildings in
Residential, Commercial, Municipal and Industrial (Hotel) sector.
Chapter 8th talks about the energy planning in residential, commercial, municipal
and Industrial sector.
The 9th and 10th talk about the various renewable energy and energy efficiency
strategies and the implementable projects in the city. It gives a brief description of
the various projects and the probable strategies that can be adopted in order to
achieve the objectives of the scheme.

Solar City Master Plan PANAJI
v
The 11th chapter talks in detail about the budget and five year action plan for the
implementation of the solar city scheme. The total budgeted yearly expenditure is
estimated as per the table below:
RE & EE
Strategy for
CCP
Energy Saving Target over 5 years period
of implementation (MU per year)
% of
savings
target to
achieve
Emission
reduction
1st
Year
2nd
Year
Cumul
ative
3rd
Year
Cumul
ative
4th
Year
Cumul
ative
5th
Year
Cumula
tive
RE for Residential
Sector
0 1 2 3 5 10% 3333
RE for
commercial
2 5 10 15 21 47% 17242
RE for Municipal 2 4 6 9 12 27% 10606
RE for Industrial 0 1 2 3 4 9% 3205
Total RE
Strategy
5 12 20 30 42 93% 31180
EE for Residential 0 1 1 2 3 7% 2605
EE for
Commercial
1.03 2.58 4.64 7.21 10.31 22.92% 8348
EE for Industrial 0.041 0.103 0.18 0.29 0.41 0.91% 333
EE for Municipal 0.13 0.33 0.59 0.92 1.32 3% 1299
Total for EE
strategy
2 4 7 11 15.25 34% 12584
RE & EE
Combined
Strategy
6 15 27 41 57 127% 43765
The total indicative budget of solar city is estimated as Rs 243 crore which will be
invested over a five year period. The year wise budget allocation is shown in the
table below.

Solar City Master Plan PANAJI
vi
Budget Contribution
MNRE Contribution
Total
(
Lakhs)
Year
1 Year2
Year
3 Year 4
Year
5
Renewable Energy Strategy
- Residential 1371 137 206 274 343 411
Renewable Energy -
Commercial 1755 176 263 351 439 527
Renewable Energy Municipal 866 87 130 173 216 260
Renewable Energy Strategy
- Industrial 659 66 99 132 165 198
19.17% 4651 399 599 798 998 1198
State /City Contribution
Renewable Energy Municipal 5520 552 828 1104 1380 1656
Energy Efficiency Strategy -
Municipal 419 42 63 84 105 126
24.48% 5938 594 891 1188 1485 1782
Private User Contribution
Renewable Energy Strategy
- Residential 3156 316 473 631 789 947
Renewable Energy Strategy
- Commercial 5615 561 842 1123 1404 1684
Energy Efficiency Strategy -
Residential 1067 107 160 213 267 320
Energy Efficiency Strategy -
Commercial 2227 223 334 445 557 668
Renewable Energy-
Industrial 1537 154 231 307 384 461
Energy Efficiency Industrial 72 7 11 14 18 22
56.36% 13674 1367 2051 2735 3418 4102
Grand Total 24263 2360 3541 4721 5901 7081
As per the current schemes of MNRE for eastern states, the total direct contribution
of MNRE has been estimated to be around 19 % of the total estimated
expenditure of Solar City. The share of the state/City and end user has been
proposed to be 24 % and 56 % respectively over a period of five years. However

Solar City Master Plan PANAJI
vii
the same is subject to change depending upon the methods of financing the
projects adopted by the state.
The chapter also discusses about the various financing schemes and models in
order to arrange the finances for the proper and timely execution of the various
projects.
At the end, there are various annexure giving details of the action plan for the
utilization of the fund allocated by MNRE for the implementation of the scheme
over a period of five years
The Master Plan provides a framework to compare and analyze the alternative
strategies and policies, in order to facilitate Councils review and decision making
process. Achieving significant reduction in energy consumption requires collective
effort by all city departments, other government departments, business, industries
and citizens. The investigation showed the biggest potential for energy savings in
the residential sector and huge potential for implementation of various solar
projects.

Solar City Master Plan PANAJI
viii
Table of contents
EXECUTIVE SUMMARY ................................................................................ iii
1 Introduction ......................................................................................... 1
1.1 BACKGROUND ................................................................................ 1
1.2 ENERGY SCENARIO .......................................................................... 2
1.3 NEED FOR RENEWABLE ENERGY ........................................................... 3
1.4 ROLE OF SOLAR POWER IN ENERGY SECURITY .......................................... 3
1.5 GREEN CITY .................................................................................. 4
1.5.1 Goals and Objectives ................................................................... 4
2 Approach and Methodology .................................................................... 5
2.1 MASTER PLAN FOR SOLAR CITY ........................................................... 5
2.1.1 Objectives .................................................................................. 5
2.2 STUDY APPROACH ........................................................................... 5
2.3 METHODOLOGY .............................................................................. 6
2.3.1 Mobilization ................................................................................ 6
2.3.2 Project Instigation ....................................................................... 6
2.3.3 Preparation of Energy Baseline for 2012 ........................................ 7
2.3.4 Demand Forecasting for 2014-15 to 20123-24................................ 7
2.4 STRATEGIC VISION ......................................................................... 7
3 Success Stories ..................................................................................... 8
3.1 INTRODUCTION .............................................................................. 8
3.2 INSTITUTIONS INVOLVED ON SOLAR CITIES ............................................. 8
3.2.1 International Solar Cities initiatives (ISCI) ..................................... 8
3.2.2 European Solar Cities Initiatives ................................................... 8
3.2.3 Solar city Task force .................................................................... 9
3.2.4 European solar cities projects ....................................................... 9
4 Stakeholders Consultation .................................................................... 11
4.1 FORMATION OF STAKE HOLDER COMMITTEE ........................................... 11
4.1.1 Problems and suggestions highlighted by the stakeholders ............. 11
5 Sector wise Energy Consumption & Baseline ........................................... 13
5.1 INTRODUCTION ............................................................................ 13
5.2 ABOUT THE CITY ........................................................................... 13
5.2.1 Demographic Profile .................................................................. 15

Solar City Master Plan PANAJI
ix
5.2.2 Land Use Pattern ...................................................................... 16
5.2.3 Electricity Consumption Scenario ................................................ 16
5.2.4 Consumption Scenario of Petroleum Products ............................... 18
5.2.5 Residential Sector ..................................................................... 19
5.2.6 Commercial sector .................................................................... 21
5.2.7 Industrial Sector ....................................................................... 22
6 Energy Forecasting and Target Setting ................................................... 24
6.1 INTRODUCTION ............................................................................ 24
6.2 PROJECTION FOR ELECTRICITY DEMAND UP TO 2023-24 .......................... 24
6.2.1 Residential Sector ..................................................................... 25
6.2.2 Commercial Sector .................................................................... 26
6.2.3 Industrial Sector ....................................................................... 26
6.3 PROJECTION OF DEMAND OF PETROL, DIESEL AND LPG FOR NEXT DECADE IN
BUSINESS AS USUAL (BAU) SCENARIO .................................................................. 27
6.3.1 Projected demand for Petrol and Diesel ....................................... 27
6.3.2 Projected demand for LPG .......................................................... 28
6.4 TARGET SETTING .......................................................................... 29
7 Green Building & Energy Efficiency in Buildings ....................................... 32
7.1 INTRODUCTION ............................................................................ 32
7.2 BUILDING ENERGY EFFICIENCY – EXISTING POLICY FRAMEWORK .................. 32
7.3 GREEN BUILDING-AN UNDERSTANDING ............................................... 33
7.4 NEED FOR A GREEN BUILDING ........................................................... 34
7.5 BENEFITS AND OUTCOMES OF A GREEN BUILDING .................................... 34
7.6 RATING SYSTEM FOR GREEN BUILDINGS ............................................... 35
7.7 PROCEDURE FOR CERTIFICATION ........................................................ 36
7.7.1 Salient Features of Green Building .............................................. 40
7.8 DEMAND COMPARISON: CONVENTIONAL VIS A VIS GREEN BUILDING .......... 42
7.9 GREEN BUILDING IMPLEMENTATION FRAMEWORK MODEL FOR CORPORATION OF
THE CITY OF PANAJI ......................................................................................... 42
7.10 STEPS TO BE TAKEN BY CCP FOR EFFECTIVE IMPLEMENTATION OF ENERGY
EFFICIENCY IN BUILDINGS ................................................................................. 43
8 Energy Planning .................................................................................. 45
8.1 RENEWABLE ENERGY RESOURCE ASSESSMENT ........................................ 45
8.1.1 Biomass potential ..................................................................... 45
8.1.2 Solar Energy ............................................................................ 45

Solar City Master Plan PANAJI
x
9 Renewable Energy Strategy .................................................................. 47
9.1 RESIDENTIAL SECTOR RE STRATEGY ................................................... 47
9.1.1 Solar Water Heaters .................................................................. 47
9.1.2 Solar PV for Home Inverters ....................................................... 48
9.1.3 Solar PV for replacement of DG sets ............................................ 48
9.1.4 Area Requirement for installation of Solar PV and water heating
system in residential sector .................................................................... 49
9.1.5 Summary of RE strategy for Residential Sector ............................. 50
9.2 COMMERCIAL SECTOR RE STRATEGY ................................................... 51
9.2.1 Installation of Rooftop Solar PV in the Schools & Community Hall.... 51
9.2.2 Installation of Rooftop Solar PV in the Health Centers & others
commercial establishments .................................................................... 51
9.2.3 Installation of Rooftop Solar PV in the Banks ................................ 52
9.2.4 1 MW Community based Grid Connected Solar Power Plant ............ 53
9.2.5 2 MW Municipal Solid Waste Power Plant on Public Private Partnership
basis 53
9.2.6 Solar water heater for Hotels, Resorts, Hospitals, Medical centers &
Commercial centers. .............................................................................. 54
9.2.7 Area Requirement for installation of Solar PV and water heating
system in commercial sector .................................................................. 55
9.2.8 Summary of RE strategy for Commercial Sector ............................ 56
9.3 MUNICIPAL SECTOR RE STRATEGY ..................................................... 57
9.3.1 Installation of Rooftop Solar PV in the Government Buildings .......... 57
9.3.2 Installation of Rooftop Solar PV in the Market & Shopping Centers .. 57
9.3.3 Replacement of conventional street light with solar street light. ...... 58
9.3.4 Installation of solar traffic light. .................................................. 59
9.3.5 Installation of solar Advertising Hoardings.................................... 59
9.3.6 Installation of Sewerage Treatment based Biogas power plant ........ 60
9.3.7 Summary of RE strategy for Municipal Sector ............................... 61
9.4 INDUSTRIAL (HOTEL) SECTOR RE STRATEGY ......................................... 62
9.4.1 Installation of Solar Water Heating system for Heating or cooking ... 62
9.4.2 Installation of Roof Top Solar PV System in High rise buildings having
plot size more than 1000 SqM. ............................................................... 63
10 Energy Efficiency Strategy .................................................................... 64
10.1 ENERGY EFFICIENCY STRATEGIES IN RESIDENTIAL SECTOR ......................... 64
10.1.1 Replacement of CFL with LED ..................................................... 64

Solar City Master Plan PANAJI
xi
10.1.2 Replacement of Conventional Ceiling fan with Energy Efficient Ceiling
fans 64
10.1.3 Replacement of Conventional AC with EE Star Rated AC ................ 65
10.1.4 Summary of EE strategy for Residential Sector ............................. 66
10.2 COMMERCIAL SECTOR EE STRATEGY ................................................... 67
10.2.1 Replacement of CFL with LED ..................................................... 67
10.2.2 Replacement of T12/T8 with T5 Tube Light................................... 67
10.2.3 Replacement of conventional Ceiling fan with EE ceiling fan............ 68
10.2.4 Replacement of conventional AC with Star Rated AC ..................... 69
10.2.5 Summary of EE strategy for Commercial Sector ............................ 70
10.3 INDUSTRIAL (HOTEL) SECTOR EE STRATEGY ......................................... 71
10.3.1 Replacement of T12 with 15 W LED ............................................. 71
Assumptions: ....................................................................................... 71
10.3.2 Replacement of T12 / T8 by T5 Tube light .................................... 71
Assumptions: ....................................................................................... 71
10.3.3 Replacement of ceiling fan with EE ceiling fan ............................... 72
Assumptions: ....................................................................................... 72
10.3.4 Replacement of conventional air conditioners with EE air conditioners
73
Assumptions: ....................................................................................... 73
10.3.5 Summary of EE strategy for Industrial (Hotel) sector. .................... 74
10.4 MUNICIPAL SECTOR EE STRATEGY ..................................................... 75
10.4.1 Replacement of 40 W Tube Light with 15 W LED ........................... 75
10.4.2 Replacement of 250 W HPSV with 100 W LED ............................... 76
10.4.3 Replacement of 150 W HPSV with 70 W LED ................................ 77
10.4.4 Electricity Saving by Design Efficiency in Water pumping system. ... 78
10.4.5 Electricity saving by installation of Variable frequency Drives (VFD) in
Water pumping system. ......................................................................... 78
10.4.6 Summary of EE strategy Municipal Sector .................................... 79
11 Budget & Action Plan ........................................................................... 80
11.1 IMPLEMENTATION PLAN ................................................................... 80
11.2 ANNUAL ENERGY SAVING TARGET ...................................................... 82
11.3 ANNUAL BUDGET ALLOCATION .......................................................... 83
11.3.1 Indicative Budget for Renewable Energy ...................................... 83
11.3.2 Indicative Budget for Energy Efficiency ........................................ 85
11.4 ACTION PLAN .............................................................................. 88
11.5 CAPACITY BUILDING AND AWARENESS GENERATION ................................. 88

Solar City Master Plan PANAJI
xii
11.5.1 Capacity Building for Green Buildings .......................................... 89
REFERENCES 91
ANNEXURE 1- ACTION PLAN FOR UTILIZATION OF FUNDS ............................................. 92
ANNEXURE 2- SUMMARY OF RE STRATEGIES ............................................................ 94
ANNEXURE 3- SUMMARY OF EE STRATEGIES ............................................................ 96
ANNEXURE 4- YEAR WISE ACTION PLAN FOR SOLAR CITY PROJECT .................................. 98
ANNEXURE 6- INITIATIVE TAKEN BY CCP .............................................................. 105
ANNEXURE 7- LIST OF SOLAR CITY MEMBERS ......................................................... 105
ANNEXURE 8- LIST OF STAKEHOLDER COMMITTEE MEMBERS ........................................ 105
ANNEXURE 9- SOLAR CITY APPROVAL LETTER FROM MNRE ........................................ 105

Solar City Master Plan PANAJI
xiii
LIST OF TABLES
Table 5.1: Year wise population: urban Agglomeration - Panaji ......................... 15
Table 5.2: Sector wise Total Number of Consumers ......................................... 18
Table 5.3: Social & Geographical profile of CCP ............................................... 19
Table 6.1: Consumption of Energy Sources in Year 2013-14 ............................. 29
Table 6.2: Consumption of Energy Sources in Year 2013-14 converted into Million
Units (MU) of electricity equivalent. ............................................................... 30
Table 7.3: Projected Consumption of energy from Conventional sources in 2018-
19. ............................................................................................................ 30
Table 7.4: Projected Consumption of energy from Conventional sources in 2023-24
................................................................................................................. 30
Table 7.5: Target Reduction of conventional Energy @10% .............................. 30
Table 8.1: List of Projects Identified for CCP to implement solar Power Project .... 45
Table 9.1: Target for SWH installation in Panaji .............................................. 47
Table 9.2: Solar PV for Home Invertors .......................................................... 48
Table 9.3: Solar PV for Replacement of DG Sets .............................................. 49
Table 9.4: Summary of RE Strategy for Residential Sector ............................... 50
Table 9.5: Roof Top Solar PV System in Schools & Community Hall ................... 51
Table 9.6: Roof Top Solar PV - Health Care Centers, Hotels, Resorts etc. ........... 52
Table 9.7: Rooftop Solar in Banks ................................................................. 52
Table 9.8: 1 MW Community Based Grid Connected Power Plant ....................... 53
Table 9.9: 2 MW Grid Connected Municipal Solid Waste based Power Plant ......... 53
Table 9.10: SWH for Hotels, Resorts, Hospitals, Medical centers etc. ................. 54
Table 9.11: Summary of RE strategy for Commercial Sector ............................. 56
Table 9.12: Roof Top Solar PV System in Government Buildings ........................ 57
Table 10.13: Roof Top Solar PV System in Market & Shopping Centre ................ 58
Table 10.14: Replacement of Conventional street lights with Solar Street Lights . 58
Table 9.15: Solar Traffic Lights ..................................................................... 59
Table 9.16: RE system for Advertisement Hoardings ........................................ 59
Table 9.17: Sewerage Treatment based biogas power plant.............................. 60
Table 9.18: Summary of RE strategy for Municipal Sector ................................ 61
Table 9.19: Solar water Heting System 2000 LPD Capacity each ....................... 62
Table 9.20: Roof Top Solar PV System in High Rise Buildings having plot size more
than 1000 Sq.M .......................................................................................... 63

Solar City Master Plan PANAJI
xiv
Table 10.1: Replacement of CFL with LED ...................................................... 64
Table 10.2: Replacement of conventional ceiling fan with Energy Efficient fans ... 65
Table 10.3: Replacement of conventional AC with EE star rated ACs .................. 65
Table 10.4: Summary of EE Strategy for Residential Sector .............................. 66
Table 10.5: Replacement of CFL with LED ...................................................... 67
Table 10.6: Replacement of T12 / T8 light by T5 Tube Light ............................. 68
Table 10.7: Replacement of Conventional ceiling fan with Energy Efficient Fans .. 68
Table 11.8: Replacement of Conventional air conditioners with EE star rated ACs 69
Table 10.9: Summary of EE strategy for commercial sector .............................. 70
Table 10.10: Replacement of T12 with 15 W LED in all the premises.................. 71
Table 10.11: Replacement of T12 / T8 Tube Lights with T5 Tube Light .............. 72
Table 10.12: Replacement of Conventional Ceiling fan with Energy Efficient Ceiling
Fans .......................................................................................................... 72
Table 10.13: Replacement of Conventional air conditioners with EE air conditioners
................................................................................................................. 73
Table 10.14: Summary of EE strategy for Industrial (IT) sector......................... 74
Table 10.15: Replacement of 40 W Tube Light with 15 W LED ........................... 75
Table 10.16: Replacement of 250 W HPSV with 100 W LED .............................. 76
Table 10.17: Replacement of 150 W HPSV with 70 W LED ................................ 77
Table 10.18: Improvement in Design Efficiency ............................................... 78
Table 10.19: Improvement in Design Efficiency ............................................... 78
Table 11.20: Summary of EE strategy Municipal Sector .................................... 79
Table 11.1: Year wise Energy Saving Target ................................................... 82
Table 12.2: Year wise budget Allocation for RE projects ................................... 83
Table 11.3: Year wise budget Allocation for EE projects ................................... 85
Table 11.4: Budget Contribution ................................................................... 87

Solar City Master Plan PANAJI
xv
List of Figures
Figure 5-1: Satellite Image of Panaji City ....................................................... 15
Figure 5-2: Population Growth of Panaji ......................................................... 15
Figure 6-3: Land use pattern of CCP .............................................................. 16
Figure 5-4: Total Annual Electricity consumption (MU) ..................................... 17
Figure 5-5: Sectoral electricity use pattern ..................................................... 17
Figure 6-6: Annual consumption of Petroleum Products (MU) ............................ 18
Figure 5-7: Annual electricity Consumption – domestic (MU) ............................ 19
Figure 5-8: Household Energy consumption pattern ......................................... 20
Figure 5-9: Contribution of different luminaries in electricity consumption .......... 20
Figure 5-10: Commercial Sector Electricity Consumption .................................. 21
Figure 5-11: No. of Commercial consumers .................................................... 22
Figure 5-12: Industrial Sector Electricity Consumption ..................................... 22
Figure 5-13: No. of Commercial consumers .................................................... 23
Figure 6-1: Projected population data for Panaji .............................................. 24
Figure 6-2 Total Projected Annual Electricity consumption (MU) in BAU scenario . 25
Figure 6-3: Projected Annual Electricity consumption (MU) in BAU scenario –
Residential ................................................................................................. 25
Figure 6-4: Projected Annual Electricity consumption (MU) in BAU scenario –
Commercial ................................................................................................ 26
Figure 6-5: Projected Annual Electricity consumption (MU) in BAU scenario –
Industrial ................................................................................................... 27
Figure 6-6: Projected Annual Petrol & Diesel consumption (KL) in BAU scenario .. 28
Figure 6-7: Projected Annual LPG consumption (MT) in BAU scenario ................. 29

Solar City Master Plan PANAJI
1
1 In t r odu c t i on
1.1 Background
The inevitable process of urbanization brought with the environmental degradation,
besmirched quality of life and knocked out the root of sustainable development of
cities and towns. The limited resource bases of cities are not able to cope with the
ever increasing pressure of people migrating from rural areas for the variety of
reasons.
The people and governments are already working hard to cut greenhouse gases,
and everyone can help. It should be our moral mission to get actively involved for
preventing degradation of our environment and save the planet.
Cities are spatial manifestations of human and economic activities; buildings form a
crucial part of this spatial manifestation. Estimates put construction alone
responsible for approximately 40 percent of the total energy use worldwide, most
of which is sourced from fossil fuels.
With nearly 8% rise in annual energy consumption in the residential and
commercial sectors, building energy consumption has seen an increase from a low
14 percent in 1970s to nearly 33 percent in 2004-05.
Residential Energy Consumption in India
In India residential sector is responsible for 13.3 percent of total commercial
energy use. Energy sources are mainly being electricity, kerosene, firewood, crop
residue and renewable energy such as solar, wind, hydro. During the period 1990-
2003, the two commercial fuels LPG and Electricity has grown at the average
annual growth rate of 11.26 percent and 8.25 percent respectively.
Residential energy consumption can be broadly divided into six categories such as:
Lighting, Cooking, Space Conditioning, Refrigeration, Water, Heating and Others.
Commercial Sector Energy Consumption
In India, 60 percent of the total electricity is consumed for lighting, 32 percent for
space conditioning and 8 percent for refrigeration in the commercial sector. The
commercial sector comprises various institutional and industrial establishments
such as: Banks, Hotels, Shopping Complexes, Offices, and Public Departments
supplying basic utilities.
Environmentalists have suggested one approach by reducing greenhouse gases
emissions from a variety of sources with technologies available, rather than relying

Solar City Master Plan PANAJI
2
on an enormous change in a single area. Strategies for mitigation of global
warming include development of new technologies; carbon offsets; renewable
energy such as biodiesel, solar power, biomass, geothermal and wind power;
electric or hybrid automobiles; fuel cells; energy conservation; carbon credits;
carbon taxes; enhancing natural carbon dioxide sinks; population control; and
carbon capture & storage. Many environmental groups encourage individual
lifestyle and political action against global warming. Plants and trees absorb CO2 as
they grow, "sequestering" carbon naturally.
1.2 Energy Scenario
In the past sixty years India has achieved remarkable growth in development of
electricity systems, from a meager installed capacity of around 1350 MW to
250256.95 MW of installed capacity as on 31 July 2014. While this growth is
impressive, the needs of the nation are daunting. Some facts
o With 17.31% of world’s population India has
o Only 0.6% of global oil reserves and 7 % of coal reserves
o Rapidly growing Economy (2003-09) 8%; to grow 8-10% per annum
o Indian Power Sector (as of 31 July 2014)
o Installed Capacity: 250 GW (per capita 779 kWh)
o India needs 300 GW of incremental power generation
o Capacity to be added over the next 10 years
o GOI target for renewable Energy
o 20% by 2020
However if India has to ensure GDP growth rate in excess of 8% for a sustained
period of time, it has to ensure sufficient energy supply for industrial and
commercial activity in the country, as energy is an essential input in the economic
activity. To achieve this and to ensure sufficient electricity to all at reasonable
rates, it is not only necessary to have an efficient and competitive power sector but
there is also a need to explore all possible options for electricity generation and
distribution.

Solar City Master Plan PANAJI
3
1.3 Need for Renewable Energy
India has been dependant on fossil fuels such as coal, oil and gas for its energy
requirements. As per data provided by Ministry of Power (MoP) today, more than
57% of its capacity is coal fuel dependant. Despite the recent discoveries of gas as
well as initiatives to develop coal reserves, it is likely that our dependence on fossil
fuels will continue in near future. However, in the last couple of years, the price of
fossil fuels has shown a consistent upward trend.
As per data published by Ministry of Petroleum and natural Gas in Economic Report
“Basic Statistics on Indian Petroleum & Natural Gas, 2011-12” India imports in
year 2011-12 were about 81% of its total oil consumption and considering the past
trend this share of imported oil is expected to reach 90% by 2031-32. The story of
coal imports is not expected to be significantly different. It is envisaged that India
will be importing 50-60 million tons of coal every year by the end of the eleventh
five year plan. Given this scenario, it is of paramount importance that the country
develops all possible domestic energy sources. India cannot afford to ignore any
source of energy just because those sources are currently expensive, because the
economic loss due to non – supply of electricity will be greater than the cost of
selected sources of energy.
1.4 Role of Solar Power in Energy Security
While wind has been a success story in India and has great potential, wind is
extremely site specific and therefore, not suitable or large scale distributed
generation. Further the total wind potential (approx 50 GW) in the country is much
less as compared to the total solar energy potential (approx 600 GW). Further, this
estimated potential is done at current targets for technology efficiency. If
technology is improved, solar energy potential could be further increased
significantly.
Further, solar energy systems do not require any fuel and therefore, operating
costs are negligible. Over a life time cycle, the costs of the solar energy
applications like large solar farms, roof top installations, telecom towers etc. can be
lower than that of conventional energy products especially the more expensive and
highly polluting diesel generators. The other advantages of solar energy systems
are that they are modular in nature, have long life, are reliable, and require low
maintenance effort. This distributed source of energy is uniquely suitable for India.

Solar City Master Plan PANAJI
4
1.5 Green City
The smart solution to the problem of unplanned growth of cities and towns would
be to make affordable a new level of quality townships that would seriously
consider the important role that environmental issues play globally, locally and
domestically. Thus, the concept of the Green City was conceived.
What our cities will look like in the future will depend on, how they are planned or,
much more important; whether they are planned at all. The key point is that
planning has a key role in ensuring sustainability.
Many of the problems associated with our cities have happened because they have
not been planned, or the planning has been ineffective or misdirected. Planning has
seldom kept pace with the scale of urban growth and rapid urbanization it has also
been unresponsive to the needs of the poor. Forced evictions in some cities have
been justified by the so called need for "proper planning".
1.5.1 Goals and Objectives
The Goal of the Solar City program is to promote the use of Renewable Energy in
Urban Areas by providing support to the CCP for preparation and implementation of
a Road Map to develop their cities as Solar Cities. The objectives of the programme
are given below:
o To enable/empower Urban Local Governments to address energy challenges
at City - level.
o To provide a framework and support to prepare a Master Plan including
assessment of current energy situation, future demand and action plans
o To build capacity in the Urban Local Bodies and create awareness among all
sections of civil society.
o To involve various stakeholders in the planning process
o To oversee the implementation of sustainable energy options through public - private
partnerships.

Solar City Master Plan PANAJI
5
2 App roa ch and Me thodo l ogy
2.1 Master Plan for Solar City
Master plan for solar city is both a perspective and a vision for the future
development of a city; as a renewable energy city or an eco green city minimizing
the demand for conventional energy at the end of fifth year. It presents the current
stage of the city’s existing energy demand and supply scenario. It sets out the
directions of change, to reduce the demand for conventional sources, assessment
of various renewable energy resources and identifying the thrust areas. It also
suggests alternative routes, strategies, and interventions for decreasing the
demand for conventional energy resources and to make renewable energy &
energy efficiency be able to reduce at least 10% of the projected total demand of
conventional energy. It provides a framework and vision within which projects need
to be identified and implemented. It establishes a logical and consistent framework
for evaluation of investment decisions.
Master plan for development of CCP as a Solar City is initiated by Goa Energy
Development Agency & Corporation of the City of Panaji under the scheme for
development of solar cities, a scheme of MNRE.
2.1.1 Objectives
The objective of development of Solar Cities is for:
� Preparation of a master plan for increasing energy efficiency and renewable
energy supply in the city
� Setting-up institutional arrangements for the implementation of the master
plan.
� Awareness generation and capacity building activities.
The program aims at minimum 10% reduction in projected demand of conventional
energy at the end of tenth year, which can be achieved through a combination of
energy efficiency measures and enhancing supply from renewable energy sources.
Out of this at least 5% will be from renewable energy sources.
2.2 Study Approach
� The master plan exercise will be carried out through consistent stakeholder
participation at various stages. Focus Group Discussion will be organized in
all the stakeholder meetings to familiarize them with the purpose, process,
and expected outcomes, and to build enthusiasm, understanding and
commitment to the development of solar city. This helps in arriving at a

Solar City Master Plan PANAJI
6
consensus between CCP and other stakeholders in confirming the identified
sector strategies and various projects identified.
� Preparation of a master plan is a multi-stage exercise, involving:
� In-depth analysis of the existing situation, covering the detailed
documentation of the existing energy demand and supply scenario for the
city: The purpose of this stage is to review and analyze the current status of
the city with regard to sector wise energy consumption and energy supply.
� Demand forecasting from financial year 2014-15 to 2023-24: Using the
results of the first stage of analysis combined with consultations with key
stakeholders and civil society, demand for energy is forecasted, by
determining growth in energy use in different sectors.
� Formulating sector wise strategies, based on the techno economic feasibility
of different renewable energy and energy efficiency options for each sector.
2.3 Methodology
� The Consultant has rich experience in working on similar assignments on
city development plans and renewable energy in the past and hence the
consultant has laid thrust on two aspects while developing the methodology.
One is the past experience on similar kind of assignments and the other is
related to the project requirement.
2.3.1 Mobilization
� Immediately after the signing of the contract and the orders to commence
work, the Consultant mobilized the project team. Team comprising of
planners and renewable energy specialists will study the intricacies of the
project and hold discussions with the CCP & GEDA and concerned
departments on the work plan that can be adopted for various stakeholder
meetings, primary and secondary data collection and identification of
various sector specific strategies.
2.3.2 Project Instigation
This task involved several sub tasks like:
� Reviewing case studies on various documents related to Green Cities/ eco
cities prepared nationally and internationally.
� Meetings and consultations with stakeholders
� Appreciation of prevailing development policies
Solar City Master Plan PANAJI
7
2.3.3 Preparation of Energy Baseline for 2012
Task 01: Database Ident i f i cat ion and Antho logy
� Primary and secondary data forms the backbone of any kind of research
work and also helps in focusing the study towards the definite approach.
Under this task, the database required and the departments responsible for
such kind of data was identified at urban level during the data collection.
� Secondary data would be collected in relation to different sectors.
� Apart from the secondary data, sample surveys was conducted to cover
aspects such as energy consuming appliances, consumption patterns,
consumer preferences; efficiency of use etc by detailed survey of various
household of various categories
Task 02: Preparat ion of energy base l ine report
Here, all the information collected from Secondary and primary sources are
analyzed to arrive at the energy baseline for each sector. In order to develop a
better understanding of the energy consumption and supply of different sectors.
2.3.4 Demand Forecasting for 2014-15 to 20123-24
The energy demand for each of the sectors is established. This is done by taking
into account the various parameters (e.g. Fuel consumption by outside vehicle,
future commercial & Industrial growth etc.).
2.4 Strategic Vision
Strategic vision for developing CCP as a solar city has been decided on the basis of
stakeholder consultation and focused group discussion during the preparation of
solar city master plan.
Solar City Master Plan PANAJI
8
3 Suc ce s s S t o r i e s
3.1 Introduction
A large proportion of the world’s population lives in cities, towns and urban regions,
in which three quarters of the overall energy consumption occurs. Urbanization and
economic development are leading to a rapid rise in energy demand in urban areas.
The urban areas are heavily dependent on fossil fuels for maintaining essential public
services for powering homes, transport, infrastructure, industry and commerce etc.
It is generally recognized that a transformation of the present energy system is
required in order to secure the energy supply and to mitigate the risks of climate
change. The transformation can be made possible by a shift towards Renewable
Energy Systems (RES) and a more national use of energy. One of the approaches to
achieve such a transformation might be to convert more number of cities to solar
cities.
3.2 Institutions involved on Solar Cities
Several institutions working on solar cities are given below.
• European Solar cities initiatives (ESCI)
• International Solar cities initiatives (ISCI)
• Solar city Task force
The following section discusses briefly about the initiatives and activities undertaken
by these institutions.
3.2.1 International Solar Cities initiatives (ISCI)
International Solar cities initiative is the group who had organized the first solar
cities congress in Daegu, Korea in 2004. The primary focus of ISCI is to set up the
target for introduction of renewable energy and reduction of green house gas
emissions on a longer term.
3.2.2 European Solar Cities Initiatives
The aim of the initiative is to support the European energy and climate policy by
stimulating the interests of European “high performance” cities and surrounding
regions (prospective “Solar cities”), the European research community and the
European sustainable energy industry.
The initiative will mobilize a critical mass of participants to find efficient and rapid
ways of implementing Renewable Energy Sources (RES) and Rational Use of Energy
(RUE) in European cities through research, development, demonstration and
information dissemination activities and through stakeholder participation (citizen

Solar City Master Plan PANAJI
9
and others). The goal is to speed up the transformation of the European cities into
solar cities.
A working definition of solar city is a city that aims at reducing the level of green
house gas emissions through a holistic strategy for the introduction of RES and RUE
to a climate stable and thus sustainable level in the year 2050.
3.2.3 Solar city Task force
Solar city task force is an advisory service to assist towns, cities etc. integrating
renewable energy technologies and energy conservation and efficiency measures in
order to reduce the green house gas emission. A general methodology has been
developed based on the experiences and best practices adopted by different
institutions internationally for providing such services.
3.2.4 European solar cities projects
The European Solar cities projects (EU Solar Cities) aims at promoting the wider and
larger scale use of renewable energy (RE) within the context of long term planning
for sustainable urban development. It is basically a study that addresses the
planning and application of technologies for utilizing RES and RUE in an urban
context and their relevance for reducing CO2 emissions.
Solar city is seen as a city that has made firm commitments in order to reduce green
house gas emission targets while incorporating renewable energy technologies.
Within the scope of this project several activities were conducted.
• The collection and assessment of information about different activities and
programmes of selected European cities and city networks, with a description
on their implementation and an assessment of their impact.
• The examination of these activities assisted in the development of two guide
books for city actors, namely:
• Good practice guide
• Guide on CO2 reduction potential in cities.
The results encompass a range of informative materials, with recommendations for
replication to city actors and local governments.
The good practice guide is useful for city actors that require ideas and information for
planning their own activities and strategies to implement clean energy sources and
promote the reduction of harmful emissions. A set of generic good practices have
been identified , which represent a good starting point for cities that require an
introduction to the concept of implementing RES and RUE strategies and activities.
The CO2 reduction potential assessment and issues impacting on CO2 balances, is a
comprehensive report that addresses reduction targets and baseline targets. This is

Solar City Master Plan PANAJI
10
particularly useful for guiding cities interested in implementing a strategy, with basic
steps identified to assist this process.
It has to be noted that there are many different approaches that are, and can be,
used by cities, with different baselines and varied ways of presenting emissions
reduction results. Although scientists are not unanimous in agreeing to the best way
to measure emissions, or the most effective way to calculate emission reductions,
the project team has the view that a delay in implementing the strategies and
activities that will adequately reduce harmful emissions is in itself the most
damaging approach.
Under this study eight cities were identified. Cities were selected from Austria,
Belgium, Denmark, France, Germany and Italy. Sixty three city good practices from
seven cities and one housing association have been identified. Every city needs to
consider the results of its actions in terms of energy used and the effect it has on the
environment.
A range of good practices recommended for replication have been identified and
present a guide to urban actions that contribute to sustainability in cities, and actions
that strengthen networks.
• 63 city good practices
• 22 city network good practices.

Solar City Master Plan PANAJI
11
4 S t akeho l de r s C on su l t a t i on
The success of the Solar City Master Plan depends on the extent of people
participation. As it is very rightly said “Planning is an exercise ‘For’ the people,
‘Of’ the people and ‘By’ the people”. People perception and views should be
given an important position in any development programme as the whole exercise
is done for the common good of the people.
As per the guidelines, Consultants were supposed to organize its first inception
workshop with assistance from GEDA & CCP. The aim of the workshop was to
familiarize various stakeholders the purpose, process and expected outcomes of
the Master Plan. Stakeholders included elected representatives, Municipal
commissioner and people from local departments like PWD, Electricity Department,
Town and country planning department, development Authority.
4.1 Formation of Stake Holder Committee
A stake holder committee comprising of the Municipal corporation officials,
Department of Electricity officials, PWD, NGOs, and Press etc. was formed. The
Solar City Cell members will participate in the discussions at every stage during the
course of preparation of the City Development Plan. The Steering Group members
of Goa State Solar City Cell are as follows:
� Municipal commissioner, CCP
� Project Officer GEDA, Goa
� Additional District Magistrate
� District Supply Officer
� Principal, ITI, Goa
� Executive Engineer, Department of Electricity
4.1.1 Problems and suggestions highlighted by the stakeholders
The problems and issues identified by the elected representatives and
administrative staff and other stakeholders are encapsulated as under:
� Primary Survey type has to be Presented, like questionnaire filled,
consumers approached etc.
� Transport Sector has been included as much as possible in Solar City master
plan. Due to technical and geographical constraints direct intervention is not
possible at this stage in transport sector. CCP should introduce battery
operated vehicle for reducing the conventional fuel demand in transport
sector.

Solar City Master Plan PANAJI
12
� Project to be Included: Solar Panel mounted on top of the Building to
capture the sunlight and feed the electricity generated into the grid.
� Solar Water heating system & Star ratings of Buildings should be promoted
in housing complex and commercial buildings.
� Renewable energy and water conservation projects should be identified for
Hotel Industries.
� Separate chapter on Green Building should be included in Master Plan.
� Bus Depot and Bus stands should also be considered for installation of solar
rooftop systems.
� Waste to energy analysis for future should be made in the Master Plan, like
type of project, area required for the project, cost of project, technology
used.
� Buildings or parks can be utilized for street lighting through solar energy.

Solar City Master Plan PANAJI
13
5 Se c t o r w i s e En e r gy
Con sump t i on & Bas e l i n e
5.1 Introduction
Energy baseline is the amount of energy that would be consumed annually in
Business As Usual (BAU) scenario. This BAU is without consideration of any energy
conservation measure and is entirely dependent upon the historical data,
engineering calculations, metered energy consumption in systems, building load
simulation model, statistical regression analysis or a combination of these. This
chapter is focused on present energy consumption in residential, institutional,
commercial and municipal sector with its overall energy consumption scenario for
Panaji city.
5.2 About the city
Panaji the capital city of Goa comprises 30 wards like fountain has, Mala, St Tome,
Alto Pilots, Boca de Vaca, Portais, Bhatlem, Tonca, Alto Guimaraes, Campal, St
Inez, Gaspar Dias, Ribandar, Dona Paula, etc. Panaji’s history is long. Historical
accounts of this place date back to Kadamba King Shasthadeva (1007-1050).
The Corporation of the City of
Panaji is the oldest civic
institution in Asia. It received
the status of a Portuguese city
in 1843. It is also the world’s
smallest municipal corporation,
catering to the civic needs of
Goa’s capital city of Panaji.
Goa one of the youngest
states, which was incorporated into Indian Union (in 1962). The City Panaji is the
capital of the state of Goa, and it is the headquarters of the North Goa district. The
official name is Panaji, though in the local language (Konkani) the Panaji gets
pronounced as Ponnji, Ponnje, or Ponjhe.

Solar City Master Plan PANAJI
14
Panaji is a tiny city that packs in a large punch, built around a church facing a
prominent square and lies on the banks of the Mandovi estuary in the district of
North Goa.
Panaji is the important center in terms of Indo-Portuguese cultural heritage. Panaji
is spotted as one of the most attractive tourist destination centers in India, and it
attracts around 2.0 Lakhs of National tourist and 0.35 Lakh of international tourist
annually.
The City Panaji is located in 15.25° North Latitude 73.5° to East Latitude and about
60 Meter above the Mean Sea Level. The city is bound by the Rua de Querem creek
on the north that has been artificially trained to flow along its east side, the
Mondovi river on the north, the hillock of Altinho on the south east and the St.Inez
Nullah and Taleigaoon the west.
Panaji is the travel & transit hub of Goa. The city is well connected by roadways,
airways, waterways and railway network (Map 3.1). to the urban centers in the
state, national capital and important cities in the neighboring states. Being Goa’s
capital city and administrative headquarter, it is well connected by road to the
towns and cities within the state and with important towns in neighboring states,
as it is served by National Highway No. 17 and 4A. Goa, Maharashtra and
Karnataka state transport corporations operate from Panaji's Kadamba bus stand.
As Panaji is located along the river Mandovi, on island of Tiswadi in land/waterways
have also developed to some extent. It is well connected by airways, from Mumbai
(Bombay), Bangalore, Cochin, Delhi, Chennai (Madras), Mangalore and
Trivandrum. The airport is located at Dabolim, which is about 35 km away from the
city of Panaji. Panaji is also connected by air with Secunderabad, and Jaipur in
addition to above towns. The railway station is located at Madgaon.
Solar City Master Plan PANAJI
15
Figure 5-1: Satellite Image of Panaji City
5.2.1 Demographic Profile
The Figure below gives us the population data for CCP. The table 6.1 shown below
gives us the yearly population, its increase in absolute terms as well as in
percentage for CCP.
Figure 5-2: Population Growth of Panaji
Table 5.1: Year wise population: urban Agglomeration - Panaji
2014 79650
2015 79841
2016 80032
2017 80223
2018 80414
2019 80605
2020 80795
2021 80986
2022 81177
2023 81368
2024 81559
78500
79000
79500
80000
80500
81000
81500
82000

Solar City Master Plan PANAJI
16
5.2.2 Land Use Pattern
The total area of CCP is 830 ha. The land use pattern is as per North Goa Planning
and Development Authority has been shown in figure 6.3
Figure 5-3: Land use pattern of CCP
5.2.3 Electricity Consumption Scenario
In order to have a better understanding about energy conservation potential, it is
imperative to understand the profile of the energy consumption under the business
as usual scenario (BAU). The following sections focus on present energy
consumption pattern in residential, industrial and commercial sector with its overall
energy consumption scenario.
Residential
34%
Commercial
10%
Institutional/
Government
9%
Transport/Comm
unications
3%
Parks/Playground
s
10%
Natural
Resources
25%
Conversation/Pre
servation
4%
Defense Land
1%
Watershed
4%

Solar City Master Plan PANAJI
17
Figure 5-4: Total Annual Electricity consumption (MU)
Source: Department of Electricity
The total energy consumption for Panaji city is shown in the Figure 5.4. As can be
seen from the figure, the electricity consumption has become 1.5 times that of the
year 2007-08 and it stands at 92 MU for the year 2013-14.
Figure 5-5: Sectoral electricity use pattern
Source: Department of Electricity
Figure 5.5 shown gives us an idea about sectoral electricity use pattern of Panaji
city for the year 2013-14. It shows that commercial and followed by residential
sectors are the most power consuming sector and others are having only 3% of
total consumption.
0
20
40
60
80
100
120
2009-10 2010-11 2011-12 2012-13 2013-14
Electricity Consumption (MU)
Unit (MU)
Residential
42%
Commercial
54%
Hotel Industries
4%
Agriculture
0%
Public Light &
water Supply
0%

Solar City Master Plan PANAJI
18
Table 5.2: Sector wise Total Number of Consumers
Type of User 2008-
2009
2009-
2010
2010-
2011
2011-
2012
2012-
2013
Residential 11361 11944 13109 13546 13400
Commercial 6037 6346 6966 7198 7469
Industrial 91 95 96 100 105
Institutional 105 107 110 111 113
Municipal
Hotel Industries 76 76 76 77 78
Source: Department of Electricity The total number of consumer per year has been shown in the table 5.2 for
domestic, commercial, Industrial, Institutional and Municipal sector. All sectors are
not having variation with respect to number of consumers in the last five years. It
shows that there is no so much growth in the city.
5.2.4 Consumption Scenario of Petroleum Products
The transport, commercial, institutional and residential sectors are the major
consumers of petroleum products (Petrol, Diesel and LPG). Liquid Petroleum Gas
(LPG) is mainly used in commercial, institutional and residential sector. Petrol and
diesel are used mainly in transport, residential, commercial and institutional
sectors. The following figure shows the annual consumption pattern of petroleum
products for the last 5 years.
Figure 5-6: Annual consumption of Petroleum Products (MU)
Source : Oil Marketing companies area office
The consumption of petroleum products is increasing, especially for petrol and
diesel. It clearly shows that there has been a considerable change in annual petrol
consumption pattern. The consumption of petrol and diesel has increased
0
20
40
60
80
100
120
2009-10 2010-11 2011-12 2012-13 2013-14
Petrol (MU) Diesel (MU) LPG (MU)

Solar City Master Plan PANAJI
19
substantially in the last couple of year. The increase in consumption of petrol may
be attributed to transportation sector as the number of households has increased
substantially in the last couple of year. Further, the number of commercial
establishments has increased substantially in the last couple of year to cater to this
increase in the floating population. Consumption of diesel has decreased in last 2
years. The consumption of LPG in the city has increased in the past 5 years due to
rise in commercial activity and increase in household consumption. There is
decrease in consumption of LPG in year 2013-14. It is due to new subsidy scheme
of central government for residential LPG cylinder.
5.2.5 Residential Sector
The population of Panaji city is 79650 for 2014. The Socio economic profile of CCP
is indicated in the Table 6.3 below.
Table 5.3: Social & Geographical profile of CCP
Particulars Year- 2014
Population 79650
Area (ha) 830
Number of households 13400
Figure 5-7: Annual electricity Consumption – domestic (MU)
Source: Department of Electricity
The annual electricity consumption pattern is shown in the figure 5.7. As can be
seen from the figure, the consumption of energy has increased 1.5 times in the last
five years in Panaji city. Currently it stands at around 92 MU.
0
20
40
60
80
100
120
2009-10 2010-11 2011-12 2012-13 2013-14
Unit (MU)

Solar City Master Plan
20
Figure 5-8: Household Energy consumption pattern
Since it’s a new city, it is assumed that all the households are electrified. The
household electricity consumption pattern based on our sample survey is indic
in the figure 5.8. It shows that the
total load. Largest chunk of electricity is being used in operating the
Microwave as every household use these appliances on daily basis
portion of electricity is used in Television
there is a good awareness among the people about use of CFL (Compact Florescent
Lamp). If we further delve into the sample survey data about type of luminaries in
the household, we can see the
in the figure 5.9. As the chart shows that
requirement.
Figure 5-9: Contribution of different luminaries in elec
Fan2%
CFL (25W)3%
AC37%
Solar City Master Plan PANAJI
: Household Energy consumption pattern
Since it’s a new city, it is assumed that all the households are electrified. The
household electricity consumption pattern based on our sample survey is indic
. It shows that the AC is having maximum connected load in the
chunk of electricity is being used in operating the AC followed by
as every household use these appliances on daily basis. A
is used in Television. The same sample survey indicates that
there is a good awareness among the people about use of CFL (Compact Florescent
Lamp). If we further delve into the sample survey data about type of luminaries in
see the contribution of various luminaries used for lighting
. As the chart shows that CFL is used for the 75% of total lighting
: Contribution of different luminaries in electricity consumption
Washing Machine 10%
Microwave15%
Electric toaster11%
Refrigerator4%
Geyser15%
TV3%
75%
25%
CFL FTL
Since it’s a new city, it is assumed that all the households are electrified. The
household electricity consumption pattern based on our sample survey is indicated
AC is having maximum connected load in the
followed by
. A nominal
The same sample survey indicates that
there is a good awareness among the people about use of CFL (Compact Florescent
Lamp). If we further delve into the sample survey data about type of luminaries in
used for lighting
CFL is used for the 75% of total lighting
tricity
Electric toaster

Solar City Master Plan PANAJI
21
5.2.6 Commercial sector
The commercial sector growth is almost stable in Panaji. To cater these floating
population commercial setups is coming up. The commercial sector has got both
the HT as well as LT consumers. The electricity consumption of the commercial
sector is 49 MU in year 2013-14 which is shown in the figure 5.10.
Figure 5-10: Commercial Sector Electricity Consumption
In order to have a better understanding about energy conservation potential, it is
imperative to understand the profile of the energy consumption under the business
as usual scenario (BAU). The following sections focus on present energy
consumption pattern in commercial sector with its overall energy consumption
scenario.
The average number of consumers per year has been shown in the figure 5.11 for
commercial sector. The number of commercial consumers has increased 6037 in FY
2009-10 from 7469 in FY 2003-14.
0
10
20
30
40
50
60
2009-10 2010-11 2011-12 2012-13 2013-14
Commercial
Commercial

Solar City Master Plan PANAJI
22
Figure 5-11: No. of Commercial consumers
5.2.7 Industrial Sector
The industrial sector growth is almost stable in Panaji. The Industrial sector has got
both the HT as well as LT consumers. The electricity consumption of the Industrial
sector is 3 MU in year 2013-14 which is shown in the figure 5.10.
Figure 5-12: Industrial Sector Electricity Consumption
In order to have a better understanding about energy conservation potential, it is
imperative to understand the profile of the energy consumption under the business
as usual scenario (BAU). The following sections focus on present energy
0
1000
2000
3000
4000
5000
6000
7000
8000
2008-2009 2009-2010 2010-2011 2011-2012 2012-2013
Commercial
0
1
1
2
2
3
3
4
4
2009-10 2010-11 2011-12 2012-13 2013-14
Hotel Industries
Hotel Industries

Solar City Master Plan PANAJI
23
consumption pattern in commercial sector with its overall energy consumption
scenario.
The total number of consumers per year has been shown in the figure 5.13 for
Indutrial sector. The number of commercial consumers has from increased 91 in FY
2009-10 to 105 in FY 2003-14.
Figure 5-13: No. of Commercial consumers
80
85
90
95
100
105
110
2008-2009 2009-2010 2010-2011 2011-2012 2012-2013
Industrial
Industrial

Solar City Master Plan PANAJI
24
6 Ene r gy F o r e c as t i n g and T a r ge t
S e t t i n g
6.1 Introduction
As discussed the current situation in the earlier section, now we are doing the
trend analysis for the population data, we get the following data for the projected
population as shown in figure 6.1. It shows that by the end of 2024, the population
will grow up to 82,000.
Figure 6-1: Projected population data for Panaji
6.2 Projection for electricity demand up to 2023-24
Based on the total electricity consumption data for Panaji for the past five year, a
trend analysis has been done for preparation of BAU scenario and the same has
been projected for the next 10 years as shown in figure 6.2. It clearly shows that
by 2023-24, the annual electricity consumption of Pani City would be around 262
MU in BAU scenario which is about 2.85 times the total electricity consumption of
the city in the year 2013-14.
78500
79000
79500
80000
80500
81000
81500
82000

Solar City Master Plan PANAJI
25
Figure 6-2 Total Projected Annual Electricity consumption (MU) in BAU scenario
Source: Department of Electricity & Darashaw Analysis
The projection of different sectors has been given in the following sections.
6.2.1 Residential Sector
All the demand forecast/projection in the following sections has been done through
time series analysis of data gathered from various sources for historical data.
Figure 6-3: Projected Annual Electricity consumption (MU) in BAU scenario – Residential
Source: Department of Electricity & Darashaw Analysis
Based on the electricity consumption data, a trend analysis has been done for
preparation of BAU scenario and the projection of electricity demand has been done
0
50
100
150
200
250
300
0
20
40
60
80
100
120

Solar City Master Plan PANAJI
26
for the next ten years as shown in the figure 6.3. It shows that in case of BAU
scenario, the electricity consumption in the residential sector would go up to 103
MU by 2023-24, which was 39 MU in FY 2013-14. It means that the expected
growth in electricity consumption in the residential sector would be more than the
growth rate of the total electricity consumption for Panaji. This could be attributed
to the spurt in commercial activity to cater to the floating population of the city.
Residential consumption will increase due to increase in number of consumers.
6.2.2 Commercial Sector
The commercial sector is growing at a considerable rate in Panaji. Some of these
establishments are HT consumers and others are LT consumers. The total energy
consumption from all these commercial consumers have been projected for the
next ten years on the basis of past five year data using regression analysis and
shown in figure 6.4. It clearly shows that by the end of 2023-24, the annual
electricity consumption in commercial sector will be around 150 MU in BAU
scenario, which was 49 MU in FY 2013-14.
6.2.3 Industrial Sector
The Industrial sector is having almost stagnant growth in Panaji. Some of these
establishments are HT consumers and others are LT consumers. The total energy
consumption from all these commercial consumers have been projected for the
next ten years on the basis of past five year data using regression analysis and
Figure 6-4: Projected Annual Electricity consumption (MU) in BAU scenario – Commercial
Source: Department of Electricity & Darashaw Analysis
0
20
40
60
80
100
120
140
160

Solar City Master Plan PANAJI
27
shown in figure 6.5. It clearly shows that by the end of 2023-24, the annual
electricity consumption in commercial sector will be around 10 MU in BAU scenario,
which was 3 MU in FY 2013-14.
6.3 Projection of demand of Petrol, Diesel and LPG for next Decade in Business as usual (BAU) scenario
6.3.1 Projected demand for Petrol and Diesel
Forecast/projection for petrol, Diesel and LPG has been done through time series
analysis of data gathered from various sources for historical data. The fuel
consumed is projected for next ten years considering the appropriate growth rate.
Figure 6-5: Projected Annual Electricity consumption (MU) in BAU scenario – Industrial
Source: Department of Electricity & Darashaw Analysis
0
1
2
3
4
5
6
7
8
9
10

Solar City Master Plan PANAJI
28
Figure 6-6: Projected Annual Petrol & Diesel consumption (KL) in BAU scenario
Source: Oil Marketing companies & Darashaw Analysis
Based on the fuel consumption data, a trend analysis has been done for
preparation of BAU scenario and the projection of fuel demand has been done for
the next ten years as shown in the figure 6.6. It shows that in case of BAU
scenario, the Petrol and Diesel consumption would go up to 18038 KL and 16122
KL respectively by 2023-24, which was 9008 KL and 7780 KL respectively in FY
2013-14. Projections for petrol have been done based on growth rate of 5 years
CAGR and for petrol and diesel is 7.2% and 7.6% respectively has been
considered.
6.3.2 Projected demand for LPG
The consumption of gas will keep on increasing in the BAU scenario. The projection
of LPG consumption is shown in figure 6.7 in MT. The projected consumption of
LPG has shown a considerable increase over next 10 years. LPG consumption is
projected on the basis of 5 years CAGR. It shows that in case of BAU scenario, the
LPG consumption would go up to 1393 MT by 2023-24, which was 1246 MT in FY
2013-14. It clearly shows that by the end of 2023-24, the annual LPG consumption
will increase due to increase in no. of households & Population.
0
2000
4000
6000
8000
10000
12000
14000
16000
18000
20000
Petrol Diesel

Solar City Master Plan PANAJI
29
Figure 6-7: Projected Annual LPG consumption (MT) in BAU scenario
Source: Oil Marketing companies & Darashaw Analysis
6.4 Target Setting
As shown in the previous sections, the demand of energy is going to increase
unabated in the Business as Usual scenario. If we convert all the energy derived
from fossil fuel source to equivalent amount of electricity in Million Units, we can
arrive at a baseline of 2013-14. The total equivalent electricity consumption thus
derived in the baseline year could be taken as the basis and the target setting can
be done accordingly (10% reduction in next 5 years). The following table 6.1 shows
the consumption of electricity as well as fossil fuel projected in the baseline year.
Table 6.1: Consumption of Energy Sources in Year 2013-14
Energy
Source
Electricity
(MU)
Petrol (KL) Diesel
(KL)
Kerosene
(KL)
LPG (MT)
Consumption 92 9008 7780 798 1246
Now if we convert these sources of energy into a common denomination, we can
arrive at equivalent million units of electricity for all these different sources of
energy. The table 6.2 shows these values converted into the same units of million
equivalent of Electricity produced (in Million Units).
1150
1200
1250
1300
1350
1400
1450MT
LPG

Solar City Master Plan PANAJI
30
Table 6.2: Consumption of Energy Sources in Year 2013-14 converted into Million
Units (MU) of electricity equivalent.
Energy
Source
Electricity(MU) Petrol
(MU)
Diesel (MU) Kerosene
(MU)
LPG (MU)
Consumption 92 97 88 30 16
Now, the solar city programme envisage a 10% reduction in conventional energy
demand through a combination of various demand side and supply side measures
spread across all the sectors by the end of next 5 years. Accordingly, the target for
CCP could be considered as a reduction of 10% of the total energy demand which
turns out to be equal to 85 Million Units of electricity.
Table 6.3: Projected Consumption of energy from Conventional sources in 2018-
19.
Energy
Source
Electricity(MU) Petrol
(MU)
Diesel
(MU)
Kerosene
(MU)
LPG
(MU)
Total
(MU)
Consumption 155 137 127 13 17 450
Table 6.4: Projected Consumption of energy from Conventional sources in 2023-
24
Energy
Source
Electricity(MU) Petrol
(MU)
Diesel
(MU)
Kerosene
(MU)
LPG
(MU)
Total
(MU)
Consumption 262 194 183 6 18 663
Table 6.5: Target Reduction of conventional Energy @10%
Year Total (MU)
2016-17 45 MU
2021-22 66 MU
The target for the Solar city programme for Panaji City could be taken as the
reduction in the demand of electricity equivalent by 45 MU by next five years
through various supply and demand side measures in residential, commercial,
Industrial and Municipal sectors. This would lead to a marked reduction in the
Carbon footprint of the city and will propel it onto a sustainable path of growth in
terms of energy. Various Renewable Energy (RE) and Energy Efficiency (EE)
options through which this can be achieved are explained in detail in the
subsequent chapters.

Solar City Master Plan PANAJI
31
CCP will achieve 73% of total target by Renewable energy and balance 27%
through energy efficiency sources. Total estimated targeted reduction of RE
sources is 42 MU and reduction of EE measures is 15 MU by 2018-19.

Solar City Master Plan PANAJI
32
7 Gr een Bu i l d i ng & En e rg y
E f f i c i en c y i n Bu i l d i ngs
7.1 Introduction
Residential, public and commercial buildings consume a large amount of energy
mostly for lighting, appliances, space heating and water heating. In order to
improve energy efficiency and conserve energy through the concept of solar city
existing buildings and new buildings must evolve to incorporate energy efficiency
and energy conservation measures.
To encourage the best practices in Panaji, this chapter considers how energy
efficiency is incorporated into building codes. Strategies to achieve energy efficient
buildings according to international practice will be explained here for the main
components of a building in order to achieve energy efficiency and conservation in
the developing solar city of Panaji. Information on technologies and energy saving
methods outlined in this chapter aim to assist CCP in going beyond basic energy
efficient strategies and to provide more the tools for innovative design for new and
retrofit buildings for Panaji.
As Panaji lies in the hot and humid climate, any energy efficient building system
must be designed according to this climate. This should also be a major
consideration when looking at various practices that are suitable to follow.
This chapter will explain in detail the various green and sustainable initiatives that
can be incorporated during the construction and operation of any new construction
as well as retrofitting of existing buildings planned in city of Panaji.
7.2 Building Energy Efficiency – Existing policy Framework
In India there exist the National Building codes 2005 (NBC 2005) and the new
Energy conservation of buildings codes 2006 (ECBC 2006). The national building
codes only consider regulations in building construction primarily for the purposes
of regulating administration, health and safety, materials and construction
requirements and building and plumbing services whereas the ECBC 2006 consider
energy conservation and energy efficiency in buildings to provide minimum
requirement for the energy efficient design and construction of buildings. The NBC
2005 refers to a wide variety of building type and ownership whereas ECBC 2005
only refers to commercial buildings and some building complexes.
The ECBC 2006 mainly considers administration and enforcement, the building
envelope, HVAC, service hot water and pumping, lighting and electric power to

Solar City Master Plan PANAJI
33
encourage conservation of energy. These are considered in new buildings and
additions to existing buildings.
At present the energy conservation act 2001 empowers the state governments to
adjust the codes according to local conditions. This encourages inconsistency in
building practices across the country and can lead to huge deviations from the
existing codes. There are currently state designated agencies for implementation of
this code for example in Panaji, Department of Electricity Goa is the state
designated agency for implementing the energy conservation act 2001 and hence
ECBC 2006.The regulating authority is different for each state and is responsible
for enforcing the adapted building codes for that state. Experts check the plans for
new buildings or changes to existing buildings and permit the builder to carry out
construction if the design meets the code requirements. The plans are rejected and
sent for alteration if they do not meet the requirements. After the building is built it
must again be certified as complete by the state designated agency before it is
used.
The Bureau of Energy Efficiency is working on certifying Energy Auditing Agencies
in order to evaluate buildings energy use, which will enable better regulation of
energy conservation in buildings. In order to encourage green rating practices of
buildings, IGBC has come up with LEED rating.
Points are given for different criterion at the site planning, building planning and
construction, and the building operation and maintenance stages of the building life
cycle as explained in action plan.
7.3 Green Building-An Understanding
Green Building, also known as green construction or sustainable building, is the
practice of creating structures and using processes that are environmentally
responsible and resource- efficient throughout a building's life-cycle.
Although new technologies are constantly being developed to complement current
practices in creating greener structures, the common objective is that green
buildings are designed to reduce the overall impact of the built environment on
human health and the natural environment by:
� Efficiently using energy, water, and other resources
� Protecting occupant health and improving employee productivity
� Reducing waste, pollution and environmental degradation.

Solar City Master Plan PANAJI
34
7.4 Need for a Green building
Traditional buildings consume large amounts of energy and other natural resources
and generate harmful byproducts for the environment around them. In India
buildings account for 30% of total energy consumption and generate 35% of green
house gas emissions that harm air quality and contribute to global warming.
Thus Buildings have an enormous impact on the environment, human health, and
the economy. The successful adoption of green building strategies can maximize
both the economic and environmental performance of buildings.
7.5 Benefits and outcomes of a Green building
The major benefits of a Green building
are as follows:
� Reduced energy consumption
without sacrificing the comfort
levels
� Reduced destruction of natural
areas, habitats, and biodiversity,
and reduced soil loss from
erosion etc.
� Reduced air and water pollution
(with direct health benefits)
� Reduced water consumption
� Limited waste generation due to
recycling and reuse
� Reduced pollution loads
� Increased user productivity
� Enhanced image and
marketability
Following are the outcomes of a Green building as researched on basis of existing
Green buildings.

Solar City Master Plan PANAJI
35
� There is 8-9 % decrease in operating costs
� The building value increases by around 7.5 %.
� The return on investment is around 6.6 %.
� There is around 3.5 % increase in occupancy in Green buildings.
� Reported increase of about 3.0 % in rent ration.
7.6 Rating system for Green buildings In India, at present, there are predominantly two rating systems to certify
buildings as green buildings, namely GRIHA and LEED-INDIA. These rating systems
have a predefined set of criteria and there are points for each one of these
criterion. The buildings are required to fulfill the defined criteria and achieve a
certain number of points to be certified.
GRIHA Rating: GRIHA, an acronym for Green Rating for Integrated Habitat
Assessment, is the National Rating System of India. It has been conceived by TERI
and developed jointly with the MNRE Ministry of New and Renewable Energy,
Government of India. It is a green building 'design evaluation system', and is
suitable for all kinds of buildings in different climatic zones of the country.
It is a rating tool that helps people, assess the performance of their building
against certain nationally acceptable benchmarks. It will evaluate the
environmental performance of a building holistically over its entire life cycle,
thereby providing a definitive standard for what constitutes a ‘green building’. The
rating system, based on accepted energy and environmental principles, will seek to
strike a balance between the established practices and emerging concepts, both
national and international. The guidelines/criteria appraisal may be revised every
three years to take into account the latest scientific developments during this
period.
Going by the old adage ‘what gets measured, gets managed’, GRIHA attempts to
quantify aspects such as energy consumption, waste generation, renewable energy
adoption, etc. so as to manage, control and reduce the same to the best possible
extent.
LEED India Rating: LEED-INDIA is the Indian counterpart of United States Green
Building Council’s LEED (Leadership in Energy and Environmental Design). It is led
by the Indian Green Building Council (IGBC) in India.
The Leadership in Energy and Environmental Design (LEED-INDIA) Green Building
Rating System is a nationally and internationally accepted benchmark for the
design, construction and operation of high performance green buildings.
LEED-INDIA rating system provides a roadmap for measuring and documenting
success for every building type and phase of a building lifecycle.

Solar City Master Plan PANAJI
36
7.7 Procedure for certification
1. GRIHA Rating
All buildings, except for industrial complexes and housing colonies, which are in the
design stage, are eligible for certification under the GRIHA system which also
adopted by MNRE (Ministry of New and Renewable Energy). Buildings include
offices, retail spaces, institutional buildings, hotels, hospital buildings, healthcare
facilities, residences, and multi-family high-rise buildings.
Registration
• A project has to be registered with GRIHA through the GRIHA website
(www.grihaindia.org) by filling in the registration form online.
• Registration should preferably be done at beginning of a project, as several
issues need to be addressed at the pre-design stage.
• The registration process includes access to the essential information related
to rating. If desired by the applicant, one-day training for the design team
by GRIHA on the rating system is also included at a nominal additional cost.
During the training session, the following areas shall be covered:
• Overview of the green building design
• Building project and project-specific guidance system
• Documentation process
• Evaluation process
The key steps for the process of Certification for getting a building evaluated under
GRIHA are:
1. Registration
2. Submission of documentation
3. Preliminary evaluation by TERI Technical team
4. Evaluation by panel of experts
5. Preliminary rating with comments sent to project team
6. Final submission of documents
7. Final evaluation by panel of experts
8. Approval of rating by advisory committee
9. Award of rating
Fees
The registration cum rating fee (subject to review and modification every year)
w.e.f. from July 1 2008 is as follows:

Solar City Master Plan PANAJI
37
Registration Cost and the fee for
secretariat
Rs. 2,50,000 {Fixed Cost}
Evaluation fee for up to 5000 sq. m Rs. 64,000
Evaluation fee for area > 5000 sq. m Rs 64,000 + Rs3.75/sq.m for each
sq. m over and above 5000 sq. m
This fee is to be paid upfront on registration of the project for GRIHA certification
and is non-refundable.
The fee includes
• Cost of GRIHA documents and templates
• Third party evaluator fees
• One-day training workshop for all consultants involved in the project {In
Delhi or Bangalore}
• GRIHA secretariat costs for documents collection, assimilation, valuation
and submission.
MNRE Scheme on Energy efficient Solar / Green buildings:
• Budget Allocation: The total budget of Rs. 10.00 crore has been allocated
for implementation of the scheme during the year 2013-14 and rest of the
12th Plan period. The Ministry aims to promote the green building principles
& concept with emphasis on the renewable energy application in the green
buildings among the stakeholders through a combination of promotional
incentives and support majors in the country.
• Financial Provisions: The scheme provides for the financial incentives to
carry out the following promotional activities to promote the construction of
Green Buildings in the country.
• Incentives for Capacity Building and Awareness Activities: A financial
support of up to Rs. 2.00 lakh for 1-2 days and Rs. 3.0 lakh for three days
activity could be provided for organizing training programmes, workshops,
conferences, seminars, publications, awareness campaigns, and orientation
programmes etc. to the implementing agencies. However, for International
Conferences/ exhibitions/ workshops the financial supports up to Rs. 5.0
lakh may be considered based on merit.

Solar City Master Plan PANAJI
38
• Awards to Urban Local bodies (ULBs): The onetime cash award of Rs.
10 lakh along with a shield will be given to best 3 ULBs per year selected
through competition for adopting and promoting the energy efficient
solar/green buildings to be rated under the rating system in vogue i.e.,
GRIHA, LEED India etc.
• Awards to the Green Building having maximum RE installations: The
cash award of Rs. 15 Lakh 10 Lakh and 5 Lakh along with a shield will be
given to best 3 buildings per year that have the maximum installation of
renewable energy systems and the net Zero energy based buildings in the
country.
• Incentives for Renewable Energy Projects installations: The proposals
on RE systems including SPV installations, SWH, waste to energy projects,
biogas generation projects etc. or any other innovative RE related projects
in the Energy Efficient Solar/ Green buildings may be considered under the
Scheme as per available incentives under various MNRE’s schemes.
2. LEED India Rating
LEED India certification provides independent, third-party verification that a
building project meets the highest performance standards. The LEED India plaque
awarded by the IGBC is recognition of the project achievement.
Registration:
The first step toward earning LEED-INDIA certification is project registration.
Registering during the early phases of project design will ensure maximum
potential for achieving certification. Registration is an important step that
establishes contact with the IGBC and provides access to essential information,
software tools and communications. Upon registration, project contacts receive
LEED India templates and a Reference guide.
Once a project is registered, the project team begins to prepare documentation
and calculations to satisfy the prerequisite and credit submittal requirements. It is
helpful to have an IGBC Accredited Professional as the project contact and team
member responsible for coordinating the LEED-INDIA process and requirements.
Credit Interpretations:

Solar City Master Plan PANAJI
39
In some cases, project teams may encounter difficulties applying a LEED India
prerequisite or credit to a specific project. In such cases, projects can apply for
Credit Interpretation Request (CIR).
Certification Process:
The key steps for the process of Certification for getting a building evaluated under
LEED India are:
1. Registration
2. Credit Interpretations
3. Certification and Documentation
4. Certification Award
5. Appeal
Fee Summary
The registration and rating fees for LEED rating is as follows:
Certification Fee
5,000 sq.m
& below
5,001 sq.m to 50,000 sq.m 50,001 sq.m
& above
Fixed rate Based on sq.m Fixed rate
Founding
Members Rs. 2,90,000
Rs. 2,90,000 plus Rs. 5.30 per
additional sq.m over & above
5,000 sq.m
Rs. 5,30,000
Annual
members Rs. 3,25,000
Rs. 3,25,000 plus Rs. 5.30 per
additional sq.m over & above
5,000 sq.m
Rs. 5,65,000
Non-
members Rs. 3,35,000
Rs. 3,35,000 plus Rs. 5.30 per
additional sq.m over & above
5,000 sq.m
Rs. 5,75,000
* Parking areas need not be considered as part of the built-up area
* Fee is inclusive of service tax
* Registration and Certification fee are non-refundable
* Membership discounts can be availed only if the project owner is a member of
IGBC.
Registration Fee
IGBC Members Rs.25,000
Non Members Rs.30,000

Solar City Master Plan PANAJI
40
IGBC to recognize Government Green Buildings Demonstrating Global
Leadership
To enable wider adoption of Green Building concepts by the government sector,
IGBC would like to offer the following benefits to Government building projects,
registering with IGBC, effective April 1, 2010.
Free Feasibility Study*:
An exclusive feasibility study for the project team. This is a techno-economic study
to help the project team to decide on the level of rating that can be aspired for, by
verifying the projects compliance with the mandatory and other credit
requirements. The study would enable incorporating energy & water saving
measures by design. It is designed to provide strategic inputs & direction to
achieve the rating. This service is offered free of cost. However, organizations are
requested to reimburse the travel and accommodation for 2 professionals.
Free Training Programme on Green Buildings*:
Training program on green buildings for the project team will facilitate information
sharing on green buildings, rating systems and case studies. This also provides an
insight into various facets of green building design and enlightens the participants
to acquire knowledge on expectation of a green building, both during design and
performance. This service is offered free of cost. However, organizations are
requested to reimburse the travel and accommodation for 2 professionals.
Unique Benefits for Government Buildings achieving Platinum rating of
IGBC
Achieving 'PLATINUM' rating under various rating programmes of IGBC is a
challenging task. 'PLATINUM' rating signifies demonstration of global leadership in
green building design and construction practices.
IGBC will refund 100% certification fee for the Government building project, on
achieving the 'PLATINUM' rating of any IGBC rating system
Note:
*The above said incentives & services are offered for buildings constructed by Not-
For-Profit governmental organizations
7.7.1 Salient Features of Green Building
Green Building has the following advantages:
� Minimum Air Conditioning Load:
Each tonne of refrigeration (TR) caters to more than 300 Sqft (Normal buildings
in India require 150-200 Sqft / TR) of air conditioned area, despite higher fresh
air intake. This is achieved through specially selected double glazing for each

Solar City Master Plan PANAJI
41
orientation, and by ensuring that all external walls and exposed roofs are well
insulated, thus minimizing the air conditioning load.
� Lighting Power Density:
Energy efficient general lighting power density is less than 10 W / Sq.mt
(Normal is 20 W/Sqmt), as per LED requirements.
� Power Consumption:
Annual power consumption for Green Office building is generally less than 250
KWH / Sq.mt for normal 12 hours / day operation (Normal buildings are 400
KWH / Sq.mt.).
� Excellent Indoor Air Quality:
Fresh air requirement is 3% higher than ASHRAE 62.1 - 2004, to improve the
indoor air quality (IAQ). Therefore personnel working indoor are always subject
to generous quantity of treated fresh air, which keeps them fresh and energetic
even after extended working hours, thereby improving productivity. Fresh air is
generally supplied on-demand basis monitored thru CO2 level in return air.
� Treated Fresh Air:
Treated fresh air is provided with heat recovery wheel (HRW) to minimize the
air conditioning load by reducing the ambient air temperature before it passes
through the cooling coil of the space AHUs.
� Visible Light Transmittance:
Glass of window is specified for superior visible light transmittance allowing
maximum harnessing of day-light (without adding glare on computer screen)
thus reducing energy consumption through electrical light fixtures throughout
the day.
� Water Conservation:
It is achieved through Zero Discharge, that is, entire effluent is treated in
Sewerage Treatment Plant (STP), and treated water is recycled as makeup for
air conditioning and DG sets cooling towers, for flushing in WCs and urinals,
and for gardening
� Rain Water Harvesting System:
Rain water harvesting system with filtration is provided. This water can be used
for cars / car parking washing and for general washing.

Solar City Master Plan PANAJI
42
7.8 Demand Comparison: Conventional Vis a Vis Green
Building
Table 7.1: Demand comparison of Conventional building vis-à-vis Green Building
Type of Loads Conventional Building Green Buildings *
Air-conditioning Cooling Load 150 SFT/TR 600 SFT/TR
Electrical Demand Load 10 WATT/SFT 4 WATT/SFT
Lighting Power Density office
area 2 WATT/SFT < 0.6 WATT/SFT
Lighting Power Density retail
area 4 WATT/SFT < 1 WATT/SFT
Lighting Power Density parking
area 1 WATT/SFT < 0.15 WATT/SFT
Potable Water Demand 45 Liters per day per
person
20 Liters per day per
person
* - As per the Green measures adopted
Green buildings are scored by rating systems, such as the Leadership in Energy
and Environmental Design (LEED) rating system developed by the Indian Green
Building Council, U.S. Green Building Council, Green Globes from GBI and other
locally developed rating systems.
7.9 Green Building Implementation Framework Model for
Corporation of the City of Panaji
In order to propagate the energy efficient/ green building in the jurisdiction of CCP,
the construction of commercial, industrial and residential complexes/ townships can
be made mandatory by CCP or can advocate some special financial incentives can
be given by CCP such as property tax rebates or incentives in electricity bills etc.
For the effective implementation of sustainable construction as per the LEED/
GRIHA criteria CCP should set up a Green Building cell which can be a subset of the
solar city cell, which will consist of members of town planning authority, PWD and
CCP who will be trained on Green Building concept and also seek the help of LEED
AP or GRIHA certified professionals.
This green building cell will be responsible for the approval of all plans in order to
ensure that it is as per the criteria of LEED/ GRIHA which can also have a third
party inspection from LEED AP/ GRIHA certified professionals who in turn will give
the certification report to town planning department advising them on any changes
to be made in plan if required or recommending approval. The model framework
depicted in Figure below. CCP should conduct extensive training programme either
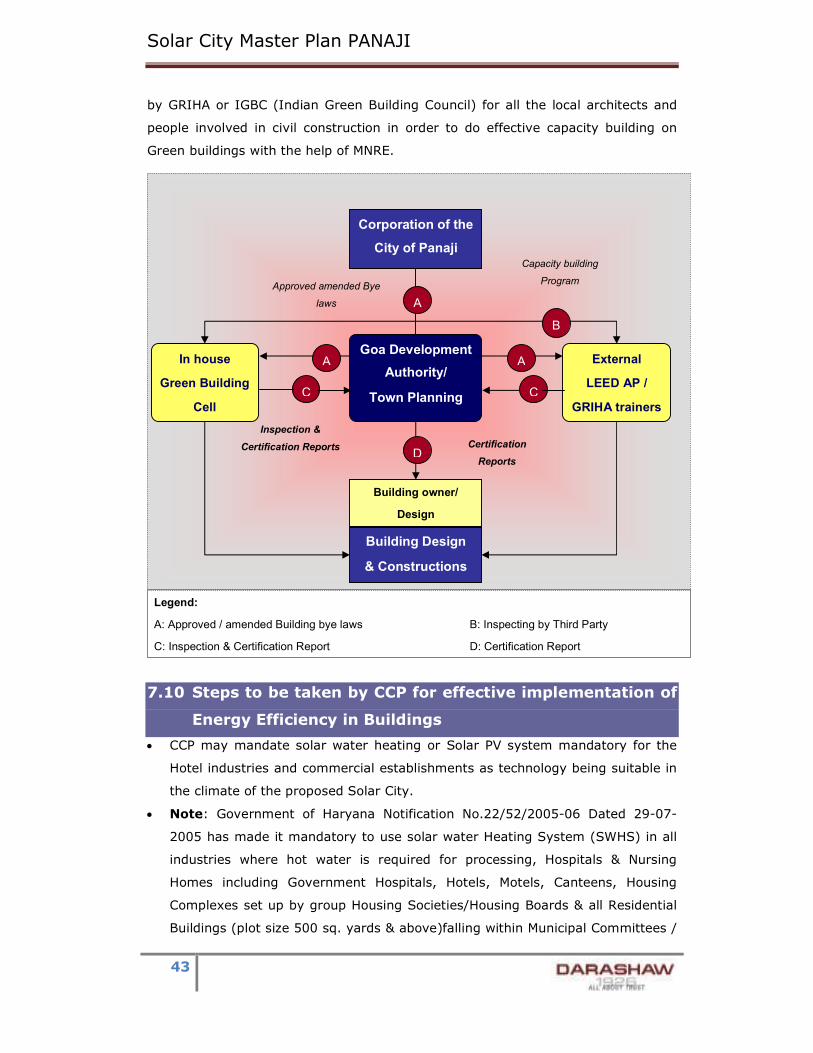
Solar City Master Plan PANAJI
43
by GRIHA or IGBC (Indian Green Building Council) for all the local architects and
people involved in civil construction in order to do effective capacity building on
Green buildings with the help of MNRE.
7.10 Steps to be taken by CCP for effective implementation of
Energy Efficiency in Buildings
• CCP may mandate solar water heating or Solar PV system mandatory for the
Hotel industries and commercial establishments as technology being suitable in
the climate of the proposed Solar City.
• Note: Government of Haryana Notification No.22/52/2005-06 Dated 29-07-
2005 has made it mandatory to use solar water Heating System (SWHS) in all
industries where hot water is required for processing, Hospitals & Nursing
Homes including Government Hospitals, Hotels, Motels, Canteens, Housing
Complexes set up by group Housing Societies/Housing Boards & all Residential
Buildings (plot size 500 sq. yards & above)falling within Municipal Committees /
External
LEED AP /
GRIHA trainers
In house
Green Building
Cell
Building owner/
Design
Building Design
& Constructions
Legend:
A: Approved / amended Building bye laws B: Inspecting by Third Party
C: Inspection & Certification Report D: Certification Report
Goa Development
Authority/
Town Planning
Department
Corporation of the
City of Panaji
A A
A
B
D
C C
Capacity building
Program Approved amended Bye
laws
Inspection &
Certification Reports Certification
Reports

Solar City Master Plan PANAJI
44
Corporations and HUDA sectors, All Government Buildings, Residential schools,
Educational and training institutes, Tourism Complexes And Universities Etc. in
the state.
• CCP can mandate the energy conservation measures considering the following
example of Administration of Union Territory of Chandigarh. Detailed
Notification is attached as an annexure.
• Note: In exercise of the powers conferred by Section 18 of the Energy
Conservation Act, 2001 (52 of 2001), read with the Government of India,
Ministry of Home Affairs Notification No.S.O. 593(E)/F.No. U-11030/1/2005-UTL
dated the 24th April, 2006 Administrator of Union Territory of Chandigarh
hereby issues the following directions for efficient use of energy and its
conservation in the Union Territory of Chandigarh namely:
o Mandatory use of Solar Water Heating Systems
o Mandatory use of Compact Fluorescent Lamp (CFL) in Government
Buildings/Government Aided Institutions/Boards/corporations.
o Mandatory use of Energy Efficient Tube Light System/Retrofit Assembly
in Government Buildings/Government Aided Institutions/Boards/
Corporations.
o Mandatory use of Compact Fluorescent lamps (CFLs) and T-5 (28 watt)
Tube Lights.
o Promotion of Energy Efficient Building Design
o Mandatory use of Energy Efficient Street Lights

Solar City Master Plan PANAJI
45
8 Ene r gy P l ann i n g
8.1 Renewable Energy Resource Assessment
Having arrived at baseline scenario, the next logical step is look for ways and
means to address the issue of ever increasing energy demand. It is required to see
how best the demand can be meeting in a sustainable manner. To meet the goal
for Sustainable development, effective plan is required for meeting the energy
requirement and at the same time minimizing the impact of such activities on the
environment through emissions reduction. Under the national plan for climate
change, India plans to install 20 GW of solar power by 2020. Also India has fifth
largest capacity of wind power installed. Further, the Ministry for New and
Renewable energy has taken many steps to encourage the installation of power
plants based on renewable. But in order to assess the generation mix by these
renewable, one needs to evaluate the resources for renewable energy available at
that particular site. Currently Goa has less than 1% of installed capacity from
Renewable Energy sources. The analysis of the potential of these renewable is
presented in the following sections.
8.1.1 Biomass potential
In Corporation of the City of Panaji biomass power potential is too less to establish
biomass based power plant. Biomass is used in the organic farming.
8.1.2 Solar Energy
Corporation of City of Panaji is having good potential for power generation through
Solar PV. Good potential for use of solar energy in thermal applications is available
for Panaji. List of implementable projects are shown in the table below.
Table 8.1: List of Projects Identified for CCP to implement solar Power Project
Sl. No. Name of Project Proposed Project size (KW)
1 Govt. Polytechnic Collage, Althino, Panaji, Goa 50
2 Dhempe Collage of Arts and Science, Miramar, Goa 50
3
National Institute of Ocean Graphy, Dona Pola,
Panaji, Goa 50

Solar City Master Plan PANAJI
46
4 Goa Dental Collage, Banbolin , Panaji, Goa 3
5
Goa Industries Development Corporation (GIDC)
Patto, Panaji, Goa 25
6 Paryatan Bhavan (Goa Tourism), Patto, Panaji, Goa 50
7 Passport Office, Patto, Panaji, Goa 20
8 Kadamba Bus stand 100
9 The Municipal Garden 75
10 Francisco Luis Gomes Garden 50
11 Dona Paula 100
12 Miramar Beach 100
13 Kala Academy 25
14 Church of Our Lady of the Immaculate Conception 25
Total 723

Solar City Master Plan PANAJI
47
9 Renewab l e En e r gy S t r a t e gy
9.1 Residential Sector RE strategy
9.1.1 Solar Water Heaters
Assumptions:
• 200 LPD can replace 4.5 KW capacity Geyser
• Hot water requirement in one house hold for 4 months
• Average operations 1 hour per day from 10 liters geyser (1.5 KW)
o = 4 X 30 X 1.5 X 1 = 180 Kwh / year.
• Number of household = 13400
• Emission Factor .81 tCO2 / MWh.
Table 9.1: Target for SWH installation in Panaji
Single Household Value Units
Average size of domestic SWH 200 LPD
Collector Area 4 Sqmt
Total energy saved per year 180 KWh
Indicative Cost of Installation 35000 `
MNRE Subsidy at Rs 3000 per sq Mtr 3300 per sq mtr
for ETC and FPC
10500 `
Cost of Energy Savings 1170 `
Emission Reduction per year 0.14 Tonnes
Payback Period 30 Years
Target for Entire City
Total No of Households 13400 Nos
Residential Household using fossil fuel for water
heating
70%
Target to replace electric geyser by SWH in 5 years 60%
Average size of domestic SWH 200 LPD
Number of SWH to be installed in 5 year plan 5628 Nos
Total collector area in sqm 22512 Sqmt
Total energy saved per year 1.01 MU
Indicative cost of installation 1969 `Lakhs
MNRE Subsidy at Rs 1100 per sq Mtr 590 `Lakhs

Solar City Master Plan PANAJI
48
Cost of Energy Savings 25 `Lakhs
Payback Period 3 years
Emission Reduction per year 820 tonnes
Source for Subsidy & cost of system MNRE, Emission Factor CEA calculation
9.1.2 Solar PV for Home Inverters
Assumptions:
• Solar Insolation Level – 4.5 kWh/m2/day
• Subsidy – 30%
• Emission Factor .81 tCO2 / MWh.
Table 9.2: Solar PV for Home Invertors
Value Units
Capacity of solar PV system for Home Inverter 250 Wp
Indicative cost of incorporating Solar PV to home
inverter
30000 `
Total Residential Household 13400 nos
Residential Household using inverter during load
shedding
70% %
Target to introduce solar charger for inverters in 5
years
60% %
Number of solar invertors to be installed in 5 years
plan
5628 Nos
Total PV capacity installed 1407 KWp
Energy generated by PV 1.98 MU
Cost of energy saved 49 `Lakhs
Indicative cost of installation 1688 `Lakhs
MNRE Subsidy 506 `Lakhs
Emission Reduction per year 1600 tonnes
Source: CCP, GEDA, MNRE & CEA for emission factor
9.1.3 Solar PV for replacement of DG sets
Assumptions:
• Solar Insolation Level – 4.5 kWh/m2/day
• Subsidy – 30%
• Emission factor of Diesel 0.81 tco2/Mwh
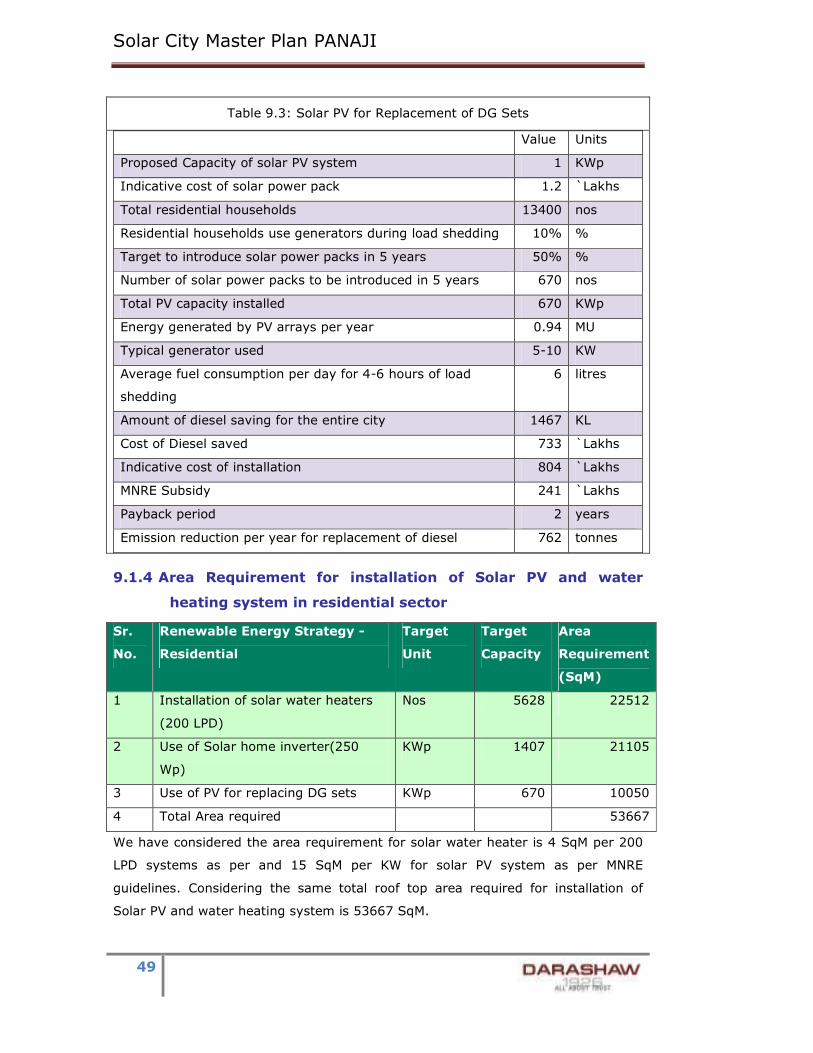
Solar City Master Plan PANAJI
49
Table 9.3: Solar PV for Replacement of DG Sets
Value Units
Proposed Capacity of solar PV system 1 KWp
Indicative cost of solar power pack 1.2 `Lakhs
Total residential households 13400 nos
Residential households use generators during load shedding 10% %
Target to introduce solar power packs in 5 years 50% %
Number of solar power packs to be introduced in 5 years 670 nos
Total PV capacity installed 670 KWp
Energy generated by PV arrays per year 0.94 MU
Typical generator used 5-10 KW
Average fuel consumption per day for 4-6 hours of load
shedding
6 litres
Amount of diesel saving for the entire city 1467 KL
Cost of Diesel saved 733 `Lakhs
Indicative cost of installation 804 `Lakhs
MNRE Subsidy 241 `Lakhs
Payback period 2 years
Emission reduction per year for replacement of diesel 762 tonnes
9.1.4 Area Requirement for installation of Solar PV and water
heating system in residential sector
Sr.
No.
Renewable Energy Strategy -
Residential
Target
Unit
Target
Capacity
Area
Requirement
(SqM)
1 Installation of solar water heaters
(200 LPD)
Nos 5628 22512
2 Use of Solar home inverter(250
Wp)
KWp 1407 21105
3 Use of PV for replacing DG sets KWp 670 10050
4 Total Area required 53667
We have considered the area requirement for solar water heater is 4 SqM per 200
LPD systems as per and 15 SqM per KW for solar PV system as per MNRE
guidelines. Considering the same total roof top area required for installation of
Solar PV and water heating system is 53667 SqM.

Solar City Master Plan PANAJI
50
9.1.5 Summary of RE strategy for Residential Sector
Table 9.4: Summary of RE Strategy for Residential Sector
Renewable
Energy
Strategy -
Residential
Target
Unit
Target
Capacit
y
Investm
ent
( `lakhs)
MNRE
Subsidy
( `lakhs)
User
Contrib
ution (
`Lakhs
)
Energ
y
Save
d per
year
(MU)
Emis
sion
Redu
ction
(Ton
nes)
Installation of
solar water
heaters (200
LPD)
Sqmt 22512 1970 591 1379 1.01 821
Use of solar
home lighting
systems
(74Wp)
Nos 402 64 32 32 0.63 151
Use of Solar
home
inverter(250
Wp)
KWp 1407 1688 507 1182 1.98 1600
Use of PV for
replacing DG
sets
KWp 670 804 241 563 0.94 762
Total 4527 1371 3156 4.56 3333
Source: Darashaw Analysis

Solar City Master Plan PANAJI
51
9.2 Commercial Sector RE Strategy
9.2.1 Installation of Rooftop Solar PV in the Schools & Community
Hall
Assumptions:
o Cost of Roof Top SPV: Rs. 0.9 Lakhs per KW
o MNRE Subsidy: 30%
o 55% of total Load considered for Roof Top Solar PV
o Daily insolation level taken: 4.5 kWh/m2/day
o Emission Factor 0.81 t CO2 / MWh
o Roof Top Solar PV System without Battery Backup
Table 9.5: Roof Top Solar PV System in Schools & Community Hall
Particulars Total Units
Primary School 98 nos
Middle School 48 nos
Secondary & Higher secondary School 41 nos
Higher Education institution 12 nos
Total connected load of Building 2893 KW
Tentative Potential for Roof Top in Buildings 1736 KW
Total Indicative Cost of Installation 1562 `Lakhs
Total Energy Generated 2.85 MU
MNRE Subsidy 469 ` Lakhs
Cost of Energy Saved 185 ` Lakhs
Emission Reduction per year 2309 tonnes
Source: CCP,GEDA, MNRE & CEA for emission factor
9.2.2 Installation of Rooftop Solar PV in the Health
Centers & others commercial establishments
Assumptions:
o Cost of Roof Top SPV: Rs. 0.9 Lakhs per KW
o MNRE Subsidy: 30%
o Daily insolation level taken: 4.5 kWh/m2/day
o Roof Top Solar PV System without Battery Backup
o Emission Factor 0.81 t CO2 / MWh
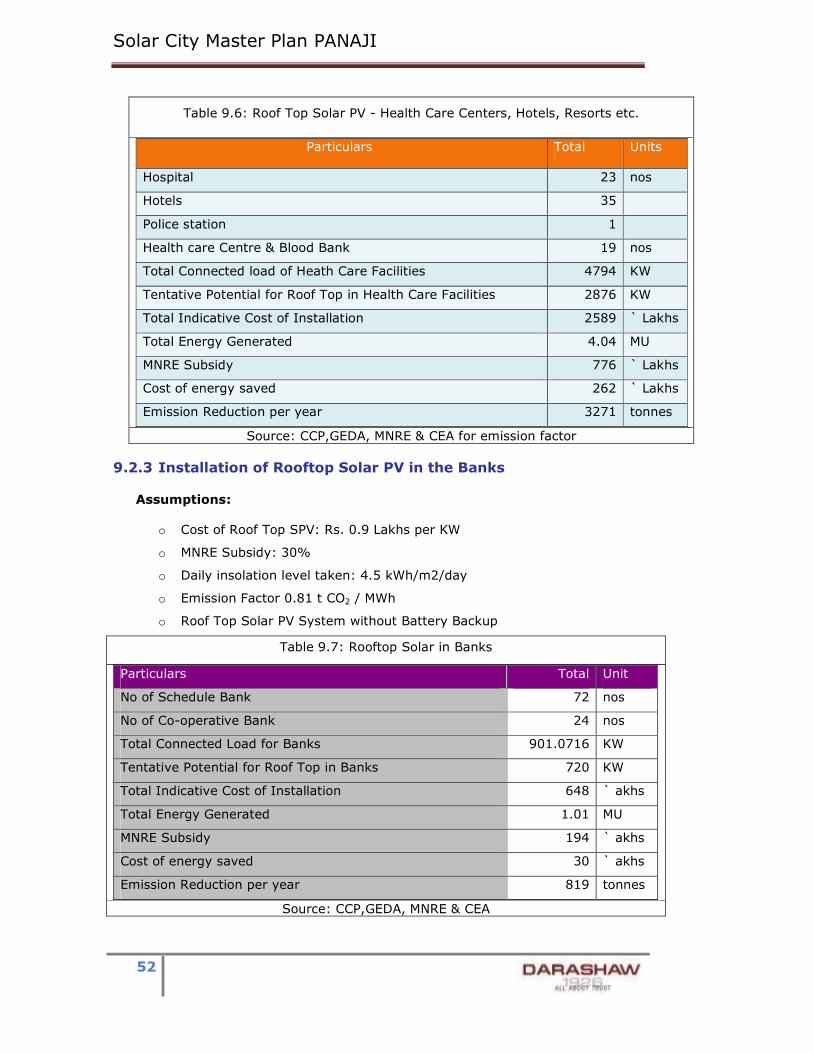
Solar City Master Plan PANAJI
52
Table 9.6: Roof Top Solar PV - Health Care Centers, Hotels, Resorts etc.
Particulars Total Units
Hospital 23 nos
Hotels 35
Police station 1
Health care Centre & Blood Bank 19 nos
Total Connected load of Heath Care Facilities 4794 KW
Tentative Potential for Roof Top in Health Care Facilities 2876 KW
Total Indicative Cost of Installation 2589 ` Lakhs
Total Energy Generated 4.04 MU
MNRE Subsidy 776 ` Lakhs
Cost of energy saved 262 ` Lakhs
Emission Reduction per year 3271 tonnes
Source: CCP,GEDA, MNRE & CEA for emission factor
9.2.3 Installation of Rooftop Solar PV in the Banks
Assumptions:
o Cost of Roof Top SPV: Rs. 0.9 Lakhs per KW
o MNRE Subsidy: 30%
o Daily insolation level taken: 4.5 kWh/m2/day
o Emission Factor 0.81 t CO2 / MWh
o Roof Top Solar PV System without Battery Backup
Table 9.7: Rooftop Solar in Banks
Particulars Total Unit
No of Schedule Bank 72 nos
No of Co-operative Bank 24 nos
Total Connected Load for Banks 901.0716 KW
Tentative Potential for Roof Top in Banks 720 KW
Total Indicative Cost of Installation 648 ` akhs
Total Energy Generated 1.01 MU
MNRE Subsidy 194 ` akhs
Cost of energy saved 30 ` akhs
Emission Reduction per year 819 tonnes
Source: CCP,GEDA, MNRE & CEA

Solar City Master Plan PANAJI
53
9.2.4 1 MW Community based Grid Connected Solar Power Plant
Assumptions:
o Cost of Roof Top SPV: Rs. 7.5 Crore Per MW
o Daily insolation level taken: 4.5 kW/m2/day
o Total Operational Days 312
o Emission Factor 0.81 t CO2 / MWh
Table 9.8: 1 MW Community Based Grid Connected Power Plant
Particulars Value Units
Capacity of Solar PV power plant 1 MW
Indicative cost of installation 15 ` Crore
Total Energy Generated 1.40 MU
Cost of energy saved 42.12 ` Lakhs
Emission Reduction per year 1137.24 tonnes
9.2.5 2 MW Municipal Solid Waste Power Plant on Public
Private Partnership basis
Assumptions:
o 25-30 Tons of bio degradable waste required for generating 1 MW (25
MT/MW)
Table 9.9: 2 MW Grid Connected Municipal Solid Waste based Power Plant
Value Units
Total Solid Waste Generated by 2018-19 50 tonnes
Quantity of Refuse Derived Fuel 30 tonnes
Quantity required for 1 MW 28 tonnes
Tentative Potential 2 MW
Plant Load Factor 75% %
Auxiliary Consumption 10% %
Total Energy generated per year 13.14 MU
Total Energy exported to Grid 11.826 MU
Cost of Installation 1000.00 ` Lakhs
MNRE Subsidy 300.00 ` Lakhs
Emission Reduction per year 9579.06 tonnes
Source: CCP, GEDA and Darashaw Analysis

Solar City Master Plan PANAJI
54
9.2.6 Solar water heater for Hotels, Resorts, Hospitals, Medical
centers & Commercial centers.
Assumptions:
• Average size of SWH system = 2000 LPD
• Collective area for each SWH system = 40 SqM
• Operational days 365 / year for 12 hours each day
• Emission Factor .81 tCO2 / MWh
Table 9.10: SWH for Hotels, Resorts, Hospitals, Medical centers etc.
SWH for Commercial Sector Value Units
Average size of domestic SWH 2000 LPD
Collector Area 60 Sqmt
Total energy saved per year 6570 KWh
Indicative Cost of Installation 300000 Lakh
MNRE Subsidy at Rs 1100 per sq Mtr 66000 `
Cost of Energy Savings 49275 `
Emission Reduction per year 5.42025 Tonnes
Payback Period 6 Years
Target for Entire City
Total No of commercial establishments 65 Nos
Commercial consumers uses electric geyser 80%
Target to replace electric geyser by SWH in 5 years 45%
Average size of domestic SWH 2000 LPD
Number of SWH to be installed in 5 year plan 23 Nos
Total collector area in sqm 1404 Sqmt
Total energy saved per year 0.15 MU
Indicative cost of installation 70.2 `Lakhs
MNRE Subsidy at Rs 1100 per sq Mtr 15.44 `Lakhs
Cost of Energy Savings 11.53 `Lakhs
Payback Period 3 years
Emission Reduction per year 124.52778 tonnes
Source: CCP, GEDA, MNRE and Darashaw Analysis
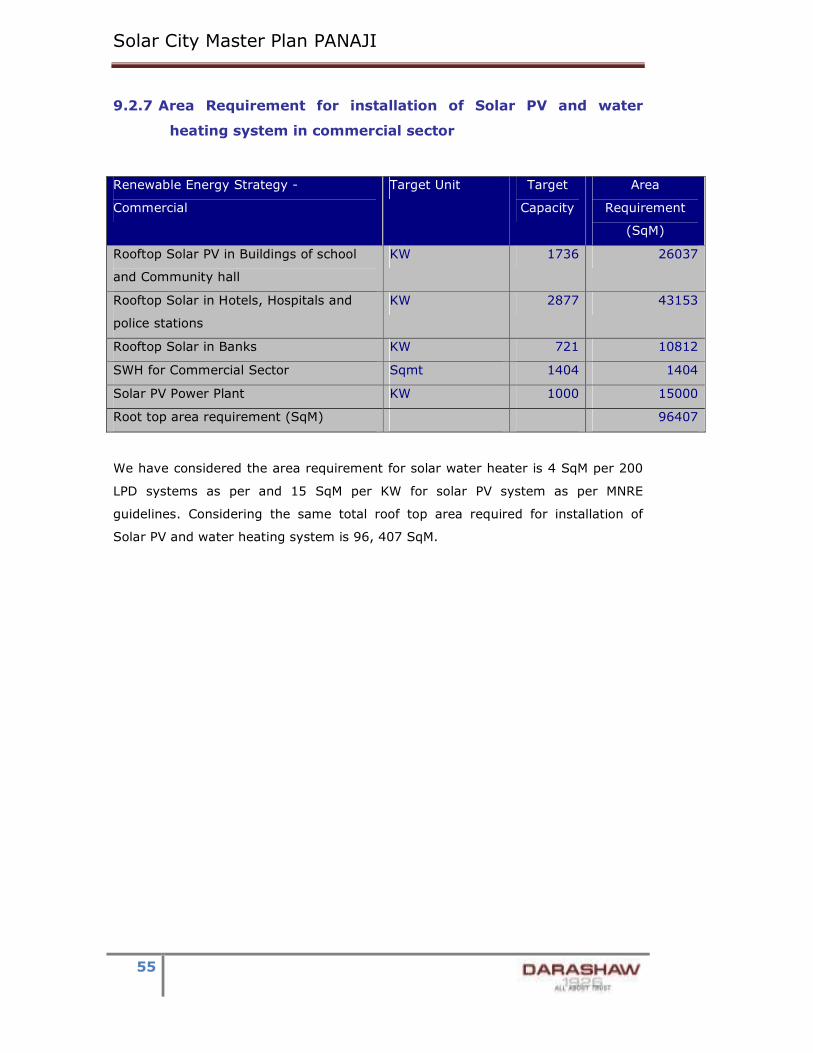
Solar City Master Plan PANAJI
55
9.2.7 Area Requirement for installation of Solar PV and water
heating system in commercial sector
Renewable Energy Strategy -
Commercial
Target Unit Target
Capacity
Area
Requirement
(SqM)
Rooftop Solar PV in Buildings of school
and Community hall
KW 1736 26037
Rooftop Solar in Hotels, Hospitals and
police stations
KW 2877 43153
Rooftop Solar in Banks KW 721 10812
SWH for Commercial Sector Sqmt 1404 1404
Solar PV Power Plant KW 1000 15000
Root top area requirement (SqM) 96407
We have considered the area requirement for solar water heater is 4 SqM per 200
LPD systems as per and 15 SqM per KW for solar PV system as per MNRE
guidelines. Considering the same total roof top area required for installation of
Solar PV and water heating system is 96, 407 SqM.

Solar City Master Plan PANAJI
56
9.2.8 Summary of RE strategy for Commercial Sector
Table 9.11: Summary of RE strategy for Commercial Sector
Renewable
Energy
Strategy -
Commercial
Target
Unit
Target
Capacity
Investment
( `lakhs)
MNRE
Subsidy
(
`lakhs)
User
Contribution
( `Lakhs)
Energy
Saved
per
year
(MU)
Emission
Reduction
(Tonnes)
Rooftop
Solar PV in
Buildings of
school and
Community
hall
KW 1736 1562 469 1094 2.85 2309
Rooftop
Solar in
Hotels,
Hospitals
and police
stations
KW 2877 2589 777 1812 4.04 3272
Rooftop
Solar in
Banks
KW 721 649 195 454 1.01 820
SWH for
Commercial
Sector
Sqmt 1404 70 15 55 0.15 125
Solar PV
Power Plant
MW 1 1500 0 1500 1.40 1137
Energy
From
Municipal
Solid Waste
MW 2 1000 300 700 11.83 9579
Total 7370 1755 5615 21.29 17242

Solar City Master Plan PANAJI
57
9.3 Municipal Sector RE Strategy
9.3.1 Installation of Rooftop Solar PV in the Government Buildings
Assumptions:
o Cost of Roof Top SPV: Rs. 0.9 Lakhs per KW
o MNRE Subsidy: 30%
o Solar insolation level taken: 4.5 kWh/m2/day
o Roof Top Solar PV System without Battery Backup
o Emission Factor: .81 tCO2 / MWh
Table 9.12: Roof Top Solar PV System in Government Buildings
Sr. No. Building Category Total Units
1 Block Level centers 4 nos
2 Utility Area 13 nos
3 Post Office 64 nos
4 Bus Stand 1 nos
5 Telegraph office 1 nos
6 Other Government Buildings 15 nos
7 Total connected load of Government Buildings 1346 KW
8 Tentative Potential for Roof Top in Govt
Buildings
1211 KW
9 Total Indicative Cost of Installation 1090 `Lakhs
10 Total Energy Generated 1.70 MU
11 MNRE Subsidy 327 ` Lakhs
12 Cost of Energy Saved 51 ` Lakhs
13 Emission Reduction per year 1377 tonnes
Source: CCP,GEDA, MNRE and Darashaw Analysis
9.3.2 Installation of Rooftop Solar PV in the Market & Shopping
Centers
Assumptions:
o Cost of Roof Top SPV: Rs. 0.9 Lakhs per KW
o MNRE Subsidy: 30%
o Daily insolation level taken: 4.5 kW/m2/day
o Roof Top Solar PV System without Battery Backup
o Emission Factor: .81 tCO2 / MWh

Solar City Master Plan PANAJI
58
Table 9.13: Roof Top Solar PV System in Market & Shopping Centre
Sr.
NO.
Market Categories Total Units
1 Neighborhood centre 15 nos
2 Agriculture Cooperative Society 0 nos
3 Markets 4 nos
4 Total connected load of Markets 445 KW
5 Tentative Potential for Rooftop in Markets 400 KW
6 Total Indicative Cost of Installation 360 ` Lakhs
7 Total Energy Generated 0.56 MU
8 MNRE Subsidy 108 ` Lakhs
9 Cost of Energy Saved 16 ` Lakhs
10 Emission Reduction per year 455 tonnes
Source: CCP,GEDA, MNRE & Darashaw Analysis
9.3.3 Replacement of conventional street light with solar street
light.
Assumptions:
o Estimated Cost of Solar Street Light: Rs. 20, 000
o MNRE Subsidy: 30%
o Daily insolation level taken: 4.5 kW/m2/day
o Roof Top Solar PV System without Battery Backup
o Emission Factor: .81 tCO2 / MWh
Table 9.14: Replacement of Conventional street lights with Solar Street Lights
Sr. NO. Particulars Value Units
1 Target no of street lights 800 nos
2 Capacity of one solar PV Module 74 Wp
3 Indicative cost of one street light 20000 `
4 Total PV capacity installed 59.2 KW
5 Energy Generated by PV 0.08 MU
6 Cost of energy saved 6.23 ` Lakhs
7 Indicative cost of installation 160 ` Lakhs
8 MNRE Subsidy 48 ` Lakhs
9 Emission Reduction per year 67 tonnes
Source: CCP,GEDA, MNRE and Darashaw Analysis

Solar City Master Plan PANAJI
59
9.3.4 Installation of solar traffic light.
Assumptions:
o Estimated Cost of LED based Solar Traffic Light: Rs. 25, 000
o Daily insolation level taken: 4.5 kW/m2/day
o Solar PV System without Battery Backup
o Emission Factor: .81 tCO2 / MWh
Table 9.15: Solar Traffic Lights
Particulars Value Units
Target no of street lights 800 nos
Capacity of one solar PV Module 74 Wp
Indicative cost of one street light 20000 `
Total PV capacity installed 59 KW
Energy Generated by PV 0.08 MU
Cost of energy saved 2.49 ` Lakhs
Indicative cost of installation 160 ` Lakhs
MNRE Subsidy 48 ` Lakhs
Emission Reduction per year 67 tonnes
Source: PWD, CCP and GEDA
9.3.5 Installation of solar Advertising Hoardings.
Assumptions:
o Estimated Cost of LED based Solar Traffic Light: Rs. 25, 000
o Solar PV System with Battery Backup
o Emission Factor: .81 tCO2 / MWh
Table 9.16: RE system for Advertisement Hoardings
Value Units
Target no of traffic lights 50 nos
Capacity of one solar PV Module ( 2*74Wp) 148 Wp
Indicative cost of one traffic light 25000 `
Total PV capacity installed 7.4 KW
Energy Generated by PV 0.01 MU
Cost of energy saved 0.0000003 ` Lakhs
Indicative cost of installation 12.5 ` Lakhs
MNRE Subsidy 3.75 ` Lakhs
Emission Reduction per year 8 tonnes
Source: PWD, CCP and GEDA

Solar City Master Plan PANAJI
60
9.3.6 Installation of Sewerage Treatment based Biogas power plant
Assumptions:
o Estimated Water requirement Per Person: 120 lpcd
o Waste Water generated: 80% of total water used
o Biodegradable waster available for methanization: 40%
o Estimated Biogas Consumption Cubic Meter / Hour / 1 MW: 521 Cum
o Operational Days: 350
Table 9.17: Sewerage Treatment based biogas power plant
Particulars Value Units
Total projected Population in 2024 83843 nos
Total Water Requirement @ 120 lpcd 11.32 MLD
Total waste water generated 9 MLD
Total biodegradable waste available for biomethanation 3.62 TPD
Digester efficiency 65% %
Biogas yield 0.8 cum/kg
Total biogas yield per day 1883 cum
Biogas consumption Cu mtr/hour/engine for @ 1MW 521 cum
Tentative capacity of bio-methanation plant 150 Kw
PLF 80% %
Auxiliary consumption 10% %
Total energy generated 1012218 Kwh
Electricity exported to grid 0.91 MU
Cost of Installation 50 ` lakhs
MNRE Subsidy 15 lakhs
Emission Reduction per year 737 tonnes
Source: PWD, CCP and Darashaw Analysis

Solar City Master Plan PANAJI
61
9.3.7 Summary of RE strategy for Municipal Sector
Table 9.18: Summary of RE strategy for Municipal Sector
Renewable
Energy Strategy -
Municipal
Targe
t Unit
Target
Capaci
ty
Invest
ment
(
`lakhs
)
MNRE
Subsidy
(
`lakhs)
User
Contr
ibuti
on (
`Lak
hs)
Energy
Saved
per
year
(MU)
Emissio
n
Reducti
on
(Tonnes
)
Installation of 5
MW Solar PV Plant
MW 5 3500 0 3500 7.50 6525
Rooftop Solar PV in
Building
KW 1211 1090 327 763 1.70 1378
Rooftop Solar PV in
Markets
KW 401 360 108 252 0.56 455
Replacement of
Conventional
Street Lights with
Solar Street Lights
Nos 800 160 48 112 0.08 67
Solar Traffic Lights Nos 50 13 4 9 0.010 8
Sewerage
treatment plant
Kw 151 50 15 35 0.91 738
Demonstration
Projects
KW 723 1012 304 709 1.08 878
RE systems for
Advertisement
Hoardings
Nos 200 200 60 140 0.08 68
Total 6385 866 5520 11.94 10118

Solar City Master Plan PANAJI
62
9.4 Industrial (Hotel) Sector RE Strategy
9.4.1 Installation of Solar Water Heating system for Heating or
cooking
Table 9.19: Solar water Heting System 2000 LPD Capacity each
Single Industries Value Units
Average size of domestic SWH 2000 LPD
Collector Area 40 Sqmt
Total energy saved per year 16000 KWh
Indicative Cost of Installation 175000
MNRE Subsidy at Rs 1100 per sq Mtr 52500 `
Cost of Energy Savings 72000 `
Emission Reduction per year 13 Tonnes
Payback Period 2 Years
Target for Entire City
Total No of Households 50 Nos
Industrial consumers using fossil fuel for water heating 100%
Target to replace electric geyser by SWH in 5 years 80%
Average size of domestic SWH 2000 LPD
Number of SWH to be installed in 5 year plan 40 Nos
Total collector area in sqm 1600 Sqmt
Total energy saved per year 0.64 MU
Indicative cost of installation 70 `Lakhs
MNRE Subsidy at Rs 1100 per sq Mtr 21 `Lakhs
Cost of Energy Savings 29 `Lakhs
Payback Period 3 years
Emission Reduction per year 518 tonnes
Source: CCP, GEDA and Darashaw Analysis

Solar City Master Plan PANAJI
63
9.4.2 Installation of Roof Top Solar PV System in High rise buildings
having plot size more than 1000 SqM.
Assumptions
o Cost of Roof Top SPV: Rs. 0.9 Lakhs per KW
o MNRE Subsidy: 30%
o Daily insolation level taken: 4.5 kW/m2/day
o Roof Top Solar PV System without Battery Backup
o Emission Factor: .81 tCO2 / MWh
Table 9.20: Roof Top Solar PV System in High Rise Buildings having plot size more
than 1000 Sq.M
Particulars Value Units
Total potential for Roof Top Solar PV system 4.725 MWp
Target to introduce solar Power Plant in 5 years 50% %
Total PV capacity installed 2.4 MWp
Energy generated by PV arrays per year 3.32 MU
Cost of Diesel saved 590 `Lakhs
Indicative cost of installation 2126 `Lakhs
MNRE Subsidy 638 `Lakhs
Payback period 3 years
Emission reduction per year for replacement of diesel 2686 tonnes
Source: CCP, GEDA, Darashaw Analysis

Solar City Master Plan PANAJI
64
10 Ene rgy E f f i c i e n c y S t r a t egy
10.1 Energy Efficiency Strategies in Residential Sector
10.1.1 Replacement of CFL with LED
Assumptions:
• Estimated Cost of 15 W LED : Rs. 1800/-
• Hrs. of operation: 8
• Electricity Saving Per CFL: 10W
Table 10.1: Replacement of CFL with LED
Particulars Value Units
Total Residential Households 13400 nos
Households using CFL 100% %
Target to replace CFL with LED 75% %
Number of CFL to be replaced per households 4 nos
Total number of Incandescent bulb to be replaced 40200 nos
Indicative cost of installation 724 ` Lakhs
Energy saved by replacing 25 W CFL with 15W LED 1 MU
Cost of electricity savings 29 ` Lakhs
Payback period 25 years
Emission Reduction per year 951 tonnes
Source: CCP GEDA and Darashaw Analysis
10.1.2 .Replacement of Conventional Ceiling fan with Energy
Efficient Ceiling fans
Assumptions:
• Cost of 1 EE Ceiling Fan : Rs. 1500/-
• Hrs. of operation: 8
• Electricity saving Per Fan: 20 W

Solar City Master Plan PANAJI
65
Table 10.2: Replacement of conventional ceiling fan with Energy Efficient fans
Particulars Value Units
Total residential households 13400 nos
Household using conventional fans 100% %
Target to replace conventional fan by energy efficient fans 90% %
Number of conventional fan to be replaced per household 2 nos
Total number of conventional fans to be replaced 24120 nos
Indicative cost of installation 362 ` Lakhs
Energy saved by replacing conventional fans by EE fans 1 MU
Cost of electricity savings 35 ` Lakhs
Payback period 7 years
Emission reduction per year 1141 tonnes
Source: CCP GEDA and Darashaw Analysis
10.1.3 .Replacement of Conventional AC with EE Star Rated AC
Assumptions:
• Cost of 1.5 T AC: Rs. 28000/-
• Normal energy Consumption per day: 9.45 kWh/day
• Hrs. of operation: 8
• Months of operation: 5
• Energy Saving per day: 1.75 kWh/day
Table 10.3: Replacement of conventional AC with EE star rated ACs
Particulars Value Units
Total Residential Households 13400 nos
Households using conventional ACs 45% %
Target to replace Conventional ACs by EE star rated Acs 40% %
Number of Conventional Acs to be replaced per household 1 nos
Total number of conventional ACs to be replaced 2412 nos
Indicative cost of installation 675 ` lakhs
Energy saved by replacing conventional Acs by EE star
rated Acs
0.63 MU
Cost of electricity savings 15 ` lakhs
Payback period 15 years
Emission Reduction per year 512 tonnes
Source: CCP GEDA and Darashaw Analysis

Solar City Master Plan PANAJI
66
10.1.4 .Summary of EE strategy for Residential Sector
Table 10.4: Summary of EE Strategy for Residential Sector
Energy Efficiency
Strategy -
Residential
Target
Unit
Target
Capacity
Investment
( `lakhs)
Energy
Saved
per
year
(MU)
Emission
Reduction
(Tonnes)
Replacement of
CFL with LED
nos 40200 30 1.17 951
Replacement of
conventional
ceiling fan with
Energy Efficient
ceiling fans
nos 24120 361 1.41 1141
Replacement of
conventional
airconditioners
with EE star rated
ACs
nos 2412 675 0.63 513
Total 1066 3.22 2605
Source: Darashaw Analysis

Solar City Master Plan PANAJI
67
10.2 Commercial Sector EE Strategy
10.2.1 .Replacement of CFL with LED
Assumptions:
o Cost of each 15 W LED: Rs. 1800/-.
o Energy Saving per CFL: 10 W
o Hours of operation: 6 Hrs
Table 10.5: Replacement of CFL with LED
Particulars Value Units
Total Commercial Consumers 7469 nos
Consumers using CFL 95% %
Target to replace CFL with LED 90% %
Number of CFL to be replaced per consumer 15 nos
Total number of CFL to be replaced 95790 nos
Indicative cost of installation 1725 `Lakhs
Energy saved by replacing 25 W CFL with 15W
LED
2.10 MU
Cost of electricity savings 63 `Lakhs
Payback period 27 years
Emission Reduction per year 1699 tonnes
Source: PWD, CCP & Darashaw Analysis
10.2.2 .Replacement of T12/T8 with T5 Tube Light
Assumptions:
o Cost of each T5 (28W) FTL: RS. 500/-
o Energy Saving per T5: 22W
o Hours of operation: 6 Hrs

Solar City Master Plan PANAJI
68
Table 10.6: Replacement of T12 / T8 light by T5 Tube Light
Particulars Value Units
Total Commercial Consumers 7469 nos
Consumers using T8/T12 tube lights 95% %
Target to replace T8/T12 by T5 tube lights 90% %
No of tube lights to be replaced per consumer 15 nos
Total number of T8/T12 tube lights to be replaced 95790 nos
Indicative cost of installation 478 `Lakhs
Energy saved by replacing T8/T12 (with magnetic
ballast) with T5 ( with electronic ballast)
4.62 MU
Cost of electricity savings 138 `Lakhs
Pay back period 2 years
Emission Reduction per year 3738 tonnes
Source: PWD, CCP & Darashaw Analysis
10.2.3 .Replacement of conventional Ceiling fan with EE ceiling fan
Assumptions:
o Cost of each EE Ceiling Fan: RS. 1500/-
o Energy Saving per Fan: 20W
o Hours of operation: 8 Hrs
Table 10.7: Replacement of Conventional ceiling fan with Energy Efficient Fans
Particulars Value Units
Total Commercial Consumers 7469 nos
Consumers using conventional fans 95% %
Target to replace conventional fan by energy efficient
fans
80% %
Number of conventional fan to be replaced per
consumer
8 nos
Total number of conventional fans to be replaced 45412 nos
Indicative cost of installation 681 `Lakhs
Energy saved by replacing conventional fans by EE fans 2.65 MU
Cost of electricity savings 80 `Lakhs
Payback period 7 years
Emission reduction per year 2148 tonnes
Source: PWD, CCP & Darashaw Analysis

Solar City Master Plan PANAJI
69
10.2.4 .Replacement of conventional AC with Star Rated AC
Assumptions:
o Cost of each 1.5 Ton AC: RS. 28000/-
o Normal Energy Consumption in conventional AC per day: 9.47kWh/day
o 3 Star AC Energy Consumption: 7.7 kWh/day
o Energy Saving per day: 1.75 kWh/day
o Hours of operation: 8 Hrs
o Months of operation: 5 months
Table 10.8: Replacement of Conventional air conditioners with EE star rated ACs
Particulars Value Units
Total Commercial Consumers 7469 nos
Consumers using conventional ACs 60% %
Target to replace Conventional ACs by EE star rated Acs 80% %
Number of Conventional Acs to be replaced per consumer 2 nos
Total number of conventional ACs to be replaced 3585 nos
Indicative cost of installation 1004 `lakhs
Energy saved by replacing conventional Acs by EE star
rated Acs
0.94 MU
Cost of electricity savings 28 `lakhs
Payback period 15 years
Emission Reduction per year 762 tonnes

Solar City Master Plan PANAJI
70
10.2.5 .Summary of EE strategy for Commercial Sector
Table 10.9: Summary of EE strategy for commercial sector
Energy
Efficiency
Strategy -
Commercial
Target Unit Target
Capacity
Investment
( `lakhs)
Energy
Saved per
year (MU)
Emission
Reduction
(Tonnes)
Replacement
of CFL with
LED
nos 95790 63 2.10 1699
Replacement
of conventional
ceiling fan with
Energy
Efficient ceiling
fans
nos 45412 681 2.65 2148
Replacement
of conventional
air conditioners
with EE star
rated ACs
nos 3585.12 1004 0.94 762
Replacement
of T12/T8 tube
light by T5
tube light
nos 95790 479 4.62 3738
Total 2227 10.31 8348

Solar City Master Plan PANAJI
71
10.3 Industrial (Hotel) Sector EE Strategy
10.3.1 .Replacement of T12 with 15 W LED
Assumptions:
o Cost of each 15 W LED: Rs. 1800/-.
o Energy Saving per T12: 25 W
o Hours of operation: 8 Hrs
Table 10.10: Replacement of T12 with 15 W LED in all the premises
Particulars Value Units
Total T12 installations in all the premises 105 nos
Consumers using Incandescent Bulbs 100% %
Target to replace Incandescent Bulbs with CFL 100% %
Number of lights to be replaced per consumer 2625 nos
Total number of Lights to be replaced 2625 nos
Indicative cost of installation 47 `Lakhs
Energy saved by replacing 40 W F12 with 15 W LED 0.19 MU
Cost of electricity savings 9 `Lakhs
Payback period 0.4 years
Emission Reduction per year 155 tonnes
Source: PWD, CCP and Darashaw Analysis
10.3.2 .Replacement of T12 / T8 by T5 Tube light
Assumptions:
o Cost of each T5 Tube Lights: Rs. 500/-.
o Energy Saving per T12: 22 W
o Hours of operation: 6 Hrs

Solar City Master Plan PANAJI
72
Table 10.11: Replacement of T12 / T8 Tube Lights with T5 Tube Light
Particulars Value Units
Total Industrial Consumers 105 nos
Consumers using T8/T12 tube lights 90% %
Target to replace T8/T12 by T5 tube lights 90% %
No of tube lights to be replaced per consumer 25 nos
Total number of T8/T12 tube lights to be replaced 2126 nos
Indicative cost of installation 11 `Lakhs
Energy saved by replacing T8/T12 (with magnetic
ballast) with T5 ( with electronic ballast)
0.102 MU
Cost of electricity savings 5 Lakhs
Payback period 2 years
Emission Reduction per year 83 tonnes
Source: PWD, CCP and Darashaw Analysis
10.3.3 .Replacement of ceiling fan with EE ceiling fan
Assumptions:
o Cost of one 50 W Fan: Rs. 1500/-.
o Energy Saving per T12: 20 W
o Hours of operation: 8 Hrs
Table 10.12: Replacement of Conventional Ceiling fan with Energy Efficient Ceiling
Fans
Particulars Value Units
Total Industrial Consumers 105 nos
Consumers using conventional fans 70% %
Target to replace conventional fan by energy efficient fans 100% %
Number of conventional fan to be replaced per industrial
consumer
20 nos
Total number of conventional fans to be replaced 1470 nos
Indicative cost of installation 22 `Lakhs
Energy saved by replacing conventional fans by EE fans 0.086 MU
Cost of electricity savings 4 `Lakhs
Payback period 7 years
Emission reduction per year 70 tonnes
Source: PWD, CCP and Darashaw Analysis

Solar City Master Plan PANAJI
73
10.3.4 .Replacement of conventional air conditioners with EE air
conditioners
Assumptions:
o Cost of each 1.5 Ton AC: RS. 28000/-
o Normal Energy Consumption in conventional
AC per day: 9.47kWh/day
o 3 Star AC Energy Consumption: 7.7 kWh/day
o Energy Saving per day: 1.75 kWh/day
o Hours of operation: 8 Hrs
o Months of operation: 8 months
Table 10.13: Replacement of Conventional air conditioners with EE air conditioners
Particulars Value Units
Total Industrial Consumers 105 nos
Consumers using conventional ACs 70% %
Target to replace Conventional ACs by EE star rated Acs 100% %
Number of Conventional Acs to be replaced per industrial
consumer
4 nos
Total number of conventional ACs to be replaced 74 nos
Indicative cost of installation 31 `lakhs
Energy saved by replacing conventional Acs by EE star
rated Acs
0.03 MU
Cost of electricity savings 1.39 `lakhs
Payback period 15 years
Emission Reduction per year 25 tonnes
Source: PWD, CCP and Darashaw Analysis

Solar City Master Plan PANAJI
74
10.3.5 .Summary of EE strategy for Industrial (Hotel) sector.
Table 10.14: Summary of EE strategy for Industrial (IT) sector
Energy Efficiency
Strategy - Industrial
Target
Unit
Target
Capacity
Investment
(lakhs)
Energy
Saved per
year (MU)
Emission
Reduction
(Tonnes)
Replacement of T12 with
15W LED in all the
premises
nos 2625 9 0.19 155
Replacement of T12/T8
tube light by T5 tube
light
nos 2126 11 0.10 83
Replacement of
conventional ceiling fan
with Energy Efficient
ceiling fans
nos 1470 22 0.09 70
Replacement of
conventional
airconditioners with EE
star rated ACs
nos 73.50 31 0.03 25
Total 72 0.41 333

Solar City Master Plan PANAJI
75
10.4 Municipal Sector EE Strategy
10.4.1 .Replacement of 40 W Tube Light with 15 W LED
Table 10.15: Replacement of 40 W Tube Light with 15 W LED
Sr.
No.
Type of Fixture Calculation Unit HPSV 400
W
LED 160
W
[A] [B]
1 Working Hours/Day - Hrs/Day/Fixture 12 12
2 Power Consumption - KW/Day/Fixture 0.65 0.18
3 Annual Power
Consumption
[2] x 365 KW/Annum/Fixture 237 66
4 Power Saving [A]-[B] KW/Annum/Fixture 0 171
5 Total Nos of Fixtures Nos 600 600
6 Total Power Saving [4] x [5] KW/Annum 0 102492
7 Monetary Saving 3x [6] `/Annum 0 307476
8 Life of Lamp - Years 2 10
9 Cost of Lamp - `/lamp 4000 -
10 Replacement Cost [5] x [9] x
12/ [8]
`/12 Yrs 13090909
11 Cost of Fixture - `/Fixture 15000 40000
5 Total Cost of Fixtures [5] x [11] ` 9000000 24000000
13 Maintenance Cost - % 10 1
14 Total Maintenance Cost [12] x [13]/
100
`/12 Yrs 900000 120000
15 Maintenance Cost [14]/12 `/Yr 75000 10000
16 Salvage Value of HPSV
Fixture @ 50%
[12A] x 0.5 ` - 4500000
17 Net Investment [10] + [12]
– [16]
` 22090909 19510000
18 Net Saving [7] - [15] `/Annum - 297476
19 Payback Period 12 x [17]/
[18]
Month - 787
20 Emission Reduction per
year
tonnes 83
Source: PWD, Electricity Department & Darashaw Analysis

Solar City Master Plan PANAJI
76
10.4.2 Replacement of 250 W HPSV with 100 W LED
Table 10.16: Replacement of 250 W HPSV with 100 W LED
Sr.
No.
Type of Fixture Calculatio
n
Unit HPSV
250 W
LED 100
W
[A] [B]
1 Working Hours/Day - Hrs/Day/Fixtur
e
12 12
2 Power Consumption - KW/Day/Fixtur
e
3 1
3 Annual Power
Consumption
[2] x 365 KW/Annum/Fix
ture
1095 438
4 Power Saving [A]-[B] KW/Annum/Fix
ture
0 657
5 Total Nos of Fixtures Nos 1318 1318
6 Total Power Saving [4] x [5] KW/Annum 0 865926
7 Monetary Saving 3x [6] `/Annum 0 2597778
8 Life of Lamp - Years 2 12
9 Cost of Lamp - `/lamp 0 -
10 Replacement Cost [5] x [9] x
12/ [8]
`/12 Yrs 0
11 Cost of Fixture - `/Fixture 2800 13000
5 Total Cost of Fixtures [5] x [11] ` 3690400 17134000
13 Maintenance Cost - % 10 1
14 Total Maintenance Cost [12] x [13]/
100
`/12 Yrs 369040 85670
15 Maintenance Cost [14]/12 `/Yr 30753 7139
16 Salvage Value of HPSV
Fixture @ 50%
[12A] x 0.5 ` - 0
17 Net Investment [10] + [12]
– [16]
` 3690400 17141139
18 Net Saving [7] - [15] `/Annum - 2590639
19 Payback Period 12 x [17]/
[18]
Month - 79
20 Emission Reduction per
year
tonnes 701

Solar City Master Plan PANAJI
77
10.4.3 .Replacement of 150 W HPSV with 70 W LED
Table 10.17: Replacement of 150 W HPSV with 70 W LED
Sr.
No.
Type of Fixture Calculation Unit HPSV 150
W
LED 70
W
[A] [B]
1 Working
Hours/Day
- Hrs/Day/Fixture 12 12
2 Power
Consumption
- KW/Day/Fixture 2 1
3 Annual Power
Consumption
[2] x 365 KW/Annum/Fixture 657 307
4 Power Saving [A]-[B], [A]-[C] KW/Annum/Fixture 0 350
5 Total Nos of
Fixtures
Nos 993 993
6 Total Power
Saving
[4] x [5] KW/Annum 0 347947
7 Monetary Saving 3x [6] `/Annum 0 1043842
8 Life of Lamp - Years 2 12
9 Cost of Lamp - `/lamp 550 -
10 Replacement Cost [5] x [9] x 12/ [8] `/12 Yrs 2979000
11 Cost of Fixture - `/Fixture 2500 6500
5 Total Cost of
Fixtures
[5] x [11] ` 2482500 6454500
13 Maintenance Cost - % 10 1
14 Total Maintenance
Cost
[12] x [13]/ 100 `/12 Yrs 248250 32273
15 Maintenance Cost [14]/12 `/Yr 20688 2689
16 Salvage Value of
HPSV Fixture @
50%
[12A] x 0.5 ` - 1241250
17 Net Investment [10] + [12] – [16] ` 5461500 5215939
18 Net Saving [7] - [15] `/Annum - 1041152
19 Payback Period 12 x [17]/ [18] Month - 60
20 Emission
Reduction per year
tonnes 282
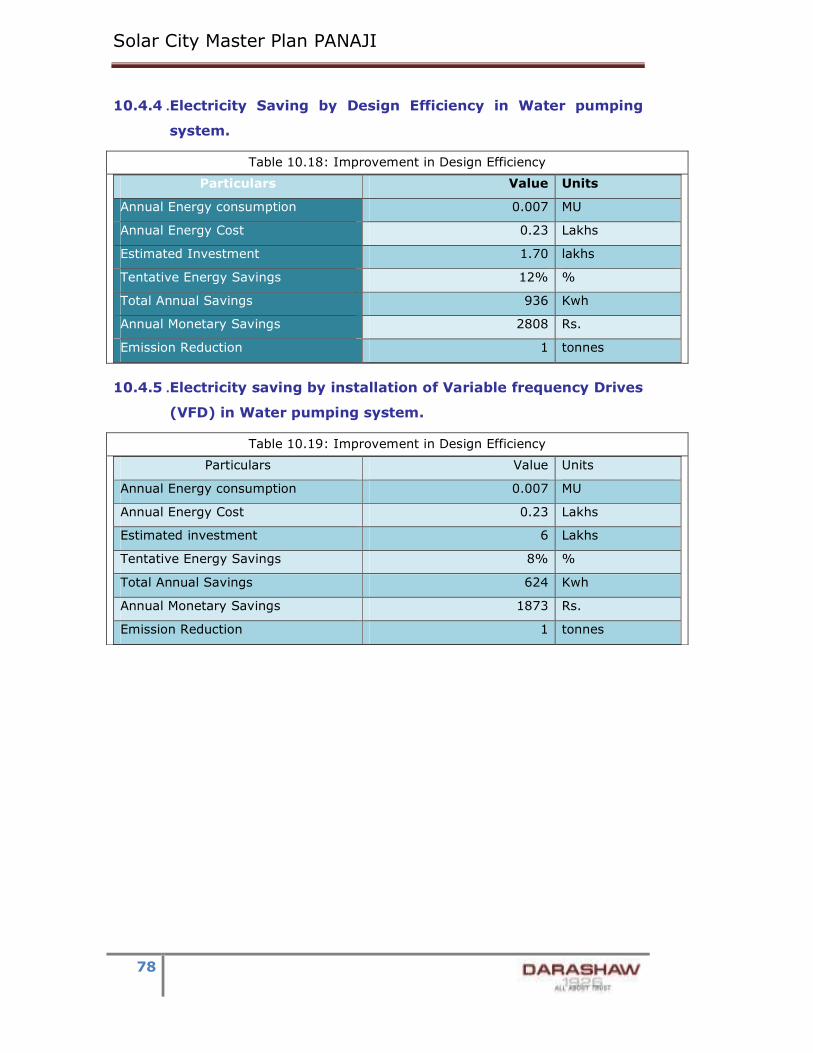
Solar City Master Plan PANAJI
78
10.4.4 .Electricity Saving by Design Efficiency in Water pumping
system.
Table 10.18: Improvement in Design Efficiency
Particulars Value Units
Annual Energy consumption 0.007 MU
Annual Energy Cost 0.23 Lakhs
Estimated Investment 1.70 lakhs
Tentative Energy Savings 12% %
Total Annual Savings 936 Kwh
Annual Monetary Savings 2808 Rs.
Emission Reduction 1 tonnes
10.4.5 .Electricity saving by installation of Variable frequency Drives
(VFD) in Water pumping system.
Table 10.19: Improvement in Design Efficiency
Particulars Value Units
Annual Energy consumption 0.007 MU
Annual Energy Cost 0.23 Lakhs
Estimated investment 6 Lakhs
Tentative Energy Savings 8% %
Total Annual Savings 624 Kwh
Annual Monetary Savings 1873 Rs.
Emission Reduction 1 tonnes

Solar City Master Plan PANAJI
79
10.4.6 .Summary of EE strategy Municipal Sector
Table 10.20: Summary of EE strategy Municipal Sector
Energy Efficiency
Strategy - Municipal
Target
Unit
Target
Capacity
Investment
( `lakhs)
Energy
Saved
per
year
(MU)
Emission
Reduction
(Tonnes)
Replacement of Tube
Lights of 40W with LED
lights of 15 W
nos 600 195 0.10 83
Replacement of High
Pressure Sodium Vapor
Lamps of 250W with
LED lights of 100 W
nos 1318 171 0.87 701
Replacement of High
Pressure Sodium Vapor
Lamps of 150 W with
LED lights of 70 W
nos 993 52 0.35 282
Improvement of Design
Efficiency in Pumping
System
MU 0.00 0 0.00 0
Variable Speed Drivers MU 0.00 0 0.00 0
Total 419 1.32 1066
Source: CCP, PWD and Darashaw Analysis

Solar City Master Plan PANAJI
80
11 Budge t & Ac t i on P l an
To meet the growing energy needs of Panaji, optimizing energy conservation and
resource efficiency is needed which would thus reduce per capita electricity
demand. This would minimize the need for new generation and reduce GHG
emissions. It would enable a cleaner environment with reduced green house gases
and other pollutants, thereby addressing the environmental concerns.
As matter of priority, in order to develop Panaji as a solar city, the principal
government agencies should be committed to:
• Discussing critical energy issues jointly through open meetings and ongoing
informal communication.
• Sharing of information and analyses to minimize duplication, maximize a
common understanding and ensure a broad basis for decision making.
• Continuing progress in meeting the environmental goals and standards,
including minimizing the energy sectors impact on local and global
environment.
Based on the analysis of potential for demand side measures along with that of
supply side augmentation through renewable energy technologies, the following
targets are proposed for Panaji in order to develop it as a solar city. These targets
are based on the detailed analysis and renewable resource potential assessment.
The short term targets for energy conservation are based on the energy
conservation options identified and also with the recommendation for detailed
energy audit. To achieve the medium and long term targets the key
implementation points of the proposed Integrated Development Plan to make
Panaji a solar city is summarized below.
11.1 Implementation Plan
• For implementation of the projects under the solar city scheme, an
empowered committee may be set up which may work in coordination with
the Solar city cell under the chairmanship of CCP.
• The solar city cell may take advantage of the programmes like JNNURM for
implementation of the master plan.
• The solar city cell may also take advantage of the grant in aid being
provided by the BEE to design a few pilot energy efficient buildings in the
city, in accordance with ECBC. The possibility of availing incentives provided
by central government for IGBC/GRIHA rated buildings may also be
explored.
• The solar city cell/CCP may work proactively:

Solar City Master Plan PANAJI
81
o To get ECBC notification immediately.
o To ensure that building byelaws are changed in accordance with it.
o To ensure that all upcoming non residential buildings are brought under
the ambit of ECBC and incorporate the relevant green building elements.
o To ensure that the major new commercial complexes are IGBC/GRIHA
certified.
• CCP may distribute quality LED lights to its residents at concessional prices
or on easy payment terms which could be registered as CDM project, which
can act as a revenue generator to CCP and also help in energy conservation.
• CCP may initiate a dialogue with the electricity department for introducing
rebate on electricity tariff for domestic consumers who employ solar
devices.
• CCP may also give property tax rebates to residents, commercial
establishment who install solar water heating systems and rain water
harvesting systems.
• To begin with CCP can go in for the detailed Energy audit of the whole area
under township and take up various projects; street lighting, optimization of
water pumping system etc. on priority basis through ESCO mode. The draft
EOI, RFP documents for the same are attached in Annexure.
• CCP may initiate on priority basis the tender for Roof top Solar PV for CCP
office building and other buildings.
• Utilizing various MNRE schemes CCP may initiate installation of solar based
LED traffic lights, solar street lights, building integrated solar PV, and other
relevant solar products on priority basis.
• CCP may launch adequate and suitable campaign on solar city covering all
media resources – including print, radio and television.
• In order to spearhead the campaign activities and to demonstrate the same
to public, CCP can construct an energy park and avail benefits of Scheme
(Format attached in Annexure) which will act as an inviting place to provide
public education about issues of sustainable energy and also demonstrate
working models and benefits of various RE/EE devices along with Akshay
Urja Shops.
• Setting up of solar powered, LED display boards at the strategic locations of
the city which would not only display the fact that Panaji is a solar city but
also display pollution levels, temperature updates, and messages useful to
general public can taken up on public private partnership basis.
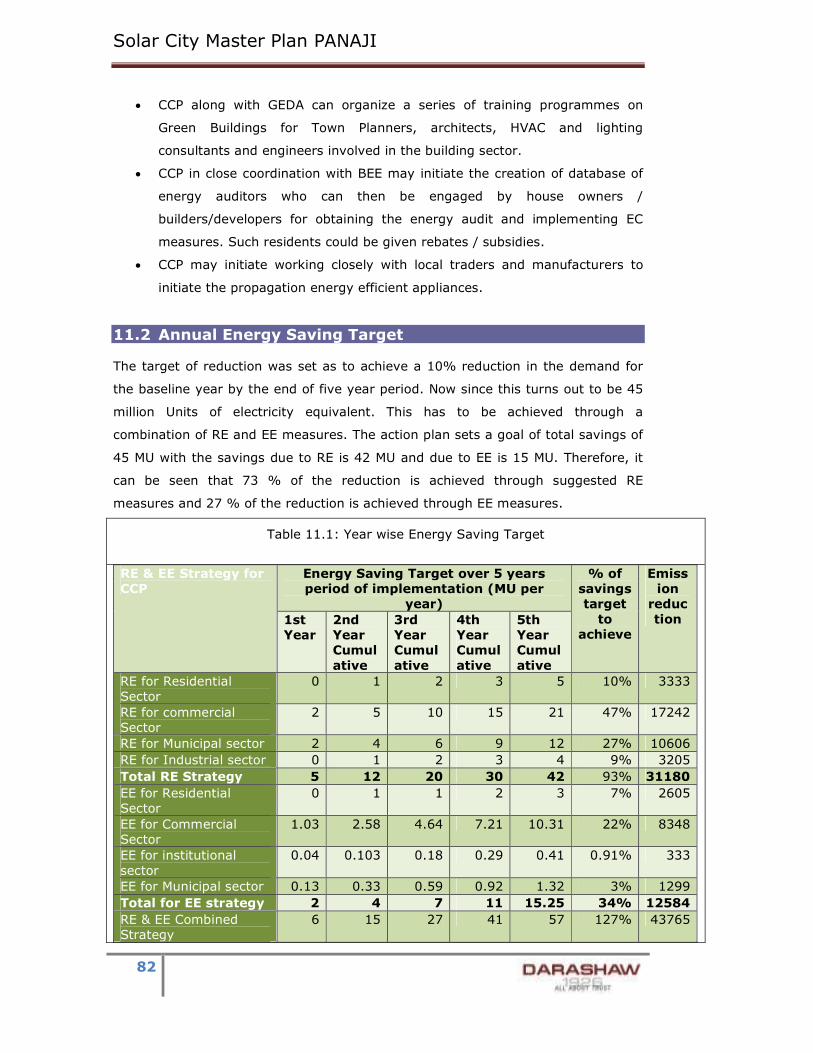
Solar City Master Plan PANAJI
82
• CCP along with GEDA can organize a series of training programmes on
Green Buildings for Town Planners, architects, HVAC and lighting
consultants and engineers involved in the building sector.
• CCP in close coordination with BEE may initiate the creation of database of
energy auditors who can then be engaged by house owners /
builders/developers for obtaining the energy audit and implementing EC
measures. Such residents could be given rebates / subsidies.
• CCP may initiate working closely with local traders and manufacturers to
initiate the propagation energy efficient appliances.
11.2 Annual Energy Saving Target
The target of reduction was set as to achieve a 10% reduction in the demand for
the baseline year by the end of five year period. Now since this turns out to be 45
million Units of electricity equivalent. This has to be achieved through a
combination of RE and EE measures. The action plan sets a goal of total savings of
45 MU with the savings due to RE is 42 MU and due to EE is 15 MU. Therefore, it
can be seen that 73 % of the reduction is achieved through suggested RE
measures and 27 % of the reduction is achieved through EE measures.
Table 11.1: Year wise Energy Saving Target
RE & EE Strategy for CCP
Energy Saving Target over 5 years period of implementation (MU per
year)
% of savings target
to achieve
Emission
reduction 1st
Year 2nd Year Cumulative
3rd Year Cumulative
4th Year Cumulative
5th Year Cumulative
RE for Residential Sector
0 1 2 3 5 10% 3333
RE for commercial Sector
2 5 10 15 21 47% 17242
RE for Municipal sector 2 4 6 9 12 27% 10606
RE for Industrial sector 0 1 2 3 4 9% 3205
Total RE Strategy 5 12 20 30 42 93% 31180
EE for Residential Sector
0 1 1 2 3 7% 2605
EE for Commercial Sector
1.03 2.58 4.64 7.21 10.31 22% 8348
EE for institutional sector
0.04 0.103 0.18 0.29 0.41 0.91% 333
EE for Municipal sector 0.13 0.33 0.59 0.92 1.32 3% 1299
Total for EE strategy 2 4 7 11 15.25 34% 12584
RE & EE Combined Strategy
6 15 27 41 57 127% 43765

Solar City Master Plan PANAJI
83
11.3 Annual Budget Allocation
The total indicative budget of solar city is estimated as Rs 243 crore which will be
invested over a five year period. Indicative Budget for Renewable Energy and
Energy efficiency is Rs. 205 Crore and Rs. 38 Crore respectively. The year wise
budget allocation is shown in the table 11.2 and table 11.3 below.
11.3.1 .Indicative Budget for Renewable Energy
Table 11.2: Year wise budget Allocation for RE projects
Activities Total
Budget
(lakhs)
Year 1 Year2 Year 3 Year 4 Year 5
10% 15% 20% 25% 30%
Renewable Energy Strategy - Residential
Installation of solar water
heaters (200 LPD)
1970 197 295 394 492 591
Use of solar home lighting
systems (74Wp)
64 6 10 13 16 19
Use of Solar home inverter(250
Wp)
1688 169 253 338 422 507
Use of PV for replacing DG sets 804 80 121 161 201 241
Sub Total 4527 453 679 905 1132 1358
Renewable Energy -Commercial
Rooftop Solar PV in Buildings of
school and Community hall
1562 156 234 312 391 469
Rooftop Solar in Hotels,
Hospitals and police stations
2589 259 388 518 647 777
Rooftop Solar in Banks 649 65 97 130 162 195
SWH for Commercial Sector 70 7 11 14 18 21
Solar PV Power Plant 1500 150 225 300 375 450
Energy From Municipal Solid
Waste
1000 100 150 200 250 300
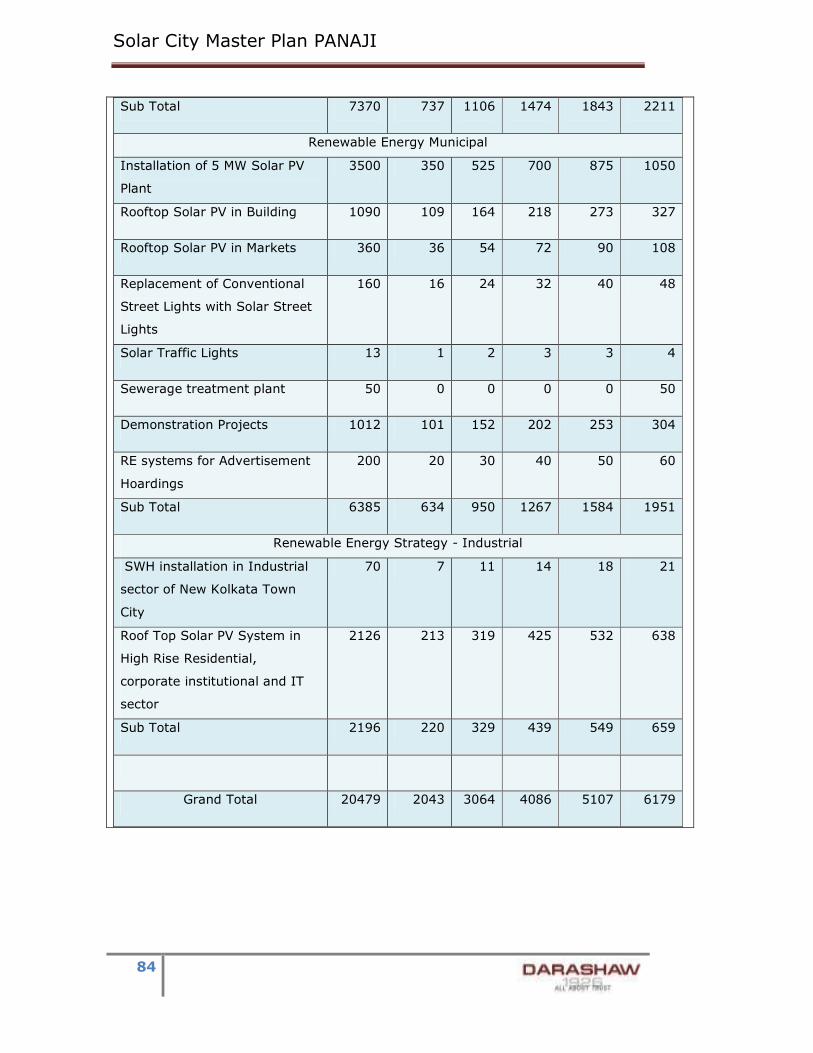
Solar City Master Plan PANAJI
84
Sub Total 7370 737 1106 1474 1843 2211
Renewable Energy Municipal
Installation of 5 MW Solar PV
Plant
3500 350 525 700 875 1050
Rooftop Solar PV in Building 1090 109 164 218 273 327
Rooftop Solar PV in Markets 360 36 54 72 90 108
Replacement of Conventional
Street Lights with Solar Street
Lights
160 16 24 32 40 48
Solar Traffic Lights 13 1 2 3 3 4
Sewerage treatment plant 50 0 0 0 0 50
Demonstration Projects 1012 101 152 202 253 304
RE systems for Advertisement
Hoardings
200 20 30 40 50 60
Sub Total 6385 634 950 1267 1584 1951
Renewable Energy Strategy - Industrial
SWH installation in Industrial
sector of New Kolkata Town
City
70 7 11 14 18 21
Roof Top Solar PV System in
High Rise Residential,
corporate institutional and IT
sector
2126 213 319 425 532 638
Sub Total 2196 220 329 439 549 659
Grand Total 20479 2043 3064 4086 5107 6179

Solar City Master Plan PANAJI
85
11.3.2 .Indicative Budget for Energy Efficiency
Table 11.3: Year wise budget Allocation for EE projects
Energy Efficiency Strategy - Residential
Particulars Investment
(Lakhs Rs.)
Year 1 Year2 Year 3 Year 4 Year 5
Replacement of CFL with
LED
29 3 4 6 7 9
Replacement of
conventional ceiling fan
with Energy Efficient
ceiling fans
362 36 54 72 90 109
Replacement of
conventional air
conditioners with EE star
rated ACs
675 68 101 135 169 203
Total 1067 107 160 213 267 320
Energy Efficiency Strategy - Commercial
Particulars Investment
(Lakhs Rs.)
Year
1
Year2 Year
3
Year
4
Year 5
Replacement of CFL with
LED
62.93 6.29 9 13 16 19
Replacement of conventional
ceiling fan with Energy
Efficient ceiling fans
681.17 68 102 136 170 204
Replacement of conventional
air conditioners with EE star
rated ACs
1003.83 100 151 201 251 301
Replacement of T12/T8 tube
light by T5 tube light
478.95 48 72 96 120 144
Energy Efficiency in Green
Buildings
0.00 0 0 0 0 0
Total 2226.89 223 334 445 557 668
Energy Efficiency Industrial

Solar City Master Plan PANAJI
86
Particulars Investment
(Lakhs Rs.)
Year
1
Year2 Year
3
Year
4
Year 5
Replacement of T12 with
15W LED in all the premises
8.62 0.86 1.29 1.72 2.16 2.59
Replacement of T12/T8 tube
light by T5 tube light
10.63 1.06 1.59 2.13 2.66 3.19
Replacement of conventional
ceiling fan with Energy
Efficient ceiling fans
22.05 2.21 3.31 4.41 5.51 6.62
Replacement of conventional
air conditioners with EE star
rated ACs
30.87 3.09 4.63 6.17 7.72 9.26
Total 72.17 7.22 10.83 14.43 18.04 21.65
Energy Efficiency Strategy - Municipal
Particulars Investment
(Lakhs Rs.)
Year
1
Year2 Year
3
Year
4
Year 5
Replacement of Tube Lights
of 40W with LED lights of 15
W
195 20 29 39 49 59
Replacement of High
Pressure Sodium Vapor
Lamps of 250W with LED
lights of 100 W
171 17 26 34 43 51
Replacement of High
Pressure Sodium Vapor
Lamps of 150 W with LED
lights of 70 W
52 5 8 10 13 16
Improvement of Design
Efficiency in Pumping
System
0 0 0 0 0 0
Variable Speed Drivers 0 0 0 0 0 0
Sub Total 419 42 63 84 105 126
Grand Total 3784 378 568 757 946 1135
• The total budget will be shared by CCP/ state Government, MNRE and
private share in the proportion shown in the figure below.

Solar City Master Plan PANAJI
87
Table
MNRE Contribution
Renewable Energy
Strategy - Residential
Renewable Energy -
Commercial
Renewable Energy
Municipal
Renewable Energy
Strategy - Industrial
19.17%
State /City
Contribution
Renewable Energy
Municipal
Energy Efficiency
Strategy - Municipal
24.48%
19.17%
24.48%
Share of different stakeholders in the proposed budgetary
MNRE Contribution
PANAJI
Table 11.4: Budget Contribution
Total
( Lakhs)
Year 1 Year2 Year 3 Year 4
1371 137 206 274
1755 176 263 351
866 87 130 173
659 66 99 132
4651 399 599 798
5520 552 828 1104 1380
419 42 63 84
5938 594 891 1188 1485
24.48%
56.36%
Share of different stakeholders in the proposed budgetary allocation
Panjim Municipal Corporation Private user contribution
Year 4 Year 5
343 411
439 527
216 260
165 198
998 1198
1380 1656
105 126
1485 1782
Private user contribution

Solar City Master Plan PANAJI
88
Private User
Contribution
Renewable Energy
Strategy - Residential
3156 316 473 631 789 947
Renewable Energy
Strategy - Commercial
5615 561 842 1123 1404 1684
Energy Efficiency
Strategy - Residential
1067 107 160 213 267 320
Energy Efficiency
Strategy - Commercial
2227 223 334 445 557 668
Renewable Energy-
Industrial
1537 154 231 307 384 461
Energy Efficiency
Industrial
72 7 11 14 18 22
56.36% 13674 1367 2051 2735 3418 4102
Grand Total
24263
236
0
3541 4721 5901 7081
11.4 Action Plan
The table shown in Annex shows the detailed year wise action plan and targets of
various strategies (RE & EE). He year wise target has been distributed in such a
way that initial years target is less and it gradually increases till 5th year as the
awareness level of the citizens also increase.
11.5 Capacity Building and Awareness Generation
In order to inculcate the energy conservation techniques in the common
architecture, it is essential that all the practitioners be properly trained in energy
efficient or Green Architecture. CCP may organize a series of training programmes
for the planners, architects, electrical, HVAC and lighting consultants and engineers
involved in the building sector. These courses, tailor made to suit different levels,
would have to be imparted to all the professionals, in public as well as in private
sector – on a regular basis.

Solar City Master Plan PANAJI
89
Specific training programmes need to be designed for front line workers and
technicians and also for those in supervisory role, for effective monitoring of
energy demand.
Entire members of solar city cell should be trained on RE and EE by MNRE and BEE
respectively on various PPP models and in terms of selection of appropriate private
party.
Public awareness and education being central to successful changeover to solar
city, it is imperative for CCP to engage the public through sustained awareness
campaigns and communicate the benefits of energy conservation and renewable
energy to different user groups, including local elected representatives.
A key component of the awareness campaign would be to capture school children’s
attention towards energy efficiency and clean future. Thus the campaign for the
school children will include the following elements:
� Inter School essay and drawing competitions.
� Inter School quizzes.
� Workshops and seminars.
� Exhibitions and demonstrations.
� Field Trips.
CCP can also initiate awareness campaigns along with electricity departments to
generate a public response on energy conservation like door to door campaign,
newsletters etc.
11.5.1 Capacity Building for Green Buildings
Target
Groups
Subgroups Types of Awareness/training Required
Government
Agencies
1. CCP
2. PWD
3. Department
of Electricity
4. GEDA
Training on Guidelines and regulations to achieve
energy efficiency in the built environment of CCP
Awareness Generation Activities:
1. National environmental initiatives viz.,
GRIHA, ECBC etc
2. Audit all govt. buildings and retrofit

Solar City Master Plan PANAJI
90
Building
Professional
s and
Professional
Bodies
Architects
Engineers
Planners
Builders
Training on Guidelines and regulations that are
incorporated into the building bye laws to achieve
energy efficiency in the built environment of CCP.
Awareness Generation Activities:
1. Incentives for building professionals and
builders
2. Latest products in the market
3. National environmental initiatives viz.,
GRIHA, ECBC etc
4. Labeled appliances/products
5. Annual meets to have a segment on energy
efficiency in buildings
Civil Society General public Training on simple techniques upon energy
conservation, electricity saving and practices on
green building construction
Awareness generation activities:
1. Through Website
2. Hoardings and billboards
3. Print media/posters/education leaflets
4. Eco Cell free personalized consultations
interface with general public
5. Print & electronic media (TV, Radio)
initiatives to sensitize public to the need of
energy efficient buildings
Resident welfare
associations
Training on simple techniques upon energy
conservation, electricity saving and practices on
green building construction
Awareness generation activities:
1. Energy efficient construction measures,
energy saving – provide checklist for display
in residential areas
2. Locality related development measures
3. National energy conservation initiatives viz.,

Solar City Master Plan PANAJI
91
References
• http://www.cea.nic.in
• www.mnre.gov.in
• www.powermin.nic.in
• http://www.indiaenergyportal.org/overview_detail.php
• http://www.bee-india.nic.in
• http://www.isci-cities.org
• http://www.eu-solarcities.org
• http://www.solarcity.org
• http://www.ises.org
• http://www.europeangreencities.com/publications/publications.asp
• http://www.energy-cities.eu
• http://www.environment.gov.au/settlements/solarcities/
• http://www.martinot.info/solarcities/barcelona.htm
• http://www.martinot.info/solarcities/linz.htm
• http://www.mahaurja.com/
• http://www.igbc.in
• http://lab.cgpl.iisc.ernet.in/Atlas/
• http://www.larc.nasa.gov/cgi-bin/disclaimer.cgi?http://www.retscreen.net/
• http://mnre.gov.in/pdf/mission-document-JNNSM.pdf
• India - Manual for the Development of Municipal Energy Efficiency Projects,
2008
• International Energy Agency, 2009 report
• Unlocking Energy Efficiency in US Economy, McKinsey Global Energy and
Materials, July 2009
• Environmental and Energy Sustainability: An Approach for India, McKinsey
& Company, Aug 2009
• The Economics of Solar Power, McKinsey Quarterly, June 2008

Solar City Master Plan PANAJI
92
Annexure
Annexure 1- Action plan for Utilization of Fundsof Funds

Solar City Master Plan PANAJI
93

Solar City Master Plan PANAJI
94
Annexure 2- Summary of RE Strategies
Renewable Energy Strategy -
Residential
Target
Unit
Target
Capacity
Investment
(Lakhs Rs.)
MNRE
Subsidy
(Lakhs
Rs.)
User
Contribution
(Lakhs Rs.)
Energy
Saved
per year
(MU)
Emission
Reduction
(Tonnes)
Installation of solar water heaters (200
LPD)
Sqmt 22512 1969.80 590.94 1378.86 1.01 820.56
Use of solar home lighting systems (74Wp) Nos 402 64.32 32.16 32.16 0.63 150.51
Use of Solar home inverter(250 Wp) KWp 1407 1688.40 506.52 1181.88 1.98 1600.10
Use of PV for replacing DG sets KWp 670 804.00 241.20 562.80 0.94 761.95
Total 4526.52 1370.82 3155.70 4.56 3333.12
Renewable Energy -Commercial
Rooftop Solar PV in Buildings of school and
Community hall
KW 1735.80 1562.22 468.67 1093.55 2.85 2309.35
Rooftop Solar in Hotels, Hospitals and police
stations
KW 2876.87 2589.19 776.76 1812.43 4.04 3271.70
Rooftop Solar in Banks KW 720.86 648.77 194.63 454.14 1.01 819.79
SWH for Commercial Sector Sqmt 1404.00 70.20 15.44 54.76 0.15 124.53
Solar PV Power Plant MW 1.00 1500.00 0.00 1500.00 1.40 1137.24
Energy From Municipal Solid Waste MW 2.00 1000.00 300.00 700.00 11.83 9579.06

Solar City Master Plan PANAJI
95
Total 7370.38 1755.50 5614.88 21.286 17241.66
Renewable Energy Municipal
Installation of 5 MW Solar PV Plant MW 5.00 3500.00 0.00 3500.00 7.50 6525.00
Rooftop Solar PV in Building KW 1211.40 1090.26 327.08 763.18 1.70 1377.65
Rooftop Solar PV in Markets KW 400.50 360.45 108.14 252.32 0.56 455.46
Replacement of Conventional Street Lights
with Solar Street Lights
Nos 800.00 160.00 48.00 112.00 0.08 67.32
Solar Traffic Lights Nos 50.00 12.50 3.75 8.75 0.01 8.42
Sewerage treatment plant Kw 150.63 50.00 15.00 35.00 0.91 737.91
Demonstration Projects KW 723.00 1012.20 303.66 708.54 1.08 878.45
RE systems for Advertisement Hoardings Nos 200.00 200.00 60.00 140.00 0.08 68.23
Total 6385.41 865.62 5519.79 11.94 10118.44
Renewable Energy Strategy - Industrial
SWH installation in Industrial sector of New
Kolkata Town City
Sqmt 1600.00 70.00 21.00 49.00 0.64 518.40
Roof Top Solar PV System in High Rise
Residential, corporate institutional and IT
sector
MWp 2.36 2126.25 637.88 1488.38 3.32 2686.73
Total 2196.25 658.88 1537.38 3.96 3205.13

Solar City Master Plan PANAJI
96
Annexure 3- Summary of EE Strategies
Energy Efficiency Strategy - Residential Target Unit Target
Capacity
Investment
(Lakhs Rs.)
Energy
Saved per
year (MU)
Emission
Reduction
(Tonnes)
Replacement of CFL with LED nos 40200.00 29.35 1.17 950.81
Replacement of conventional ceiling fan with Energy Efficient
ceiling fans
nos 24120.00 361.80 1.41 1140.97
Replacement of conventional air conditioners with EE star rated
ACs
nos 2412.00 675.36 0.63 512.85
Total 1066.51 3.22 2604.63
Energy Efficiency Strategy - Commercial
Replacement of CFL with LED nos 95790 62.93 2.10 1699.22
Replacement of conventional ceiling fan with Energy Efficient
ceiling fans
nos 45412 681.17 2.65 2148.15
Replacement of conventional air conditioners with EE star rated
ACs
nos 3585 1003.83 0.94 762.29
Replacement of T12/T8 tube light by T5 tube light nos 95790 479 5 3738
Total 2226.89 10.31 8347.93
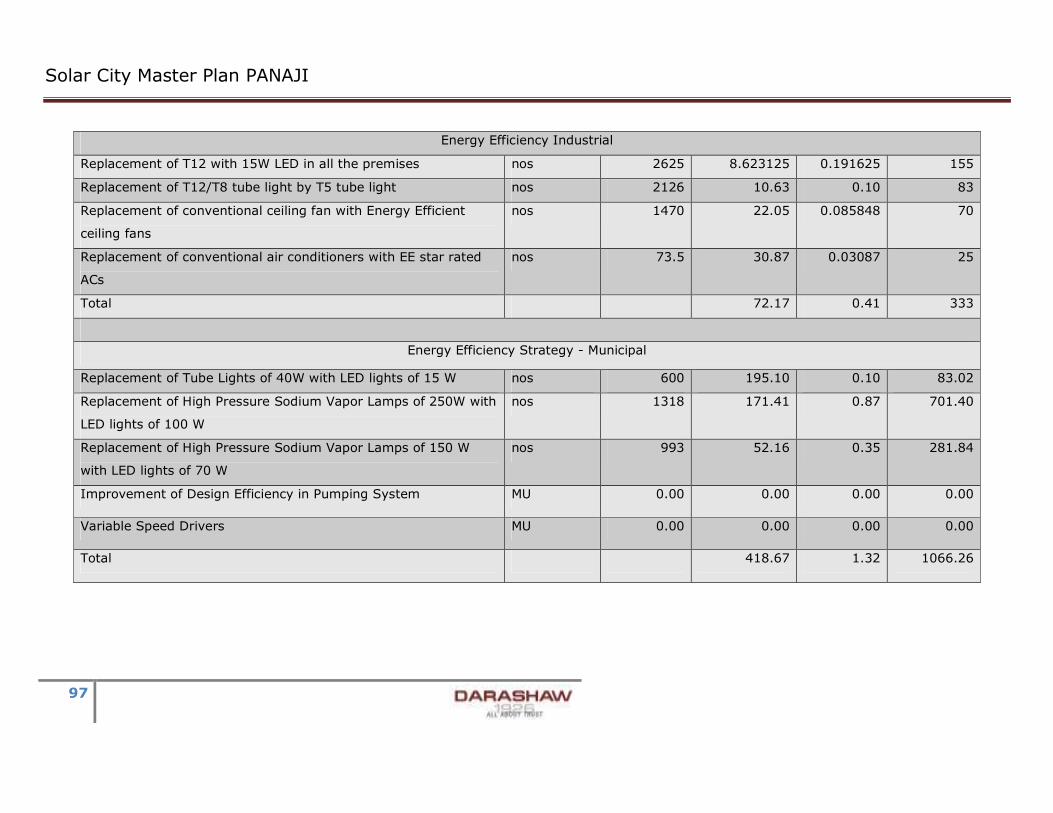
Solar City Master Plan PANAJI
97
Energy Efficiency Industrial
Replacement of T12 with 15W LED in all the premises nos 2625 8.623125 0.191625 155
Replacement of T12/T8 tube light by T5 tube light nos 2126 10.63 0.10 83
Replacement of conventional ceiling fan with Energy Efficient
ceiling fans
nos 1470 22.05 0.085848 70
Replacement of conventional air conditioners with EE star rated
ACs
nos 73.5 30.87 0.03087 25
Total 72.17 0.41 333
Energy Efficiency Strategy - Municipal
Replacement of Tube Lights of 40W with LED lights of 15 W nos 600 195.10 0.10 83.02
Replacement of High Pressure Sodium Vapor Lamps of 250W with
LED lights of 100 W
nos 1318 171.41 0.87 701.40
Replacement of High Pressure Sodium Vapor Lamps of 150 W
with LED lights of 70 W
nos 993 52.16 0.35 281.84
Improvement of Design Efficiency in Pumping System MU 0.00 0.00 0.00 0.00
Variable Speed Drivers MU 0.00 0.00 0.00 0.00
Total 418.67 1.32 1066.26

Solar City Master Plan PANAJI
98
Annexure 4- Year wise Action Plan for Solar City Project
Activities
Unit for capacity targeted
1st Year
10%
Target
2nd Year
15%
Target
3rd Year
20%
Target
4th Year
25%
Target
5th Year
30%
Target
Aggregrate in 5 years 44.966
Capacity Targeted
Savings (MU)
Emission
Reduction (Tonnes)
Capacity
Targeted
Savings (MU)
Emission
Reduction (Tonnes)
Capacity
Targeted
Savings (MU)
Emission
Reduction (Tonnes)
Capacity
Targeted
Savings (MU)
Emission
Reduction (Tonnes)
Capacity
Targeted
Savings (MU)
Emission
Reduction (Tonnes)
Capacity
Targeted
Savings (MU)
Emission
Reduction
(Tonnes)
% of targe
t
Renewable Energy Strategies
Renewable Energy Strategy-Residential
Installation of solar water heaters (200 LPD)
Sqmt 2251 0.101
82 3377 0.15 123.08
4502 0.20 164.11
5628 0.25 205.14
6754 0.30 246.17
22512 1.013
820.56 2.25%
Use of solar home lighting systems (74Wp)
Nos 40 0.063
15.05 60 0.09 22.58 80 0.13 30.10 101 0.16 37.63 121 0.19 45.15 402 0.630
150.51 1.40%
Use of Solar home inverter(250 Wp)
KWp 141 0.198
160.01
211 0.30 240.01
281 0.40 320.02
352 0.49 400.02
422 0.59 480.03
1407 1.975
1600.10
4.39%
Use of PV for replacing DG sets
KWp 67 0.094
76.20 101 0.14 114.29
134 0.19 152.39
168 0.24 190.49
201 0.28 228.59
670 0.941
761.95 2.09%
Total for Residential Sector
0.46 333.3
1 0.68
499.97
0.91 666.6
2 1.14
833.28
1.37 999.9
4
4.560
3333.12
10.14%
RE Strategy for Commercial Sector

Solar City Master Plan PANAJI
99
Rooftop Solar PV in Buildings of school and Community hall
KW 173.58
0.285
230.935
260.37
0.428
346.403
347.16
0.57 461.87
433.95
0.71 577.34
520.74
0.86 692.81
1735.80
2.851
2309.35
6.34%
Rooftop Solar in Hotels, Hospitals and police stations
KW 287.69
0.404
327.170
431.53
0.606
490.754
575.37
0.81 654.34
719.22
1.01 817.92
863.06
1.21 981.51
2876.87
4.039
3271.70
8.98%
Rooftop Solar in Banks
KW 72.09 0.101
81.979
108.13
0.152
122.968
144.17
0.20 163.96
180.21
0.25 204.95
216.26
0.30 245.94
720.86 1.012
819.79 2.25%
SWH for Commercial Sector
Sqmt 140.40
0.015
12.453
210.60
0.023
18.679
280.80
0.03 24.91 351.00
0.04 31.13 421.20
0.05 37.36 1404.0
0 0.154
124.53 0.34%
Solar PV Power Plant
MW 0.10 0.140
113.724
0.15 0.211
170.586
0.20 0.28 227.45
0.25 0.35 284.31
0.30 0.42 341.17
1.00 1.404
1137.24
3.12%
Energy From Municipal Solid Waste
MW 0.20 1.183
957.906
0.30 1.774
1436.859
0.40 2.37 1915.81
0.50 2.96 2394.77
0.60 3.55 2873.72
2.00 11.826
9579.06
26.30%
Total for Commercial Sector
2.129
1724.166
3.193
2586.250
4.257
3448.333
5.322
4310.416
6.386
5172.499
21.286
17241.663
47.34%
RE Strategy for Municipal Sector
Installation of 5 MW Solar PV Plant
MW 1.000 1.500
1305.000
1.000 1.500
1426.800
1.000 1.500
1426.800
1.000 1.500
1426.800
1.000 1.500
1426.800
5.000 7.500
7012.200
16.679%
Rooftop Solar PV in Building
KW 121.140
0.170
137.765
181.710
0.255
206.648
242.280
0.340
275.531
302.850
0.425
344.413
363.420
0.510
413.296
1211.400
1.701
1377.653
3.782%
Rooftop Solar PV in Markets
KW 40.050
0.056
45.546
60.075
0.084
68.320
80.100
0.112
91.093
100.125
0.141
113.866
120.150
0.169
136.639
400.500
0.562
455.465
1.251%
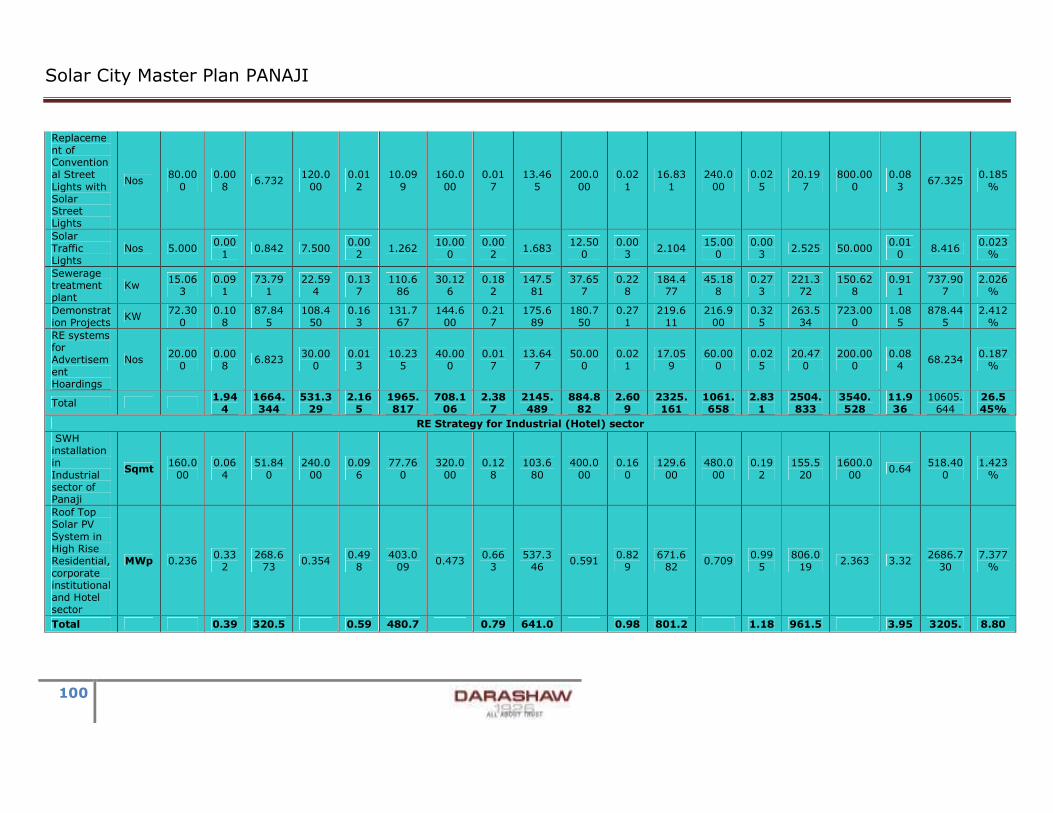
Solar City Master Plan PANAJI
100
Replacement of Conventional Street Lights with Solar Street Lights
Nos 80.000
0.008
6.732 120.000
0.012
10.099
160.000
0.017
13.465
200.000
0.021
16.831
240.000
0.025
20.197
800.000
0.083
67.325 0.185%
Solar Traffic Lights
Nos 5.000 0.001
0.842 7.500 0.002
1.262 10.000
0.002
1.683 12.500
0.003
2.104 15.000
0.003
2.525 50.000 0.010
8.416 0.023%
Sewerage treatment plant
Kw 15.063
0.091
73.791
22.594
0.137
110.686
30.126
0.182
147.581
37.657
0.228
184.477
45.188
0.273
221.372
150.628
0.911
737.907
2.026%
Demonstration Projects
KW 72.300
0.108
87.845
108.450
0.163
131.767
144.600
0.217
175.689
180.750
0.271
219.611
216.900
0.325
263.534
723.000
1.085
878.445
2.412%
RE systems for Advertisement Hoardings
Nos 20.000
0.008
6.823 30.000
0.013
10.235
40.000
0.017
13.647
50.000
0.021
17.059
60.000
0.025
20.470
200.000
0.084
68.234 0.187%
Total 1.944
1664.344
531.329
2.165
1965.817
708.106
2.387
2145.489
884.882
2.609
2325.161
1061.658
2.831
2504.833
3540.528
11.936
10605.644
26.545%
RE Strategy for Industrial (Hotel) sector
SWH installation in Industrial sector of Panaji
Sqmt 160.000
0.064
51.840
240.000
0.096
77.760
320.000
0.128
103.680
400.000
0.160
129.600
480.000
0.192
155.520
1600.000
0.64 518.40
0 1.423%
Roof Top Solar PV System in High Rise Residential, corporate institutional and Hotel sector
MWp 0.236 0.332
268.673
0.354 0.498
403.009
0.473 0.663
537.346
0.591 0.829
671.682
0.709 0.995
806.019
2.363 3.32 2686.730
7.377%
Total 0.39 320.5 0.59 480.7 0.79 641.0 0.98 801.2 1.18 961.5 3.95 3205. 8.80

Solar City Master Plan PANAJI
101
6 13 4 69 1 26 9 82 7 39 7 130 0%
Energy Efficiency Strategies
EE Strategy for Residential Sector
Replacement of CFL with LED
nos 4020 0.117
95.08 6030 0.176
142.62
8040 0.235
190.16
10050 0.293
237.70
12060 0.352
285.24
40200 1.174
950.81 2.61%
Replacement of conventional ceiling fan with Energy Efficient ceiling fans
nos 2412 0.141
114.10
3618 0.211
171.15
4824 0.282
228.19
6030 0.352
285.24
7236 0.423
342.29
24120 1.409
1140.97
3.13%
Replacement of conventional airconditioners with EE star rated ACs
nos 241 0.063
51.29 362 0.095
76.93 482 0.127
102.57
603 0.158
128.21
724 0.190
153.86
2412 0.633
512.85 1.41%
Total for Residential Sector
0.32 260.4
6 0.48
390.70
0.64 520.9
3 0.80
651.16
0.96 781.3
9
3.216
2604.63
7.15%
EE Strategy for Commercial Sector
Replacement of CFL with LED
nos 9579 0.210
169.92
14368 0.315
254.88
19158 0.420
339.84
23947 0.524
424.80
28737 0.629
509.77
95790 2.098
1699.22
4.67%
Replacement of conventional ceiling
nos 4541 0.265
214.81
6812 0.398
322.22
9082 0.530
429.63
11353 0.663
537.04
13623 0.796
644.44
45412 2.652
2148.15
5.90%

Solar City Master Plan PANAJI
102
fan with Energy Efficient ceiling fans
Replacement of conventional air conditioners with EE star rated ACs
nos 359 0.094
76.23 538 0.141
114.34
717 0.188
152.46
896 0.235
190.57
1076 0.282
228.69
3585 0.941
762.29 2.09%
Replacement of T12/T8 tube light by T5 tube light
nos 9579 0.462
373.83
14368 0.692
560.74
19158 0.923
747.66
23947 1.154
934.57
28737 1.385
1121.48
95790 4.615
3738.28
10.26%
Energy Efficiency in Green Buildings
Nos 0 0.000
0.00 0 0.000
0.00 0 0.000
0.00 0 0.000
0.00 0 0.000
0.00 0 0.000
0.00 0.00%
Total for Commercial Sector
1.03 834.7
9 36086.47
1.55 1252.19
48115.30
2.06 1669.59
60144.12
2.58 2086.98
72172.95
3.09 2504.38
240576.49
10.31
8347.93
22.92%
EE Strategy for Industrial (Hotel)
Replacement of T12 with 15W LED in all the premises
263 0.0192
16 394 0.0287
23 525 0.0383
31 656 0.0479
39 788 0.0575
47 2625 0.192
155.22 0.43%
Replacement of T12/T8 tube light by T5 tube light
213 0.0102
8 319 0.0154
12 425 0.0205
17 532 0.0256
21 638 0.0307
25 2126 0.102
82.98 0.2278%

Solar City Master Plan PANAJI
103
Replacement of conventional ceiling fan with Energy Efficient ceiling fans
147 0.0086
7 221 0.0129
10 294 0.0172
14 368 0.0215
17 441 0.0258
21 1470 0.086
69.54 0.1909%
Replacement of conventional air conditioners with EE star rated ACs
7 0.0031
2.50 11 0.0046
3.75 15 0.0062
5.00 18 0.0077
6.25 22 0.0093
7.50 74 0.031
25.00 0.0687%
Total 0.04 33.27 944.2
1 0.06 49.91
1258.95
0.08 66.55 1573.69
0.10 83.18 1888.43
0.12 99.82 6294.75
0.41 332.7
4 0.91%
EE strategy for Municipal Sector
Replacement of Tube Lights of 40W with LED lights of 15 W
nos 60 0.01 8.30 90 0.02 12.45 120 0.02 120.00
150 0.03 150.00
180 0.03 24.91 600 0.102
316 0.23%
Replacement of High Pressure Sodium Vapor Lamps of 250W with LED lights of 100 W
nos 132 0.09 70.14 198 0.13 105.21
264 0.17 140.28
330 0.22 175.35
395 0.26 210.42
1318 0.866
701 1.93%
Replacement of High Pressure Sodium Vapor
nos 99 0.03 28.18 149 0.05 42.28 199 0.07 56.37 248 0.09 70.46 298 0.10 84.55 993 0.348
282 0.77%

Solar City Master Plan PANAJI
104
Lamps of 150 W with LED lights of 70 W
Improvement of Design Efficiency in Pumping System
MU 0.00 0.00 0.00 0.00 0.00 0.00 0.00 0.00 0.00 0.00 0.00 0.00 0.00 0.00 0.00 0.00 0.000
0 0.00%
Variable Speed Drivers
MU 0.00 0.00 0.00 0.00 0.00 0.00 0.00 0.00 0.00 0.00 0.00 0.00 0.00 0.00 0.00 0.00 0.000
0 0.00%
Total 0.13 106.6
3 436.6
5 0.20
159.94
582.20
0.26 316.6
5 727.7
5 0.33
395.81
873.30
0.39 319.8
8 2911.00
1.32 1299 2.93%
56.99
Sum Total
126.74%

Solar City Master Plan PANAJI
105
Annexure 6- Initiative taken by CCP
Annexure 7- List of Solar City members
Annexure 8- List of Stakeholder committee members
Annexure 9- Solar City Approval Letter from MNRE

Darashaw & Co. Pvt. Ltd.6th Floor, Express Building
14th “E’”Road, Near Government
Law College, Churchgate (West)
Mumbai-400020
Tel.: 91 22 4302 2355
Fax: 91 22 4302 2366
E-mail: [email protected]
Website: www.darashaw.com