PALMA-2008-Flying Geese and Wadling Ducks.pdf
47
1 Flying geese and waddling ducks: the different capabilities of East Asia and Latin America to “demand-adapt” and “supply-upgrade” their export productive capacity José Gabriel Palma 1 August 2008 Paper published in M Cimoli, G Dosi and J Stiglitz (eds.), The Political Economy of Capabilities Accumulation: the Past and Future of Policies for Industrial Development, Oxford University Press, 2009. ABSTRACT This paper investigates the implications for growth and welfare gains from specialization of the old controversy about whether there is a difference for developing countries between exporting potato-chips or micro-chips. It concludes that the experiences of Latin America and East Asia since 1980 (i.e., during the period of economic reforms and ‘globalization’) support at least four hypotheses: first, that growth seems to be a “product-specific” phenomenon; second, that the role played in it by exports relates at least as much to what a country exports as to how much it exports; third, that the capacity to build a flexible export productive capacity seems to be an “institution-specific” phenomenon; and fourth, that regional dynamics have played a significant role in growth, export diversification and gains from specialization, in part due to the specific type of leadership that Japan has exerted in East Asia (as opposed to that shown by the US in the Americas). Faculty of Economics, University of Cambridge, Cambridge CB3 9DD, United Kingdom e-mail: [email protected] 1 I would like to thank Alice Amsden, Stephanie Blankenburg, Mario Cimoli, Mushtaq Khan, José Luis Fiori, Daniel Hahn, Michael Hobday, Richard Kozul- Wright, Carlos Lopes, Carlota Perez, Annalisa Primi, Bob Sutcliffe, Fiona Tregenna and especially Giovanni Dosi and Julie McKay for helpful observations. Also, participants at seminars in Bangkok, Bilbao, New Delhi, Kuala Lumpur, Rio de Janeiro, Santiago and Sydney made constructive comments on this paper and on two previous drafts (Palma, 1998 and 2006). The usual caveats apply.
-
Upload
igor-castellano -
Category
Documents
-
view
217 -
download
3
Transcript of PALMA-2008-Flying Geese and Wadling Ducks.pdf
1
Flying geese and waddling ducks:
the different capabilities of East Asia and Latin America to “demand-adapt” and
“supply-upgrade” their export productive capacity
José Gabriel Palma1
August 2008
Paper published in M Cimoli, G Dosi and J Stiglitz (eds.), The Political Economy of Capabilities Accumulation: the Past and Future of Policies
for Industrial Development, Oxford University Press, 2009.
ABSTRACT
This paper investigates the implications for growth and welfare gains from specialization of the old controversy about whether there is a difference for developing countries between exporting potato-chips or micro-chips. It concludes that the experiences of Latin America and East Asia since 1980 (i.e., during the period of economic reforms and ‘globalization’) support at least four hypotheses: first, that growth seems to be a “product-specific” phenomenon; second, that the role played in it by exports relates at least as much to what a country exports as to how much it exports; third, that the capacity to build a flexible export productive capacity seems to be an “institution-specific” phenomenon; and fourth, that regional dynamics have played a significant role in growth, export diversification and gains from specialization, in part due to the specific type of leadership that Japan has exerted in East Asia (as opposed to that shown by the US in the Americas).
Faculty of Economics, University of Cambridge, Cambridge CB3 9DD, United Kingdom e-mail: [email protected]
1 I would like to thank Alice Amsden, Stephanie Blankenburg, Mario Cimoli, Mushtaq Khan, José Luis Fiori, Daniel Hahn, Michael Hobday, Richard Kozul-Wright, Carlos Lopes, Carlota Perez, Annalisa Primi, Bob Sutcliffe, Fiona Tregenna and especially Giovanni Dosi and Julie McKay for helpful observations. Also, participants at seminars in Bangkok, Bilbao, New Delhi, Kuala Lumpur, Rio de Janeiro, Santiago and Sydney made constructive comments on this paper and on two previous drafts (Palma, 1998 and 2006). The usual caveats apply.
2
“The world of foreign trade is one of change. It makes a great difference to the trade of different countries, and to the impact of trade on them, whether they are capable of changing with the
world. [...] Capacity to transform is capacity to react to change, originating at home or abroad, by adapting the structure of foreign trade to the
new situation in an economic fashion.”
-- C. Kindleberger
“[...] the obsession with competitiveness is not only wrong but dangerous, skewing domestic
policies and threatening the international economic system.”
-- P. Krugman
Introduction
During the 1992 US presidential campaign President Bush's head economic
adviser was questioned about the decline in the technological content of
US’s exports; he replied that he saw no problem in it as there was no
difference between exporting micro-chips or potato-chips. This paper
investigates whether this is really the case, especially for developing
countries (DCs). Are there major economic consequences for the growth
path of DCs (especially for its pace, nature and sustainability) from an
export orientation based on one or the other type of product? In
particular, what are the consequences in terms of the long-term
productivity growth potential of the export sector itself, for the capacity of
exports to induce productivity growth in the rest of the economy, for
institution building, and for the welfare gains from specialization (e.g.,
issues related to the terms of trade)? Do DCs have a choice in this
matter? And are regional dynamics, particularly the role of the regional
power, an important component of the likelihood of DCs exporting one or
the other type of product?
The general issue of “potato-chips versus micro-chips” will be
analyzed through the examination of the diverse export and growth
performances of Latin America (LA) and East Asia (EA) since 1960. As
mentioned in the abstract, in this chapter I argue that their experiences
support at least four hypotheses. First, that growth is a “product specific”
phenomenon. Second, that the role played in it by exports relates at least
3
as much to what a country exports as to how much it exports – i.e., that
the capacity of exports to generate and sustain (trade-induced) GDP
growth is related not only to the volume but also to the composition of
exports. Third, that the capacity of an economy continuously to shift
resources towards more “growth-enhancing” export activities is related to
the effectiveness of the state to implement appropriate trade and industrial
policies; and that this effectiveness is associated not just with the ability of
the state to create rents, but (much more importantly) to its capacity to
compel the corporate sector to invest them in productive capacity
diversification – i.e., continuously to shift resources towards products that
would help to supply-upgrade along the so-called “learning curve”, and
demand-adapt a country’s export productive capacity to an ever-changing
international demand. And fourth, that regional dynamics have played a
significant role in growth, export diversification and gains from
specialization, especially due to the specific type of leadership that Japan
has exerted in East Asia (as opposed to that shown by the US in the
Americas).
Economic growth: regional diversities
One of the main stylized facts of the world economy since the beginning of
‘globalization’ and economic reforms is the different economic
performances of LA and EA. Figure 1 highlights this remarkable
phenomenon.
4
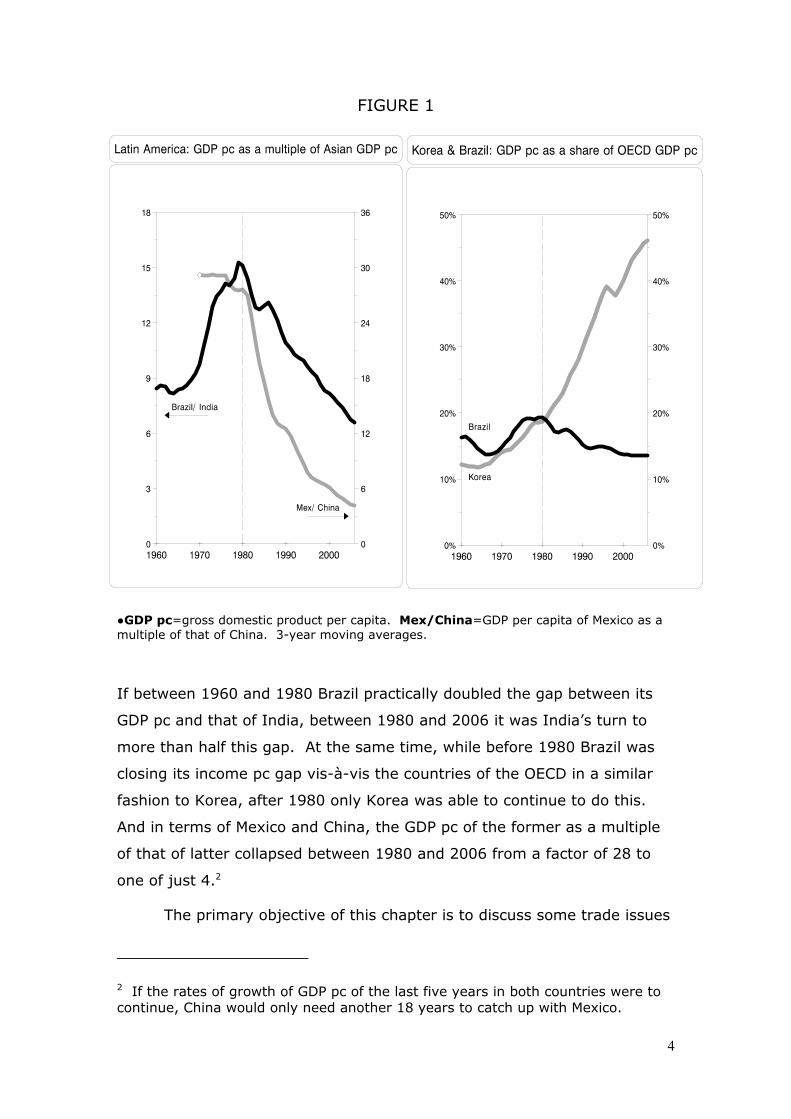
FIGURE 1
●GDP pc=gross domestic product per capita. Mex/China=GDP per capita of Mexico as a multiple of that of China. 3-year moving averages.
If between 1960 and 1980 Brazil practically doubled the gap between its
GDP pc and that of India, between 1980 and 2006 it was India’s turn to
more than half this gap. At the same time, while before 1980 Brazil was
closing its income pc gap vis-à-vis the countries of the OECD in a similar
fashion to Korea, after 1980 only Korea was able to continue to do this.
And in terms of Mexico and China, the GDP pc of the former as a multiple
of that of latter collapsed between 1980 and 2006 from a factor of 28 to
one of just 4.2
The primary objective of this chapter is to discuss some trade issues
2 If the rates of growth of GDP pc of the last five years in both countries were to continue, China would only need another 18 years to catch up with Mexico.
5
related to these remarkable asymmetries and their regional dimensions.
East Asian versus Latin American development strategies
Differences between LA’s and EA’s trade and industrial policies have been
well documented. The primary benefit of these policies for EA (and now
for India and Vietnam) was that EA was able to increase simultaneously its
shares of exports and of manufactures in GDP. By contrast, LA, which
throughout the first half of the 20th century had been the region with the
largest share of exports in GDP, between 1950 and the first oil crisis of the
1970s experienced a near-halving of this share. This decline followed both
a weakened demand for primary commodities in OECD markets since the
Korean War and trade and industrial policies characterized by strong anti-
export bias. As a result, and despite a strong growth performance in some
countries until 1980, particularly in Brazil and Mexico, the rapid increase in
the share of manufactures in GDP resulting from import-substituting
industrialization (ISI) came at the expense of exports.3
Although LA’s growth strategy during ISI had left the region
vulnerable to external shocks, especially due to continuous current account
deficits and growing foreign debt, nothing had prepared the region for the
one unnecessarily created by Paul Volker following his appointment to the
Fed in 1979. In fact, the consequences for LA of Volker’s “macho-
monetarism” were of a magnitude not felt in the region since 1929.4 And
as had happened in the 1930s, a massive and long-lasting external shock
(that found LA in an extremely vulnerable position) not only brought about
the need for a sudden and very painful internal and external
macroeconomic adjustment, but also laid the foundations for a radical and
widespread change in the economic paradigm of the region. In this case, it
3 For a detailed discussion of these issues, see, for example, Ffrench-Davis, Muñoz and Palma (1994) and Palma (2004). For an overview of Latin American economic development throughout the 20th century, see Ocampo (2004). 4 For example, the combination of the Fed trebling nominal rates and recession in the North led to a 33 percentage-point increase in the real rate of interest paid by LA for its foreign debt (i.e., when LIBOR is deflated by LA’s non-oil export-prices, this rate increased from minus 11.2% to 22.1%; see Palma, 2004a). See also Diaz-Alejandro (1984), Marcel and Palma (1988) and Ocampo (2004).
6
was characterized by an extreme move towards trade and financial
liberalization, wholesale privatization and market deregulation, along the
lines experimented with in Chile since 1973. Therefore, the key element to
understanding these reforms, particularly the purely ideological and
remarkably rigid and unimaginative way in which they were implemented
throughout the region, is that they were mostly carried out as a result of
perceived economic weaknesses – i.e., an attitude of ‘throwing in the
towel’ vis-à-vis the previous growth strategy of state-led ISI. In fact, the
economic discourse ended up as a compass whose 'magnetic north' was
simply the mechanical reversal of as many aspects as possible of the
previous development strategy.5 The mere idea that alternatives could
exist met with a mixture of amusement and contempt.6 This helps to
explain the remarkable differences with which the reforms were
implemented in LA, as distinct from EA.
As I have argued elsewhere (Palma, 2004a), it is not that EA did not
implement its economic reforms partly out of necessity (and also because
of mounting external political pressure from the US to do so); but its
economic weaknesses were very different in nature and intensity. Since
the 1960s, EA integrated into the world economy in a different way to LA.
Instead of accepting their traditional, path-dependent comparative
advantages (i.e., based on traditional resource endowment, subject to
decreasing returns), East Asian countries acquired a more flexible and
growth-enhancing set of comparative advantages mainly by following a
‘flying-geese’ pattern of production and upgrading.7 This was achieved
through increased export penetration of OECD markets for manufactured
goods, within a process of the regionalization of production led by Japan
(see especially Figure 6 below). Their extraordinary success was based on
5 The new economic discourse went as far as transforming almost anything previously considered as virtue into vice, and vice-versa. This attitude was best summarized by Gustavo Franco, President of the Central Bank during the years of economic reform (leading up to the 1999 financial crisis): “[Our real task] is to undo forty years of stupidity (‘besteira’) […].” (Veja 15-11-1996) 6 Franco again: “[In Brazil today] the alternative is to be neo-liberal or neo-idiotic (neo-burros).” 7 See for example, McKay (2002) and Palma (1998).
7
several factors. On the external front, the fast rate of expansion of
international trade in these goods, and OECD (especially US) market
openness were key.8 Internally, it was due to several factors such as the
ability to build a structure of property rights and incentives, an institutional
capability and a political settlement that allowed them to produce globally
competitive manufactures; an ability to upgrade exports continuously
through the ”flying geese” path;9 to their ability to generate the high levels
of investment and saving required for this upgrading; and their achieving
an effective coordination of this investment through different forms of
industrial and trade policies, which succeeded in simultaneously insulating
domestic markets and outwardly orienting tradable production.
However, in the late 1980s and early 1990s, problems emerged for
many East Asian economies. First, in part due to the increased
standardization of inputs to the electronics industry, some of their most
important exports faced rapidly falling prices. In response, the corporate
sectors massively expanded their productive capacity, attempting to turn
falling prices to their advantage via increased market shares.10 An obvious
casualty was profitability; consequently, the composition of the finance for
investment had to move away from profits towards (domestic and foreign)
debt.11 The increasing need for access to finance was one of the key
domestic pressures behind the drive towards financial liberalization.
Another problem was that in the same period, China became a
formidable competitor in many markets crucial to the second-tier East
Asian NICs, affecting profitability and contributing to an increased need for
external finance. At the same time, the second-tier NICs reached a point
where further upgrading of exports to higher value-added products was
8 With the exception of post-NAFTA Mexico, this openness was clearly not extended to LA, and especially not to Brazil. 9 This also led to remarkably positive interaction between increases in productivity and wages, particularly in the first-tier NICs (Newly Industrializing Countries). 10 The price of memory chips (per MB of RAM), for example, fell by about four-fifths in 1996 alone, partly resulting from excess supply due to massive expansion of Taiwanese production. Korea was particularly affected. 11 This was reflected in rising debt/equity ratios, which, particularly in Korea, reached vertiginous heights.
8
becoming increasingly difficult. In particular, it became more and more
complicated to break away from a “sub-contracting” type of
industrialization. So (as India and Vietnam would do later), in a far more
pragmatic way than in LA, East Asian countries increasingly looked towards
trade and financial liberalization, and economic deregulation in general, not
as a way of changing but of strengthening their existing ambitious growth
strategy.
The capacity to ‘demand-adapt’ a country’s export profile to a
rapidly changing OECD import-demand structure.
The rapidly evolving structure of demand in world markets is a well-known
characteristic of international trade, especially since the Second World
War. This phenomenon raises the issue of the need for a more flexible
approach to the concept of comparative advantages within an export-led
growth strategy; i.e., from the point of view of gains from specialization
the key issue becomes how to develop the capability continuously to adapt
one’s export productive capacity to the ever-changing patterns of
international demand.
Since the introduction of the Prebisch-Singer hypothesis in the
1950s,12 and the related research at ECLAC in the 1960s,13 DCs have
fretted over the changing nature of international demand, and in particular
about the declining purchasing power of unprocessed primary commodities
exports resulting from their low income and price elasticities of demand.
Figure 2 shows the remarkable changes in the structure of OECD demand
for imports until 2000 (i.e., before the cyclical upturn for commodities
following 9/11) and its anti-unprocessed-primary-commodity bias (except
for the erratically changing fortunes of oil).
12 See Ocampo and Parra (2004), and Palma (2008a). 13 See Blankenburg, Palma and Tregenna (2008).
9
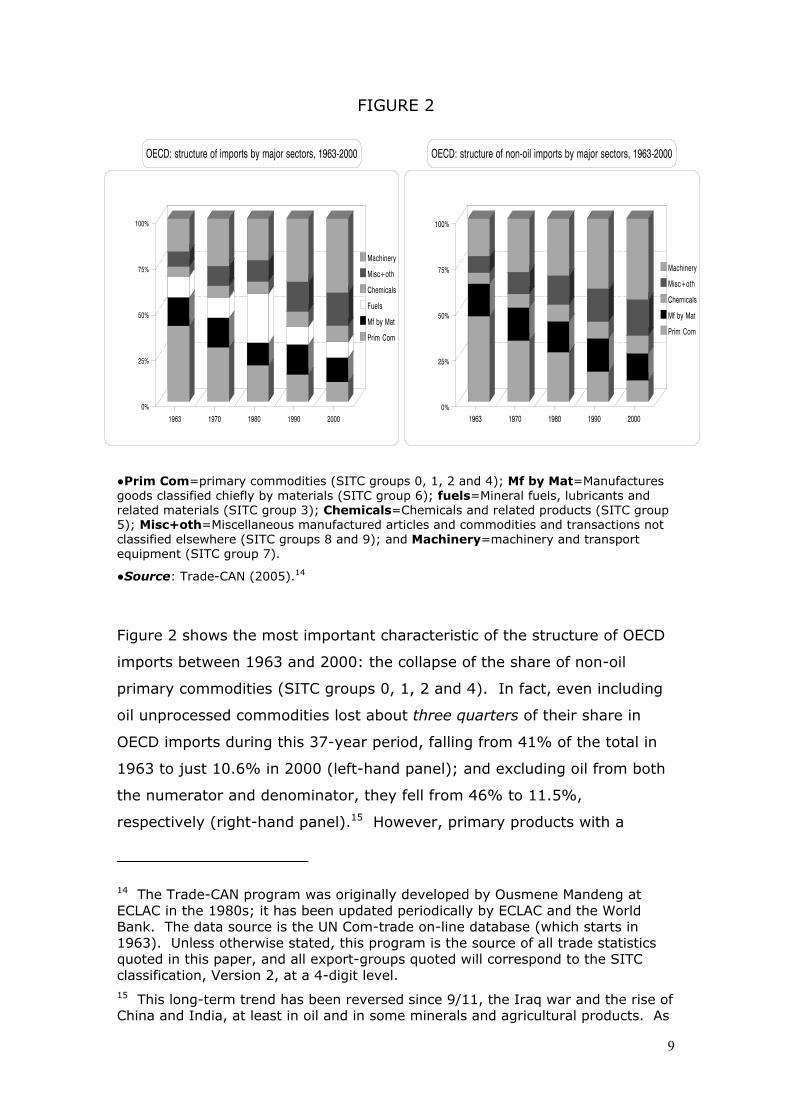
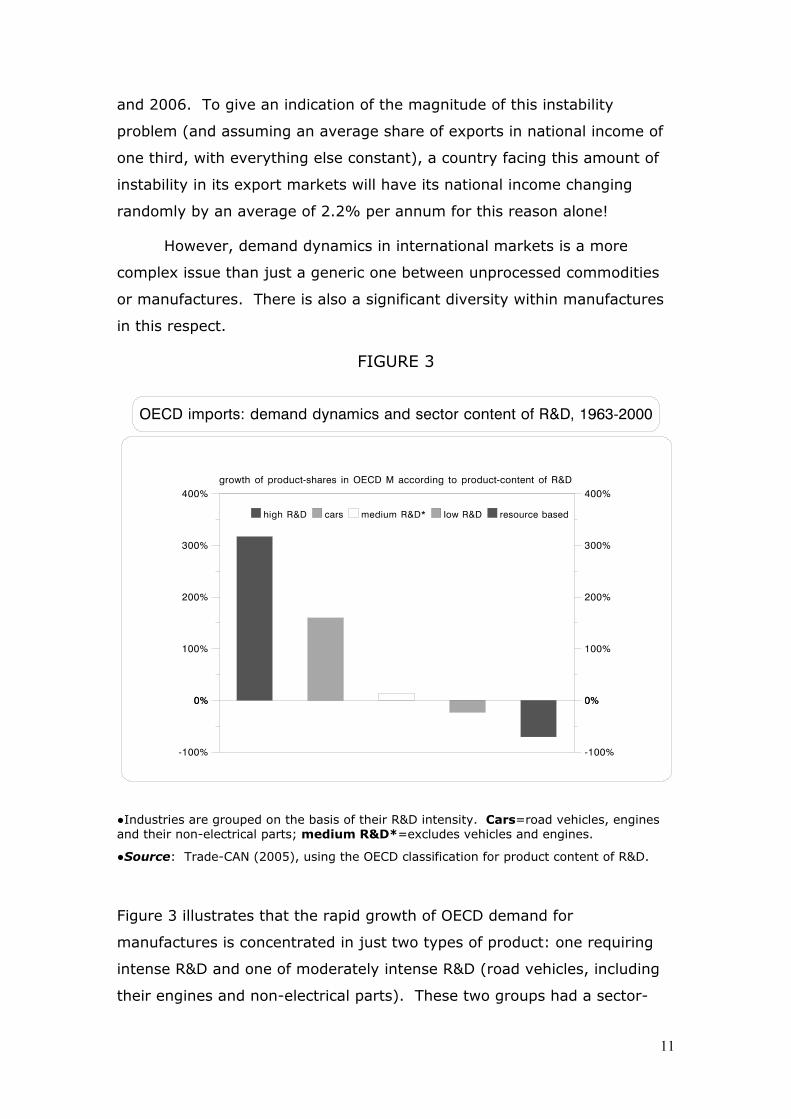
FIGURE 2
●Prim Com=primary commodities (SITC groups 0, 1, 2 and 4); Mf by Mat=Manufactures goods classified chiefly by materials (SITC group 6); fuels=Mineral fuels, lubricants and related materials (SITC group 3); Chemicals=Chemicals and related products (SITC group 5); Misc+oth=Miscellaneous manufactured articles and commodities and transactions not classified elsewhere (SITC groups 8 and 9); and Machinery=machinery and transport equipment (SITC group 7).
●Source: Trade-CAN (2005).14
Figure 2 shows the most important characteristic of the structure of OECD
imports between 1963 and 2000: the collapse of the share of non-oil
primary commodities (SITC groups 0, 1, 2 and 4). In fact, even including
oil unprocessed commodities lost about three quarters of their share in
OECD imports during this 37-year period, falling from 41% of the total in
1963 to just 10.6% in 2000 (left-hand panel); and excluding oil from both
the numerator and denominator, they fell from 46% to 11.5%,
respectively (right-hand panel).15 However, primary products with a
14 The Trade-CAN program was originally developed by Ousmene Mandeng at ECLAC in the 1980s; it has been updated periodically by ECLAC and the World Bank. The data source is the UN Com-trade on-line database (which starts in 1963). Unless otherwise stated, this program is the source of all trade statistics quoted in this paper, and all export-groups quoted will correspond to the SITC classification, Version 2, at a 4-digit level. 15 This long-term trend has been reversed since 9/11, the Iraq war and the rise of China and India, at least in oil and in some minerals and agricultural products. As
10
higher level of manufacturing value added (e.g., SITC group 6) maintained
their share in OECD imports at a relatively stable level (about 15% of the
total). By contrast, imports of machinery and transport equipment (SITC
group 7) more than doubled their OECD import-share during this period
(from 18.4% to 41%).
Quite apart from supply-side issues discussed below (such as the
different long-term productivity growth potentials that exports of
manufactures and unprocessed commodities may have), to insert oneself
into the international division of labour through exporting products
characterized by slow-growing (or even declining) markets does not augur
well for long-term welfare gains from international specialization. In fact,
during the second half of the 20th century, the terms of trade of non-oil
exporting LA fell (cyclically) by half from its Korean War peak, reaching
before the 9/11 crisis a level even below that of the post-1929 crash.
What Latin American policy-makers and their economic advisors seem to
forget these days is that, from the point of view of demand, exports are
just an indirect way of producing imports; and by exporting low-income
and low-price elasticity of demand products, declining terms of trade
makes (the indirect production of) those imports ever more expensive. In
fact, in a Ricardian sense, the region’s increased export efficiency may
sometimes even act as an ‘own-goal’ because although increased
competitiveness may help GDP-growth, if it is done too much at the
expense of the terms of trade, it may seriously harm the purchasing power
of that GDP growth – i.e., in extreme cases output growth may be
outweighed by deteriorating terms of trade.16
As if the problem of the (cyclical) long-term declining level of LA’s
non-fuel terms of trade was not serious enough, the instability of these
terms of trade adds a further uncertainty to the region’s economic life. In
fact, the average (absolute) percentage variation of LA’s non-oil terms of
trade reached 6.7% per annum during the 84-year period between 1920
has so often happened in the past, many policy-makers and analysts have incorporated a bit too quickly into their analysis the assumption that this post-9/11 cyclical recovery is a permanent state of affairs. 16 See Krugman (1994).
11
and 2006. To give an indication of the magnitude of this instability
problem (and assuming an average share of exports in national income of
one third, with everything else constant), a country facing this amount of
instability in its export markets will have its national income changing
randomly by an average of 2.2% per annum for this reason alone!
However, demand dynamics in international markets is a more
complex issue than just a generic one between unprocessed commodities
or manufactures. There is also a significant diversity within manufactures
in this respect.
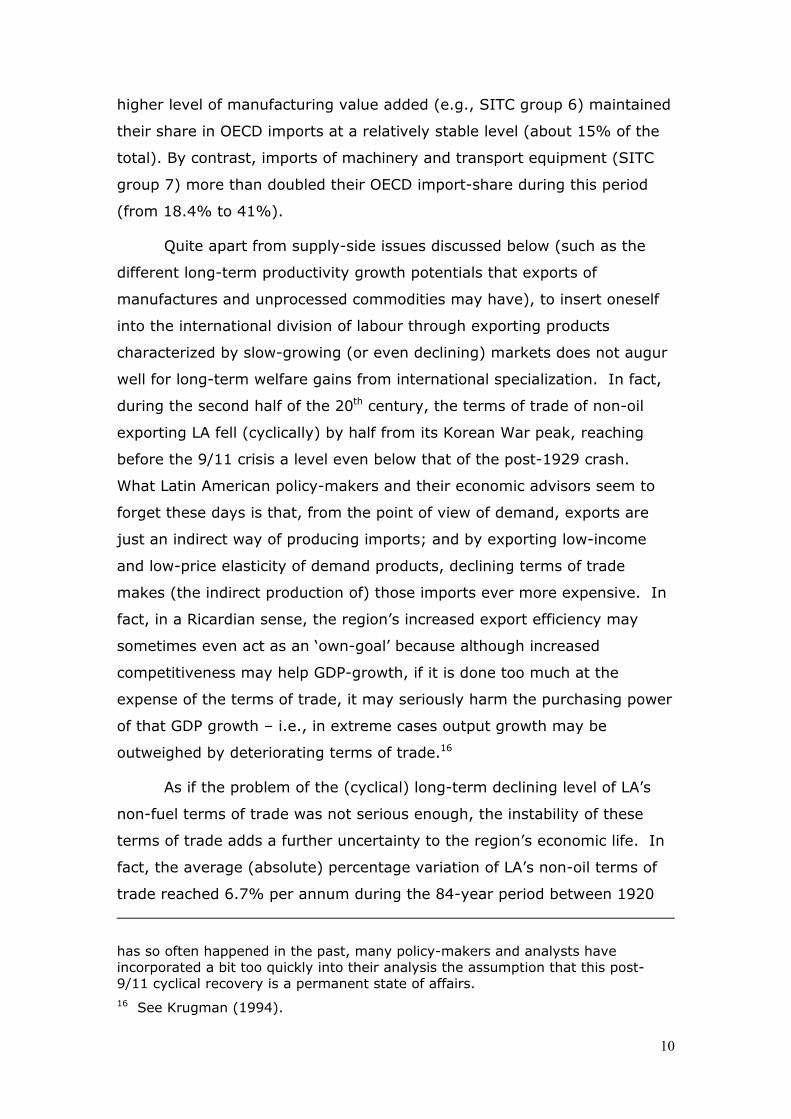
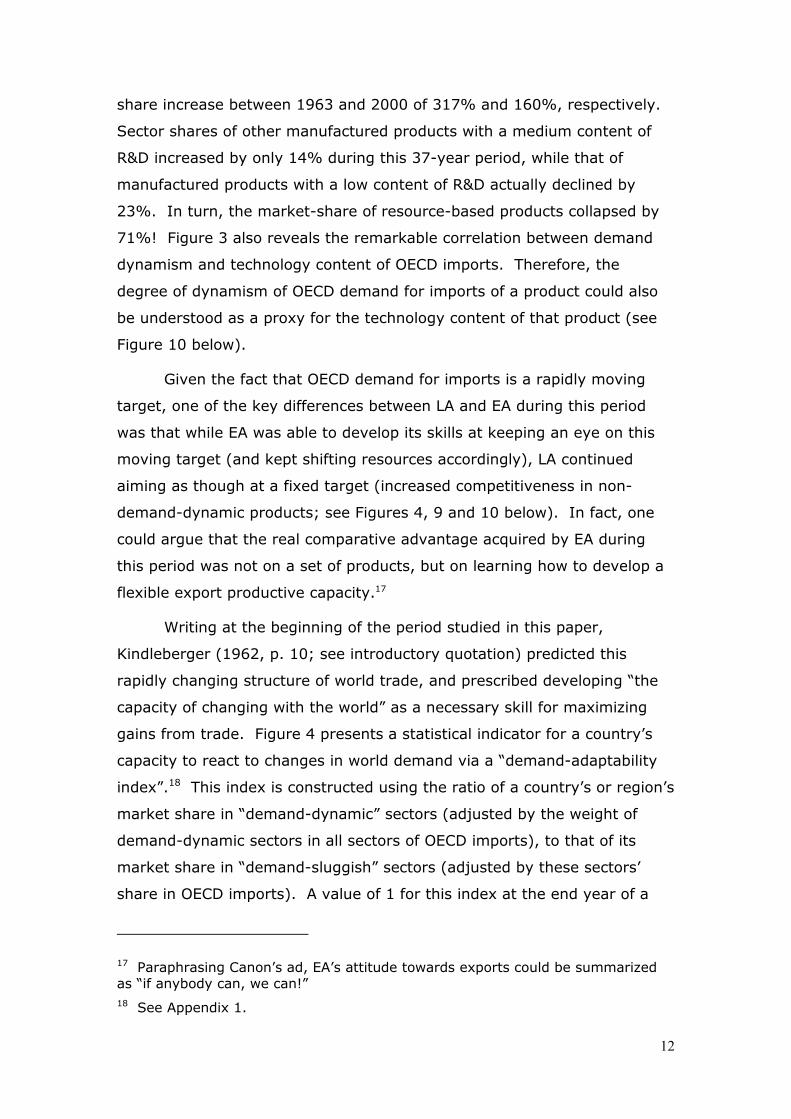
FIGURE 3
●Industries are grouped on the basis of their R&D intensity. Cars=road vehicles, engines and their non-electrical parts; medium R&D*=excludes vehicles and engines.
●Source: Trade-CAN (2005), using the OECD classification for product content of R&D.
Figure 3 illustrates that the rapid growth of OECD demand for
manufactures is concentrated in just two types of product: one requiring
intense R&D and one of moderately intense R&D (road vehicles, including
their engines and non-electrical parts). These two groups had a sector-
12
share increase between 1963 and 2000 of 317% and 160%, respectively.
Sector shares of other manufactured products with a medium content of
R&D increased by only 14% during this 37-year period, while that of
manufactured products with a low content of R&D actually declined by
23%. In turn, the market-share of resource-based products collapsed by
71%! Figure 3 also reveals the remarkable correlation between demand
dynamism and technology content of OECD imports. Therefore, the
degree of dynamism of OECD demand for imports of a product could also
be understood as a proxy for the technology content of that product (see
Figure 10 below).
Given the fact that OECD demand for imports is a rapidly moving
target, one of the key differences between LA and EA during this period
was that while EA was able to develop its skills at keeping an eye on this
moving target (and kept shifting resources accordingly), LA continued
aiming as though at a fixed target (increased competitiveness in non-
demand-dynamic products; see Figures 4, 9 and 10 below). In fact, one
could argue that the real comparative advantage acquired by EA during
this period was not on a set of products, but on learning how to develop a
flexible export productive capacity.17
Writing at the beginning of the period studied in this paper,
Kindleberger (1962, p. 10; see introductory quotation) predicted this
rapidly changing structure of world trade, and prescribed developing “the
capacity of changing with the world” as a necessary skill for maximizing
gains from trade. Figure 4 presents a statistical indicator for a country’s
capacity to react to changes in world demand via a “demand-adaptability
index”.18 This index is constructed using the ratio of a country’s or region’s
market share in “demand-dynamic” sectors (adjusted by the weight of
demand-dynamic sectors in all sectors of OECD imports), to that of its
market share in “demand-sluggish” sectors (adjusted by these sectors’
share in OECD imports). A value of 1 for this index at the end year of a
17 Paraphrasing Canon’s ad, EA’s attitude towards exports could be summarized as “if anybody can, we can!” 18 See Appendix 1.
13
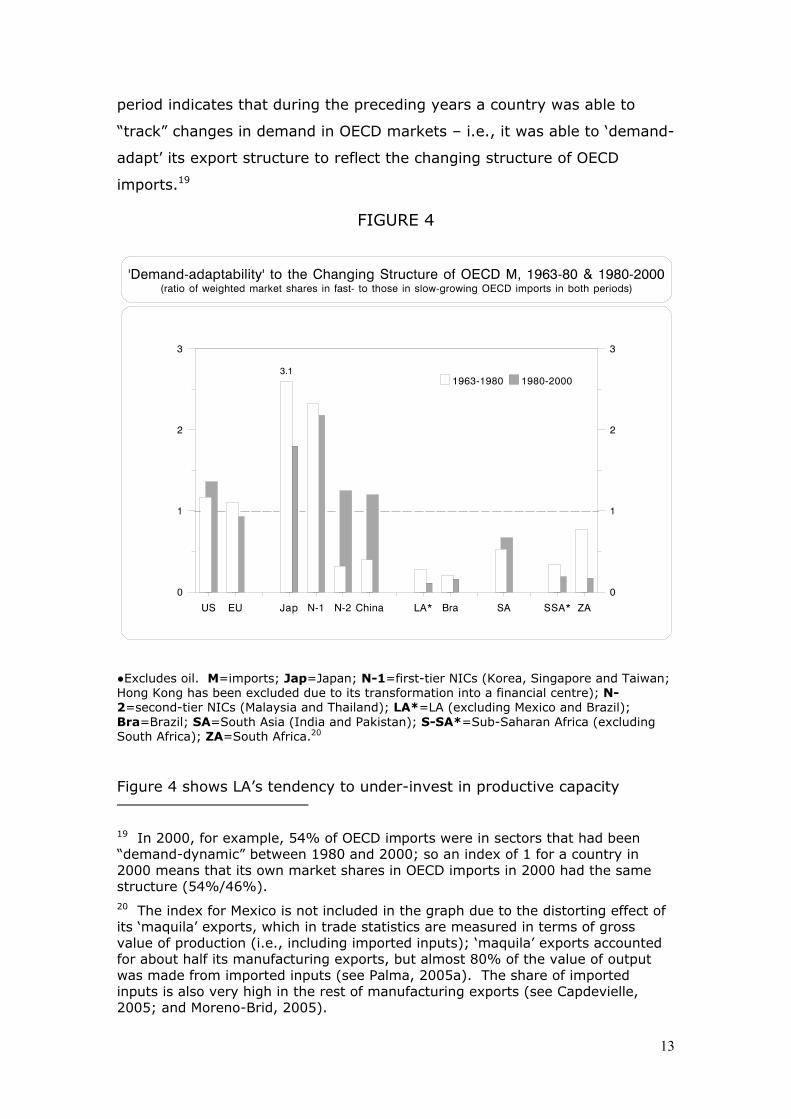
period indicates that during the preceding years a country was able to
“track” changes in demand in OECD markets – i.e., it was able to ‘demand-
adapt’ its export structure to reflect the changing structure of OECD
imports.19
FIGURE 4
●Excludes oil. M=imports; Jap=Japan; N-1=first-tier NICs (Korea, Singapore and Taiwan; Hong Kong has been excluded due to its transformation into a financial centre); N-2=second-tier NICs (Malaysia and Thailand); LA*=LA (excluding Mexico and Brazil); Bra=Brazil; SA=South Asia (India and Pakistan); S-SA*=Sub-Saharan Africa (excluding South Africa); ZA=South Africa.20
Figure 4 shows LA’s tendency to under-invest in productive capacity
19 In 2000, for example, 54% of OECD imports were in sectors that had been “demand-dynamic” between 1980 and 2000; so an index of 1 for a country in 2000 means that its own market shares in OECD imports in 2000 had the same structure (54%/46%). 20 The index for Mexico is not included in the graph due to the distorting effect of its ‘maquila’ exports, which in trade statistics are measured in terms of gross value of production (i.e., including imported inputs); ‘maquila’ exports accounted for about half its manufacturing exports, but almost 80% of the value of output was made from imported inputs (see Palma, 2005a). The share of imported inputs is also very high in the rest of manufacturing exports (see Capdevielle, 2005; and Moreno-Brid, 2005).
14
diversification in its export sector; this could hardly be passively blamed
merely on the fact that the region happens to be rich in natural resources.
Abundance of natural resources could hardly be considered a sufficient
condition for lack of investment efforts in product-diversification and
upgrading. That is, a rich resource endowment could not be blamed in
itself (as the resource-curse hypothesis seeks to do) for a country ending
up being a waddling-duck rather than a dynamic goose.21
One obvious way for primary commodity rich countries to improve
their ‘demand-adaptability’ is to increase the degree of processing of these
commodities, as the Scandinavian and some East Asian countries
(especially Malaysia) have shown. Another is the upgrading of their
domestic productive capacity in terms of the inputs needed for their
commodity production.22 Both paths (up- and down-stream) would lead to
export products that are more “demand dynamic” in world markets. Yet
another path is the targeting of high-value low-volume commodity niches,
taking advantage of the hyper-segmentation of markets that characterizes
the current process of globalization.23 The process of export upgrading
(both up- and downstream) is the subject of the next section of this paper.
The capacity to “supply-upgrade” a country’s export profile
Upgrading resource-based exports
Increasing the degree of manufacturing value added of resource-based
exports allows resource-rich countries to attain an export structure
characterized not just by stronger demand in international markets, but
also by products with higher long-term productivity growth potentials.
Figure 5 shows the contrast between Finland and Malaysia on the one
hand, and Brazil and Chile on the other, in timber-based export products.
21 For a critique of the ‘resource curse’ literature, see DiJohn (2008). For a detailed study of how one particularly successful commodity exporter (Botswana) managed to avoid this supposed ‘curse’, see Tregenna (2006). 22 On the literature on ‘technology-gap’ and evolutionary theory, see Cimoli (1994); Dosi et al. (1988) and (1990); Freeman and Soete (1997); Hobday (2003); and Teece (1996). 23 One example of this would be organic agriculture (see Perez, 2008).
15
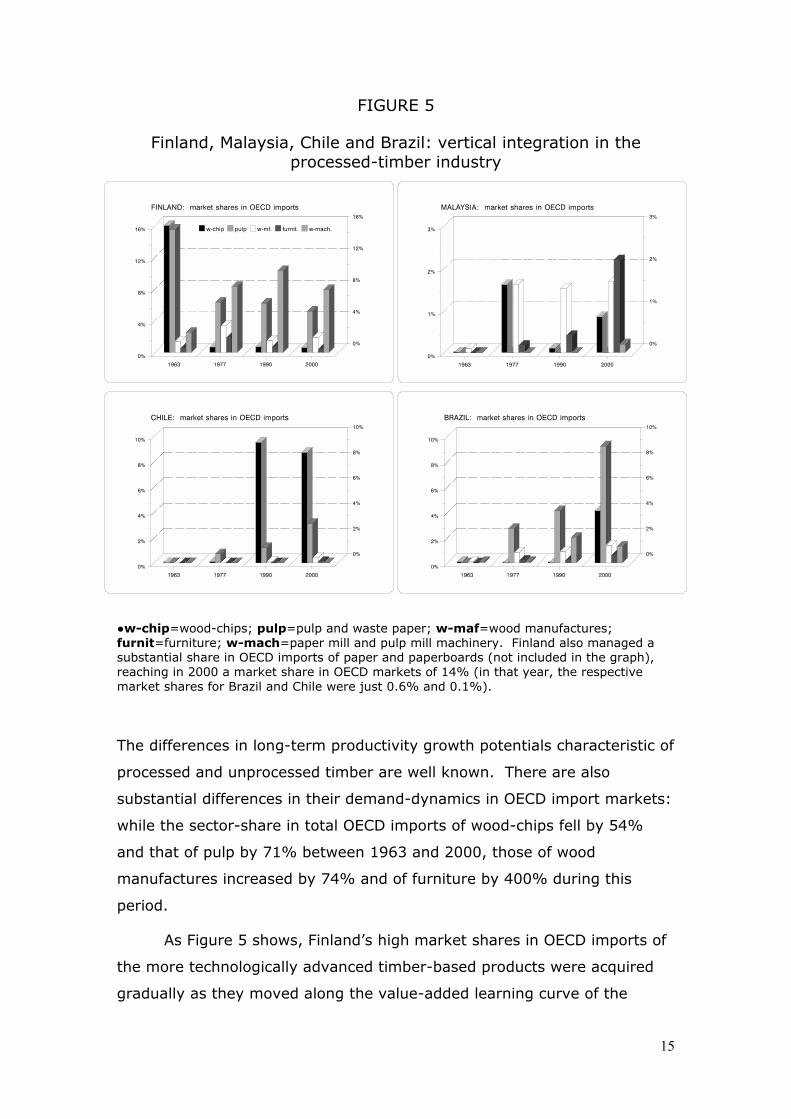
FIGURE 5
Finland, Malaysia, Chile and Brazil: vertical integration in the processed-timber industry
●w-chip=wood-chips; pulp=pulp and waste paper; w-maf=wood manufactures; furnit=furniture; w-mach=paper mill and pulp mill machinery. Finland also managed a substantial share in OECD imports of paper and paperboards (not included in the graph), reaching in 2000 a market share in OECD markets of 14% (in that year, the respective market shares for Brazil and Chile were just 0.6% and 0.1%).
The differences in long-term productivity growth potentials characteristic of
processed and unprocessed timber are well known. There are also
substantial differences in their demand-dynamics in OECD import markets:
while the sector-share in total OECD imports of wood-chips fell by 54%
and that of pulp by 71% between 1963 and 2000, those of wood
manufactures increased by 74% and of furniture by 400% during this
period.
As Figure 5 shows, Finland’s high market shares in OECD imports of
the more technologically advanced timber-based products were acquired
gradually as they moved along the value-added learning curve of the
16
industry. A large part of Finland's timber-based exports in the 1960s
consisted simply (as in Brazil and Chile) of wood-chips and pulp. However,
by the 1970s Finland had all but stopped exporting wood-chips, had
substantially cut its exports of pulp, and was using these raw materials as
inputs for increased production and export of paper and paperboards,
wood manufactures, and furniture. Also, by then Finland’s market shares
in OECD markets for machinery for the paper mill and pulp mill industries
had exceeded 8% – a substantial achievement for such a small country.24
Figure 5 also reveals large disparities in export upgrading in the
processed-timber industry between LA and EA. In the 1960s, neither had
a processed-timber export industry. In the 1970s, while Chile and Brazil
continued to export basic timber products, Malaysia had already added
some wood manufactures, aided by the successful implementation of an
industrial policy restricting exports of unprocessed timber. By 2000,
Brazil’s and Chile's exports still consisted entirely of products at the lower
end of processing, while Malaysia's exports of processed-timber products
consisted almost entirely of wood manufactures and furniture.25
The upgrading in the timber-based industry is, of course, a complex
phenomenon, full of investment indivisibilities, high-entry costs, huge
economies of scale, intricate financial engineering, specific skills,
technological complexities and environmental issues. Even the relatively
simple operation of upgrading from wood-chip to ‘MDF’ requires
considerable investments and skilful institutional arrangements.26
Basically, one could easily end up in the business of transforming high
quality timber into worthless furniture. As a result, many advise DCs not
to tackle these market failures in the export-upgrading business (those
that tend to keep them trapped in their traditional comparative
advantages), and to try to make the best of their sub-optimal growth path.
24 Sweden had a similar capacity to supply-upgrade its timber exports, as well as the production of inputs for its commodity-extracting industries (see Walker, 2003). 25 Taiwan presents a similar success story of upgrading in the timber-processing industry, but this country had to import the required inputs. 26 On the technological issues involved, see especially Perez (2003).
17
It would be wiser to be risk averse in this matter of ‘acquiring’ more
growth-enhancing comparative advantages. For example, some may
remember the World Bank reports and academic publications of the late
1950s and early 1960s that were intrigued by Japanese corporations
transforming world-class steel and other high-quality inputs into sub-
standard cars, which could be sold only to captive domestic customers or
exported at highly-subsidized prices.27 Korean corporations followed suit in
the 1970s, and the ‘usual suspects’ again wondered about what could be
the rationale for building low or negative value-added production lines that
used profits from captive markets to subsidize unprofitable exports? Who
would voluntarily choose to buy a 1970s’ Korean car, unless it was a
home-customer with no choice, or an international one only able to afford
a massively subsidized product? But in fact, it did not take all that long for
the Japanese and Korean car industry to turn the tables completely on
their competitors.28
Asymmetries in the dynamics of international demand for iron, steel
and metal-working machinery are similar to those of the timber industry:
while the sector shares in total OECD imports of iron ores and concentrates
fell in value by 82% between 1977 and 2000, those of metal-working
machinery significantly improved their relative position in OECD imports.
However, in 2000 Chile exported only iron ores and Brazil’s market share
in OECD imports of iron ores was 15 times larger than its share in
processed iron and steel. As mentioned above, this can hardly be justified
simply by LA’s natural resource abundance or US protectionist policies.
Korea, by contrast, soon transformed the initial exports of iron ores into
steel; then developed further into exporting metal-working machinery.
Taiwan, in turn, had by the 1980s also already developed a significant
27 In fact, the first car that Toyata exported to the US (the ‘Toyopet’) was such a flop that it had to be withdrawn from the market (it was described at the time as just “four wheels and an ashtray”). As Chang reminds us, “many [inside and outside Japan] argued at the time that Toyota should have stuck to its original business of making simple textile machinery. […] Today, Japanese cars are considered as ‘natural’ as Scottish salmon or French wine.” (2007). 28 On the distinction between “allocative”, “Schumpeterian” and “growth” efficiencies, see Dosi, Pavitt and Soete (1990) and the chapter by Cimoli, Dosi, Nelson and Stiglitz in this book.
18
export industry of metal-working machinery.
Although it is well known that as many countries which have tried
this type of product-upgrading and demand adaptation have failed as have
succeeded, the fact is that EA has developed the habit of succeeding while
post-reform LA has stopped trying. Not surprisingly, when FDI decides to
get involved in this type of value-chain it tends to invest in resource-
extraction in LA and resource-processing in EA.29
In fact, post-reform LA has not only invested very little in productive
capacity diversification in order to move up the ‘technology ladder’ in
terms of the processing of exports, but in several cases the movement has
actually been in the opposite direction. Post-1973 Chile, for example, not
only abandoned its previous ‘pro-industrialization’ agenda, but even ended
up severely reducing the share of domestic value added in its copper
exports, with the proportion of refined copper in total exports being
drastically reduced in favor of the far more primitive copper ‘concentrates’
(see below).
Supply-upgrading in resource-poor countries: the flying-geese
phenomenon
The Japanese economist Akamatsu coined the phrase ‘flying geese’ to
characterize the East Asian supply-upgrading industrialization model
(Akamatsu 1962). The analysis that follows will characterize two very
distinct components of this flying-geese phenomenon, not distinguished
properly by Akamatsu and often confused in the literature: what I have
called here the “sequential movements” and the “parallel movements”
along the learning curve. Although each process is characterized by a very
different dynamic, both have a crucial common element in that nearly all
products involved are demand-dynamic from the point of view of world
trade. What is characteristic of the first (and better known) component of
this ‘flying-geese’ process of industrialization, that which ‘moves
sequentially along the learning curve’, is the involvement of products that
29 See especially Amsden (2001).
19
Japan can no longer competitively produce and export and, therefore,
allows its productive capacity to be transferred to the geese that are
following them. For Japan, these products are either too labour-intensive
to be produced competitively at Japanese wages, or they have already
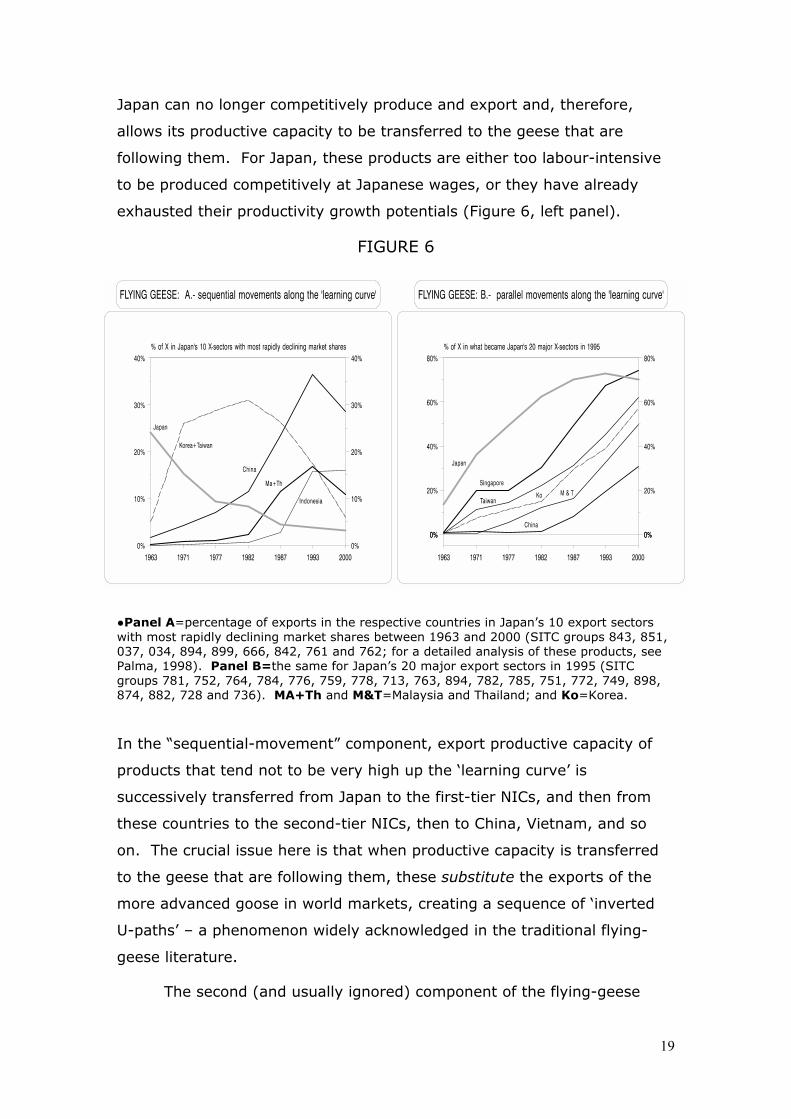
exhausted their productivity growth potentials (Figure 6, left panel).
FIGURE 6
●Panel A=percentage of exports in the respective countries in Japan’s 10 export sectors with most rapidly declining market shares between 1963 and 2000 (SITC groups 843, 851, 037, 034, 894, 899, 666, 842, 761 and 762; for a detailed analysis of these products, see Palma, 1998). Panel B=the same for Japan’s 20 major export sectors in 1995 (SITC groups 781, 752, 764, 784, 776, 759, 778, 713, 763, 894, 782, 785, 751, 772, 749, 898, 874, 882, 728 and 736). MA+Th and M&T=Malaysia and Thailand; and Ko=Korea.
In the “sequential-movement” component, export productive capacity of
products that tend not to be very high up the ‘learning curve’ is
successively transferred from Japan to the first-tier NICs, and then from
these countries to the second-tier NICs, then to China, Vietnam, and so
on. The crucial issue here is that when productive capacity is transferred
to the geese that are following them, these substitute the exports of the
more advanced goose in world markets, creating a sequence of ‘inverted
U-paths’ – a phenomenon widely acknowledged in the traditional flying-
geese literature.
The second (and usually ignored) component of the flying-geese
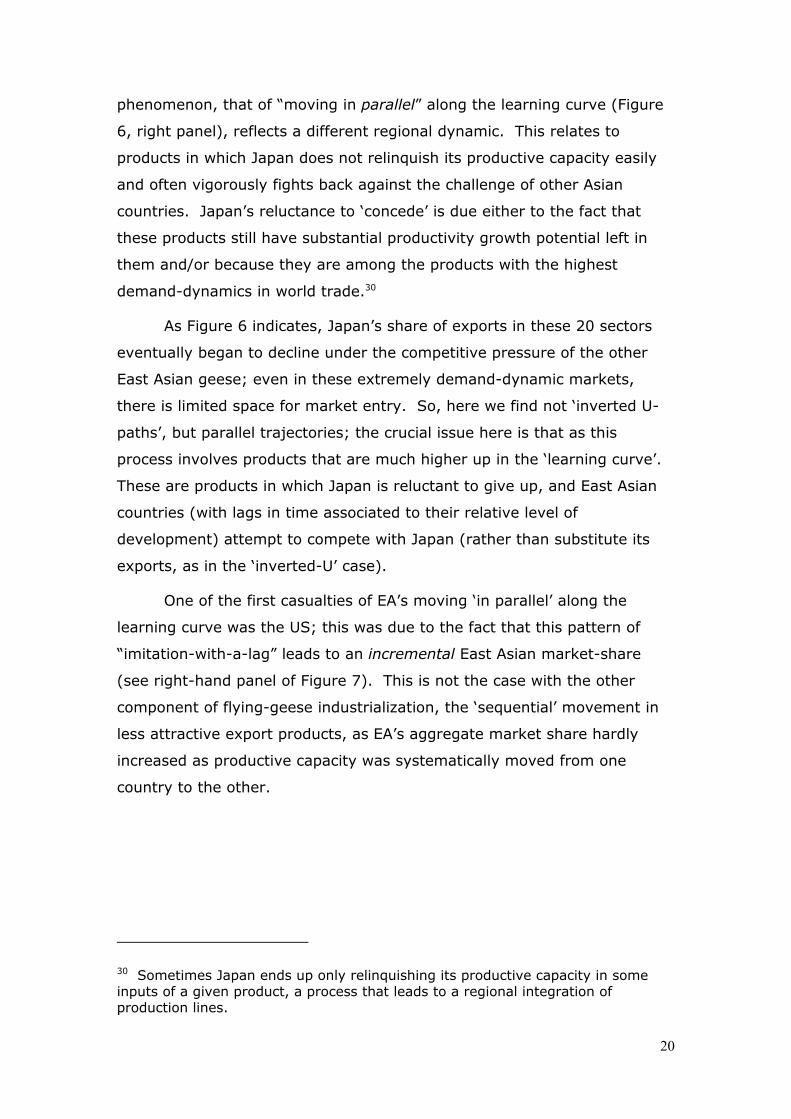
20
phenomenon, that of “moving in parallel” along the learning curve (Figure
6, right panel), reflects a different regional dynamic. This relates to
products in which Japan does not relinquish its productive capacity easily
and often vigorously fights back against the challenge of other Asian
countries. Japan’s reluctance to ‘concede’ is due either to the fact that
these products still have substantial productivity growth potential left in
them and/or because they are among the products with the highest
demand-dynamics in world trade.30
As Figure 6 indicates, Japan’s share of exports in these 20 sectors
eventually began to decline under the competitive pressure of the other
East Asian geese; even in these extremely demand-dynamic markets,
there is limited space for market entry. So, here we find not ‘inverted U-
paths’, but parallel trajectories; the crucial issue here is that as this
process involves products that are much higher up in the ‘learning curve’.
These are products in which Japan is reluctant to give up, and East Asian
countries (with lags in time associated to their relative level of
development) attempt to compete with Japan (rather than substitute its
exports, as in the ‘inverted-U’ case).
One of the first casualties of EA’s moving ‘in parallel’ along the
learning curve was the US; this was due to the fact that this pattern of
“imitation-with-a-lag” leads to an incremental East Asian market-share
(see right-hand panel of Figure 7). This is not the case with the other
component of flying-geese industrialization, the ‘sequential’ movement in
less attractive export products, as EA’s aggregate market share hardly
increased as productive capacity was systematically moved from one
country to the other.
30 Sometimes Japan ends up only relinquishing its productive capacity in some inputs of a given product, a process that leads to a regional integration of production lines.
21
FIGURE 7
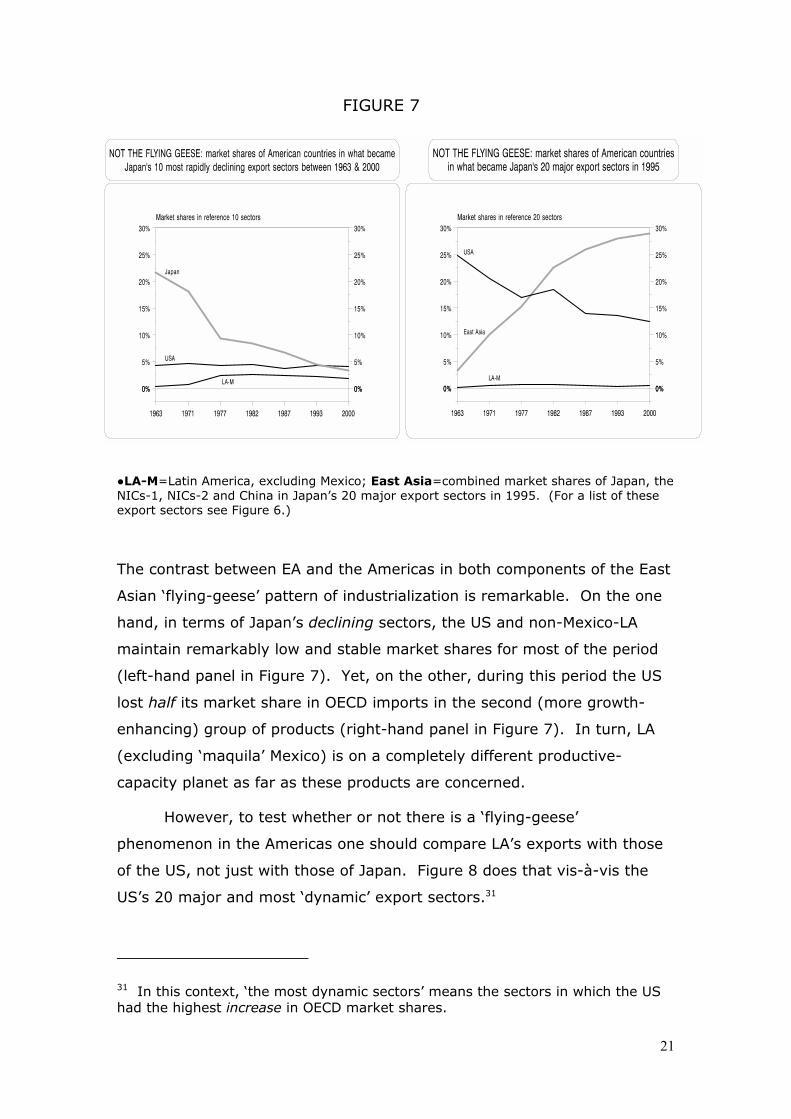
●LA-M=Latin America, excluding Mexico; East Asia=combined market shares of Japan, the NICs-1, NICs-2 and China in Japan’s 20 major export sectors in 1995. (For a list of these export sectors see Figure 6.)
The contrast between EA and the Americas in both components of the East
Asian ‘flying-geese’ pattern of industrialization is remarkable. On the one
hand, in terms of Japan’s declining sectors, the US and non-Mexico-LA
maintain remarkably low and stable market shares for most of the period
(left-hand panel in Figure 7). Yet, on the other, during this period the US
lost half its market share in OECD imports in the second (more growth-
enhancing) group of products (right-hand panel in Figure 7). In turn, LA
(excluding ‘maquila’ Mexico) is on a completely different productive-
capacity planet as far as these products are concerned.
However, to test whether or not there is a ‘flying-geese’
phenomenon in the Americas one should compare LA’s exports with those
of the US, not just with those of Japan. Figure 8 does that vis-à-vis the
US’s 20 major and most ‘dynamic’ export sectors.31
31 In this context, ‘the most dynamic sectors’ means the sectors in which the US had the highest increase in OECD market shares.
22
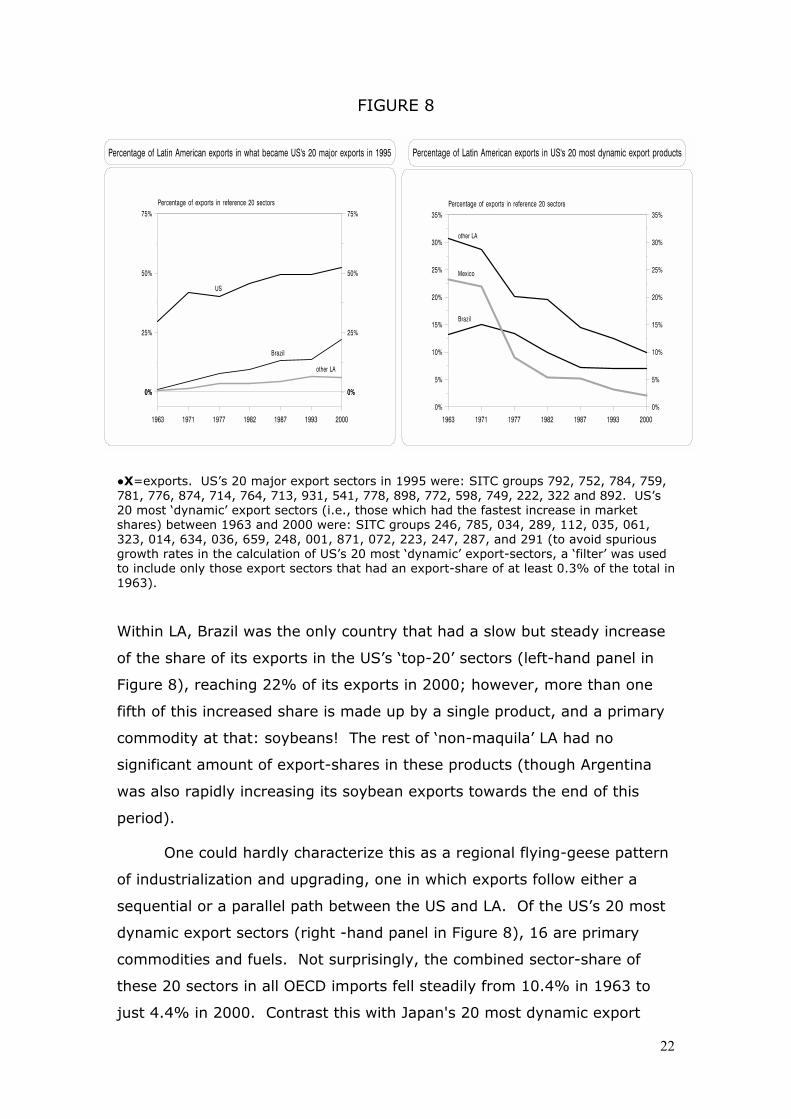
FIGURE 8
●X=exports. US’s 20 major export sectors in 1995 were: SITC groups 792, 752, 784, 759, 781, 776, 874, 714, 764, 713, 931, 541, 778, 898, 772, 598, 749, 222, 322 and 892. US’s 20 most ‘dynamic’ export sectors (i.e., those which had the fastest increase in market shares) between 1963 and 2000 were: SITC groups 246, 785, 034, 289, 112, 035, 061, 323, 014, 634, 036, 659, 248, 001, 871, 072, 223, 247, 287, and 291 (to avoid spurious growth rates in the calculation of US’s 20 most ‘dynamic’ export-sectors, a ‘filter’ was used to include only those export sectors that had an export-share of at least 0.3% of the total in 1963).
Within LA, Brazil was the only country that had a slow but steady increase
of the share of its exports in the US’s ‘top-20’ sectors (left-hand panel in
Figure 8), reaching 22% of its exports in 2000; however, more than one
fifth of this increased share is made up by a single product, and a primary
commodity at that: soybeans! The rest of ‘non-maquila’ LA had no
significant amount of export-shares in these products (though Argentina
was also rapidly increasing its soybean exports towards the end of this
period).
One could hardly characterize this as a regional flying-geese pattern
of industrialization and upgrading, one in which exports follow either a
sequential or a parallel path between the US and LA. Of the US’s 20 most
dynamic export sectors (right -hand panel in Figure 8), 16 are primary
commodities and fuels. Not surprisingly, the combined sector-share of
these 20 sectors in all OECD imports fell steadily from 10.4% in 1963 to
just 4.4% in 2000. Contrast this with Japan's 20 most dynamic export
23
sectors, which doubled their sector-share over the same period. Moreover,
as the right panel of Figure 8 shows, in the US’s 20 most dynamic export
sectors the “goose leader”, the US, flies in reverse: i.e., trying to penetrate
markets that are being relinquished by supposed geese-following Latin
American countries! That is, it is in the 20 sectors in which the US had the
highest increase in OECD market shares that one of the most bizarre
aspects of the US’s regional influence emerges. The US was increasing its
export-shares in (rather unattractive, mostly primary) products in which LA
was already reducing its export-share. Rather than an East Asian flying-
geese pattern of succession, the (more magical realist) Americas present a
scenario in which the leader follows the followers…32
Figure 9, which compares the changes in the overall levels of
competitiveness and the capacity to move into ‘high-tech’ products in the
regions studied here, illustrates several related issues.33
32 Not surprisingly, in a series of new trade agreements between the US and Latin American countries, a primary concern of the US has been the opening up of Latin American markets to its exports of primary commodity (particularly agricultural products). 33 The main limitation of traditional trade statistics (such as those available in the UN Com-trade online database and the Trade-CAN software) is that they refer to gross value of exports and not to their value added. As mentioned above, this problem is particularly important in the study of the so-called ‘maquila’ industry (or purely assembly-type export-operations) of Mexico and some parts of Central America; in fact, the use of these data would distort the comparative regional analysis attempted below. As a result, there is little option but again to exclude Mexico in most of the following comparative analysis, and to analyze Mexico’s peculiar export-led growth experience properly separately (see Palma 2005a).
24
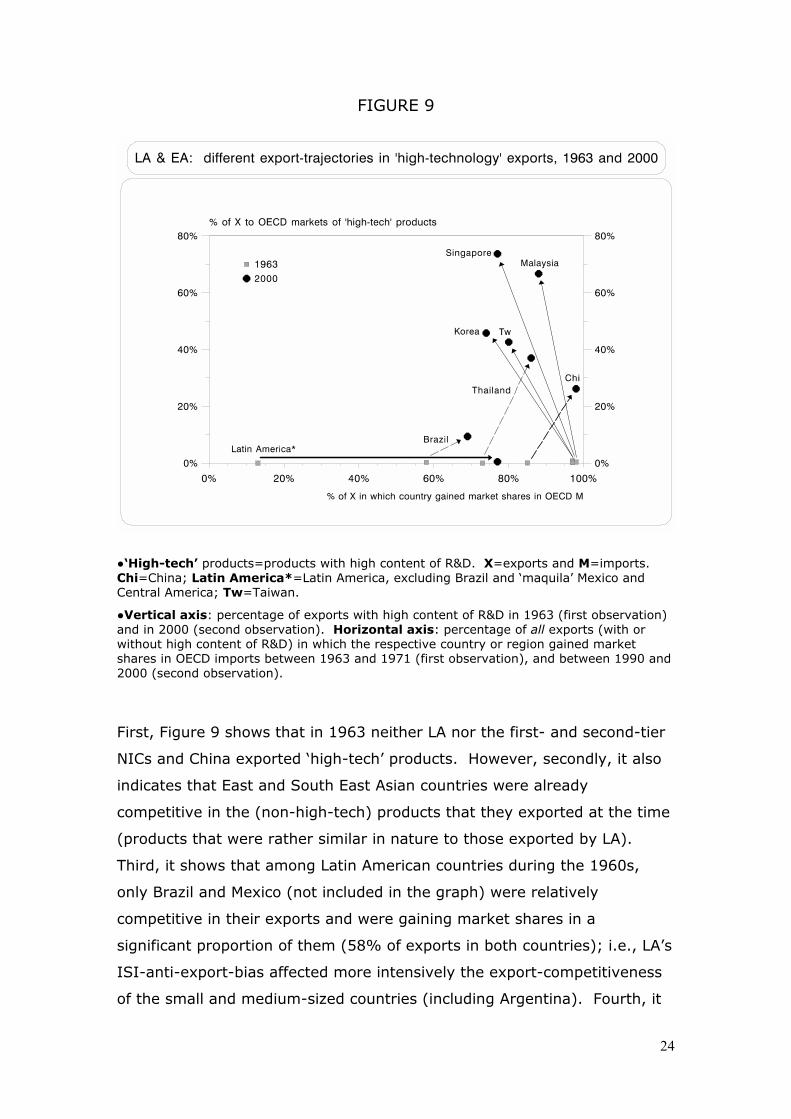
FIGURE 9
●‘High-tech’ products=products with high content of R&D. X=exports and M=imports. Chi=China; Latin America*=Latin America, excluding Brazil and ‘maquila’ Mexico and Central America; Tw=Taiwan.
●Vertical axis: percentage of exports with high content of R&D in 1963 (first observation) and in 2000 (second observation). Horizontal axis: percentage of all exports (with or without high content of R&D) in which the respective country or region gained market shares in OECD imports between 1963 and 1971 (first observation), and between 1990 and 2000 (second observation).
First, Figure 9 shows that in 1963 neither LA nor the first- and second-tier
NICs and China exported ‘high-tech’ products. However, secondly, it also
indicates that East and South East Asian countries were already
competitive in the (non-high-tech) products that they exported at the time
(products that were rather similar in nature to those exported by LA).
Third, it shows that among Latin American countries during the 1960s,
only Brazil and Mexico (not included in the graph) were relatively
competitive in their exports and were gaining market shares in a
significant proportion of them (58% of exports in both countries); i.e., LA’s
ISI-anti-export-bias affected more intensively the export-competitiveness
of the small and medium-sized countries (including Argentina). Fourth, it
25
shows that during the 1990s (after trade liberalization) LA was able
massively to increase its competitiveness in OECD markets – in several
cases, from less than 20% to about 80% of their exports. Fifth, even
though during the 1990s LA reached East Asian levels of export-
competitiveness, it did so only in its traditional-type exports.34 If
international demand had not discriminated in such an extreme form
against commodities, and if these products had had the same long-term
productivity growth potential and growth-enhancing ‘pulling’ effect as
those higher up in the ‘value-chain’, this remarkable increase in
competitiveness would have been an unqualified regional success.
Unfortunately, this was clearly not the case. Finally, Figure 9 also
illustrates East Asian countries’ remarkable capacity to ‘reinvent’
themselves, by diversifying their export productive capacity towards ‘high-
tech’ products; further, they did so while retaining most of their former
extremely high levels of export-competitiveness.
Overall export-trajectories between the 1960s and 1990s
Finally, one could compare export profiles between the 1960s and the
1990s not just by looking at the capacity to move into ‘high-tech’ products
(Figure 9), but also into ‘demand-dynamic’ products in general, whether
‘high-tech’ or not (Figure 10).
34 The partial exception is Brazil, which increased its share of exports in ‘high-tech’ products from 0.3% in 1963 to 3.8% in 1985 and 9.4% in 2000. However, two thirds of those exports in 2000 consisted only of only one (though rather notable) product: aircrafts (SITC group 792). In fact, in that year no other ‘high-tech’ product reached 1% of total exports.
26
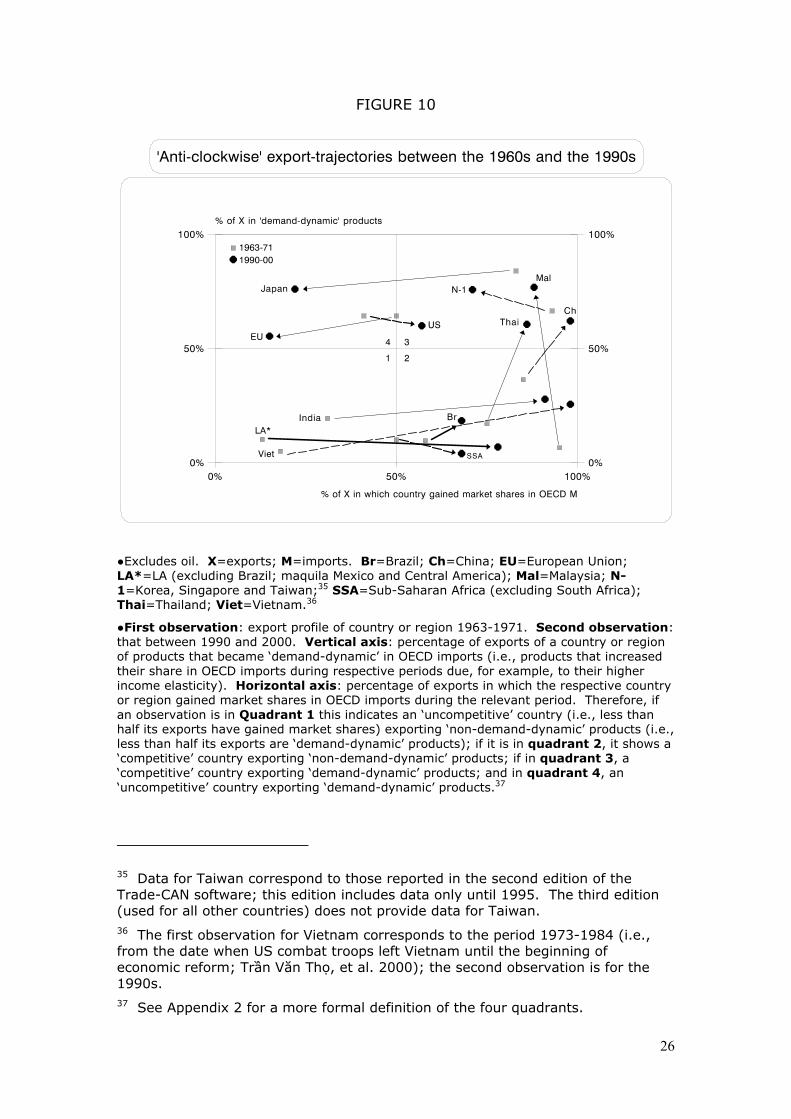
FIGURE 10
●Excludes oil. X=exports; M=imports. Br=Brazil; Ch=China; EU=European Union; LA*=LA (excluding Brazil; maquila Mexico and Central America); Mal=Malaysia; N-1=Korea, Singapore and Taiwan;35 SSA=Sub-Saharan Africa (excluding South Africa); Thai=Thailand; Viet=Vietnam.36
●First observation: export profile of country or region 1963-1971. Second observation: that between 1990 and 2000. Vertical axis: percentage of exports of a country or region of products that became ‘demand-dynamic’ in OECD imports (i.e., products that increased their share in OECD imports during respective periods due, for example, to their higher income elasticity). Horizontal axis: percentage of exports in which the respective country or region gained market shares in OECD imports during the relevant period. Therefore, if an observation is in Quadrant 1 this indicates an ‘uncompetitive’ country (i.e., less than half its exports have gained market shares) exporting ‘non-demand-dynamic’ products (i.e., less than half its exports are ‘demand-dynamic’ products); if it is in quadrant 2, it shows a ‘competitive’ country exporting ‘non-demand-dynamic’ products; if in quadrant 3, a ‘competitive’ country exporting ‘demand-dynamic’ products; and in quadrant 4, an ‘uncompetitive’ country exporting ‘demand-dynamic’ products.37
35 Data for Taiwan correspond to those reported in the second edition of the Trade-CAN software; this edition includes data only until 1995. The third edition (used for all other countries) does not provide data for Taiwan. 36 The first observation for Vietnam corresponds to the period 1973-1984 (i.e., from the date when US combat troops left Vietnam until the beginning of economic reform; Trần Văn Thọ, et al. 2000); the second observation is for the 1990s. 37 See Appendix 2 for a more formal definition of the four quadrants.
27
Figure 10 illustrates that the remarkable increase in export-
competitiveness in LA between the 1960s and the 1990s (i.e., the rapid
movement from quadrants 1 to 2), was not accompanied by an
improvement in the ‘quality’ of its exports. Figure 9 has shown that LA’s
improved export-competitiveness did not include many high-tech products;
Figure 10 indicates that it did not include many other demand-dynamic
products either. In EA, in contrast, it indicates an intriguing aspect of the
flying-geese pattern of industrialization and exports: the different
trajectories of young-industrializers (second-tier NICs and China), to those
of middle-aged ones (first-tier NICs) and of more ‘mature’ ones (Japan).
Basically, the rapid movement into demand-dynamic products of the
second-tier NICs and China – their sharp movement from quadrants 2 to 3
– eats away some degree of export-competitiveness in the first-tier NICs.
This process is more acute with Japan (and the EU) because the aggregate
competitive pressure of all NICs and China (in addition to other domestic
economic problems) has driven these countries from quadrants 3 to 4.
With the exception of the US (primarily during the Clinton years, and in
part due to the composition of its exports discussed above), the overall
pattern that emerges in Figure 10 is one of a clear anti-clockwise
trajectory.
For LA and other countries moving into quadrant 2, the crucial
trade- and industrial-policy issue next is whether there are endogenous
market forces that would lead them in an upwards movement from
quadrants 2 to 3. Or whether there are market failures that would lead
them to get trapped in being ever more competitive in products that tend
to be ever more marginalized (in value terms) from world markets (except
for temporary cyclical periods such as those that benefited many
commodities, such as oil, after the 9/11 crisis). In fact, especially in
commodity markets, excessive competitive struggle for market shares by
DCs often leads to a self-defeating fallacy of composition problems.38
So far, there is little (if any) evidence of “upward endogenous
forces” at work that would help bring a country from ‘2 to 3’. Countries in
38 For an analysis of the fallacy of composition issue, see Mayer (2003).
28
quadrant 2 seem to need an exogenous push such as the trade and
industrial policies that characterized the movement from 2 to 3 in most
East Asian countries. However, for these policies to be implemented
effectively, what is needed is the type of institutional arrangements that
allowed them to be effective in EA. These include a strong state, capable
not only of devising trade and industrial policies to generate rents that
would create incentives to the transfer of resources towards demand-
dynamic export products, but also capable of making sure that these rents
are used effectively. That is, a state not only able of generating rents, but
also one capable of imposing conditionalities in order to ‘discipline’ the
capitalist élite to use them productively. Furthermore, for these policies to
succeed it is also necessary to have a state capable of withstanding
clientelist pressures from “intermediate classes”.39
If these policies and the institutional arrangements necessary for
their success are not implemented, the potential GDP-growth-enhancing
effect of further increases in export-competitiveness in LA would continue
to be restricted by the generally low productivity growth potential of
unprocessed commodity exports (sometimes after an initial one-off boost),
and by their modest positive externalities and spill-over effects and low
capacity to induce productivity growth in the rest of the economy in
general. Furthermore, lack of an upward movement from ‘2 to 3’ could
also seriously affect the welfare gains from trade specialization in terms of
the purchasing power of exports.40
Existing evidence for LA indicates that the (not so) invisible hand of
globalized markets are only creating incentives leading towards further
penetration into quadrant 2. There is little evidence that market
incentives, the domestic structure of property rights and institutional
arrangements, or domestic political settlements are helping the region to
move upwards in the direction of quadrant 3. One example is Chile, the
most successful country in post-reform LA (at least for the period between
39 See especially Kahn (2000). 40 On the issue of the different “qualities of specializations”, see Cimoli and Correa (2005).
29
the 1982 debt crisis and the 1997 East Asian financial crisis), whose export
trajectory is a horizontal (in fact, slightly downward) movement from
quadrant 1 to 2, increasing the share of competitive exports from 12% to
79%, while actually decreasing the share of exports of demand-dynamic
products from 12% to 6%. The performance of its copper export industry
is a good example of this peculiar combination of increased
competitiveness with no ‘upward push’; in fact, while rapidly gaining
market share, Chile was actually reducing the average share of
manufacturing value added in its copper exports. As a result, the
proportion of refined copper (i.e., with more than 99% metal content) has
fallen from 97% of total copper exports in 1973 to just about half, in favor
of the far less processed form of copper ‘concentrates’ (with less than one-
third metal content).41 There is ample evidence that the sharp slowdown
in Chile’s growth since the end of the 1990s is partly due to this under-
investment in upward productive diversification.42
Finally, the analysis of the past 40 years of international trade
clearly shows that LA’s long-delayed transition towards ‘quadrant 3’ can
expect little (if any) ‘pulling’ help from the US (as East Asian countries had
from their ‘leading-goose’).43
A simple test for the different capabilities of EA and LA to use
exports effectively as an engine of growth
LA’s economic performance since the beginning of trade and financial
41 On this subject, see especially Lagos (2000). On the issue of Chile’s and other Latin American countries’ “premature” de-industrialization since economic reform, see Palma (2005b). 42 See especially Moguillansky (1999). 43 Further, the proliferation of the above-mentioned trade agreements between countries of the region and the US (such as those signed by Chile in 2003, and by some Central American countries in 2004), especially due to their asymmetric nature (see, for example, Stiglitz, 2003, and Bhagwati, 2003), would probably make the transition from quadrant 2 to 3 even less likely, unless one considers (against all evidence – see Palma, 2005a) that maquila-type exports are the panacea.
30
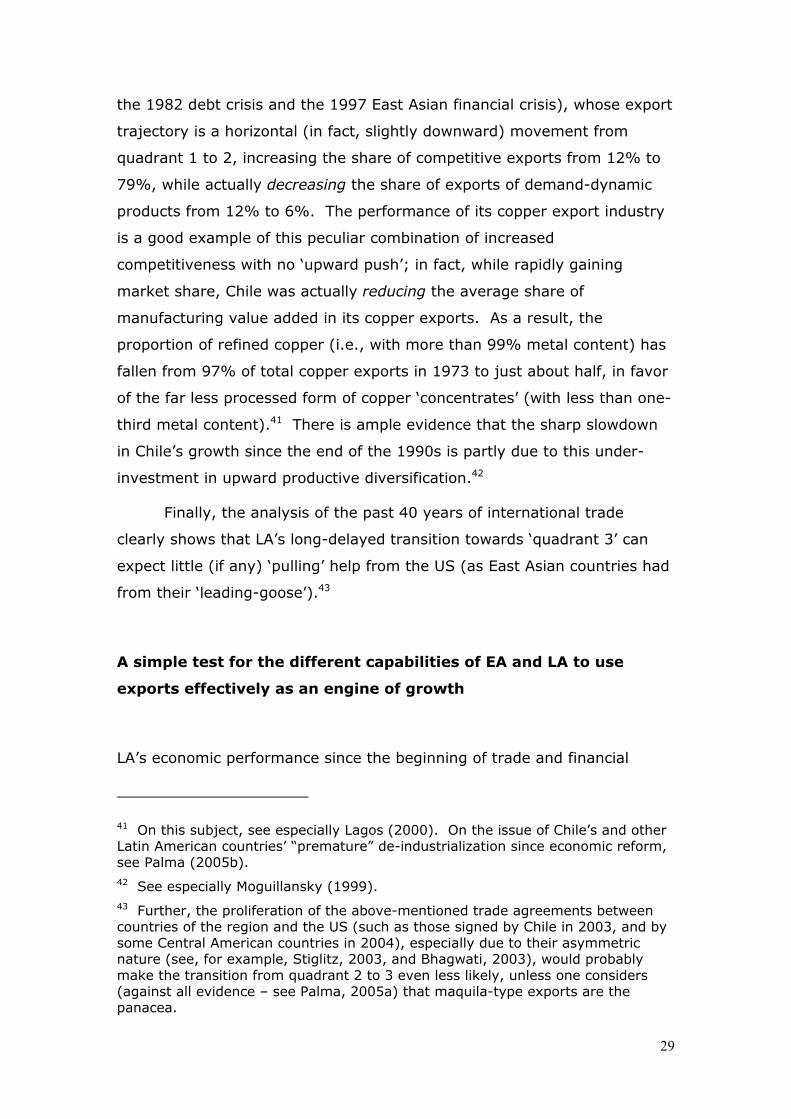
liberalization, and the switching back of the engine of growth to the export
sector, has been characterized by dynamic exports and sluggish growth in
the rest of the economy. Figure 11 shows the average growth of GDP and
exports since 1980, as well as the conditional expectation for this
relationship.
FIGURE 11
●EA*=NICs-1 and NICs-2 (excluding China); LA*=Latin America (excluding Brazil, Mexico and Venezuela); dLA=interactive dummy for Latin American countries; mena=North Africa and the Middle East; oecd=average of 15 high-income OECD countries; SA*=South Asia (excluding India); S-S A*=Sub-Saharan Africa (excluding South Africa). Br=Brazil; Mx=Mexico; and ZA=South Africa.
●Source: Constructed by the author using data from WDI (2007).44
44 The regression line is obtained from a cross-country regression in which GDP growth is the dependent variable and export growth squared is the explanatory one; the sample consists of all countries for which the WDI reports data for both variables during this period (94). It is important to emphasize here that the aim of this regression is simply to represent a cross-sectional description of cross-country GDP-growth differences, categorized by export-growth performance. Therefore, this regression should not be interpreted as ‘predictive’, because as is well-known there are a number of difficulties with a regression of this type estimated from a single cross-section, especially regarding the homogeneity restrictions that are required to hold. This regression passes all the relevant diagnostic tests. The R2 is 54% and the ‘t’ statistic of the explanatory variable is 10.1. The ‘t’ statistics are based on ‘White’s heteroscedasticity adjusted standard
31
In most of LA, as in many other DCs, economic reform has certainly
succeeded in shifting the ‘engine of growth’ towards the export sector.
However, for any engine to be effective, the power it generates must be
properly harnessed. Asian countries seem to have mastered this process
rather well, while those in LA (especially Brazil and Mexico, formerly the
most dynamic economies of the region) and in Sub-Saharan Africa
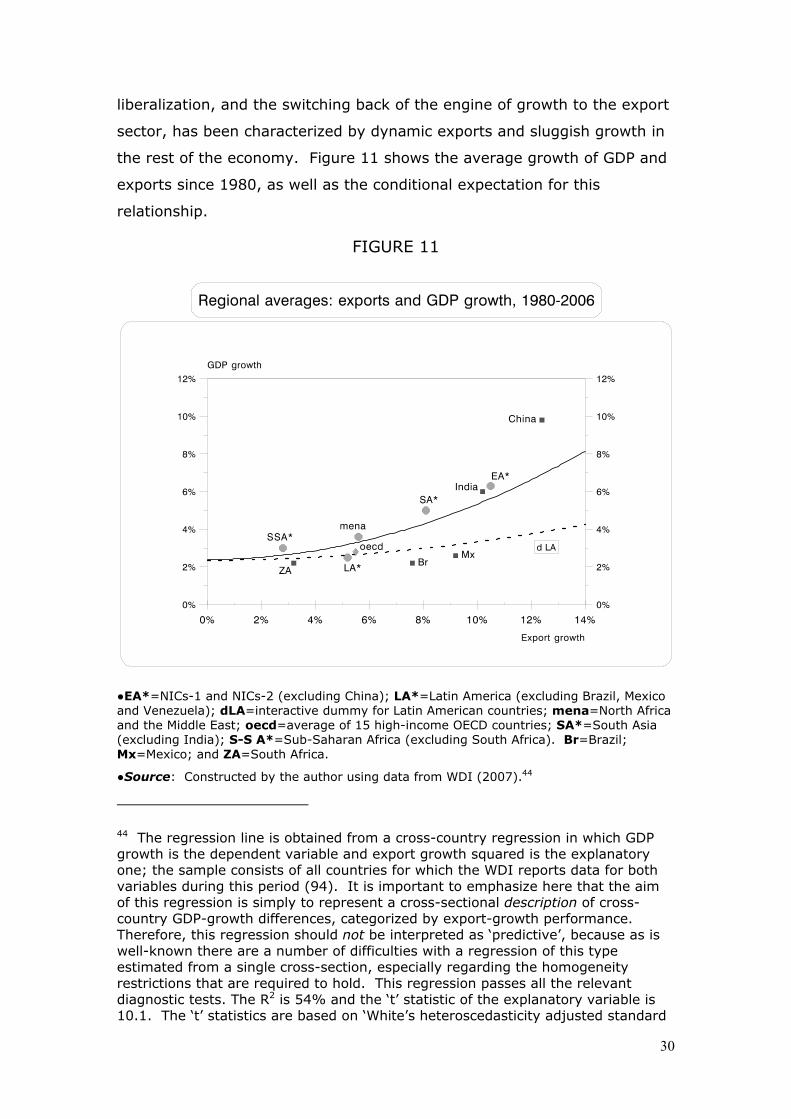
(including South Africa) remain far from doing so. Figure 12 shows the
degree to which the performance of the export engine seems to be region-
specific, and the remarkable underperformance of LA.
FIGURE 12
●EA=East and South-East Asia; LA=Latin America; dLA=interactive dummy for Latin American countries; SA=South Asia; S-S A=Sub-Saharan Africa; and S-S A*=Sub-Saharan Africa (excluding South Africa). Ar=Argentina; B=Bangladesh; Br=Brazil; Ch=Chile; Co=Colombia; Ec=Ecuador; H=Hong-Kong; In=India; Ko=Korea; M=Malaysia; Mx=Mexico; Pa=Paraguay; Pe=Peru; Pk=Pakistan; Th=Thailand; Tw=Taiwan;45 Ur=Uruguay; and VN=Vietnam; and ZA=South Africa. Vietnam’s export growth is 14.7%.
errors’. For a discussion of the econometrics of cross-section regressions, see Pesaran, et al. (2000). 45 The WDI database does not provide information for Taiwan. Data for this country have been obtained from The Republic of China Yearbook of Statistics.
32
With the LA dummy the R2 of the regression increases to 58% and the ‘t’ statistic of the explanatory variable to 10.8; the ‘t’ of the dummy is 3. The ‘t’ statistics are based on ‘White’s heteroscedasticity adjusted standard errors’.
As is clear from the graph, the Latin American export-engine tends to
perform badly compared to those of EA and South Asia in terms of its
capacity to be associated with GDP growth in the rest of the economy. In
fact, it performs poorly in relative terms even when compared with that of
other commodity-exporting countries. Basically, during this period Sub-
Saharan countries achieved disappointing growth rates on both exports
and GDP, while Asian countries managed dynamic growth on both fronts;
whereas Latin American countries (and especially Brazil and Mexico), while
able to engineer a rapid expansion of exports, were unable to pull the rest
of the economy along with it. So, in statistical terms, as GDP growth in
Latin American countries is located below their conditional expectations
consistently enough, the interactive dummy for the region ends up being
negative and highly significant.
The underperforming of the Latin American export-engine after
economic reform is a relatively stable phenomenon throughout the post-
1980 period. In Brazil, for example, while between 1950 and 1980 the
growth of the previous engine (manufacturing) and overall GDP were very
similar (8.8% and 7.3% per year, respectively), since Lula was first
elected, the asymmetry between the growth of the new engine (exports)
and GDP during this period (2002-2007) could hardly be greater (13.3%
and 3.5% respectively; see http://www.eclac.org).
Mexico is the country with the largest gap between actual GDP-
growth and the conditional expectation of this growth in the whole sample,
making it an extreme example of export-led failure. During these two and
a half decades, a remarkably dynamic growth of exports (9.2% per year)
was associated with an extremely poor growth performance (2.6%).46
Further, as population grew at over 1.6%, per capita GDP growth stood at
46 One of the most remarkable features of Mexico’s poor growth performance is that it took place in a context of both a massive inflow of FDI (well over US$ 200 billion during this period; see Palma, 2005a) and practically unrestricted market access to the US – the first two items on most DCs’ growth agenda!
33
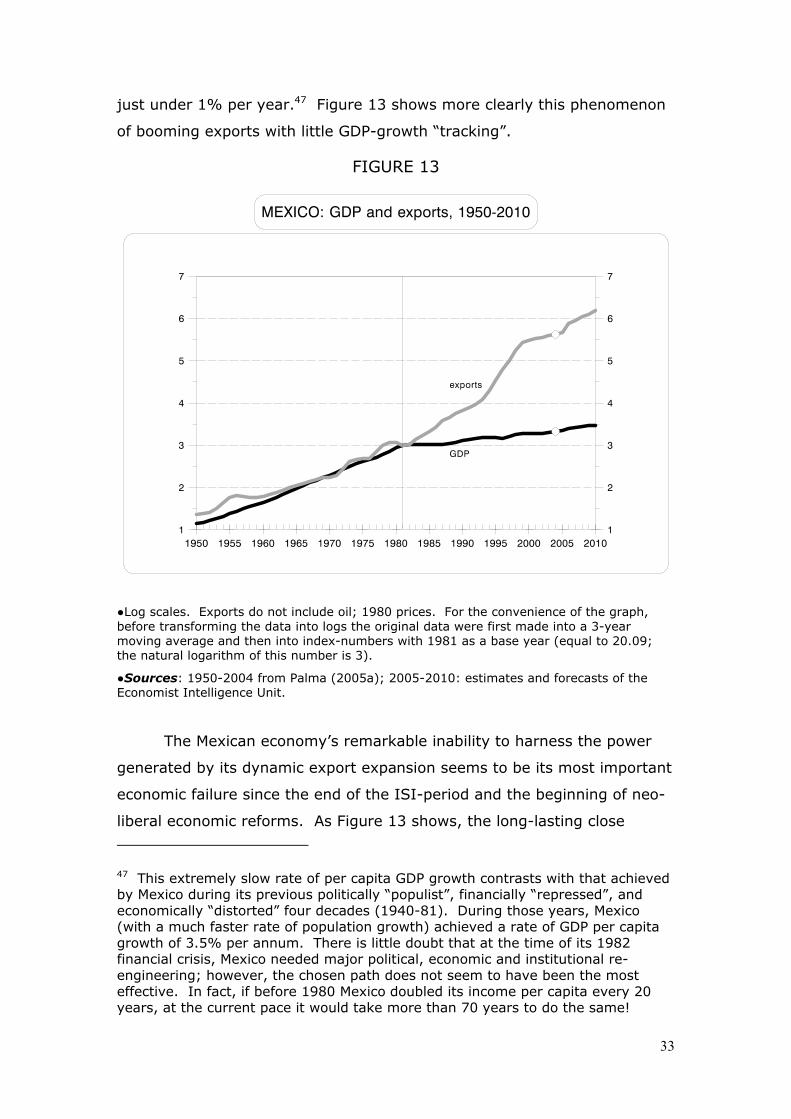
just under 1% per year.47 Figure 13 shows more clearly this phenomenon
of booming exports with little GDP-growth “tracking”.
FIGURE 13
●Log scales. Exports do not include oil; 1980 prices. For the convenience of the graph, before transforming the data into logs the original data were first made into a 3-year moving average and then into index-numbers with 1981 as a base year (equal to 20.09; the natural logarithm of this number is 3).
●Sources: 1950-2004 from Palma (2005a); 2005-2010: estimates and forecasts of the Economist Intelligence Unit.
The Mexican economy’s remarkable inability to harness the power
generated by its dynamic export expansion seems to be its most important
economic failure since the end of the ISI-period and the beginning of neo-
liberal economic reforms. As Figure 13 shows, the long-lasting close
47 This extremely slow rate of per capita GDP growth contrasts with that achieved by Mexico during its previous politically “populist”, financially “repressed”, and economically “distorted” four decades (1940-81). During those years, Mexico (with a much faster rate of population growth) achieved a rate of GDP per capita growth of 3.5% per annum. There is little doubt that at the time of its 1982 financial crisis, Mexico needed major political, economic and institutional re-engineering; however, the chosen path does not seem to have been the most effective. In fact, if before 1980 Mexico doubled its income per capita every 20 years, at the current pace it would take more than 70 years to do the same!
34
relationship between exports and GDP growth, built during ISI,
disappeared after the 1982 debt crisis, when the sharp acceleration in the
rate of growth of exports became associated with a sharp decline in rate of
growth of GDP – not exactly the Promised Land of the Washington
Consensus. In fact, the ratio of export growth to that of GDP more than
trebled.
As the regression line above has indicated, in LA exports are
faltering as an engine of growth not because of their lack of own growth,
market penetration or competitiveness, but because of their poor ‘GDP-
tracking’ properties. This is likely to be associated, at least in part, with
the lack of ‘quality’ of its export composition (i.e., in terms of the idiom of
Figure 10 above, with the region’s inability to move from quadrants 2 to 3;
and in the case of Mexico, with the lack of ‘deepening’ of its maquila
exports). Orthodox and unimaginative monetary, fiscal and exchange-rate
policies have not helped either. However, as Figure 12 indicated, this is
also a region-specific phenomenon, likely to be the result of the rigid way
in which economic reforms were implemented in the region. For example,
if one adds to the above regression a variable for the ‘quality’ of exports
(as in Figure 10), other variables to account for factor accumulation
(population growth and investment) and others to account for ‘production
frontier shifters’ (such as manufacturing), LA again ends up as the region
with the largest negative gap between actual GDP growth and the
conditional expectation of that growth.
Ironically, while during the ISI period the main obstacle in LA to the
sustainability of growth was an almost obsessive concentration of policy
incentives and resources in (non-export) manufacturing, leading to a
neglect of exports (hindering growth via a balance of payments
constraint), in the post-1980 period the region did exactly the same but
the other way around. Though LA certainly succeeded in becoming
competitive in world markets for its traditional export products, this effort
seems to have had little overall growth effects. Lack of growth-enhancing
policies, institutions capable of implementing them, adequate structures of
property rights and incentives and macro-stability also matter in this.
Product diversification, high levels of investment and adequate institutions
35
seem to be the conditions that have helped Asian countries successfully
take advantage of new ‘growth spaces’ in a globalized world.
In sum, export-led growth when based on unprocessed primary
commodities or ‘thin’ maquila exports has proved to be a poor engine of
growth. The main lesson from post-reform LA is that if the region wants to
insist on this export orientation, it should think about this model only as an
export-“enabling” growth-strategy, not as an export-“led” one. That is,
one in which dynamic (but unattractive) exports can only be expected to
provide the necessary foreign exchange to enable a fast rate of growth
that is not balance-of-payment constrained. However, for this growth
actually to take place there is still the need for a proper ‘engine’ to be
found somewhere else in the economy. That is, other sectors or activities
that would play the role of “production frontier shifters”, able to set in
motion processes of cumulative causation – characterized by their positive
feedback loops into the system, and capable of generating a momentum of
change which is self-perpetuating (e.g., in the Veblen / Myrdal or Young /
Kaldor manner). There is not much evidence from LA since 1980 that
unprocessed primary commodities or ‘maquila’ exports can play that role—
nor that the countries of this region have made much effort in export-
upgrading, or in looking elsewhere for an effective engine of growth.
Conclusions
Ultimately, the effectiveness of exports as an engine of growth depends on
the capacity of exports to improve both productivity growth and labour
absorption not only in the export sector but in the overall economy. On
the purchasing power of income side there is the additional issue of the
terms of trade, as these are the vital link between real GDP growth and
real command-GDP growth.
In post-reform LA (with the sole exception of Chile – and only during
a specific period that covers about half its post-reform years), the main
stylized fact regarding GDP growth is that even in those countries
successful in rapidly accelerating the rate of growth of exports, especially
Mexico and Brazil, the rate of growth of output has been particularly
36
disappointing. Of course, for those countries that have not even been able
to improve export-competitiveness, the post-reform economic situation
has usually proved much worse.
For LA and many other DCs the key strategic trade-policy issue is
how to invest effectively in product-diversification in order to re-direct
export growth from quadrants 2 to 3. The well-know facts that the design
of these policies is sometimes difficult, and that their practical
implementation is always so (due to institutional, technological, financial,
and other constraints) has become a Latin American and South African, but
not an Asian, excuse. As discussed above, the movement from 2 to 3
relates not only to the critical supply-side differences between
concentrating exports in basic unprocessed primary commodities rather
than in products higher up in the value-chain, but also to the rather
obvious fact that if for a DC exports are to be the engine of growth in an
export-led strategy, it is better to be attached to a locomotive (world
demand) with effective pulling-power (demand-growth). This could prove,
for example, the difference between international trade being a positive- or
zero-sum game vis-à-vis competitors.
Export-led growth in post-reform LA has been, at best, a mixed
blessing. Although ‘maquila’ exports have absorbed a significant amount
of labour, they have been characterized by little or no productivity growth,
and associated with little or no productivity growth in the rest of the
economy. In turn, in the few cases of rapid productivity growth in
unprocessed commodity exports (e.g., some mining and agricultural
products), there is evidence that this has been more a ‘one-off’ type of
phenomenon than a process that could be sustained over time. Moreover,
this productivity growth has had little ‘pulling’ effect on productivity-growth
in the rest of the economy. And from the point of view of command-GDP-
growth, at least until the cyclical upswing in commodity terms of trade that
started with 9/11, when exports were adjusted by the price of imports, the
capacity of export-growth to add to the purchasing power of GDP proved
equally disappointing.
Using Krugman’s terminology, post-reform LA may be a
paradigmatic case in which the single-minded emphasis on improved
37
export competitiveness has led policy makers and their economic advisers
to forget that what really matters from the point of view of income in
export-led economies are the purchasing power gains arising from
specialization. And as Krugman emphasizes, single-minded emphasis on
export competitiveness is a very dangerous obsession that tends to skew
domestic economic policies.48
That is not to say that in open economies ‘competitiveness’ does not
matter; but when the terms of trade are so unstable and downwardly-
mobile, “competitive-gains” can mean something very different from
“welfare-gains”. Therefore, being able to enhance international
competitiveness in a given product, even when both the domestic and the
international prices are “right”, does not per se justify the continuous
concentration of resources in that specific export product in the long run.
In fact, one should never forget that when Korea took the decision to ‘re-
invent’ its export sector in the early 1960s, it certainly had no
‘competitiveness’ problem with its world class silk or its excellent quality
seaweed (the country’s main export products at the time).
LA’s underinvestment in export-product diversification in a world of
rapidly-changing demand has led the region from being a major player in
major products to being a major player in relatively marginal products.49
In fact, it has not even sought ‘niches’ in segmented commodity markets
that have emerged from the dissemination of the new technological
paradigm (characterized by a ‘knowledge-society’ with flexible production
techniques). This underinvestment in part reflects the region’s (path-
dependent) obsession with traditional products that are often less and less
attractive from the point of view of international demand, in which further
‘competitive’ gains can only be achieved by ever increasing mass
production, more and more optimal routines, greater and greater degrees
48 See especially 1997, chapters 1 and 2. 49 In 1963, 57% of LA’s exports were products included in the OECD list of 20 major import products of the time; by 2000, less than 7% of its exports consisted of products that made the then (new) OECD ‘top 20’ list. Meanwhile the first- and second-tier NICs and China moved in the opposite direction, with respective shares of 6% and 64%, 8% and 50%, and 8% and 32%, respectively.
38
of standardization, and larger and larger economies of scale.50 Obviously,
LA's underinvestment in productive capacity diversification is the direct
result of the fact that every time private investment in the region manages
to rise above 15% of GDP the capitalist élite begins to experience feelings
of vertigo. As a result, LA ends up being like a football team that plays
better and better in a league that gets continuously relegated to lower and
lower divisions, while EA seems to be a member of a league continually
promoted to higher and higher divisions. In fact, in a Ricardian sense, LA’s
increased export competitiveness has sometimes acted as an ‘own-goal’
because its standard of living has sometimes actually declined when
domestic output growth has been outweighed by deteriorating terms of
trade.
The obsession with increased competitiveness in existing export
products has led LA to keep shooting at a fixed target, even though world
demand is a rapidly moving one. In contrast, EA, aided by its own efforts
in institution-building, investment, savings, education, etc., as well as by
Japanese regional leadership, has been increasingly successful in learning
how to hit a moving target. Further, as the data have shown, international
demand-adaptation and supply-upgrading are closely related phenomena;
therefore, predicting the trajectory of this moving target does not seem to
be such a difficult task, despite the rapidly changing technological
paradigm. Unfortunately, the capacity of the state to ‘discipline’ the
capitalist élite in order to be able effectively to implement an appropriate
set of strategic trade and industrial policies is another matter – and one in
which LA does not seem to have learnt how to acquire much comparative
advantage!
One of the characteristics of a great deal of the trade literature,
even in some of its ‘new-trade’ brand, is that it has been slow to
acknowledge this type of problem. For example, when ‘new-trade’
theorists criticize traditional neo-classical trade theory, they do so only in
50 In 2000, for example, for all of Chile’s remarkable export growth and (horizontal) diversification, two thirds of its exports still consisted of products that belonged to the 1963 list of ‘top-20’ OECD imports, while only 2.6% of its exports appeared in the 2000 ‘top-20’ list.
39
relation to issues such as the fact that it has ignored the possibility that a
given set of “right” prices could still generate multiple equilibria due to
uncertainties in the economic system (where decisions are taken in a
decentralized way); or because it ignores the possibility of the emergence
of several types of inefficiency in the social learning process, which in turn
could produce inefficient economic outcomes. These could occur, for
example, because the information structure is determined by the nature
and the extent of these uncertainties, the degree of communication among
agents, the pay-off relevance of the decisions to be taken and the actual
range of choices faced by the agents. In other words, in these types of
criticism of the neo-classical trade theory, ‘new trade’ theory has often
tried to identify, and give due relevance to, issues such as the social
learning process and the macro-institutional framework of the export
sector. It has put emphasis on the actual context in which agents are
supposed to learn, and on how this learning is very much determined by
the institutional context. Further, it has endogenised the learning process
to a (supposedly exogenous) institutional context, and discussed how in
this way different export paths could arise. However, the concept of an
“optimal” export path, even though more relative, is still determined by
how to maximize an export performance given present resource
endowments and a set of contemporary (more or less) “right” prices. But
it is not at all obvious how the given set of prices will signal medium- and
long-term changes in the pattern of international demand and
technological change, nor how these prices, or the supposedly ‘exogenous’
domestic institutional setting, can provide an incentive for diversification of
exports towards a flexible pattern compatible with inter-temporal
maximization of gains from specialization. In a sense, this new literature
returns to the same traditional issue of how to achieve the maximum
degree of ‘competitiveness’ given some existing domestic endowments and
current external constraints (now including market failures), but with a
much richer way of understanding the dynamics of how this could (or could
not) be achieved.
An alternative approach to international trade in DCs should promote
the idea that once agents and institutions have learnt how to deal
40
effectively in the ‘real’ international markets, there is still a need for some
vigorous agency (e.g., active trade and industrial policies) steering the
economy towards a flexible export productive capacity, which can
maximize returns from (often acquired) comparative advantages in a world
with constantly changing demand patterns and rapid technological change.
In this way, a country could attempt to maximize the trade-induced
output-growth potentials it gets from an export-led growth strategy as well
as welfare gains from international trade. As Stiglitz has repeatedly
demonstrated, markets do not necessarily lead to these sorts of efficient
outcomes by themselves.51
There are obviously many other trade-related issues that cannot be
discussed here, such as the crucial one of exhaustible resources (even for
resource-rich countries); the optimal taxation policy (“royalties”) towards
the extraction of non-renewal export-resources; FDI’s anti-Latin American
bias in the local processing of resources; the upgrading and “anchoring” of
maquila production lines; the perennial lack of innovative Schumpeterian
spirit of the Latin American oligarchy; and, in particular, the question of
why the region’s capitalist élite seem to get altitude sickness every time
private investment climbs to about 15% of GDP.
In sum, the remarkable asymmetries in terms of gains from
specialization between LA and EA (evident, for example, in the negative
and significant Latin American dummy in Figure 12 above) inevitably lead
to a question asked in the spirit of Sugar Kowalczyk (Marilyn Monroe’s
character in Some Like It Hot): why is it that in trade-related issues Latin
American countries always seem to end up with the wrong end of the
lollipop? There can be little doubt that at least one important part of the
answer is that the Latin American capitalist élite can ‘afford’ to be so risk-
averse in terms of demand-adaptation and supply-upgrading in their trade-
related business because they are as effective now (after economic
reforms) as they were before in creating structures of property rights and
incentives from which lavishly large income streams (rents) can be
51 See, for example (2002), and the introduction to this book by Dosi, Cimoli and Stiglitz.
41
generated in the domestic economy. After all, according to the World
Bank statistics, the median income share of the top 10% of income earners
in LA is currently above 45% (and increasing), while in Malaysia and
Thailand it is 35%, in India 31%, and in Korea only 25%!52
In other words, in post-reform LA the capitalist élite can ‘afford’ to
be so risk-averse in their trade-related business because they have
managed to create a political-institutional settlement in which a new
distributional coalition has succeeded in imposing a new structure of
property rights and incentives that have allowed them, and their populist
allies, extravagant forms of predatory capitalism, un-productive rent-
seeking and the economic emasculation of the state.53 And in terms of
their populist allies, one question that begs an answer is why democratic
forces in the region were so prepared to accept such a strait-jacketed type
of institutionality in exchange for the return to democracy – the democratic
forces in Chile seemed to believe that they could only defeat Pinochet in
his 1988-plebiscite if they implicitly agreed that their electoral motto would
be “Liberté, Inégalité, Passivité”.54 Another, of course, is why almost
immediately after the return to democracy did these formerly progressive
groups decide to become the new standard-bearers of the neo-liberal
orthodoxy?55
So, it seems that in their trade-related business the Latin American
52 For a comparative regional analysis of income distribution, see Palma (2003). 53 For example, the processes of privatization of public assets in the region compete in their degrees of corruption with those of post-communist Russia. At the same time, the post-reform institutional environment has created a situation in which large corporations in the real and financial sectors can exploit their monopoly power freely, and can count on unlimited bail-outs from governments when things go wrong. In this institutional environment capital can also rent-seek freely from downwardly-flexible labour markets, and can be assured that their capital flight will not only be free of regulation but will also be highly exchange-rate-subsidized (for example, foreign asset holdings by Argentinean residents at the time of the 2001 crisis amounted to about $ 100 billion; this figure was 25% higher than the whole increase in foreign debt since the first election of Menem in 1989). 54 The Latin American economic élite’s capacity to transform particularly unequal forms of income distribution achieved during repressive regimes into permanent features of society has become legendary. 55 For an analysis of these issues, see Palma (2008b).
42
capitalist élite can perfectively well ‘afford’ not to make the required
investment efforts for adaptation and upgrading, not to be Schumpeterian-
innovative, or to take the required risks, because they can count on the
fact that their (not very puritanical) share of domestic income will be so
plentiful that it will compensate for their (not very Calvinistic) attitude
towards trade-related issues. In fact, if one compares the above-
mentioned share of national income appropriated by the top 10% with the
share of private investment in GDP, LA appears even more as an outlier:
while in LA the income-share of the top decile is approximately three times
the GDP-share of private investment, in India this ratio is less than 1.5, in
Malaysia and Thailand is only slightly above one, and in Korea these shares
of income and investment are roughly the same. Perhaps this is what
really makes the discreet charm of the Latin American bourgeoisie so
unique!
43
Appendix 1
A demand-adaptability index vis-à-vis (a changing) OECD structure of
imports.
One set of statistics that can be constructed using the data provided by the
Trade-CAN software is a ‘demand-adaptability index’ of a country to the
(changing) structure of imports of the OECD (see Figure 4 and footnote 14
above). This index can give an insight into a country’s capacity to react to
changes in OECD demand for imports.
The ‘demand-adaptability index’ jA of a country ‘j’ to the structure
of OECD imports is defined here as ∑∑=ndd i
ndij
i
dijj aaA . The numerator ∑
di
dija
is the country's market share in demand-dynamic sectors (‘d’), adjusted by
the weight of demand-dynamic sectors in OECD imports; and the
denominator ∑ndi
ndija is the country's market share in non-dynamic sectors
(‘nd’), also adjusted by the share of these sectors in OECD imports.
Therefore, j
ijij S
sa = ; where
i
ijij M
Ms = is the country ‘j’ share ‘s’ in OECD
imports (‘M’) of product ‘i’ (for either ‘d’ or ‘nd’ products), and S M sj j iji
= = ∑
is the country’s total share ‘S’ in OECD imports (‘M’) – this, in turn, is the
sum of the market shares for different products ‘i’ of country ‘j’. Finally,
demand-dynamic products (‘di’) are those import products that increase
their shares in OECD imports between two points in time (such that
0≥= idi ss & ). In turn, non-dynamic products are those that decrease their
shares in total imports during this period ( 0<= indi ss & ).
44
Appendix 2
The four quadrants of Figure 10
For the export profile of a country to be located in Quadrant 1 during a
given period of time – i.e., for it to be classified as an ‘uncompetitive’
country exporting ‘non-demand-dynamic’ products during this period (e.g.,
LA in the 1960s) – its export profile should be characterized by both [Mi/M
(fy) < Mi/M (by)], and [Mij/Mi (fy) < Mij/Mi (by)]; where ‘fy’ is final year and ‘by’
is base year of this period (note that data for all years in the Trade-CAN
software are 3-year moving averages). For an export profile to be in
‘Quadrant 2’ – i.e., a ‘competitive’ country exporting ‘non-demand-
dynamic’ products (e.g., LA in the 1990s) – this profile should be
characterized by [Mi/M (fy) < Mi/M (by)] and [Mij/Mi (fy) > Mij/Mi (by)]. For it to
be in ‘Quadrant 3’ – a ‘competitive’ country exporting ‘demand-dynamic’
products (e.g., EA in the 1990s) – the conditions [Mi/M (fy) > Mi/M (by)], and
[Mij/Mi (fy) > Mij/Mi (by)] should apply. Finally, to be in ‘Quadrant 4’ – and be
an ‘uncompetitive’ country exporting ‘demand-dynamic’ products (e.g.,
Japan and the European Union in the 1990s) – a country’s export profile
should be characterized by [Mi/M (fY) > Mi/M (by)] and [Mij/Mi (fy) < Mij/Mi (by)].
45
Bibliography
Akamatsu, K (1962), ‘A Historical Pattern of Economic Growth in Developing Countries’; The Developing Economies, Issue No. 1, March –August.
Amsden, A (2001), The Rise of “the Rest”. Challenges to the West from late-industrializing economies; Oxford University Press.
Bhagwati, J (2004), ‘Testimony to the U.S. House of Representatives Committee on Financial Services Subcommittee on Domestic and International Monetary Policy, Trade and Technology’ Tuesday, April 1
Blankenburg, S, J G Palma and F Tregenna (2008), ‘Structuralism’, The New Palgrave Dictionary of Economics, 2nd Edition, Macmillan.
Capdevielle, M (2005), ‘Procesos de producción global : ¿alternativa para el desarrollo mexicano?’, Comercio Exterior, Vol 55, N 7.
Chang, H-J (1994), The Political Economy of Industrial Policy, Macmillan.
Chang, H-J (2007), Bad Samaritans: The Myth of Free Trade and the Secret History of Capitalism, Random House.
Cimoli, M (1994), Lock-in and specialization (dis)advantages in a structuralist growth model, in Fagerberg, J Von Tunzelmann, N and Verspagen, B (eds.) The Dynamics of Technology, Trade and Growth, Edwar Elgar.
Cimoli, M and N Correa (2005), ‘Trade openness and technology gaps in Latin America: a “low-growth trap”?’, in J A Ocampo (2005).
Diaz-Alejandro, C (1984), ‘Latin American Debt: I don't think we are in Kansas anymore’, Brookings Papers on Economic Activity, 2.
DiJohn, J (2008), From Windfall to Curse? Oil and industrialisation in Venezuela since 1920, Pennsylvanian State University Press.
Dosi, G, C Freeman, R Nelson, L Soete (1988), Technological change and Economic Theory, Pinter and Columbia University Press.
Dosi, G, Pavitt, K and Soete, L (1990), The Economics of Technical Change and International Trade, Harvest.
Ffrench-Davis, R., Muñoz and G. Palma (1994), ‘The Latin American Economies, 1950-1990’, Cambridge History of Latin America, 6, CUP.
Freeman, C, and L Soete (1997), The Economics of Industrial Innovation, Pinter.
Hobday, M. (2003), ‘Innovation in Asian Industrialisation: a Gerschenkronian perspective’, Oxford Development Studies, Vol. 31, No. 3, September.
Kahn, M (2000), ‘Rent-seeking as Process’, in Khan, M, and Jomo, KS (eds.), Rents, Rent-Seeking and Economic Development: Theory and Evidence in Asia, CUP.
Krugman, P (1997), Pop Internationalism; MIT Press.
Marcel, M and J G Palma, (1988), ‘Third World debt and its effects on the British economy: a Southern view on economic mismanagement in the North’, Cambridge Journal of Economics, September.
Mayer, Jorg (2003), ‘The fallacy of composition: A review of the literature’, UNCTAD Discussion Papers 166, February.
McKay, J (2002), Export Structures in a Regional Context and the Flying Geese Paradigm; Ph D Thesis, University of Cambridge.
Moguillansky, G (1999), La Inversión en Chile: ¿el fin de un ciclo en expansión?;
46
Fondo de Cultura Económica – CEPAL.
Moreno-Brid, J C, J Santamaría, and J C Rivas Valdivia (2005), ‘Industrialization and Economic Growth in Mexico after NAFTA: The Road Traveled’, Development and Change, December.
Ocampo, J A and M A Parra (2004), ‘The commodity terms of trade and their strategic implications for development’; ECLAC, mimeo.
Ocampo, J A and M A Parra (2006), The dual divergence: growth successes and collapses in the developing world since 1980, DESA, mimeo.
Ocampo, J A (2004), ‘LA in the long 20th Century’, UN, mimeo.
Ocampo, J A (2005), Beyond Reforms, Structural Dynamics and Macroeconomic Vulnerability, Stanford University Press, ECLAC and World Bank.
Palma, J G (1998), ‘Does it make a difference to export micro-chips rather than potato-chips? Comparing export structures in East Asia and Latin America', UNCTAD.
Palma, J G (2003), ‘National inequality in the era of globalisation: what do recent data tell us?’, in J Michie (ed.), Handbook of Globalisation, Edward Elgar.
Palma, J G (2004), ‘Latin American during the second half of the 20th Century: from the ‘age of extremes’ to the age of ‘end-of-history’ uniformity’, in H-J Chang, Rethinking Development Economics, Anthem Press.
Palma, J G (2005a), ‘The six main ‘stylised facts’ of the Mexican economy since trade liberalisation and NAFTA’, Journal of Industrial and Corporate Change, December.
Palma, J G (2005b), ‘Four sources of de-industrialisation and a new concept of the Dutch Disease', in J A Ocampo (2005).
Palma, J G (2006), ‘Stratégies actives et stratégies passives d’exportation en Amérique Latine et en Asie orientale. La croissance en tant que phénomène spécifique á la composition de produit et spécifique aux institutions’, Revue Tiers Monde, N. 186.
Palma, J G (2008a), ‘Raúl Prebisch’, The New Palgrave Dictionary of Economics, 2nd Edition, Macmillan.
Palma, J G (2008b), ‘Why did the Latin American critical tradition in the social sciences become practically extinct?, in M Blyth (ed.), The Handbook of International Political Economy, Routledge.
Pérez, C. (2002), Technological Revolutions and Financial Capital, Elgar.
Pérez, C. (2008), ‘A vision for Latin America: a resource-based strategy for technological dynamism and social inclusion’, ECLAC.
Pesaran H, N U Haque and S Sharma (2000), ‘Neglected heterogeneity and dynamics in cross-country savings regressions’, in J Krishnakumar and E Ronchetti, (eds.) Panel Data Econometrics - Future Direction, Elsevier Science.
Lagos, J. F. (2000), Chile, de Exportador de Cobre Refinado a Gran Exportador de Concentrados: ¿la segunda fase exportadora?, mimeo, Santiago de Chile.
Stiglitz, J (2004), ‘The Free Trade Agreement between Chile and the US’, mimeo.
Stiglitz, J (2002), Globalization and its Discontent; Penguin.
Teece, D (1996), Strategy, Technology and Public Policy: The Selected Papers of David Teece, Vol. 2, Edward Elgar.
Trade-CAN (2005), Competitive Analyses of Countries; ECLAC-World Bank.
47
Trần Văn Thọ, Nguyễn Ngọc Đức, Nguyễn Văn Chỉnh, Nguyễn Quán (2000), The Vietnamese Economy 1955-2000. New Calculations and New Analyses, Statistical Publishing House - Hanoi.
Tregenna, F (2006), ‘Towards a new understanding of Botswana’s growth experience’, paper presented at the AEA meeting, Boston, January.
UNCTAD (1996), Trade and Development Report, Geneva.
Walker, M (2003), ‘Resource-based industrialisation strategies: lessons from the developed world experience’, mimeo.
WDI (2007), World Bank, World Development Indicators.