Palm Biodiesel Industry- Navigating through the Storm. Plenary 1 UR Unnithan...Presentation Outline...
55
PRIVATE & CONFIDENTIAL Palm & Lauric Oils Price Outlook Conference & Exhibition 2018 Mar 5-7, Kuala Lumpur Palm Biodiesel Industry- Navigating through the Storm. U.R. Unnithan, SUMWIN Group
Transcript of Palm Biodiesel Industry- Navigating through the Storm. Plenary 1 UR Unnithan...Presentation Outline...

PRIVATE & CONFIDENTIAL
Palm & Lauric Oils Price Outlook Conference & Exhibition 2018 Mar 5-7, Kuala Lumpur
Palm Biodiesel Industry- Navigating through the Storm.
U.R. Unnithan, SUMWIN Group

Presentation Outline
1. Head Winds facing the Palm Biodiesel industry
2. Global Energy Outlook
3. Renewables in the energy mix
4. Global Biodiesel scenario
5. Palm Biodiesel update for Indonesia and Malaysia
6. Updates on B10 testing in Malaysia
7. Economics for Biodiesel in Malaysia and Indonesia
8. Conclusion and Palm Price Outlook
2

Head Winds Facing the Palm Biodiesel Industry.
1. EU ban on Palm Oil for Biodiesel.
2. Demand for a new common Sustainability Standard in EU.
3. American RFS2 approval still a dream.
4. Lack of Political will in Asia for Biofuel Mandates.
5. Low Crude Oil prices
3

EU BAN ON PALM OIL FOR BIOFUELS
4

5
The general perception of the MEP Resolution...
An example of what the Press (Guardian) says

6
EU parliament’s Environment Committee and Research & Energy Committee proposed a ban on Palm oil for Biofuel on Jan 17, 2018 • 492 MEPs voted in favour • 88 MEPs voted against • 107 MEPs abstentions U.K MEPs voted against the ban in view of inflationary effect on food prices and economic damage to developing countries Spain has come out against the ban as it Is a big user of Palm Oil for Biodiesel in EU.

7

8 SOURCE: MPOC

Malaysia’s Response
• MITI Minister YBM Datuk Mustafa: ban is “ potential violation of WTO Rules”
• MPIC Minister YBM Mah: ban is “ akin to Crop Apartheid”
• 650,000 small holders in Malaysia up in arms against the ban
9

10

11
Double Standards- Palm is banned by 2021 but other Food Crops can be used till 2030
• 46 % of total palm oil imported by the EU is used for the production of biofuels. • This is estimated to use of about one million hectares of tropical area. • Palm has a yield/hectare that is 10 times more than Soy and 4 times that of Rapeseed. Where is EU going to find this land to fill the void? • UK Conservative party MEP said “ The reality is that this is a vote driven by interests of Rapeseed producers here in Europe specifically the biofuels industry at home

12
• Palm Cultivation done responsibly and sustainably can deliver positive contributions to the economic development of farmers in developing countries. • The view is that the existence of different schemes RSPO, ISPO and MSPO is confusing for consumers. • The ultimate objective should be the development of a single certification scheme, which would improve the visibility of sustainable palm oil for consumers • Question is : What is the effectiveness of a sustainability standard like ISCC that all Palm Biofuel producers have been using for exports to EU

13
What does RED II say about this?
“Member States may … distinguish between different types of biofuels, bioliquids, and biomass fuels produced from food and feed crops, for instance by setting a lower limit for the contribution from food or feed crop based biofuels produced from oil crops, taking into account indirect land use change”. • Most affected would be Palm Biodiesel • This means that each individual EU Government would have the ability to pick and choose limits for different types of biofuels- Palm Oil needs friends in the EU.

Global Energy outlook
• World GDP more than doubles by 2040.
• Global energy demand is predicted to rise by 33% in the next 25 years.
• China and India will account for half of the growth in global energy demand.
• Renewable Energy is the fastest growing energy source accounting for 40% of the increase in primary energy.
• Liquid biofuels constitute only about 4.1% of the total Renewable energy
14

-
0.5%
0.0
%
0.5
%
1.0
%
1.5
%
2.0
%
2.5
%
3.0
%
2030-
40
Other EU
Africa
Middle
East Other
Asia India
China
1985-2000 2000-15 2015-
30 *Industry excludes non-combusted use
of fuels
0
1
2
3
4
5
6
1990 2000 2010 2020 2030 2040
Electricity
Gas
Oil Coal
Sectors:
Industry
2018 BP Energy
Outlook
Growth in final energy consumption
in industry* by region
% per annum
Final energy consumption
in industry* by fuel
Billion toe
15

350
300
250
200
150
100
50
0
-50
-
100
India
China
Other non-
OECD OECD
Total
0.
0
0.
5
1.
0
1.
5
2.
0
2.
5
3.
0
3.
5
2000 2010 2020 2030 2040
Other*
Electricity
Gas
Oil
Transport demand continues to be dominated by oil…
Transport energy consumption by fuel type
Billion toe
Transport energy consumption
growth by region
Mtoe
*Other includes biofuels, gas-to-liquids, coal-to-liquids,
hydrogen 2018 BP Energy Outlook 16
2000- 2005- 2010- 2015- 2020- 2025- 2030- 2035-
2005 2010 2015 2020 2025 2030 2035 2040

0%
15%
30%
45%
60%
0%
2%
4%
6%
8% GDP
Other sectors
Industry*
Primary energy
India emerges as the largest growth market for global energy...
Oi
l
Coa
l
Ga
s
Renewable
s
1990-2016 2016-2040
*Excludes non-combusted fuels
2018 BP Energy Outlook 17
Other fuels
1990 2000 2010 2020
2030 2040
Growth of GDP and primary energy Shares of primary energy
% per annum

RENEWABLES IN THE MIX
18

0
5
1
0
1
5
2
0 Othe
r Africa
Other Asia
India
China
OEC
D
The energy transition…
*Industry excludes non-combusted use of fuels
0
5
1
0
1
5
2
0 Renewables
Hydro
Nuclear
Coal
Gas
Oil
Billion toe
0
5
1
0
1
5
2
0 Transport
Industry*
Non-combusted
Buildings
Primary energy demand
End-use sector Region Fuel
2018 BP Energy Outlook
19

India &
Other Asia
Differences in the fuel mix across regions...
0
1
2
3
4
201
6
20
40
201
6
204
0
201
6
204
0
20
16
204
0
201
6
204
0
Coa
l Oil
Gas
Hydro
Nuclear
Renewable
s
US EU China Middle
East
5
-400
-200 0 200 400 600 800
China India
China Other
Asia
Middle East
China India
US
India EU
Changes 2016-2040† by
fuel and region Primary energy demand by fuel and region Billion toe Mtoe
Renewables
Gas
Gas
Nuclear
Oil
Renewables
Renewables
Renewables
Coal
Oil
Coal
Oil
Coal
Coal
Coal
†Ten largest increases and five largest declines
China
2018 BP Energy Outlook
US
EU
US
EU
20

GLOBAL BIODIESEL SCENARIO
21

BIODIESELand HVO: World Production ( Mn T )
J a n u a r y / D e c e m b e r
2017 2016 2015 2014 2013
EU-28 . . . . . 12.90* 12.61 12.41 12.29 10.71
U.S.A. . . . . . 6.10 6.21 4.72 4.80 4.77
Argentina . . . 2.80* 2.66 1.81 2.58 2.00
Brazil . . . . . . 3.75 3.33 3.46 3.00 2.56
Colombia . . . .53* .51 .51 .52 .50
Singapore . . 1.05* .99 .87 .80 .81 Indonesia. . . 2.95* 3.18* 1.22 2.92 2.60
Malaysia . . . .72 .51 .67 .60 .47
Thailand. . . . 1.33* 1.16* 1.14 1.04 .94 Oth. ctries.. . 3.06* 2.95* 2.89* 2.94* 2.65*
Total . . . . . . 35.19* 34.13 29.70 31.49 28.01
Change in ( Mn T )
+1.06* 4.43 -1.79 +3.48 +3.33
Source: ISTA Mielke, Feb 2018 – www.oilworld.de
22

2005 2007 2009 2011 2013 2015 2017
0
5
10
15
20
25
30
35
40
Biodiesel & HVO: World Production (Mn T)
Source: ISTA Mielke, Feb 2018 – www.oilworld.de
23

BIODIESEL Global Production
Quantity, MT
Share of Global Biodiesel
Production
PME 10.75 million 30.55%
SME 9.29 million 26.4%
RME 7.33 million 20.83%
TME 2.44million 6.93%
ALL BIODIESEL 35.19 million
Biodiesel production by Feedstock 2017
24

2008 2009 2010 2011 2012 2013 2014 2015 2016 2017
0
5
10
15
20
25
30
35
40 others
used oils
tallow
rape oil
palm oil
soya oil
Biodiesel Use of Major Feedstock (Mn T)
Source: ISTA Mielke, Feb 2018 – www.oilworld.de
25
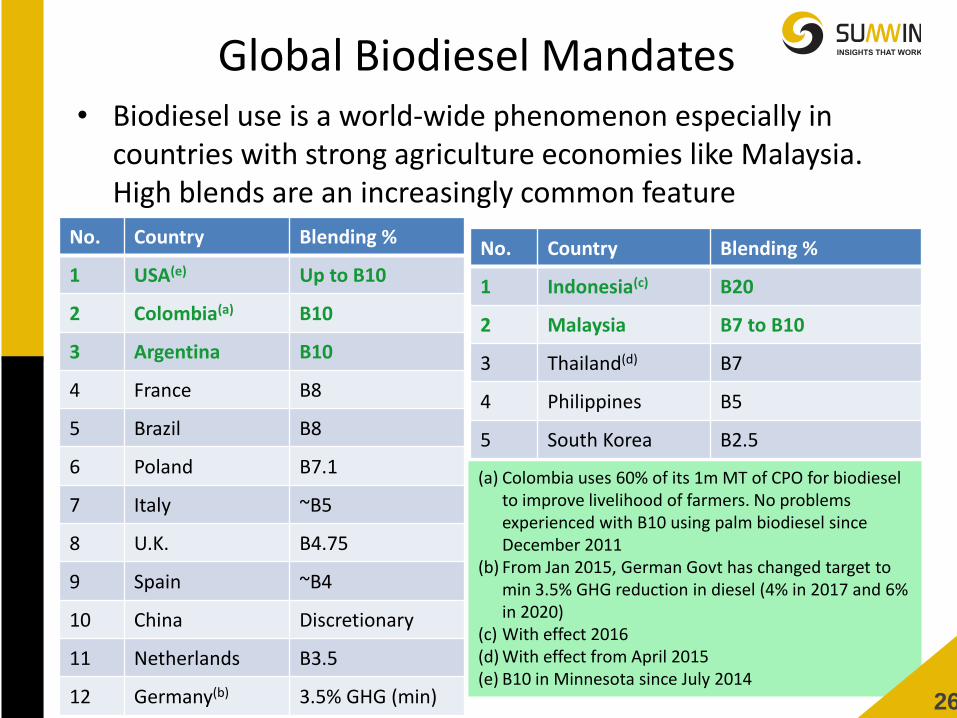
Global Biodiesel Mandates • Biodiesel use is a world-wide phenomenon especially in
countries with strong agriculture economies like Malaysia. High blends are an increasingly common feature
No. Country Blending %
1 USA(e) Up to B10
2 Colombia(a) B10
3 Argentina B10
4 France B8
5 Brazil B8
6 Poland B7.1
7 Italy ~B5
8 U.K. B4.75
9 Spain ~B4
10 China Discretionary
11 Netherlands B3.5
12 Germany(b) 3.5% GHG (min)
No. Country Blending %
1 Indonesia(c) B20
2 Malaysia B7 to B10
3 Thailand(d) B7
4 Philippines B5
5 South Korea B2.5
(a) Colombia uses 60% of its 1m MT of CPO for biodiesel to improve livelihood of farmers. No problems experienced with B10 using palm biodiesel since December 2011
(b) From Jan 2015, German Govt has changed target to min 3.5% GHG reduction in diesel (4% in 2017 and 6% in 2020)
(c) With effect 2016 (d) With effect from April 2015 (e) B10 in Minnesota since July 2014
26

BIODIESEL IN MALAYSIA AND INDONESIA
27

From Concept to Commercialization (1981-2006)
1981-1984
MPOB Starts palm biodiesel project, constructs first pilot plant
1984-1994
Palm biodiesel trials in taxis/buses
2000-2002
First commercial palm biodiesel pilot plant at Carotino
2006
First commercial palm biodiesel plant at Carotino
2008 Establishment of MBA
Source: MPOB
The MPOB began R&D into palm biodiesel from the early 1980s – constructing pilot plants and conducting vehicle engine trials
The first commercial palm biodiesel plant was built at Carotino with MPOB technology
28

Malaysian Biodiesel Mandate (2006-Present)
2008
Biofuel Industry Act 2007 comes into force
2011 Rollout of B5 Programme
2014 (November) Launch of B7
2018?
Launch of B10?
29

Total investments in the Malaysian biodiesel industry estimated about RM 2.2 billion
Total installed capacity is 2.1 million tonnes (based on MBA members’ capacity-17 members)
National Biodiesel mandate since 2011
Source: MPIC & MPOB
Malaysian Biodiesel Statistics
Years
Biodiesel [PME]
Production
Quantity
(MT)
Biodiesel [PME]
Export Quantity
(MT)
Biodiesel Blended
locally
(MT)
2008 171,555 102,108
2009 222,217 227,457
2010 117,173 89,609
2011 173,220 49,999 20,343
2012 249,213 28,983 113,276
2013 472,129 175,032 185,039
2014 600,524 87,856 295,451
2015 763,532 178,942 382,000
2016 500, 857 83,581 350,000
2017 720,410 235,291 358,586
30

Export Boom → Bust → Local Consumption
Source: MPOB
Period I Period II Period III Period IV
Domestic Growth
31

Domestic Consumption Dominates
Period I Period II Period III Period IV
32

Biodiesel is Going Local
Source: MPOB, MEMR, USDA, *2016 includes Malaysian local consumption figure estimate by author
33
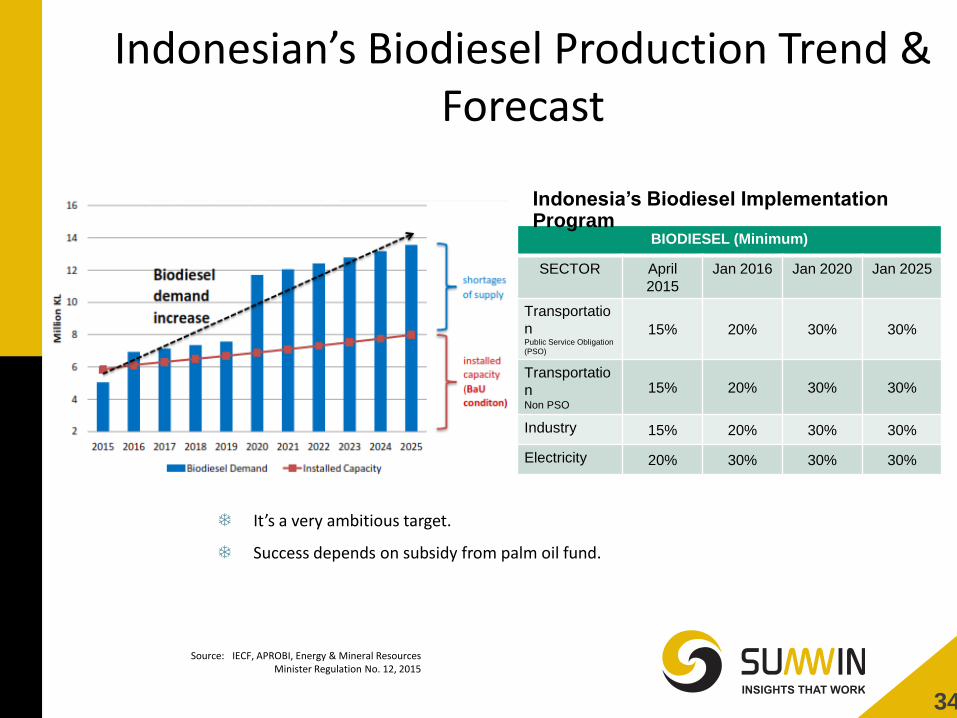
Indonesian’s Biodiesel Production Trend & Forecast
Source: IECF, APROBI, Energy & Mineral Resources Minister Regulation No. 12, 2015
BIODIESEL (Minimum)
SECTOR April
2015
Jan 2016 Jan 2020 Jan 2025
Transportatio
n Public Service Obligation
(PSO)
15% 20% 30% 30%
Transportatio
n Non PSO
15% 20% 30% 30%
Industry 15% 20% 30% 30%
Electricity 20% 30% 30% 30%
It’s a very ambitious target.
Success depends on subsidy from palm oil fund.
Indonesia’s Biodiesel Implementation Program
34

Indonesian’s Biodiesel Roadmap
Source: IECF, 2015
By 2020, 26% of Indonesia’s CPO is targeted for use in Biodiesel
35

Indonesian Government Policies on Energy Mix, Biodiesel Program & NDC
Coal
29.40
%
Oil
41.40
%
Renewable Energy
2025 2050
23% 31%
Bioenergy
10% 14%
2014
B5
2006
B10
B15
B20
2016
B30
2020
Biodiesel Mandatory Program
Indonesia,
Nationally Determined
Contributions UNFCCC
2020 2030
26% 29%
GO
VE
RN
ME
NT
PO
LIC
IES
& R
EG
UL
AT
ION
S
36
Source : APROBI

Indonesian Biodiesel Facts 2016
B20 Domestic Utilization
3 M kl/ 18.867 m barrel
Upstream sector Workforce
297,000
Greenhouse Gas Emissions Saving
8.03 M Ton (-15%) CO2 eq
Exporting Capabilities 2016
8.2 Mil Ton
Sources, APROBI
BIO
DIE
SE
L F
AC
T &
CO
NC
LU
SIO
NS
37

38
Updates on B10 & B20 testing in Malaysia

Breakdown of brand of vehicles in B10 Project
Model Type No. of Vehicles Engine Maker
Mitsubishi 4 wheel drive 5 Japan
Ford 4 wheel drive 3 USA
Toyota 4 wheel drive 9 Japan
Hyundai 4 wheel drive 1 Japan
Ssangyong 4 wheel drive 1 Korea
Mercedes Benz Passenger 1 Germany
Peugeot Passenger 5 Germany
Total 25
39 Source : MPOB

B10 and B20 MPOB Vehicles • Update as of June 2017:
Consumption of B10 & B20: 400,000 Litres
The total mileage covered: 2,149,200 km (min: 5,000 km; average: 90,000 km; max: 170,000 km)
• Findings:
No problem has been reported by drivers
Normal vehicle services have been carried at recommended service interval with no specific issues.
No signs of drop in engine performance.
40
Source : MPOB

41

B10 with Kuala Lumpur City Hall
• Started in February 2014 • As of June 2017: • Consumption: 282,227 liters • Normal vehicles: 1,219,211 km • Machineries: 5,917 hours • Findings: i. Service and Maintenance Follow the recommended service interval with no technical issues. ii. Monitoring and testing Quality of B10 Collection of Data on Mileage Visual Inspection of Oil and fuel Filter Lube Oil Analysis
42 Source : MPOB

B10 with Kuala Lumpur City Hall
43
Source : MPOB
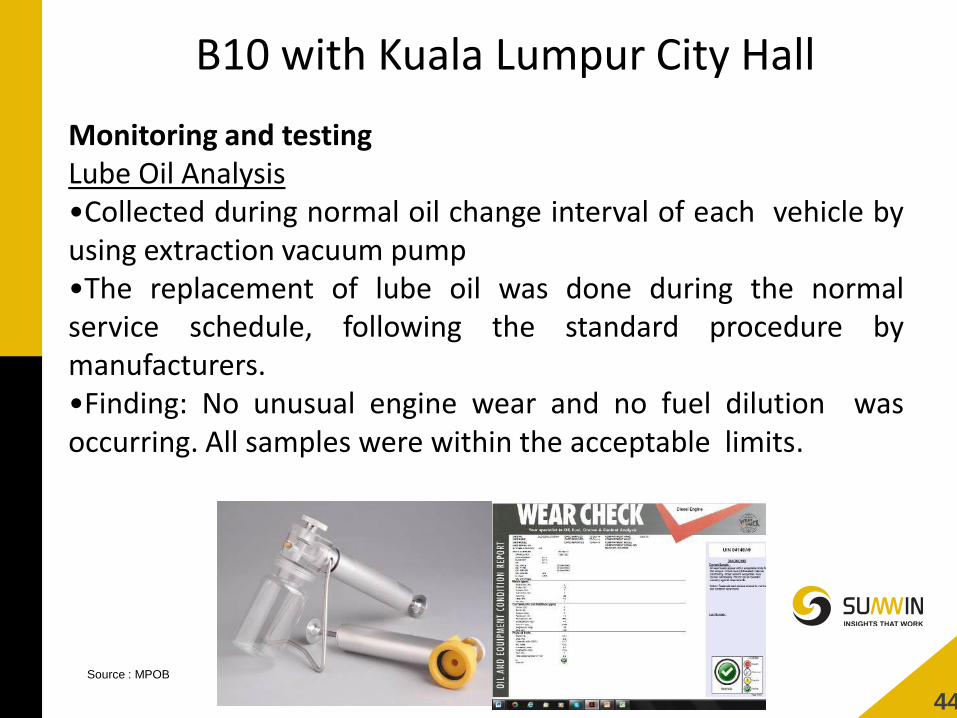
B10 with Kuala Lumpur City Hall
Monitoring and testing Lube Oil Analysis •Collected during normal oil change interval of each vehicle by using extraction vacuum pump •The replacement of lube oil was done during the normal service schedule, following the standard procedure by manufacturers. •Finding: No unusual engine wear and no fuel dilution was occurring. All samples were within the acceptable limits.
44
Source : MPOB

Findings of the recommended test: i. The exhaust emissions test: Nissan Navara and Nissan UD Truck LKA211N complied with the maximum opacity limit set by DOE. ii. Injector diagnostic test: The injector of Nissan Navara (WXK 3673) was in normal working condition after running 60,000 km. iii.Compression test: Compression pressures for six (6) engine cylinders of Nissan UD truck LKA211N were within standard specification and no excessive wear and tear noticed after running 100,000 km.
Engine Assessment
45

Report on Injector and Emission Test for 2 DBKL vehicles
(60,000km and 100,000km) in April – May 2017
Smoke test by Department of Environment (DOE)
Diagnostic test by Nissan Group Compression test by Nissan Group
46 Source : MPOB

Driver Survey
Estimated performance for vehicle using B10
Most of the respondents agreed that B10 is giving more power, more
pick-up, less noise, no engine jerking, less engine maintenance and
service, lower the engine temperature, less tailpipe emission and lower
fuel consumption as compared to normal diesel.
47 Source : MPOB

Conclusion (DBKL)
• B10 does not cause any problem to the engine of
vehicle and machinery
• B10 does not affect daily operations and
maintenance costs.
48 Source : MPOB

• Energy security – reducing dependency on foreign imported fuel
• GHG reduction – helping to meet the national target. GHG reduction is also a KPI for industries in improving its image in export markets
• No subsidies required (if B10 is built into formula pricing)
• The cost effectiveness of biodiesel would be even better as Malaysia moves to more stringent Euro 5 standard for diesel with 10 ppm sulfur. Here, palm biodiesel will further improve lubricity at lower sulfur levels (hence saving on an additional lubricity additive which would raise the price of ULSD)
• Create additional demand for CPO and its likely positive price impact
Benefits of B10
49

ECONOMICS FOR BIODIESEL IN MALAYSIA AND INDONESIA
50
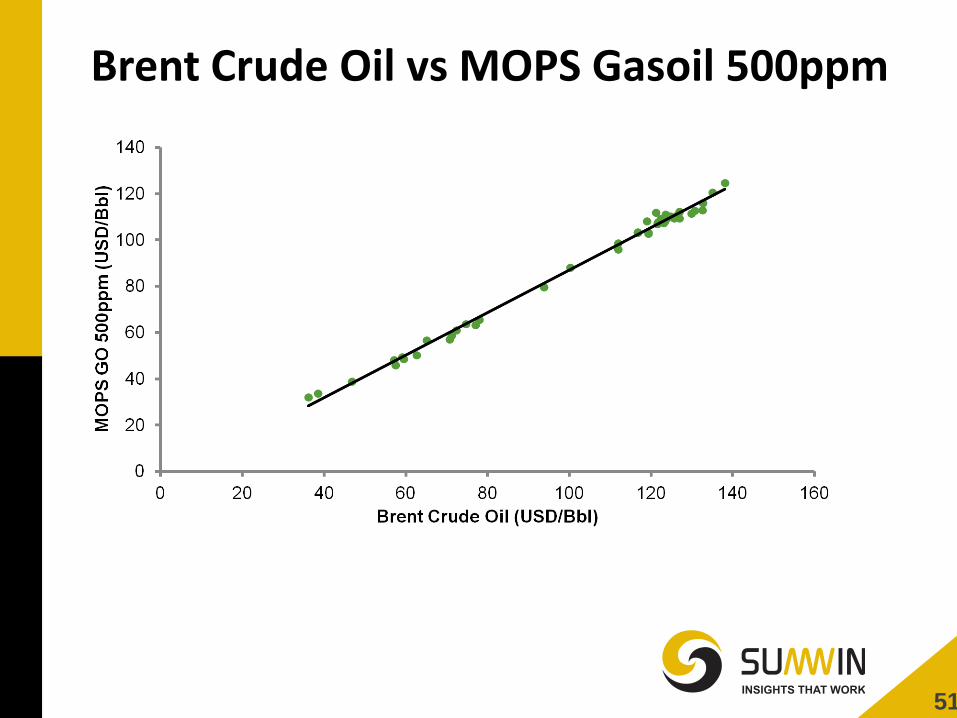
Brent Crude Oil vs MOPS Gasoil 500ppm
51

Brent
Crude
(USD/Bbl)
MOPS GO
500ppm
(USD/MT)
MOPS
GO 500
ppm
(MYR/L)
APM Formula
Malaysian
Retail EURO2
Diesel
(MYR/L)
Additional
Cost
(MYR/L) for
APM
Formula
Malaysian
Retail
EURO5
Diesel
(MYR/L)
B7 B10
25.00 244.29 0.79 1.02 0.11 0.17 1.12
30.00 284.70 0.92 1.15 0.11 0.15 1.25
35.00 325.10 1.05 1.28 0.10 0.14 1.38
40.00 365.51 1.19 1.42 0.09 0.13 1.52
50.00 446.33 1.45 1.68 0.07 0.10 1.78
60.00 527.15 1.71 1.94 0.05 0.08 2.04
70.00 607.97 1.97 2.20 0.03 0.05 2.30
80.00 688.78 2.23 2.46 0.02 0.02 2.56
CPO = RM2500/MT
PME = RM2.70/L
Exchange Rate 3.91
Retail price of Diesel will increase by MYR0.26/L for every USD10/bbl increase in Crude Oil price.
Until Nov 2014, subsidized diesel retail price in Malaysia was already at MYR2.1/L
Economics for Biodiesel Mandate in Malaysia
52
Malaysian retail price of Diesel in March 2018 is MYR2.18/L

Indonesia’s Biodiesel Support Fund
1. Biofuels Business Entities supply biodiesel to Pertamina / PT ANEKA KIMIA RAYA (AKR). 2. Pertamina / AKR will pay for the Biodiesel based on the Diesel Fuel Market Price Index
assigned by the Director General of Oil and Gas, Ministry of Energy and Mineral Resources.
3. Ministry of Energy and Mineral Resources cq DG EBTKE verify the delivery of Biodiesel from Biofuels Business Entities to Pertamina / AKR
4. IECF will disburse the Biodiesel financing funds based on the verification results. 5. Biodiesel Support Funds = The difference between the Market Price Index of Biodiesel
and Diesel Fuel Market Price Index determined by the Ministry of Energy and Mineral Resources.
6. As of December 2015, IECF disbursed 460 billion Rupiah.
Source: IECF, 2015
March 2016
53

Conclusions & Price Outlook
1. The EU ban on Palm Oil in Biofuel from 2021 will affect overall sentiment but unlikely to affect Price of CPO in 2018.
2. Protectionist policies from EU & US will restrict exports of PME.
3. The lifting of the Anti-dumping duties on Biodiesel exports from Indonesia and Argentina will lead to much higher Biodiesel exports in 2018.
4. 2018 could see an increase in mandates in Malaysia( B7 to B10) after the General Elections.
5. With Palm production picking up from the 2nd half of the year could see a drop in Palm Oil prices resulting in lower POGO spreads will provide support for the Indonesian B20 & Malaysian B10
6. On Balance, I see Palm Oil price not likely to drop below RM 2300 in 2018 and might average about RM 2450 in 2018.
54

Suite No. 3, Business Wing,X-Sentral within Bio-XCell Biotechnology Park No.2, Jalan Bioteknologi 1, Kawasan Perindustrian SiLC
79200 Iskandar Puteri, Johor, Malaysia
SUMWIN SOLUTIONS MALAYSIA SDN BHD
www.sumwinglobal.com Office: +607 300 5132/33 Fax:- +607 300 5130
THANK YOU