Palestinian National authority Palestinian Central Bureau of
38
Palestinian National authority Palestinian Central Bureau of Statistics Performance of Palestinian Economy, 2010 May, 2011
Transcript of Palestinian National authority Palestinian Central Bureau of
Palestinian National authority
Palestinian Central Bureau of Statistics
Performance of Palestinian Economy, 2010
May, 2011
© May, 2011.
All Rights Reserved
Suggested Citation: Palestinian Central Bureau of Statistics, 2011. Performance of Palestinian Economy, 2010. Ramallah – Palestine.
All correspondence should be directed to: Palestinian Central Bureau of Statistics P.O. Box 1647, Ramallah, Palestine.
Tel: (970/972) 2 298 2700
Fax: (970/972) 2 298 2710
Toll Free: 1800300300
E-Mail: [email protected]
Website: http://www.pcbs.gov.ps
This document is prepared in accordance with the standard procedures stated in the Code of Practice for Palestine Official
Statistics 2006
Work Team
Report Preparation
Mohammad Qalalwa
Mohannad Hamayel
Dissemination Standards Hanan Janajreh
Preliminary Review Saleh Kafri
Ibrahim Tarshah
Husam Kalifa
Faed Ryan
Hani Al-Ahmed
Jawad Saleh
Mahmoud Al-Quia
Final Review Mahmoud Jaradat
Overall Supervision
Ola Awad President of PCBS
Preface
The Palestinian central Bureau of Statistics (PCBS) has devoted great efforts to consolidate main economic indicators such as GDP, labor market, prices, poverty, Balance of Payments, government and private sectors, building licenses and tourism into one report that reflect the performance of the Palestinian economy. The report will serve the instrumental needs of businesses and their organizations for statistical information on states and trends. The rich content of this report facilitates measurement, comparison and further economic analysis.
PCBS is pleased to issue the first release of the report on the performance of the Palestinian Economy in the Palestinian Territory for 2010. The report sheds light on main economic indicators for 2010 in addition to comparisons with 2009 to reflect on changes and variations pertaining to the economic conditions in the Palestinian Territory.
PCBS hopes that the findings of this report will provide comprehensive picture about the characteristics and performance of the Palestinian Economy to assist researchers and decision makers in the analysis, planning and development of the Palestinian Economy.
May, 2011
Ola Awad
President of PCBS
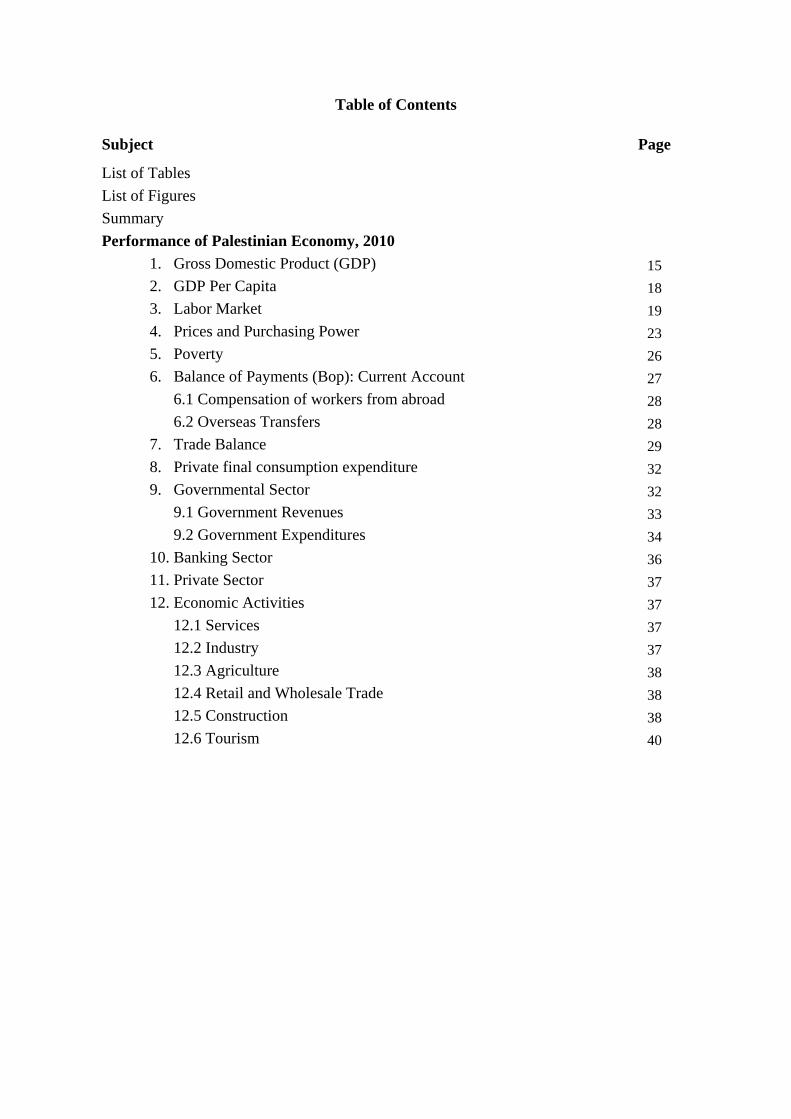
Table of Contents
Subject Page
List of Tables List of Figures Summary Performance of Palestinian Economy, 2010
1. Gross Domestic Product (GDP) 15 2. GDP Per Capita 18 3. Labor Market 19 4. Prices and Purchasing Power 23 5. Poverty 26 6. Balance of Payments (Bop): Current Account 27
6.1 Compensation of workers from abroad 28 6.2 Overseas Transfers 28
7. Trade Balance 29 8. Private final consumption expenditure 32 9. Governmental Sector 32
9.1 Government Revenues 33 9.2 Government Expenditures 34
10. Banking Sector 36 11. Private Sector 37 12. Economic Activities 37
12.1 Services 37 12.2 Industry 37 12.3 Agriculture 38 12.4 Retail and Wholesale Trade 38 12.5 Construction 38 12.6 Tourism 40
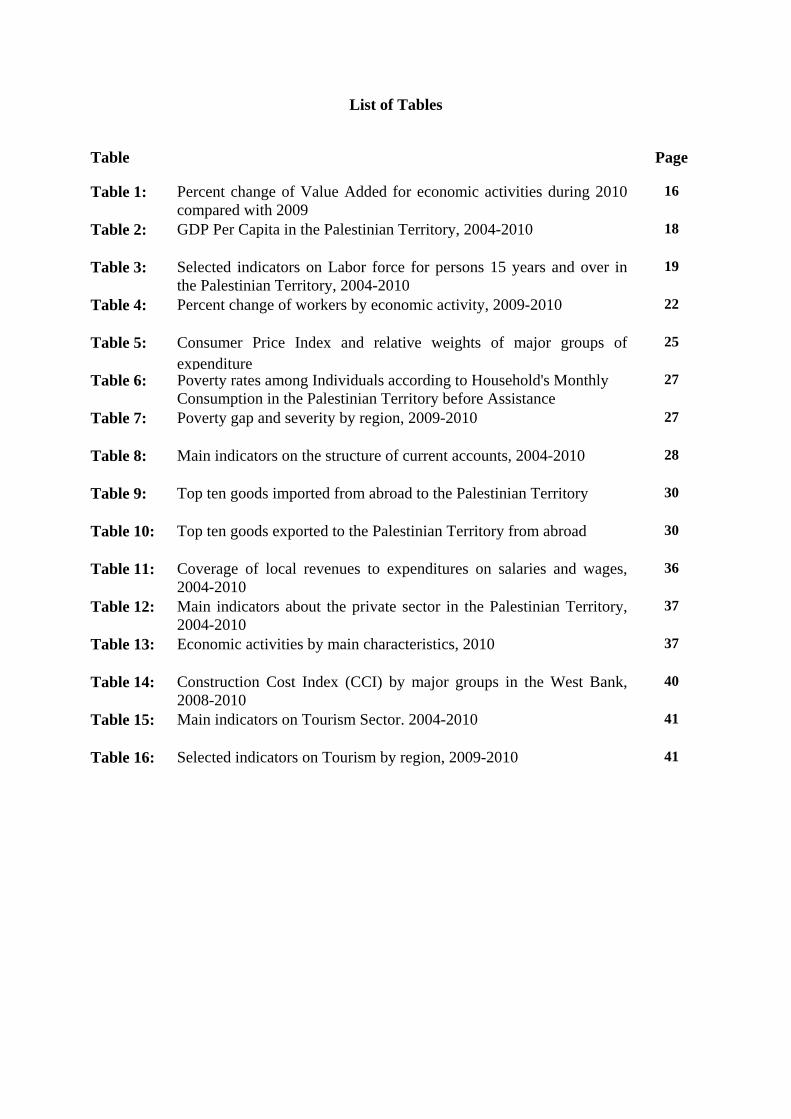
List of Tables
Table Page
Table 1: Percent change of Value Added for economic activities during 2010 compared with 2009
16
Table 2: GDP Per Capita in the Palestinian Territory, 2004-2010 18
Table 3: Selected indicators on Labor force for persons 15 years and over in the Palestinian Territory, 2004-2010
19
Table 4: Percent change of workers by economic activity, 2009-2010 22
Table 5: Consumer Price Index and relative weights of major groups of expenditure
25
Table 6: Poverty rates among Individuals according to Household's Monthly Consumption in the Palestinian Territory before Assistance
27
Table 7: Poverty gap and severity by region, 2009-2010 27
Table 8: Main indicators on the structure of current accounts, 2004-2010 28
Table 9: Top ten goods imported from abroad to the Palestinian Territory 30
Table 10: Top ten goods exported to the Palestinian Territory from abroad 30
Table 11: Coverage of local revenues to expenditures on salaries and wages, 2004-2010
36
Table 12: Main indicators about the private sector in the Palestinian Territory, 2004-2010
37
Table 13: Economic activities by main characteristics, 2010 37
Table 14: Construction Cost Index (CCI) by major groups in the West Bank, 2008-2010
40
Table 15: Main indicators on Tourism Sector. 2004-2010 41
Table 16: Selected indicators on Tourism by region, 2009-2010 41
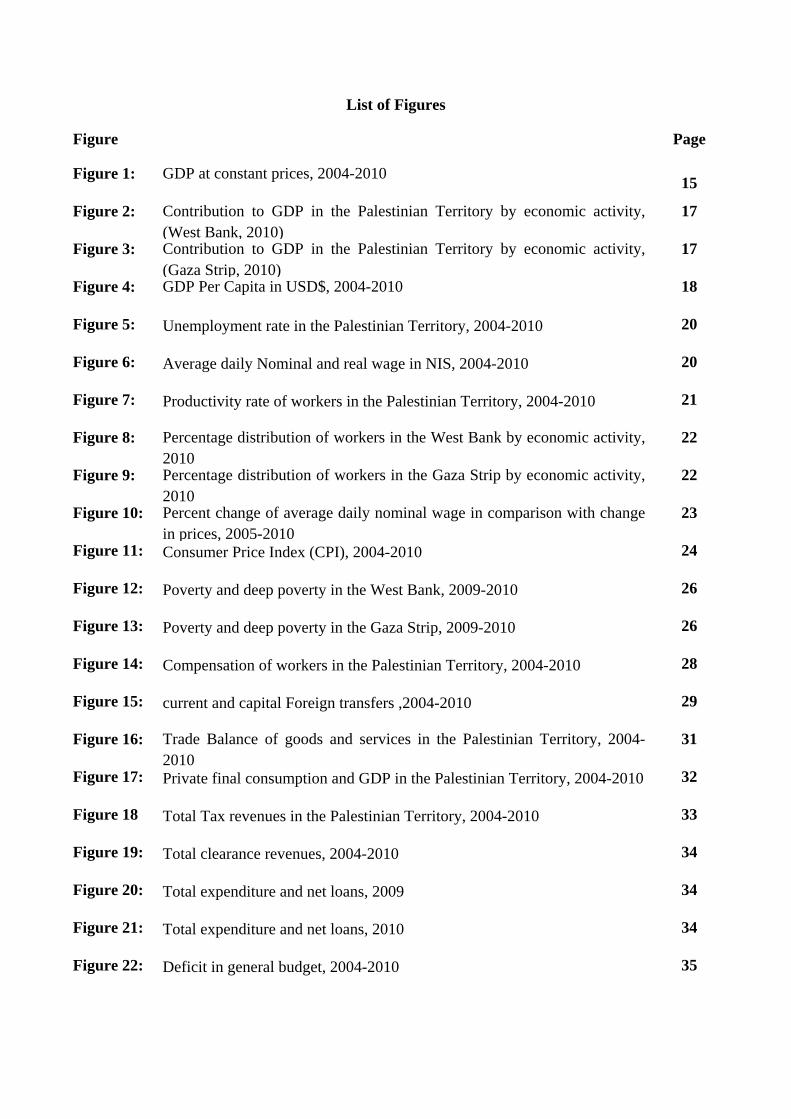
List of Figures
Figure Page
Figure 1: GDP at constant prices, 2004-2010 15
Figure 2: Contribution to GDP in the Palestinian Territory by economic activity, (West Bank, 2010)
17
Figure 3: Contribution to GDP in the Palestinian Territory by economic activity, (Gaza Strip, 2010)
17
Figure 4: GDP Per Capita in USD$, 2004-2010 18
Figure 5: Unemployment rate in the Palestinian Territory, 2004-2010 20
Figure 6: Average daily Nominal and real wage in NIS, 2004-2010 20
Figure 7: Productivity rate of workers in the Palestinian Territory, 2004-2010 21
Figure 8: Percentage distribution of workers in the West Bank by economic activity, 2010
22
Figure 9: Percentage distribution of workers in the Gaza Strip by economic activity, 2010
22
Figure 10: Percent change of average daily nominal wage in comparison with change in prices, 2005-2010
23
Figure 11: Consumer Price Index (CPI), 2004-2010 24
Figure 12: Poverty and deep poverty in the West Bank, 2009-2010 26
Figure 13: Poverty and deep poverty in the Gaza Strip, 2009-2010 26
Figure 14: Compensation of workers in the Palestinian Territory, 2004-2010 28
Figure 15: current and capital Foreign transfers ,2004-2010 29
Figure 16: Trade Balance of goods and services in the Palestinian Territory, 2004-2010
31
Figure 17: Private final consumption and GDP in the Palestinian Territory, 2004-2010 32
Figure 18 Total Tax revenues in the Palestinian Territory, 2004-2010 33
Figure 19: Total clearance revenues, 2004-2010 34
Figure 20: Total expenditure and net loans, 2009 34
Figure 21: Total expenditure and net loans, 2010 34
Figure 22: Deficit in general budget, 2004-2010 35

Figure Page
Figure 23: External support, 2004-2010 36
Figure 24: Issued building licenses in the West Bank, 2004-2010 39
Figure 25: Issued building licenses in the West Bank, 2009-2010 39
Figure 26: Quantities of imported cements to the West Bank and Gaza Strip, 2004-2010
40
Figure 27: Workers in Hotels, 2004-2010 41
Performance of Palestinian Economy
Summary
Growth of GDP and rise in the GDP per Capita: The Palestinian Territory had witnessed growth of the GDP by 9.3% during the year 2010 compared with 2009. Statistics indicated growth of main economic activities with relatively high contribution to GDP including Agriculture, Fishing, Construction, Retail and Wholesale Trade, Transport and Communication Services as well as Public Administration and Defense. The Construction Sector recorded the highest growth at 35.6% during 2010. The Gross Domestic Product per Capita for the Palestinian Territory during 2010 had recorded an increase by 6.1% compared with 2009.
Rise in the number of workers, decline in unemployment and increase in productivity of workers in the Palestinian Territory during 2010: A rise by 3.7% in the number of workers that was accompanied by decline in unemployment from 24.5% in 2009 to reach 23.7% in 2010. The majority of economic activities had witnessed increase in the number of workers especially the Construction Sector, which indicated a growth by 16.2%. On the other hand, the Manufacturing and Mining Sector had recorded a decline in the number of workers by 2.1%, while the productivity of workers had recorded an increase to reach 15.1 thousand dollar per worker during 2010 compared to 14.1 in 2009.
Slight increase of the nominal average daily wage along with a decrease in its real value: The nominal average daily wage had witnessed a slight increase by 0.4%. However, the real average daily wage had decreased by 3.1% based on the rise of prices and that signals a decline in the purchasing power of workers in the Palestinian Territory.
Increase of the Consumer Price Index (CPI): The annual consumer price index in the Palestinian Territory during 2010 increased by 3.75% compared with the previous year. The rise in the CPI during 2010 was due to the increase in the prices of food and beverages, housing and housing appliances, education services as well as increase in the prices of cloth and clothing.
About 25.7% of persons in the Palestinian Territory had suffered from poverty during 2010: Slightly more than one out of four Individuals (25.7%) were living below poverty line in 2010, (18.3% in the West Bank and 38.0% in Gaza Strip) compared with 26.2% in 2009 (19.4% in the West Bank and 38.3% in Gaza Strip).
Increase in the value of employee’s compensation received from the outside world: Compensation of employees comprises 85.0% of net income in the Balance of Payments (BoP). In 2010, the compensation of employees had increased by 23.4% to reach USD$ 998.9 million compared to 809.4 million in 2009.
Less dependence on external transfers by 16.5% during 2010: As the Palestinian economy is dependent mainly on external transfers, the value of current transfers received from abroad during 2010 had declined by 26.3% to reach USD$ 1,822.9 million compared with USD$ 2,473.1 million in 2009. The value of total capital transfers received from abroad had increased by 16.9% to reach USD$ 840.7 million during 2010 compared to USD$ 719.0 million in 2009.
Increase in the deficit of trade balance : The trade balance for 2010 recorded a deficit of USD$ 3,989.2 million, marking an increase by 6.3% compared to 2009. The increase in the deficit was caused by increase in imports by 7.0% compared to increase in exports by 8.8%.
Significant increase in the revenues of central government compared with decrease in the government expenditures during 2010: The year 2010 had witnessed greater government reforms in the field of tax collection in line with the development and Reforms Plan. Local revenues (tax and non tax revenues) constituted 39.0% of total revenues and that contributed to cover current expenditures with less dependence on external transfers to support the general budget. In 2010, the total
revenues of the Palestinian National Authority amounted to USD$ 1.9 billion, marking an increase by 21.6%. In addition, government expenditures had been reduced by 2.7%.
A rise in the Private final consumption for households and non-profit institutions by 9.3%: In 2010, the private consumption reached USD$ 6,109.7 million that constituted about 106% of the GDP. This reflects the large deficit in the Palestinian trade balance.
Increase in the value of deposits by residents in local banks: Based on the Consolidated budget of banks issued by Palestine Monetary Authority, deposits by residents in local banks had increased by 14.2% to reach USD$ 6.8 billion in 2010 compared to 6.0 billion in 2009.
Higher employment in the private sector and increase in the average wages; increase of the productivity rate and value added: The number of workers in the private sector had increased by 6.6% to reach 465 thousand in 2010. The average daily wage had also increased to reach 74.3 NIS and that was accompanied by improvement of 1.8% in the productivity rate. The value added for the private sector reached USD$ 4.5 billion in 2010. .
.
Economic Performance 2010
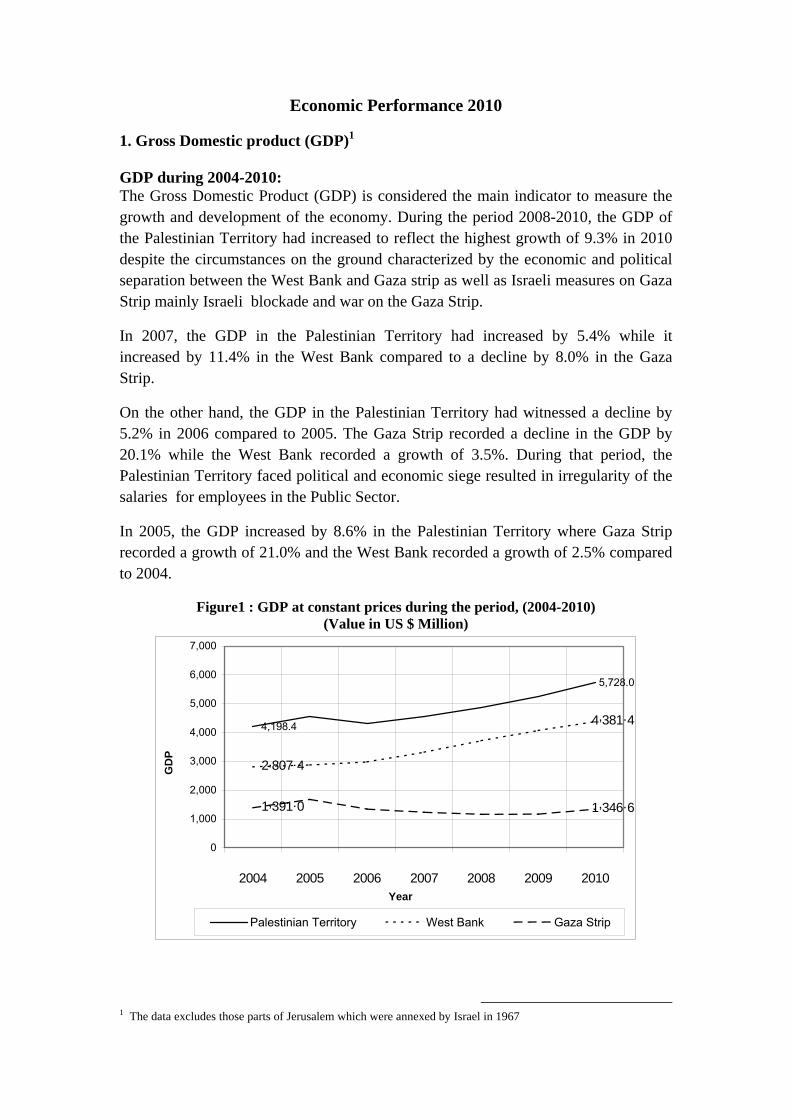
1. Gross Domestic product (GDP)1 GDP during 2004-2010: The Gross Domestic Product (GDP) is considered the main indicator to measure the growth and development of the economy. During the period 2008-2010, the GDP of the Palestinian Territory had increased to reflect the highest growth of 9.3% in 2010 despite the circumstances on the ground characterized by the economic and political separation between the West Bank and Gaza strip as well as Israeli measures on Gaza Strip mainly Israeli blockade and war on the Gaza Strip.
In 2007, the GDP in the Palestinian Territory had increased by 5.4% while it increased by 11.4% in the West Bank compared to a decline by 8.0% in the Gaza Strip.
On the other hand, the GDP in the Palestinian Territory had witnessed a decline by 5.2% in 2006 compared to 2005. The Gaza Strip recorded a decline in the GDP by 20.1% while the West Bank recorded a growth of 3.5%. During that period, the Palestinian Territory faced political and economic siege resulted in irregularity of the salaries for employees in the Public Sector.
In 2005, the GDP increased by 8.6% in the Palestinian Territory where Gaza Strip recorded a growth of 21.0% and the West Bank recorded a growth of 2.5% compared to 2004.
Figure1 : GDP at constant prices during the period, (2004-2010) (Value in US $ Million)
4,198.4
5,728.0
2,807.4
4,381.4
1,391.0 1,346.6
0
1,000
2,000
3,000
4,000
5,000
6,000
7,000
2004 2005 2006 2007 2008 2009 2010Year
GD
P
Palestinian Territory West Bank Gaza Strip
1 The data excludes those parts of Jerusalem which were annexed by Israel in 1967
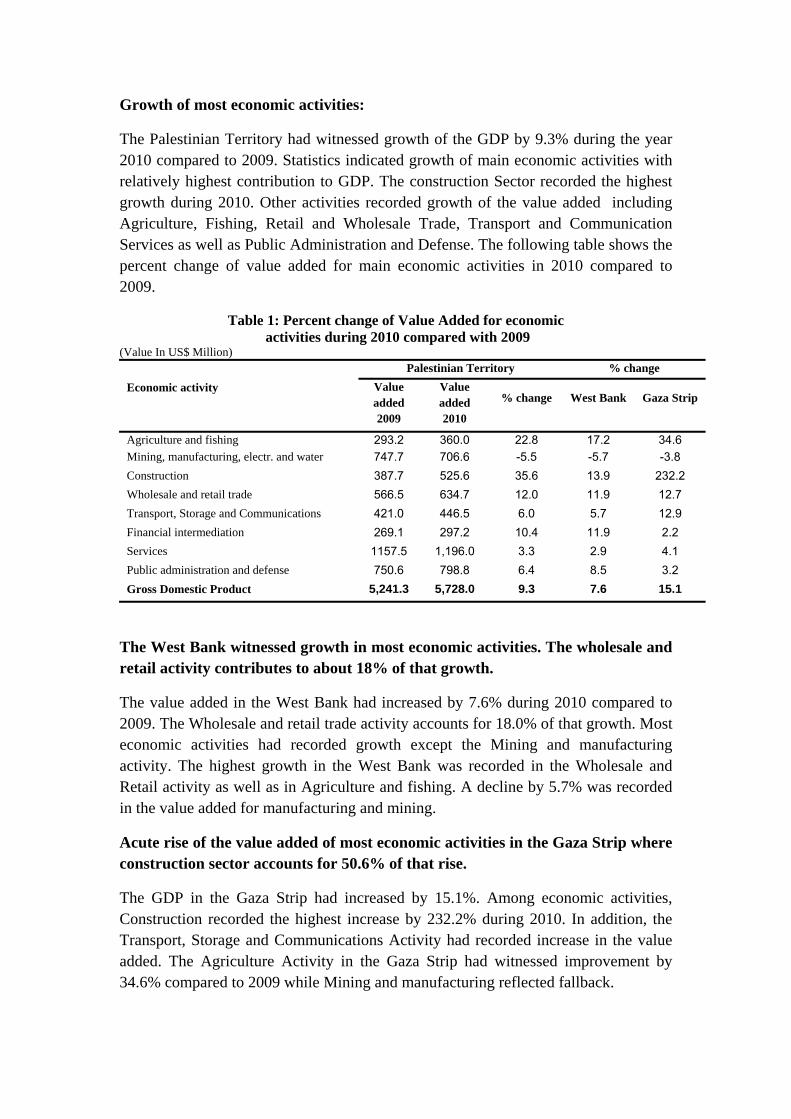
Growth of most economic activities:
The Palestinian Territory had witnessed growth of the GDP by 9.3% during the year 2010 compared to 2009. Statistics indicated growth of main economic activities with relatively highest contribution to GDP. The construction Sector recorded the highest growth during 2010. Other activities recorded growth of the value added including Agriculture, Fishing, Retail and Wholesale Trade, Transport and Communication Services as well as Public Administration and Defense. The following table shows the percent change of value added for main economic activities in 2010 compared to 2009.
Table 1: Percent change of Value Added for economic activities during 2010 compared with 2009
(Value In US$ Million) Palestinian Territory % change
Economic activity Value added 2009
Value added 2010
% change West Bank Gaza Strip
Agriculture and fishing 293.2 360.0 22.8 17.2 34.6 Mining, manufacturing, electr. and water 747.7 706.6 -5.5 -5.7 -3.8 Construction 387.7 525.6 35.6 13.9 232.2 Wholesale and retail trade 566.5 634.7 12.0 11.9 12.7 Transport, Storage and Communications 421.0 446.5 6.0 5.7 12.9 Financial intermediation 269.1 297.2 10.4 11.9 2.2 Services 1157.5 1,196.0 3.3 2.9 4.1 Public administration and defense 750.6 798.8 6.4 8.5 3.2 Gross Domestic Product 5,241.3 5,728.0 9.3 7.6 15.1
The West Bank witnessed growth in most economic activities. The wholesale and retail activity contributes to about 18% of that growth.
The value added in the West Bank had increased by 7.6% during 2010 compared to 2009. The Wholesale and retail trade activity accounts for 18.0% of that growth. Most economic activities had recorded growth except the Mining and manufacturing activity. The highest growth in the West Bank was recorded in the Wholesale and Retail activity as well as in Agriculture and fishing. A decline by 5.7% was recorded in the value added for manufacturing and mining.
Acute rise of the value added of most economic activities in the Gaza Strip where construction sector accounts for 50.6% of that rise.
The GDP in the Gaza Strip had increased by 15.1%. Among economic activities, Construction recorded the highest increase by 232.2% during 2010. In addition, the Transport, Storage and Communications Activity had recorded increase in the value added. The Agriculture Activity in the Gaza Strip had witnessed improvement by 34.6% compared to 2009 while Mining and manufacturing reflected fallback.
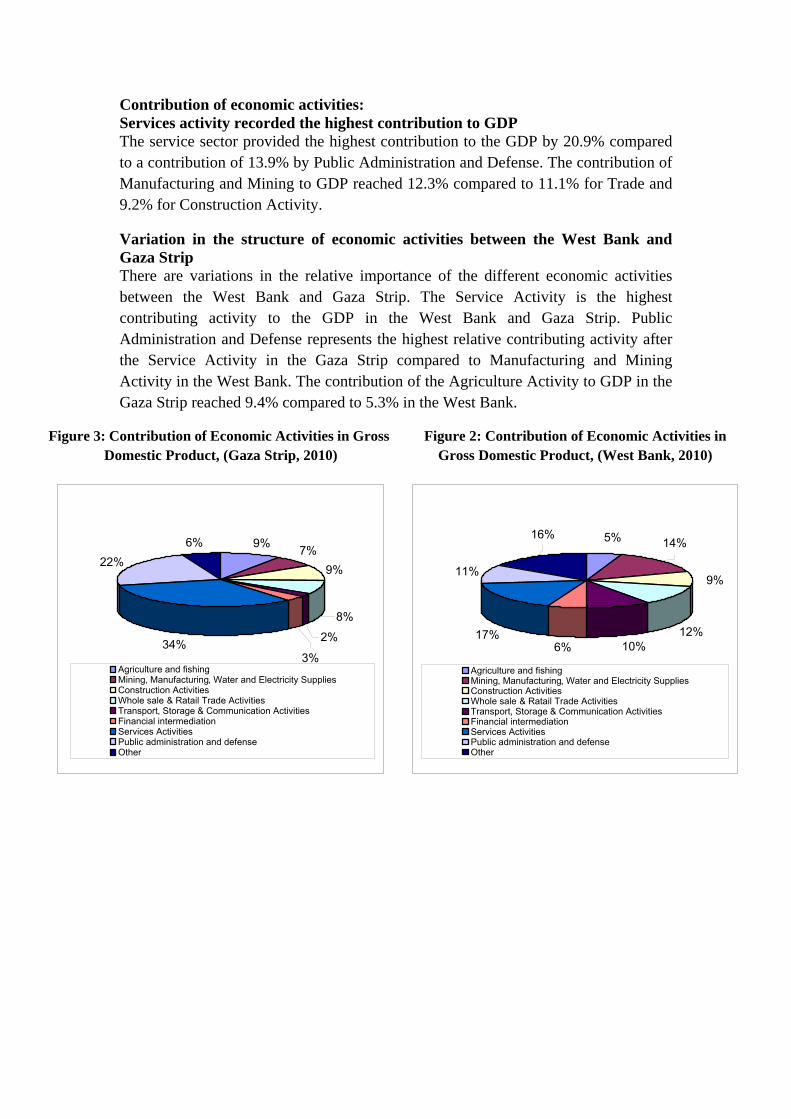
Contribution of economic activities: Services activity recorded the highest contribution to GDP The service sector provided the highest contribution to the GDP by 20.9% compared to a contribution of 13.9% by Public Administration and Defense. The contribution of Manufacturing and Mining to GDP reached 12.3% compared to 11.1% for Trade and 9.2% for Construction Activity.
Variation in the structure of economic activities between the West Bank and Gaza Strip There are variations in the relative importance of the different economic activities between the West Bank and Gaza Strip. The Service Activity is the highest contributing activity to the GDP in the West Bank and Gaza Strip. Public Administration and Defense represents the highest relative contributing activity after the Service Activity in the Gaza Strip compared to Manufacturing and Mining Activity in the West Bank. The contribution of the Agriculture Activity to GDP in the Gaza Strip reached 9.4% compared to 5.3% in the West Bank.
Figure 3: Contribution of Economic Activities in Gross Domestic Product, (Gaza Strip, 2010)
9% 7%9%
8%
2%34%
22%6%
3%Agriculture and fishingMining, Manufacturing, Water and Electricity SuppliesConstruction ActivitiesWhole sale & Ratail Trade ActivitiesTransport, Storage & Communication ActivitiesFinancial intermediationServices ActivitiesPublic administration and defenseOther
Figure 2: Contribution of Economic Activities in Gross Domestic Product, (West Bank, 2010)
12%10%6%
17%
11%
16%
9%
14%5%
Agriculture and fishingMining, Manufacturing, Water and Electricity SuppliesConstruction ActivitiesWhole sale & Ratail Trade ActivitiesTransport, Storage & Communication ActivitiesFinancial intermediationServices ActivitiesPublic administration and defenseOther
2. GDP Per Capita
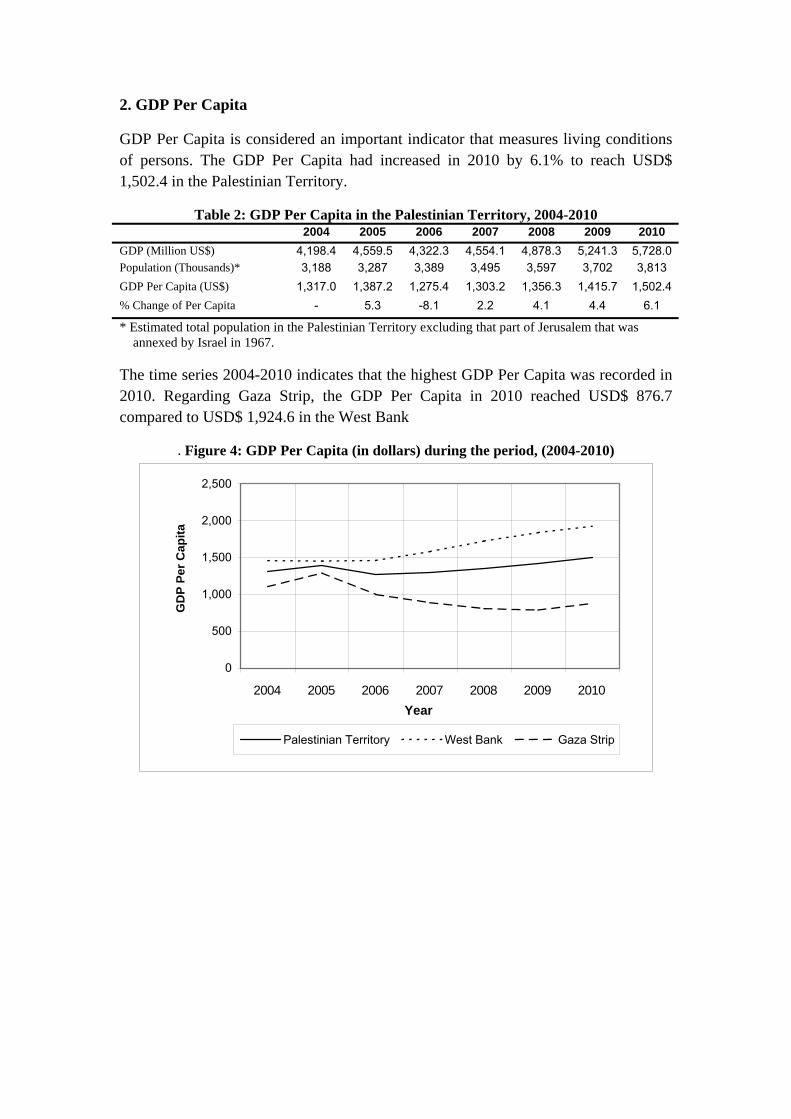
GDP Per Capita is considered an important indicator that measures living conditions of persons. The GDP Per Capita had increased in 2010 by 6.1% to reach USD$ 1,502.4 in the Palestinian Territory.
Table 2: GDP Per Capita in the Palestinian Territory, 2004-2010 2004 2005 2006 2007 2008 2009 2010
GDP (Million US$) 4,198.4 4,559.5 4,322.3 4,554.1 4,878.3 5,241.3 5,728.0 Population (Thousands)* 3,188 3,287 3,389 3,495 3,597 3,702 3,813 GDP Per Capita (US$) 1,317.0 1,387.2 1,275.4 1,303.2 1,356.3 1,415.7 1,502.4 % Change of Per Capita - 5.3 -8.1 2.2 4.1 4.4 6.1
* Estimated total population in the Palestinian Territory excluding that part of Jerusalem that was annexed by Israel in 1967. The time series 2004-2010 indicates that the highest GDP Per Capita was recorded in 2010. Regarding Gaza Strip, the GDP Per Capita in 2010 reached USD$ 876.7 compared to USD$ 1,924.6 in the West Bank
. Figure 4: GDP Per Capita (in dollars) during the period, (2004-2010)
0
500
1,000
1,500
2,000
2,500
2004 2005 2006 2007 2008 2009 2010Year
GD
P Pe
r Cap
ita
Palestinian Territory West Bank Gaza Strip
3. Labor Market
The Palestinian economy is largely dependent on labor for production; while resources such as capital and land are limited.
Table 3: Selected indicators on Labor force for persons 15 years and over in the Palestinian Territory, 2004-2010
2004 2005 2006 2007 2008 2009 2010 Size of labor force (Thousands) 752 789 834 882 908 951 976 Participation rate in labor force 40.1 40.4 41.0 41.7 41.2 41.6 41.1 Workers (Thousands) 550 603 637 691 666 717 744 % change in number of workers - 9.6 5.5 8.5 -3.5 7.6 3.7 Nominal average daily wage (NIS) 73.8 77.0 81.5 81.9 87.0 91.3 91.7 Real average daily wage* 73.8 74.0 75.4 74.4 71.9 73.4 71.1 Unemployment rate 26.8 23.5 23.7 21.7 26.6 24.5 23.7 Productivity (Dollar/Worker) 14,922.
414,885.5 12,936.4 12,283.3 14,147.7 14,106.0 15,129.9
* The nominal daily wage was re-calculated based on the Consumer Price Index to highlight the Purchasing Power of workers in constant prices
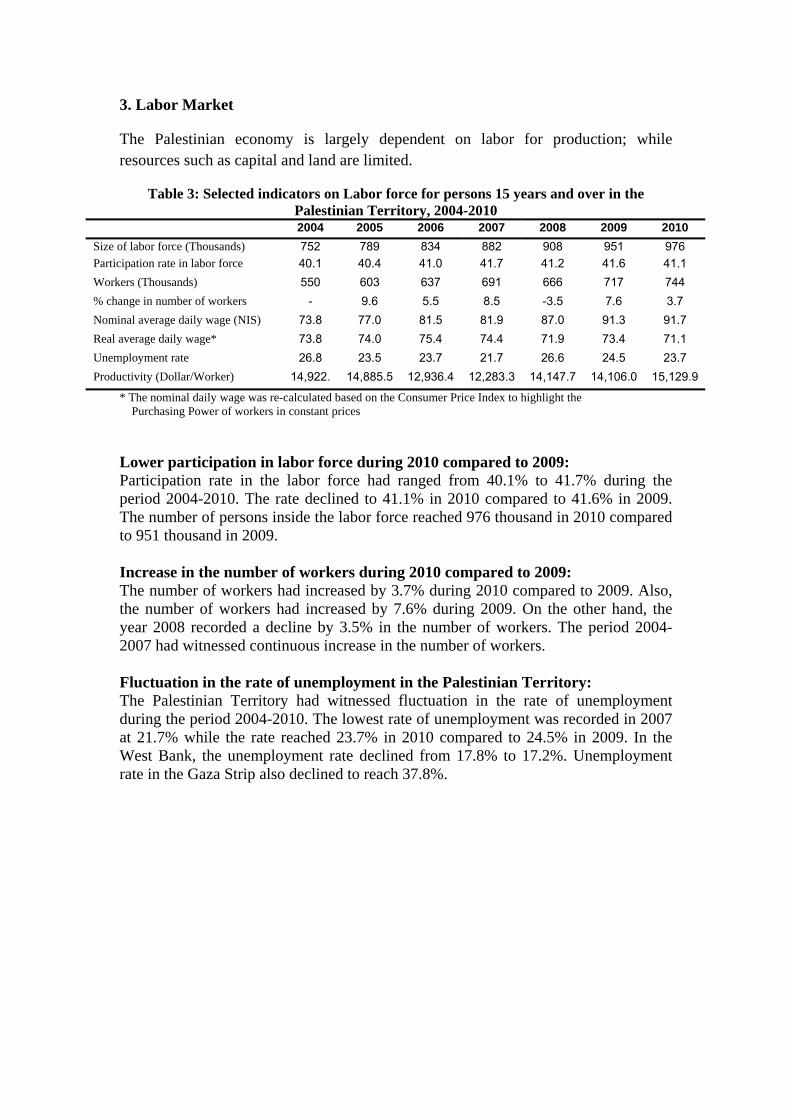
Lower participation in labor force during 2010 compared to 2009: Participation rate in the labor force had ranged from 40.1% to 41.7% during the period 2004-2010. The rate declined to 41.1% in 2010 compared to 41.6% in 2009. The number of persons inside the labor force reached 976 thousand in 2010 compared to 951 thousand in 2009. Increase in the number of workers during 2010 compared to 2009: The number of workers had increased by 3.7% during 2010 compared to 2009. Also, the number of workers had increased by 7.6% during 2009. On the other hand, the year 2008 recorded a decline by 3.5% in the number of workers. The period 2004-2007 had witnessed continuous increase in the number of workers. Fluctuation in the rate of unemployment in the Palestinian Territory: The Palestinian Territory had witnessed fluctuation in the rate of unemployment during the period 2004-2010. The lowest rate of unemployment was recorded in 2007 at 21.7% while the rate reached 23.7% in 2010 compared to 24.5% in 2009. In the West Bank, the unemployment rate declined from 17.8% to 17.2%. Unemployment rate in the Gaza Strip also declined to reach 37.8%.
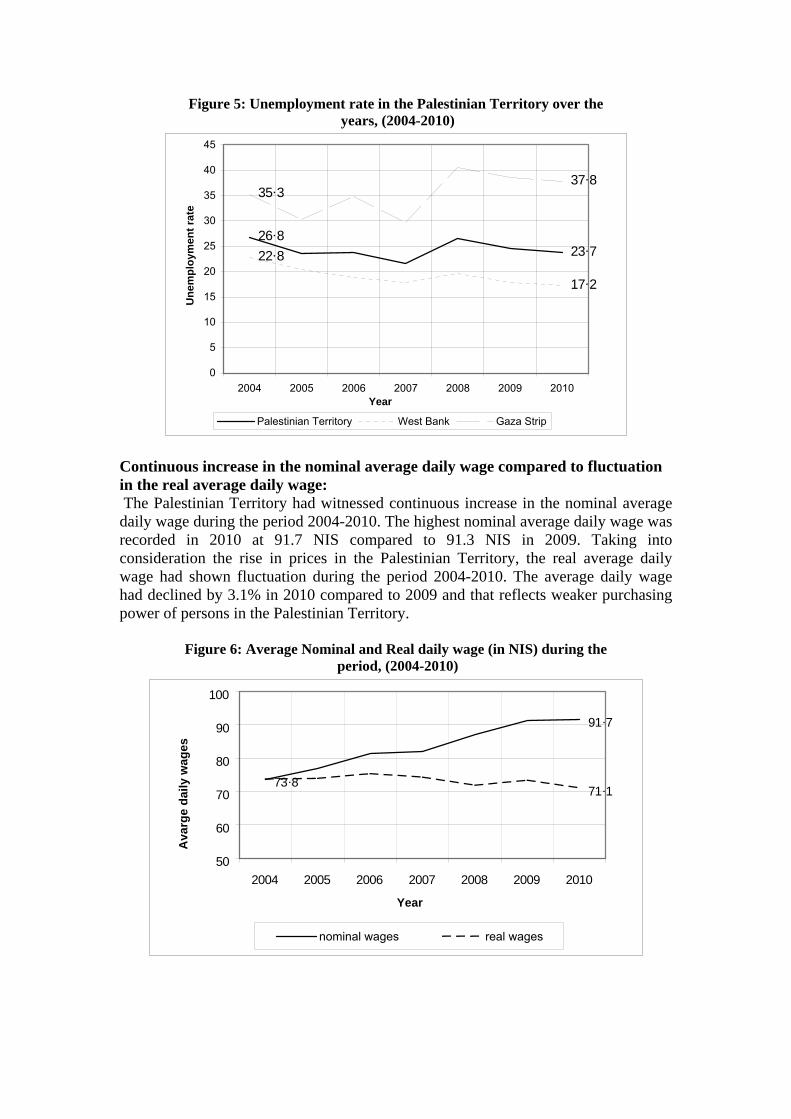
Figure 5: Unemployment rate in the Palestinian Territory over the years, (2004-2010)
23.726.8
17.2
22.8
37.835.3
0
5
10
15
20
25
30
35
40
45
2004 2005 2006 2007 2008 2009 2010Year
Une
mpl
oym
ent r
ate
Palestinian Territory West Bank Gaza Strip
Continuous increase in the nominal average daily wage compared to fluctuation in the real average daily wage: The Palestinian Territory had witnessed continuous increase in the nominal average daily wage during the period 2004-2010. The highest nominal average daily wage was recorded in 2010 at 91.7 NIS compared to 91.3 NIS in 2009. Taking into consideration the rise in prices in the Palestinian Territory, the real average daily wage had shown fluctuation during the period 2004-2010. The average daily wage had declined by 3.1% in 2010 compared to 2009 and that reflects weaker purchasing power of persons in the Palestinian Territory.
Figure 6: Average Nominal and Real daily wage (in NIS) during the period, (2004-2010)
91.7
73.871.1
50
60
70
80
90
100
2004 2005 2006 2007 2008 2009 2010
Year
Ava
rge
daily
wag
es
nominal wages real wages
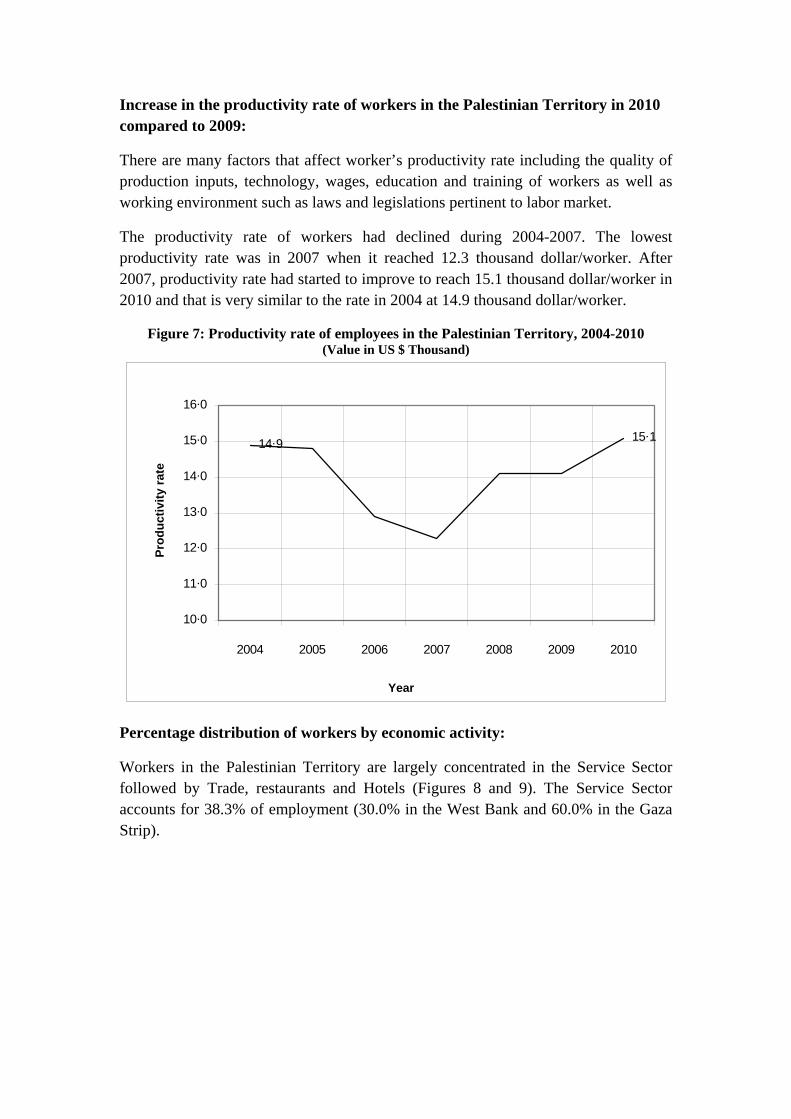
Increase in the productivity rate of workers in the Palestinian Territory in 2010 compared to 2009:
There are many factors that affect worker’s productivity rate including the quality of production inputs, technology, wages, education and training of workers as well as working environment such as laws and legislations pertinent to labor market.
The productivity rate of workers had declined during 2004-2007. The lowest productivity rate was in 2007 when it reached 12.3 thousand dollar/worker. After 2007, productivity rate had started to improve to reach 15.1 thousand dollar/worker in 2010 and that is very similar to the rate in 2004 at 14.9 thousand dollar/worker.
Figure 7: Productivity rate of employees in the Palestinian Territory, 2004-2010 (Value in US $ Thousand)
14.9 15.1
10.0
11.0
12.0
13.0
14.0
15.0
16.0
2004 2005 2006 2007 2008 2009 2010
Year
Prod
uctiv
ity ra
te
Percentage distribution of workers by economic activity:
Workers in the Palestinian Territory are largely concentrated in the Service Sector followed by Trade, restaurants and Hotels (Figures 8 and 9). The Service Sector accounts for 38.3% of employment (30.0% in the West Bank and 60.0% in the Gaza Strip).
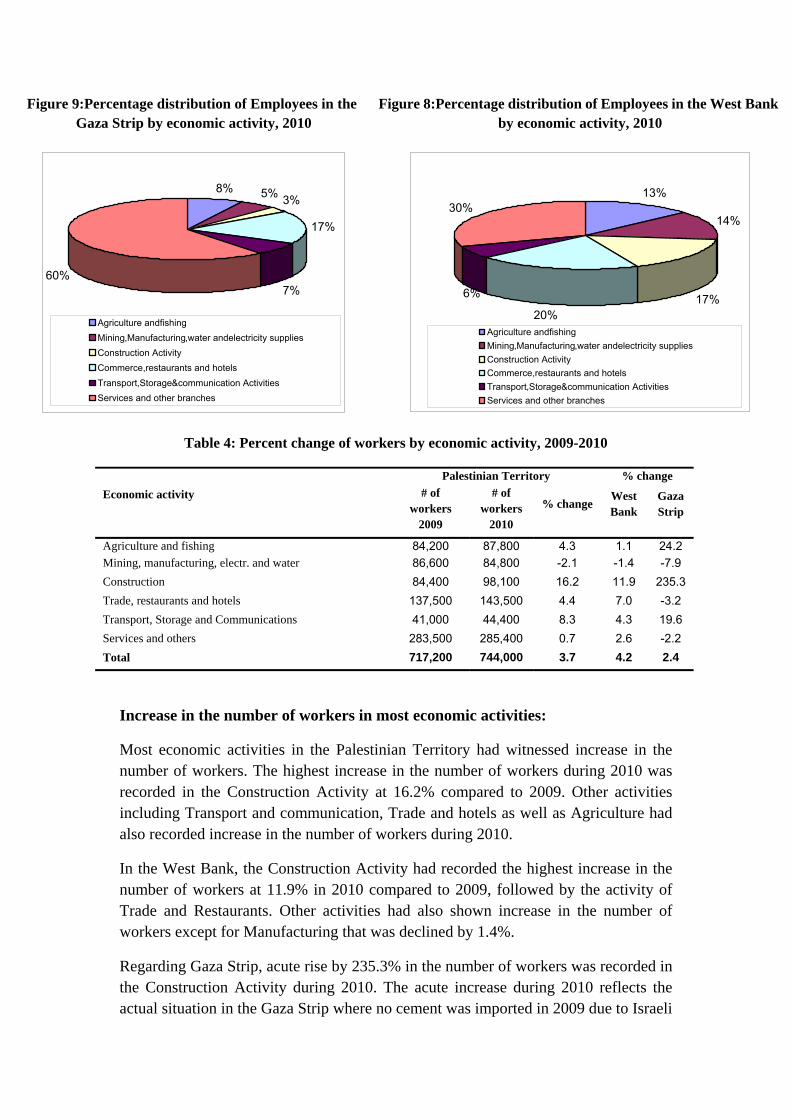
Figure 9:Percentage distribution of Employees in the Gaza Strip by economic activity, 2010
8% 5% 3%
17%
7%60%
Agriculture andfishingMining,Manufacturing,water andelectricity suppliesConstruction ActivityCommerce,restaurants and hotelsTransport,Storage&communication ActivitiesServices and other branches
Figure 8:Percentage distribution of Employees in the West Bank by economic activity, 2010
13%
14%
17%20%
30%
6%
Agriculture andfishingMining,Manufacturing,water andelectricity suppliesConstruction ActivityCommerce,restaurants and hotelsTransport,Storage&communication ActivitiesServices and other branches
Table 4: Percent change of workers by economic activity, 2009-2010
Palestinian Territory % change Economic activity # of
workers 2009
# of workers
2010
% change West Bank
Gaza Strip
Agriculture and fishing 84,200 87,800 4.3 1.1 24.2 Mining, manufacturing, electr. and water 86,600 84,800 -2.1 -1.4 -7.9 Construction 84,400 98,100 16.2 11.9 235.3 Trade, restaurants and hotels 137,500 143,500 4.4 7.0 -3.2 Transport, Storage and Communications 41,000 44,400 8.3 4.3 19.6 Services and others 283,500 285,400 0.7 2.6 -2.2 Total 717,200 744,000 3.7 4.2 2.4
Increase in the number of workers in most economic activities:
Most economic activities in the Palestinian Territory had witnessed increase in the number of workers. The highest increase in the number of workers during 2010 was recorded in the Construction Activity at 16.2% compared to 2009. Other activities including Transport and communication, Trade and hotels as well as Agriculture had also recorded increase in the number of workers during 2010.
In the West Bank, the Construction Activity had recorded the highest increase in the number of workers at 11.9% in 2010 compared to 2009, followed by the activity of Trade and Restaurants. Other activities had also shown increase in the number of workers except for Manufacturing that was declined by 1.4%.
Regarding Gaza Strip, acute rise by 235.3% in the number of workers was recorded in the Construction Activity during 2010. The acute increase during 2010 reflects the actual situation in the Gaza Strip where no cement was imported in 2009 due to Israeli
measures. The number of workers in Agriculture and Fishing had increased by 24.2%. The Transport and communication Activity had also witnessed improvement in the number of workers during 2010.
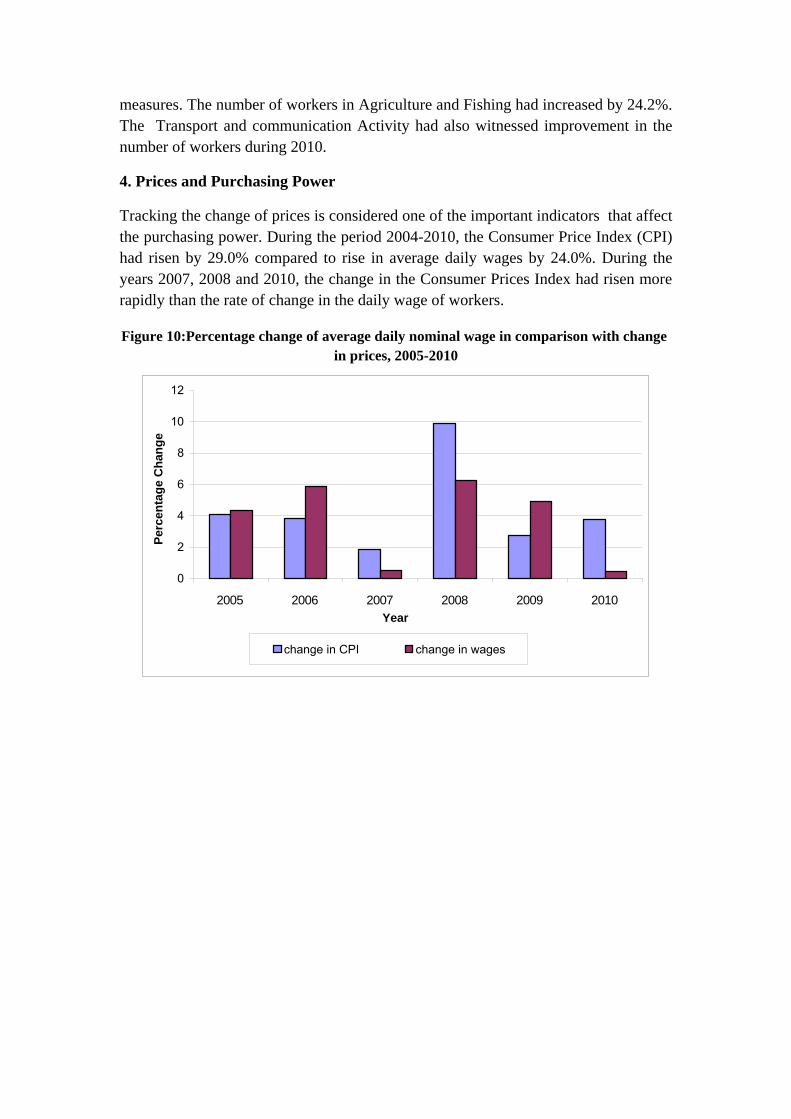
4. Prices and Purchasing Power
Tracking the change of prices is considered one of the important indicators that affect the purchasing power. During the period 2004-2010, the Consumer Price Index (CPI) had risen by 29.0% compared to rise in average daily wages by 24.0%. During the years 2007, 2008 and 2010, the change in the Consumer Prices Index had risen more rapidly than the rate of change in the daily wage of workers.
Figure 10:Percentage change of average daily nominal wage in comparison with change in prices, 2005-2010
0
2
4
6
8
10
12
2005 2006 2007 2008 2009 2010Year
Perc
enta
ge C
hang
e
change in CPI change in wages
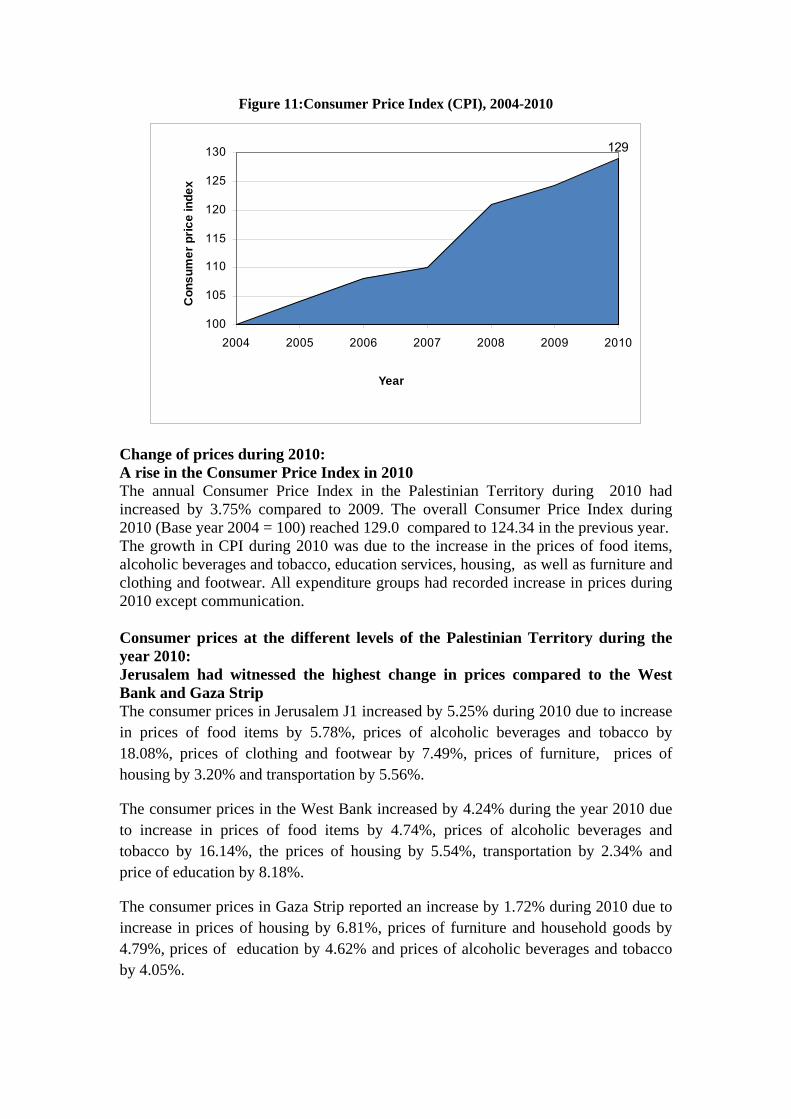
Figure 11:Consumer Price Index (CPI), 2004-2010
129
100
105
110
115
120
125
130
2004 2005 2006 2007 2008 2009 2010
Year
Con
sum
er p
rice
inde
x
Change of prices during 2010: A rise in the Consumer Price Index in 2010 The annual Consumer Price Index in the Palestinian Territory during 2010 had increased by 3.75% compared to 2009. The overall Consumer Price Index during 2010 (Base year 2004 = 100) reached 129.0 compared to 124.34 in the previous year. The growth in CPI during 2010 was due to the increase in the prices of food items, alcoholic beverages and tobacco, education services, housing, as well as furniture and clothing and footwear. All expenditure groups had recorded increase in prices during 2010 except communication. Consumer prices at the different levels of the Palestinian Territory during the year 2010: Jerusalem had witnessed the highest change in prices compared to the West Bank and Gaza Strip The consumer prices in Jerusalem J1 increased by 5.25% during 2010 due to increase in prices of food items by 5.78%, prices of alcoholic beverages and tobacco by 18.08%, prices of clothing and footwear by 7.49%, prices of furniture, prices of housing by 3.20% and transportation by 5.56%.
The consumer prices in the West Bank increased by 4.24% during the year 2010 due to increase in prices of food items by 4.74%, prices of alcoholic beverages and tobacco by 16.14%, the prices of housing by 5.54%, transportation by 2.34% and price of education by 8.18%.
The consumer prices in Gaza Strip reported an increase by 1.72% during 2010 due to increase in prices of housing by 6.81%, prices of furniture and household goods by 4.79%, prices of education by 4.62% and prices of alcoholic beverages and tobacco by 4.05%.
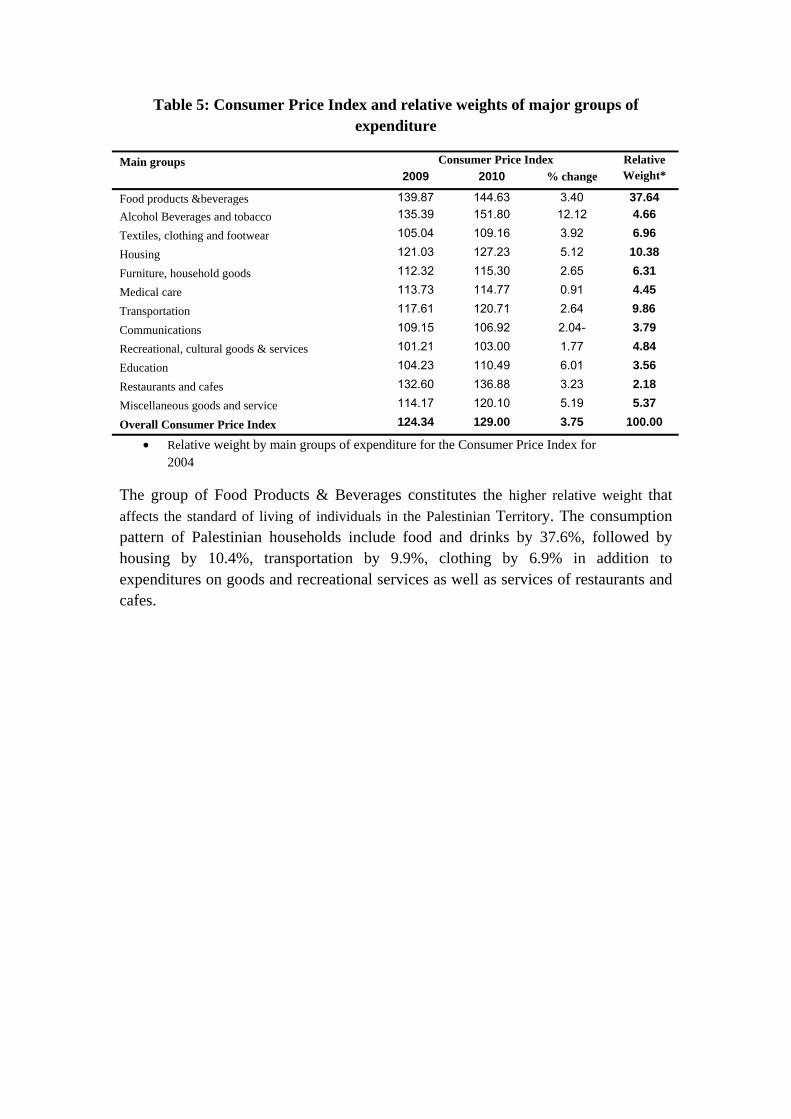
Table 5: Consumer Price Index and relative weights of major groups of expenditure
Consumer Price Index Main groups 2009 2010 % change
Relative Weight*
Food products &beverages 139.87 144.63 3.40 37.64 Alcohol Beverages and tobacco 135.39 151.80 12.12 4.66
Textiles, clothing and footwear 105.04 109.16 3.92 6.96
Housing 121.03 127.23 5.12 10.38
Furniture, household goods 112.32 115.30 2.65 6.31
Medical care 113.73 114.77 0.91 4.45
Transportation 117.61 120.71 2.64 9.86
Communications 109.15 106.92 -2.04 3.79
Recreational, cultural goods & services 101.21 103.00 1.77 4.84
Education 104.23 110.49 6.01 3.56
Restaurants and cafes 132.60 136.88 3.23 2.18
Miscellaneous goods and service 114.17 120.10 5.19 5.37
Overall Consumer Price Index 124.34 129.00 3.75 100.00
• Relative weight by main groups of expenditure for the Consumer Price Index for 2004
The group of Food Products & Beverages constitutes the higher relative weight that affects the standard of living of individuals in the Palestinian Territory. The consumption pattern of Palestinian households include food and drinks by 37.6%, followed by housing by 10.4%, transportation by 9.9%, clothing by 6.9% in addition to expenditures on goods and recreational services as well as services of restaurants and cafes.
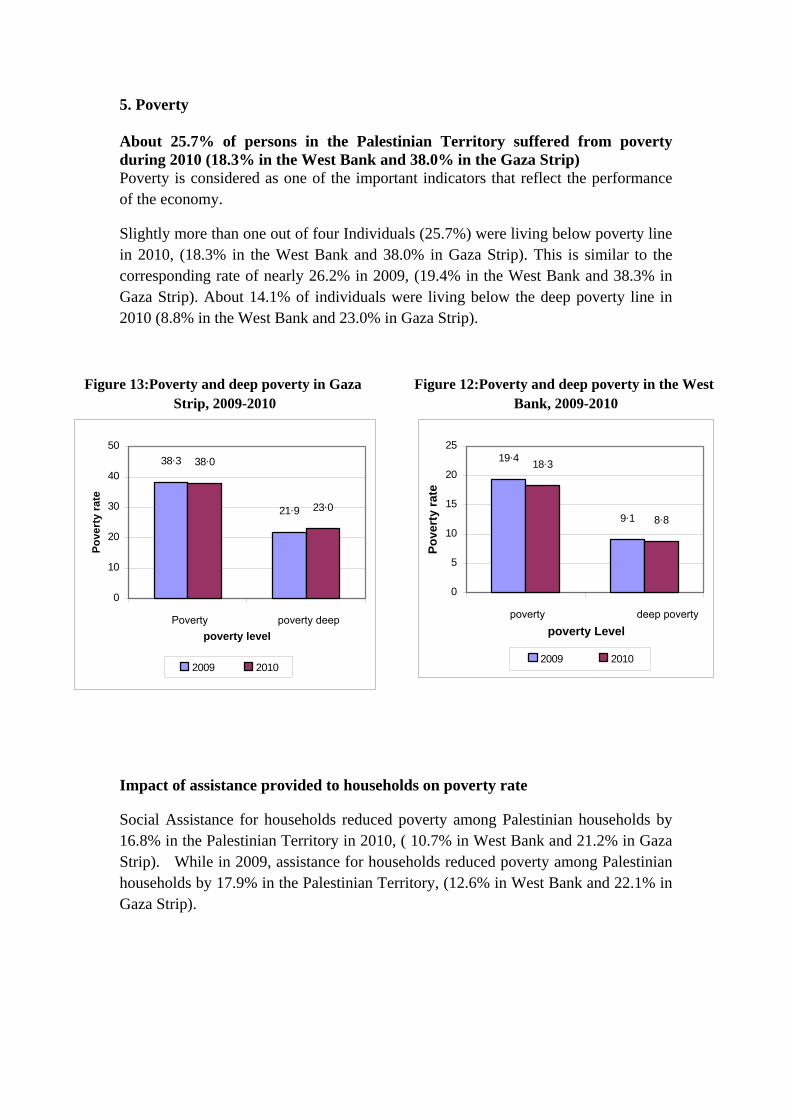
5. Poverty About 25.7% of persons in the Palestinian Territory suffered from poverty during 2010 (18.3% in the West Bank and 38.0% in the Gaza Strip) Poverty is considered as one of the important indicators that reflect the performance of the economy.
Slightly more than one out of four Individuals (25.7%) were living below poverty line in 2010, (18.3% in the West Bank and 38.0% in Gaza Strip). This is similar to the corresponding rate of nearly 26.2% in 2009, (19.4% in the West Bank and 38.3% in Gaza Strip). About 14.1% of individuals were living below the deep poverty line in 2010 (8.8% in the West Bank and 23.0% in Gaza Strip).
Figure 13:Poverty and deep poverty in Gaza Strip, 2009-2010
38.3
21.9
38.0
23.0
0
10
20
30
40
50
Poverty poverty deeppoverty level
Pove
rty
rate
2009 2010
Figure 12:Poverty and deep poverty in the West Bank, 2009-2010
19.4
9.1
18.3
8.8
0
5
10
15
20
25
poverty deep povertypoverty Level
Pove
rty
rate
2009 2010
Impact of assistance provided to households on poverty rate
Social Assistance for households reduced poverty among Palestinian households by 16.8% in the Palestinian Territory in 2010, ( 10.7% in West Bank and 21.2% in Gaza Strip). While in 2009, assistance for households reduced poverty among Palestinian households by 17.9% in the Palestinian Territory, (12.6% in West Bank and 22.1% in Gaza Strip).
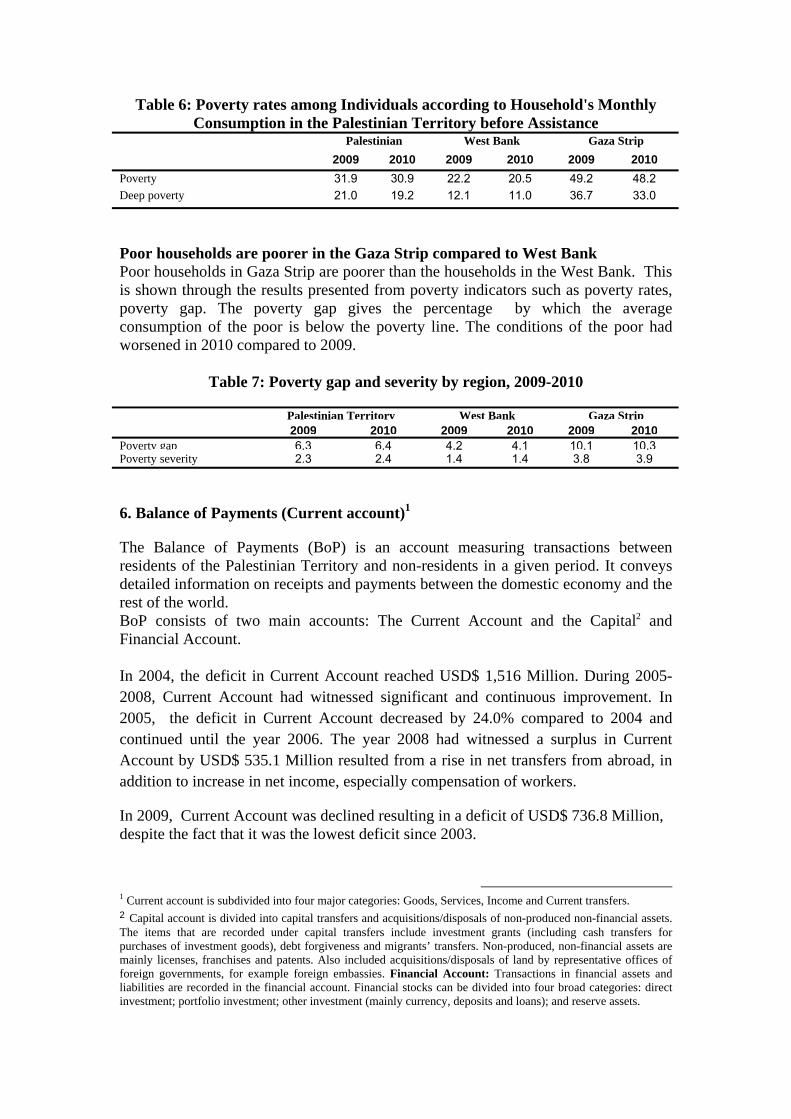
Table 6: Poverty rates among Individuals according to Household's Monthly Consumption in the Palestinian Territory before Assistance
Palestinian West Bank Gaza Strip 2009 2010 2009 2010 2009 2010
Poverty 31.9 30.9 22.2 20.5 49.2 48.2 Deep poverty 21.0 19.2 12.1 11.0 36.7 33.0
Poor households are poorer in the Gaza Strip compared to West Bank Poor households in Gaza Strip are poorer than the households in the West Bank. This is shown through the results presented from poverty indicators such as poverty rates, poverty gap. The poverty gap gives the percentage by which the average consumption of the poor is below the poverty line. The conditions of the poor had worsened in 2010 compared to 2009.
Table 7: Poverty gap and severity by region, 2009-2010
Palestinian Territory West Bank Gaza Strip 2009 2010 2009 2010 2009 2010
Poverty gap 6.3 6.4 4.2 4.1 10.1 10.3Poverty severity 2.3 2.4 1.4 1.4 3.8 3.9
6. Balance of Payments (Current account)1
The Balance of Payments (BoP) is an account measuring transactions between residents of the Palestinian Territory and non-residents in a given period. It conveys detailed information on receipts and payments between the domestic economy and the rest of the world. BoP consists of two main accounts: The Current Account and the Capital2 and Financial Account. In 2004, the deficit in Current Account reached USD$ 1,516 Million. During 2005-2008, Current Account had witnessed significant and continuous improvement. In 2005, the deficit in Current Account decreased by 24.0% compared to 2004 and continued until the year 2006. The year 2008 had witnessed a surplus in Current Account by USD$ 535.1 Million resulted from a rise in net transfers from abroad, in addition to increase in net income, especially compensation of workers.
In 2009, Current Account was declined resulting in a deficit of USD$ 736.8 Million, despite the fact that it was the lowest deficit since 2003.
1 Current account is subdivided into four major categories: Goods, Services, Income and Current transfers. 2 Capital account is divided into capital transfers and acquisitions/disposals of non-produced non-financial assets. The items that are recorded under capital transfers include investment grants (including cash transfers for purchases of investment goods), debt forgiveness and migrants’ transfers. Non-produced, non-financial assets are mainly licenses, franchises and patents. Also included acquisitions/disposals of land by representative offices of foreign governments, for example foreign embassies. Financial Account: Transactions in financial assets and liabilities are recorded in the financial account. Financial stocks can be divided into four broad categories: direct investment; portfolio investment; other investment (mainly currency, deposits and loans); and reserve assets.
One of the most important reasons for this deficit was increase in the value of imports of goods and services to Palestine, which was reflected in deficit in the Trade Balance (one of the most important components of the Current Account for the Balance of Payments), in addition to decline in current transfers received from the outside world.
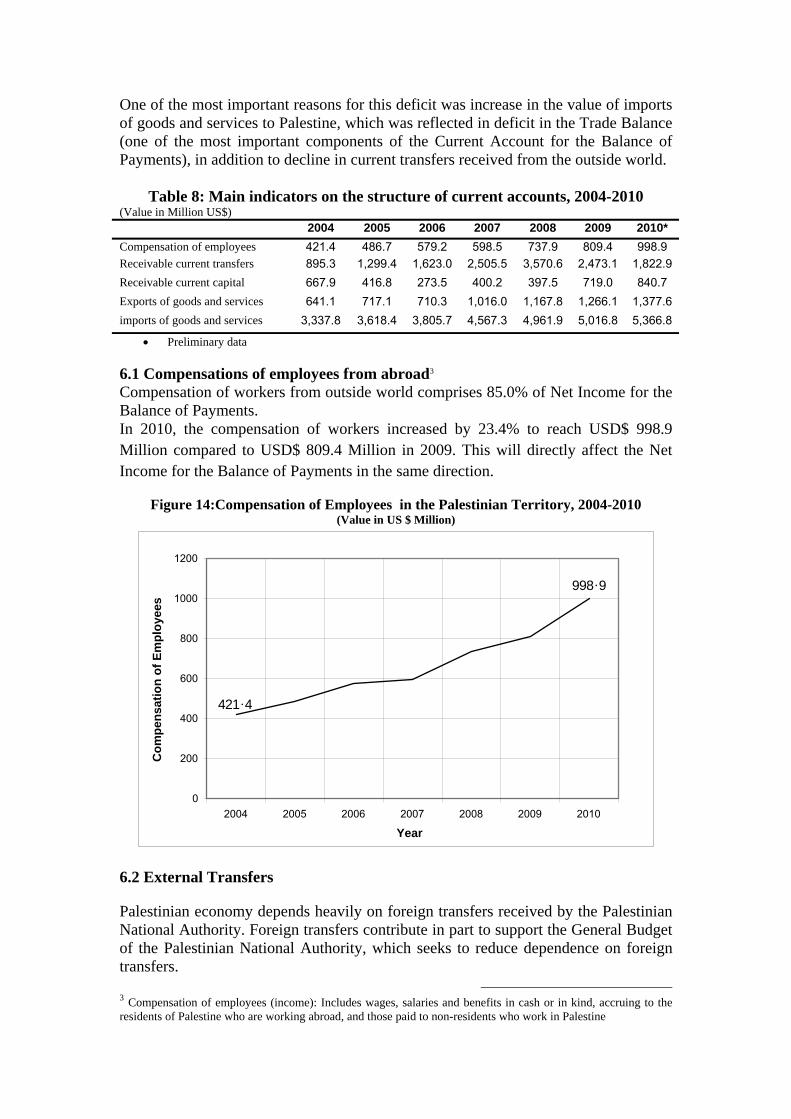
Table 8: Main indicators on the structure of current accounts, 2004-2010 (Value in Million US$)
2004 2005 2006 2007 2008 2009 2010* Compensation of employees 421.4 486.7 579.2 598.5 737.9 809.4 998.9 Receivable current transfers 895.3 1,299.4 1,623.0 2,505.5 3,570.6 2,473.1 1,822.9 Receivable current capital 667.9 416.8 273.5 400.2 397.5 719.0 840.7 Exports of goods and services 641.1 717.1 710.3 1,016.0 1,167.8 1,266.1 1,377.6 imports of goods and services 3,337.8 3,618.4 3,805.7 4,567.3 4,961.9 5,016.8 5,366.8
• Preliminary data
6.1 Compensations of employees from abroad3 Compensation of workers from outside world comprises 85.0% of Net Income for the Balance of Payments. In 2010, the compensation of workers increased by 23.4% to reach USD$ 998.9 Million compared to USD$ 809.4 Million in 2009. This will directly affect the Net Income for the Balance of Payments in the same direction.
Figure 14:Compensation of Employees in the Palestinian Territory, 2004-2010 (Value in US $ Million)
998.9
421.4
0
200
400
600
800
1000
1200
2004 2005 2006 2007 2008 2009 2010
Year
Com
pens
atio
n of
Em
ploy
ees
6.2 External Transfers
Palestinian economy depends heavily on foreign transfers received by the Palestinian National Authority. Foreign transfers contribute in part to support the General Budget of the Palestinian National Authority, which seeks to reduce dependence on foreign transfers.
3 Compensation of employees (income): Includes wages, salaries and benefits in cash or in kind, accruing to the residents of Palestine who are working abroad, and those paid to non-residents who work in Palestine
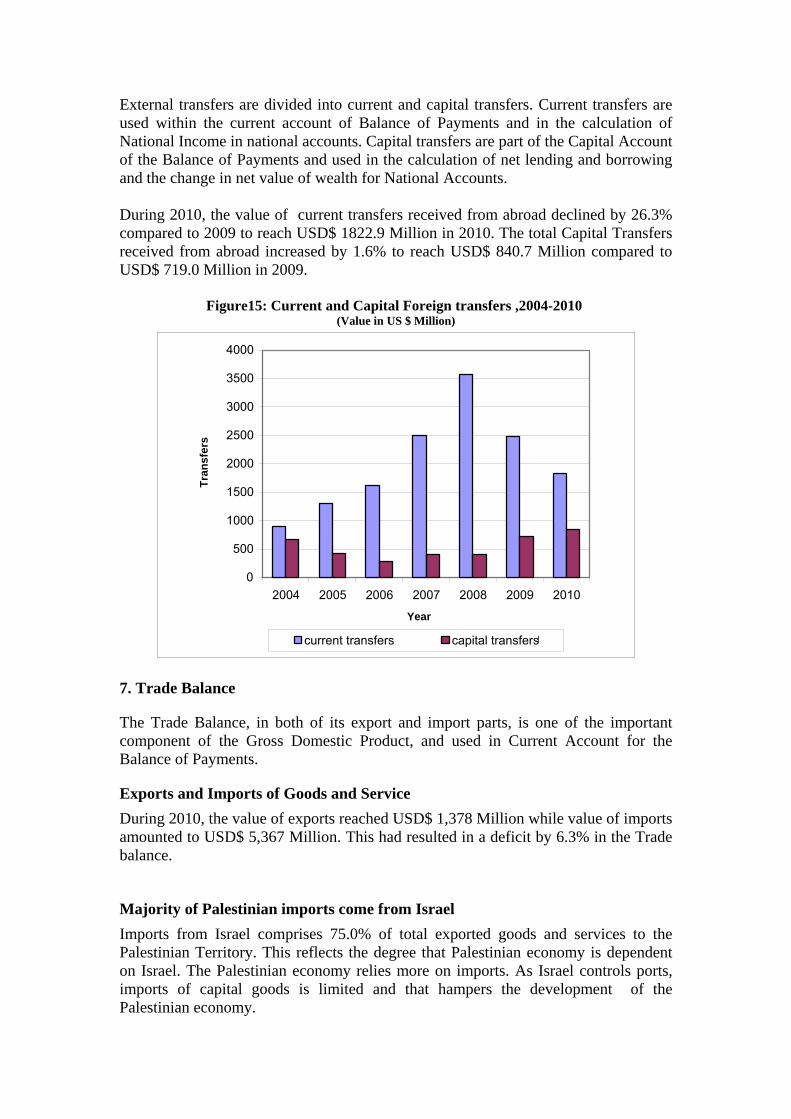
External transfers are divided into current and capital transfers. Current transfers are used within the current account of Balance of Payments and in the calculation of National Income in national accounts. Capital transfers are part of the Capital Account of the Balance of Payments and used in the calculation of net lending and borrowing and the change in net value of wealth for National Accounts. During 2010, the value of current transfers received from abroad declined by 26.3% compared to 2009 to reach USD$ 1822.9 Million in 2010. The total Capital Transfers received from abroad increased by 1.6% to reach USD$ 840.7 Million compared to USD$ 719.0 Million in 2009.
Figure15: Current and Capital Foreign transfers ,2004-2010 (Value in US $ Million)
0
500
1000
1500
2000
2500
3000
3500
4000
2004 2005 2006 2007 2008 2009 2010
Year
Tran
sfer
s
current transfers capital transfersا
7. Trade Balance
The Trade Balance, in both of its export and import parts, is one of the important component of the Gross Domestic Product, and used in Current Account for the Balance of Payments.
Exports and Imports of Goods and Service During 2010, the value of exports reached USD$ 1,378 Million while value of imports amounted to USD$ 5,367 Million. This had resulted in a deficit by 6.3% in the Trade balance.
Majority of Palestinian imports come from Israel Imports from Israel comprises 75.0% of total exported goods and services to the Palestinian Territory. This reflects the degree that Palestinian economy is dependent on Israel. The Palestinian economy relies more on imports. As Israel controls ports, imports of capital goods is limited and that hampers the development of the Palestinian economy.
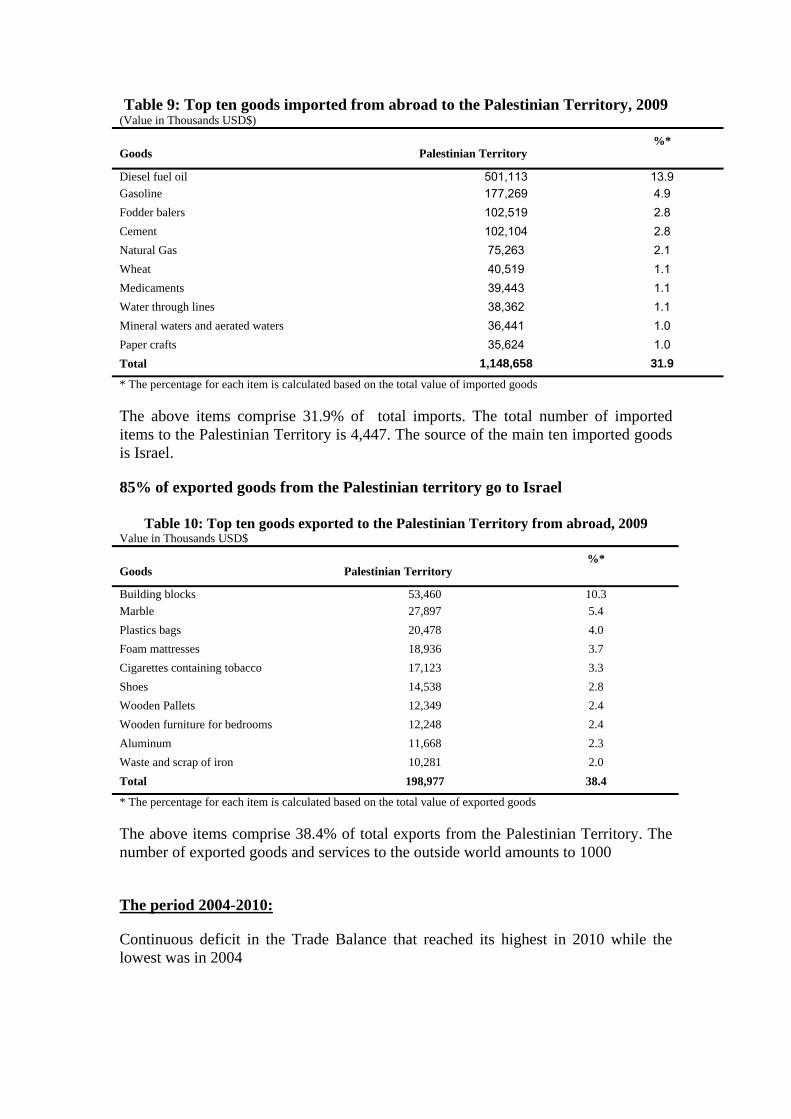
Table 9: Top ten goods imported from abroad to the Palestinian Territory, 2009 (Value in Thousands USD$)
Goods Palestinian Territory %*
Diesel fuel oil 501,113 13.9 Gasoline 177,269 4.9 Fodder balers 102,519 2.8 Cement 102,104 2.8 Natural Gas 75,263 2.1 Wheat 40,519 1.1 Medicaments 39,443 1.1 Water through lines 38,362 1.1 Mineral waters and aerated waters 36,441 1.0 Paper crafts 35,624 1.0 Total 1,148,658 31.9* The percentage for each item is calculated based on the total value of imported goods
The above items comprise 31.9% of total imports. The total number of imported items to the Palestinian Territory is 4,447. The source of the main ten imported goods is Israel.
85% of exported goods from the Palestinian territory go to Israel
Table 10: Top ten goods exported to the Palestinian Territory from abroad, 2009 Value in Thousands USD$
Goods Palestinian Territory %*
Building blocks 53,460 10.3 Marble 27,897 5.4 Plastics bags 20,478 4.0 Foam mattresses 18,936 3.7 Cigarettes containing tobacco 17,123 3.3 Shoes 14,538 2.8 Wooden Pallets 12,349 2.4 Wooden furniture for bedrooms 12,248 2.4 Aluminum 11,668 2.3 Waste and scrap of iron 10,281 2.0 Total 198,977 38.4
* The percentage for each item is calculated based on the total value of exported goods
The above items comprise 38.4% of total exports from the Palestinian Territory. The number of exported goods and services to the outside world amounts to 1000
The period 2004-2010:
Continuous deficit in the Trade Balance that reached its highest in 2010 while the lowest was in 2004
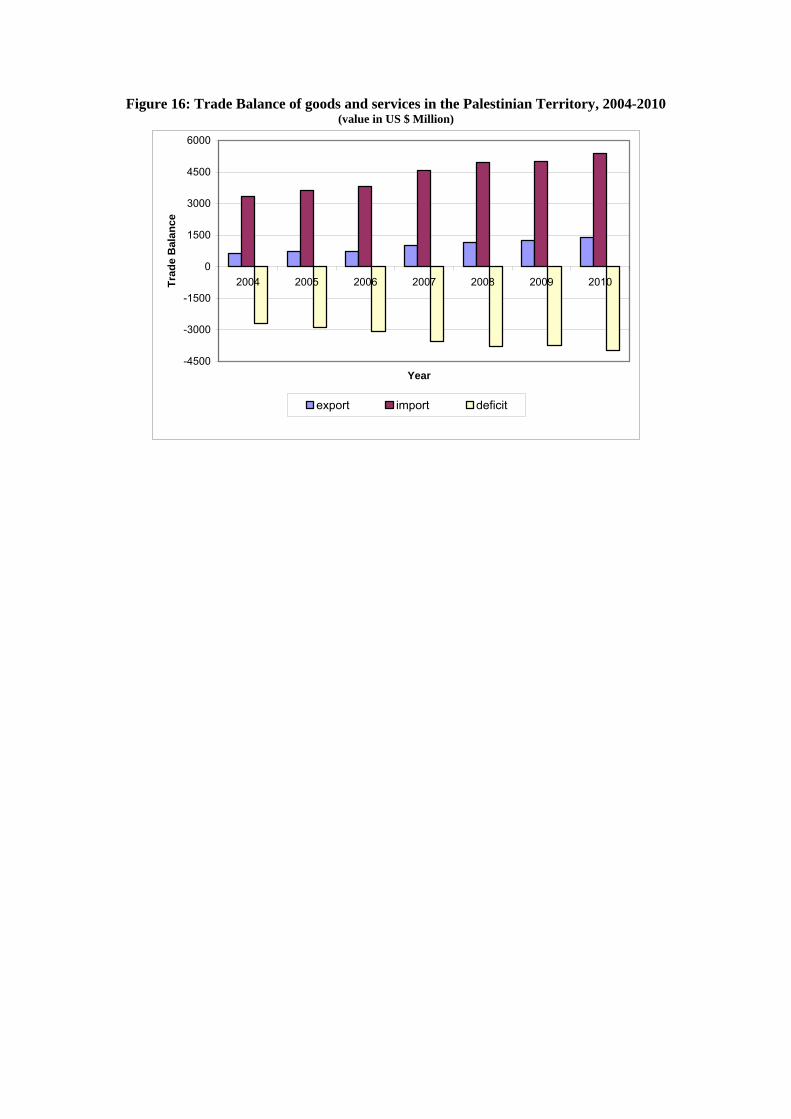
Figure 16: Trade Balance of goods and services in the Palestinian Territory, 2004-2010 (value in US $ Million)
-4500
-3000
-1500
0
1500
3000
4500
6000
2004 2005 2006 2007 2008 2009 2010
Year
Trad
e B
alan
ce
export import deficit
8. Private Final Consumption (Households, Non-Profit Institutions)
Households’ final consumption and Non-Profit Institutions (Private Consumption) are important components of the macroeconomics in the Palestinian Territory. During 2010, the value of Private Final Consumption reached US$ 6,109.7 Million, which contributes 106% to the GDP. The government and private expenditure together constitutes high percentage that reflects the large deficit in the Palestinian trade balance
Figure 17: Final Private Consumption and GDP in the Palestinian Territory, 2004-2010 (value in US $ Million)
3,000
3,500
4,000
4,500
5,000
5,500
6,000
6,500
2004 2005 2006 2007 2009 2010Year
val
ue
Private consumption GDP
9. Government Sector
The Government Sector accounts for 22.2% of GDP in the Palestinian Territory and that reflects the necessity to shed light on the financial situation of the Palestinian National Authority taking into consideration the rapid political and economic changes that are affecting its financial performance.
Israeli occupation along with its measures of economic blockade, curfews, siege and restriction of movement contribute to weakening of the economic and development structure of the Palestinian Territory.
After the financial siege imposed on the Palestinian Territory in 2006 and the sequence of political events that resulted in the formation of caretaker government in mid-2007, a Reform and Development Plan (2008-2010) was developed and put into implementation despite the Israeli War in 2008 on Gaza Strip and Israeli siege that resulted in the destruction of the Palestinian economy.
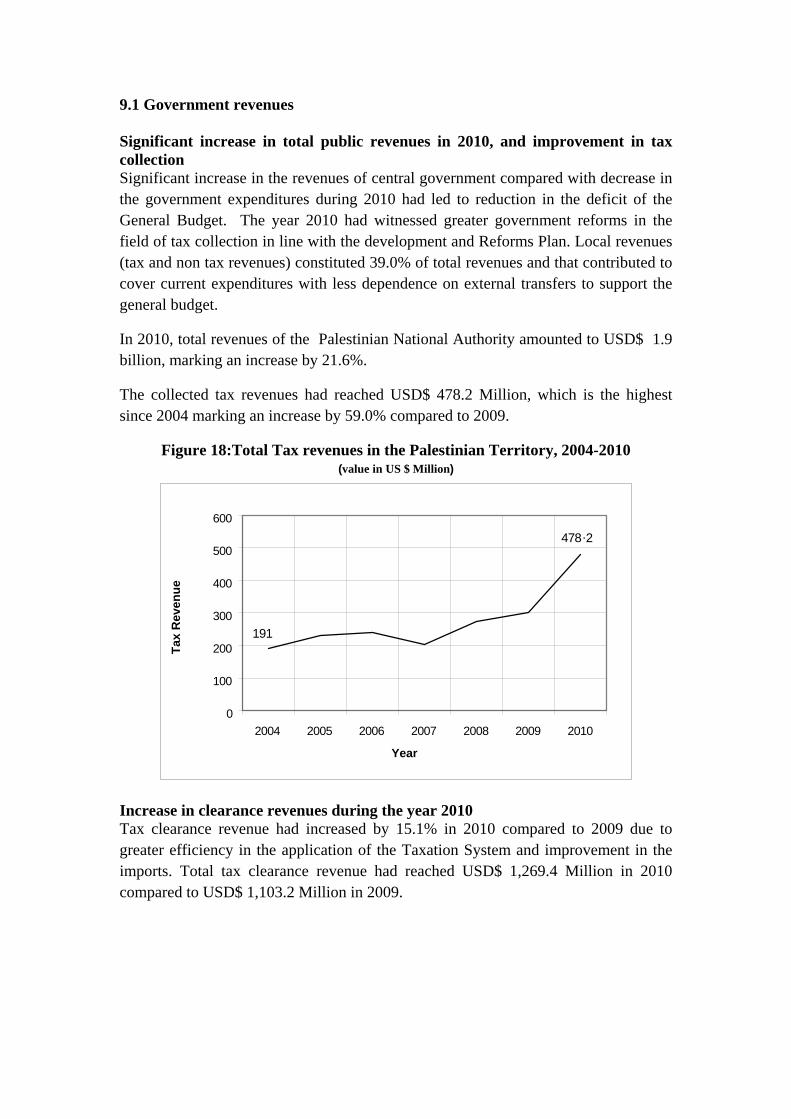
9.1 Government revenues Significant increase in total public revenues in 2010, and improvement in tax collection Significant increase in the revenues of central government compared with decrease in the government expenditures during 2010 had led to reduction in the deficit of the General Budget. The year 2010 had witnessed greater government reforms in the field of tax collection in line with the development and Reforms Plan. Local revenues (tax and non tax revenues) constituted 39.0% of total revenues and that contributed to cover current expenditures with less dependence on external transfers to support the general budget.
In 2010, total revenues of the Palestinian National Authority amounted to USD$ 1.9 billion, marking an increase by 21.6%.
The collected tax revenues had reached USD$ 478.2 Million, which is the highest since 2004 marking an increase by 59.0% compared to 2009.
Figure 18:Total Tax revenues in the Palestinian Territory, 2004-2010 )value in US $ Million(
191
478 .2
0
100
200
300
400
500
600
2004 2005 2006 2007 2008 2009 2010
Year
Tax
Rev
enue
Increase in clearance revenues during the year 2010 Tax clearance revenue had increased by 15.1% in 2010 compared to 2009 due to greater efficiency in the application of the Taxation System and improvement in the imports. Total tax clearance revenue had reached USD$ 1,269.4 Million in 2010 compared to USD$ 1,103.2 Million in 2009.
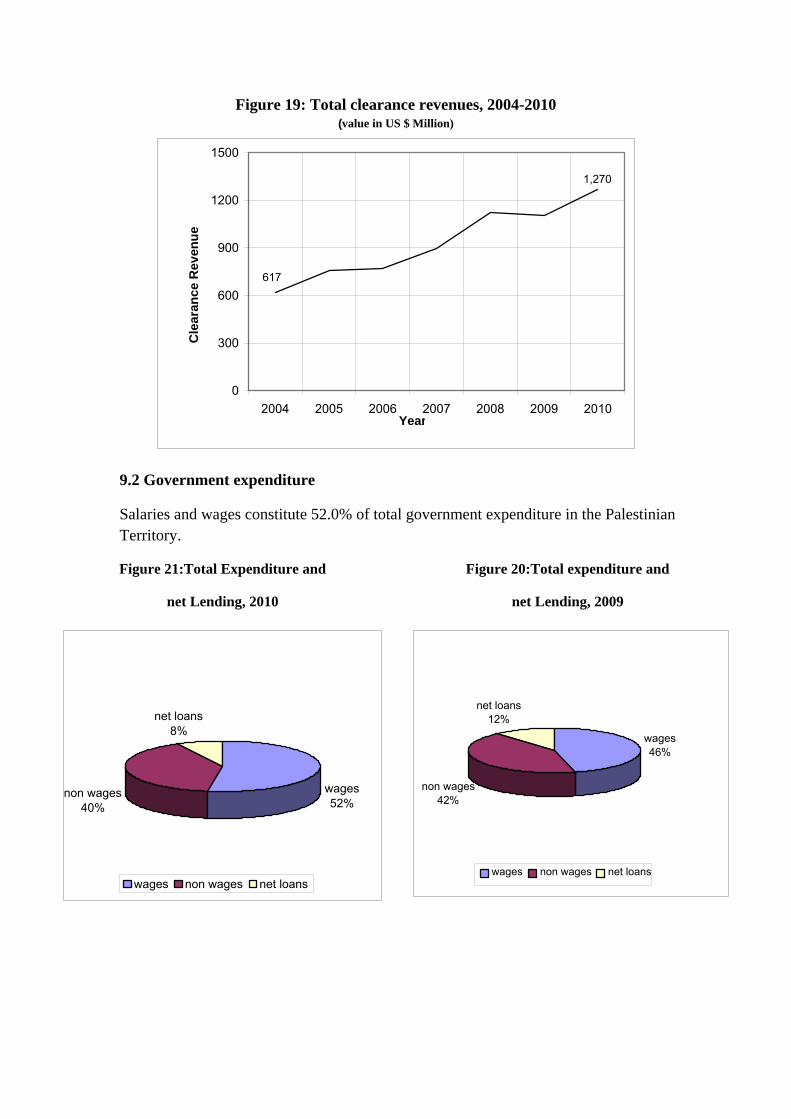
Figure 19: Total clearance revenues, 2004-2010 value in US $ Million)(
1,270
617
0
300
600
900
1200
1500
2004 2005 2006 2007 2008 2009 2010Year
Cle
aran
ce R
even
ue
9.2 Government expenditure
Salaries and wages constitute 52.0% of total government expenditure in the Palestinian Territory.
Figure 21:Total Expenditure and
net Lending, 2010
wages52%
non wages40%
net loans8%
wages non wages net loans
Figure 20:Total expenditure and
net Lending, 2009
wages46%
non wages42%
net loans12%
wages non wages net loans
Decline in government expenditure in 2010 Government expenditures had been reduced by 2.7% to reach USD$ 3,101.7 Million in 2010 compared to USD$ 3,189.8 Million in 2009.
The decline in government expenditure was as a result of decrease in non-wage expenditure by 8.2%. On the other hand, wage expenditures had increased in 2010 by 10.9% to reach its highest at USD$ 1,626.8 Million.
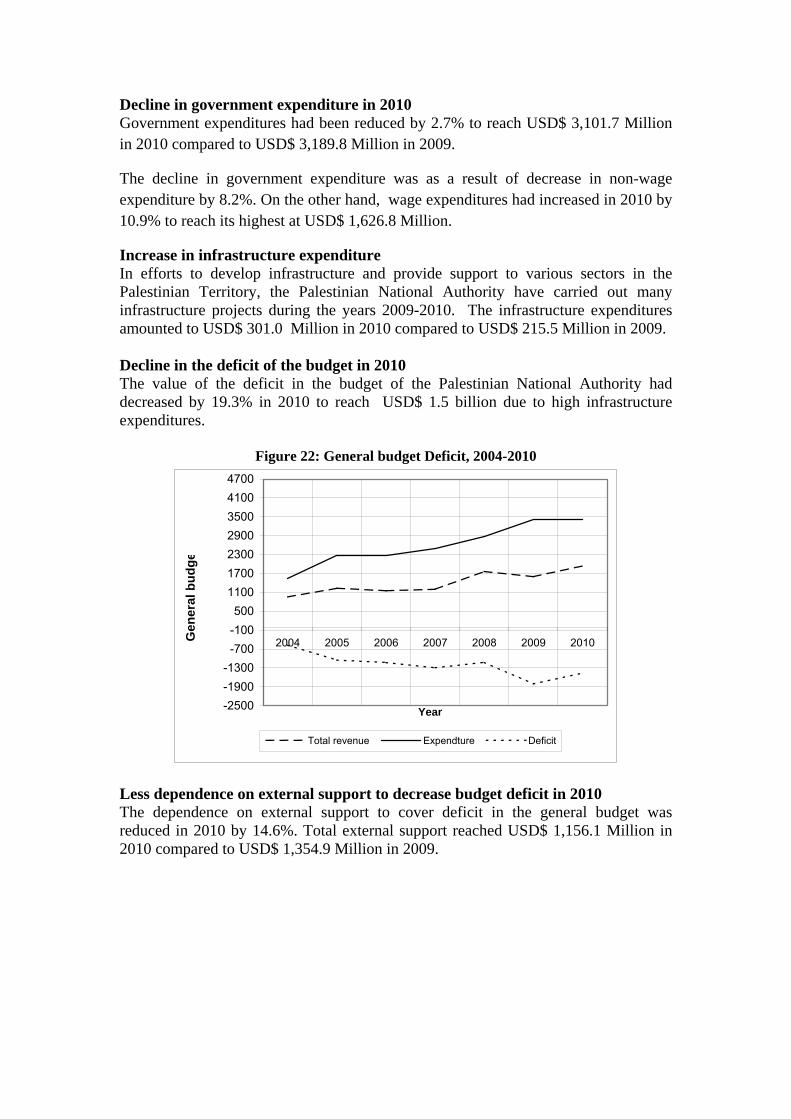
Increase in infrastructure expenditure In efforts to develop infrastructure and provide support to various sectors in the Palestinian Territory, the Palestinian National Authority have carried out many infrastructure projects during the years 2009-2010. The infrastructure expenditures amounted to USD$ 301.0 Million in 2010 compared to USD$ 215.5 Million in 2009. Decline in the deficit of the budget in 2010 The value of the deficit in the budget of the Palestinian National Authority had decreased by 19.3% in 2010 to reach USD$ 1.5 billion due to high infrastructure expenditures.
Figure 22: General budget Deficit, 2004-2010
-2500-1900-1300
-700-100500
1100170023002900350041004700
2004 2005 2006 2007 2008 2009 2010
Year
Gen
eral
bud
ge
Total revenue Expendture Deficit
Less dependence on external support to decrease budget deficit in 2010 The dependence on external support to cover deficit in the general budget was reduced in 2010 by 14.6%. Total external support reached USD$ 1,156.1 Million in 2010 compared to USD$ 1,354.9 Million in 2009.
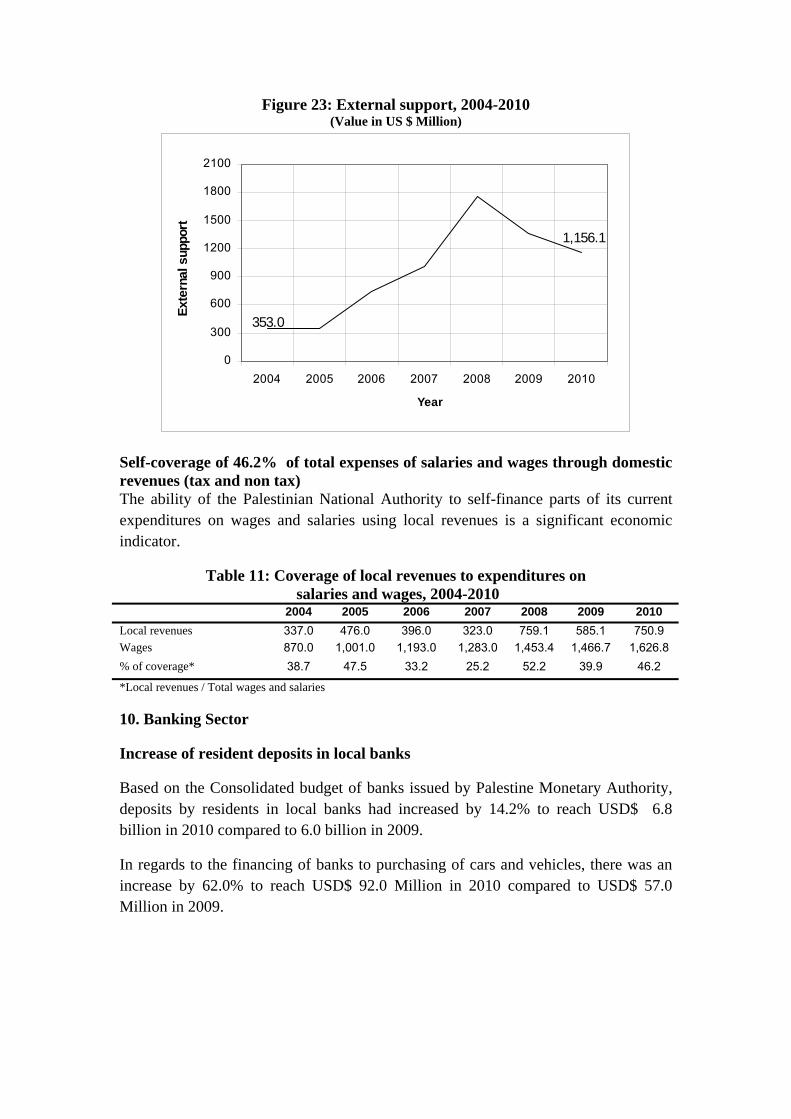
Figure 23: External support, 2004-2010 (Value in US $ Million)
1,156.1
353.0
0
300
600
900
1200
1500
1800
2100
2004 2005 2006 2007 2008 2009 2010
Year
Ext
erna
l sup
port
Self-coverage of 46.2% of total expenses of salaries and wages through domestic revenues (tax and non tax) The ability of the Palestinian National Authority to self-finance parts of its current expenditures on wages and salaries using local revenues is a significant economic indicator.
Table 11: Coverage of local revenues to expenditures on salaries and wages, 2004-2010
2004 2005 2006 2007 2008 2009 2010 Local revenues 337.0 476.0 396.0 323.0 759.1 585.1 750.9 Wages 870.0 1,001.0 1,193.0 1,283.0 1,453.4 1,466.7 1,626.8 % of coverage* 38.7 47.5 33.2 25.2 52.2 39.9 46.2
*Local revenues / Total wages and salaries
10. Banking Sector
Increase of resident deposits in local banks
Based on the Consolidated budget of banks issued by Palestine Monetary Authority, deposits by residents in local banks had increased by 14.2% to reach USD$ 6.8 billion in 2010 compared to 6.0 billion in 2009.
In regards to the financing of banks to purchasing of cars and vehicles, there was an increase by 62.0% to reach USD$ 92.0 Million in 2010 compared to USD$ 57.0 Million in 2009.
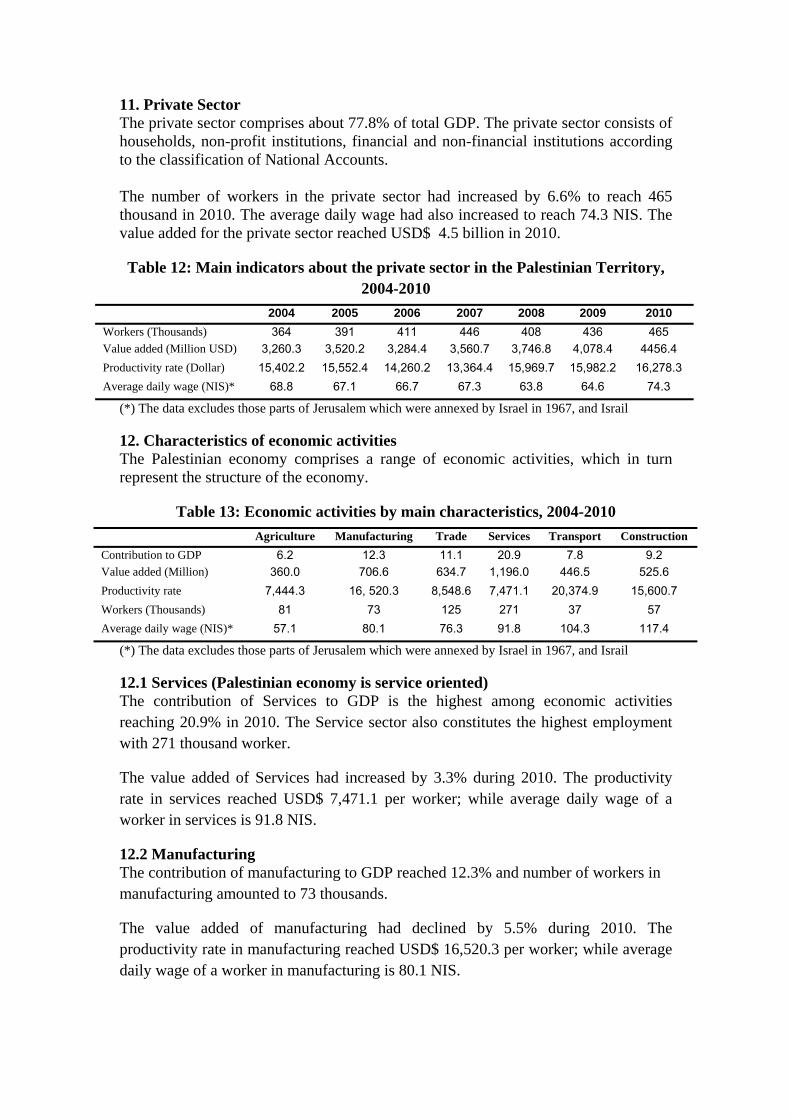
11. Private Sector The private sector comprises about 77.8% of total GDP. The private sector consists of households, non-profit institutions, financial and non-financial institutions according to the classification of National Accounts. The number of workers in the private sector had increased by 6.6% to reach 465 thousand in 2010. The average daily wage had also increased to reach 74.3 NIS. The value added for the private sector reached USD$ 4.5 billion in 2010.
Table 12: Main indicators about the private sector in the Palestinian Territory, 2004-2010
2004 2005 2006 2007 2008 2009 2010 Workers (Thousands) 364 391 411 446 408 436 465 Value added (Million USD) 3,260.3 3,520.2 3,284.4 3,560.7 3,746.8 4,078.4 4456.4 Productivity rate (Dollar) 15,402.2 15,552.4 14,260.2 13,364.4 15,969.7 15,982.2 16,278.3 Average daily wage (NIS)* 68.8 67.1 66.7 67.3 63.8 64.6 74.3
(*) The data excludes those parts of Jerusalem which were annexed by Israel in 1967, and Israil 12. Characteristics of economic activities The Palestinian economy comprises a range of economic activities, which in turn represent the structure of the economy.
Table 13: Economic activities by main characteristics, 2004-2010 Agriculture Manufacturing Trade Services Transport Construction
Contribution to GDP 6.2 12.3 11.1 20.9 7.8 9.2 Value added (Million) 360.0 706.6 634.7 1,196.0 446.5 525.6 Productivity rate 7,444.3 16, 520.3 8,548.6 7,471.1 20,374.9 15,600.7 Workers (Thousands) 81 73 125 271 37 57 Average daily wage (NIS)* 57.1 80.1 76.3 91.8 104.3 117.4
(*) The data excludes those parts of Jerusalem which were annexed by Israel in 1967, and Israil 12.1 Services (Palestinian economy is service oriented) The contribution of Services to GDP is the highest among economic activities reaching 20.9% in 2010. The Service sector also constitutes the highest employment with 271 thousand worker.
The value added of Services had increased by 3.3% during 2010. The productivity rate in services reached USD$ 7,471.1 per worker; while average daily wage of a worker in services is 91.8 NIS.
12.2 Manufacturing The contribution of manufacturing to GDP reached 12.3% and number of workers in manufacturing amounted to 73 thousands.
The value added of manufacturing had declined by 5.5% during 2010. The productivity rate in manufacturing reached USD$ 16,520.3 per worker; while average daily wage of a worker in manufacturing is 80.1 NIS.
12.3 Agriculture
16.0% of the total area of the Palestinian Territory is cultivated land area The cultivated land area comprises 16.0% of the total area of Palestinian Territory during the agricultural year 2009/2010, based on the preliminary results of the Agriculture Census 2010.
The contribution of Agriculture to GDP reached 6.2% and the value added of Agriculture increased by 22.8% during 2010. The number of workers in Agriculture increased by 6.3% to reach 81 thousands in 2010.
The productivity rate in agricultural fields reached USD$ 7,444.3 per worker, while average daily wage of a worker in agriculture is 57.1 NIS.
12.4 Wholesale and Retail Trade
The contribution of the Wholesale and Retail Trade to GDP reached 11.1% and number of workers had increased by 6.4% to reach 125 thousands in 2010 compared to 2009. The value added of this sector had increased by 12.0% during 2010. The productivity rate in Wholesale and Retail Trade reached USD$ 8,548.6 per worker, while average daily wage of a worker in this sector is 76.3 NIS.
12.5 Construction
The value added of the Construction Activity had increased by 35.6% in 2010 compared to 2009. In addition, administrative records also showed a rise by 17.5% in the number of building licenses issued in the West Bank for the year 2010. The prices of construction materials rose by 1.6% compared to 2009 despite quantities of imported cement reached 1.3 million ton in 2010 compared to 1.2 million ton in 2009. The year 2010 also witnessed a rise by 26.2% in the number of workers in construction activity to reach 57 thousand workers in 2010. The average daily wage of a worker in the Construction Activity is considered the highest among economic activities to reach NIS 117.4; while productivity rate reached USD$ 15,600.7 per worker.
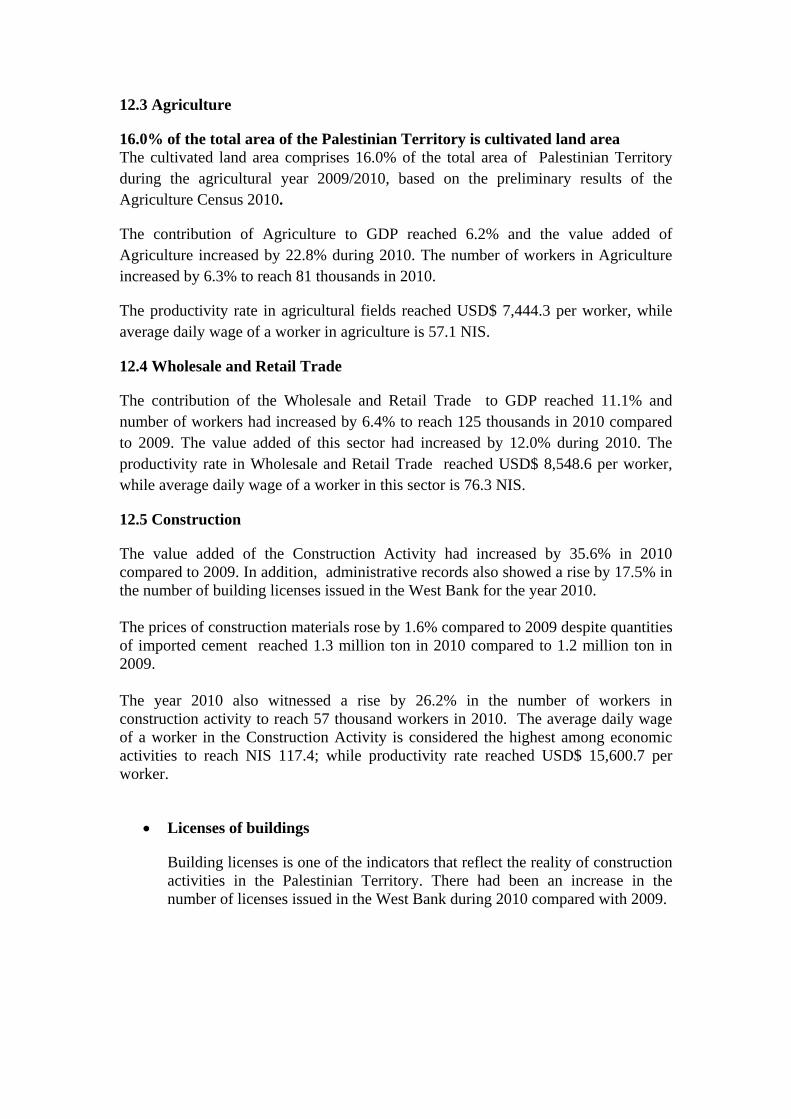
• Licenses of buildings
Building licenses is one of the indicators that reflect the reality of construction activities in the Palestinian Territory. There had been an increase in the number of licenses issued in the West Bank during 2010 compared with 2009.
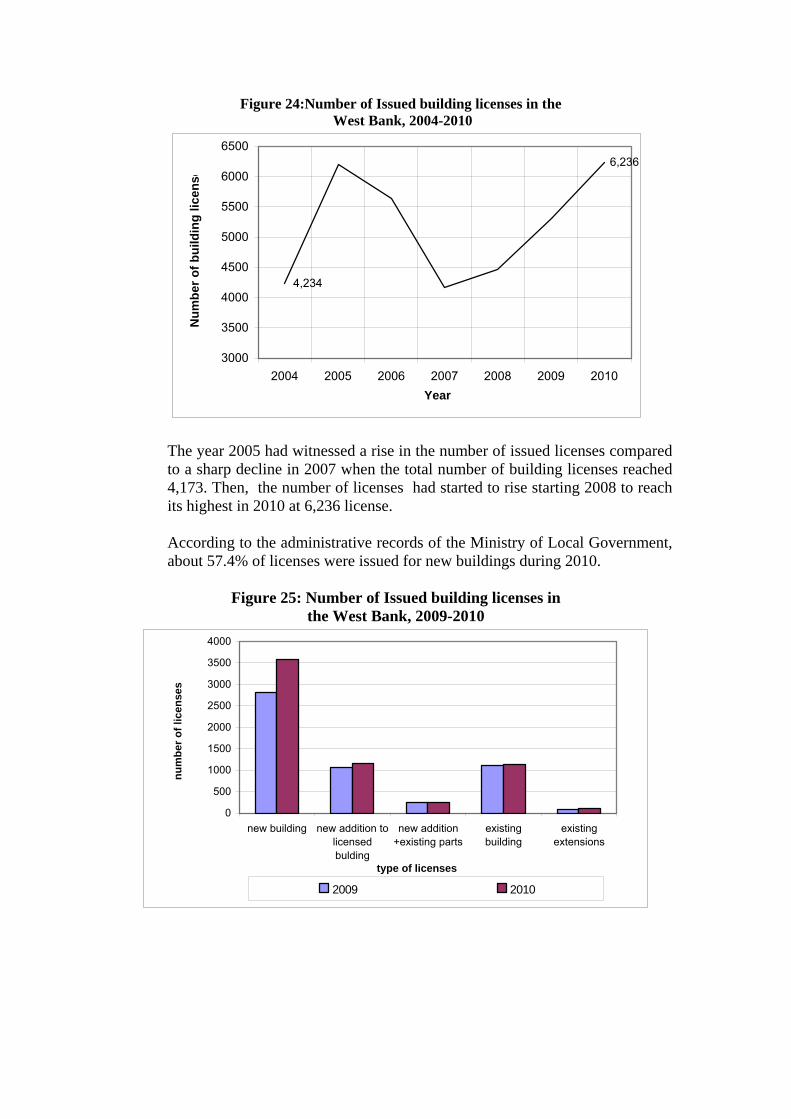
Figure 24:Number of Issued building licenses in the West Bank, 2004-2010
6,236
4,234
3000
3500
4000
4500
5000
5500
6000
6500
2004 2005 2006 2007 2008 2009 2010Year
Num
ber o
f bui
ldin
g lic
ense
The year 2005 had witnessed a rise in the number of issued licenses compared to a sharp decline in 2007 when the total number of building licenses reached 4,173. Then, the number of licenses had started to rise starting 2008 to reach its highest in 2010 at 6,236 license. According to the administrative records of the Ministry of Local Government, about 57.4% of licenses were issued for new buildings during 2010.
Figure 25: Number of Issued building licenses in the West Bank, 2009-2010
0
500
1000
1500
2000
2500
3000
3500
4000
new building new addition tolicensedbulding
new addition+existing parts
existingbuilding
existingextensions
type of licenses
num
ber o
f lic
ense
s
2009 2010
• Quantities of cement The quantities of cement imported from abroad is one of the important indicators that demonstrate the performance of the construction sector in the Palestinian Territory, where there had been a rise in the quantities of imported cement in 2010 compared to 2009.
Figure 26:Quantities of imported Cements to the West Bank and Gaza Strip, 2004-2010
0
200
400
600
800
1000
1200
1400
1600
2004 2005 2006 2007 2008 2009 2010
Year
Qua
ntiti
es o
f im
port
ed c
emen
ts in
Th
ousa
nd T
on
West bank Gaza strip
Gaza Strip had witnessed a significant decline in the quantities of imported cement since 2006 till 2010. Records show that during 2008, no quantities of cement was imported to the Gaza Strip from abroad.
• Construction Cost Index (CCI)
The Construction Cost Index had increased by 1.6% in 2010 compared to 2009.
Table 14: Construction Cost Index (CCI) by major groups in the West Bank, 2008-2010 Major Groups 2008 2009 2010
Raw materials 114.13 104.30 105.84 Hiring of equipment 119.61 131.11 137.28
Labor cost and wages 105.30 116.69 118.89
All- Items Construction Cost Index 111.63 107.67 109.36
12.6 Tourism
The tourism sector is most sensitive and significantly influenced by the political reality of the Palestinian Territory. Israeli occupation, siege and instability are all hamper the growth of the tourism sector and its contribution to the Palestinian economy. Despite the characteristics of the Palestinian Territory that is rich in its religious and cultural heritage, the contribution of the tourism sector to GDP does not exceed 3.0%.
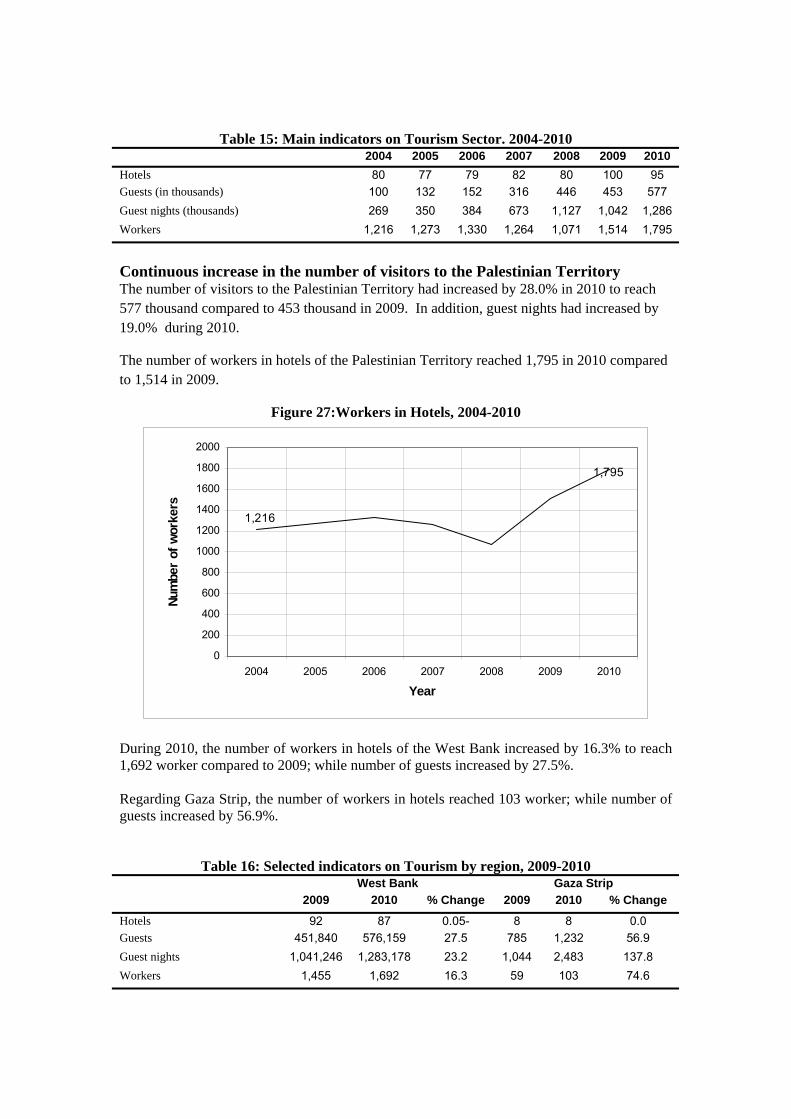
Table 15: Main indicators on Tourism Sector. 2004-2010 2004 2005 2006 2007 2008 2009 2010
Hotels 80 77 79 82 80 100 95 Guests (in thousands) 100 132 152 316 446 453 577 Guest nights (thousands) 269 350 384 673 1,127 1,042 1,286 Workers 1,216 1,273 1,330 1,264 1,071 1,514 1,795
Continuous increase in the number of visitors to the Palestinian Territory The number of visitors to the Palestinian Territory had increased by 28.0% in 2010 to reach 577 thousand compared to 453 thousand in 2009. In addition, guest nights had increased by 19.0% during 2010.
The number of workers in hotels of the Palestinian Territory reached 1,795 in 2010 compared to 1,514 in 2009.
Figure 27:Workers in Hotels, 2004-2010
1,795
1,216
0
200
400
600
800
1000
1200
1400
1600
1800
2000
2004 2005 2006 2007 2008 2009 2010
Year
Num
ber
of w
orke
rs
During 2010, the number of workers in hotels of the West Bank increased by 16.3% to reach 1,692 worker compared to 2009; while number of guests increased by 27.5%. Regarding Gaza Strip, the number of workers in hotels reached 103 worker; while number of guests increased by 56.9%.
Table 16: Selected indicators on Tourism by region, 2009-2010 West Bank Gaza Strip
2009 2010 % Change 2009 2010 % ChangeHotels 92 87 -0.05 8 8 0.0 Guests 451,840 576,159 27.5 785 1,232 56.9 Guest nights 1,041,246 1,283,178 23.2 1,044 2,483 137.8 Workers 1,455 1,692 16.3 59 103 74.6