
Paleoliquefaction in Christchurch, New Zealand
18
1 Paleoliquefaction in Christchurch, New Zealand Sarah H. Bastin † , Mark C. Quigley, and Kari Bassett Department of Geological Sciences, University of Canterbury, Christchurch 8014, New Zealand ABSTRACT Liquefaction during the 2010 moment magnitude (M w ) 7.1 Darfield earthquake and large aftershocks (known as the Canterbury earthquake sequence) caused severe damage to land and infrastructure in Christchurch, New Zealand. Liquefaction occurred at M w - weighted peak ground accelerations (PGA 7.5 ) as low as 0.06g at highly susceptible sites. Trenching investigations conducted at two sites in eastern Christchurch enabled docu- mentation of the geologic expressions of re- current liquefaction and determination of whether evidence of pre–Canterbury earth- quake sequence liquefaction is present. Exca- vation to water table depths (~1–2 m below surface) across sand blow vents and fissures revealed multiple generations of Canterbury earthquake sequence liquefaction “feeder” dikes that crosscut Holocene-to-recent fluvial and anthropogenic stratigraphy. Canterbury earthquake sequence dikes crosscut and in- trude oxidized and weathered dikes and sills at both sites that are interpreted as evidence of pre–Canterbury earthquake sequence liq- uefaction. Crosscutting relationships com- bined with 14 C dating constrain the timing of the pre–Canterbury earthquake sequence liquefaction to post–A.D. 1660 to pre–ca. A.D. 1905 at one site, and post–A.D. 1415 to pre– ca. A.D. 1910 at another site. The PGA 7.5 of five well-documented historical earthquakes that caused regional damage between 1869 and 1922 are approximated for the study sites using a New Zealand specific ground motion prediction equation. Only the June 1869 M w ~4.8 Christchurch earthquake pro- duces a median modeled PGA 7.5 that exceeds the PGA 7.5 0.06g threshold for liquefaction. Prehistoric earthquakes sourced from re- gional faults, including the 1717 Alpine fault M w ~7.9 ± 0.3 and ca. 500–600 yr B.P. M w ≥ 7.1 Porters Pass fault earthquakes, provide additional potential paleoseismic sources for pre–Canterbury earthquake sequence lique- faction. The recognition of pre–Canterbury earthquake sequence liquefaction in late Holocene sediments is consistent with hazard model-based predicted return times of PGAs exceeding the liquefaction triggering thresh- old in Christchurch. Residential develop- ment in eastern Christchurch from ca. 1860 to 2005 occurred in areas where geologic evidence for pre–Canterbury earthquake se- quence liquefaction was present, highlighting the potential of paleoliquefaction studies to predict locations of future liquefaction and to contribute to seismic hazard assessments and land-use planning. INTRODUCTION Cyclic shearing of loosely compacted and fluid-saturated sediments during earthquake- induced ground motion results in excess pore- water pressures and reduced shear strength in the affected media. Sediment transitions to a liquefied state as excess pore-water pres- sures exceed the static confining pressure, causing large strains and flowage of the sedi- ment, and breakdown of the grain arrangement (Seed and Idriss, 1982; Idriss and Boulanger, 2008). Liquefied sediment may be ejected to the ground surface via feeder dikes, that com- monly utilize fractures in the sedimentary cover overlying the liquefied stratum. Surface ejecta commonly manifests as sand blows, blistering of the surface by near-surface sediment injec- tion, and vertical (subsidence) or lateral (lat- eral spreading) ground deformation (Seed and Idriss, 1982; Sims and Garvin, 1995; Tuttle and Barstow, 1996; Obermeier, 1996; Galli, 2000; Idriss and Boulanger, 2008; Cubrinovski and Green, 2010; Tuttle and Hartleb, 2012; Quigley et al., 2013). Surface liquefaction features may be rapidly (i.e., within hours to months) reworked into forms that are difficult to distinguish from eolian, fluvial, or estuarine deposits (Sims and Garvin, 1995; Reid et al., 2012; Quigley et al., 2013), complicating the geologic identification of prehistoric features. However, subsurface liquefaction features such as dikes, laterally injected sills, and other injection features are commonly present in the geologic record where host sediments are preserved, enabling the detection of historic or prehistoric (i.e., paleoliquefaction) events (Obermeier, 1996; Obermeier et al., 2005; Tuttle et al., 2006). Paleoliquefaction features ranging in age from 10 2 yr (Sims and Garvin, 1995) to several 10 8 yr (Loope et al., 2013) have been identified from geologic inves- tigations. Paleoliquefaction provides evidence for paleoearthquakes with site-specific strong ground motions and shaking durations that exceeded threshold values for liquefaction (Green et al., 2005). Analysis of paleolique- faction features preserved in the geologic record may enable recurrence intervals, ground motions, and magnitudes of the paleoearth- quakes to be estimated (Obermeier et al., 1991; Obermeier, 1996; Tuttle et al., 2002; Green et al., 2005; Tuttle and Atkinson, 2010). Paleo- liquefaction investigations rely on the accurate identification of features, interpretation of their relative ages, and constraints on the shaking intensities under which liquefaction was trig- gered (Obermeier et al., 1991; Sims and Garvin, 1995; Obermeier, 1996; Tuttle, 2001; Tuttle et al., 2002). The minimum peak ground accel- eration (PGA) required to trigger liquefaction is typically determined for a site using site- specific geotechnical tests (i.e., cone penetration tests [CPT], standard penetrations tests [SPT], and Swedish weight sounding [SWS]; Seed and Idriss, 1982; Idriss and Boulanger, 2008). Seis- mic triggering thresholds for initiating liquefac- tion are typically characterized using moment magnitude–weighted PGA 7.5 (Green et al., 2005; Quigley, et al., 2013). A PGA 7.5 value rep- resents the equivalent PGA for a M w 7.5 event. This is calculated from a magnitude scaling fac- tor (MSF) that accounts for the shaking dura- tion and frequency content of the ground motion (PGA 7.5 = PGA × 1/MSF; Idriss and Boulanger, 2008). Recent compilations of earthquake and liquefaction data suggest a liquefaction-induc- ing threshold of PGA 7.5 = 0.09g (Santucci de Magistris et al., 2013), although minor lique- faction has been reported in highly susceptible sediments under PGA 7.5 as low as ~0.06g (Quig- ley et al., 2013). Sedimentary (e.g., grain size, clay content) and hydrologic characteristics GSA Bulletin; Month/Month 2015; v. 1xx; no. X/X; p. 1–18; doi: 10.1130/B31174.1; 11 figures; 3 tables; Data Repository item 2015131.; published online XX Month 2014. † [email protected] For permission to copy, contact [email protected] © 2015 Geological Society of America
Transcript of Paleoliquefaction in Christchurch, New Zealand

Paleoliquefaction in Christchurch, New Zealand
Geological Society of America Bulletin, v. 1XX, no. XX/XX 1
Paleoliquefaction in Christchurch, New Zealand
Sarah H. Bastin†, Mark C. Quigley, and Kari BassettDepartment of Geological Sciences, University of Canterbury, Christchurch 8014, New Zealand
ABSTRACT
Liquefaction during the 2010 moment magnitude (Mw) 7.1 Darfi eld earthquake and large aftershocks (known as the Canterbury earthquake sequence) caused severe damage to land and infrastructure in Christchurch, New Zealand. Liquefaction occurred at Mw-weighted peak ground accelerations (PGA7.5) as low as 0.06g at highly susceptible sites. Trenching investigations conducted at two sites in eastern Christchurch enabled docu-mentation of the geologic expressions of re-current liquefaction and determination of whether evidence of pre–Canterbury earth-quake sequence liquefaction is present. Exca-vation to water table depths (~1–2 m below surface) across sand blow vents and fi ssures revealed multiple generations of Canterbury earthquake sequence liquefaction “feeder” dikes that crosscut Holocene-to-recent fl uvial and anthropogenic stratigraphy. Canterbury earthquake sequence dikes crosscut and in-trude oxidized and weathered dikes and sills at both sites that are interpreted as evidence of pre–Canterbury earthquake sequence liq-uefaction. Crosscutting relationships com-bined with 14C dating constrain the timing of the pre–Canterbury earthquake sequence liquefaction to post–A.D. 1660 to pre–ca. A.D. 1905 at one site, and post–A.D. 1415 to pre–ca. A.D. 1910 at another site. The PGA7.5 of fi ve well-documented historical earthquakes that caused regional damage between 1869 and 1922 are approximated for the study sites using a New Zealand specifi c ground motion prediction equation. Only the June 1869 Mw ~4.8 Christchurch earthquake pro-duces a median modeled PGA7.5 that exceeds the PGA7.5 0.06g threshold for liquefaction. Prehistoric earthquakes sourced from re-gional faults, including the 1717 Alpine fault Mw ~7.9 ± 0.3 and ca. 500–600 yr B.P. Mw ≥ 7.1 Porters Pass fault earthquakes, provide additional potential paleoseismic sources for pre–Canterbury earthquake sequence lique-faction. The recognition of pre–Canterbury
earthquake sequence liquefaction in late Holo cene sediments is consistent with hazard model-based predicted return times of PGAs exceeding the liquefaction triggering thresh-old in Christchurch. Residential develop-ment in eastern Christchurch from ca. 1860 to 2005 occurred in areas where geologic evidence for pre–Canterbury earthquake se-quence liquefaction was present, highlighting the potential of paleoliquefaction studies to predict locations of future liquefaction and to contribute to seismic hazard assessments and land-use planning.
INTRODUCTION
Cyclic shearing of loosely compacted and
fl uid-saturated sediments during earthquake-
induced ground motion results in excess pore-
water pressures and reduced shear strength
in the affected media. Sediment transitions
to a liquefi ed state as excess pore-water pres-
sures exceed the static confining pressure,
causing large strains and fl owage of the sedi-
ment, and breakdown of the grain arrangement
(Seed and Idriss, 1982; Idriss and Boulanger,
2008). Lique fi ed sediment may be ejected to
the ground surface via feeder dikes, that com-
monly utilize fractures in the sedimentary cover
overlying the liquefi ed stratum. Surface ejecta
commonly manifests as sand blows, blistering
of the surface by near-surface sediment injec-
tion, and vertical (subsidence) or lateral (lat-
eral spreading) ground deformation (Seed and
Idriss, 1982; Sims and Garvin, 1995; Tuttle
and Barstow, 1996; Obermeier, 1996; Galli,
2000; Idriss and Boulanger, 2008; Cubrinovski
and Green, 2010; Tuttle and Hartleb , 2012;
Quigley et al., 2013). Surface liquefaction
features may be rapidly (i.e., within hours to
months) reworked into forms that are diffi cult
to distinguish from eolian, fl uvial, or estuarine
deposits (Sims and Garvin, 1995; Reid et al.,
2012; Quigley et al., 2013), complicating the
geologic identifi cation of prehistoric features.
However, subsurface liquefaction features
such as dikes, laterally injected sills, and other
injection features are commonly present in
the geologic record where host sediments are
preserved, enabling the detection of historic
or prehistoric (i.e., paleoliquefaction) events
(Obermeier, 1996; Obermeier et al., 2005;
Tuttle et al., 2006). Paleoliquefaction features
ranging in age from 102 yr (Sims and Garvin,
1995) to several 108 yr (Loope et al., 2013)
have been identified from geologic inves-
tigations.
Paleoliquefaction provides evidence for
paleoearthquakes with site-specific strong
ground motions and shaking durations that
exceeded threshold values for liquefaction
(Green et al., 2005). Analysis of paleo lique-
faction features preserved in the geologic
record may enable recurrence intervals, ground
motions, and magnitudes of the paleoearth-
quakes to be estimated (Obermeier et al., 1991;
Obermeier, 1996; Tuttle et al., 2002; Green
et al., 2005; Tuttle and Atkinson, 2010). Paleo-
lique faction investigations rely on the accurate
identifi cation of features, interpretation of their
relative ages, and constraints on the shaking
intensities under which liquefaction was trig-
gered (Obermeier et al., 1991; Sims and Garvin,
1995; Obermeier, 1996; Tuttle, 2001; Tuttle
et al., 2002). The minimum peak ground accel-
eration (PGA) required to trigger liquefaction
is typically determined for a site using site-
specifi c geotechnical tests (i.e., cone penetration
tests [CPT], standard penetrations tests [SPT],
and Swedish weight sounding [SWS]; Seed and
Idriss, 1982; Idriss and Boulanger, 2008). Seis-
mic triggering thresholds for initiating liquefac-
tion are typically characterized using moment
magnitude–weighted PGA7.5 (Green et al.,
2005; Quigley, et al., 2013). A PGA7.5 value rep-
resents the equivalent PGA for a Mw 7.5 event.
This is calculated from a magnitude scaling fac-
tor (MSF) that accounts for the shaking dura-
tion and frequency content of the ground motion
(PGA7.5 = PGA × 1/MSF; Idriss and Boulanger,
2008). Recent compilations of earthquake and
liquefaction data suggest a liquefaction-induc-
ing threshold of PGA7.5 = 0.09g (Santucci de
Magistris et al., 2013), although minor lique-
faction has been reported in highly susceptible
sedi ments under PGA7.5 as low as ~0.06g (Quig-
ley et al., 2013). Sedimentary (e.g., grain size,
clay content) and hydrologic characteristics
GSA Bulletin; Month/Month 2015; v. 1xx; no. X/X; p. 1–18; doi: 10.1130/B31174.1; 11 fi gures; 3 tables; Data Repository item 2015131.;
published online XX Month 2014.
For permission to copy, contact [email protected]
© 2015 Geological Society of America

Bastin et al.
2 Geological Society of America Bulletin, v. 1XX, no. XX/XX
(e.g., water table depth) of the source sediment
infl uence liquefaction susceptibility.
The 2010–2011 Canterbury earthquake
sequence caused at least 10 distinct episodes
of observed liquefaction in parts of eastern
Christchurch, New Zealand (Quigley et al.,
2013). The most severe liquefaction-induced
damage was reported following the Septem-
ber 2010 Mw 7.1 Darfi eld main shock, and the
February 2011 Mw 6.2 (i.e., 2011 Christchurch
earthquake), June 2011 Mw 6.0, and December
2011 Mw 5.9 aftershock earthquakes (Fig. 1;
Cubrinovski and Green, 2010; Cubrinovski
et al., 2011; Quigley et al., 2013). As a result
of extensive land and infrastructure damage,
more than 6000 residential properties in east-
ern Christchurch were purchased by the cen-
tral government (http:// cera .govt .nz /residential
-red -zone). Recent estimates of post–insurance
pay-out losses exceed $NZ 1 billion ($U.S.
800 million; http:// www /stuff /co .nz /national
/christchurch -earthquake /8655455 /Govt -faces
-1 -billion -red -zone -shortfall). Understanding
the timing, location, magnitude, and frequency
of liquefaction-inducing earthquakes in Christ-
church (e.g., Almond et al., 2013; Bastin et al.,
2013) thus has the potential to inform land-
use planning decisions and make contribu-
tions to seismic hazard modeling (e.g., Stirling
et al., 2012).
Pre–Canterbury earthquake sequence lique-
faction was reported in Kaiapoi and Belfast
(Fig. 1B) following the 1901 Mw 6.8 Cheviot
earthquake (Berrill et al., 1994); however, no
pre–Canterbury earthquake sequence liquefac-
tion had been recorded in Christchurch. In this
study, we fi rst describe the subsurface mor-
phology of Canterbury earthquake sequence
lique faction features at two study sites, with
the goals of (1) documenting how this earth-
quake sequence is manifested in the geologic
record, and (2) characterizing the source layer
of contemporary liquefaction. We then present
new stratigraphic and chronologic evidence
for previously undocumented pre–Canterbury
earthquake sequence liquefaction in eastern
Christchurch.
GEOLOGIC SETTING
Christchurch Area
The city of Christchurch (population
~360,000) is primarily situated upon a low-relief
and low-elevation alluvial landscape (0–20 m
above sea level) on the east coast of New Zea-
land’s South Island (Fig. 1). The city and eastern
suburbs are predominantly underlain by drained
peat swamps, fl uvial sands and silts, and estua-
rine, dune, and foreshore sands (Fig. 1C; Brown
and Weeber, 1992). Channelized gravels in the
uppermost several meters are typically attrib-
uted to deposition by the braided Waimakariri
River that intermittently avulsed through the
city prior to European settlement (Fig. 1; Cowie,
1957; Brown and Weeber, 1992). To the west of
-43.5°
172°E 172.5°E
43.5°S
Greendale fault
Christchurch
PacificOcean
Fig.1C&D
Waimakariri River
22 Feb.201113 June2011
4 Sept.2010
23 Dec.2011
major fault rupture
other liquefaction triggering quakes
Christchurch
AN
Kaiapoi
PacificOcean
Belfast
CBD
Minor
Severe
Moderate
Avonside
0 21 3 Km
1870 Lake Ellesmere~Mw 5.7 +/– 0.1
1869 Christchurch~Mw 4.8 +/– 0.1
1922 Motunau~Mw 6.4 +/– 0.1
1901 Cheviot~Mw 6.8 +/– 0.1
1888 Hope Fault~Mw 7.2 +/– 0.1
Waimakariri River
Christchurch
0Km
500 50Km
C
0 21 3
1 ka
2 ka
3 ka
5 ka
7 ka
6.5
ka
CBD
Avonside
B
D
Km
Beach and dune sand
Alluvial sands & siltsAlluvial gravels
Drained peat swamps& estuaries
Estuary
Figure 1. (A) Epicentral locations of the 2010–2011 Canterbury earthquake sequence that generated liquefaction within Avonside. The rup-ture of the Greendale fault (bold line) and projected locations of the subsurface faults (dashed lines) that ruptured in the February, June, and December 2011 aftershocks are indicated (modifi ed from Quigley et al., 2013). (B) The approximate epicenter location of the fi ve historic earthquakes causing damage within the wider Christchurch area from 1869 to 1922. Pre–Canterbury earthquake sequence liquefaction was reported in Kaiapoi and Belfast (indicated) following the 1901 Cheviot earthquake. (C) Simplifi ed geological map of the Christchurch area (modifi ed from Brown and Weeber, 1992), with the approximate locations of the 7–1 ka shorelines indicated with respect to Avonside and the Central Business District (CBD). (D) The spatial extent and severity of liquefaction as mapped following the 22 February 2011 earthquake.

Paleoliquefaction in Christchurch, New Zealand
Geological Society of America Bulletin, v. 1XX, no. XX/XX 3
the central city, fl uvial sands and gravels pre-
dominate (Fig. 1C).
The sediments in eastern Christchurch were
deposited by shoreline progradation and marine
regression following the mid-Holocene high-
stand with shorelines recorded ~3 km west of
the present central city at ~6500 yr B.P. (Fig.
1C; Brown and Weeber, 1992). The fl uvial
sands and silts refl ect deposition by the mean-
dering Avon and Heathcote Rivers within the
city (Fig. 1C). The youthful, unconsolidated
nature of the fi ne sands to silt underlying eastern
Christchurch combined with high water tables
(1–2 m depth) and localized artesian water pres-
sures pose a long-recognized high liquefaction
hazard (Elder et al., 1991). This was confi rmed
during the Canterbury earthquake sequence
(Cubrinovski and Green, 2010). Liquefaction
may also have been exacerbated in parts of the
eastern suburbs by leakage of underlying arte-
sian aquifers through breached aquitards (Cox
et al., 2012).
Avonside Study Area
The study area of Avonside, eastern Christ-
church, experienced severe liquefaction-induced
damage during the Canterbury earthquake
sequence (Fig. 1D). Avonside is encompassed
within an inner meander bend of the Avon River,
which undergoes tidally infl uenced fl ow inver-
sions (Fig. 1C). The suburb is underlain by fi ne
sand and silt of point bar and overbank deposits
of the Avon River, along with coastal swamp
and sand dune deposits (Fig. 1C; Silby, 1856;
Brown and Weeber, 1992). Localized channel-
ized gravels that are present at ~2 m depth may
be related to historic fl oods of the Waimakariri
River through this area prior to European settle-
ment (Brown and Weeber, 1992). The position
of the ~5000 yr. B.P. coastline was ~3 km to
the west, and the ~3000 yr. B.P. coastline was
~0.5–1 km east of the study sites (Fig. 1C;
Brown and Weeber, 1992). The modern coast-
line is located ~5 km to the east (Fig. 1C). The
water table is located between 1 and 2 m depth;
however, it can rise to ≤0.5 m depth during wet
periods (Brown and Weeber, 1992).
Two sites were chosen for trenching to inves-
tigate the morphology and stratigraphic relation-
ships of the Canterbury earthquake sequence
and pre–Canterbury earthquake sequence lique-
faction features in the subsurface (Fig. 2A): Sul-
livan Park (site 1; Fig. 2B), and the former site
of a residential property at 11 Bracken Street
(site 2; Fig. 2D). Site 1 was selected based on
the intensity of lateral spreading cracks and lack
of near-surface anthropogenic infl uence on the
spatial distribution of liquefaction (Fig. 2C).
Site 2 was selected because it was continuously
T2
Tren
ch 4
(T4)
T1
Met
ers
500
1020
3040
BBC
Met
ers
500
1020
3040
06M
eter
s2
4
Late
ral s
prea
dfis
sure
E
06M
eter
s2
4
D
22 F
eb. 2
011
sand
eje
cta
Tren
ch 4
(T4)
Tren
ch 1
(T1)
CPTu
Tren
ch 2
(T2)
Galibrath Ave.
NN N
NLa
tera
l spr
ead
fissu
re22
Feb
. 201
1 sa
nd e
ject
aVe
nt z
one
T4T4
T1
T2
Site
2 (D
)
Site
1
(B) 0
5010
020
0Met
ers
NEl
evat
ion
(m a
.s.l)
5 0.5
ASi
te 1
Site
1
Site
2Si
te 2
T3
Tren
ch 3
(T3)
T3
Tren
ch 1
(T1)
CPTu
Tren
ch 2
(T2)
Tren
ch 3
(T3)
Resi
dent
ial
prop
erty
Tren
ch
loca
tions
Fig
ure
2. (A
) Dig
ital
ele
vati
on m
odel
(DE
M) o
f the
Avo
nsid
e ar
ea w
ith
the
loca
tion
of t
he tw
o st
udy
site
s in
dica
ted.
(B) U
nint
erru
pted
aer
ial
phot
ogra
ph o
f si
te 1
fol
low
ing
the
Feb
ruar
y 20
11 e
arth
quak
e w
ith
tren
ch a
nd C
PTu
(co
ne p
enet
rati
on t
est
wit
h po
re-p
ress
ure
[pie
zoco
ne]
mea
sure
men
t) lo
cati
ons
indi
cate
d. (
C)
The
map
ped
dist
ribu
tion
of
lique
fact
ion
feat
ures
, and
loca
tion
s of
the
tre
nche
s an
d C
PTu
at
site
1.
(D)
Uni
nter
rupt
ed a
eria
l pho
togr
aph
of s
ite
2 fo
llow
ing
the
Feb
ruar
y 20
11 e
arth
quak
e w
ith
the
tren
ch lo
cati
on in
dica
ted.
(E
) The
map
ped
dist
ribu
tion
of
lique
fact
ion
ejec
ta f
ollo
win
g th
e F
ebru
ary
2011
ear
thqu
ake
(mod
ifi ed
fro
m Q
uigl
ey e
t al
., 20
13),
wit
h th
e lo
cati
ons
of t
he
tren
ch a
nd r
esid
enti
al d
wel
ling
indi
cate
d.

Bastin et al.
4 Geological Society of America Bulletin, v. 1XX, no. XX/XX
monitored by Quigley et al. (2013) during the
Canterbury earthquake sequence (Fig. 2E). Cali-
bration of the observations for the occurrence
and nonoccurrence of liquefaction with nearby
accelerometer measurements of PGA enabled
a PGA7.5 liquefaction triggering threshold to
be established for the susceptible sediments at
site 2 of PGA7.5 ~0.06g (minor liquefaction) to
PGA7.5 0.12g (major to severe liquefaction; for a
full description of PGA7.5 derivation methodol-
ogy for this study site, see Quigley et al., 2013).
METHODS
Trenching
The subsurface morphology of the Canter-
bury earthquake sequence and prior liquefaction
features was documented using well-established
criteria for identifying earthquake-induced
lique fac tion features, including analysis of aerial
photography, trenching, and dating of subsur-
face deposits (e.g., Sims, 1975; Obermeier et al.,
1991; Obermeier, 1996; Tuttle, 2001). Docu-
mentation of the subsurface features that fed
known Canterbury earthquake sequence surface
vents, and comparison with published photo-
graphs of subsurface liquefaction features aided
the identifi cation and interpretation of other liq-
uefaction features that pinched out beneath the
surface (see also Obermeier et al., 2005; Tuttle,
2001; Counts and Obermeier, 2012). High-reso-
lution aerial photographs (fl own on 24 Febru-
ary 2011 by NZ Aerial Mapping for the Christ-
church Response Centre) were examined to
identify the distribution of features at each site
(Fig. 2). Trenches were excavated perpendicular
to aligned sand blow vents and lateral spread-
ing fi ssures at both sites (Fig. 2). Trench walls
were cleaned using handheld scrapers and then
photographed and logged at centimeter scale to
document small-scale changes in the morphol-
ogy of the liquefaction features and the sur-
rounding stratigraphy. The trench fl oor was also
logged at several locations of interest at site 1
(Fig. 3A). The documentation of Canterbury
earthquake sequence liquefaction features and
their relationship with the surrounding sediment
enabled prior liquefaction features to be iden-
tifi ed within the stratigraphy. The liquefaction
features and the surrounding stratigraphy were
described in terms of their grain size, sorting,
color, and degree of sediment mottling. Full
sediment descriptions of each unit are presented
in Appendix 1.1 Two hand-augered holes at
site 1 were excavated to 2.5 m depth, where the
sediment became cohesionless and failed to be
retained within the auger head.
Radiocarbon Dating
The ages of the pre–Canterbury earthquake
sequence liquefaction features and trench stra-
tigraphy were constrained from radiocarbon
dating of detrital wood fragments obtained from
key stratigraphic horizons. Samples were dried
at 40 °C for 1 wk and then sorted to separate
the organic material from the host sediment.
Between 10 and 20 mg samples of organic
material were submitted to the Rafter Radiocar-
bon Laboratory in Wellington, New Zealand, for
accelerator mass spectrometry (AMS) radiocar-
bon analysis. Samples were prepared for analy-
sis by subsampling, picking, and grinding of the
wood fragments, and repeated acid and alkali
treatment, after which they were combusted
and converted to graphite by reduction with
hydrogen over iron catalyst. Ages were cali-
brated using the Southern Hemisphere calibra-
tion curve (SHCAL04; McCormac et al., 2004).
The radiocarbon ages referred to in the text are
reported as 2σ calendar calibrated age ranges.
The uncalibrated conventional radiocarbon ages
and detailed age range distributions of the cal-
endar calibrated ages are presented in Table 1.
Optically Stimulated Luminescence Dating
Two sediment samples were collected from
site 1 for optically stimulated luminescence
(OSL) dating to further constrain the likely
depositional ages of the trench stratigraphy.
Sampling was conducted by pushing 5-cm-
diameter stainless-steel tubes into cleaned sec-
tions of the trench wall. Samples were dated
by infrared stimulated luminescence (IRSL) of
the polymineral fi ne grain fraction (4–11 mm)
using a Riso TL-DA-15 with an infrared diode
array at the OSL facility at the University of Vic-
toria, Wellington, New Zealand. The equivalent
dose was determined in the blue spectral band
(fi lters BG39+Kopp 5–58) by the single-aliquot
additive dose method with late light subtrac-
tion (SAR method; Aitken, 1998). The multiple
aliquot additive dose method (MAAD) was
applied to determine the dose rate. Radionu-
clide contents of 238U, 232Th, and 40K, a values,
and water content were measured from a sample
aliquot. Samples were stored for 3 wk after irra-
diation, and a 5 min preheat was then applied to
isolate the stable signal component. After 6 mo
of storage, samples were subjected to a fading
test. All measurements were conducted at room
temperature (Aitken, 1998). Optical ages are
presented in Table 2.
Geotechnical Testing
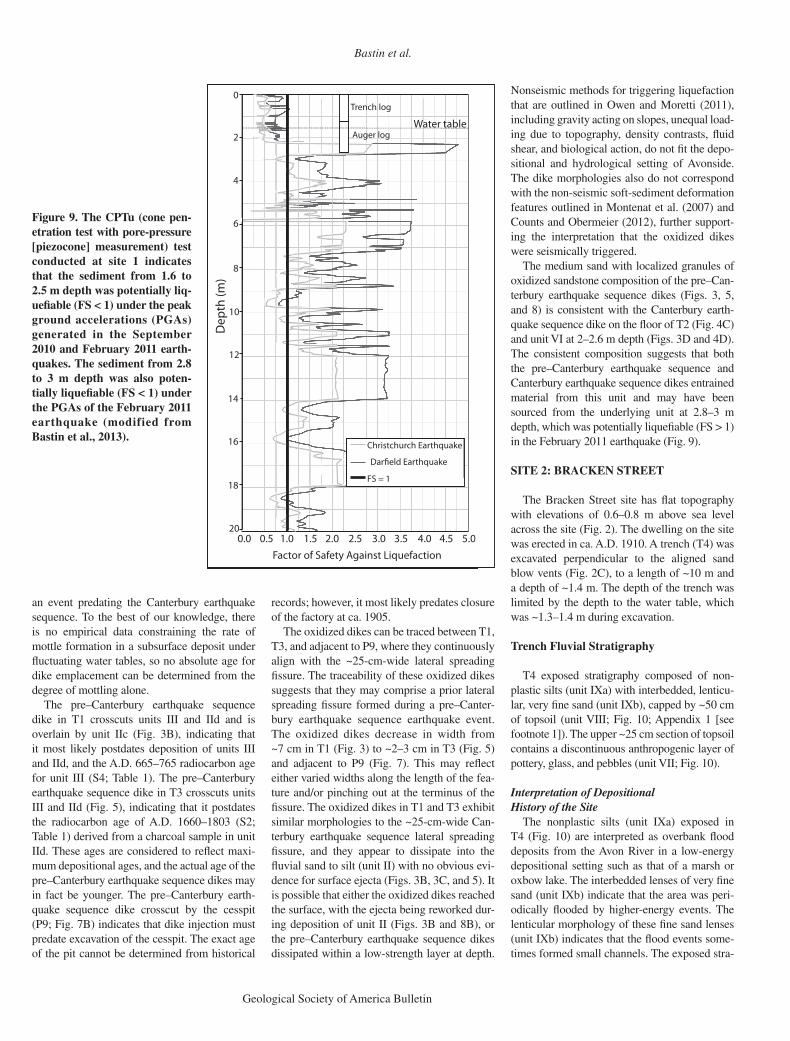
A CPTu (cone penetration test with pore-
pressure [piezocone] measurement) was con-
ducted ~20 m north of trench 1 at site 1 to a
depth of 20 m (Fig. 2B). The CPTu measures
the resistance of the subsurface sediments to an
instrumented cone being pushed at a constant
rate (Idriss and Boulanger, 2008). The relative
resistance of the subsurface sediments acts as
a proxy for the subsurface properties and for
delineating stratigraphy. The CPTu is com-
monly applied to determine the liquefaction
susceptibility of a given area due to its rapid
testing times, continuous recording, high accu-
racy, and the repeatability of the test (Idriss and
Boulanger, 2008).
The liquefaction potential of the subsurface
strata was evaluated from the CPTu using the
Idriss and Boulanger (2008) method. This
method establishes the liquefaction potential
by comparing the cyclic stress ratio (CSR),
which evaluates loading induced at differ-
ent depths by an earthquake, with the cyclic
resistance ratio (CRR), which represents the
ability of the soil to resist liquefaction. The
likelihood that a soil will liquefy is expressed
as a factor of safety against liquefaction
(FS), where FS < 1 is considered potentially
liquefi able. The results of the CPTu sound-
ing were correlated with the stratigraphy to
2.5 m depth, as determined from the trench
and hand auger. This enabled the possible
depth of the liquefi ed source sediment to be
constrained.
SITE 1: SULLIVAN PARK
Sullivan Park is located centrally within
Avonside and within 50 m of the Avon River
(Fig. 2). The park has almost fl at topography
with elevations of 1.5–2 m above sea level
across the site (Fig. 2). Analysis of the post–
February 2011 aerial photographs indicates
that lateral spreading–induced fissuring and
associated sand blows formed across the site
during the Canterbury earthquake sequence
(Fig. 2C).
Three trenches (T1–T3) were excavated per-
pendicular to the axis of two lateral spreading
fi ssures to lengths of ~18 m (T1), ~6 m (T2), and
~8 m (T3) and a depth of ~1.5 m (Fig. 2B). The
trench excavation depth was limited to ~1.6 m
by the depth of the water table. Two hand-
augered holes were excavated in T1 and T2 (A1
and A2, respectively) to a depth of 2.5 m. The
trench and auger logs are presented in Figures
3, 4, 5, and 7, and selected fi eld photographs are
presented in Figures 6 and 8. The CPTu data is
presented in Figure 9.
1GSA Data Repository item 2015131, Appendix 1:
Detailed sedimentary descriptions, is available at
http:// www .geosociety .org /pubs /ft2015 .htm or by
request to editing@ geosociety .org.

Paleoliquefaction in Christchurch, New Zealand
Geological Society of America Bulletin, v. 1XX, no. XX/XX 5
111
± 14
YBP
1364
±15
YPB
813±
38
YBP
2683
± 16
YBP
2850
± 21
0 YB
P
2820
± 21
0 YB
P
Fig.
8D
Fig.
8E
Figu
re B
Fig.
6B
Fig.
6E
I IIa
IId
IIcIIb
PF3
PF4
IIc’
PF2
PF1
IIc′
III
IV
III
IIbIIa
IId
IIc
IIc′
50 c
m
50 c
m0
PF′
IIu
IV
Fig.
8A
A1
665
–765
AD
ASi
te 1
- Tr
ench
1 -
Wes
tern
wal
lN
2820
± 21
0 YB
P
I
810
–792
BC
IIb
IIc IIdIII
1229
–127
6 A
D
2850
± 21
0 YB
P
IV
BN 0
50 c
m
50 c
m
B
IV
Ant
hrop
ogen
ic D
epos
its
Uni
t PF:
Pit
fill -
Fin
e sa
nd to
silt
with
silt
& so
il cl
asts
, lam
b bo
nes &
fern
mat
Uni
t PFʹ
: Silt
to v
ery
fine
sand
with
gro
und
up &
bur
nt b
one
Radi
ocar
bon
sam
ple
loca
�on
and
age
(Con
ven�
onal
)O
SL sa
mpl
e lo
ca�o
n an
d ag
e
Liqu
efac
tion
Dep
osits
Uni
t Mx:
Wel
l sor
ted,
med
ium
to
fine
sand
gra
des u
pwar
ds to
silt
(CES
liqu
efac
�on)
Uni
t Mxʹ
: Wel
l sor
ted
silt
(CES
liqu
efac
�on)
Uni
t Px:
Wel
l sor
ted,
oxi
dize
d &
m
o�le
d fin
e to
med
ium
sand
(P
re-C
ES li
quef
ac�o
n)
Uni
t II:
Mod
erat
ely
sort
ed
med
ium
to v
ery
fine
sand
, gr
ades
up
to si
lt
Uni
t I: M
oder
atel
y so
rted
, ca
rbon
aceo
us si
lt lo
am w
ith
loca
lized
peb
bles
& b
ricks
Uni
t IIʹ:
Mod
erat
ely
sort
ed,
very
fine
sand
to si
lt
Fluv
ial D
epos
its
Uni
t III:
Mod
erat
ely
sort
ed,
plas
�c si
lt, ~
10%
mo�
led
Uni
t IV:
Wel
l sor
ted,
oxi
dize
d m
ediu
m sa
nd, ~
10%
mo�
led
I IIc′
IIeIId
IIc
IIb
IIa
IIc′
PF8
Depth (m)
0
0.5
1.0
1.5
2.0
2.5
Uni
t VI
Uni
t V
Uni
t II
Uni
t III
Uni
t PF
Uni
t I
Uni
t V: M
oder
atel
y so
rted
, m
o�le
d, fi
ne to
med
ium
sand
Uni
t VI:
Med
ium
sand
with
gr
anul
es, g
rade
s to
pebb
les
III
010
cm
10 c
m
Fig.
8B
1907
AD
±12
yr
IV
Mx
Px
Mx Px
Mx Px
Auge
r 1 (A
1)
CS1
- T1
- W
est w
all -
recu
tN
DS1
- T1
- Au
ger 1
Fig
ure
3. (
A)
Det
aile
d tr
ench
log
of t
he w
est
wal
l and
fl oo
r of
T1
(sit
e 1)
. The
Can
terb
ury
eart
hqua
ke s
eque
nce
(CE
S) li
quef
acti
on d
ikes
(M
x) c
ross
cut
the
fl uvi
al (
I–II
I) a
nd a
nthr
opog
enic
(P
F1–
PF
4) s
trat
igra
phy.
The
pre
–Can
terb
ury
eart
hqua
ke s
eque
nce
dike
(P
x) is
cro
ss-
cut
by a
Can
terb
ury
eart
hqua
ke s
eque
nce
dike
(M
x) a
nd d
issi
pate
s w
ithi
n be
d of
fl u
vial
san
d (I
Ic).
The
loc
atio
n of
aug
er 1
(A
1) i
s al
so
indi
cate
d. (
B)
Clo
se-u
p of
the
cro
sscu
ttin
g re
lati
onsh
ip b
etw
een
the
Can
terb
ury
eart
hqua
ke s
eque
nce
(Mx)
and
oxi
dize
d di
ke (
Px)
. The
lo
cati
ons
and
resu
lts
of t
he 14
C a
nd o
ptic
ally
sti
mul
ated
lum
ines
cenc
e (O
SL)
sam
ples
are
ind
icat
ed. (
C)
Det
aile
d lo
g of
the
re-
cut
of t
he
tren
ch w
all.
The
Can
terb
ury
eart
hqua
ke s
eque
nce
dike
(Mx)
cro
sscu
ts th
e fl u
vial
(I–I
II) a
nd a
nthr
opog
enic
(P8)
str
atig
raph
y an
d th
e pr
e–C
ante
rbur
y ea
rthq
uake
seq
uenc
e di
ke (
Px)
, whi
ch d
issi
pate
s in
to t
he fl
uvia
l san
d (u
nit
IIc)
. (D
) Aug
er 1
(1.
5–2.
5 m
) in
dica
tes
the
tren
ch is
un
derl
ain
by m
oder
atel
y so
rted
, fi n
e to
med
ium
san
d (u
nit V
) th
at c
onta
ins
gran
ules
to
pebb
les
(uni
t VI)
fro
m 1
.9 t
o 2.
5 m
dep
th.

Bastin et al.
6 Geological Society of America Bulletin, v. 1XX, no. XX/XX
TA
BLE
2.
OP
TIC
ALLY
ST
IMU
LA
TE
D L
UM
INE
SC
EN
CE
DA
TA
AN
D A
GE
ES
TIM
AT
ES
Labora
tory
no.
Sa
mple
no.
Localit
yD
epth
(m)
Wa
ter
(%)
Radio
nuclid
e c
oncentr
ations
a-va
lue
Co
sm
icd
ose
ra
te(G
y/k
a)
De
(Gy
–1)
Do
se
ra
te(G
y/k
a)
Op
tica
l a
ge
(yr
B.P
.)K
(%
)T
h (
ppm
) fr
om
2
08T
l, 2
12P
b,
22
8A
cU
(ppm
) fr
om
23
4T
hU
(ppm
) fr
om
22
6R
a,
21
4P
b,
21
4B
iU
(ppm
) fr
om
2
10P
b
WLL1075
O1
Tre
nch 1
Site1
1.0
521.2
2.2
2±
0.0
510.8
8 ±
0.1
83.0
0±
0.3
73.0
2 ±
0.2
23.6
6±
0.3
20
.13
± 0
.01
0.1
797
± 0
.00
90
13
.21
± 0
.57
4.6
4 ±
0.2
82
85
0±
21
0
WLL1076
O2
Tre
nch 1
Site 1
0.8
621.2
2.2
4±
0.0
510.5
4 ±
0.1
43.4
2±
0.2
6
2.9
9 ±
0.1
53.3
2±
0.2
30
.09
± 0
.01
0.1
845
± 0
.00
911
.95
± 0
.62
4.2
4 ±
0.2
32
82
0±
21
0
TA
BLE
1.
RA
DIO
CA
RB
ON
DA
TA
AN
D A
GE
ES
TIM
AT
ES
Sam
ple
no.
Depth
(m)
Localit
yD
escription
δ13C
(‰)
Radio
carb
on a
ge
(yr
B.P
.)
Ca
len
da
r ca
libra
ted
ag
e
2σ
1σ
S1
0.8
Tre
nch 3
Site 1
Wood fra
gm
ent
from
fl u
via
l sand
(unit IIc
)–26.4
± 0
.24
126 ±
25
2858–
28
07
B.C
. (1
7.1
% o
f a
rea
)2752–
27
19
B.C
. (5
.8%
of a
rea
)2701–
25
62
B.C
. (6
4.1
% o
f a
rea
)2531–
24
93
B.C
. (7
.8%
of a
rea
)
28
34
–2
81
4 B
.C. (1
0.6
% o
f a
rea
)2
67
0–
25
71
B.C
. (5
5.7
% o
f a
rea
)2
50
9–
25
04
B.C
. (1
.7%
of a
rea
)
sS
20.9
Tre
nch 3
Site 1
Wood fra
gm
ent
from
fl u
via
l sand
(unit IId
)–27.1
± 0
.2220 ±
19
1660–1
68
4 A
.D. (1
7.3
% o
f a
rea
)1730–1
80
3 A
.D. (7
7.4
% o
f a
rea
)1
66
9–
16
75
A.D
. (6
.9%
of a
rea
)1
73
9–
17
87
A.D
. (5
6.2
% o
f a
rea
)1
79
3–
17
98
A.D
. (5
.9%
of a
rea
)
S3
1.4
0T
rench 1
Site 1
Wood fra
gm
ent
from
basal silt
(u
nit III
) –32.3
± 2
.0813 ±
38
12
29
–1
27
6 A
.D.
12
03
–1
29
5 A
.D.
S4
1.5
5T
rench 1
Site 1
Wood fra
gm
ent
from
basal silt
(u
nit III
)–24.9
± 0
.21
364 ±
15
665
–6
94
A.D
. (4
6.6
% o
f a
rea
)705
–7
06
A.D
. (0
.9%
of a
rea
)749–
76
5 A
.D. (2
0.2
% o
f a
rea
)
66
0–
72
1 A
.D. (6
8.1
% o
f a
rea
)7
42
–7
70
A.D
. (2
6.7
% o
f a
rea
)
S5
0.2
0T
rench 1
Site 1
Fern
sam
ple
fro
m p
it–22.3
± 0
.2111
± 1
41709–
17
21
A.D
. (4
.7%
of a
rea
)1811–
18
38
A.D
. (2
9.9
% o
f a
rea
)1847–
18
59
A.D
. (2
.9%
of a
rea
)1863–
18
66
A.D
. (0
.6%
of a
rea
)1880–
19
32
A.D
. (5
6.5
% o
f a
rea
)
18
17
–1
83
0 A
.D. (2
2.2
% o
f a
rea
)1
89
4–
19
21
A.D
. (4
6.2
% o
f a
rea
)
S6
1.8
Pit 9
Site 1
Charc
oa
l sam
ple
fro
m p
it 9
–26.4
± 0
.28
15 ±
20
12
23
–1
27
9 A
.D.
12
30
–1
25
2 A
.D. (4
1.9
% o
f a
rea
)1
26
1–
12
75
A.D
. (2
7.7
% o
f a
rea
)
S7
1.1
5T
rench 1
Site 1
Wood fra
gm
ent
from
Cante
rbury
eart
hquake s
equence d
ike
.C.
B9
77
–8
28
.C.
B2
97
–0
18
61
±3
86
22.
0±
5.6
2–
S8
0.5
0T
rench 4
Site 2
Wood fra
gm
ent
from
silt
loam
–26.3
± 0
.15
45 ±
18
14
15
–1
43
5 A
.D.
14
08
–1
44
2 A
.D.
S9
1.1
0T
rench 4
Site 2
Wood fra
gm
ent
from
silt
loam
–23.7
± 0
.16
06 ±
18
1330–1
33
1 A
.D. (1
.3%
of a
rea
)1392–
14
12
A.D
. (6
5.8
% o
f a
rea
)1
32
4–
13
46
A.D
. (2
1.6
% o
f a
rea
)1
38
9–
14
18
A.D
. (7
3.1
% o
f a
rea
)

Paleoliquefaction in Christchurch, New Zealand
Geological Society of America Bulletin, v. 1XX, no. XX/XX 7
Trench Fluvial Stratigraphy
The three trenches (T1–T3; Figs. 3, 4, and 5)
exposed stratigraphy composed of a plastic
silt (unit III) with interbedded lenses of fi ne to
medium sand (unit IV), overlain by normally
graded beds of fi ne sand to silt (unit IIa–e). The
stratigraphy is capped by ~20–50 cm of topsoil
(unit I; Appendix 1 [see footnote 1]). The two
hand augers (A1–A2) indicate that the plastic
silt (unit III) is underlain by medium sand (unit
V), and a granule to pebble horizon (unit VI) at
~2–2.5 m depth (Figs. 3D and 4D; Appendix 1
[see footnote 1]).
Interpretation of Depositional HistoryThe medium sand (unit V) and granule to
pebble bed (unit VI) are coarser than the overly-
ing stratigraphy and are consistent with deposits
within the active fl oodplain of the Waimakariri
River (Fig. 3D). Units V and VI are therefore
interpreted to most likely represent crevasse
splay deposits from a pre-European fl ood event
of the Waimakariri River (Brown and Weeber,
1992). The overlying plastic silt (unit III) was
likely deposited in a marsh or oxbow lake adja-
cent to the meandering Avon River that periodi-
cally received sediment during fl ood events, as
indicated by the interbedded lenses of fi ne to
medium sand (unit IV). The normally graded
beds of fi ne sand to silt (unit II, a–e) exposed
in T1–T3 (Figs. 3, 4, and 5) are interpreted as
overbank fl ood deposits from the nearby Avon
River. The stratigraphy is consistent with the
pre-European (i.e., pre–mid-nineteenth cen-
tury) avulsion of the Avon River across the site
and the historical reports of periodic fl ooding
of the Avon River during periods of heavy rain
between 1865 and 1953 (Cowie, 1957). Unit I
is interpreted as a topsoil horizon. There are no
well-documented rates of soil formation for the
Christchurch region due to the varied land uses
throughout the development of the city, and so
no surface age may be inferred from the topsoil
thickness.
Radiocarbon dating of two subrounded wood
fragments obtained from unit II in T3 at depths
of 0.8 m (S1) and 0.9 m (S2) yielded ages of
2858–2493 B.C. (S1) and A.D. 1660–1803 (S2),
respectively (Fig. 5; Table 1). Two small, sub-
rounded wood fragments were also obtained
from unit III in T1 from depths of 1.4 m (S3)
and 1.55 m (S4). The samples yielded predomi-
nant ages of A.D. 1229–1276 (S3) and A.D.
665–765 (S4), respectively (Fig. 3B; Table 1).
S1 yielded a complicated age spectra (Table 1)
with a mean age signifi cantly older than the
bounding strata, suggesting that the dated mate-
rial may be reworked detritus; therefore, it is
excluded from further discussions. S2, S3, and
S4 all were small, subrounded wood fragments
that lacked root-like geometries or lateral conti-
nuity. We suggest that these ages approximate
Granules
A B
C
Fig. 6D
Fig. 6F
II
III
PF6
PF6
IIa
IIc
IIa
PF5
PF5
IIb
IIc
IId
IIe
IIf
I
PF
III
Anthropogenic Deposits
Unit PF: Pit fill - Fine sandto silt with silt & soil clasts,lamb bones & fern matsUnit PFʹ: Silt to very fine sand with granules of ground up burnt bone
Liquefaction DepositsUnit Mx: Well sorted, medium to fine sand grades upward to silt (CES liquefac�on)Unit Mxʹ: Well sorted silt(CES liquefac�on)
Unit II: Moderately sorted, medium to very fine sand, grades up to silt
Unit I: Moderately sorted, carbonaceous silt loam with localized pebbles & bricks
Unit IIʹ: Moderately sorted, very fine sand to silt
Fluvial Deposits
Unit III: Moderately sortedplas�c silt, ~10 % mo�led
Unit IV: Well sorted, oxidized medium sand, ~10% mo�led
Unit V: Moderately sorted, mo�led fine to medium sand
Unit VI: Medium sand with granules, grades downto pebbles
IIIIId
IIc
IIb
IIa
IIb
IIf
IIe
IId
N Site 1 - Trench 2 - East wall
N Site 1 - Trench 2 - Floor
Dep
th (m
)
0
0.5
1.0
1.5
2.0
2.5
Unit I
Unit II
Unit VI
Unit V
Unit III
Unit II
Unit IIUnit IIUnit II
Unit II
N
D Site 1 - Auger 2
0 15 cm
15 cm
0 15 cm
15 cm
0 15 cm
15 cm
Site 1 - Trench 2 - West wall
Auger 2 (A2) loca�on
IV
gg
Mx
Mx
Mx
IV
A2
IV
IV
Mx′
PF′
Figure 4. Detailed trench log of the west (A) and east (B) walls, and fl oor (C) of T2 (site 1). The location of auger 2 (A2) is also indicated. The Canterbury earthquake sequence (CES) liquefaction dikes (Mx) crosscut the fl uvial stratigraphy (I–III) and anthropogenic cesspits (PF5–PF6) from the trench fl oor to surface. Small Canterbury earthquake sequence dikes (~10 cm long; Mx) are observed to originate within PF5 (A). (D) Auger 2 (1.5–2.5 m) indicates that the stratigraphy is underlain by moderately sorted fi ne to medium sand (unit V), that contains granules to pebbles (unit VI) from 2.3 to 2.5 m depth.

Bastin et al.
8 Geological Society of America Bulletin, v. 1XX, no. XX/XX
the depositional age of the sediment due to the
consistency between the reported ages of S2–
S4. Therefore, the ages indicate that the trench
stratigraphy was most likely deposited over a
maximum period from ca. A.D. 665 to present.
OSL dating of two samples obtained from
the unit II in T1 from depths of 0.86 m (O1) and
1.05 m (O2) yielded ages of 838 B.C. (±210 yr)
and 818 B.C. (±210 yr), respectively (Fig. 3B;
Table 2). During testing, it was observed from
experimental data that these samples were com-
posed of bleached and partially bleached sand
and therefore were not suffi ciently exposed to
light prior to redeposition (N. Wang, 2013, per-
sonal commun.). These ages are interpreted to
refl ect maximum ages, with the depositional ages
of the host sediment possibly much younger.
Trench Anthropogenic Stratigraphy
The fl uvial stratigraphy exposed in T1–T3
is crosscut by anthropogenic pits, ~20–100 cm
wide and ~20–90 cm deep, with subvertical
walls (Figs. 3, 4, and 5). The pits contain silt
(unit PF, for pit fi ll) with irregular lenses of car-
bonaceous silt (5%–10%), oxidized whole and
fragmented lamb fetlock bones, fern mats, and
fragments of ground-up and burnt bone (Fig.
6A; Appendix 1 [see footnote 1]). The lenses of
burnt bone are surrounded by an oxidation front
in unit III (Fig. 6D).
T1 (Fig. 3A) is crosscut by multiple anthro-
pogenic pits (P1–P4, and P8). P1–P3 exhibit
internal lensoidal stratigraphy and crosscut the
fl uvial stratigraphy from ~20 to ~70 cm depth
to the trench fl oor. P4 (Fig. 3A) underlies and is
separated from P3 by ~20 cm of unit II; it is com-
posed of unit PF with rare fragments of oxidized
bone and fern mat. A fi fth pit (P8) was exposed
as the west wall of T1 was cut back by ~50 cm;
it contains unit PF with no internal lenses (Fig.
3C). Excavation of P3, P4, and P8 in plan view
indicates that these pits comprise a corner of
a larger pit (P9) that extends from ~20 cm to
1.8 m depth and is capped by an iron lid (Fig. 7).
The intervening bed of unit II between P3 and 4
(Fig. 3A) was not observed during excavation of
P9. It is possible that the relationship observed
on the wall of T1 refl ects an irregularly dug wall
or collapse of the corners of the larger pit into
the surrounding fl uvial sediment. T2 is crosscut
by two pits (P5 and P6; Figs. 4 and 6A), and T3
is crosscut by one pit (P7; Fig. 5), all of which
are composed of unit PF and exhibit internal
lensoidal stratigraphy.
Interpretation of Anthropogenic HistoryA wool scouring factory operated adjacent
to site 1, and historical photographs place the
park within the property boundaries of the fac-
tory (Bremer, 1985). The history of the wool
scouring industry within Avonside is poorly
documented; however, it is known that the
Avonside scour opened “shortly after” the
Woolston scoury was established in A.D. 1864,
with activity continuing at the site until ca. 1905
(Bremer, 1985). Cesspits are reported as being
in use during production in an attempt to reduce
pollution in the Avon River (Bremer, 1985). We
interpret the anthropogenic pits identifi ed in T1–
T3 (Figs. 3, 4, 5, and 6A) as cesspits due to the
irregular pit walls and internal stratigraphy con-
sistent with intermittent shoveling of waste (Fig.
7). The presence of only fetlock bones further
supports that these are cesspits, because fetlock
bones were not removed during skinning and
therefore would have been disposed of on site
(Bremer, 1985). It is likely that the pits in T2
(P5–P6; Figs. 4 and 6A), T3 (P7; Fig. 5), and
P1–P2 in T1 (Fig. 3A) also comprise sections
of other large cesspits; however, this cannot be
confi rmed, as these pits were not excavated in
plan view.
The anthropogenic pits crosscut the fl uvial
stratigraphy from ~20 cm depth, indicating
that excavation of these pits postdated deposi-
tion of the fl uvial stratigraphy beneath 20 cm.
The recorded timing of production at the fac-
tory is consistent with a radiocarbon age of A.D.
1709–1932 obtained from a fern mat exposed in
P8 (S5; Fig. 3C; Table 1). A charcoal fragment
obtained within P9 at 1.8 m depth (S6) yielded
a radiocarbon age of A.D. 1223–1279 (Fig. 7;
Table 1). The reported age is inconsistent with
the reported timing of production at the factory,
suggesting that it may be derived from reworked
detritus.
Canterbury Earthquake Sequence Liquefaction Features
Canterbury earthquake sequence liquefaction
features were recognized in the subsurface by
(1) their alignment with and traceable continuity
into the observed surface Canterbury earthquake
sequence sand blows and fi ssures and (2) their
crosscutting relationship with the fl uvial and
anthropogenic stratigraphy. These liquefaction
features were documented in detail in order to
record the morphologies of subsurface liquefac-
I
IIa
IIb
IIc
III
PF7
Fig. 8C
Liquefaction DepositsUnit Mx: Well sorted, medium to fine sand grades upwards to silt (CES liquefac�on)
Unit Mxʹ: Well sorted silt (CES liquefac�on)
Unit Px: Well sorted, oxidized, fine to medium sand, ~10% mo�led (Pre-CES liquefac�on)
Anthropogenic Deposits Unit PF: Pit fill - Fine sand to silt with silt & soil clasts, lamb bones & fern mats
Radiocarbon sample loca�on and age (Conven�onal)
Unit II: Moderately sorted, medium tovery fine sand, grades up to silt
Unit I: Moderately sorted, carbonaceous silt loam with localized pebbles & bricks
Fluvial Deposits
Unit III: Moderately sorted, plas�c silt,~10% mo�led
1660–1803 AD
2858–2493 BC
IId
Mx
Px
025 cm
25cm
N Site 1 - Trench 3 - West wall
Figure 5. Detailed trench log of the west wall of T3. The Canterbury earthquake sequence (CES) liquefaction dike (Mx) crosscuts the fl uvial (I–III) and anthropogenic (P7) stratig-raphy from the trench fl oor to the surface. The pre–Canterbury earthquake sequence dike (Px) crosscuts the fl uvial stratigraphy (I–III) from the trench fl oor to ~90–95 cm depth. The location and results of the 14C samples are also indicated.

Paleoliquefaction in Christchurch, New Zealand
Geological Society of America Bulletin, v. 1XX, no. XX/XX 9
tion and assist with the identifi cation and inter-
pretation of pre–Canterbury earthquake sequence
liquefaction features. The Canterbury earthquake
sequence liquefaction features all consist of gray,
well-sorted, fi ne to medium sand, unless other-
wise stated, and lack the oxidation and mottling
developed in the surrounding stratigraphy.
Canterbury Earthquake Sequence Lateral Spreading Fissures
The large (>50 cm in width) lateral spread-
ing fi ssure intersected in T1 and T2 (Fig. 2B)
is bounded by inward-dipping fractures in the
subsurface, forming a graben (Figs. 3A and 6C).
The grabens in T1 (Fig. 3A) and on the east
wall of T2 (Figs. 4B and 6D) are bounded by
two subvertical, planar dikes, ~2–10 cm wide,
that downdrop the stratigraphy by ~30–40 cm.
The fi ssure can be traced across the fl oor of
T2, where the bounding dikes are composed
of medium sand with granules to pebbles (5%–
10%) of oxidized sandstone (Fig. 4C). The fi s-
sure aligns with an ~20-cm-wide, subvertical,
planar dike on the west wall of T2 (Fig. 4A).
Canterbury Earthquake Sequence Liquefaction Dikes
The smaller lateral spreading fi ssure (<50 cm
in width) intersected in T1 and T3 (Fig. 2B) cor-
responds with ~25-cm-wide, subvertical, planar
dikes in the subsurface that crosscut the fl uvial
and anthropogenic stratigraphy and feed into the
surface fi ssure. The dikes decrease in width and
fi ne upward (Figs. 3A, 6B, and 6C). The dike
in T1 contains downdropped clasts of topsoil
~5–15 cm in diameter (Figs. 3A and 6B), while
the dike in T3 contains incorporated clasts of top-
soil and unit PF ~5–10 cm in diameter (Fig. 6C).
Smaller subvertical, planar dikes, ~2–10 cm
wide in T1–T3, crosscut the stratigraphy from
the trench fl oor to 10 cm depth, where they pinch
out, and they are composed of fi ne sand to silt
(Figs. 3A, 4A, 5, and 6A). Silt layers, ~1–2 mm
thick, are observed along the dike margins (Fig.
6B) and internally within the dikes, where they
A
D E F
B C
′
Figure 6. (A) Interpreted fi eld photograph of the west wall of T2 (site 1). The fl uvial stratigraphy (I–II and outlined in black dotted line) and anthropogenic cesspits (PF and outlined in black lines and dots) are crosscut by Canter-bury earthquake sequence liquefaction features (Mx and outlined in black solid lines). (B) The ~25-cm-wide lat-eral spreading fi ssure at the north end of T1 contains downdropped topsoil clasts and a dike-parallel silt lining that separates two Canterbury earthquake sequence events (M1 and M2). (C) The ~25-cm-wide lateral spreading fi ssure at the north end of T3 contains downdropped clasts of topsoil and unit PF. (D) The ~50-cm-wide lateral spreading fi ssure on the east wall of T2 forms a graben that downdrops the fl uvial stratigraphy (I–III) by ~40 cm and is bounded by liquefaction dikes (Mx). (E) The lens of white bone fragments on the fl oor of T1 is surrounded by an oxidation front (dotted black line) and is crosscut by Canterbury earthquake sequence dikes (outlined in black). (F) The ~7-cm-wide dike on the fl oor of T2 exhibits 1–2-mm-thick, dike-parallel silt lining and internal silt lining (outlined in black), suggesting that two Canterbury earthquake sequence events are preserved within the one dike (M1 and M2). M1 also exhibits intradike sorting fi ning from fi ne sand to silt.
Bastin et al.
10 Geological Society of America Bulletin, v. 1XX, no. XX/XX
separate two units of fi ne sand (Fig. 6F). Lateral
grading from fi ne sand to silt is also observed
within the ~5–10-cm-wide dike on the fl oor
of T2 (Figs. 4C and 6F). Dikes ~1–2 cm wide
and 10–40 cm long were observed to originate
within the pit fi ll (unit PF) on the west wall of
T2 (Figs. 4A and 6A). These small dikes termi-
nate beneath the surface, are composed of silt,
and increase in width with depth.
The dikes identifi ed in T1–T3 crosscut the
fl uvial and anthropogenic stratigraphy from
the trench fl oor to between 0–10 cm depth
(Figs. 3, 4, and 5). This indicates that forma-
tion of these dikes postdated deposition of the
lower (beneath 10 cm) stratigraphy. The dikes
that reach the surface feed into the Canterbury
earthquake sequence liquefaction fi ssures and
sand blows (Figs. 3, 4, 5, and 6), confi rming
that they formed during the Canterbury earth-
quake sequence. The similar morphology, com-
position, and lack of mottling and oxidation
of the dikes that pinch out beneath the surface
indicate that they are also of Canterbury earth-
quake sequence age. A detrital wood fragment
obtained from within an ~5-cm-wide dike at
~1.15 m depth in T1 yielded a radiocarbon age
of 810–792 B.C. (S7; Fig. 3B; Table 1). This is
interpreted to refl ect the maximum depositional
age of the liquefi ed sediment source.
Interpretation of Canterbury Earthquake Sequence Liquefaction Features
The alignment of the subsurface grabens
and dikes with the surface fi ssures indicates
that these features represent lateral spreading
fissures in-filled by liquefied sediment. The
increasing width of the dikes with depth sug-
gests that these features formed by the upward
injection of sediment, as opposed to downward-
propagating surface cracking, in which features
would be expected to decrease in width with
depth (Figs. 3, 4A, 4B, and 5; Counts and Ober-
meier, 2012). Individual dikes range in width
from ~2 to 50 cm (Fig. 3, 4, 5, and 6A). These
varied widths likely refl ect complexities in the
three-dimensional dike geometries resulting
from interactions with host sediment, variations
in lateral spreading, and differing source depths.
The predominately gray, well-sorted, fi ne
to medium sand comprising the <50-cm-wide
Canterbury earthquake sequence dikes is con-
sistent with the fi ne to medium sand of unit V
identifi ed in A1, suggesting that it may be
sourced from this unit (Fig. 3D). The medium
sand with localized granules of oxidized sand-
stone comprising the >50-cm-wide Canterbury
earthquake sequence dike on the fl oor of T2
(Fig. 4C) is consistent with unit VI identifi ed in
A1 at 2.2–2.8 m depth (Figs. 3D and 4D). The
CPTu sounding (Figs. 2B and 9) indicates that
the stratum from 1.5 to 2.2 m depth (unit V in
A1; Fig. 3D) was potentially liquefi able under
the ground accelerations generated in the 2010
Darfi eld, and 2011 Christchurch earthquakes
(FS > 1). The underlying stratum from 2.2 to
2.8 m (unit VI) was not liquefi able during the
Canterbury earthquake sequence; however, the
unit at 2.8–3 m was potentially liquefi able in
the February 2011 earthquake (Fig. 9). There-
fore, the CPTu supports the interpretation that
the smaller Canterbury earthquake sequence
dikes were likely sourced from unit V, while
the >50-cm-wide dike was likely sourced from
the unit at 2.8–3 m depth, and likely entrained
granules from unit VI during ejection. As the
unit at 2.8–3 m was only liquefi able during the
February event, the larger dike likely formed
during this event. This indicates that the higher
shaking intensities that occurred during the
February 2011 event likely formed wider dikes
(>50 cm) and triggered liquefaction at greater
depths than the other Canterbury earthquake
sequence events.
The well-sorted and fi ning-upward nature of
the medium to fi ne sand to silt within the dikes
indicates that sediment sorting occurred during
ejection/injection. The sediment sorting is con-
sistent with the Hjulström curve, in which very
50 cm
0
25 cm
25 cm
PFPx
Mx
PF
PF’
N Site 1 - Plan view P9 - 0.75 m depthA N Site 1 - Plan view P9 - 1.8 m depthB
Fig. 8F
Fluvial Deposits Anthropogenic Deposits Unit PF: Pit fill - Fine sand to silt with silt & soil clasts, lamb bones & fern mat
Unit PF’: Lens of fern mat, ground up burnt bone, and lamb fetlock bones
Unit III: Moderately sorted, plastic silt, ~10% mottled
Lens of oxidized granules in fine to medium sand matrix
Liquefaction Feeder DikesUnit Mx: Well sorted, medium to fine sand, grades upwards to silt (CES liquefaction)
Unit Px: Well sorted, oxidized, fine to medium sand, ~10% mottled (Pre-CES liquefaction)
Logged wall of T1 (Fig. 3) Location of iron lid
1223 - 1279 AD
0
25 cm
25 cm
Unit II: Moderately sorted, medium tovery fine sand, grades up to silt
Radiocarbon sample location & age (Conventional)
III
II
PF
Mx
Px
PF’
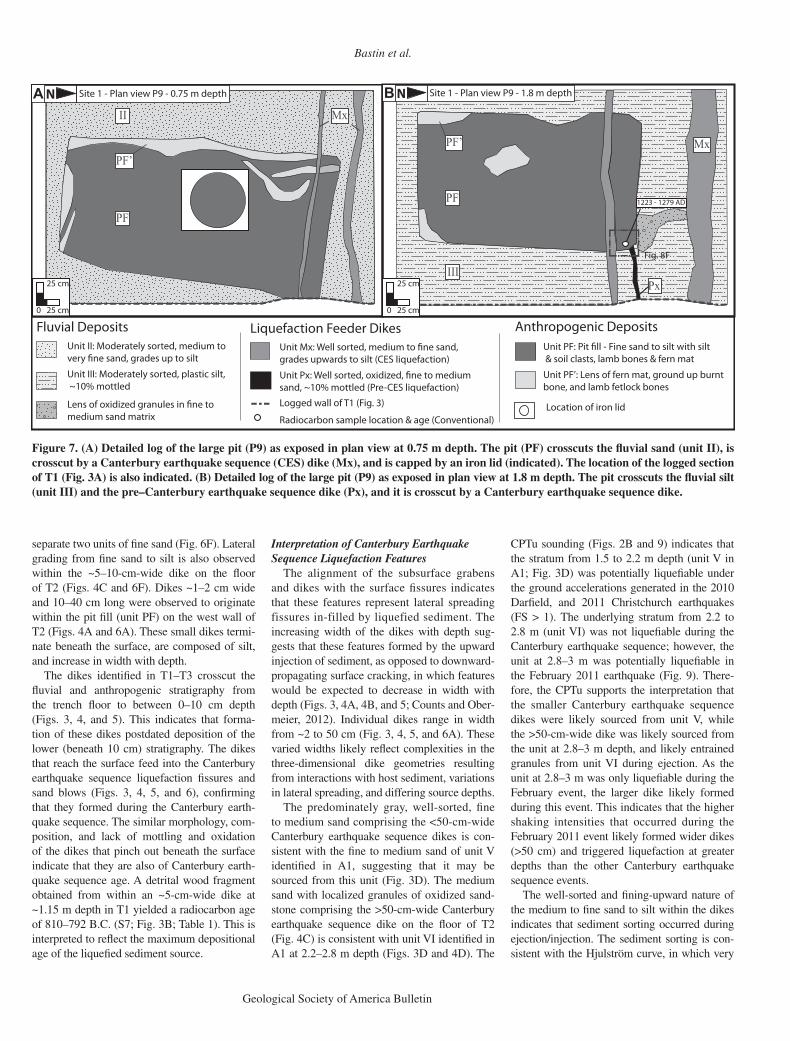
Figure 7. (A) Detailed log of the large pit (P9) as exposed in plan view at 0.75 m depth. The pit (PF) crosscuts the fl uvial sand (unit II), is crosscut by a Canterbury earthquake sequence (CES) dike (Mx), and is capped by an iron lid (indicated). The location of the logged section of T1 (Fig. 3A) is also indicated. (B) Detailed log of the large pit (P9) as exposed in plan view at 1.8 m depth. The pit crosscuts the fl uvial silt (unit III) and the pre–Canterbury earthquake sequence dike (Px), and it is crosscut by a Canterbury earthquake sequence dike.

Paleoliquefaction in Christchurch, New Zealand
Geological Society of America Bulletin, v. 1XX, no. XX/XX 11
fi ne sand has the lowest critical velocity required
to entrain particles and thus is mobilized fi rst
(Hjulström, 1939). The fi ning-upward trend may
refl ect decreasing fl ow velocity of the escaping
fl uids, possibly due to the formation of wide con-
duits (i.e., the lateral spreading cracks), enabling
fl uid pressure dissipation and resulting in a
decreased grain size entrained in the fl ow. The
intradike lateral grading from fi ne sand to silt
(Fig. 6F) indicates that fl ow rates varied laterally
within the dike during ejection. This sorting may
refl ect obstruction of fl ow around an object (e.g.,
topsoil clast), resulting in the deposition of silt
in voids as the fl ow waned. The intradike clasts
of topsoil and unit PF (Figs. 3A, 5, 6B, and 6C)
likely formed by fragmentation of the host sedi-
ment during sediment ejection, with the clasts
settling through the liquefi ed sediment as the
fl ow waned or as a result of their higher density
compared to the surrounding liquefi ed sediment.
The dike-parallel silt linings on the dike mar-
gins (Figs. 6B and 6F) suggest that fl ow veloci-
ties were lower on the dike margins, resulting
in silt being deposited out of suspension. The
preservation of dike-parallel silt linings within
a dike (Figs. 6B and 6F) suggests that multiple
liquefaction episodes may be preserved within
one dike. This may refl ect either pulsed ejection
of sediment during one earthquake, or conduit
reactivation in sucessive Canterbury earthquake
sequence events.
Pre–Canterbury Earthquake Sequence Liquefaction Features
Pre–Canterbury earthquake sequence lique-
faction was identifi ed in the trenches based on
their structural similarities to/and crosscutting
relationships with the Canterbury earthquake
sequence liquefaction features and the surround-
ing stratigraphy.
Pre–Canterbury Earthquake Sequence Liquefaction Dike
The lateral spreading fi ssure intersected in T1
(Figs. 3A and 3B) and T3 (Fig. 5) crosscuts oxi-
dized dikes on the trench wall and fl oor (Fig. 8).
The oxidized dikes consist of well-sorted, oxi-
dized, and mottled (~1–7 mm wide), medium
sand with granules of oxidized sandstone
(Fig. 8).
In T1, the ~7-cm-wide oxidized dike cross-
cuts unit III and unit IId to ~70 cm depth, where
it appears to dissipate and become indistinguish-
able from unit IIc (Figs. 3B and 8A). No defor-
mation or evidence for the oxidized dike was
observed in the overlying stratigraphy (Figs. 3B
and 8A). The west wall of T1 was cut back by
~50 cm to further analyze this relationship (Fig.
3C). The oxidized dike continued to be traceable
to ~70 cm depth, where it dissipates into the fl u-
vial sand to silt of unit IIc (Figs. 3C and 8B).
In T3, the oxidized dike crosscuts units III and
IId to ~90–95 cm depth (Figs. 5 and 8C), and
is comparatively narrower (~2–3 cm wide) than
in T1. Excavation of P9 in plan view revealed
an oxidized dike that is crosscut by the pit at
~1.8 m depth (Figs. 7B and 8B). The oxidized
dike emerges from the northwest side of P9,
where it varies from ~2 to 4 cm in width.
Interpretation of FeatureThe oxidized dikes identifi ed in T1 (Figs. 3A
and 3B) and T3 (Fig. 5) approximately align
with the Canterbury earthquake sequence lateral
spreading feature and exhibit similar subverti-
cal and planar morphologies to the Canterbury
earthquake sequence dikes, thus suggesting that
the dikes were seismically triggered. The mot-
tling within the oxidized dikes (Fig. 8) formed
through precipitation of reduced iron in pore
spaces during water-table lowering (Van Bree-
men and Buurman, 2002). The well-developed
mottles in the oxidized dikes suggest long
residence in fl uctuating water tables, therefore
suggesting that the dikes were emplaced in
A
D
E F
B C
′′
Figure 8. (A) Interpreted fi eld photograph of the north end of T1, indicating the alignment of the Canterbury earthquake sequence (Mx) and pre–Canterbury earthquake sequence (Px) dikes. The Canterbury earthquake sequence dike (Mx) crosscuts the fl uvial stratigra-phy (I–III) and the pre–Canterbury earthquake sequence dike (Px). The pre–Canterbury earthquake sequence dike crosscuts the stratigraphy to ~70 cm. (B) Interpreted fi eld photo-graph of the re-cut in the north wall of T1. The Canterbury earthquake sequence dike cross-cuts the fl uvial stratigraphy (I–III) and pre–Canterbury earthquake sequence liquefaction dike (PX). The pre–Canterbury earthquake sequence dike (PX) dissipates into the fl uvial sand (unit IIc) at ~70 cm depth. (C) Interpreted fi eld photograph of the north end of T3. The Canterbury earthquake sequence dike (Mx) crosscuts the fl uvial stratigraphy (I–III) to the surface. The pre–Canterbury earthquake sequence dike (PX) crosscuts the fl uvial silt (III) and dissipates into the fl uvial sand (unit IIc) at ~90 cm depth. (D) The Canterbury earth-quake sequence dike (Mx) also crosscuts the pre–Canterbury earthquake sequence dike (Px) on the fl oor of T1. (E) The Canterbury earthquake sequence dike (Mx) crosscuts the pre–Canterbury earthquake sequence dike on the fl oor of T1 and contains an internal, dike-parallel silt lining (outlined in white) that separates two Canterbury earthquake sequence liquefaction events (M1 and M2). (F) Excavation of P9 (PF) in plan view reveals that the pit crosscuts the pre–Canterbury earthquake sequence dike (Px) and fl uvial silt (III).
Bastin et al.
12 Geological Society of America Bulletin, v. 1XX, no. XX/XX
an event predating the Canterbury earthquake
sequence. To the best of our knowledge, there
is no empirical data constraining the rate of
mottle formation in a subsurface deposit under
fl uctuating water tables, so no absolute age for
dike emplacement can be determined from the
degree of mottling alone.
The pre–Canterbury earthquake sequence
dike in T1 crosscuts units III and IId and is
overlain by unit IIc (Fig. 3B), indicating that
it most likely postdates deposition of units III
and IId, and the A.D. 665–765 radiocarbon age
for unit III (S4; Table 1). The pre–Canterbury
earthquake sequence dike in T3 crosscuts units
III and IId (Fig. 5), indicating that it postdates
the radiocarbon age of A.D. 1660–1803 (S2;
Table 1) derived from a charcoal sample in unit
IId. These ages are considered to refl ect maxi-
mum depositional ages, and the actual age of the
pre–Canterbury earthquake sequence dikes may
in fact be younger. The pre–Canterbury earth-
quake sequence dike crosscut by the cesspit
(P9; Fig. 7B) indicates that dike injection must
predate excavation of the cesspit. The exact age
of the pit cannot be determined from historical
records; however, it most likely predates closure
of the factory at ca. 1905.
The oxidized dikes can be traced between T1,
T3, and adjacent to P9, where they continuously
align with the ~25-cm-wide lateral spreading
fi ssure. The traceability of these oxidized dikes
suggests that they may comprise a prior lateral
spreading fi ssure formed during a pre–Canter-
bury earthquake sequence earthquake event.
The oxidized dikes decrease in width from
~7 cm in T1 (Fig. 3) to ~2–3 cm in T3 (Fig. 5)
and adjacent to P9 (Fig. 7). This may refl ect
either varied widths along the length of the fea-
ture and/or pinching out at the terminus of the
fi ssure. The oxidized dikes in T1 and T3 exhibit
similar morphologies to the ~25-cm-wide Can-
terbury earthquake sequence lateral spreading
fi ssure, and they appear to dissipate into the
fl uvial sand to silt (unit II) with no obvious evi-
dence for surface ejecta (Figs. 3B, 3C, and 5). It
is possible that either the oxidized dikes reached
the surface, with the ejecta being reworked dur-
ing deposition of unit II (Figs. 3B and 8B), or
the pre–Canterbury earthquake sequence dikes
dissipated within a low-strength layer at depth.
Nonseismic methods for triggering liquefaction
that are outlined in Owen and Moretti (2011),
including gravity acting on slopes, unequal load-
ing due to topography, density contrasts, fl uid
shear, and biological action, do not fi t the depo-
sitional and hydrological setting of Avonside.
The dike morphologies also do not correspond
with the non-seismic soft-sediment deformation
features outlined in Montenat et al. (2007) and
Counts and Obermeier (2012), further support-
ing the interpretation that the oxidized dikes
were seismically triggered.
The medium sand with localized granules of
oxidized sandstone composition of the pre–Can-
terbury earthquake sequence dikes (Figs. 3, 5,
and 8) is consistent with the Canterbury earth-
quake sequence dike on the fl oor of T2 (Fig. 4C)
and unit VI at 2–2.6 m depth (Figs. 3D and 4D).
The consistent composition suggests that both
the pre–Canterbury earthquake sequence and
Canterbury earthquake sequence dikes entrained
material from this unit and may have been
sourced from the underlying unit at 2.8–3 m
depth, which was potentially liquefi able (FS > 1)
in the February 2011 earthquake (Fig. 9).
SITE 2: BRACKEN STREET
The Bracken Street site has fl at topography
with elevations of 0.6–0.8 m above sea level
across the site (Fig. 2). The dwelling on the site
was erected in ca. A.D. 1910. A trench (T4) was
excavated perpendicular to the aligned sand
blow vents (Fig. 2C), to a length of ~10 m and
a depth of ~1.4 m. The depth of the trench was
limited by the depth to the water table, which
was ~1.3–1.4 m during excavation.
Trench Fluvial Stratigraphy
T4 exposed stratigraphy composed of non-
plastic silts (unit IXa) with interbedded, lenticu-
lar, very fi ne sand (unit IXb), capped by ~50 cm
of topsoil (unit VIII; Fig. 10; Appendix 1 [see
footnote 1]). The upper ~25 cm section of topsoil
contains a discontinuous anthropogenic layer of
pottery, glass, and pebbles (unit VII; Fig. 10).
Interpretation of Depositional History of the Site
The nonplastic silts (unit IXa) exposed in
T4 (Fig. 10) are interpreted as overbank fl ood
deposits from the Avon River in a low-energy
depositional setting such as that of a marsh or
oxbow lake. The interbedded lenses of very fi ne
sand (unit IXb) indicate that the area was peri-
odically fl ooded by higher-energy events. The
lenticular morphology of these fi ne sand lenses
(unit IXb) indicates that the fl ood events some-
times formed small channels. The exposed stra-
A
Water table
Dep
th (m
)
Factor of Safety Against Liquefaction0.0 0.5 1.0 1.5 2.0 2.5 3.0 3.5 4.0 4.5 5.0
0
2
4
6
8
10
12
14
16
18
20
FS = 1
Christchurch Earthquake
Darfield Earthquake
Trench log
Auger log
Figure 9. The CPTu (cone pen-etration test with pore-pressure [piezocone] measurement) test conducted at site 1 indicates that the sediment from 1.6 to 2.5 m depth was potentially liq-uefi able (FS < 1) under the peak ground accelerations (PGAs) generated in the September 2010 and February 2011 earth-quakes. The sediment from 2.8 to 3 m depth was also poten-tially liquefi able (FS < 1) under the PGAs of the February 2011 earthquake (modified from Bastin et al., 2013).

Paleoliquefaction in Christchurch, New Zealand
Geological Society of America Bulletin, v. 1XX, no. XX/XX 13
tigraphy refl ects the present depositional setting
of the site within the low-elevation (1–1.5 m
above sea level) fl oodplain of the Avon River
(Fig. 2) and is consistent with historical reports
of periodic fl ooding of the Avon River during
periods of heavy rain (Cowie, 1957).
Radiocarbon dating of two detrital wood
fragments obtained from unit IXa at depths of
0.5 m (S8) and 1.1 m (S9) yielded ages of A.D.
1415–1435 (S8) and A.D. 1330–1412 (S9),
respectively (Fig. 10; Table 1). These 14C ages
indicate that the stratigraphy was deposited over
a maximum period from A.D. 1330 to present.
Canterbury Earthquake Sequence Liquefaction Features
Canterbury earthquake sequence liquefac-
tion features were recognized in T4 (Fig. 10)
by their traceable continuity into the observed
surface sand blows. The Canterbury earthquake
sequence features were documented in detail to
determine whether the morphologies of lique-
faction features were consistent between the two
sites, and to aid identifi cation of pre–Canterbury
earthquake sequence liquefaction features. The
Canterbury earthquake sequence liquefaction
features are all composed of gray, well-sorted,
fi ne sand to silt unless otherwise stated.
Canterbury Earthquake Sequence Liquefaction Dikes
The linear array of surface sand blows inter-
sected at the southern end of T4 (Fig. 2D) aligns
with an ~4–5-cm-wide, subvertical, planar dike
in the subsurface that crosscuts the fl uvial stra-
tigraphy from the trench fl oor to the surface
(Fig. 10). Thinner, subvertical, planar dikes,
~0.5–2 cm wide, that crosscut the stratigraphy
from the trench fl oor to ~10 cm depth are evi-
dent at the northern end of the trench.
The dikes all increase in width with depth and
lack the oxidation and mottling developed in the
surrounding stratigraphy (Fig. 10). No evidence
for vertical grading is observed within these
dikes. Contact-parallel silt linings, ~1 mm thick,
are observed on the margins of the ~4–5-cm-wide
dikes (Fig. 10), while no silt lining is observed on
the margins of the ~0.5–2-cm-wide dikes.
Canterbury Earthquake Sequence Subsurface Liquefaction Sill
The ~4–5-cm-wide dike crosscuts an ~2-cm-
wide sill at ~50 cm depth (Fig. 10). The sill
exhibits a composition consistent with that of
the Canterbury earthquake sequence dike and is
separated from the dike by the ~1–2-mm-thick
dike-parallel silt lining (Fig. 10).
Interpretation of Canterbury Earthquake Sequence Liquefaction Features
The ~4–5-cm-wide dike crosscuts the fl uvial
stratigraphy from the trench fl oor to the surface
(Fig. 10), indicating that it postdates deposition
of the fl uvial stratigraphy. The alignment of the
subsurface dike with the surface sand blow (Fig.
10) confi rms that it formed during the Canter-
bury earthquake sequence, which is further sup-
ported by its lack of oxidation and mottling. The
sill and the ~0.5–2-cm-wide dikes are of simi-
lar composition to the Canterbury earthquake
sequence dikes that unequivocally reach the sur-
face and also lack oxidation and mottling. The
similar composition indicates that the smaller
dikes and sill also formed during the Canterbury
earthquake sequence. The increasing width of
the dikes with depth (Fig. 10) supports the inter-
pretation of these dikes as having formed by
the upward injection of sediment (Counts and
Obermeier, 2012). The subvertical and planar
morphology of the dikes at site 2 is consistent
with the morphologies of the dikes documented
at site 1. The consistent morphology indicates
that dike geometries, as well as the well-sorted
grain-size distributions, may be used to identify
liquefaction features in the subsurface and in the
absence of surface ejecta.
The dike-parallel silt linings along the margin
of the ~4–5-cm-wide dike (Fig. 10) indicate that
fl ow velocities were lower adjacent to the dike
wall. The presence of the silt lining separat-
ing the sill from the dike suggests that the sill
formed prior to the last liquefaction event ejected
through the dike. This indicates that at least two
generations of Canterbury earthquake sequence
liquefaction are preserved within the subsurface.
The dikes at site 2 (Fig. 10) are comparatively
narrower than those identifi ed at site 1 (~5 cm
at site 2 and up to 25 cm at site 1; Figs. 3, 4, 5,
and 10). The varied widths may be attributed to
the varied distance of each site from the river, as
it was observed that the width and spatial den-
sity of surface features decrease away from the
river (Bastin et al., 2013). The varied widths of
the dikes may also refl ect variations in the stra-
tigraphy overlying the liquefi ed layers, which
are predominantly composed of fl uvial silts at
site 2 and fl uvial sands at site 1. It is possible
that the predominately silt stratigraphy at site 2
may inhibit fracturing, thus possibly resulting in
the formation of comparatively narrower dikes.
Pottery Clast
1415–1435 AD
IXa
VIII
VII
0 20 cm
20 cm
Unit VIII: Moderately sorted,bioturbated, massive, carbonaceous silt loam
Unit VII: Moderately sorted,carbonaceous silt loam with localized pebbles & bricks
Unit IXb: Moderately sorted,bioturbated, fine sandto silt
Fluvial Deposits
Unit IXa: Moderately sorted,mo�led and oxidized silt to very fine sand, grada�onal contact with IXb
Unit Mx: Well sorted, fine sand grades upwards to silt (CES liquefac�on)
Radiocarbon sample loca�onand age (Conven�onal)
Unit Px: Well sorted, oxidized and mo�led, fine to medium sand (Pre-CES liquefac�on)
Liquefaction DepositsIXb
Site 2 - Trench 4 - East WallN
1330–1412 AD
IXb
Px
Mx
Figure 10. Detailed trench log of the south end of the east wall in T4 (site 2). The Canterbury earthquake sequence (CES) dike (Mx) crosscuts the fl uvial stratigraphy (VII–IXa) and the dike-fed, pre–Canterbury earthquake sequence injection feature (Px), and it feeds into the surface ejecta. The stratig-raphy within the surface ejecta, and the location and 14C ages of the samples are also indicated.

Bastin et al.
14 Geological Society of America Bulletin, v. 1XX, no. XX/XX
Pre–Canterbury Earthquake Sequence Liquefaction Features
Pre–Canterbury earthquake sequence lique-
faction features were identifi ed in T4 based
on their structural similarities and crosscutting
relationships with the Canterbury earthquake
sequence liquefaction features and the sur-
rounding stratigraphy, and from comparison
with the pre–Canterbury earthquake sequence
features identifi ed at site 1.
The Canterbury earthquake sequence dike
at the southeast end of T4 crosscuts a bulbous-
shaped lens of oxidized and mottled, well-
sorted, fi ne to very fi ne sand (Fig. 10). This lens
crosscuts the fl uvial stratigraphy from the trench
fl oor to ~80 cm depth and exhibits irregular
and bioturbated contacts (Fig. 10). Excavation
around this feature revealed a dike at ~1.5–1.7 m
depth that merges with the bulbous lens and is of
consistent grain size and sorting (Fig. 10). The
dike ranges from 5 to 7 cm in width and exhib-
its a similar subvertical, planar geometry to the
Canterbury earthquake sequence dike at site 2
(Fig. 10), and the oxidized dikes at site 1 (Fig.
8). Excavation beyond this point was limited by
the height of the water table.
Interpretation of Pre–Canterbury Earthquake Sequence Liquefaction Features
The dike beneath the oxidized lens (Fig. 10)
indicates that it formed by the upward injection
of liquefi ed sediment. The similar sub verti-
cal, planar geometry of the oxidized dike and
the adjacent Canterbury earthquake sequence
dike indicates that the oxidized feature was
seismically triggered. The oxidation and mot-
tling within this feature indicate that it has
been subjected to prolonged fl uctuations in the
height of the water table, indicating that it pre-
dates the Canterbury earthquake sequence. The
bulbous shape of the oxidized lens, combined
with its irregular contacts (Fig. 10) and lack of
evidence for surface ejecta, suggests that this
feature formed by the subsurface injection of
liquefi ed sediment. The bulbous morphology of
this feature is inconsistent with the Canterbury
earthquake sequence injection sills observed at
both sites 1 and 2. Therefore, we suggest that
this feature may refl ect injection into and sub-
sequent deformation of a lens of fi ne sand, pos-
sibly being the paleochannel comprising unit
IXb (Fig. 10). Liquefaction dikes are likely to
preferentially form within loosely consolidated
sands such as that within a paleochannel, as the
sand provides a path of lower resistance com-
pared to the surrounding silt. The site-specifi c
depositional and hydrological conditions and
the bulbous morphology of the oxidized feature
are inconsistent with the liquefaction-triggering
mechanisms and morphologies of nonseismic
liquefaction features described in Montenat
et al. (2007), Owen and Moretti (2011), and
Counts and Obermeier (2012). This supports the
interpretation that this oxidized lens and associ-
ated dike formed during a pre-Canterbury earth-
quake sequence earthquake.
The pre–Canterbury earthquake sequence
lique faction injection feature crosscuts the
fl uvial silt (unit IXa) from the trench fl oor to
~80 cm depth. This indicates that this liquefac-
tion feature likely formed in an event that post-
dated deposition of the fl uvial silt (unit IXa),
and the 14C ages of A.D. 1415–1435 (S8; Fig.
10; Table 1). The lack of surface ejecta associ-
ated with this feature indicates that the causative
earthquake triggered liquefaction at depth; how-
ever, it did not generate the shaking intensities
required to fracture the overlying soil cap and
eject liquefi ed sediment to the surface at this
location. It is possible that localized ejecta did
form at other locations across this site and were
not intersected within this trench. The lack of
surface ejecta means that the ground surface
at the time of injection cannot be determined,
and no additional constraints can be placed on
the timing of the paleoearthquake. The depth of
the liquefi ed source stratum for the Canterbury
earthquake sequence dikes and pre–Canterbury
earthquake sequence liquefaction feature cannot
be determined for this site because excavation
was limited by the shallow water table.
POSSIBLE TIMING AND SEISMIC SOURCE FOR THE PALEOLIQUEFACTION
Timing and Origin of Paleoearthquake(s)
The approximate timing of the earthquake(s)
forming the pre–Canterbury earthquake
sequence liquefaction features at sites 1 and 2
can be approximated by combining crosscutting
relationships with 14C ages of the host sediments.
The pre–Canterbury earthquake sequence dikes
at site 1 crosscut the strata to ~70 cm depth in
T1 (Fig. 3) and ~90–95 cm depth in T3 (Fig. 5)
and are crosscut by P9 (Figs. 7 and 8B). This
indicates that the pre–Canterbury earthquake
sequence dikes postdate the depositional age of
A.D. 1660–1803 for unit IIc (S2; Fig. 5; Table 1)
and predate the closure of the wool scouring fac-
tory in ca. 1905.
The OSL ages (Fig. 3B; Table 2) are within
error of the 14C age of 810–792 B.C. for the
lique fi ed source strata (Table 1). It is possible
that the OSL ages are dominated by reworked
sediment sourced from the liquefi ed unit or its
age equivalent elsewhere via redeposition of
lique fi ed material ejected from depth, bioturba-
TA
BLE
3. IN
FE
RR
ED
MA
GN
ITU
DE
S A
ND
MM
I V
ALU
ES
FO
R T
HE
FIV
E H
IST
OR
IC E
AR
TH
QU
AK
ES
WIT
H T
HE
50
TH
PE
RC
EN
TIL
EP
EA
K G
RO
UN
D A
CC
ELE
RA
TIO
N (
PG
A),
AN
D C
ALC
ULA
TE
D 1
6T
H,
50T
H, A
ND
84T
H P
ER
CE
NT
ILE
PG
A7.
5 V
AL
UE
S F
OR
SIT
E 1
Mt
ne
vE
wM
MI
Appro
x.
dis
tance f
rom
epic
ente
r (k
m)
PG
A50th
perc
.P
GA
7.5
16th
perc
.P
GA
7.5
50
th p
erc
.P
GA
7.5
84
th p
erc
.C
alc
ula
ted
MM
I
71.
0±
8.4
hc r
uh
ctsir
hC
96
81
14
0.1
48 ±
0.0
13
0.0
40 ±
0.0
05
0.0
74
± 0
.00
90
.12
4 ±
0.0
05
7
1870 L
ake E
llesm
ere
5.7
± 0
.16
137
0.0
49 ±
0.0
04
0.0
17 ±
0.0
02
0.0
31
± 0
.00
30.0
55
± 0
.00
55
.5
61.
0±
2.7
tlu
afe
po
H8
88
12
102
0.0
46 ±
0.0
035
0.0
26 ±
0.0
02
0.0
43
± 0
.00
40
.07
1 ±
0.0
01
75
7–
61.
0±
8.6
toi
ve
hC
10
91
3105
0.0
34 ±
0.0
01
0.0
17 ±
0.0
01
0.0
28
± 0
.00
10
.04
7 ±
0.0
01
4.5
7–
61.
0±
4.6
ua
nut
oM
22
91
358
0.0
42 ±
0.0
01
0.0
21 ±
0.0
01
0.0
36
± 0
.00
10.0
62
± 0
.00
15
Not
e: S
ourc
e: 1—
Dow
nes a
nd Y
etton (
2012);
2—
Cow
an (
1991);
3—
Stirlin
g e
t al. (
1999).
Mw—
mom
ent
magnitude;
MM
I—m
odifi
ed M
erc
alli
inte
nsity; p
erc
—p
erc
en
tile
.

Paleoliquefaction in Christchurch, New Zealand
Geological Society of America Bulletin, v. 1XX, no. XX/XX 15
tion causing mixing of the surface ejecta with
the surrounding fl uvial deposits, or via erosion
and redeposition of ca. 2.6–2.8 ka sediment
from elsewhere without bleaching.
The pre–Canterbury earthquake sequence
liquefaction feature at site 2 crosscuts the fl u-
vial stratigraphy to ~80 cm depth (Fig. 10),
indicating that it postdates the depositional age
of A.D. 1415–1435 for unit IXa. No additional
constraints on the timing of the earthquake can
be concluded from crosscutting relationships;
therefore, it cannot be concluded whether the
pre-Canterbury earthquake sequence liquefac-
tion features at both sites formed during the
same earthquake event.
The historic record of earthquakes within
the wider Christchurch area is limited to post-
1843, following European settlement. Historic
reports indicate that fi ve damaging earthquakes
occurred within ~150 km of Christchurch
between 1869 and 1922 (Fig. 1B; Pettinga
et al., 2001; Downes and Yetton, 2012). The
magnitudes and inferred Modifi ed Mercalli
Indices (MMI) in Christchurch for each of
these events are presented in Table 3 (Downes
and Yetton, 2012). The 1869 Mw ~4.8 Christ-
church earthquake occurred on 5 June 1869 at
NZST 8.30 a.m. and was felt throughout the
city (Elder et al., 1991; Stirling et al., 1999; Pet-
tinga et al., 2001; Downes and Yetton, 2012).
The highest shaking intensity was recorded
within the Central Business District (CBD)
causing the collapse of chimneys, the Christ-
church cathedral spire, and a brick wall of a
house (Stirling et al., 1999). Damage within
Avonside and northeast Christchurch included
extensive damage to the contents of residential
properties, and many damaged or fallen chim-
neys. The reported damage corresponds with
the effects of a MMI 7 earthquake (Downes
and Yetton, 2012). Downes and Yetton (2012)
assigned a macroseismic epicenter of 43.55°S,
172.60°E and upper-crustal hypocentral depth
of 5 km, which is located at the center of the
isoseismal pattern based on the accounts from
residents and the distribution of damage (Stir-
ling et al., 1999). Following the earthquake, it
was observed by a local resident that “the tide
runs higher up the Heathcote River than for-
merly,” suggesting that settlement, potentially
induced by liquefaction, may have occurred
(Downes and Yetton, 2012).
Damage during the 1870 ~Mw 5.7 Lake Elles-
mere earthquake was less widespread, with only
damage to the contents of residential properties
and chimneys reported within Avonside. The
1888 ~Mw 7.2 North Canterbury and 1901 ~Mw
6.8 Cheviot earthquakes caused widespread
damage within the wider Christchurch area,
including toppling of the Cathedral spire during
both events (Cowan, 1991; Downes and Yetton,
2012). Damage was also reported in Christ-
church following the 1922 ~Mw 6.4 Motunau,
North Canterbury, earthquake (Downes and
Yetton, 2012). No surface manifestation of
liquefaction was reported in Avonside follow-
ing any of these events; however, it is possible
that localized surface ejecta formed and went
unreported due to the sparsely populated, rural
and industrial nature of much of this area at
this time. Large known prehistoric earthquakes
prior to the settlement of Christchurch during
the time interval encompassing the pre–Can-
terbury earthquake sequence liquefaction fea-
tures include the 1717 Alpine fault Mw ≥7.9
(Sutherland et al., 2007) and ca. 500–600 yr
B.P. Mw ≥ 7.1 Porters Pass fault earthquakes
(Howard et al., 2005). The approximate epicen-
tral locations and shaking intensities generated
in Christchurch for these events are poorly con-
strained given the broad constraints on earth-
quake Mw and the lack of historical accounts.
Additional large earthquakes in the Canterbury
region are not considered due to the limited his-
torical record.
Triggering of LiquefactionThe PGA7.5 0.06g liquefaction-initiation
threshold at site 2 (Quigley et al., 2013) was
established based on the observation of local-
ized, small sand blows (~20 cm in diameter) that
formed in the Mw 5.0 April 2011 earthquake.
Widespread liquefaction ejecta were reported at
the site at PGA7.5 >0.1g (Fig. 11). No empiri-
cally derived liquefaction triggering threshold
was established for site 1; however, a similar
threshold is likely given their geographic prox-
imity, the similar geomorphic and geologic set-
tings, and the similar water-table depths.
Site-specifi c PGA7.5 estimates were derived
for site 1 for the fi ve well-documented histori-
cal events using the ground motion prediction
equation (GMPE) outlined by Bradley (2013;
Table 3). Site class E (very soft soil) characteris-
tics were assumed for the study site. This GMPE
is a New Zealand–specifi c model derived from
comparison of four different preexisting models
and calibrated against recorded ground motions
in New Zealand (Bradley, 2013). The model
utilizes the inferred magnitude, distance from
epicenter, predominant rock type, and fault type
1869 Christchurch
1870 Lake Ellesmere
1888 Hope Fault
1901 Cheviot
1922 Motunau
13 June 2011-b
23 Dec. 2011-b13 June 2011-a
16 April 201121 June 2011
0.00
0.05
0.10
0.15
0.20
0.25
0.30
4.5 5 5.5 6 6.5 7 7.5Moment Magnitude Mw
22 Feb. 2011
4 Sept. 2010
PGA
7.5
(g)
Minor liquefac�on thresholdSevere liquefac�on threshold
Liquefac�on
No Liquefac�on
Historic earthquake
Figure 11. The calculated PGA7.5 (peak ground acceleration equivalent for a Mw 7.5 event) for the Canterbury earthquake sequence events that did and did not cause liquefaction at site 2 compared with earthquake magnitude (Mw). The calculated median PGA7.5 (box) and associated 16th and 84th percentiles (error bars), and inferred magnitudes for the paleo-events are also plotted. The plotted PGA7.5 values are compared to the liquefaction trigger-ing thresholds for minor to severe liquefaction during the Canterbury earthquake sequence as constrained for site 2 by Quigley et al. (2013).

Bastin et al.
16 Geological Society of America Bulletin, v. 1XX, no. XX/XX
(i.e., normal, reverse, or strike slip) to calculate
the approximate PGA experienced at the site
(Table 3). Directionality was not considered due
to the lack of constraints on the rupture direc-
tivity. The results provide a distribution with
both the median and standard deviation PGAs.
The 16th and 84th percentiles of this distribu-
tion were derived from the 50th percentile
median PGA (Table 3). The PGA values were
Mw 7.5–weighted (PGA7.5) using the method-
ology outlined in Idriss and Boulanger (2008).
The PGA7.5 value enables direct comparison of
ground accelerations generated by events with
different Mw and epicentral distances. Here, we
plot the median PGA7.5 and 16th and 84th per-
centiles as error bars (Fig. 11), and compare the
plotted PGA7.5 for each event with the liquefac-
tion triggering thresholds of PGA7.5 ~0.06g for
minor liquefaction and PGA7.5 0.1g for severe
liquefaction at site 2 (Fig. 11). Of the fi ve his-
torical events, only the 1869 Christchurch
earthquake produces a modeled median (50th
percentile) PGA7.5 that exceeds the threshold for
minor liquefaction (Table 3). The 1869 earth-
quake predates closure of the wool scouring fac-
tory; therefore, it is possible that the pre–Canter-
bury earthquake sequence dikes at site 1 formed
during this event, and the pit (P9) was excavated
following this event.
Liquefaction during the Canterbury earth-
quake sequence was reported at distances of
~8 km from the epicenter following the 19 Octo-
ber 2010 Mw 5.0 aftershock (Cubrinovski and
Green, 2010) and ~14 km from the epicenter of
the 16 April 2011 Mw 5.0 aftershock (Quigley
et al., 2013). This indicates that moderate-to-
large (M 5–7.9) events can trigger lique faction at
distances greater than that predicted from empir-
ical global compilations of Mw versus “distance
to most distal liquefaction feature” (Ambraseys,
1988; Galli, 2000; Cubrinovski and Green,
2010), particularly in highly susceptible sedi-
ments or in areas prone to seismic amplifi cation.
Therefore, it is possible that the 1869 earthquake
triggered minor liquefaction at an approximate
epicentral distance of 6 km in highly susceptible
sediments. The termination of the pre–Can-
terbury earthquake sequence dikes at ~70 and
~90 cm depth indicates that either ~90 cm of
sedimentation occurred at the site following the
event, or that the dikes terminated beneath the
surface. It is considered unlikely that ~90 cm of
sediment accumulated at the site post-1869 and
during production at the wool scouring factory,
thus suggesting the dikes terminated at depth.
However, the similar geometries of the pre–Can-
terbury earthquake sequence dikes and Canter-
bury earthquake sequence lateral spreading fi s-
sure suggest that the pre–Canterbury earthquake
sequence dikes may comprise a lateral spread-
ing fi ssure. The geometry of the dikes, com-
bined with the inferred sedimentation at the site,
suggests that the pre–Canterbury earthquake
sequence features formed in an event prior to
the 1869 event. It is possible that these features
formed during a large, far-fi eld earthquake such
as the ~Mw 7.9 ± 0.3 1717 Alpine fault event,
which postdates the depositional age of A.D.
1660–1803 for unit IIc (S2; Fig. 5; Table 1). The
GMPE indicates that this event likely generated
PGA7.5, exceeding the liquefaction triggering
threshold at the site (Bradley, 2013).
The New Zealand Seismic Hazard Model
(NZSHM) predicts approximate return times
of ~50 yr for PGAs of 0.11g (MMI 6–7) and
~200 yr for PGAs of 0.22g (MMI 7–8) for class
C material (shallow soils) in the Christchurch
area (Stirling et al., 2008). This suggests a high
likelihood of earthquake-induced strong ground
motions exceeding the liquefaction triggering
threshold within the last ~220 yr, particularly in
sediments that are highly susceptible to lique-
faction (e.g., site class E, very soft soils; NZS
1170.5, 2004). The approximate return times
exclude the occurrence of earthquake clustering
and are therefore considered to refl ect average
return times.
Liquefaction Susceptibility of AvonsideThe liquefaction potential of the two sites in
Avonside is governed by their hydrologic, geo-
logic, and geomorphic setting. The liquefaction
potential of the subsurface sediments generally
decreases over time due to sedimentation, com-
paction, and the formation of secondary cements
(Seed and Idriss, 1982; Idriss and Boulanger,
2008). The water table within Avonside is tid-
ally infl uenced and controlled by the height of
the Avon River, which remains approximately
at sea level. Therefore, subsurface sediments
at ≥1–2 m depth are likely to have remained in
the saturation zone following initial deposition,
which, combined with their relatively young
age (810–792 B.C.; S7; Table 1), suggests that
limited cementation or aging is likely to have
occurred. Quigley et al. (2013) showed a power-
law relationship between the spatial extent and
maximum stratigraphic thicknesses of sedi-
ment ejecta during the Canterbury earthquake
sequence with PGA7.5. This implies that any
changes to the liquefaction source sediment dur-
ing the Canterbury earthquake sequence (e.g.,
densifi cation) did not have a discernible infl u-
ence on the liquefaction susceptibility of the site
in subsequent earthquakes. We suggest that the
liquefaction susceptibility of the study sites dur-
ing pre-CES liquefaction is unlikely to have been
modifi ed signifi cantly by sediment densifi cation.
The surface at site 1 has aggraded by ~20 cm
since excavation of the pits (Figs. 3, 4, and 5),
suggesting that the site was still actively aggrad-
ing following the pre–Canterbury earthquake
sequence event. The geometry of the pre–Can-
terbury earthquake sequence dikes at site 1
suggests ~70–90 cm of sedimentation may be
inferred at the site since the paleoearthquake.
This inferred sedimentation may have increased
the overburden pressure on the liquefi able strata,
increasing the cyclic stress threshold required
to initiate liquefaction and therefore decreas-
ing the liquefaction susceptibility of the site.
The sediment accumulation at site 2 cannot be
directly calculated; however, historical records
of periodic fl ooding (Cowie, 1957) suggest that
sedimentation has most likely occurred at the
site since the paleoearthquake. Any compaction
of subsurface strata during the previous epi-
sodes of liquefaction is unlikely to have had a
major effect on liquefaction susceptibility. The
inferred sedimentation, limited compaction,
and combined limited cementation, suggest
that the liquefaction triggering threshold dur-
ing the earthquake(s) forming the pre–Canter-
bury earthquake sequence liquefaction features
in Avonside is likely to have been consistent
or lower than that during the Canterbury earth-
quake sequence.
IMPLICATIONS FOR PALEOSEISMIC STUDIES AND FUTURE LAND USE
The identifi cation of pre–Canterbury earth-
quake sequence liquefaction at both sites in
Avonside indicates that residential development
within eastern Christchurch (ca. 1860–2005)
took place on top of sediments where geologic
evidence for liquefaction was present in the shal-
low subsurface. The identifi cation of the pre–
Canterbury earthquake sequence at both sites in
Avonside highlights the potential of paleo lique-
faction investigations, in addition to geotech-
nical data, to contribute to land-use planning.
Future residential and commercial develop-
ments could therefore utilize paleolique faction
observations to assist with making informed
decisions on land zonation and building design
criteria.
The approximate alignment of the pre–Can-
terbury earthquake sequence features with the
~25-cm-wide lateral spreading fi ssure at site 1
and the ~5-cm-wide dike at site 2 indicates that
some zones of weakness were reoccupied dur-
ing the subsequent earthquake events (Figs. 3,
5, and 10). The identifi cation of two generations
of Canterbury earthquake sequence liquefac-
tion within the subsurface at both sites (Figs. 8
and 10), despite the 10 Canterbury earthquake
sequence liquefaction events recorded at site 2
(Quigley et al., 2013), suggests that geologic
evidence for paleoliquefaction may signifi cantly

Paleoliquefaction in Christchurch, New Zealand
Geological Society of America Bulletin, v. 1XX, no. XX/XX 17
underrepresent the number of distinct liquefac-
tion events at the site. Feeder dike generations
identifi ed in paleoliquefaction studies should
therefore be generally treated as proxies for
the minimum number of liquefaction-inducing
earthquakes.
The CPTu and hand auger data indicate that
the widest Canterbury earthquake sequence
dike (>50 cm) identifi ed on the fl oor of T2 at
site 1 (Fig. 4C) likely formed during the Feb-
ruary 2011 earthquake and was likely sourced
from a greater depth than the other Canterbury
earthquake sequence dikes. The width of this
dike (>50 cm) compared to the other Canter-
bury earthquake sequence (<25 cm) and pre–
Canterbury earthquake sequence dikes (<7 cm)
implies that the shaking intensity and severity
of liquefaction experienced during the Febru-
ary 2011 earthquake is likely to have been the
most severe since initial deposition of the fl uvial
sediment ca. A.D. 665. The width of liquefac-
tion dikes preserved within the subsurface may
act as proxies for the intensity of shaking and
associated severity of liquefaction experienced
during historic earthquakes in certain instances.
CONCLUSIONS
Canterbury earthquake sequence liquefaction
features at sites 1 and 2 consist of liquefaction
dikes and sills that exhibit subvertical, planar
morphology and increase in width with depth.
The dikes and sills are composed of gray, well-
sorted, fi ne to medium sand that lacks the oxida-
tion and mottling developed in the surrounding
sediment. Pre–Canterbury earthquake sequence
liquefaction features were also identifi ed at both
sites, including dikes at site 1 and an injection
feature at site 2. These pre features were dis-
tinguished from the Canterbury earthquake
sequence features by their oxidized and mottled
appearance and bioturbated contacts.
The presence of pre–Canterbury earthquake
sequence liquefaction confi rms that earthquake-
induced strong ground motions exceeding the
threshold value for liquefaction occurred within
eastern Christchurch prior to the 2010 Darfi eld
earthquake. Crosscutting relationships com-
bined with 14C dating at site 1 indicate that this
event most likely occurred between A.D. 1660–
1803 (S2) and ca. 1905.
The PGA7.5 values calculated for site 1 for the
fi ve historic events indicate that only the 1869
Christchurch earthquake generated ground
motions in excess of the local liquefaction trig-
gering threshold of PGA7.5 ~0.06g (Quigley
et al., 2013). The recorded damage within Avon-
side during the event (MMI 7) and reports of the
tide running up the Heathcote River support the
inference that liquefaction may have been trig-
gered during this event. The calculated PGA7.5
for this event corresponds with minor liquefac-
tion in the Canterbury earthquake sequence.
This supports the interpretation that minor
lique faction in highly susceptible sediments
may have formed during this event.
The documentation of liquefaction in mod-
erate-to-large (Mw ~5–7.9) earthquakes at dis-
tances exceeding that predicted by Ambraseys
(1988) (i.e., ~8 km from epicenter for the Octo-
ber 2011 Mw 5.0 earthquake, ~14 km from epi-
center for the April 2011 Mw 5.0 earthquake,
and ~6 km from inferred epicenter for the 1869
Christchurch Mw 4.8 ± 0.1 earthquake) indicates
that even moderate Mw earthquakes on blind
faults can trigger liquefaction in highly sus-
ceptible sediments or in areas prone to seismic
amplifi cation at distances greater than predicted.
More data documenting the spatial distribu-
tion of liquefaction associated with moderate
Mw earthquakes will help to better refi ne the
liquefaction hazard posed by earthquakes of
this nature.
ACKNOWLEDGMENTS
We thank Martitia Tuttle, Peter Almond, and Pilar
Villamor for their discussions and assistance that
aided in the interpretation of these pre–Canterbury
earthquake sequence liquefaction features. We also
thank Matthew Hughes for his assistance with ArcGIS
and Brendon Bradley for calculating the peak ground
accelerations for the paleoearthquake events. This
work was funded by an EQC Capability Fund and the
University of Canterbury Mason Trust Fund.
REFERENCES CITED
Aitken, M.J., 1998, Introduction to Optical Dating: Oxford,
UK, Oxford University Press, 267 p.
Almond, P., Villamor, P., Tuttle, M., Langridge, R., Clark,
K., Eger, A., Bastin, S., Quigley, M., Barker, P., and
Vandergoes, M., 2013, Liquefaction induced by the
2010–2011 Canterbury earthquake sequence and im-
plications of recently discovered paleoliquefaction
features: Geological Society of America Abstracts with
Programs, v. 44, no. 7, p. 414.
Ambraseys, N.N., 1988, Engineering seismology part 1:
Earthquake Engineering & Structural Dynamics, v. 17,
no. 1, p. 1–50, doi: 10 .1002 /eqe .4290170101 .
Bastin, S.H., Quigley, M.C., Bassett, K., and Green, R.A.,
2013, Characterisation of modern and paleo-liquefac-
tion features in eastern Christchurch, NZ, following
the 2010–2011 Canterbury earthquake sequence: NZ
Geomechanics News, v. 26, p. 38–46.
Berrill, J.B., Mulqueen, P.C., and Ooi, E.T.C., 1994, Lique-
faction at Kaiapoi in the 1901 Cheviot, New Zealand,
earthquake: Bulletin of the New Zealand National
Society for Earthquake Engineering, v. 24, no. 3,
p. 178–189.
Bradley, B., 2013, A New Zealand–specifi c pseudospectral
acceleration ground-motion prediction equation for ac-
tive shallow crustal earthquakes based on foreign mod-
els: Bulletin of the Seismological Society of America,
v. 103, no. 3, p. 1801–1822, doi: 10 .1785 /0120120021 .
Bremer, J., 1985, Wool Scours of New Zealand—Tales of
the Early Industry: Christchurch, New Zealand, New
Zealand Woolscours Association Inc., 136 p.
Brown, L.J., and Weeber, J.H., 1992, Geology of the
Christchurch Urban Area: Institute of Geological and
Nuclear Sciences Geological Map 1, scale 1:25,000, 1
sheet + 105 p.
Counts, R.C., and Obermeier, S.F., 2012, Subtle seismic
signatures: Using small-scale features and ground
fractures as indicators of paleoseismicity, in Cox, R.T.,
Tuttle, M.P., Boyd, O., and Locat, J., eds., Recent Ad-
vances in North American Paleoseismology and Neo-
tectonics East of the Rockies: Geological Society of
America Special Paper 493, p. 203–219.
Cowan, H.A., 1991, The North Canterbury earthquake of
September 1, 1888: Journal of the Royal Society of
New Zealand, v. 21, p. 1–12, doi: 10 .1080 /03036758
.1991 .10416105 .
Cowie, C.A., 1957, Floods in New Zealand 1920–1953,
with Notes on Some Earlier Floods: Wellington, New
Zealand, The Soil Conservation and Rivers Control
Council, 240 p.
Cox, S.C., Rutter, H.K., Sims, A., Manga, M., Weir, J.J.,
Ezzy, T., White, P.A., Horton, T.W., and Scott, D.,
2012, Hydrological effects of the Mw 7.1 Darfi eld
(Canterbury) earthquake, 4 September 2010: New Zea-
land Journal of Geology and Geophysics, v. 55, no. 3,
p. 231–247, doi: 10 .1080 /00288306 .2012 .680474 .
Cubrinovski, M., and Green, R.A., eds., 2010, Geotechni-
cal Reconnaissance of the 2010 Darfi eld (Canterbury)
Earthquake (contributing authors: Allen, J., Ashford,
S., Bowman, E., Bradley, B., Cox, B., Cubrinovski, M.,
Green, R., Hutchinson, T., Kavazanjian, E., Orense, R.,
Pender, M., Quigley, M., Wotherspoon, L.): Bulletin of
the New Zealand Society for Earthquake Engineering,
v. 43, no. 4, p. 243–320.
Cubrinovski, M., Bray, J.D., Taylor, M., Giorgini, S., Brad-
ley, B., Wotherspoon, L., and Zupan, J., 2011, Soil
liquefaction effects in the Central Business District
during the February 2011 Christchurch earthquake:
Seismological Research Letters, v. 82, no. 6, p. 893–
904, doi: 10 .1785 /gssrl .82 .6 .893 .
Downes, G., and Yetton, M., 2012, Pre-2010 historical seis-
micity near Christchurch, New Zealand: The 1869 Mw
4.7–4.9 Christchurch and 1870 Mw 5.6–5.8 Lake Elles-
mere earthquakes: New Zealand Journal of Geology
and Geophysics, v. 55, no. 3, p. 199–205, doi: 10 .1080
/00288306 .2012 .690767 .
Elder, D.M., McCahon, I.F., and Yetton, M.D., 1991, The
Earthquake Hazard in Christchurch: A Detailed Evalu-
ation: Research Report to the EQC: Christchurch, New
Zealand, Soils and Foundations Ltd, 131 p.
Galli, P., 2000, New empirical relationships between mag-
nitude and distance for liquefaction: Tectonophys-
ics, v. 324, p. 169–187, doi: 10 .1016 /S0040 -1951
(00)00118 -9 .
Green, R.A., Obermeier, S.F., and Olsond, S.M., 2005,
Engineering geologic and geotechnical analysis of
paleoseismic shaking using liquefaction effects: Field
examples: Engineering Geology, v. 76, p. 263–293,
doi: 10 .1016 /j .enggeo .2004 .07 .026 .
Hjulström, F., 1939, Transportation of detritus by moving
water: Part 1. Transportation, in Trask, P.D., ed., Recent
Marine Sediments: American Association of Petro leum
Geologists Special Volume 10, p. 5–31.
Howard, M.E., Nicol, A., Campbell, J., and Pettinga, J.,
2005, Holocene paleoearthquakes on the strike-slip
Porters Pass fault, Canterbury, New Zealand: New Zea-
land Journal of Geology and Geophysics, v. 48, no. 1,
p. 59–74, doi: 10 .1080 /00288306 .2005 .9515098 .
Idriss, I.M., and Boulanger, R.W., 2008, Soil Liquefaction
during Earthquakes, Monograph Series: Oakland,
California, Earthquake Engineering Research Institute,
261 p.
Loope, D.B., Elder, J.F., Zlotnik, V.A., Kettler, R.M., and
Pederson, D.T., 2013, Jurassic earthquake sequence re-
corded by multiple generations of sand blows, Zion Na-
tional Park, Utah: Geology, v. 41, no. 10, p. 1127–1134.
McCormac, F.G., Hogg, A.G., Blackwell, P.G., Buck, C.E.,
Higham, T.F.G., and Reimer, P.J., 2004, SHCAL04
Southern Hemisphere calibration, 0–11.0 cal kyr BP:
Radiocarbon, v. 46, no. 3, p. 1087–1092.
Montenat, C., Barrier, P., d’Estevou, P.O., and Hibsch, C.,
2007, Seismites: An attempt at critical analysis and
classifi cation: Sedimentary Geology, v. 196, p. 5–30,
doi: 10 .1016 /j .sedgeo .2006 .08 .004 .
NZS 1170.5, 2004, Structural Design Actions Part 5: Earth-
quake Actions: Wellington, New Zealand, Standards
New Zealand, 80 p.

Bastin et al.
18 Geological Society of America Bulletin, v. 1XX, no. XX/XX
Obermeier, S.F., 1996, Use of liquefaction-induced features
for paleoseismic analysis—An overview of how seis-
mic liquefaction features can be distinguished from
other features and how their regional distribution and
properties of source sediment can be used to infer the
location and strength of Holocene paleo-earthquakes:
Engineering Geology, v. 44, p. 1–76, doi: 10 .1016
/S0013 -7952 (96)00040 -3 .
Obermeier, S.F., Bleuer, N.K., Munson, C.A., Munson,
P.J., Martin, W.S., McWilliams, K.M., Tabaczynski,
D.A., Odum, J.K., Rubin, M., and Eggart, D.L., 1991,
Evidence of strong earthquake shaking in the lower
Wabash Valley from prehistoric liquefaction features:
Science, v. 251, p. 1061–1063, doi: 10 .1126 /science
.251 .4997 .1061 .
Obermeier, S.F., Olson, S.M., and Green, R.A., 2005, Field
occurrences of liquefaction-induced features: A primer
for engineering geologic analysis of paleoseismic
shaking: Engineering Geology, v. 76, p. 209–234, doi:
10 .1016 /j .enggeo .2004 .07 .009 .
Owen, G., and Moretti, M., 2011, Identifying triggers for
liquefaction-induced soft-sediment deformation in
sands: Sedimentary Geology, v. 235, p. 141–147, doi:
10 .1016 /j .sedgeo .2010 .10 .003 .
Pettinga, J.R., Yetton, M.D., Van Dissen, R.J., and Downes,
G., 2001, Earthquake source identifi cation and char-
acteristics for the Canterbury region, South Island,
New Zealand: Bulletin of the New Zealand Society for
Earthquake Engineering, v. 34, no. 4, p. 282–317.
Quigley, M.C., Bastin, S., and Bradley, B.A., 2013, Recur-
rent liquefaction in Christchurch, New Zealand, during
the Canterbury earthquake sequence: Geology, v. 41,
n. 5, p. 614.
Reid, C.M., Thompson, N.K., Irvine, J.R.M., and Laird,
T.E., 2012, Sand volcanoes in the Avon-Heathcote
estuary produced by the 2010–2011 Christchurch
earthquakes: Implications for geological preserva-
tion and expression: New Zealand Journal of Geology
and Geophysics, v. 55, no. 3, p. 249–254, doi: 10 .1080
/00288306 .2012 .674051 .
Santucci de Magistris, F., Lanzano, G., Forte, G., and Fab-
brocino, G., 2013, A database for PGA threshold in
lique faction occurrence: Soil Dynamics and Earth-
quake Engineering, v. 54, p. 17–19, doi: 10 .1016 /j
.soildyn .2013 .07 .011 .
Seed, H.B., and Idriss, I.M., 1982, Ground Motions and Soil
Liquefaction during Earthquakes, Monograph Series:
Berkeley, California, Earthquake Engineering Re-
search Institute, 134 p.
Silby, K., compiler, 1856, Christchurch Area Showing
Water ways Swamps and Vegetation: Christchurch
Drainage Board, available at http:// resources .ccc .govt
.nz /fi les /blackmap -environmentecology .pdf (accessed
June 2013).
Sims, J.D., 1975, Determining earthquake recurrence inter-
vals from deformational structures in young lacustrine
sediments: Tectonophysics, v. 29, p. 141–152, doi: 10
.1016 /0040 -1951 (75)90139 -0 .
Sims, J.D., and Garvin, C.D., 1995, Recurrent liquefaction
induced by the 1989 Loma Prieta earthquake and 1990
and 1991 aftershocks: Implications for paleoseismic-
ity studies: Bulletin of the Seismological Society of
America, v. 85, no. 1, p. 51–65.
Stirling, M., Yetton, M., Pettinga, J., Berryman, K.R., and
Downes, G.L., 1999, Probabilistic Seismic Hazard
Assess ment and Earthquake Scenarios for the Canter-
bury Region, and Historic Earthquakes in Christchurch.
Stage 1 (Part B) of Canterbury Regional Council’s
Earthquake Hazard and Risk Assessment Study: Lower
Hutt, New Zealand, Institute of Geological and Nuclear
Sciences Client Report 1999/53, GNS Science, 14 p.
Stirling, M., Gerstenberger, M., Litchfi eld, N., McVerry, G.,
Smith, W., Pettinga, J., and Barnes, P., 2008, Seismic
hazard of the Canterbury region, New Zealand: New
earthquake source model and methodology: Bulletin of
the New Zealand Society for Earthquake Engineering,
v. 41, no. 2, p. 51–67.
Stirling, M., McVerry, G., Gerstenberger, M., Litchfi eld, N.,
Van Dissen, R., Berryman, K., Barnes, P., Wallace, L.,
Villamor, P., Langridge, R., Lamarche, G., Nodder,
S., Reyners, M., Bradley, B., Rhoades, D., Smith, W.,
Nicol , A., Pettinga, J., Clark, K., and Jacobs, K., 2012,
National seismic hazard model for New Zealand: 2010
update: Bulletin of the Seismological Society of Amer-
ica, v. 102, no. 4, p. 1514–1542.
Sutherland, R., Eberhart-Phillips, D., Harris, R.A., Stern,
T.A., Beavan, R.J., Ellis, S.M., Henrys, S.A., Cox,
S.C., Norris, R.J., Berryman, K.R., Townend, J., Ban-
nister, S.C., Pettinga, J., Leitner, B., Wallace, L.M.,
Little, T.A., Cooper, A.F., Yetton, M., and Stirling,
M.W., 2007, Do great earthquakes occur on the Alpine
fault in central South Island, New Zealand?, in Okaya,
D.A., Stern, T.A., and Davey, F.J., eds., A Continen-
tal Plate Boundary: Tectonics at South Island, New
Zealand: American Geophysical Union Geophysical
Monograph 175, p. 235–251.
Tuttle, M., 2001, The use of liquefaction features in paleo-
seismology: Lessons learnt in the New Madrid seismic
zone, central United States: Journal of Seismology,
v. 5, p. 361–380, doi: 10 .1023 /A: 1011423525258 .
Tuttle, M.P., and Atkinson, G.M., 2010, Localization of
large earthquakes in the Charlevoix seismic zone, Que-
bec, Canada, during the past 10,000 years: Seismologi-
cal Research Letters, v. 81, no. 1, p. 140–147, doi: 10
.1785 /gssrl .81 .1 .140 .
Tuttle, M., and Barstow, N., 1996, Liquefaction-related
ground failure: A case study in the New Madrid seismic
zone, central United States: Bulletin of the Seismologi-
cal Society of America, v. 86, no. 3, p. 636–645.
Tuttle, M.P., and Hartleb, R., 2012, CEUS Paleo-liquefac-
tion Database, Uncertainties Associated with Paleo-
liquefaction Data, and Guidance for Seismic Source
Characterization: Central and Eastern United States
Seismic Source Characterization for Nuclear Facilities,
Appendix E. NUREG-2115, Volume 5: Appendices C
to F: Palo Alto, California, U.S. Department of Energy
(DOE), U.S. Nuclear Regulatory Commission (NRC),
and Electric Power Research Institute (EPRI), Acces-
sion No. ML12048A859.
Tuttle, M.P., Schweig, E.S., Sims, J.D., Lafferty, R.H.,
Wolf, L.W., and Haynes, M.L., 2002, The earthquake
potential of the New Madrid seismic zone: Bulletin
of the Seismological Society of America, v. 92, no. 6,
p. 2080–2089, doi: 10 .1785 /0120010227 .
Tuttle, M.P., Al-Shukri, H., and Mahdi, H., 2006, Very large
earthquakes centered southwest of the New Madrid
seismic zone 5,000–7,000 years ago: Seismological
Research Letters, v. 77, no. 6, p. 755–770, doi: 10 .1785
/gssrl .77 .6 .755 .
Van Breemen, N., and Buurman, P., 2002, Soil Formation
(2nd ed.): Dordrecht, Netherlands, Kluwer Academic
Publishers, 408 p.
SCIENCE EDITOR: A. HOPE JAHREN
ASSOCIATE EDITOR: STEPHEN T. JOHNSTON
MANUSCRIPT RECEIVED 26 JULY 2014REVISED MANUSCRIPT RECEIVED 12 DECEMBER 2014MANUSCRIPT ACCEPTED 25 FEBRUARY 2015
Printed in the USA


![IN THE HIGH COURT OF NEW ZEALAND CHRISTCHURCH … · SERVICES LTD [2016] NZHC 1048 IN THE HIGH COURT OF NEW ZEALAND CHRISTCHURCH REGISTRY ... concrete veneer cladding, on a perimeter](https://static.fdocuments.net/doc/165x107/5fb29531fe51d041c1703cc9/in-the-high-court-of-new-zealand-christchurch-services-ltd-2016-nzhc-1048-in-the.jpg)


![IN THE HIGH COURT OF NEW ZEALAND CHRISTCHURCH … · IN THE HIGH COURT OF NEW ZEALAND CHRISTCHURCH REGISTRY CIV-2013-409-000896 [2015] NZHC 1627 BETWEEN AVONDALE GOLF CLUB INC Plaintiff](https://static.fdocuments.net/doc/165x107/6028aebf5222f90ce472361c/in-the-high-court-of-new-zealand-christchurch-in-the-high-court-of-new-zealand-christchurch.jpg)
