Paleoecology Vertebrate Paleontology of the Cloverly Formation (Lower Cretaceous… ·...
13
BioOne sees sustainable scholarly publishing as an inherently collaborative enterprise connecting authors, nonprofit publishers, academic institutions, research libraries, and research funders in the common goal of maximizing access to critical research. Vertebrate Paleontology of the Cloverly Formation (Lower Cretaceous), II: Paleoecology Author(s): Matthew T. Carrano , Matthew P. J. Oreska , and Rowan Lockwood Source: Journal of Vertebrate Paleontology, 36(2) Published By: The Society of Vertebrate Paleontology URL: http://www.bioone.org/doi/full/10.1080/02724634.2015.1071265 BioOne (www.bioone.org ) is a nonprofit, online aggregation of core research in the biological, ecological, and environmental sciences. BioOne provides a sustainable online platform for over 170 journals and books published by nonprofit societies, associations, museums, institutions, and presses. Your use of this PDF, the BioOne Web site, and all posted and associated content indicates your acceptance of BioOne’s Terms of Use, available at www.bioone.org/page/terms_of_use . Usage of BioOne content is strictly limited to personal, educational, and non-commercial use. Commercial inquiries or rights and permissions requests should be directed to the individual publisher as copyright holder.
Transcript of Paleoecology Vertebrate Paleontology of the Cloverly Formation (Lower Cretaceous… ·...
BioOne sees sustainable scholarly publishing as an inherently collaborative enterprise connecting authors, nonprofit publishers, academic institutions, researchlibraries, and research funders in the common goal of maximizing access to critical research.
Vertebrate Paleontology of the Cloverly Formation (Lower Cretaceous), II:PaleoecologyAuthor(s): Matthew T. Carrano , Matthew P. J. Oreska , and Rowan LockwoodSource: Journal of Vertebrate Paleontology, 36(2)Published By: The Society of Vertebrate PaleontologyURL: http://www.bioone.org/doi/full/10.1080/02724634.2015.1071265
BioOne (www.bioone.org) is a nonprofit, online aggregation of core research in the biological, ecological, andenvironmental sciences. BioOne provides a sustainable online platform for over 170 journals and books publishedby nonprofit societies, associations, museums, institutions, and presses.
Your use of this PDF, the BioOne Web site, and all posted and associated content indicates your acceptance ofBioOne’s Terms of Use, available at www.bioone.org/page/terms_of_use.
Usage of BioOne content is strictly limited to personal, educational, and non-commercial use. Commercial inquiriesor rights and permissions requests should be directed to the individual publisher as copyright holder.

ARTICLE
VERTEBRATE PALEONTOLOGYOF THE CLOVERLY FORMATION (LOWER CRETACEOUS),II: PALEOECOLOGY
MATTHEW T. CARRANO,*,1 MATTHEW P. J. ORESKA,1,2 and ROWAN LOCKWOOD3
1Department of Paleobiology, Smithsonian Institution, P.O. Box 37012,MRC 121,Washington,DC 20013-7012,U.S.A.,[email protected];
2Department of Environmental Sciences, University of Virginia, Clark Hall, 291 McCormick Road, P.O. Box 400123, Charlottesville,VA 22904-4123, U.S.A., [email protected];
3Department of Geology, The College of William and Mary, P.O. Box 8795, Williamsburg, VA 23185, U.S.A., [email protected]
ABSTRACT—Vertebrate microfossil assemblages in terrestrial formations are a promising source of data on the structure offossil metacommunities. However, the degree to which these deposits capture true, metacommunity-level samples isunknown. Individual deposits may be biased in ways that limit their utility for intra- and inter-formation comparisons. Thisstudy describes the composition of ten vertebrate microfossil assemblages collected from the Lower Cretaceous CloverlyFormation in Montana and Wyoming, U.S.A., and evaluates whether the assemblages are sufficiently similar to suggest thepresence of a single Cloverly metacommunity, or ‘paleocommunity type.’ The assemblages appear to be biased by factorsrelated to the preferential incorporation and preservation of different taxa and skeletal element types, which compound withdecreasing locality sample size. Less productive localities lack whole taxonomic groups, especially small, fully terrestrialvertebrates. Only the two vertebrate microfossil bonebeds approach the known formation richness. High individual toothcounts overrepresent particular species, especially the crocodylians. Despite these biases, the multiple assemblagesnevertheless yield statistically similar taxon abundance rank orders, suggesting the presence of a single, formation-widepaleo-metacommunity, which bears resemblance to a viable metacommunity. The aggregate assemblage exhibits an ‘Eltonianpyramid’ trophic hierarchy for both terrestrial and aquatic taxa. Comparing the multiple assemblages synoptically alsoreveals possible landscape-scale abundance patterns for particular species. Taken together, microvertebrate assemblagesoffer insight into regional paleo-metacommunities and provide samples for inter-formational comparisons at this level.
SUPPLEMENTAL DATA—Supplemental materials are available for this article for free at www.tandfonline.com/UJVP
Citation for this article: Carrano, M. T., M. P. J. Oreska, and R. Lockwood. 2016. Vertebrate paleontology of the CloverlyFormation (Lower Cretaceous), II: Paleoecology. Journal of Vertebrate Paleontology. DOI: 10.1080/02724634.2015.1071265.
INTRODUCTION
The Early Cretaceous witnessed several important ecologi-cal and evolutionary transitions, including radiations andniche diversification among mammals and birds (e.g., Zhouet al., 2003; Luo, 2007), a shift from sauropod- to ceratop-sian- and ornithopod-dominated terrestrial herbivore faunasin North America (D’Emic and Foreman, 2012), and theemergence of many modern vertebrate clades (Evans, 2003;Benson et al., 2013). The resulting global faunal turnover isdiscernable in the fossil record over multiple temporal stages(e.g., Gates et al., 2010; Benson et al., 2013) but is less appar-ent at finer spatiotemporal scales. As a result, it has not beenwell studied at the scales on which most ecological drivers(such as competition and climate change) likely acted. Identi-fying such potential drivers behind major faunal transitionsrequires a better understanding of community structure varia-tion, including relative taxonomic abundances, at regionalscales and below (e.g., Barnosky, 2001; Blois and Hadly,2009).A few studies have attempted metacommunity-level analy-
ses with fossil vertebrates, generally by aggregating occur-rences in collection databases to assemble regional samples
(e.g., Davis, 2005; Mitchell et al., 2012; Darroch et al., 2014).This aggregation can mask important collection effort sam-pling biases, particularly in the vertebrate fossil record, whichis dominated by individual specimen occurrences. Further-more, there might not be enough individual specimen occur-rences to confidently assess assemblage relative abundances(Moore et al., 2007). One solution is to utilize vertebratemicrofossil deposits, which provide more suitable samples bypreserving large, diverse specimen assemblages that formedunder restricted taphonomic, temporal, and geographicregimes.Most hypotheses about how these deposits form assume a
degree of postmortem mixing and time averaging, processes thatmight result in taxonomically more complete samples of thepaleocommunity (e.g., Rogers and Kidwell, 2007; Palmqvistand Arribas, 2009; Terry, 2009; Rogers and Brady, 2010). Somevertebrate fossil concentrations possibly represent lag deposits(Rogers and Kidwell, 2000), but many others are found in chan-nels (Eberth, 1990) and likely formed through re-deposition ofreworked material (Rogers and Brady, 2010; meandering streammigration though existing fossiliferous deposits can exhume andtransport material to new accumulation sites; e.g., Scasso et al.,2012). These processes may concentrate fossils from multiplecommunities in a single deposit, but they also introduce tapho-nomic biases that complicate comparisons, even within similartaphofacies (Moore, 2012). Hydraulic sorting during transport*Corresponding author.
Journal of Vertebrate Paleontology e1071265 (12 pages)� by the Society of Vertebrate PaleontologyDOI: 10.1080/02724634.2015.1071265

results in concentrations biased by specimen size, shape, anddensity (Blob and Fiorillo, 1996) and preferential elementincorporation and loss.Brinkman et al. (2005) noted that vertebrate microfossil
deposits have already been used to make formational (e.g.,Estes, 1964; Sahni, 1972) and intra-formational paleoecologicalcomparisons (e.g., Estes and Berberian, 1970). In both cases,individual assemblages are sometimes assumed to represent aformation-wide ‘paleofauna,’ despite potential biases (e.g., Bloband Fiorillo, 1996). However, Eberth (1990) surveyed 24 JudithRiver Formation microfossil localities and concluded that manyappeared to represent localized samples. Therefore, the degreeto which vertebrate microfossil localities record a formation-wide ancient metacommunity remains uncertain.Most studies have not attempted to determine the size of the
paleocommunity contributing to a locality or whether individuallocalities provide representative samples of a formation-wide‘paleofauna.’ A few studies have attempted to identify a subsetof taxa at sites from a proximal community, following Shotwell’s(1955) relative completeness index (e.g., Estes and Berberian,1970), but this metric can be subjective for poorly known taxarepresented by few elements. Other attempts to identify discretepaleocommunities include subdivisions based on presumed life-habit (Brinkman, 1990). Finally, only a few studies have notedapparent stratigraphic trends within a formation, includingchanges in the relative abundance of vertebrate groups consis-tent with changes in paleoenvironment over time (Brinkman,1990; Garrison et al., 2007).Here we determine the relative abundances of Cloverly spe-
cies, identify regionally abundant taxa, and establish taxon tro-phic linkages in order to illuminate the paleoecology ofindividual Cloverly species. By partitioning recovered specimensaccording to guilds, we compare apparent metacommunity-levelstructure with the hypothesis that assemblages should exhibit an‘Eltonian pyramid’—potential prey species should outnumberconsumers at each successive trophic level (Elton, 1927). Forexample, we might expect an inverted pyramid if the deposi-tional settings coincided with areas where predators congre-gated, a flattened pyramid if the assemblage formed as acoprocoenosis (e.g., Fisher, 1981), or no pattern if body size biaswas significant.This study also evaluates whether observed biases preclude
the use of Cloverly Formation vertebrate microfossil assemb-lages as samples from the ancient metacommunity. We considerwhether site assemblages exhibit compositional variability attrib-utable to real biological differences that would imply faunal andpaleoenvironmental heterogeneity on the landscape during thetime of deposition. Successfully assembling a metacommunity-level sample for the Cloverly Formation would provide a usefulexample for similar efforts in more fossiliferous formations.
(PALEO-) COMMUNITIES ANDMETACOMMUNITIES
The relationships between paleoecological concepts and theirpotential neoecological counterparts have been extensively dis-cussed (e.g., Miller, 1990; Bennington and Bambach, 1996; Tom-asovych and Kidwell, 2010) and are not reviewed in detail here.However, it is important to establish some conceptual limits tothe terminology employed here and to relate them, as far as pos-sible, to the samples at hand.At the smallest scale, a neoecological ‘community’ is lim-
ited to taxa that cooccur in a given place at a given time(often defined as interacting within a habitat patch; Leiboldet al., 2004). The ‘metacommunity’ refers to local communi-ties linked by the “dispersal of multiple potentially interact-ing species” (Leibold et al., 2004:603). Although the conceptis primarily spatial (cf. Hanski and Gilpin, 1991), the focus
on dispersal allows neoecologists to account for composi-tional changes in individual communities over time.Paleoecological parallels exist for both terms, although neither
is exact or enjoys complete consensus. A ‘paleocommunity’refers to a set of fossil taxa in an assemblage, but because oftime-averaging and other impacts of fossilization, it may not rep-resent a single original ‘community’ (Bennington and Bambach,1996). Likewise, the ‘paleocommunity type’ refers to aggrega-tions of similar paleocommunities (and local paleocommunities),which approximates the concept of a metacommunity (Benning-ton and Bambach, 1996) and can therefore also be termed a‘paleo-metacommunity.’In this study, we utilize two scales of assemblages, equivalent
to those described above. A ‘paleocommunity’ is the assemblageof taxa recorded at an individual Cloverly Formation locality.The aggregate of all taxa in the formation is the ‘paleo-meta-community’. We compare taxonomic composition between dif-ferent paleocommunities and between these paleocommunitiesand the paleo-metacommunity. Formations provide convenientgeographic and stratigraphic boundaries for defining paleo-meta-communities. By comparing multiple paleocommunities sampledthroughout the Cloverly Formation, we evaluate whether theyprovide evidence for a single paleo-metacommunity at theregional scale. If so, vertebrate microfossil deposits could serveas replicate samples for inter-formational comparisons to helpquantify differences between metacommunities.
METHODS
Quantifying Taxon Abundances
The data and methods for fossil collection and identificationare as described previously (Oreska et al., 2013). A total of 29vertebrate microfossil localities (‘microsites,’ sensu Brinkmanet al., 2004, 2005) were found, 10 of which were productiveenough to warrant bulk sampling. Bulk samples were wet-sievedusing 0.5-mm mesh, revealing a range of productivity, from siteswith near-background concentrations (<0.25 specimens per kilo-gram) to those with concentrations >1 specimen per kilogram.The richer USNM Locs. 42183 and 42222 yielded fossil concen-trations >5 specimens per kilogram and are here considered‘vertebrate microfossil bonebeds’ (DVMBs, sensu Rogers andBrady, 2010). Specimens were sorted and identified to the lowestpossible taxonomic level and element type was noted. The mostproductive localities were more intensively sampled and, as aresult, most specimens derived from a small number of localities(Oreska et al., 2013:table 1).We aggregated specimen counts by taxon and sorted them into
taxonomically nested sets. Faunal diversity was analyzed at‘class,’ ‘order,’ and ‘species’ levels (the debate about strict equiv-alence across Linnean ranks need not be revisited here; theselevels only need to be equivalent in their hierarchical relation-ships). Individual ‘species’-level taxa represented unique‘operational species units’ (OSU). These included forms thatcould only be diagnosed at higher taxonomic levels but that musthave existed as species—and thus been taxonomically distinctfrom other faunal constituents (e.g., Egertonodus sp., Theropodaindet. A). Each OSU therefore represented a hierarchically con-sistent, lowest possible assignment (see systematic paleontologyin Oreska et al., 2013). Higher taxonomic levels were similarlydesignated ‘operational order units’ (OOUs) and ‘operationalclass units’ (OCUs).The mixed, fragmentary nature of vertebrate microfossil accu-
mulations complicates abundance determinations (see discus-sions in Carrano and Velez-Juarbe [2006] and Oreska et al.[2013]). Our primary concerns are: (1) the comparability of dif-ferent samples, which relies on obtaining a sufficient sample size(e.g., Jamnickzky et al., 2003) and applying appropriate compar-ative techniques (see Oreska et al. [2013] for rarefaction
Carrano et al.—Cloverly Formation vertebrate paleontology II (e1071265-2)

comparisons and details of Cloverly Formation samples) and (2)the relationship between the sample and the original fauna. Thelatter is a complex topic with no clear solution and requires mul-tiple approaches—but rests on decisions of how to countspecimens.It is important to note that none of the localities studied here
show evidence of fluvial deposition or extensive specimen trans-port, and therefore we do not consider hydraulic sorting to havebeen especially important in determining the nature of theseassemblages. Rather, they appear to have been attritional accu-mulations that underwent minimal transport and predominatelyin situ mixing and postmortem winnowing. In addition, we foundno evidence that any of the specimens were originally associatedand so we consider each specimen to have been derived from adifferent once-living organism. Therefore, and unless otherwisenoted, the following analyses used raw specimen counts—thetotal number of specimens (NS) assigned to a taxon (cf. Carranoand Velez-Juarbe, 2006). These NS counts provide a standardabundance baseline in assemblages dominated by isolated speci-men occurrences (Badgley, 1986).However, using NS certainly overcounts particular taxa. Spe-
cifically, continual tooth replacement allows one individual tocontribute many teeth to a deposit, in addition to its final contri-bution at the time of death. Thus, the same individual could con-tribute to the biocoenosis and the taphocoenosis. The resultingbias favors fishes, amphibians, and (most) reptiles over mammalsand turtles. (Further research is needed to accommodate poten-tial taxonomic differences in tooth replacement rates.) To helpmitigate these biases, we standardized isolated tooth countsaccording to the total number of teeth in an individual. For chon-drichthyans, osteichthyans, crocodylians, dinosaurs, and avianswe divided NS of isolated teeth by the expected number of teethfor an individual to give an adjusted tooth count (NS*). Forexample, individual bernissartid crocodylians had »80 teeth(Buffetaut and Ford, 1979) and Deinonychus had »70 teeth(Ostrom, 1969). Other estimates were based on comparisonswith similar and/or related extant taxa, e.g., »100 teeth in mod-ern Amia calva (Grande and Bemis, 1998) for the Cloverly amii-forms. These methods were not applied to mammals (for whichonly deciduous teeth would impact NS) or teeth in jaws (whichcan only have entered the system through death of theindividual).OSUs were rank-ordered using both NS and NS*. For the lat-
ter, NS* tooth counts were added to counts of other elementtypes for each taxon. We conservatively excluded material fromthe species level that might have originated from one of severalOSUs. For example, crocodylian dermal scutes and vertebraecould not be definitively assigned to any one of the four crocody-lian OSUs that were diagnosed by distinctive teeth. Likewise,indeterminate sauropod and large theropod specimens were notincluded in Titanosauria indet. or Tetanurae indet., respectively,if we could not formally refer these elements to those specifictaxa. Numerous osteichthyan scales were also excluded fromOSU comparisons but were included in OCU and OOU analysesalong with OSU counts, which were sorted into taxonomicallynested sets and aggregated at the higher levels.Factors related to preferential element inclusion and taxon
body size may have favored specimen preservation for particulartaxa in the mixed fossil assemblages (e.g., Blob and Fiorillo,1996; Palmqvist and Arribas, 2009; Brown et al., 2013). Forexample, taxa that contributed a greater diversity of elementtypes might be better represented by individual specimens indeposits. We tested the degree to which biases were present bycorrelating the log-transformed NS abundance of vertebrateclasses to the number of element types representing each class. Itwas not possible to rank species-level taxa by element diversity,because the majority of species were represented by only onetype of element. We checked for a body size bias by looking for
a correlation between a species’ abundance (both NS and NS*)and its estimated body mass. Body mass estimates were obtainedfrom the published literature or estimated using autecology (seeSupplementary Data, Table S1). Estimated body mass was notnormally distributed, so correlations were evaluated usingSpearman’s rs and Kendall’s t. Both correlation tests were runon rank-order data obtained from the bulk-sampled localities(N D 10).We determined whether certain taxa were consistently
more abundant in vertebrate microfossil assemblages byapplying the nonparametric Friedman test to NS abundancedata for each taxon in the 10 bulk-sampled localities. Taxonabundance represented the ‘treatment’ and the localitiesserved as ‘blocks.’ Our null hypothesis was that a taxon’sabundance rank at a given locality would be independentfrom its rank at other localities. Under such a scenario, ataxon’s abundance rank would appear to be random in eachassemblage. We conducted Friedman tests on OCU-, OOU-,and OSU-level NS abundance data; it was necessary toassume that absences at localities represented true absences(this is justified for the VMB sample sizes but uncertain forthe other localities; Jamniczky et al., 2003). We used posthoc sign tests between taxon pairs to determine whether par-ticular taxa contributed to significant results. Plotting theaverage locality abundance of each taxon against its fre-quency of occurrence (the number of localities at which itoccurred) allowed us to identify individual taxa that occurredwith relatively high abundance across multiple localities,those that appeared to be locally abundant, and those thatwere consistently rare or absent—different occurrence pat-terns that influenced Friedman test results. Friedman testsand follow-up comparisons were run using the R Stats Pack-age (R Core Team, 2012); correlation tests were run usingthe R ltm Package (Rizopoulos, 2012).
Comparing Assemblages
The total number of fossils varied greatly across localities.Given the practical difficulties in achieving similar sample sizesfor all localities, we calculated the Simpson index of diversity (1¡ D) and Pielou’s J evenness at all three taxonomic levels foreach bulk-sampled locality using the R Vegan Package (Oksanenet al., 2013) to compare assemblage diversity and evenness. Con-trary to expectations, 1 ¡D appeared to increase with increasingsample size. Correlation tests on 1 ¡ D and J and sample NSwere used to look for sample size bias, with a strong correlationsuggesting a sample size effect on index value. One locality,USNM Loc. 43416 was omitted from the correlation analysesbecause it had a richness of 1. A Pearson correlation test was runon log-transformed 1 ¡ D and log-transformed NS. Spearman’srank correlation was used to evaluate a correlation between Jand NS, because J values were not normally distributed andcould not be transformed to meet the normality assumption. Alinear regression model was used to evaluate the relationshipbetween 1 ¡ D and log-transformed sample size (R Stats Pack-age; R Core Team, 2012).Particular groups of organisms were rare or absent at local-
ities that yielded smaller sample sizes. We identified the taxo-nomic groups contributing to unusual occurrence patterns atlocalities by manually ordering the locality OCU specimenmatrix according to predetermined factors: (1) specimenabundance per OCU; (2) locality occurrence frequencies perOCU; (3) total number of specimens per locality (productiv-ity); and (4) total number of OCUs per locality (a measureof richness; Table 1). Rows and columns were ordered indecreasing magnitude, which allowed us to search for‘embedded absences’ (sensu Leibold and Mikkelson, 2002)and expected rank-order reversals—deviations from
Carrano et al.—Cloverly Formation vertebrate paleontology II (e1071265-3)
aggregate sample trends at individual localities that mightrelate to paleoecological or paleoenvironmental signals (seeDiscussion for an explanation of observed patterns and howthese patterns possibly relate to either taphonomic biases orgenuine signals). Focusing on OCUs allowed us to maximizethe number of included specimens.
Analyzing Trophic Structure
In order to investigate apparent Cloverly paleo-metacommun-ity trophic structure, we assigned each OSU a set of ecomorpho-logical characteristics (cf. Matsukawa et al., 2006). Theseincluded basic skeletal structure (vertebrate vs. invertebrate),body mass, life habit (aquatic, amphibious, or terrestrial), andtrophic habit (herbivore, omnivore, or carnivore). Life habit andtrophic habit were identified from the published literature orinferred using autecology (see Supplementary Data, Table S2).Using these assignments, we organized Cloverly species into tro-phic guilds (e.g., large terrestrial herbivores) to infer a Cloverlypaleo-metacommunity food web (Fig. 1). Taxa were also aggre-gated into ordered, canonical trophic levels (sensu Ulanowiczand Kemp, 1979). Carnivore trophic levels were defined usingestimated body size (cf. Lindeman, 1942:fig. 2; see Supplemen-tary Data, Table S2).We hypothesized that taxa at higher trophic levels should
have lower abundances than those at lower levels, and evalu-ated this by testing for a rank-order correlation between tro-phic level (D maximum number of trophic steps between ataxon and primary producers) and the NS (or NS*) assignedto each trophic level (i.e., the aggregate NS for each taxongrouped within each trophic level: see Supplementary Data,Table S3). For the most part, all constituents of individualguilds received the same trophic rank, but certain size dis-crepancies suggested the need for additional ranks withinparticular carnivore guilds (e.g., between larger and smaller
crocodylians within the amphibious large-carnivore guild).Correlations between trophic level and specimen abundancewere evaluated for each habitat type (terrestrial, amphibious,and aquatic) using Pearson tests. It was necessary to log-transform NS* counts for aquatic taxa and square root–trans-form NS* counts for amphibious taxa to meet normalityassumptions.
RESULTS
Abundance and Distribution of Cloverly Taxa
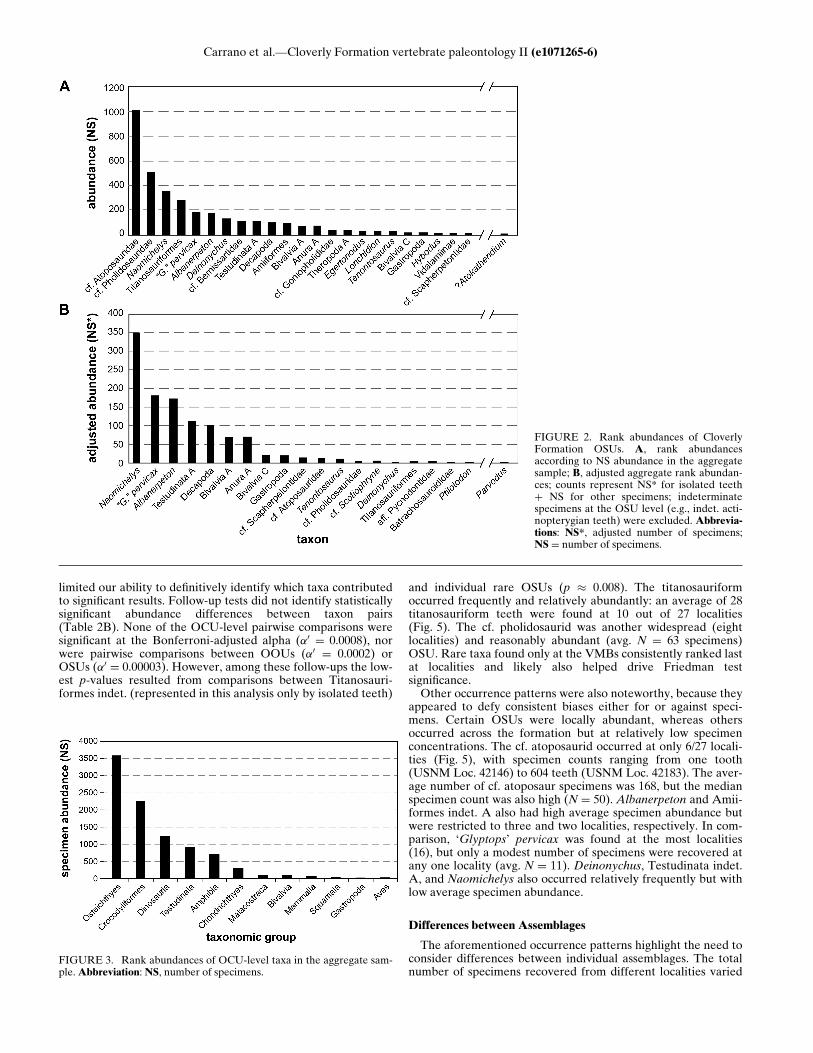
Ranking Cloverly OSUs by their aggregate specimen abun-dance generated a highly concave rank-abundance curve(Fig. 2), in which abundant taxa outnumbered rare taxa by sev-eral orders of magnitude. A similar pattern has been observed atVMBs in other terrestrial formations (e.g., Jamniczky et al.,2003:table 1). The cf. atoposaurid was the most abundant OSU,followed by the cf. pholidosaurid. Both were representedentirely by isolated teeth. Other abundant OSUs includedrepresentatives from multiple taxonomic groups: Naomichelys,Titanosauria indet., ‘Glyptops’ pervicax, Albanerpeton, Deinony-chus, and the cf. bernissartid, in descending order. The mostabundant osteichthyan was an indeterminate amiiform, also rep-resented exclusively by isolated teeth. We recovered 71osteichthyan centra (compared to 303 isolated teeth), but thesewere too weathered to permit OSU assignment. None of the2,111 indeterminate scales could be related to a particular OSU,although the majority exhibited holostean characteristics andmight derive from Lepidotes. Likewise, a large number ofamphibian centra were recovered (262 specimens), but manywere too poorly preserved to permit referral to a particular OSU(although most seem to pertain to either salamanders oralbanerpetontids).Among rare taxa, the indet. alticonodontine was the most
abundant mammal (13 teeth in the aggregate assemblage),
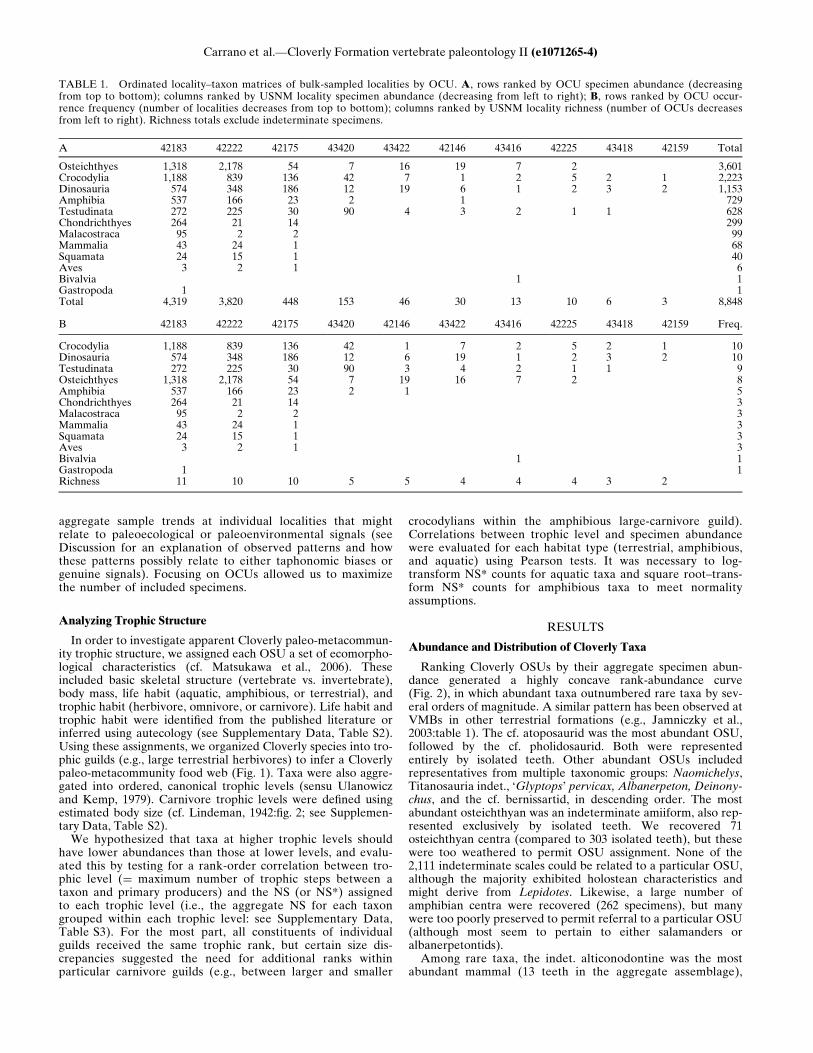
TABLE 1. Ordinated locality–taxon matrices of bulk-sampled localities by OCU. A, rows ranked by OCU specimen abundance (decreasingfrom top to bottom); columns ranked by USNM locality specimen abundance (decreasing from left to right); B, rows ranked by OCU occur-rence frequency (number of localities decreases from top to bottom); columns ranked by USNM locality richness (number of OCUs decreasesfrom left to right). Richness totals exclude indeterminate specimens.
A 42183 42222 42175 43420 43422 42146 43416 42225 43418 42159 Total
Osteichthyes 1,318 2,178 54 7 16 19 7 2 3,601Crocodylia 1,188 839 136 42 7 1 2 5 2 1 2,223Dinosauria 574 348 186 12 19 6 1 2 3 2 1,153Amphibia 537 166 23 2 1 729Testudinata 272 225 30 90 4 3 2 1 1 628Chondrichthyes 264 21 14 299Malacostraca 95 2 2 99Mammalia 43 24 1 68Squamata 24 15 1 40Aves 3 2 1 6Bivalvia 1 1Gastropoda 1 1Total 4,319 3,820 448 153 46 30 13 10 6 3 8,848
B 42183 42222 42175 43420 42146 43422 43416 42225 43418 42159 Freq.
Crocodylia 1,188 839 136 42 1 7 2 5 2 1 10Dinosauria 574 348 186 12 6 19 1 2 3 2 10Testudinata 272 225 30 90 3 4 2 1 1 9Osteichthyes 1,318 2,178 54 7 19 16 7 2 8Amphibia 537 166 23 2 1 5Chondrichthyes 264 21 14 3Malacostraca 95 2 2 3Mammalia 43 24 1 3Squamata 24 15 1 3Aves 3 2 1 3Bivalvia 1 1Gastropoda 1 1Richness 11 10 10 5 5 4 4 4 3 2
Carrano et al.—Cloverly Formation vertebrate paleontology II (e1071265-4)

but ?Paracimexomys was also relatively abundant (seventeeth). The remaining mammalian taxa, Microvenator, all liz-ard taxa, and Parvodus were represented by fewer than fivespecimens apiece. With the exception of Microvenator, theserare OSUs only occurred at the VMBs. Three previouslyreported Cloverly OSUs appeared to be definitively absentfrom our samples: the myliobatoid Pseudohypholophus, Aqui-laceratops, and an ornithomimid. Another two OSUsappeared absent—Tatankacephalus and Ostrom’s (1970)Cryptodira indet.—but might be represented by indetermi-nate material not referable to an OSU.These relative abundance results possibly reflect a real
paleoecological signal, in addition to expected assemblagebiases. Different taxa were disproportionately represented bydifferent element types in the aggregate assemblage. ThoseOCUs represented by a greater number of element typesalso tended to be more abundant (Fig. 3); this partly reflectsour ability to include a greater variety of element types athigher levels of taxonomic assignment (e.g., crocodylian fem-ora, dermal scutes, and vertebrae could be added to theOSU-level teeth). The number of element types per OCUwas significantly positively correlated with the log-trans-formed abundance of each OCU (log NS), according to thePearson test (r D 0.752, N D 9, p D 0.019). The number ofelement types per OCU was normally distributed accordingto the Shapiro-Wilk test (W D 0.921, N D 9, p D 0.399). Log-transformed NS abundances were also normally distributed(W D 0.936, N D 9, p D 0.537).Because of difficulties assigning OSU-indeterminate material,
most taxa were identified based on only one element type (typi-cally teeth), but such specimen counts are likely biased in favor
of particular taxa. The high relative abundances for the cf. atopo-saurid, titanosauriform, and Deinonychus may be attributable tothe fact that individuals exhibited continual tooth replacementand had a large number of teeth at any given time. CalculatingNS* tooth counts and using the adjusted counts to recalculatethe relative abundance of all taxa yielded a different rank order(Fig. 4). Turtles and amphibians replaced crocodylians, the tita-nosauriform, and Deinonychus as the most abundant taxa. Nao-michelys rose from rank 3 to become the most abundant OSU,followed by ‘G.’ pervicax. Albanerpeton rose from rank 6 to rank3. The titanosauriform fell from rank 4 to rank 18. Likewise,Dei-nonychus fell from rank 7 to rank 17.Body size also likely creates biases among taxa, but our
results are ambiguous. Estimated body mass was significantlypositively correlated with NS according to Spearman’s rankcorrelation (rs D 0.326, N D 45, p D 0.029) but not signifi-cantly correlated according to Kendall’s t (t D 0.198, N D45, p D 0.061). The five most abundant OSUs by NS all hadestimated body masses �1 kg, although the two crocodyliansand the titanosauriform were represented exclusively by iso-lated teeth. Estimated body mass was also significantly corre-lated with NS* abundance—using both Spearman (rs D¡0.357, N D 45, p D 0.016) and Kendall (t D ¡0.245, N D45, p D 0.020)—but the correlation coefficients were negativefor NS* comparisons.Despite possible differences in rank abundance attributable to
counting method, the relative abundance of taxa appearedbroadly consistent across localities. According to the Friedmantest, certain taxa were regularly more abundant than others inthe individual bulk-sampled assemblages (Table 2A). However,differences in the specific rank order of taxa among localities
FIGURE 1. Hypothesized trophic web for Cloverly Formation fauna. Arrows indicate direction of energy transfer, and dashed lines represent tenta-tive linkages that were not used in the trophic correlation analysis. Taxon name sizes correspond to the number of specimens for that taxon in theaggregate assemblage; identification qualifiers (e.g., ‘cf.,’ ‘aff.’) have been omitted for space; possibly synonymous indeterminate taxa are referred toknown taxa (e.g., indet. alticonodontines are all listed as Corviconodon montanensis).
Carrano et al.—Cloverly Formation vertebrate paleontology II (e1071265-5)
limited our ability to definitively identify which taxa contributedto significant results. Follow-up tests did not identify statisticallysignificant abundance differences between taxon pairs(Table 2B). None of the OCU-level pairwise comparisons weresignificant at the Bonferroni-adjusted alpha (a0 D 0.0008), norwere pairwise comparisons between OOUs (a0 D 0.0002) orOSUs (a0 D 0.00003). However, among these follow-ups the low-est p-values resulted from comparisons between Titanosauri-formes indet. (represented in this analysis only by isolated teeth)
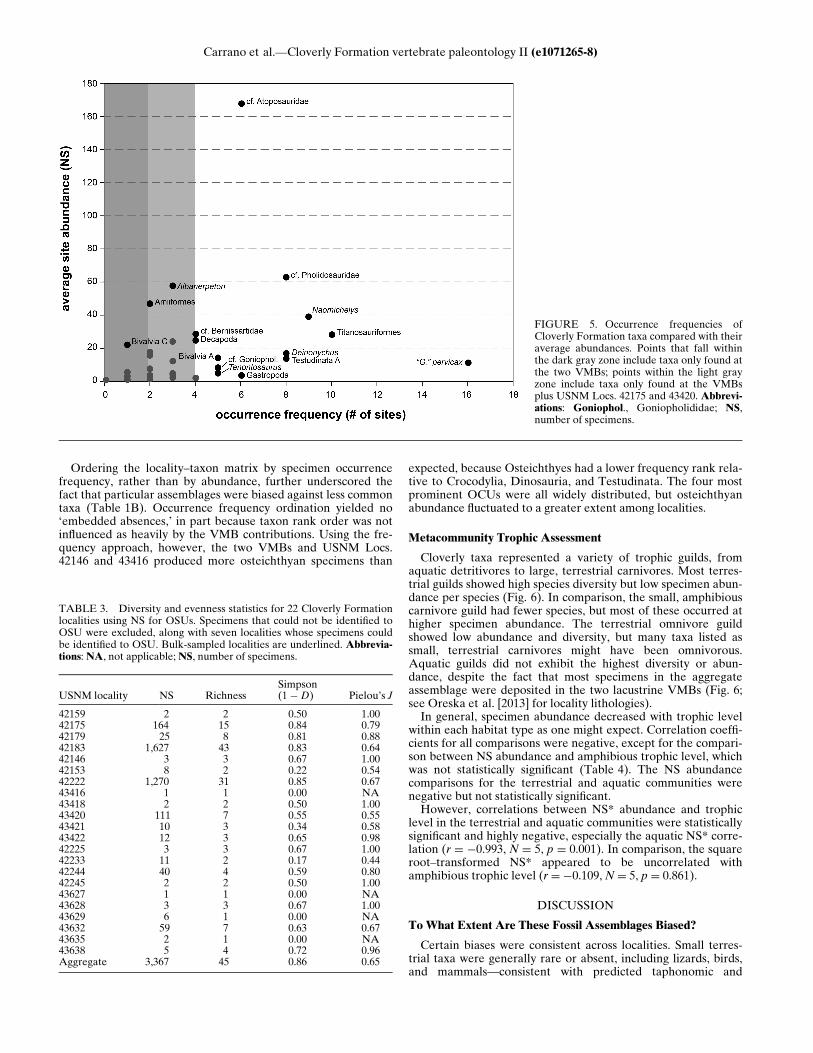
and individual rare OSUs (p � 0.008). The titanosauriformoccurred frequently and relatively abundantly: an average of 28titanosauriform teeth were found at 10 out of 27 localities(Fig. 5). The cf. pholidosaurid was another widespread (eightlocalities) and reasonably abundant (avg. N D 63 specimens)OSU. Rare taxa found only at the VMBs consistently ranked lastat localities and likely also helped drive Friedman testsignificance.Other occurrence patterns were also noteworthy, because they
appeared to defy consistent biases either for or against speci-mens. Certain OSUs were locally abundant, whereas othersoccurred across the formation but at relatively low specimenconcentrations. The cf. atoposaurid occurred at only 6/27 locali-ties (Fig. 5), with specimen counts ranging from one tooth(USNM Loc. 42146) to 604 teeth (USNM Loc. 42183). The aver-age number of cf. atoposaur specimens was 168, but the medianspecimen count was also high (N D 50). Albanerpeton and Amii-formes indet. A also had high average specimen abundance butwere restricted to three and two localities, respectively. In com-parison, ‘Glyptops’ pervicax was found at the most localities(16), but only a modest number of specimens were recovered atany one locality (avg. N D 11). Deinonychus, Testudinata indet.A, and Naomichelys also occurred relatively frequently but withlow average specimen abundance.
Differences between Assemblages
The aforementioned occurrence patterns highlight the need toconsider differences between individual assemblages. The totalnumber of specimens recovered from different localities varied
FIGURE 2. Rank abundances of CloverlyFormation OSUs. A, rank abundancesaccording to NS abundance in the aggregatesample; B, adjusted aggregate rank abundan-ces; counts represent NS* for isolated teethC NS for other specimens; indeterminatespecimens at the OSU level (e.g., indet. acti-nopterygian teeth) were excluded. Abbrevia-tions: NS*, adjusted number of specimens;NS D number of specimens.
FIGURE 3. Rank abundances of OCU-level taxa in the aggregate sam-ple.Abbreviation: NS, number of specimens.
Carrano et al.—Cloverly Formation vertebrate paleontology II (e1071265-6)

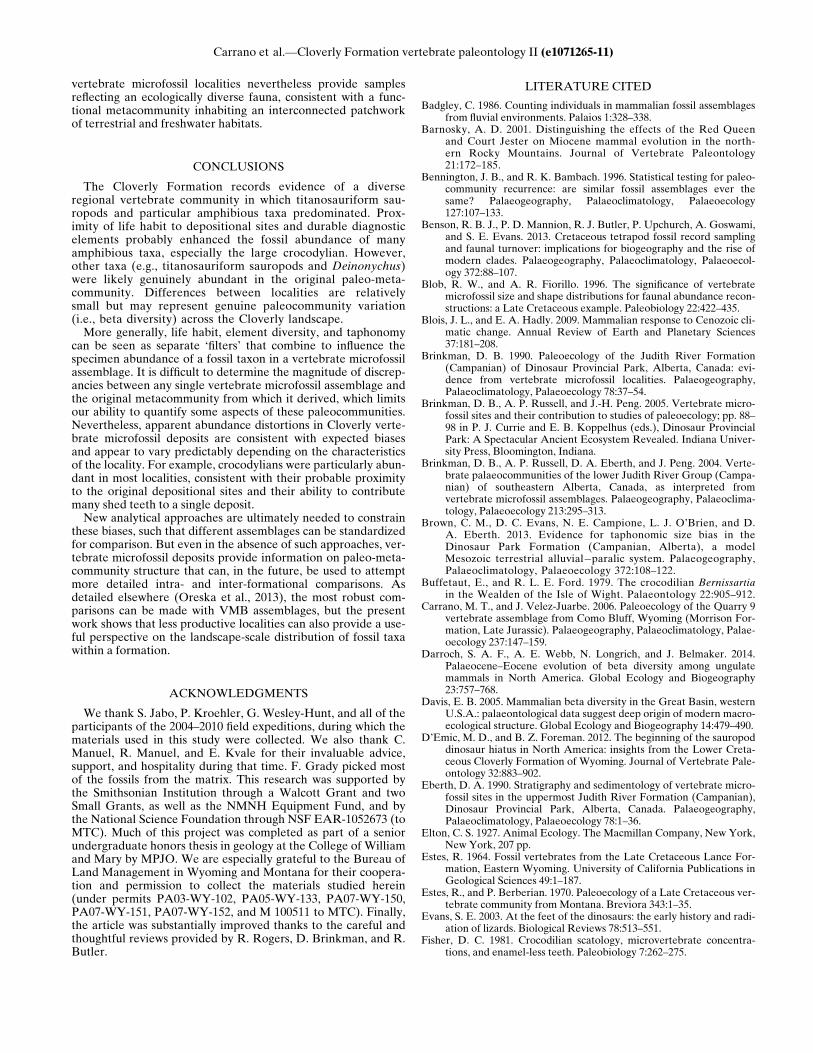
considerably, with the two VMBs alone contributing 89.1% ofthe aggregate sample. Calculating diversity and evenness indexvalues for each locality allowed us to compare assemblages(Table 3) and revealed some noteworthy differences. For exam-ple, bulk sampling USNM Loc. 43420 produced a reasonablylarge fossil sample (152 class-level specimens) but one thatexhibited lower apparent vertebrate diversity (1 ¡ D D 0.55)than some less-productive bulk-sampled localities (e.g., USNMloc. 42146) and surface collections (e.g., USNM loc. 42179). Thetwo VMBs, however, exhibited the highest specimen count, rich-ness, and 1 ¡D diversity index values.
Assemblage 1 ¡ D diversity was positively correlated withlocality NS. The Pearson correlation between log-transformedNS and log-transformed 1 ¡ D index values for bulk-sampledlocalities was highly significant (r D 0.832, N D 9, p D 0.005).Both log-transformed NS (W D 0.926, N D 9, p D 0.446) and log-transformed 1 ¡ D index values (W D 0.883, N D 9, p D 0.168)were normally distributed according to the Shapiro-Wilk test.Bulk-sampled localities that yielded fewer specimens exhibitedsignificantly lower 1 ¡ D (Table 3). Locality 1 ¡ D index valuesincreased linearly with log-transformed locality specimen counts(y D 0.102x C 0.473, R2 D 0.719, F1,7 D 17.88, p D 0.004).These same lower-sample localities also lacked one or more
(typically rare) OCUs, which was confirmed by ordination of thelocality–taxon matrix by OCU abundance and locality specimenproductivity (Table 1A). Chondrichthyes, Squamata, Aves,Mammalia, and decapod crustaceans were restricted to the twoVMBs and USNM Loc. 42175, and amphibians were absent atfive out of six localities with the lowest NS productivity. How-ever, some common taxa were also absent at these localities.Osteichthyes was the most abundant OCU in the aggregate sam-ple, and osteichthyan specimens occurred frequently—at eightout of ten bulk-sampled localities. Given these factors, theabsence of osteichthyan remains at USNM Locs. 43418 and42159 represent ‘embedded absences’ in the ordered matrix. Theabsence of amphibians at USNM Loc. 43422 was another‘embedded absence,’ given the presence of a lissamphibian den-tary at (less productive) USNM Loc. 42146.Assemblage evenness differed among productive bulk-sampled
localities but was not significantly correlated with locality samplesize (rs D ¡0.657, N D 6, p D 0.175). The four least-productivelocalities all yielded J values of 1. Although the abundance rank-order of taxa was broadly consistent across localities, accordingto the Friedman test, actual relative abundance varied amonglocalities and between individual localities and the aggregatesample. Locality–taxon matrix ordination revealed possibly note-worthy abundance deviations for particular taxa at particularlocalities. Locality USNM 42175 had a much lower percentage ofosteichthyan specimens (12.1%) than did USNM Locs. 42183(30.5%) and 42222 (57.0%). This discrepancy was further under-scored by the fact that Loc. 42175 yielded a comparable percent-age of chondrichthyans (3.1%) to Loc. 42183 (6.1%), but thepercentage at Loc. 42222 was considerably lower (0.6%). Otherexamples were also evident. At USNM Loc. 42183, amphibianswere more abundant than turtles, but the latter were more abun-dant in the aggregate assemblage. Dinosaurs had a higher abun-dance rank at USNM Locs. 42175 (41.1%) and 42146 (20.0%)than at the VMBs (13.2% for USNM Loc. 42183 and 9.1% forUSNM Loc. 42222).
FIGURE 4. Comparison between rank abundances of Cloverly Forma-tion species. Left, rank abundances according to NS abundance; right,adjusted aggregate rank abundances. Lines show changes in rank orderfor listed taxa. Names and lines in bold represent taxa for which NS* wasapplied.
TABLE 2. Friedman test results for bulk-sampled localities (N D 10).A, standard results. B, follow-up pair-wise comparisons between selectedOSUs (Bonferroni-adjusted a0 D 0.00003).
Comparisons x2 p
AOCUs across formation x2(11) D 85.9 <0.001OOUs across formation x2(22) D 134.4 <0.001OSUs across formation x2(54) D 186.4 <0.001BTitanosauriformes vs. Paramacellodus x2(1) D 7 0.008Titanosauriformes vs. Atokatheridium x2(1) D 7 0.008Titanosauriformes vs. cf. Bernissartidae x2(1) D 4.5 0.034Titanosauriformes vs cf. Atoposauridae x2(1) D 1 0.317Titanosauriformes vs. cf. Goniopholidae x2(1) D 3.6 0.059Titanosauriformes vs. cf. Pholidosauridae x2(1) D 0 1Titanosauriformes vs.Deinonychus x2(1) D 2.7 0.103Deinonychus vs. Tenontosaurus x2(1) D 4 0.046
Carrano et al.—Cloverly Formation vertebrate paleontology II (e1071265-7)
Ordering the locality–taxon matrix by specimen occurrencefrequency, rather than by abundance, further underscored thefact that particular assemblages were biased against less commontaxa (Table 1B). Occurrence frequency ordination yielded no‘embedded absences,’ in part because taxon rank order was notinfluenced as heavily by the VMB contributions. Using the fre-quency approach, however, the two VMBs and USNM Locs.42146 and 43416 produced more osteichthyan specimens than
expected, because Osteichthyes had a lower frequency rank rela-tive to Crocodylia, Dinosauria, and Testudinata. The four mostprominent OCUs were all widely distributed, but osteichthyanabundance fluctuated to a greater extent among localities.
Metacommunity Trophic Assessment
Cloverly taxa represented a variety of trophic guilds, fromaquatic detritivores to large, terrestrial carnivores. Most terres-trial guilds showed high species diversity but low specimen abun-dance per species (Fig. 6). In comparison, the small, amphibiouscarnivore guild had fewer species, but most of these occurred athigher specimen abundance. The terrestrial omnivore guildshowed low abundance and diversity, but many taxa listed assmall, terrestrial carnivores might have been omnivorous.Aquatic guilds did not exhibit the highest diversity or abun-dance, despite the fact that most specimens in the aggregateassemblage were deposited in the two lacustrine VMBs (Fig. 6;see Oreska et al. [2013] for locality lithologies).In general, specimen abundance decreased with trophic level
within each habitat type as one might expect. Correlation coeffi-cients for all comparisons were negative, except for the compari-son between NS abundance and amphibious trophic level, whichwas not statistically significant (Table 4). The NS abundancecomparisons for the terrestrial and aquatic communities werenegative but not statistically significant.However, correlations between NS* abundance and trophic
level in the terrestrial and aquatic communities were statisticallysignificant and highly negative, especially the aquatic NS* corre-lation (r D ¡0.993, N D 5, p D 0.001). In comparison, the squareroot–transformed NS* appeared to be uncorrelated withamphibious trophic level (r D ¡0.109, N D 5, p D 0.861).
DISCUSSION
ToWhat Extent Are These Fossil Assemblages Biased?
Certain biases were consistent across localities. Small terres-trial taxa were generally rare or absent, including lizards, birds,and mammals—consistent with predicted taphonomic and
FIGURE 5. Occurrence frequencies ofCloverly Formation taxa compared with theiraverage abundances. Points that fall withinthe dark gray zone include taxa only found atthe two VMBs; points within the light grayzone include taxa only found at the VMBsplus USNM Locs. 42175 and 43420. Abbrevi-ations: Goniophol., Goniopholididae; NS,number of specimens.
TABLE 3. Diversity and evenness statistics for 22 Cloverly Formationlocalities using NS for OSUs. Specimens that could not be identified toOSU were excluded, along with seven localities whose specimens couldbe identified to OSU. Bulk-sampled localities are underlined. Abbrevia-tions: NA, not applicable; NS, number of specimens.
USNM locality NS RichnessSimpson(1 ¡D) Pielou’s J
42159 2 2 0.50 1.0042175 164 15 0.84 0.7942179 25 8 0.81 0.8842183 1,627 43 0.83 0.6442146 3 3 0.67 1.0042153 8 2 0.22 0.5442222 1,270 31 0.85 0.6743416 1 1 0.00 NA43418 2 2 0.50 1.0043420 111 7 0.55 0.5543421 10 3 0.34 0.5843422 12 3 0.65 0.9842225 3 3 0.67 1.0042233 11 2 0.17 0.4442244 40 4 0.59 0.8042245 2 2 0.50 1.0043627 1 1 0.00 NA43628 3 3 0.67 1.0043629 6 1 0.00 NA43632 59 7 0.63 0.6743635 2 1 0.00 NA43638 5 4 0.72 0.96Aggregate 3,367 45 0.86 0.65
Carrano et al.—Cloverly Formation vertebrate paleontology II (e1071265-8)

proximity biases against these groups. Conversely, the high rela-tive abundance and occurrence frequencies of crocodylians andturtles were unsurprising, considering their probable aquatic oramphibious life habits and fairly durable elements. The positive,significant correlation between the number of element types perOCU and its NS favored Osteichthyes, Crocodylia, andAmphibia, consistent with Shotwell’s (1955) suggestion that ele-ment diversity in deposits increases with proximity of life habitto the site of deposition.Separate from this possible proximity bias, different elements
were also consistently rare to absent in deposits. Vertebral, pel-vic, and appendicular elements were all rare, suggesting prefer-ential loss. Fish centra were surprisingly rare, given the largenumber of isolated scales in some localities. Amphibian verte-brae were occasionally present but typically lacked diagnosticcharacters, which prevented more specific assignment. In com-parison, isolated teeth tended to be common, relatively well pre-served, and diagnostic. Consequently, tooth counts factoredheavily in species-level relative abundance determinations—aclear bias against edentulous taxa, such as Microvenator, and apossible bias against taxa with relatively few teeth, such as
dipnoans and avians. The OSU-level analyses consequentlyincluded this taxonomic bias, in addition to apparent taphonomicbiases.The role of a possible body size bias was less clear. The differ-
ence in the direction of the correlation between body mass andabundance depending on counting method (NS versus NS*) fur-ther illustrates the fact that element type and specimen entrymode might significantly bias abundance counts. A separatebody size bias that favored large taxa seems unlikely, however,given the nature of the deposits. All recovered specimens wererelatively small, and NS counts for certain large organisms werelikely overestimates. Furthermore, had we been able to specifi-cally refer isolated fish scales and indeterminate amphibian post-cranial material, both of the NS and NS* body mass correlationsmight have been significant and negative.Other biases were apparently locality specific. Particular
assemblages exhibited notable differences in taxonomic richness,composition, and abundance relative to the aggregate assem-blage. These might have derived from differences in either taph-onomic regime or paleocommunity at localities (or both).Examples included the ‘embedded’ absence of fishes at USNM
FIGURE 6. Taxonomic distributions within Cloverly trophic guilds.A, percentage abundances; B, percentage diversities.
TABLE 4. Pearson correlation test results for trophic-level abundance comparisons. Abbreviations: NS, number of specimens; NS*, adjusted num-ber of specimens; sqrtNS*, square root of NS*.
Shapiro-Wilk normality Correlation test
Habitat Count W p r p
Terrestrial NS 0.809 0.095 ¡0.568 0.318NS* 0.84 0.165 ¡0.896 0.040
Amphibious NS 0.983 0.948 0.727 0.164sqrtNS* 0.867 0.254 ¡0.109 0.861
Aquatic NS 0.891 0.362 ¡0.331 0.587LogNS* 0.988 0.971 ¡0.993 0.001
Carrano et al.—Cloverly Formation vertebrate paleontology II (e1071265-9)

Locs. 43418 and 42159 and the relatively low percentage of fishesat USNM Loc. 42175. Taphonomy at the first two localities likelyprecluded the preservation of fish fossils; they produced only afew specimens, all relatively robust crocodylian, dinosaur, or tur-tle remains. In comparison, the relative absence of fishes atUSNM Loc. 42175 might be due in part to a difference in paleo-environment between this and other localities. Given the highosteichthyan abundance in the aggregate sample, one mighthave predicted this locality to have more osteichthyan specimensthan dinosaur and crocodylian specimens. In addition to this dis-crepancy, it yielded proportionally more dinosaur remains thanwould be expected based on the aggregate sample, suggesting aterrestrial signal. These four localities all occur at slightly differ-ent stratigraphic levels, but the absence of a diverse, otherwiseabundant group such as Osteichthyes is unlikely to represent apaleo-metacommunity change over time.
HowWere Cloverly Vertebrate Microfossil Localities Derivedfrom the Paleo-metacommunity?
None of the localities yielded the paleo-metacommunitygamma diversity (i.e., total formation richness), and only the twoVMBs and USNM Loc. 42175 produced a full complement ofknown vertebrate OCUs. The 1 ¡ D diversity of assemblagesincreased linearly with exponentially increasing sample size, sup-porting the concern that large sample size discrepancies affectapparent diversity among vertebrate microfossil localities.Larger samples should exhibit lower 1 ¡ D diversity, all otherfactors being equal. Instead, increasing the sample size greatlyincreased OSU richness. Smaller assemblages also lacked partic-ular vertebrate groups entirely, including lizards, birds, andmammals. In comparison, the richness at USNM Locs. 42183and 42222 approached the gamma richness, suggesting that theVMBs approach true metacommunity-level samples. This is con-sistent with the suggestion that lacustrine VMBs capture a time-averaged picture of their surrounding paleocommunities (Rogersand Brady, 2010). The size of this composite paleocommunity(i.e., local or regional) likely depends on the size of the catch-ment supplying the deposit over time.The evenness results suggest that the vertebrate microfossil
localities do not accurately record a single, uniform paleo-meta-community. If all of the localities had accurately recorded thesame paleo-metacommunity, then the assemblages shouldexhibit the same evenness. However, the discrepancies do notlend themselves to easy interpretation. If there had been a strongpositive correlation between evenness and sample size, thenlarger samples might average out to a single paleo-metacommun-ity abundance distribution. Assuming that the true paleo-meta-community evenness was fairly moderate, and that all of thelocalities recorded the same paleo-metacommunity, a strongnegative correlation might have indicated that disproportion-ately many specimens of common taxa and more specimens forrare taxa would be accumulated by increasing the size of the fos-sil deposits. This might be evident at the two VMBs, whichappeared less even than certain low-sample localities. The lackof a significant correlation with sample size suggests that thesesignals are either mutually confounding or broadly inconsistentacross localities. The localities might have accurately recordeddifferent paleocommunities with different relative abundancedistributions or recorded the same paleo-metacommunity butwith different biases for different taxa or a combination of localpaleocommunity and paleo-metacommunity signals.There are, however, reliable paleo-metacommunity signals in
the data set, as evidenced by abundance patterns among locali-ties. The Friedman test results suggest that bulk samples fromproductive microvertebrate localities do approximate replicatesamples of a single, formation-level metacommunity, albeit withvariation among samples. Some absences were apparently due to
taphonomy (i.e., were not true absences), but the occurrence ofrare taxa at unproductive localities would likely not have alteredthe relative rank order of taxa across localities to a significantdegree. However, the observed rank abundance consistencymight derive from either the paleo-metacommunity or from rela-tive taphonomic effects acting semi-uniformly across all locali-ties. Unusual occurrence patterns for particular OSUs suggestthat some relative abundance patterns might be genuine paleo-ecological signals: for example, the low abundance/high fre-quency distribution of ‘G.’ pervicax across localities. And despitepossible element preservation bias, the most abundant OSUs arenot necessarily those represented by the greatest element diver-sity. If high element diversity indicates a life habit proximal tothe site of deposition, this proximity does not automatically con-fer an overwhelming abundance advantage. Unlike fishes andamphibians, titanosauriforms are only represented in the lacus-trine VMBs by teeth, but these teeth outnumber many individualfish and amphibian OSU samples, suggesting that titanosauri-forms were fairly abundant on the Cloverly landscape and/or vis-ited the depositional sites frequently. This was perhaps also truefor Deinonychus, which is abundantly represented by both teethand other elements.
Does Apparent Community Structure Reflect the OriginalPaleo-metacommunity?
It is difficult to evaluate the hypothesized trophic web pre-sented in Fig. 1, in the absence of more information aboutthe paleoecology of individual taxa and a better sense of howtaphonomy and other factors might have biased assemblagespecimen counts. The paleo-metacommunity picture sug-gested by the aggregate vertebrate microfossil assemblagenevertheless appears reasonably consistent with expectationsfor an actual metacommunity. The correlation analyses pro-vide very coarse support for the ‘Eltonian pyramid’: taxafrom lower trophic levels generally outnumbered those fromhigher trophic levels in both aquatic and terrestrial paleo-communities. The absence of a correlation for amphibioustaxa is due in part to the very high number of crocodylianteeth present in deposits, likely attributable to the aforemen-tioned preservation biases. This bias is partially mitigated bythe use of NS* counts. It is worth noting, however, that Elton(1927) and later studies (Lindeman, 1942) based the ‘pyramidof numbers’ concept on the assumption that predators arealways larger than their prey at each canonical trophic level.The ‘Eltonian pyramid’ observed for the terrestrial paleo-metacommunity is supported in large part by a high abun-dance of sauropods in the first trophic level.We also note that the canonical trophic levels used to assess
metacommunity structure might not accurately reflect actualpaleo-metacommunity trophic chain lengths. The higher d15Nenrichment of dromaeosaurid fossils relative to large tyranno-saurid fossils in the Judith River Formation suggests a longer tro-phic chain for the former (Ostrom et al., 1993). The d15Nenrichment for the tyrannosaurid appeared to be about one tro-phic step above that of the large herbivores in the formation. Inour analysis, we placed Deinonychus in the fourth trophic leveland the large tetanuran (Acrocanthosaurus) in the fifth, due toits larger size, to conform with canonical expectations aboutpotential energy flow (Lindeman, 1942). However, if Acrocan-thosaurus only consumed larger herbivores, it would have beenpart of a much shorter, two-step trophic chain.Our picture of the paleo-metacommunity is surely incomplete.
Some ecological guilds were absent from the vertebrate micro-fossil deposits. No obligate amphibious herbivores, grazers,or detritivores were recovered. Insects and other smallinvertebrates might have occupied this niche, or certain Cloverlyamphibians might have been omnivorous. The productive
Carrano et al.—Cloverly Formation vertebrate paleontology II (e1071265-10)
vertebrate microfossil localities nevertheless provide samplesreflecting an ecologically diverse fauna, consistent with a func-tional metacommunity inhabiting an interconnected patchworkof terrestrial and freshwater habitats.
CONCLUSIONS
The Cloverly Formation records evidence of a diverseregional vertebrate community in which titanosauriform sau-ropods and particular amphibious taxa predominated. Prox-imity of life habit to depositional sites and durable diagnosticelements probably enhanced the fossil abundance of manyamphibious taxa, especially the large crocodylian. However,other taxa (e.g., titanosauriform sauropods and Deinonychus)were likely genuinely abundant in the original paleo-meta-community. Differences between localities are relativelysmall but may represent genuine paleocommunity variation(i.e., beta diversity) across the Cloverly landscape.More generally, life habit, element diversity, and taphonomy
can be seen as separate ‘filters’ that combine to influence thespecimen abundance of a fossil taxon in a vertebrate microfossilassemblage. It is difficult to determine the magnitude of discrep-ancies between any single vertebrate microfossil assemblage andthe original metacommunity from which it derived, which limitsour ability to quantify some aspects of these paleocommunities.Nevertheless, apparent abundance distortions in Cloverly verte-brate microfossil deposits are consistent with expected biasesand appear to vary predictably depending on the characteristicsof the locality. For example, crocodylians were particularly abun-dant in most localities, consistent with their probable proximityto the original depositional sites and their ability to contributemany shed teeth to a single deposit.New analytical approaches are ultimately needed to constrain
these biases, such that different assemblages can be standardizedfor comparison. But even in the absence of such approaches, ver-tebrate microfossil deposits provide information on paleo-meta-community structure that can, in the future, be used to attemptmore detailed intra- and inter-formational comparisons. Asdetailed elsewhere (Oreska et al., 2013), the most robust com-parisons can be made with VMB assemblages, but the presentwork shows that less productive localities can also provide a use-ful perspective on the landscape-scale distribution of fossil taxawithin a formation.
ACKNOWLEDGMENTS
We thank S. Jabo, P. Kroehler, G. Wesley-Hunt, and all of theparticipants of the 2004–2010 field expeditions, during which thematerials used in this study were collected. We also thank C.Manuel, R. Manuel, and E. Kvale for their invaluable advice,support, and hospitality during that time. F. Grady picked mostof the fossils from the matrix. This research was supported bythe Smithsonian Institution through a Walcott Grant and twoSmall Grants, as well as the NMNH Equipment Fund, and bythe National Science Foundation through NSF EAR-1052673 (toMTC). Much of this project was completed as part of a seniorundergraduate honors thesis in geology at the College of Williamand Mary by MPJO. We are especially grateful to the Bureau ofLand Management in Wyoming and Montana for their coopera-tion and permission to collect the materials studied herein(under permits PA03-WY-102, PA05-WY-133, PA07-WY-150,PA07-WY-151, PA07-WY-152, and M 100511 to MTC). Finally,the article was substantially improved thanks to the careful andthoughtful reviews provided by R. Rogers, D. Brinkman, and R.Butler.
LITERATURE CITED
Badgley, C. 1986. Counting individuals in mammalian fossil assemblagesfrom fluvial environments. Palaios 1:328–338.
Barnosky, A. D. 2001. Distinguishing the effects of the Red Queenand Court Jester on Miocene mammal evolution in the north-ern Rocky Mountains. Journal of Vertebrate Paleontology21:172–185.
Bennington, J. B., and R. K. Bambach. 1996. Statistical testing for paleo-community recurrence: are similar fossil assemblages ever thesame? Palaeogeography, Palaeoclimatology, Palaeoecology127:107–133.
Benson, R. B. J., P. D. Mannion, R. J. Butler, P. Upchurch, A. Goswami,and S. E. Evans. 2013. Cretaceous tetrapod fossil record samplingand faunal turnover: implications for biogeography and the rise ofmodern clades. Palaeogeography, Palaeoclimatology, Palaeoecol-ogy 372:88–107.
Blob, R. W., and A. R. Fiorillo. 1996. The significance of vertebratemicrofossil size and shape distributions for faunal abundance recon-structions: a Late Cretaceous example. Paleobiology 22:422–435.
Blois, J. L., and E. A. Hadly. 2009. Mammalian response to Cenozoic cli-matic change. Annual Review of Earth and Planetary Sciences37:181–208.
Brinkman, D. B. 1990. Paleoecology of the Judith River Formation(Campanian) of Dinosaur Provincial Park, Alberta, Canada: evi-dence from vertebrate microfossil localities. Palaeogeography,Palaeoclimatology, Palaeoecology 78:37–54.
Brinkman, D. B., A. P. Russell, and J.-H. Peng. 2005. Vertebrate micro-fossil sites and their contribution to studies of paleoecology; pp. 88–98 in P. J. Currie and E. B. Koppelhus (eds.), Dinosaur ProvincialPark: A Spectacular Ancient Ecosystem Revealed. Indiana Univer-sity Press, Bloomington, Indiana.
Brinkman, D. B., A. P. Russell, D. A. Eberth, and J. Peng. 2004. Verte-brate palaeocommunities of the lower Judith River Group (Campa-nian) of southeastern Alberta, Canada, as interpreted fromvertebrate microfossil assemblages. Palaeogeography, Palaeoclima-tology, Palaeoecology 213:295–313.
Brown, C. M., D. C. Evans, N. E. Campione, L. J. O’Brien, and D.A. Eberth. 2013. Evidence for taphonomic size bias in theDinosaur Park Formation (Campanian, Alberta), a modelMesozoic terrestrial alluvial�paralic system. Palaeogeography,Palaeoclimatology, Palaeoecology 372:108–122.
Buffetaut, E., and R. L. E. Ford. 1979. The crocodilian Bernissartiain the Wealden of the Isle of Wight. Palaeontology 22:905–912.
Carrano, M. T., and J. Velez-Juarbe. 2006. Paleoecology of the Quarry 9vertebrate assemblage from Como Bluff, Wyoming (Morrison For-mation, Late Jurassic). Palaeogeography, Palaeoclimatology, Palae-oecology 237:147–159.
Darroch, S. A. F., A. E. Webb, N. Longrich, and J. Belmaker. 2014.Palaeocene–Eocene evolution of beta diversity among ungulatemammals in North America. Global Ecology and Biogeography23:757–768.
Davis, E. B. 2005. Mammalian beta diversity in the Great Basin, westernU.S.A.: palaeontological data suggest deep origin of modern macro-ecological structure. Global Ecology and Biogeography 14:479–490.
D’Emic, M. D., and B. Z. Foreman. 2012. The beginning of the sauropoddinosaur hiatus in North America: insights from the Lower Creta-ceous Cloverly Formation of Wyoming. Journal of Vertebrate Pale-ontology 32:883–902.
Eberth, D. A. 1990. Stratigraphy and sedimentology of vertebrate micro-fossil sites in the uppermost Judith River Formation (Campanian),Dinosaur Provincial Park, Alberta, Canada. Palaeogeography,Palaeoclimatology, Palaeoecology 78:1–36.
Elton, C. S. 1927. Animal Ecology. The Macmillan Company, New York,New York, 207 pp.
Estes, R. 1964. Fossil vertebrates from the Late Cretaceous Lance For-mation, Eastern Wyoming. University of California Publications inGeological Sciences 49:1–187.
Estes, R., and P. Berberian. 1970. Paleoecology of a Late Cretaceous ver-tebrate community fromMontana. Breviora 343:1–35.
Evans, S. E. 2003. At the feet of the dinosaurs: the early history and radi-ation of lizards. Biological Reviews 78:513–551.
Fisher, D. C. 1981. Crocodilian scatology, microvertebrate concentra-tions, and enamel-less teeth. Paleobiology 7:262–275.
Carrano et al.—Cloverly Formation vertebrate paleontology II (e1071265-11)

Garrison, J. R., Jr., D. B. Brinkman, D. J. Nichols, P. Layer, D. Burge,and D. Thayn. 2007. A multidisciplinary study of the Lower Creta-ceous Cedar Mountain Formation, Mussentuchit Wash, Utah: adetermination of the paleoenvironment and paleoecology for theEolambia caroljonesa dinosaur quarry. Cretaceous Research28:461–494.
Gates, T. A., S. D. Sampson, L. E. Zanno, E. M. Roberts, J. G. Eaton, R.L. Nydam, J. H. Hutchinson, J. A. Smith, M. A. Loewen, and M. A.Getty. 2010. Biogeography of terrestrial and freshwater vertebratesfrom the late Cretaceous (Campanian) Western Interior of NorthAmerica. Palaeogeography, Palaeoclimatology, Palaeoecology291:371–387.
Grande, L., and W. E. Bemis. 1998. A comprehensive phylogenetic studyof amiid fishes (Amiidae) based on comparative skeletal anatomy.An empirical search for interconnected patterns of natural history.Society of Vertebrate Paleontology Memoir 4. Journal of Verte-brate Paleontology 18(supplement):1–690.
Hanski, I., and M. Gilpin. 1991. Metapopulation dynamics: brief historyand conceptual domain. Biological Journal of the Linnean Society42:3–16.
Jamniczky, H. A., D. B. Brinkman, and A. P. Russell. 2003. Vertebratemicrosite sampling: how much is enough? Journal of VertebratePaleontology 23:725–734.
Leibold, M. A., and G. M. Mikkelson. 2002. Coherence, species turnover,and boundary clumping: elements of meta-community structure.Oikos 97:237–250.
Leibold, M. A., M. Holyoak, N. Mouquet, P. Amarasekare, J. M. Chase,M. F. Hoopes, R. D. Holt, J. B. Shurin, R. Law, D. Tilman, M. Lor-eau, and A. Gonzalez. 2004. The metacommunity concept: a frame-work for multi-scale community ecology. Ecology Letters 7:601–613.
Lindeman, R. L. 1942. The trophic–dynamic aspect of ecology. Ecology23:399–417.
Luo, Z.-X. 2007. Transformation and diversification in early mammalevolution. Nature 450:1011–1019.
Matsukawa, M., K. Saiki, M. Ito, I. Obata, D. J. Nichols, M. G. Lockley,R. Kukihara, and K. Shibata. 2006. Early Cretaceous terrestrial eco-systems in East Asia based on food-web and energy-flow models.Cretaceous Research 27:285–307.
Miller, W. (ed.). 1990. Paleocommunity Temporal Dynamics: The Long-term Development of Multispecies Assemblies. The PaleontologicalSociety Special Publication 5. Department of Geological Sciences,University of Tennessee, Knoxville, Tennessee, 421 pp.
Mitchell, J. S., P. D. Roopnarine, and K. D. Angielczyk. 2012. Late Cre-taceous restructuring of terrestrial communities facilitated the end-Cretaceous mass extinction in North America. Proceedings of theNational Academy of Sciences, U.S.A. 109:18857–18861.
Moore, J. R. 2012. Do terrestrial vertebrate fossil assemblages show con-sistent taphonomic patterns? Palaios 27:220–234.
Moore, J. R., D. B. Norman, and P. Upchurch. 2007. Assessing relativeabundances in fossil assemblages. Palaeogeography, Palaeoclima-tology, Palaeoecology 253:317–322.
Oksanen, J., F. Guillaume Blanchet, R. Kindt, P. Legendre, P. R. Min-chin, R. B. O’Hara, G. L. Simpson, P. Solymos, M. Henry, H. Ste-vens, and H. Wagner. 2013. Vegan Community Ecology Packageversion 2.0–7. Available at http://cran.r-project.org, http://vegan.r-forge.r-project.org/. Accessed July 3, 2013.
Oreska, M. P. J., M. T. Carrano, and K. M. Dzikiewicz. 2013. Vertebratepaleontology of the Cloverly Formation (Lower Cretaceous), I: fau-nal composition, biogeographic relationships, and sampling. Journalof Vertebrate Paleontology 33:264–292.
Ostrom, J. H. 1969. Osteology of Deinonychus antirrhopus, an unusualtheropod from the Lower Cretaceous of Montana. PeabodyMuseum Bulletin 30:1–165.
Ostrom, J. H. 1970. Stratigraphy and paleontology of the Cloverly For-mation (Lower Cretaceous) of the Bighorn Basin area, Wyomingand Montana. Peabody Museum of Natural History Bulletin35:1–234.
Ostrom, P. H., S. A. Macko, M. H. Engel, and D. A. Russell. 1993.Assessment of trophic structure of Cretaceous communities basedon stable nitrogen isotope analyses. Geology 21:491–494.
Palmqvist, P., and A. Arribas. 2009. Taphonomic decoding of the paleo-biological information locked in a lower Pleistocene assemblage oflarge mammals. Paleobiology 27:512–530.
R Core Team. 2012. The R Stats Package. Version 2.15.1. Available athttp://cran.r-project.org. Accessed July 3, 2013.
Rizopoulos, D. 2012. Latent Trait Models under IRT. Version 0.9–9.Available at http://cran.r-project.org. Accessed July 3, 2013.
Rogers, R. R., and M. E. Brady. 2010. Origins of microfossil bonebeds:insights from the Upper Cretaceous Judith River Formation ofnorth-central Montana. Paleobiology 36:80–112.
Rogers, R. R., and S. M. Kidwell. 2000. Associations of vertebrate skele-tal concentrations and discontinuity surfaces in terrestrial and shal-low marine records: a test in the Cretaceous of Montana. Journal ofGeology 108:131–154.
Rogers, R. R., and S. M. Kidwell. 2007. A conceptual framework for thegenesis and analysis of vertebrate skeletal concentrations; pp. 1–43in R. R. Rogers, D. A. Eberth, A. R. Fiorillo (eds.), Bonebeds: Gen-esis, Analysis, and Paleobiological Significance. University of Chi-cago Press, Chicago, Illinois.
Sahni,A. 1972.The vertebrate fauna of the JudithRiverFormation,Montana.Bulletin of theAmericanMuseumofNaturalHistory 147:323–412.
Scasso, R. A., J. I. Cuiti~no, P. Bouza, and M. T. Dozo. 2012. Meanderingtidal–fluvial channels and lag concentration of terrestrial verte-brates in the fluvial–tidal transition of an ancient estuary in Patago-nia. Latin American Journal of Sedimentology and Basin Analysis19:27–45.
Shotwell, J. A. 1955. An approach to the paleoecology of mammals. Ecol-ogy 36:327–337.
Terry, R. C. 2009. The dead do not lie: using skeletal remains for rapidassessment of historical small-mammal community baselines. Pro-ceedings of the Royal Society B 277:1193–1201.
Tomasovych, A., and S. M. Kidwell. 2010. The effects of temporal resolu-tion on species turnover and on testing metacommunity models.The American Naturalist 175:587–606.
Ulanowicz, R. E., and W. M. Kemp. 1979. Toward canonical trophicaggregations. The American Naturalist 114:871–883.
Zhou, Z., P. M. Barrett, and J. Hilton. 2003. An exceptionally preservedLower Cretaceous ecosystem. Nature 421:807–814.
Submitted January 13, 2015; revisions received June 1, 2015;accepted June 28, 2015.Handling editor: Richard Butler.
Carrano et al.—Cloverly Formation vertebrate paleontology II (e1071265-12)