Palatine, Illinois Fact Book - Harper College · Harper College Fact Book Chapter I: General...
82
Fact Book 2017-2018 Palatine, Illinois
Transcript of Palatine, Illinois Fact Book - Harper College · Harper College Fact Book Chapter I: General...

Fact Book2017-2018
Palatine, Illinois

MISSION
Harper College enriches its diverse communities by providing quality, affordable, and accessible education. Harper College, in collaboration with its partners, inspires the transformation of individual lives, the workforce, and society.
PHILOSOPHY STATEMENT
We, at Harper College, believe that our charge is to facilitate active learning and foster the knowledge, critical thinking and life/work skills required for participation in our global society. We work with our community partners to enrich the intellectual, cultural and economic fabric of our district. We believe that excellence in education must occur in an ethical climate of integrity and respect. We hold that the strength of our society is rooted in our diversity and that it is through synergy that we achieve excellence.
CORE VALUES
INTEGRITYResult: An environment where relationships and practices are based on trust. Key Action: Be responsible and accountable for your own actions.
RESPECTResult: Interactions which add dignity to ourselves, our relationships with others and our organization. Key Action: Value and celebrate the uniqueness of individuals.
EXCELLENCEResult: Student, employee and organizational success through a creative and responsive work environment by exceeding the needs and expectations of all. Key Action: Effectively anticipate, identify and respond to learner, employee and organizational needs.
COLLABORATIONResult: Accomplishment of better results by working together than otherwise likely to occur by working alone. Key Action: Address issues as they arise and take necessary actions to productively resolve them.

2017-2018 Fact Book
Produced by Institutional Research
Katherine Coy Ph.D., Director
Fall 2017 Harper College 1200 West Algonquin Road Palatine, Illinois 60067-7398

i
Board of Trustees
Gregory Dowell Pat Stack Dr. Nancy Robb Diane Hill Chair Vice-Chair Secretary Barrington Deer Park Barrington Inverness
Herb Johnson William F. Kelley Walt Mundt Niki Safakas Inverness Schaumburg Palatine Student Trustee
The Board of Trustees is composed of seven elected individuals who represent the voters of the district and one student representative, who has an advisory vote, elected by the student body for a one-year term. For further information, see link. http://goforward.harpercollege.edu/about/leadership/board/index.php
Kenneth L. Ender, Ph.D. President
Harper College

ii
PREFACE The Fact Book is designed to provide easy access to commonly asked questions about Harper College. It contains eight chapters: General Information, Organization and Administration, Credit Students, Workforce Solutions, Finances, Facilities, Human Resources, and Support Services. Individuals from every area of the College provided information contained in sections of the Fact Book and The Office of Institutiona l Research would like to acknowledge and thank all the individuals and units of the College for their cooperation and assistance. Questions and comments regarding the Fact Book are encouraged, as we want to continually improve the Fact Book. Please e-mail your comments and suggestions to [email protected] or call us at 847.925.6950.

iii
Table of Contents Board of Trustees ...................................................................................................... i
PREFACE ............................................................................................................... ii
Table of Contents .....................................................................................................iii
Chapter I General Information ................................................................................. 1
Harper College Institutional Profile ..................................................................... 1
Community College District 512 Map ................................................................. 4
Exhibit 1.1. Gender by Age for Harper's District ................................................... 5
Exhibit 1.2. Percent District Residents by Age Group Served By Harper................... 6
Exhibit 1.3. Race/Ethnicity of Harper District by High School District ................... 6
Exhibit 1.4. Educational Attainment (25 years and over) ........................................ 7
Exhibit 1.5. Status of Housing Units in Harper District by High School District ......... 7
Exhibit 1.6. Household Information of Harper District Residents ............................. 8
Exhibit 1.7. Population Estimates of Harper District Municipalities ......................... 9
Exhibit 1.8. Unemployment Rate ...................................................................... 10
Exhibit 1.9. Income and Benefits by High School Districts in Harper District .......... 11
Exhibit 1.10. Poverty Levels in Harper District by High School District ................. 12
Accreditations, Affiliations, Certifications.................................................................... 13
Harper College Educational Foundation ....................................................................... 13
Illinois Community College System Overview.............................................................. 14
Federal Legislators in Harper College District............................................................... 14
State Legislators in Harper College District .................................................................. 15
Chapter II Organization and Administration ........................................................... 17
Harper College Executive Council .................................................................... 17
Administrative Organization Chart FY2018........................................................ 18
Chapter III Credit Students.................................................................................... 19
Fall Semester (10th Day) Profiles of Enrolled Credit Students .......................................... 19
Exhibit 3.1. Number of Fall Credit Students by Full-Time/Part-Time Status ............ 19
Exhibit 3.2. Number of Fall Credit Students by Residency Status........................... 19
Exhibit 3.3. Number of Fall Credit Students by Student Enrollment Status .............. 20
Exhibit 3.4. Gender of Fall Credit Students ........................................................ 21
Exhibit 3.5. Age Groups of Fall Credit Students .................................................. 21
Exhibit 3.6. Race/Ethnicity of Fall Credit Students .............................................. 22
Exhibit 3.7. Fall 2017 Credit Students from In-District High Schools ..................... 22

iv
Exhibit 3.8. Fall 2017 Credit Students from Out-of-District Schools by Frequency ... 23
Exhibit 3.9. Annual Credit Student Headcounts by Fiscal Year and Semester .......... 24
Exhibit 3.10. Full-Time Equivalent (FTE) by Fiscal Year and Semester .................. 25
Exhibit 3.11. Number of Credit Students by Age Group and Fiscal Year ................. 26
Exhibit 3.12. Number of Full-Time/Part-Time Credit Students by Fiscal Year ......... 26
Exhibit 3.13. Gender of Credit Students by Fiscal Year ........................................ 26
Exhibit 3.14. Race/Ethnicity of Credit Students by Fiscal Year.............................. 27
Exhibit 3.15. Degrees and Certificates Awarded by Fiscal Year ............................. 28
Exhibit 3.16. Types of Degrees Awarded by Fiscal Year ...................................... 29
Exhibit 3.17.Associates in Applied Sciences Degrees Awarded in Fiscal Year 2017 . 30
Exhibit 3.18. Certificates Awarded in Fiscal Year 2017 ....................................... 31
Exhibit 3.19. Gender of Students Awarded Degrees or Certificates ........................ 34
Exhibit 3.20. Race/Ethnicity of Students Awarded Degrees or Certificates .............. 35
Exhibit 3.21. Top Ten Transfer Choices for Harper 2017 Graduates ....................... 36
End of Term Distance Learning .................................................................................. 37
Exhibit 3.22. FY Credit Hours by Modality ........................................................ 37
Exhibit 3.23. Fall Credit Hours by Modality ....................................................... 37
Exhibit 3.24. Spring Credit Hours by Modality ................................................... 37
Chapter IV Workforce Solutions ............................................................................. 39
Continuing Education and Business Outreach ............................................................... 39
Exhibit 4.1. Enrollment of CE Students by Program by Fiscal Year (Duplicated) ..... 40
Exhibit 4.2. Gender of CE Students by Fiscal Year (Unduplicated)......................... 41
Exhibit 4.3. Age Groups of CE Students by Fiscal Year (Unduplicated).................. 41
Exhibit 4.4. Race/Ethnicity of CE Students by Fiscal Year (Unduplicated) .............. 41
Exhibit 4.5. Gender of Career Training Students (CE) Annual (Unduplicated) ......... 42
Exhibit 4.6. Age Group of Career Training Students (CE) Annual (Unduplicated ..... 42
Exhibit 4.7. Gender of Personal Enrichment Students – CE Annual (Unduplicated) .. 43
Exhibit 4.8. Age Group of Personal Enrichment Students – CE Annual (Unduplicated).................................................................................................................... 43
Exhibit 4.9. Annual New Course Creation Ratio.................................................. 44
Workforce Certification Center .................................................................................. 45
Exhibit 4.10. Workforce Certification Center Highlights ...................................... 45
Harper Business Solutions ......................................................................................... 46
Exhibit 4.11. Harper Business Solutions ............................................................ 46

v
Illinois Small Business Development Center................................................................. 47
Exhibit 4.12. Small Business Development Center (SBDC) ................................... 47
Harper College Job Placement Resource Center ............................................................ 48
Exhibit 4.13. Job Placement Resource Center (JPRC) .......................................... 48
Chapter V Finances ................................................................................................ 49
Exhibit 5.1. Tuition Rates per Credit Hour by Residency Status............................. 49
Exhibit 5.2. Operating Funds Revenues ............................................................. 50
Harper College, Community College District No. 512 Operating Funds Revenues .... 51
Exhibit 5.3. Operating Funds Expenditures......................................................... 52
Harper College, Community College District No. 512 Operating Funds Expenditures 53
Exhibit 5.4. Historical Assessed Valuations and Taxes Extended ........................... 54
Harper College Comprehensive Annual Financial Report 2016-2017 ..................... 55
Chapter VI Facilities............................................................................................... 57
Harper College Campus Map ........................................................................... 57
Additional Locations....................................................................................... 58
Exhibit 6.1. Campus Buildings and Acceptance Dates and Gross Square Feet ........... 60
Exhibit 6.2. Gross Square Footage of Facilities ................................................... 61
Exhibit 6.3. Land and Parking Summary ............................................................ 61
Chapter VII Human Resources................................................................................ 63
Exhibit 7.1. Employee Headcount and Full-Time Equivalent (FTE) by Fall Census .. 63
Exhibit 7.2. Full-Time and Part-Time Employee Status by Occupational Category* and Fall Census ................................................................................................... 63
Exhibit 7.3. Full-Time Equivalent by Occupational Category* and Fiscal Year ........ 64
Exhibit 7.4. Full-Time and Part-Time Employees at Fall Census by Employee Type and Fiscal Year .............................................................................................. 64
Exhibit 7.5. Fall 2017 Employee Census by Employee Type and Full-Time/Part-Time Status ........................................................................................................... 65
Exhibit 7.6. Fall 2017 Employee Census by Employee Type and Gender ................ 65
Exhibit 7.7. Fall 2017 Employee Census by Employee Type and Race/Ethnicity ...... 66
Exhibit 7.8. Fall 2017 Employee Census by Employee Type and Highest Degree Earned .......................................................................................................... 67
Chapter VIII Support Services ................................................................................ 69
Academic Support Services ....................................................................................... 69
Exhibit 8.1. Resources for Learning .................................................................. 69

vi
Exhibit 8.2. Innovative Instruction .................................................................... 69
Exhibit 8.3. Tutoring Center/Success Services/Writing Center ................................ 70
Student Support Services ........................................................................................... 71
Exhibit 8.4. Student Support Services................................................................ 71
Financial Aid ........................................................................................................... 72
Exhibit 8.5. Federal and State Financial Aid Support to Students .................................. 72
Exhibit 8.6. Race/Ethnicity of Financial Aid for All Recipients*............................ 72

vii
Page left blank intentionally

Harper College Fact Book Chapter I: General Information
1
Chapter I General Information
Harper College Institutional Profile Location: 1200 West Algonquin Road Palatine, Illinois 60067-7398 Phone: 847.925.6000 Web Address: http://goforward.harpercollege.edu/ Extension Centers: Harper Professional Center (HPC) 650 East Higgins Road Schaumburg, Illinois 60173 847.925.6066 Learning and Career Center (LCC) 1375 South Wolf Road Prospect Heights, Illinois 60070 847.925.6212 Institutional Type: Comprehensive Community College District: Community College District 512: Comprised of Township High School Districts 211, 214, and Community Unit School District 220 Population: 535,497 (Source: American Community Survey Estimates 2012-2016) Municipalities: Arlington Heights, Barrington, Barrington Hills, Buffalo Grove*, Carpentersville*, Deer Park*, Des Plaines*, Elk Grove Village, Fox River Grove*, Hanover Park*, Hoffman Estates*, Inverness, Lake Barrington, Mount Prospect, North Barrington, Palatine, Prospect Heights, Rolling Meadows, Roselle*, Schaumburg*, South Barrington, Tower Lakes, Wheeling *Not all of municipality included in district Institutional Accreditation: Higher Learning Commission (HLC)

Harper College Fact Book Chapter I: General Information
2
Harper College Institutional Profile (continued)
Enrollment: 13,749 (ICCB E1 Files 10th day enrollment census)
Student Characteristics: Fall 2017 Enrollment • Gender: 55% Female, 45% Male• Race/Ethnicity: 12% Asian, 4% Black Non-Hispanic, 27% Hispanic, 51% Caucasian, 6% Other• Residency status: 88% In-district, 11% Out-of-district• Age: 21% 18 & under, 47% 19-24, 32 % >25
Student Success: 28% graduation rate; 30% transfer rate (2013 IPEDS cohort)
Employees: 1,481 (Fall 2017)
Faculty: 671 (204 Full-Time; 467 Part-Time)
Non-Faculty: 810 (508 Full-Time; 302 Part-Time)
Academic Calendar: Semester – Fall/Spring/Summer
Finances: $101,837,435 Total Operating Expenses 2016-2017
Tuition Per Credit Hour, 2017-18: In-District: $125.00, Out-of-District: $382.00, Out-of-State: $457.50, required fees: $516 required fees annually for full-time attendance
Students Awarded Financial Aid: 22% Pell grants; 6% loans, 27% other grants or scholarships (Source: 2015-16 IPEDS Financial Aid Survey)
Degrees/Certificates Awarded: • Associate in Arts (AA)• Associate in Applied Science (AAS)• Associate in Engineering Science (AES)• Associate in Fine Arts – Art (AFA-A)• Associate in Fine Arts – Music (AFA-M)• Associate of General Studies (AGS)• Associate in Science (AS)• Certificates (Various)

Harper College Fact Book Chapter I: General Information
3
Harper College Institutional Profile (continued)
Academic Divisions:
• Business and Social Science • Career and Technical Programs • Enrollment Services • Health Careers • Interdisciplinary Student Success • Liberal Arts • Mathematics and Science • Resources for Learning/Library Services • Student Affairs • Student Development
History of Harper College The story of Harper College parallels the history of the community college movement in Illinois, an educational phenomenon in the 1960s. In 1967, Harper's first faculty members were hired, and classes for 1,725 students were begun in temporary facilities in September. Read more about Harper’s history at: http://goforward.harpercollege.edu/about/history Harper College Mission Harper College enriches its diverse communities by providing quality, affordable, and accessible education. Harper College, in collaboration with its partners, inspires the transformation of individua l lives, the workforce, and society. http://goforward.harpercollege.edu/about/leadership/mission.php Harper College Philosophy We, at Harper College, believe that our charge is to facilitate active learning and foster the knowledge, critical thinking and life/work skills required for participation in our global society. We work with our community partners to enrich the intellectual, cultural and economic fabric of our district. We believe that excellence in education must occur in an ethical climate of integrity and respect. We hold that the strength of our society is rooted in our diversity and that it is through synergy that we achieve excellence. http://goforward.harpercollege.edu/about/leadership/mission.php Harper College Core Values Consistent with its mission and philosophy, we, the employees and public servants of Harper College, have chosen values by which we will work. http://goforward.harpercollege.edu/about/leadership/mission.php

Harper College Fact Book Chapter I: General Information
4
Community College District 512 Map
Source: 2017-2018 College Plan

Harper College Fact Book Chapter I: General Information
5
Exhibit 1.1. Gender by Age for Harper's District
Census Age Groups
Male Female Total Population N % N % N %
Under 5 17,106 6.5% 15,827 5.8% 32,933 6.2% 5-9 17,156 6.5% 16,746 6.2% 33,902 6.3%
10-14 17,794 6.7% 16,883 6.2% 34,677 6.5% 15-17 11,000 4.5% 9,962 3.7% 20,962 3.9% 18-19 5,225 2.0% 4,636 1.7% 9,861 1.8%
20 2,426 0.9% 1,776 0.7% 4,202 0.8% 21 2,357 0.9% 1,961 0.7% 4,318 0.8%
22-24 8,665 3.3% 8,245 3.0% 16,910 3.2% 25-29 19,002 7.2% 17,550 6.5% 36,552 6.8% 30-34 19,892 7.5% 19,830 7.3% 39,722 7.4% 35-39 18,473 7.0% 17,177 6.3% 35,650 6.7% 40-44 18,241 6.9% 18,015 6.6% 36,256 6.8% 45-49 18,253 6.9% 18,464 6.8% 36,717 6.9% 50-54 19,955 7.6% 21,847 8.1% 41,802 7.8% 55-59 18,519 7.0% 19,538 7.2% 38,057 7.1% 60-61 7,413 2.8% 7,737 2.9% 15,150 2.8% 62-64 9,394 3.6% 9,756 3.6% 19,150 3.6% 65-66 5,216 2.0% 5,935 2.2% 11,151 2.1% 67-69 6,808 2.6% 7,961 2.9% 14,769 2.8% 70-74 7,924 3.0% 9,864 3.6% 17,788 3.3% 75-79 5,503 2.1% 7,879 2.9% 13,382 2.5% 80-84 4,260 1.6% 6,514 2.4% 10,774 2.0% 85+ 3,384 1.3% 7,428 2.7% 10,812 2.02%
Total Gender 263,966 100% 271,531 100% 535,497 100% Source: American Community Survey Estimates (2012-16)
Composite Margin of Error: +/- 1,472

Harper College Fact Book Chapter I: General Information 6
Exhibit 1.2. Percent District Residents by Age Group Served By Harper
Age Groups
Harper's District Population
All In-District Enrollment (FY 2017)*
Percent of All In-district Students Attending
Harper N % N %
17 & Under 122,474 22.9% 3,936 12.8% 3.2% 18-24 35,291 6.6% 14,101 45.8% 40.0% 25-34 76,274 14.2% 5,763 18.7% 7.6% 35-44 71,906 13.4% 2,858 9.3% 4.0% 45-54 78,519 14.7% 1,969 6.4% 2.5%
55 & Over 151,033 28.2% 2,138 6.9% 1.4% Total 535,497 100.0% 30,765 100.0% 5.7%
Source: American Community Survey Estimates (2012-16) and Cognos ODS [Enrollment] *Age calculated at end of FY in order to minimize discrepancies in age group variation
Exhibit 1.3. Race/Ethnicity of Harper District by High School District
Dist. 211 Dist. 214 Dist. 220 Harper District Race/Ethnicity N % N % N % N % Hispanic or Latino 38,557 16.2% 44,888 17.8% 5,393 11.9% 88,838 16.6%
Not Hispanic or Latino
White alone 142,204 59.9% 173,141 68.5% 33,739 74.7% 349,084 65.2% African American alone 8,257 3.5% 4,490 1.8% 342 0.8% 13,089 2.4% American Indian or Alaska Native alone 185 0.1% 240 0.1% 24 0.1% 449 0.1% Asian alone 43,066 18.1% 26,338 10.4% 5,157 11.4% 74,561 13.9% Native Hawaiian or other Pacific Islander alone 202 0.1% 267 0.1% 0 0.0% 469 0.1% Some other race alone 548 0.2% 161 0.1% 15 0.0% 724 0.1% Two or more races 4,434 1.9% 3,360 1.3% 489 1.1% 8,283 1.5% Total Not Hispanic 198,896 83.8% 207,997 82.2% 39,766 88.1% 446,659 83.4%
Grand Total 237,453 100.0% 252,885 100.0% 45,159 100.0% 535,497 100.0% Source: American Community Survey Estimates (2012-16)
Composite Margin of Error: +/- 2,286

Harper College Fact Book Chapter I: General Information 7
Exhibit 1.4. Educational Attainment (25 years and over)
Geography
Total Population 25
years and Over
(Number)
Bachelor's Degree
(Percent)
Graduate or Professional
Degree (Percent)
Bachelor's Degree or
Higher (Percent)
Illinois 8,618,284 20.2% 12.7% 32.9% Chicago Metropolitan Area * 6,360,970 22.0% 14.0% 36.1% District 211 166,739 29.4% 16.5% 45.9% District 214 180,169 26.4% 15.3% 41.7% District 220 30,824 34.4% 27.1% 61.5% Total (Harper District) 377,732 28.4% 16.8% 45.2%
Source: American Community Survey Estimates (2012-16) Composite Margin of Error: +/- 6,111
* Chicago--Naperville--Elgin IL-IN-WI MSA
Exhibit 1.5. Status of Housing Units in Harper District by High School District Housing Status Number Percent
District 211 Housing Units 94,019 44.0% Owner Occupied 61,137 65.0% Renter Occupied 28,070 29.9% Vacant 4,812 5.1%
District 214 Housing Units 102,811 48.2% Owner Occupied 69,460 67.6% Renter Occupied 28,146 27.4% Vacant 5,205 5.1%
District 220 Housing Units 16,677 7.8% Owner Occupied 13,630 81.7% Renter Occupied 1,925 11.5% Vacant 1,122 6.7%
Total Housing Units in Harper District 213,507 100.0% Owner Occupied 144,227 67.6% Renter Occupied 58,141 27.2% Vacant 11,139 5.2%
Source: American Community Survey Estimates (2012-16) Composite Margin of Error: +/- 1,083

Harper College Fact Book Chapter I: General Information 8
Exhibit 1.6. Household Information of Harper District Residents
Household Size, Household Type, and Presence of Children N %
1 Person Household
Male Householder 22,183 11.0% Female Householder 31,660 15.7% Sub-Total 53,644 26.6%
2 or More Person
Household
Family Households
Married Couple Family
With Own Children Under 18 49,338 24.4% No Own Children Under 18 64,154 31.8% Sub-Total 113,603 56.3%
Other Family
Male Householder, No Wife Present
No Own Children Under 18 4,573 2.3%
With Own Children Under 18 3,047 1.5%
Sub-Total 7,249 3.6%
Female Householder, No Husband Present
No Own Children Under 18 8,461 4.2%
With Own Children Under 18 9,219 4.6%
Sub-Total 17,961 8.9% Sub-Total 25,210 12.5%
Sub-Total 138,813 68.8%
Non-Family Households
Male Householder 5,625 2.8% Female Householder 4,108 2.0% Sub-Total 9,450 4.7%
Sub-Total 148,263 73.4% Total Households 201,907 100.0%
Source: American Community Survey Estimates (2012-16) HS Districts. 211, 214, 220 Composite Margin of Error: +/- 1,154

Harper College Fact Book Chapter I: General Information 9
Exhibit 1.7. Population Estimates of Harper District Municipalities
Geography Total Population in 2010 (Number)
Total Population in 2016 (Number)*
Change in Population,
2010-2016 (Percent)
Illinois 12,830,632 12,801,539 -0.23 Arlington Heights 75,101 75,525 0.56 Barrington 10,327 10,312 -0.15 Barrington Hills 4,209 4,221 0.29 Elk Grove Village 33,127 32,931 -0.59 Hoffman Estates 51,895 51,738 -0.30 Inverness 7,399 7,541 1.92 Lake Barrington 4,973 4,950 -0.46 Mount Prospect 54,167 54,171 0.01 North Barrington 3,047 3,007 -1.31 Palatine 68,557 68,766 0.30 Prospect Heights 16,256 16,242 -0.09 Rolling Meadows 24,099 24,021 -0.32 Schaumburg 74,227 74,446 0.30 South Barrington 4,565 4,915 7.67 Tower Lakes 1,283 1,249 -2.65 Wheeling 37,648 38,315 1.77
Source: 2010 Census and 2016 Population Estimates, Illinois Subcounty Population Dataset * Population Estimate as of 7/1/16

Harper College Fact Book Chapter I: General Information 10
Exhibit 1.8. Unemployment Rate
May 2015 May 2016 May 2017 Village or City Labor Unemployed Labor Unemployed Labor Unemployed with Population Force Force Force
of 25,000 or More N N % N N % N N %
Arlington Hts.
41,088
1,850 4.5%
41,358
1,786 4.3%
40,910
1,319 3.2%
Elk Grove
19,240
972 5.1%
19,333
909 4.7%
19,069
637 3.3% Hoffman Estates
30,065
1,368 4.6%
30,283
1,341 4.4%
29,902
947 3.2%
Mount Prospect
29,564
1,351 4.6%
29,700
1,246 4.2%
29,337
870 3.0%
Palatine
39,432
1,877 4.8%
39,582
1,707 4.3%
39,133
1,240 3.2%
Schaumburg
44,199
2,160 4.9%
44,294
1,896 4.3%
43,869
1,451 3.3%
Wheeling
22,427
1,065 4.7%
22,479
934 4.2%
22,225
670 3.0%
Chicago MSA*
4,895,374
285,793 5.8%
4,906,431
258,403 5.3%
4,851,645
197,867 4.1%
Illinois
6,517,229
373,676 5.7%
6,516,889
342,972 5.3%
6,437,920
275,066 4.3%
USA
157,719,000 8,370,000 5.3%
158,800,000
7,207,000 4.5%
159,979,000
6,572,000 4.1%
Source: US Department of Labor: www.bls.gov * Chicago -Naperville-Elgin, IL-IN-WI Metropolitan Statistical Area

Harper College Fact Book Chapter I: General Information 11
Exhibit 1.9. Income and Benefits by High School Districts in Harper District
Income Level Dist. 211 Dist. 214 Dist. 220 Harper N % N % N % N %
Less than $10,000 3,215 3.6% 3,707 3.8% 626 4.0% 7,548 3.7% $10,000 to $14,999 1,619 1.8% 2,993 3.1% 340 2.2% 4,952 2.4% $15,000 to $24,999 5,760 6.5% 7,974 8.2% 586 3.8% 14,320 7.1% $25,000 to $34,999 5,837 6.5% 8,131 8.3% 692 4.4% 14,660 7.2% $35,000 to $49,999 10,024 11.2% 11,260 11.5% 1,198 7.7% 22,482 11.1% $50,000 to $74,999 17,255 19.3% 17,965 18.4% 1,538 9.9% 36,758 18.2% $75,000 to $99,999 13,086 14.7% 13,993 14.3% 1,379 8.9% 28,458 14.1% $100,000 to $149,999 17,735 19.9% 16,975 17.4% 3,009 19.3% 37,719 18.6% $150,000 to $199,999 7,624 8.5% 7,546 7.7% 1,585 10.2% 16,755 8.3% $200,000 or more 7,052 7.9% 7,062 7.2% 4,602 29.6% 18,716 9.2% Total households 89,207 100.0% 97,606 100.0% 15,555 100.0% 202,368 100.0% Median household income (dollars) 76,546 69,481 122,843 N/A
Mean household income (dollars) 96,481 89,786 178,519 N/A
Source: American Community Survey Estimates (2012-16) (Calculated in 2016 inflation-adjusted dollars; benefits defined as Social Security, retirement pensions, Supplemental Security, and public assistance)

Harper College Fact Book Chapter I: General Information 12
Exhibit 1.10. Poverty Levels in Harper District by High School District
Poverty Levels Dist. 211 Dist. 214 Dist. 220 Harper
All families 5.3% 5.0% 4.5% 4.9% With related children under 18 years 8.6% 8.2% 7.4% 8.1%
With related children under 5 years only 8.5% 7.9% 4.7% 7.0% Married couple families 3.2% 3.5% 2.5% 3.1%
With related children under 18 years 5.0% 5.2% 3.4% 4.5% With related children under 5 years only 1.9% 4.3% 0.0% 2.1%
Families with female householder, no husband present 15.1% 14.0% 24.6% 17.9% With related children under 18 years 24.0% 23.9% 30.6% 26.2%
With related children under 5 years only 42.2% 38.9% 52.1% 44.4%
All people 7.3% 7.0% 6.9% 7.1% Under 18 years 10.2% 10.0% 10.0% 10.1%
Related children under 18 years 10.2% 9.9% 9.6% 9.9% Related children under 5 years 11.5% 10.0% 6.8% 9.4% Related children 5 to 17 years 9.7% 9.9% 10.1% 9.9%
18 years and over 6.4% 6.2% 5.8% 6.1% 18 to 64 years 6.4% 5.9% 5.9% 6.1% 65 years and over 6.0% 7.1% 5.6% 6.2%
People in families 5.9% 5.6% 5.6% 5.7% Unrelated individuals 15 years and over 14.4% 14.5% 19.6% 16.2%
Source: American Community Survey Estimates (2012-16)

Harper College Fact Book Chapter I: General Information 13
Accreditations, Affiliations, Certifications Accreditations Harper College is fully accredited by the Higher Learning Commission, 230 South LaSalle Street, Suite 7-500, Chicago, IL, 60604; 800.621.7440 http://goforward.harpercollege.edu/about/consumerinfo/accreditation.php Affiliations The Harper College division offices are members of many different associations. Please refer to the list at: http://goforward.harpercollege.edu/catalog/current/a_handbook/affiliations
Certifications Harper College has many third-party certifications, including from the ACT WorkKeys, Autodesk, Cisco, Intuit QuickBooks, Manufacturing Skill Standards Council, Microsoft Partner for Learning Solutions, VMware, and more. A complete list is available in the Harper College Catalog: http://goforward.harpercollege.edu/catalog/current/a_handbook/thirdpartycert.php
Harper College Educational Foundation Harper College Educational Foundation The Harper College Educational Foundation was established in 1973. Since its inception, the Foundation’s mission has been to support the educational service of William Rainey Harper College and, to this end, to receive, invest and steward contributions for the financial support and benefit of the College in accordance with the Foundation’s policy and donor specifications. Through the years, the Foundation has matured into a not-for-profit organization that has instituted best practices for foundations affiliated with public community colleges. Its Board of Directors continues to monitor those practices and procedures in order to improve continually the operations of the Foundation. By forging strong relationships with community and corporate leaders, the Foundation has helped to create a nationally recognized community college and a strong foundation for the future. http://goforward.harpercollege.edu/foundation/about/index.php Harper College Scholarships Nearly 10,000 students were awarded over $24 million in scholarships, grants and tuition waivers through Harper College in 2016-2017. For a list of the different types of scholarships, see link below. http://goforward.harpercollege.edu/registration/financialaid/scholarships/

Harper College Fact Book Chapter I: General Information 14
Illinois Community College System Overview Illinois Community College System The Illinois Community College Board, as the state coordinating board for community colleges, administers the Public Community College Act in a manner that maximizes the ability of the community colleges to serve their communities. For further information, see link. https://www.iccb.org/iccb/ Illinois Community College System Overview Harper College is one of the colleges in the Illinois Community College System. For further information, see link. https://www.iccb.org/iccb/system-information/
Federal Legislators in Harper College District
U.S. Senators
Richard Durbin (D) 230 S. Dearborn St. Suite 3892 Chicago, IL 60604 312.353.4952 https://www.durbin.senate.gov
Tammy Duckworth (D) 230 S. Dearborn St. Suite 3900 Chicago, IL 60604 312.886.3506 https://www.duckworth.senate.gov
U.S. Representatives
Congressional District 6 Peter Roskam (R) 200 S. Hough St. Second Floor Barrington, IL 60010 847.232.0006 https://roskam.house.gov
Congressional District 8 Raja Krishnamoorthi (D) 1701 E. Woodfield Road Suite 704 Schaumburg, IL 60173 847.413.1959 https://krishnamoorthi.house.gov
Congressional District 9 Jan Schakowsky (D) 820 Davis St. Suite 105 Evanston, IL 60201 847.328.3409 https://schakowsky.house.gov

Harper College Fact Book Chapter I: General Information 15
State Legislators in Harper College District
Illinois State Senators
Senate District 22 Cristina Castro (D) The Professional Bldg 164 Division Street Suite 102 Elgin, IL 60120 847.214.8864 http://www.senatorcristinacastro.com/
Senate District 26 Dan McConchie (R) 325 N Rand Road Suite B Lake Zurich, IL 60047 224.662.4544 http://danmcconchie.com/
Senate District 27 Tom Rooney (R) 1 E. Northwest Highway Suite 109 Palatine, IL 60067 847.776.1490 https://rooney.house.gov/about-tom
Senate District 28 Laura M. Murphy (D) 1510 Midway Ct Suite E.107 Elk Grove Village, IL 60007 847.718.1110 http://www.senatorlauramurphy.com/
Senate District 29 Julie A. Morrison (D) 700 Osterman Ave. Deerfield, IL 60015 847.945.5200 juliemorrisonforstatesenate.com/
Senate District 30 Terry Link (D) 100 S. Greenleaf St. Gurnee, IL 60031 847.623.3006 senatorlink.com
Illinois State Representatives
House District 44 Fred Crespo (D) 1014 E. Schaumburg Rd. Streamwood, IL 60107 630.372.3340 http://ilhousedems.com/project/rep-fred-crespo/
House District 51 Nick Sauer (R) 1585 N Milwaukee Ave Libertyville, IL 60048 847.984.2485 http://www.repnicksauer.com
House District 52 David McSweeney (R) 105 E Main Street Cary, IL 60013 847.516.0052 http://www.davidmcsweeney.org/
House District 54 Thomas Morrison (R) 117 East Palatine Road Suite 106 Palatine, IL 60067 847.202.6584 http://www.repmorrison54.com/
House District 56 Michelle Mussman (D) 15 W. Weathersfield Way Schaumburg, IL 60193 847.923.9104 [email protected]
House District 57 Jonathon Carroll (D) 830 S Buffalo Grove Rd Suite 120 Buffalo Grove, IL 60089 847.229.5499 [email protected]

Harper College Fact Book Chapter I: General Information 16
Page left blank intentionally

Harper College Fact Book Chapter II: Organization and Administration 17
Chapter II Organization and Administration
Harper College Executive Council
• Dr. Kenneth Ender, President • Dr. Maria Coons, Chief of Staff /Vice President of Institutional Planning and Strategic Alliances • Dr. Ronald Ally, Executive Vice President of Finance and Administrative Services • Laura Brown, Vice President and Chief Advancement Officer • Dr. Judith Marwick, Provost • Michelé Smith, Vice President of Workforce Solutions/Associate Provost for Curriculum

Harper College Fact Book Chapter II: Organization and Administration 18
Administrative Organization Chart FY2018

Harper College Fact Book Chapter III: Credit Students
19
Chapter III Credit Students
Fall Semester (10th Day) Profiles of Enrolled Credit Students
Exhibit 3.1. Number of Fall Credit Students by Full-Time/Part-Time Status
Enrollment Status Fall 2013 Fall 2014 Fall 2015 Fall 2016 Fall 2017 N % N % N % N % N %
Full-Time: 12 or more hours 5,541 37.4% 5,391 36.0% 5,056 34.8% 4,836 34.2% 4,882 35.5% Part-Time: 6 to Less Than 12
hours 5,271 35.5% 5,338 35.7% 5,158 35.5% 5,197 36.7% 4,762 34.6%
Part-Time: Less Than 6 Hours 4,018 27.1% 4,228 28.3% 4,318 29.7% 4,109 29.1% 4,105 29.9%
Total Part-Time 9,289 62.6% 9,566 64.0% 9,476 65.2% 9,306 65.8% 8,867 64.5%
Total (100%) 14,830 14,957 14,532 14,142 13,749 Source: ICCB E1 Files (10th Day Enrollment)
Official counts submitted to ICCB may differ from counts reported by Enrollment Services (Registrar) due to different reporting requirements. Columns may not add up to 100% due to rounding.
Exhibit 3.2. Number of Fall Credit Students by Residency Status
Residency Status Fall 2013 Fall 2014 Fall 2015 Fall 2016 Fall 2017
N % N % N % N % N % In District 13,116 88.4% 13,122 87.7% 12,689 87.3% 12,230 86.5% 11,859 86.3% Out of District 1,611 10.9% 1,718 11.5% 1,728 11.9% 1,788 12.6% 1,763 12.8% Out of State 6 <0.1% 8 0.1% 12 0.1% 21 0.1% 12 0.1%
Foreign Country 97 0.7% 109 0.7% 103 0.7% 103 0.7% 115 0.8% Total (100%)* 14,830 14,957 14,532 14,142 13,749
Source: ICCB E1 Files (10th Day Enrollment)
Official counts submitted to ICCB may differ from counts reported by Enrollment Services (Registrar) due to different reporting requirements. Columns may not add up to 100% due to rounding.

Harper College Fact Book Chapter III: Credit Students
20
Exhibit 3.3. Number of Fall Credit Students by Student Enrollment Status
Student Category Fall 2013 Fall 2014 Fall 2015 Fall 2016 Fall 2017
Full Time
Part Time
Full Time
Part Time
Full Time
Part Time
Full Time
Part Time
Full Time
Part Time
First-time Student in College-Level Coursework
1,812 1,379 1,567 1,377 1,775 835 1,730 954 1,571 719 32.7% 14.8% 29.1% 14.4% 35.1% 8.8% 35.8% 10.3% 32.2% 8.1%
New Pre-College Student 0 23 N/A N/A 54 347 33 291 17 244
0.0% 0.2% N/A N/A 1.1% 3.7% 0.7% 3.1% 0.4% 2.8%
Transfer Student 565 1,296 550 1,248 639 1,503 575 1,253 318 367
10.2% 14.0% 10.2% 13.0% 12.6% 15.9% 11.9% 13.5% 6.5% 4.1%
Pre-College to College 1,076 1,865 1,019 1,923 857 1,856 392 1,033 60 207
19.4% 20.1% 18.9% 20.1% 17.0% 19.6% 8.1% 11.1% 1.2% 2.3%
Previous Degree 129 795 109 810 86 765 102 742 227 1361
2.3% 8.6% 2.0% 8.5% 1.7% 8.1% 2.1% 8.0% 4.7% 15.4%
Returning Student 1,706 3,378 1,907 3,396 205 1,127 127 732 383 1,249
30.8% 36.4% 35.4% 35.5% 4.1% 11.9% 2.6% 7.9% 7.9% 14.1%
Continuing Student 253 318 239 300 1,440 2,382 1,877 3,428 2,304 3,806
4.6% 3.4% 4.4% 3.1% 28.5% 25.1% 38.8% 36.8% 47.2% 42.9%
New General/Vocational Student N/A N/A N/A N/A 0 81 0 94 0 77
N/A N/A N/A N/A 0.0% 0.9% 0.0% 1.0% 0.0% 0.9%
High School Student 0 235 0 512 0 580 0 779 2 837
0.0% 2.5% 0.0% 5.4% 0.0% 6.1% 0.0% 8.4% 0.0% 9.4%
Total* 5,541 9,289 5,391 9,566 5,056 9,476 4,836 9,306 4,882 8,867 Source: ICCB E1 Files (10th Day Enrollment).
Official counts submitted to ICCB may differ from counts reported by Enrollment Services (Registrar) due to different reporting requirements. Columns may not add up to 100% due to rounding

Harper College Fact Book Chapter III: Credit Students
21
Exhibit 3.4. Gender of Fall Credit Students
Gender Fall 2013 Fall 2014 Fall 2015 Fall 2016 Fall 2017
N % N % N % N % N % Male 6,640 44.8% 6,757 45.2% 6,635 45.7% 6,403 45.3% 6,226 45.3% Female 8,190 55.2% 8,200 54.8% 7,897 54.3% 7,739 54.7% 7,523 54.7% Unknown 0 0.0% 0 0.0% 0 0.0% 0 0.0% 0 0.0% Total 14,830 14,957 14,532 14,142 13,749
Source: ICCB E1 Files (10th Day Enrollment)
Official counts submitted to ICCB may differ from counts reported by Enrollment Services (Registrar) due to different reporting requirements. Columns may not add up to 100% due to rounding.
Exhibit 3.5. Age Groups of Fall Credit Students Age Groups
Fall 2013 Fall 2014 Fall 2015 Fall 2016 Fall 2017 N % N % N % N % N %
18 and Under 1,500 10.1% 1,912 12.8% 1,985 13.7% 1,922 13.6% 2,914 21.2%
19-24 7,650 51.6% 7,638 51.1% 7,377 50.8% 7,374 52.1% 6,401 46.6% 25-28 1,678 11.3% 1,627 10.9% 1,570 10.8% 1,529 10.8% 1,384 10.1% 29-33 1,245 8.4% 1,166 7.8% 1,077 7.4% 1,026 7.3% 889 6.5% 34-38 790 5.3% 756 5.1% 759 5.2% 728 5.1% 696 5.1% 39-42 526 3.5% 486 3.2% 459 3.2% 423 3.0% 421 3.1% 43-47 529 3.6% 454 3.0% 472 3.2% 411 2.9% 391 2.8% 48-52 380 2.6% 374 2.5% 338 2.3% 305 2.2% 269 2.0% 53-57 252 1.7% 265 1.8% 247 1.7% 200 1.4% 174 1.3% 58 and Over 265 1.8% 269 1.8% 248 1.7% 208 1.5% 209 1.5% Unknown 15 0.1% 10 0.1% 0 0.0% 16 0.1% 1 0.0% Total (100%)* 14,830 14,957 14,532 14,142 13,749
Average Age 26 26 27 25 25 Source: ICCB E1 Files (10th Day Enrollment).
*Official counts submitted to ICCB may differ from counts reported by Enrollment Services (Registrar) due to different reporting requirements. Columns may not add up to 100% due to rounding.

Harper College Fact Book Chapter III: Credit Students
22
Exhibit 3.6. Race/Ethnicity of Fall Credit Students
Race/Ethnicity Fall 2013 Fall 2014 Fall 2015 Fall 2016 Fall 2017 N % N % N % N % N %
American Indian or Alaskan Native 14 0.1% 20 0.1% 17 0.1% 14 0.1% 19 0.1%
Asian 1,437 9.7% 1,572 10.5% 1,519 10.5% 1,498 10.6% 1,669 12.1% Black or African American 541 3.6% 569 3.8% 573 3.9% 587 4.2% 536 3.9%
Hispanic or Latino 3,357 22.6% 3,582 23.9% 3,767 25.9% 3,816 27.0% 3,708 27.0% Native Hawaiian or Other Pacific Islander
100 0.7% 94 0.6% 67 0.5% 25 0.2% 11 0.1%
White 8,195 55.3% 8,119 54.3% 7,819 53.8% 7,410 52.4% 7,037 51.2% Multi-Racial 466 3.1% 426 2.8% 351 2.4% 364 2.6% 278 2.0% International 2 0.0% 2 0.0% 91 0.6% 108 0.8% 126 0.9% Unknown 718 4.8% 573 3.8% 328 2.3% 320 2.3% 365 2.7% Total (100%) 14,830 14,957 14,532 14,142 13,749
Source: ICCB E1 Files (10th Day Enrollment) Official counts submitted to ICCB may differ from counts reported by Enrollment Services (Registrar) due to different reporting requirements.
Columns may not add up to 100% due to rounding.
Exhibit 3.7. Fall 2017 Credit Students from In-District High Schools
Rank In-District High School Fall 2017 Enrollment
Percent of Harper’s
Total Fall 2017
Enrollment 1 Palatine High School 915 6.7% 2 James B Conant High School 854 6.2%
3 Schaumburg High School 795 5.8% 4 Hoffman Estates High School 596 4.3%
5 Elk Grove High School 595 4.3% 6 Wheeling High School 591 4.3%
7 William Fremd High School 573 4.2% 8 Buffalo Grove High School 565 4.1%
9 Barrington Community Hs 560 4.1% 10 Rolling Meadows High School 540 3.9%
11 Prospect High School 486 3.5% 12 John Hersey High School 478 3.5%
13 Saint Viator High School 71 0.5% Total 7,619 55.4%
Source: ICCB E1 Files & Banner System
Official counts submitted to ICCB may differ from counts reported by Enrollment Services (Registrar) due to different reporting requirements.

Harper College Fact Book Chapter III: Credit Students
23
Exhibit 3.8. Fall 2017 Credit Students from Out-of-District High Schools by Frequency
Rank Out-of-District High School Fall 2017 Enrollment
Percent of Harper’s Total Fall
2017 Enrollment
1 Lake Zurich Senior High School 164 1.2% 2 Streamwood High School 161 1.2% 3 Adlai E Stevenson High School 107 0.8% 4 Cary Grove High School 103 0.7% 5 Dundee-Crown High School 95 0.7% 6 Maine West High School 93 0.7% 7 Huntley High School 92 0.7% 8 Bartlett High School 74 0.5% 9 Elgin High School 74 0.5% 10 Illinois High School 73 0.5%
Total 1036 7.5% Source: ICCB E1 Files & Banner System
Official counts submitted to ICCB may differ from counts reported by Enrollment Services (Registrar) due to different reporting requirements.

Harper College Fact Book Chapter III: Credit Students
24
Exhibit 3.9. Annual Credit Student Headcounts by Fiscal Year and Semester 2012-13 2013-14 2014-15 2015-2016 2016-2017 Annual Number of Students 26,422 25,512 25,060 25,409 25,290
Number of Students by Semester Summer 9,544 9,339 8,930 8,730 8,018 Fall 16,445 16,142 15,797 15,270 14,893 Spring 16,867 16,357 16,341 16,662 16,890
Source: ICCB A1 Files Official counts submitted to ICCB may differ from counts reported by Enrollment Services (Registrar) due to different reporting requirements.
A1 files represent end of term enrollment. Annual count is unduplicated. Semester counts are duplicative.
9,544 9,339 8,930 8,7308,018
16,445 16,142 15,797 15,270 14,893
16,867 16,357 16,341 16,662 16,890
26,42225,512 25,060 25,409 25,290
0
5,000
10,000
15,000
20,000
25,000
30,000
2012-13 2013-14 2014-15 2015-2016 2016-2017
Annual Credit Student Headcounts by Fiscal Year and Semester
Summer Fall Spring Annual

Harper College Fact Book Chapter III: Credit Students
25
Exhibit 3.10. Full-Time Equivalent (FTE) by Fiscal Year and Semester 2012-13 2013-14 2014-15 2015-16 2016-17
Credit Hours FTE Credit
Hours FTE Credit Hours FTE Credit
Hours FTE Credit Hours FTE
Annual Number of FTE Students
324,012
10,800
316,252
10,542
306,703
10,223
298,527
9,951
290,038
9,668
FTE by Semester*
Summer 42,554
7,092
41,642
6,940
39,770
6,628
38,430
6,405
35,072
5,845
Fall 143,071
9,538
141,289
9,419
136,257
9,084
131,125
8,742
127,003
8,467
Spring 138,388
9,226
133,322
8,888
130,676
8,711
128,973
8,598
127,963
8,531
Source: ICCB AC Files. Official counts submitted to ICCB may differ from counts reported by Enrollment Services (Registrar) due to different reporting requirements.
Full Time Equivalent (FTE) for Fall and Spring is the number of credit hours divided by 15; for Summer, FTE is the number of credit hours divided by 6. Annualized FTE is calculated as the sum of credit hours divided by 30.
7,092 6,9406,628 6,405
5,845
9,538 9,4199,084
8,7428,467
9,2268,888 8,712 8,598 8,531
10,800 10,54210,223
9,9519,668
0
2,000
4,000
6,000
8,000
10,000
12,000
2012-13 2013-14 2014-15 2015-16 2016-17
Full-Time Equivalent (FTE) by Fiscal Year and Semester
Summer Fall Spring Annual

Harper College Fact Book Chapter III: Credit Students
26
Exhibit 3.11. Number of Credit Students by Age Group and Fiscal Year Age Groups
2012-13 2013-14 2014-15 2015-16 2016-17 N % N % N % N % N %
18 and Under 1,736 6.6% 1,799 7.1% 2,086 8.3% 2,558 10.1% 7,465 29.5% 19-24 13,894 52.6% 13,467 52.8% 13,292 53.0% 13,222 52.0% 10,243 40.5% 25-28 3,191 12.1% 3,137 12.3% 3,042 12.1% 2,998 11.8% 2,173 8.6% 29-33 2,344 8.9% 2,195 8.6% 1,677 6.7% 2,022 8.0% 1,654 6.5% 34-38 1,454 5.5% 1,427 5.6% 1,747 7.0% 1,412 5.6% 1,156 4.6% 39-42 912 3.5% 868 3.4% 824 3.3% 827 3.3% 684 2.7% 43-47 985 3.7% 869 3.4% 797 3.2% 817 3.2% 735 2.9% 48-52 777 2.9% 722 2.8% 617 2.5% 621 2.4% 492 2.0% 53-57 538 2.0% 483 1.9% 474 1.9% 463 1.8% 329 1.3% 58 and Over 498 1.9% 508 2.0% 479 1.9% 440 1.7% 338 1.3% Unknown 93 0.4% 37 0.1% 25 0.1% 29 0.1% 21 0.1% Total Enrollment 26,422 100.0% 25,512 100.0% 25,060 100.0% 25,409 100.0% 25,290 100.0%
Average Age 27.1 26.9 26.6 26.4 24.3 Source: ICCB A1 Files
Official counts submitted to ICCB may differ from counts reported by Enrollment Services (Registrar) due to different reporting requirements. Columns may not add up to 100% due to rounding.
Exhibit 3.12. Number of Full-Time/Part-Time Credit Students by Fiscal Year Semester / Status
2012-13 2013-14 2014-15 2015-16 2016-17 N % N % N % N % N %
Summer FT 2,865 30.0% 2,794 29.9% 2,669 29.9% 2,539 29.1% 2,289 28.6% PT 6,679 70.0% 6,545 70.1% 6,261 70.1% 6,191 70.9% 5,729 71.5%
Fall FT 6,032 36.7% 5,877 36.4% 5,448 34.5% 5,132 33.6% 4,857 32.6% PT 10,413 63.3% 10,265 63.6% 10,349 65.5% 10,138 66.4% 10,036 67.4%
Spring FT 5,304 31.4% 4,950 30.3% 4,723 28.9% 4,420 26.5% 4,239 25.1% PT 11,563 68.6% 11,407 69.7% 11,618 71.1% 12,242 73.5% 12,651 74.9%
Source: ICCB A1 Files Official counts submitted to ICCB may differ from counts reported by Enrollment Services (Registrar) due to different reporting requirements.
Exhibit 3.13. Gender of Credit Students by Fiscal Year
Gender 2012-13 2013-14 2014-15 2015-2016 2016-2017
N % N % N % N % N % Female 14,633 55.1% 14,100 55.1% 13,883 55.3% 13,916 54.8% 13,964 55.2% Male 11,789 44.8% 11,412 44.9% 11,177 44.7% 11,493 45.2% 11,326 44.8% Total 26,422 100.0% 25,512 100.0% 25,060 100.0% 25,409 100.0% 25,290 100.0%
Source: ICCB A1 Files Official counts submitted to ICCB may differ from counts reported by Enrollment Services (Registrar) due to different reporting requirements.
Columns may not add up to 100% due to rounding.

Harper College Fact Book Chapter III: Credit Students
27
Exhibit 3.14. Race/Ethnicity of Credit Students by Fiscal Year
Race/Ethnicity 2012-13 2013-14 2014-15 2015-2016 2016-2017 N % N % N % N % N %
Asian 2,707 10.2% 2,752 10.8% 2,633 10.5% 2,845 11.2% 3,029 12.0% American Indian or Alaskan Native 54 0.2% 33 0.1% 41 0.2% 38 0.1% 41 0.2%
Black 1,174 4.4% 1,062 4.2% 980 3.9% 1,007 4.0% 1,025 4.1% Hispanic 4,729 17.9% 5,129 20.1% 5,776 23.0% 6,335 24.9% 6,263 24.8% Native Hawaiian or Other Pacific Islander
128 0.5% 71 0.3% 67 0.3% 48 0.2% 27 0.1%
White 15,092 57.1% 14,810 58.1% 14,072 56.2% 13,687 53.9% 13,330 52.7% Multirace 550 2.1% 667 2.6% 558 2.2% 501 2.0% 544 2.2% Nonresident Alien 8 0.0% 96 0.4% 148 0.6% 135 0.5% 149 0.6% Unknown 2,047 7.7% 892 3.5% 785 3.1% 813 3.2% 882 3.5% Total 26,422 100.0% 25,512 100.0% 25,060 100.0% 25,409 100.0% 25,290 100.0%
Source: ICCB A1 Files. Official counts submitted to ICCB may differ from counts reported by Enrollment Services (Registrar) due to different reporting requirements.
Columns may not add up to 100% due to rounding.
Asian11.98% American Indian or
Alaskan Native0.16%
Black4.05%
Hispanic24.76%
Native Hawaiian or Other Pacific
Islander0.11%
White52.71%
Multirace2.15%
Nonresident Alien0.59% Unkno…
Race/Ethnicity of Credit Students for 2016-2017

Harper College Fact Book Chapter III: Credit Students
28
Exhibit 3.15. Degrees and Certificates Awarded by Fiscal Year FY13 FY14 FY15 FY16 FY17
Degrees 1,675 1,772 1,620 1,611 1,789 Certificates 2,225 1,951 2,037 1,845 1,818 Total 3,900 3,723 3,657 3,456 3,607
Source: ICCB A2 Files for FY16 and FY17, previous years were based on A1 Files
0
500
1,000
1,500
2,000
2,500
FY13 FY14 FY15 FY16 FY17
1,675 1,7721,620 1,611
1,789
2,225
1,9512,037
1,845 1,818
Degrees and Certificates Awarded by Fiscal Year
Degrees Certificates

Harper College Fact Book Chapter III: Credit Students
29
Exhibit 3.16. Types of Degrees Awarded by Fiscal Year Degrees 2012-13 2013-14 2014-15 2015-16 2016-17 Associate in Arts (AA) 1,023 937 892 921 944 Associate in Applied Science (AAS) 490 458 485 417 466 Associate in Engineering Science (AES) 6 3 9 15 22 Associate in Fine Arts - Art (AFA-A) 7 5 7 1 2 Associate in Fine Arts - Music (AFA-M) 0 0 0 5 7 Associate of Arts in Teaching (AAT) 1 N/A N/A N/A N/A
Associate of General Studies (AGS) 33 231 68 86 133 Associate in Science (AS) 115 138 159 166 215 Total 1,675 1,772 1,620 1,611 1,789
Source: ICCB A2 Files for FY16 and FY17, previous years were based on A1 Files Official counts submitted to ICCB may differ from counts reported by Enrollment Services (Registrar) due to different reporting requirements

Harper College Fact Book Chapter III: Credit Students
30
Exhibit 3.17.Associates in Applied Sciences Degrees Awarded in Fiscal Year 2017 Degree N %
Accounting Associate Deg 11 2.35% Business Adm AAS-Financial Mgt 1 0.21% Business Admin AAS-Management 40 8.55% Business Admin AAS-Marketing 1 0.21% Business Admin AAS-Supply Chain 1 0.21% Computer Network Admin AAS 4 0.85% Computer Support AAS 3 0.64% Computers: Applications AAS 2 0.43% Dental Hygiene AAS 25 5.34% Diagnos Cardiac Sonography AAS 13 2.78% Diagnostic Medical Sonog AAS 12 2.56% Dietetic Technician AAS 14 2.99% Early Childhood Director AAS 1 0.21% Early Childhood Teacher AAS 12 2.56% Electronics Engineer Tech AAS 8 1.71% Emergency and Disaster Mgt AAS 3 0.64% EMS: Emergency Medical Svcs AAS 1 0.21% Fashion Entrepreneurship AAS 1 0.21% Fashion Merchandising AAS 11 2.35% Fashion: Design AAS 3 0.64% Fire Science Technology AAS 23 4.91% Foodservice Operations Mgt AAS 13 2.78% Forensic Science AAS 4 0.85% Graphic Arts Design AAS 14 2.99% Graphic Arts Print Graphics AAS 3 0.64% Graphic Arts Web Design AAS 3 0.64% Health Care Office Mgr AAS 12 2.56% Health Info Technology AAS 16 3.42% Hotel Operations Mgt AAS 6 1.28% Human Services AAS 18 3.85% HVAC: Refrigeration/Air Con AAS 1 0.21% Interior Design AAS 6 1.28% Law Enforcement AAS 28 5.98% Maintenance AAS 2 0.43% Mfg Tech: Metal Fabrication AAS 1 0.21% Mfg Tech: Precision Machine AAS 2 0.43% Mfg Tech: Supply Chain AAS 4 0.85% Nursing AAS 91 19.44% Paralegal Studies AAS 11 2.35% Paraprofessional Educator AAS 1 0.21% Public Relations AAS 3 0.64% Radiologic Technology AAS 23 4.91% Software Development AAS 1 0.21% Web Application Dev AAS 3 0.64% Welding Technology AAS 12 2.56% Grand Total 468 100.00%
Source: ICCB A2 Files & Banner System

Harper College Fact Book Chapter III: Credit Students
31
Exhibit 3.18. Certificates Awarded in Fiscal Year 2017 Exhibit 3.18. Certificates Awarded in Fiscal Year 2017 (cont)
Certificate N % Accounting Assistant Cer 9 0.50% Accounting Bookkeepr/Clerk Cer 51 2.81% Accounting:CPA Preparation Cer 7 0.39% Adv Acctg Bookkeeper/Clerk 30 1.65% Architectural 2-D CAD Cer 22 1.21% Building Codes and Enforce Cer 1 0.06% Business Management Cer 14 0.77% Cardiographic Technician Cer 22 1.21% CNC Operator I Cer 28 1.54% CNC Operator II Cer 10 0.55% Community Health Worker Cer 1 0.06% Computer Support TechnicianCer 7 0.39% Computers in Business Cer 34 1.87% Computers:Business SftwrSp Cer 1 0.06% Computers:Netwk Supp Techn Cer 1 0.06% Dietary Manager Cer 13 0.72% Early Ch : Infant/Toddler Cer 11 0.61% Early Child Administrator Cer 4 0.22% Early Child Bef/After Schl Cer 4 0.22% Early Child Spec Ed Parapr Cer 1 0.06% Early Child: Family Care I Cer 5 0.28% Early Childhood Asst Teach Cer 21 1.16% Early Childhood Teacher Cer 13 0.72% Electronics Cer 13 0.72% Electronics:Industr Maint Cer 17 0.94% Electronics_Electrical Mnt Cer 12 0.66% Electronics_Mechatronics Cer 2 0.11% Emergency and Disaster Mgt Cer 4 0.22% Emergency Medical Tech Cer 73 4.02% Emergency Mgt:PSDispatcher Cer 5 0.28% EMS:EMT-Basic Cer 1 0.06% Entrepreneurship Cer 1 0.06% Fashion: Apparel Construct Cer 2 0.11% Food Service Mgt Cer 3 0.17% Food Service:Bread_Pastry Cer 8 0.44% Food Service:Culinary Arts Cer 5 0.28% Forensic Science Tech Cer 16 0.88% Geographic Info Systems Cer 1 0.06% Graphic Arts: Design Cer 15 0.83% Graphic Arts:Digital PhotogCer 5 0.28% Graphic Arts:Fashion Cer 1 0.06%

Harper College Fact Book Chapter III: Credit Students
32
Exhibit 3.18. Certificates Awarded in Fiscal Year 2017 (cont)
Certificate N % Graphic Arts:Web Design Cer 3 0.17% Health Care Office Asst Cer 2 0.11% Health Info Technology Cer 7 0.39% Health Insurance Spclst Cer 3 0.17% Hotel Management Cer 8 0.44% HVAC:Domestic Refrig/Heat Cer 24 1.32% HVAC:Heating Services Cer 15 0.83% HVAC:Refrig/Air Con Svc Cer 3 0.17% HVAC:Refrigeration Service Cer 19 1.05% HVAC:Residentl Comfort Sys Cer 16 0.88% Interior:Kitchen_Bath Cer 4 0.22% Interior:Perspective_Rend Cer 1 0.06% International Business Cer 1 0.06% Inventory/Production Cer 35 1.93% Logistics Cer 8 0.44% Magnetic Resonance Imaging Cer 1 0.06% Maintenance: Commercial Cer 4 0.22% Maintenance: Supervisory Cer 1 0.06% Maintenance:Basic Cer 8 0.44% Mammography Cer 1 0.06% Management:Advanced Cer 26 1.43% Management:General Cer 12 0.66% Management:Human Resources Cer 32 1.76% Marketing:E-Commerce Bus Cer 4 0.22% Medical Assistant Cer 24 1.32% Medical Coding Cer 71 3.91% Medical Receptionist Cer 4 0.22% Mfg Tech:ManufacturingProd Cer 12 0.66% Network Administration Cer 1 0.06% Nursing:Certified Nur Asst Cer 716 39.43% Office Assistant Cer 11 0.61% Paralegal Studies Cer 21 1.16% Paramedic Certificate 1 0.06% Paraprofessional Educator Cer 1 0.06% Phlebotomy Cer 61 3.36% Practical Nursing Cer 16 0.88% Private Security Cer 1 0.06% Procurement Cer 14 0.77% Public Relations Cer 1 0.06% Public Relations for Web Cer 1 0.06% Purchasing Cer 15 0.83% Sign Language Interpreting Cer 2 0.11%

Harper College Fact Book Chapter III: Credit Students
33
Exhibit 3.18. Certificates Awarded in Fiscal Year 2017 (cont)
Certificate N % Software Development Cer 2 0.11% Supply Chain Management Cer 34 1.87% Supply Chain:Phys Distrib Cer 27 1.49% Tax Accounting Assistant Cer 2 0.11% Web Development Cer 1 0.06% Web Visual Design Cer 1 0.06% Welding:Advanced Cer 6 0.33% Welding:Basic Cer 25 1.38% Welding:Basic Pipe Cer 2 0.11% Welding:Fabrication Cer 11 0.61% Grand Total 1816 100.00%
Source: ICCB A2 Files & Banner System

Harper College Fact Book Chapter III: Credit Students
34
Exhibit 3.19. Gender of Students Awarded Degrees or Certificates
FY13 FY14 FY15 FY16 FY17 N % N % N % N % N %
Female 2,080 61.0% 2,038 61.0% 1,860 59.0% 1,853 60.2% 1,992 63.4% Male 1,400 39.0% 1,321 39.0% 1,282 41.0% 1,223 39.8% 1,151 36.6% Unknown 2 0.0% 0 0.0% 0 0.0% 0 0.0% 0 0.0% Total 3,482 100% 3,359 100% 3,142 100% 3,076 100% 3,143 100%
Source: ICCB A2 Files for FY16 and FY17, previous years were based on A1 Files
61% 61%59% 60%
63%
39% 39%41% 40%
37%
0%
10%
20%
30%
40%
50%
60%
70%
FY13 FY14 FY15 FY16 FY17
Gender of Students Awarded Degrees or Certificates
Female Male
Harper College Fact Book Chapter III: Credit Students
35
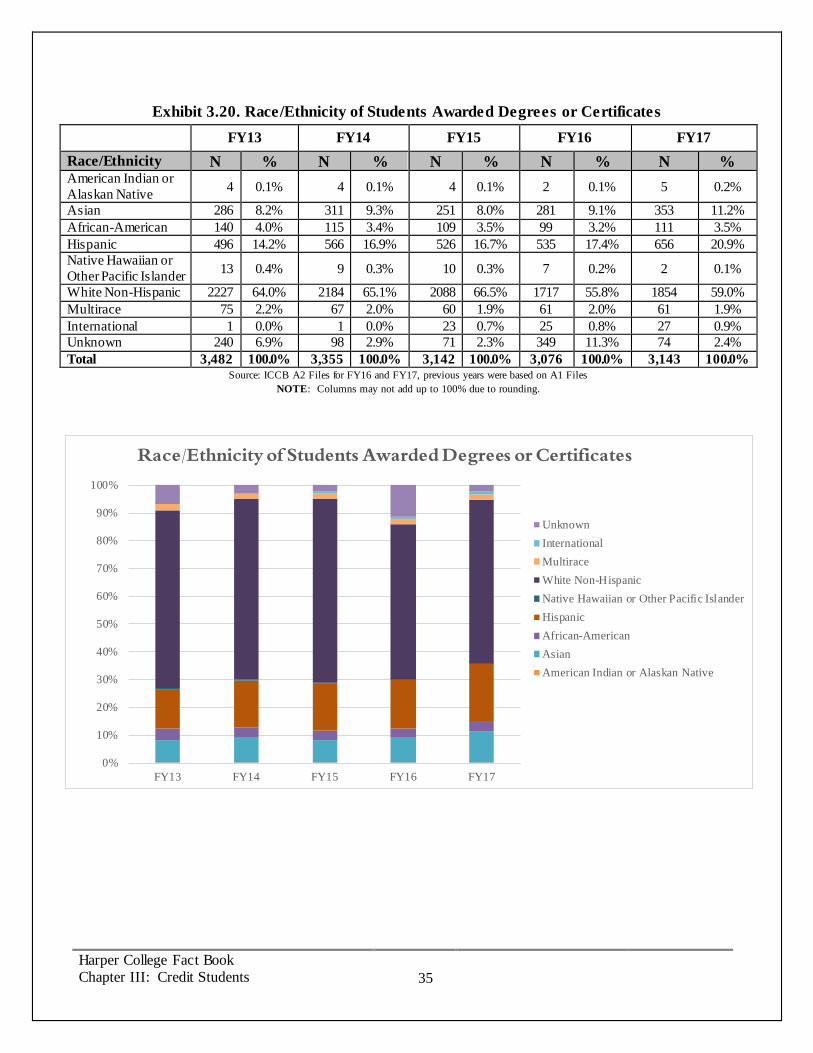
Exhibit 3.20. Race/Ethnicity of Students Awarded Degrees or Certificates
FY13 FY14 FY15 FY16 FY17 Race/Ethnicity N % N % N % N % N % American Indian or Alaskan Native 4 0.1% 4 0.1% 4 0.1% 2 0.1% 5 0.2%
Asian 286 8.2% 311 9.3% 251 8.0% 281 9.1% 353 11.2% African-American 140 4.0% 115 3.4% 109 3.5% 99 3.2% 111 3.5% Hispanic 496 14.2% 566 16.9% 526 16.7% 535 17.4% 656 20.9% Native Hawaiian or Other Pacific Islander 13 0.4% 9 0.3% 10 0.3% 7 0.2% 2 0.1%
White Non-Hispanic 2227 64.0% 2184 65.1% 2088 66.5% 1717 55.8% 1854 59.0% Multirace 75 2.2% 67 2.0% 60 1.9% 61 2.0% 61 1.9% International 1 0.0% 1 0.0% 23 0.7% 25 0.8% 27 0.9% Unknown 240 6.9% 98 2.9% 71 2.3% 349 11.3% 74 2.4% Total 3,482 100.0% 3,355 100.0% 3,142 100.0% 3,076 100.0% 3,143 100.0%
Source: ICCB A2 Files for FY16 and FY17, previous years were based on A1 Files NOTE: Columns may not add up to 100% due to rounding.
0%
10%
20%
30%
40%
50%
60%
70%
80%
90%
100%
FY13 FY14 FY15 FY16 FY17
Race/Ethnicity of Students Awarded Degrees or Certificates
UnknownInternationalMultiraceWhite Non-HispanicNative Hawaiian or Other Pacific IslanderHispanicAfrican-AmericanAsianAmerican Indian or Alaskan Native

Harper College Fact Book Chapter III: Credit Students
36
Exhibit 3.21. Top Ten Transfer Choices for Harper 2017 Graduates At Harper College, 3,143 students completed either a degree or certificate during the 2017 fiscal year. Data for these graduates were submitted to the National Student Clearinghouse in fall 2017 to determine their transfer and enrollment status since completing a credential at Harper. Of this group 28.35% (n=891) graduated and did not transfer to another institution of higher education, while 36.68% (n=1153) returned to Harper College for an additional credential. The remaining 34.97% (n=1,099) continued their educational journeys by transferring to other institutions. In closely examining the distribution of students to transfer institutions, slightly more than 50% matriculated into ten schools. Indicated below are the top ten transfer destinations for Harper College graduates in 2017.
Top Ten Transfer Choices for Harper 2017 Graduates Institution Percent of Total Transferred
(N=1099) 1. Northern Illinois University 8.9% (n=98) 2. University of Illinois at Chicago 8.7% (n=96) 3. Illinois State University 6.3% (n=69) 4. Northeastern Illinois University 4.9% (n=54) 5. Roosevelt University 4.8% (n=53) 6. DePaul University 4.8% (n=53) 7. Loyola University - Chicago 4.6% (n=51) 8. University of Illinois at Urbana - Champaign 4.5% (n=49) 9. Elmhurst College 3.3% (n=36) 10. Columbia College - Chicago 2.3% (n=25)
Total enrolled in top ten transfer choices 53.1% (n=584) Source: National Student Clearinghouse

Harper College Fact Book Chapter III: Credit Students
37
End of Term Distance Learning
Exhibit 3.22. FY Credit Hours by Modality
Modality FY 2013 FY 2014 FY 2015 FY 2016 FY 2017 2013-17 5 Year Change
Dual-Credit 7,801 8,168 10,328 13,467 18,170 132.9% Online 20,750 24,354 27,693 29,450 31,943 53.9% Blended 10,329 10,690 10,629 11,391 11,867 14.9% All Other 272,583 272,177 257,161 243,361 228,054 -16.3% Grand Total 311,463 315,390 305,811 297,670 290,035 -6.9%
Source: ICCB AC Files
Exhibit 3.23. Fall Credit Hours by Modality
Modality Fall 2012 Fall 2013 Fall 2014 Fall 2015 Fall 2016 2012-16
5 Year Change Dual-Credit 1,480 1,309 2,148 2,274 2,794 88.8% Online 7,527 8,345 9,429 10,198 11,715 55.6% Blended 3,836 4,282 3,886 4,090 4,328 12.8% All Other 124,455 127,295 120,662 114,512 108,166 -13.1% Grand Total 137,297 141,230 136,124.5 131,074 127,002 -7.5%
Source: ICCB AC Files
Exhibit 3.24. Spring Credit Hours by Modality
Modality Spring 2013
Spring 2014
Spring 2015
Spring 2016
Spring 2017
2013-17 5 Year Change
Dual-Credit 6,290.0 6,828.0 8,170.0 11,096.5 15,320.0 143.56% Online 7,788.0 9,277.0 10,436.0 11,290.0 11,992.0 53.98% Blended 4,299.0 4,092.0 4,432.0 4,475.5 4,561.0 6.09% All Other 114,774.5 112,332.5 106,920.0 101,351.5 96,089.0 -16.28% Grand Total 133,151.5 132,529.5 129,958.0 128,213.5 127,962.0 -3.90%
Source: ICCB AC Files

Harper College Fact Book Chapter III: Credit Students
38
Page left blank intentionally

Harper College Fact Book Chapter IV: Workforce Solutions
39
Chapter IV Workforce Solutions
Continuing Education and Business Outreach
The Workforce Solutions Division section presents a brief description of the division, which is comprised of Continuing Education, which offers open enrollment courses to the community in career training and personal enrichment; the Workforce Certification Center; Harper Business Solutions, which serves local businesses with customized training solutions; Illinois Small Business Development Center; the Job Placement Resource Center, and the Office of Apprenticeships.
Continuing Education
The Continuing Education Department offers classes designed to promote personal growth and provide professional development. This unit of the College responds quickly to needs for new professional skills, trends in leisure activities and advances in technology by providing noncredit and non-degree credit classes and certificates. Students of all ages, from children through older adults, are offered classes that enrich and enhance their lives. Day and evening classes are offered at the main campus and several extension sites within the College’s district.
The following section describes Continuing Education students by program, gender, age group and ethnicity. Additional tables describe the same characteristics segmented by career training and personal enrichment, and the new course creation ratio.

Harper College Fact Book Chapter IV: Workforce Solutions 40
Exhibit 4.1. Enrollment of CE Students by Program by Fiscal Year (Duplicated) Program Area 2013-14 2014-15 2015-2016 2016-2017 NC CSC Total NC CSC Total NC CSC Total NC CSC Total Career Training 3,277 1,157 4,434 3,483 386 3,869 3,254 866 4,120 2,811 951 3,762 Business Professional Development 475 401 876 383 386 769 671 317 988 522 466 988
Career Development 17 17 Online Training 106 0 106 147 147 425 425 363 363 Computer Training 1,196 276 1,472 865 247 1,112 648 171 819 591 184 775 Faculty Development 439 16 455 707 67 774 378 55 433 235 99 334 Harper Business Solutions 385 77 462 75 131 206 110 110 65 65 Health Care Professionals 559 387 946 1,289 229 1,518 1,127 213 1,340 1,095 137 1,232 Small Business Dev. Center 117 0 117 Workforce Certification Ctr 22 22 5 5 5 - 5 Personal Cultural Enrichment 18,372 56 18,428 19,228 56 19,284 18,496 59 18,555 18,854 49 18,903
Community Music and Art Ctr 835 - 835 1,107 - 1,107 1,800 1,800 1,834 1,834 Healthy Living Exercise Program 215 - 215 174 - 174 61 61 - - -
Personal Enrichment 9,132 56 9,188 9,742 56 9,798 8,844 59 8,903 10,959 49 11,008 Wellness and Sports 583 - 583 524 - 524 550 550 485 485 Youth 7,607 - 7,607 7,681 - 7,681 7,241 7,241 5,576 5,576 Total 21,649 1,213 22,862 22,711 1,133 23,844 21,750 925 22,675 21,665 1,000 22,665
Source: Workforce Development NC = noncredit CSC = career skills credit (non-degree credit); Career skills credit enrollments are also counted with the general credit student enrollment information in Chapter III;
The enrollments are duplicated in this chapter to give a more complete view of the activities of Continuing Education.

Harper College Fact Book Chapter IV: Workforce Solutions 41
Exhibit 4.2. Gender of CE Students by Fiscal Year (Unduplicated)
Gender 2013-14 2014-15 2015-2016 2016-2017
N % N % N % N % Female 5,243 45.7% 5,296 43.7% 4,892 41.4% 5,330 39.7% Male 4,762 41.5% 5,482 45.2% 5,185 43.9% 6,538 48.7% Unknown 1,475 12.8% 1,353 11.2% 1,744 14.8% 1,567 11.7% Total 11,480 100.0% 12,131 100.0% 11,821 100.0% 13,435 100.0%
Source: Workforce Development
Exhibit 4.3. Age Groups of CE Students by Fiscal Year (Unduplicated)
Age Group 2013-14 2014-15 2015-16 2016-17 N % N % N % N %
17 and under 1,820 15.9% 1,722 14.2% 1,722 14.6% 1,539 11.5% 18 102 0.9% 106 0.9% 149 1.3% 223 1.7% 19-24 1,419 12.4% 1,674 13.8% 1,665 14.1% 2,379 17.7% 25-34 2,365 20.6% 2,603 21.5% 2,608 22.1% 3,363 25.0% 35-44 1,580 13.8% 1,771 14.6% 1,745 14.8% 1,879 14.0% 45-54 1,520 13. 2% 1,614 13.3% 1,575 13.3% 1,763 13.1% 55-64 1,312 11.4% 1,330 11.0% 1,183 10.0% 1,193 8.9% 65 and over 1,141 9.9% 1,131 9.3% 958 8.1% 994 7.4% Unknown 2,212 1.9% 180 1.5% 216 1.8% 102 0.8% Total 11,480 100.0% 12,131 100.0% 11,821 100.0% 13,435 100.0%
Source: Workforce Development
Exhibit 4.4. Race/Ethnicity of CE Students by Fiscal Year (Unduplicated)
Race/Ethnicity 2013-14 2014-15 2015-16 2016-17 N % N % N % N %
American Indian or Alaskan Native 6 0.1% 10 0.1% 11 0.1% 4 0.0%
Asian 617 5.4% 447 3.7% 374 3.2% 312 2.3% Black 194 1.7% 131 1.1% 115 1.0% 110 0.8% Hispanic 363 3.2% 309 2.5% 285 2.4% 303 2.3% Native Hawaiian or Other Pacific Islander 18 0.2% 10 0.1% 8 0.1% 10 0.1%
Other 567 4.8% 487 3.6% White 3,029 26.4% 2,584 21.3% 2110 17.8% 1,890 14.1% Unknown 7,253 63.1% 8,640 71.2% 8351 70.6% 10,319 76.8% Total 11,480 100.0% 12,131 100.0% 11821 100.0% 13,435 100.0%
Source: Workforce Development

Harper College Fact Book Chapter IV: Workforce Solutions 42
Exhibit 4.5. Gender of Career Training Students (CE) Annual (Unduplicated)
Gender 2013-14 2014-15 2015-16 2016-17 N % N % N % N %
Female 1,635 59.90% 1,785 66.30% 1,737 64.93% 1,603 61.4% Male 717 26.30% 639 23.70% 623 23.29% 854 32.7% Unknown 376 13.80% 267 9.90% 315 11.78% 152 5.8% Total 2,728 100% 2,691 100% 2,675 100% 2,609 100.0%
Source: Workforce Development
Exhibit 4.6. Age Group of Career Training Students (CE) Annual (Unduplicated)
Age Group 2013-14 2014-15 2015-16 2016-17 N % N % N % N %
17 and under 12 0.4% 3 0.1% 23 0.9% 70 2.7% 18 19 0.7% 7 0.3% 16 0.6% 36 1.4% 19-24 437 16.0% 464 17.2% 469 17.5% 601 23.0% 25-34 594 21.8% 615 22.9% 626 23.4% 599 23.0% 35-44 464 17.0% 430 16.0% 426 15.9% 423 16.2% 45-54 538 19.7% 485 18.0% 502 18.8% 413 15.8% 55-64 401 14.7% 424 15.8% 373 13.9% 303 11.6% 65 and over 115 4.2% 167 6.2% 115 4.3% 119 4.6% Unknown 148 5.4% 96 3.6% 125 4.7% 45 1.7% Total 2,728 100.0% 2,691 100.0% 2,675 100.0% 2,609 100.0%
Source: Workforce Development

Harper College Fact Book Chapter IV: Workforce Solutions 43
Exhibit 4.7. Gender of Personal Enrichment Students – CE Annual (Unduplicated)
Gender 2013-14 2014-15 2015-16 2016-17 N % N % N % N %
Female 3,608 41.2% 3,579 37.5% 3,227 34.91% 3,782 34.6% Male 4,045 46.2% 4,878 51.1% 4,580 49.55% 5,717 52.4% Unknown 1,099 12.6% 1,098 11.5% 1,437 15.55% 1,419 13.0% Total 8,752 100.0% 9,555 100.0% 9,244 100% 10,918 100.0%
Source: Workforce Development
Exhibit 4.8. Age Group of Personal Enrichment Students – CE Annual (Unduplicated)
Age Group 2013-14 2014-15 2015-16 2016-17
N % N % N % N % 17 and under 1,808 20.7% 1,720 18.0% 1,699 18.4% 1,470 13.5% 18 83 0.9% 99 1.0% 134 1.4% 187 1.7% 19-24 982 11.2% 1,218 12.7% 1,209 13.1% 1,786 16.4% 25-34 1,771 20.2% 2,006 21.0% 2,003 21.7% 2,777 25.4% 35-44 1,116 12.8% 1,359 14.2% 1,325 14.3% 1,472 13.5% 45-54 983 11.2% 1,144 12.0% 1,089 11.8% 1,363 12.5% 55-64 911 10.4% 928 9.7% 825 8.9% 909 8.3% 65 and over 1,026 11.7% 991 10.4% 864 9.3% 897 8.2% Unknown 72 0.8% 90 0.9% 96 1.0% 57 0.5% Total 8,752 100.0% 9,555 100.0% 9,244 100.0% 10,918 100.0%
Source: Workforce Development

Harper College Fact Book Chapter IV: Workforce Solutions 44
Exhibit 4.9. Annual New Course Creation Ratio
Program Area 2013-14 2014-15 2015-16 2016-17
Courses New % New
Courses New % New
Courses New % New
Courses New % New Offered Courses Offered Courses Offered Courses Offered Courses
Career Training 274 95 34.7% 285 109 38.2% 342 169 49.4% 342 120 35.1%
Business Professional Dev 80 27 33.8% 88 25 28.4% 65 25 38.5% 67 25 37.3%
Computer Training 127 32 25.2% 111 24 21.6% 118 46 39.0% 116 22 19.0% Faculty Development 0 0 0.0% 46 41 89.1% 31 25 80.6% 32 29 93.5% Harper Business Solutions 12 8 66.7% 10 8 80.0% 5 2 40.0% 1 0 0.0% Health Care Professionals 32 9 28.1% 30 11 36.7% 35 8 22.9% 29 3 10.3% Online Courses 53 28 52.8% 93 40 43.0% Workforce Certification Center 23 19 82.6% 0 0 0.0% 35 35 100.0% 4 1 25.0% Personal Cultural Enrichment 752 343 45.6% 713 309 43.3% 773 407 52.7% 752 381 50.7% Community Music and Art Center 67 2 3.0% 178 80 44.9% 186 112 60.2% 214 115 53.7% Healthy Living Exercise Program 0 0 0.0% 1 0 0.0% 1 0.0% 0 0 0.0% Personal Enrichment 488 308 63.1% 337 202 59.9% 384 253 65.9% 342 230 67.3% Wellness and Sports 27 2 7.4% 27 2 7.4% 23 2 8.7% 24 6 25.0% Youth 170 31 18.2% 170 25 14.7% 179 40 22.3% 172 30 17.4% Total 1,026 438 42.7% 998 418 41.9% 1115 576 51.7% 1,094 501 45.8%
Source: Workforce Development

Harper College Fact Book Chapter IV: Workforce Solutions 45
Workforce Certification Center Harper College partners with leading certification testing providers to offer secure, reliable and convenient online testing for our community. Harper Workforce Certification Center at the Harper Professional Center (HPC) in Schaumburg brings together state-of-the-art technology and user-friendly service to give the best possible testing environment.
• Secure certification testing in our high tech labs • Group testing for your company or organization • Test and certification preparation training • Workforce skills development and career-specific training • The Harper Mobile Unit: A mobile testing center and computer classroom on wheels
Exhibit 4.10. Workforce Certification Center Highlights Workforce Certification Center 2012-13 2013-14 2014-15 2015-16 2016-17 Testing Volume n/a 1,020 3,698 5,095 5,206 Gross Revenue $1,684 $28,230 $45,715 $65,985 $69,617
Source: Workforce Development

Harper College Fact Book Chapter IV: Workforce Solutions 46
Harper Business Solutions Harper Business Solutions brings quality customized training solutions to organizations. Training can be provided at the company’s location, at times and days convenient for the company and its employees. Tailored and customized classes (credit or non-credit) are available in a wide range of content areas including Leadership Development, IT/Computer Skills, Staff Professional Development, and Specialized Industrial Skills.
Exhibit 4.11. Harper Business Solutions Harper Business Solutions (HBS) Revenue/Participants 2012-2013 2013-2014 2014-2015 2015–2016 2016–2017
HBS Revenue $788,980 $732,728 $638,766 $631,740 $406,104
State Grant Funds (included in HCT Revenue amount) $26,300 $158,650 $23,650 $0 $0
Businesses Served (unduplicated) 35 36 36 33 29 New Businesses Served (incl. those not served in last 3 FY) 7 12 17 7 6
Number of Training Classes (all) 440 363 346 304 265 Classes for Harper employees only 23 33 27 17 9 Number of Courses (unduplicated, not included in class count) 13 13 10 7 16
1.6 Courses Delivered 10 9 9 7 9 Credit Courses Delivered 3 4 1 0 7
Employees Trained (classes and courses, duplicated) 4,618 4,921 4,215 3,414 3,297
Harper employees in Harper only classes 452 439 321 174 124
1.6 Students 113 89 88 65 70 Credit Students 6 5 25 0 7
Source: Workforce and Economic Development

Harper College Fact Book Chapter IV: Workforce Solutions 47
Illinois Small Business Development Center The Illinois Small Business Development Center at Harper College offers confidential one-on-one business consulting at no cost and affordable training seminars. Consultants work with small and mid-sized entrepreneurs to solve management, marketing, and operational issues in order to build a successful, sustainable business. It is funded through a cooperative agreement with the US Small Business Administration, the State of Illinois, and Harper College.
Exhibit 4.12. Small Business Development Center (SBDC) Performance Indicator 2014/2015 2015/2016 2016/2017
Economic Impact Number of jobs created 74 106 98 Number of jobs retained 144 28 136 Number of businesses started 36 28 32 Number of Business Expansions 17 21 Number of client loans secured 16 13 8 Dollars in debt funding secured 1.367M 1.658M 1.128M Number of projects with non-debt 29 60 46 Dollars in non-debt funding secured 1.02M 1.9M 2.2M Total Capitalization 2.387M n/a 3.328M Business Advising
Total Clients 270 296 354 Number of Woman Owned Businesses 59 47 63 Number of Minority Owned Businesses 38 n/a 57 Total center counseling hours 1,445 1,327 1,168
Training/Outreach Number training workshops 59 55 48 Number of training attendees 539 n/a 453 Number of community/outreach events 52 n/a n/a Professional Development Number of hours/staff training 98 83 104
Source: Workforce and Economic Development

Harper College Fact Book Chapter IV: Workforce Solutions 48
Harper College Job Placement Resource Center
The Job Placement Resource Center (JPRC) is committed to helping Harper students and alumni become job search ready. Resources include assistance with resumes, interviewing, soft or essential skills employers want and job search. Over 400 jobs are available on the job management system each month for part-time, full-time, internships/co-ops and seasonal jobs. In addition, there are additional resources available on the JPRC website.
Exhibit 4.13. Job Placement Resource Center (JPRC)
Job Placement Resource Center
Fall 2015 July
through December
2015
Spring 2016
January through
June 2016
Fall 2016 July
through December
2016
Spring 2017
January through
June 2017
No. of Students served (duplicated) No. of appointments 328 374 262 351
No. of Walk-ins (inc Resume Wednesdays) 182 290 259 282 No. of resumes reviewed via email 575 747 487 634
No. New Employers listed on College Central 7/16 Symplicity 766 838 772 802
No. Jobs Posted 2,239 2,067 2,022 2,096 No. Resumes reviewed by employers (duplicated) 1,520 1,672 1,150 2,214
No. of Classroom presentations / No. of students reached 123/1,674 98/2,365 86/1,488 88/1,379
No. of Information tables & POP-Ups/ No. students reached 19/1,333 19/1,112 15/1,208 21/1,090
No. of Employer visits/meetings 251 183 37* 0*
No. of Faculty/Coordinator Meetings 47 20 19 7
Targeted Job Fairs/ No. students Manufacturing 34
CNA 91 140 Business 79 50
Health Careers 82 49 HVAC/Electronics 22
Summer /Part Time 84
No. of students reported placed in Jobs 68 83 50 104 cumulative total since JPRC inception - Sp2014
* No longer employed the Job Placement Specialist Source: Workforce and Economic Development

Harper College Fact Book Chapter V: Finances 49
Chapter V Finances
Exhibit 5.1. Tuition Rates per Credit Hour by Residency Status 2013-14 2014-15 2015-16 2016-17 2017-18
Resident $108.50 $110.25 $113.75 $119.25 $125.00
Non Residents $365.50 $367.25 $370.75 $376.25 $382.00
Out-of-State $441.00 $442.75 $446.25 $451.75 $457.50
International Students $441.00 $442.75 $446.25 $451.75 $457.50
Source: Harper College Website
$0.00
$50.00
$100.00
$150.00
$200.00
$250.00
$300.00
$350.00
$400.00
$450.00
$500.00
Resident Non Residents Out-of-State International Students
2013-14 2014-15 2015-16 2016-17 2017-18

Harper College Fact Book Chapter V: Finances 50
Exhibit 5.2. Operating Funds Revenues HARPER COLLEGE, COMMUNITY COLLEGE DISTRICT NO. 512
For the year ended June 30, 2017
Operations and Total Education Maintenance Operating Operating Revenue by Source Fund Fund Funds
Local Government Revenue Local taxes $43,038,654 $13,695,182 $56,733,836 Chargeback revenue 59,439 59,439 CPPRT 1,036,684 1,036,684 Total Local Government Revenue 44,134,777 13,695,182 57,829,959
State Government Revenue ICCB Credit Hour grants 7,342,892 7,342,892 Other 1,075,917 1,075,917 Total State Government Revenue 8,418,809 - 8,418,809
Federal Government Revenue Department of Education 28,033 28,033 Other 1,542 1,542 Total Federal Government Revenue 29,575 - 29,575
Student Tuition and Fees Tuition 37,062,583 37,062,583 Fees 5,180,336 2,108,679 7,289,015
Other student assessments (AED) 2,639,119 2,639,119
Total Student Tuition and Fees 44,882,038 2,108,679 46,990,717
Other sources Sales and service fees 408,239 - 408,239 Rental income - 63,587 63,587 Investment revenue 279,444 143,046 422,490 Other 126,566 417 126,983 Total Other Revenue 814,249 207,050 1,021,299
Total Revenue $98,279,448 $16,010,911 $114,290,359
Other financing sources Transfers from other funds - Adjusted Revenue $98,279,448 $16,010,911 $114,290,359
Source: Harper College Finance Department

Harper College Fact Book Chapter V: Finances 51
Harper College, Community College District No. 512 Operating Funds Revenues
Local Gov't$57,829,959
State Gov't$8,418,809
Federal Gov't$29,575
Tuition and Fees$46,990,717
Other Revenue$1,021,299

Harper College Fact Book Chapter V: Finances 52
Exhibit 5.3. Operating Funds Expenditures HARPER COLLEGE, COMMUNITY COLLEGE DISTRICT NO. 512
For the year ended June 30, 2017 Operations and Total Education Maintenance Operating Fund Fund Funds Operating Expenditures By Program
Instruction $36,624,960 - $36,624,960 Academic support 7,905,454 - 7,905,454 Student services 12,078,138 - 12,078,138
Public service / continuing education 111,814 - 111,814
Operations and maintenance - $12,838,536 12,838,536
Institutional support 24,158,241 2,031,201 26,189,442 Scholarships/grants/waivers 6,089,091 - 6,089,091
Total Operating Expenditures 86,967,698 14,869,737 101,837,435
Other financing uses Transfers to other funds 10,460,663 1,000,000 11,460,663 Adjusted Operating Expenditures 97,428,361 15,869,737 113,298,098 Operating Expenditures By Object Salaries 59,191,495 6,062,561 65,254,056 Employee benefits 11,003,570 1,534,800 12,538,370 Contractual services 4,515,639 2,537,204 7,052,843
General materials and supplies 3,736,453 780,037 4,516,490
Conference and meeting expense 819,335 6,044 825,379
Fixed charges 333,285 231,835 565,120 Utilities 1,092 3,182,759 3,183,851 Capital outlay 506,724 534,497 1,041,221 Other 6,860,105 - 6,860,105
Total Operating Expenditures $86,967,698 $14,869,737 $101,837,435 Other financing uses Transfers to other funds 10,460,663 1,000,000 11,460,663 Adjusted Operating Expenditures $97,428,361 $15,869,737 $113,298,098
Source: Harper College Finance Department

Harper College Fact Book Chapter V: Finances 53
Harper College, Community College District No. 512 Operating Funds Expenditures
Instruction$36,624,960
Academic support$7,905,454
Student services$12,078,138
Public service/continuing
education$111,814
Operations and maintenance$12,838,536
Instuctional Support$26,189,442
Scholarships/grants/waivers$6,089,091
Transfers$11,460,663

Harper College Fact Book Chapter V: Finances 54
Exhibit 5.4. Historical Assessed Valuations and Taxes Extended HARPER COLLEGE
COMMUNITY COLLEGE DISTRICT NO. 512 Governmental Fund Types 2012 2013 2014 2015 2016 Equalized Assessed Valuations (000’s) 19,011,750 16,642,049 16,824,424 16,469,953 18,916,544 Tax Rates: Education Fund 0.2007 0.2368 0.2434 0.2548 0.2428
Operations & Maintenance Fund 0.0853 0.0974 0.0937 0.0932 0.0660
Bond & Interest Fund 0.0882 0.1090 0.1123 0.1118 0.1058
Audit Fund 0.0001 0.0001 0.0001 0.0001 0.0001
Liability, Protection, & Settlement Fund 0.0001 0.0001 0.0001 0.0001 0.0001
Total 0.3744 0.4434 0.4496 0.4600 0.4148 Taxes Extended: Education Fund 38,156,583 39,408,371 40,950,648 41,960,211 45,920,503
Operations & Maintenance Fund 16,217,023 16,209,355 15,764,485 15,357,235 12,481,501
Bond & Interest Fund 16,770,847 18,138,003 18,894,721 18,416,477 20,006,430 Audit Fund 19,011 16,642 16,824 15,454 17,735
Liability, Protection, & Settlement Fund 19,011 16,642 16,824 15,454 17,735
Total 71,182,475 73,789,013 75,643,502 75,764,831 78,443,904 Source: Harper College Finance Department

Harper College Fact Book Chapter V: Finances 55
Harper College Comprehensive Annual Financial Report 2016-2017 The Comprehensive Annual Financial Report represents the financial standing of the College including the annual audit. The College maintains its accounts and prepares its financial statements in accordance with generally accepted accounting principles (GAAP) as set forth by the Government Accounting Standards Board (GASB), and the Illinois Community College Board (ICCB). http://goforward.harpercollege.edu/about/leadership/planning/pdf/Harper-College-CAFR-2017.pdf

Harper College Fact Book Chapter V: Finances 56
Page left blank intentionally

Harper College Fact Book Chapter VI: Facilities 57
Chapter VI Facilities
Harper College Campus Map

Harper College Fact Book Chapter VI: Facilities 58
Additional Locations Harper College Locations
Harper Professional Center (HPC) 650 E. Higgins Road Schaumburg, IL 60173 847.925.6066
Learning and Career Center (LCC) 1375 S. Wolf Road Prospect Heights, IL 60070 847.925.6212
Northwest Community Hospital 800 W. Central Road Arlington Heights, IL 60005 847.618.1000
Additional Services and Life Long Learning Locations
Addolorata Villa (ADV) 555 McHenry Road Wheeling, IL 60090 847.537.2900
Arlington Heights Senior Center (AHSC) 1801 West Central Road Arlington Heights, IL 60005 847.253.5532
Brookdale Des Plaines (BPDP) 800 South River Road Des Plaines, IL 60016 847.294.0119
Capelli Academy (CAPA) 333 E. Rand Road Arlington Heights, IL 60004 847.749.1416
CLEC Enterprises, Inc. (CLEC) 5105 Tollview Drive, Suite 270 Rolling Meadows, IL 60008 779.220.1343
Eagle Training Services (ETS) 1095 Pingree Rd, Suite 217 Crystal Lake, IL 60014 847.854.3218
Elevated Safety (ELVS) Training conducted at: Northeastern IL Public Safety Training Academy 2300 Patriot Boulevard Glenview, IL 60026 847.998.8090
Elgin Community College (ECC) 1700 Spartan Drive Elgin, IL 60123 847.697.1000
Flight Fitness Studio/Palatine (FFSP) 583 E. Dundee Road Palatine, IL 60074 847.274.3163
Friendship Village (FVS) 350 West Schaumburg Road Schaumburg, IL 60194 847.884.5539
Forest View Educational Center (FVEC) 2121 S. Goebbert Road Arlington Heights, IL 60005 847.718.7704
The Garlands (GAR) 1000 Garlands Lane Barrington, IL 60010 847.756.3200
The Grooming Lodge of Arlington Heights 1551 W Campbell Street Arlington Heights, IL 60005 847.398.9171
John Hersey High School 1900 E. Thomas St. Arlington Heights, IL 60004 847.718.4800
Higgins Educational Center (HEC) 1030 W Higgins Road Hoffman Estates, IL 60169 847.755.6640

Harper College Fact Book Chapter VI: Facilities 59
Additional Services and Life Long Learning Locations
Highland Woods Golf Course (HWGC) Forest Preserve District of Cook County 2775 N Ela Road Hoffman Estates, IL 60169 847.359.5850
Hoffman Estates Park District – Triphahn Ctr (HETC) 1685 W Higgins Road Hoffman Estates, IL 60169 847.885.7500
Hoffman Estates Park District-Willow Rec Ctr (HEWR) 3600 Lexington Drive Hoffman Estates, IL 60192 847.285.5440
Maxim Entertainment Group (MEG) 2400 West Hassell Road, Suite 430 Hoffman Estates, IL 60169 847.490.2102
Rock Cut State Park (RCSP) 7223 West Lane Road Loves Park, IL 61111 815.885.3311
Spring Valley Nature Center (SVNS) 1111 E. Schaumburg Road Schaumburg, IL 60194 847.985.2115
Sueval Studios (SUST) 870 S. Arthur Avenue Arlington Heights, IL 60005 877.986.2766
For updated information on the locations, see link below: http://goforward.harpercollege.edu/ce/information/pdf/location%20list%20update%20June%202017.pdf
For information on the motorcycle training site locations, see link below: http://goforward.harpercollege.edu/ce/mse/motorcycle_locations.php

Harper College Fact Book Chapter VI: Facilities 60
Exhibit 6.1. Campus Buildings and Acceptance Dates and Gross Square Feet
Building Name Acceptance Dates Gross Square Footage
Building A 1969 132,035 Building B 1969 (additions 1984 & 2005) 27,361 Building C 1969 23,244 Building D 1969 (add. 1974, 1985, 2015) 140,236 Building E 1969 14,741 Building F 1969 101,989 Building G (Parking Garage) 2015 284,933 Building H 1977 (addition 2015) 98,272 Buildings I, J 1980 94,458 Building L 1994 89,675 Building M (Wellness and Sports Center) 1980 101,150 Building O (Observatory) 1990 910 Building P 1974 25,871 Building R (Performing Arts Center) 2002 44,805 Building S 1993 13,690 Building T 1973 5,576 Building U 1974 3,007 Building V 1974 13,694 Building W (Wojcik Conference Center) 2002 51,861 Building X (Health Careers Center) 2004 97,395 Building Y (Center for Emerging Technology) 2004 52,792 Building Z (Science Center) 2004 141,583 (HPC) Harper Professional Center 1982 (purchased in 2001) 41,536 (LCC) Learning & Career Center 1973 (purchased in 1994) 54,516 Total Square Feet (Owned) 1,655,330
Source: 2017 Submission to ICCB

Harper College Fact Book Chapter VI: Facilities 61
Exhibit 6.2. Square Footage of Facilities Fiscal Years 2016-2017
Room Use Square Feet Classroom 302,932 Laboratory 236,477 Office 158,977 Study 37,980
Special Use Athletic/P.E. 61,726
All Other Special Use Facilities 10,783
General Use 95,863 Supporting Facilities 332,380 Health Care 2,484 Unclassified Facilities 7,499 Total Net Assignable Square Footage 1,247,101 NASF/GSF Ratio 69.0% Total Gross Square Footage (Overall) 1,813,077
Source: Table C3 Facilities Data compiled by ICCB from data submission 2017
Exhibit 6.3. Land and Parking Summary Fiscal Years 2016-2017
Category Acres Landscaped Grounds 74.4 Physical Education and Athletic Fields 12.8 Building and Attached Structure 16.1 Experimental Plots 7.5 Other Instructional Areas 0 Parking Lots 39.8 Total Number of Parking Spaces on Campus 5,463 Number of Parking Spaces Listed on “Parking Lots” in
which the State Participated 2,579
Roadways 13.5 Pond Retention and Drainage 12.3 Other 11.8 Total Assigned Area 188.2 Currently Unassigned 0 Total Acres 188.2 Number of Acres Paid by the State 90.6
Source: Physical Plant (Table C1.3)

Harper College Fact Book Chapter VI: Facilities 62
Page left blank intentionally

Harper College Fact Book Chapter VII: Human Resources 63
Chapter VII Human Resources
Exhibit 7.1. Employee Headcount and Full-Time Equivalent (FTE) by Fall Census
Group Headcount Full-Time Equivalent (FTE) 2017 2016 2015 2014 2013 2017 2016 2015 2014 2013
Teaching Faculty 671 695 742 785 819 359.7 370.3 387.3 401.7 410.3 Staff 810 813 875 865 857 608.7 596.3 633.7 629.0 606.3 Total 1,481 1,508 1,617 1,650 1,676 968 967 1,021 1,031 1,017
Source: Fall Human Resources Census - ICCB C1 File and IPEDS Human Resources Survey
Exhibit 7.2. Full-Time and Part-Time Employee Status by Occupational Category* and Fall Census
Occupational Category Full-Time Headcount Part-Time Headcount 2017 2016 2015 2014 2013 2017 2016 2015 2014 2013
Instructional Staff 204 208 210 210 206 467 487 532 575 613 Librarians 14 15 17 17 16 13 12 20 18 16 Student and Academic Affairs and Other Education Services 29 28 34 31 28 37 43 83 23 62 Management 36 30 38 51 34 0 0 0 Business and Financial Operations 48 49 52 43 49 6 9 27 14 14 Computer, Engineering, and Science 76 77 72 70 70 12 12 14 15 14 Community Service, Legal, Arts, and Media 121 103 83 95 86 91 106 70 118 95 Healthcare Practitioners and Technical 1 2 3 1 2 94 93 92 97 97 Service Occupations 106 107 116 111 107 8 10 12 15 17 Sales and Related Occupations 22 19 24 11 15 5 5 5 3 17 Office and Administrative Support 55 58 74 81 74 36 35 39 51 44 Total 712 696 723 721 687 769 812 894 929 989
Source: Fall Human Resources Census - ICCB C1 File and IPEDS Human Resources Survey

Harper College Fact Book Chapter VII: Human Resources 64
Exhibit 7.3. Full-Time Equivalent by Occupational Category* and Fiscal Year
Occupational Category Full-Time Equivalent (FTE) 2017 2016 2015 2014 2013
Instructional Staff 359.7 370.3 387.3 401.7 410.3 Librarians 18.3 19.0 23.7 23.0 21.3 Student and Academic Affairs and Other Education Services 41.3 42.3 61.7 38.7 48.7
Management 36.0 30.0 38.0 51.0 34.0 Business and Financial Operations 50.0 52.0 61.0 47.7 53.7 Computer, Engineering, and Science 80.0 81.0 76.7 75.0 74.7 Community Service, Legal, Arts, and Media 151.3 138.3 106.3 134.3 117.7 Healthcare Practitioners and Technical 32.3 33.0 33.7 33.3 34.3 Service Occupations 108.7 110.3 120.0 116.0 112.7 Sales and Related Occupations 23.7 20.7 25.7 12.0 20.7 Office and Administrative Support 67.0 69.7 87.0 98.0 88.7 Total 968.3 966.7 1,021.0 1,030.7 1,016.7
Source: Fall Human Resources Census - ICCB C1 File and IPEDS Human Resources Survey
Exhibit 7.4. Full-Time and Part-Time Employees at Fall Census by Employee Type and Fiscal Year Employee Type 2017 2016 2015 2014 2013
Academic Support 44 45 52 56 58 Administrative 41 44 50 51 45 Classified 187 191 231 234 250 Custodial/Maintenance 97 101 111 111 110 Professional/Technical 173 163 163 164 144 Supervisory 95 87 93 92 88 Teaching Faculty 671 695 742 785 819 Other* 173 182 175 157 162 Total 1,481 1,508 1,617 1,650 1,676
Source: Fall Human Resources Census - ICCB C1 File
*Other includes Coaches, Tutors & Health Careers Clinical Supervisors

Harper College Fact Book Chapter VII: Human Resources 65
Exhibit 7.5. Fall 2017 Employee Census by Employee Type and Full-Time/Part-Time Status
Employee Type Full-Time Part-Time Total
N % N % N Academic Support 18 40.9% 26 59.1% 44 Administrative 41 100.0% 0 0.0% 41 Classified 119 63.6% 68 36.4% 187 Custodial-Maintenance 89 91.8% 8 8.2% 97 Professional-Technical 147 85.0% 26 15.0% 173 Supervisory 94 98.9% 1 1.1% 95 Teaching Faculty 204 30.4% 467 69.6% 671 Other 0 0.0% 173 100.0% 173 Total 712 48.1% 769 51.9% 1,481
Source: Fall Human Resources Census - ICCB C1 File *Other includes Coaches, Tutors & Health Careers Clinical Supervisors
Exhibit 7.6. Fall 2017 Employee Census by Employee Type and Gender
Employee Type Male Female Total
N % N % N Academic Support 12 27.3% 32 72.7% 44
Administrative 15 36.6% 26 63.4% 41 Classified 33 17.6% 154 82.4% 187
Custodial-Maintenance 69 71.1% 28 28.9% 97 Professional-Technical 73 42.2% 100 57.8% 173
Supervisory 37 38.9% 58 61.1% 95 Teaching Faculty 342 51.0% 329 49.0% 671
Other 46 26.6% 127 73.4% 173 Total 627 42.3% 854 57.7% 1,481
Source: Fall Human Resources Census - ICCB C1 File
*Other includes Coaches, Tutors & Health Careers Clinical Supervisors

Harper College Fact Book Chapter VII: Human Resources 66
Exhibit 7.7. Fall 2017 Employee Census by Employee Type and Race/Ethnicity
Employee Type Asian
American Indian
Alaskan Native
Black or African
American Hispanic or
Latino
Native Hawaiian or Other
Pacific Islander
Multiracial White Unknown Total
N % N % N % N % N % N % N % N % N Academic Support 0 0.0% 0 0.0% 3 6.8% 3 6.8% 0 0.0% 0 0.0% 35 79.5% 3 6.8% 44 Administrative 0 0.0% 0 0.0% 5 12.2% 1 2.4% 0 0.0% 2 4.9% 31 75.6% 2 4.9% 41 Classified 10 5.3% 0 0.0% 9 4.8% 14 7.5% 0 0.0% 5 2.7% 148 79.1% 1 0.5% 187 Custodial-Maintenance 4 4.1% 0 0.0% 6 6.2% 24 24.7% 0 0.0% 1 1.0% 59 60.8% 3 3.1% 97
Professional-Technical 13 7.5% 0 0.0% 5 2.9% 24 13.9% 1 0.6% 2 1.2% 127 73.4% 1 0.6% 173
Supervisory 3 3.2% 0 0.0% 4 4.2% 4 4.2% 0 0.0% 2 2.1% 76 80.0% 6 6.3% 95 Teaching Faculty 32 4.8% 0 0.0% 16 2.4% 29 4.3% 1 0.1% 2 0.3% 532 79.3% 59 8.8% 671 Other* 6 3.5% 0 0.0% 0.0% 6 3.5% 0 0.0% 5 2.9% 67 38.7% 89 51.4% 173 Total 68 4.6% 0 0.0% 48 3.2% 105 7.1% 2 0.1% 19 1.3% 1,075 72.6% 164 11.1% 1,481
Source: Fall Human Resources Census - ICCB C1 File
*Other includes Coaches, Tutors & Health Careers Clinical Supervisors

Harper College Fact Book Chapter VII: Human Resources 67
Exhibit 7.8. Fall 2017 Employee Census by Employee Type and Highest Degree Earned
Employee Type Associate Bachelors Masters Doctoral None Unknown Total N % N % N % N % N % N % N
Academic Support 0 0.0% 1 2.3% 41 93.2% 1 2.3% 1 2.3% 0 0.0% 44 Administrative 0 0.0% 8 19.5% 25 61.0% 8 19.5% 0.0% 0 0.0% 41 Classified 0 0.0% 0 0.0% 0 0.0% 0 0.0% 0 0.0% 187 100.0% 187 Custodial-Maintenance 0 0.0% 0 0.0% 0 0.0% 0 0.0% 0 0.0% 97 100.0% 97
Professional-Technical 4 2.3% 56 32.4% 54 31.2% 1 0.6% 56 32.4% 2 1.2% 173
Supervisory 1 1.1% 31 32.6% 40 42.1% 3 3.2% 20 21.1% 0 0.0% 95 Teaching Faculty 8 1.2% 87 13.0% 417 62.1% 114 17.0% 45 6.7% 0 0.0% 671 Other* 0 0.0% 0 0.0% 0 0.0% 0 0.0% 0 0.0% 173 100.0% 173 Grand Total 13 0.9% 183 12.4% 577 39.0% 127 8.6% 122 8.2% 459 31.0% 1,481
Source: Fall Human Resources Census - ICCB C1 File
*Other includes Coaches, Tutors & Health Careers Clinical Supervisors

Harper College Fact Book Chapter VII: Human Resources 68
Page left blank intentionally

Harper College Fact Book Chapter VIII: Support Services 69
Chapter VIII Support Services
Academic Support Services
Exhibit 8.1. Resources for Learning
Library Services 2012-13 2013-14 2014-15 2015-16 2016-17 * Patron Services
Print and Media Circulation 49,075 49,695 42,659 41,208 16,833 E-Resource Searches 1,327,044 1,349,247 1,339,558 1,215,834 903,629 Reference Requests 21,376 21,165 19,541 20,998 11,256 Library Instruction:
Class Supported 336 371 307 295 251 ** Students Served 5,497 5,993 5,654 5,134 4,689 **
Resource Sharing 12,011 10,430 10,987 10,383 6,827 Provided to Other Libraries 9,410 7,798 8,301 7,943 4,662 Received from Other Libraries 2,601 2,632 2,686 2,440 2,165 Gate Count 865,427 705,883 714,068 1,822,221 ***
Collections (Titles) Print Collection 139,600 127,123 129,519 118,321 119,761 Electronic Resources 35,078 35,130 128,432 571,798 835,935 Media Resources 38,537 29,043 24,126 22,250 20,478 Microfilm 38 38 73 73 73
Source: Library Services, Provost Office
* Numbers were effected due to delayed awareness of the new Library temporary locations in D-102 and H-130.
Two-thirds (2/3) of the book collection is being housed in offsite storage.
** Numbers effected due to lack of a dedicated instruction room. Most labs could only accommodate 25 students.
Classes with large enrollment required offering two or more sessions.
*** D102 and H130 did not have security gates to tabulate gate count.
Exhibit 8.2. Innovative Instruction Academy for Teaching Excellence 2012-13 2013-14 2014-2015 2015-2016 2016-2017 Workshops and Faculty Consultations 183 81 290 **542 **609 Blackboard Course Websites Supported *6,611 *6,623 *6,417 *6,615 *6,729 Distance Course Development Requests 12 16 30 13 21 Technical Support Requests 4,808 3,568 3,874 3,369 3,834
Source: Academy for Teaching Excellence, Provost Office
* Includes all credit courses and only those CE courses that utilized a Blackboard shell on the server for the year
** Includes additional options for adjunct faculty evaluation process

Harper College Fact Book Chapter VIII: Support Services 70
Exhibit 8.3. Tutoring Center/Success Services/Writing Center
Tutoring Center/Success Services/ Writing Center
2012-13 2013-14 2014-15 2015-16 2016-17 Tutoring Center Total Contacts 28,243 33,462 30,667 36,839 35,263 Student Contacts 25,963 28,805 23,809 27,780 26,517 Computer Usage 2,280 4,657 6,858 9,059 8,746 Success Services Total Contacts 3,456 3,802 7,556 7,657 7,724 Student Contacts 3,311 3,377 4,061 4,122 4,158 Supplemental Instruction 145 425 3,495 3,535 3,566 Writing Center Total Contacts 8,935 9,188 12,162 12,416 9,967 Student Contacts 7,989 8,149 7,146 8,409 6,813 Computer Usage 946 1,039 5,016 4,007 3,154
Source: Tutoring Center/Success Services/Writing Center, Provost Office

Harper College Fact Book Chapter VIII: Support Services 71
Student Support Services
Exhibit 8.4. Student Support Services Support Service Area 2012-13 2013-14 2014-15 2015-16 2016-17 Academic Advising and Counseling Center 80,531 78,073 68,965 52,839 53,431 Student and Community Contacts Access and Disability Services 70,722 79,654 60,342 43,896 38,006
Student and Community Contacts
Assessment Center 39,514 38,149 34,873 28,738* 25,994 Tests Administered Career Development Center 59,000 38,704* 21,636 ** 16,938 19,382
Student, Community, and Employer Contacts
Center for Multicultural Learning 40,412 35,237 26,264 16,679 17,602 Student and Community Contacts Center for New Students and Orientation 67,696 57,894 59,324 59,747 49,887
Student and Community Contacts
Women’s Program 8,947 6,327 8,369 8,312 9,644 Student and Community Contacts
Source: Student Affairs
*The number of testing transactions was significantly impacted by the shift of community proctoring services to the Workforce Certification Center as well as the sender high school districts adjusting their placement testing policies to the introduction of ALEKS in FY15.
**The number of contacts for the Career Development Center (CDC) has been greatly reduced due to the creation of the Job Placement Resource Center (JPRC) in early 2014. The JPRC now handles the bulk of contacts related to job placement assistance that was previously handled by the CDC.

Harper College Fact Book Chapter VIII: Support Services 72
Financial Aid
Exhibit 8.5. Federal and State Financial Aid Support to Students Financial Aid Awards 2012-13 2013-14 2014-15 2015-16 2016-17 Total Number of Awards by Type*+ 9,196 7,594 7,267 6,553 6,943
Pell Grant 3,979 4,150 4093 3,838 3,807 ACG 0 0 0 0 0
Work Study 89 93 77 63 68 SEOG 428 380 529 457 490
Federal Stafford Loan 2,981 1,488 1,270 1,084 1,068 ISAC 1,505 1,322 1,169 984 1,403
IL Vets 214 161 129 127 107 Total Amount of Awards by Type $24,723,517 $23,445,680 $21,828,571 $19,549,173 Pell Grant $12,077,570 $12,764,245 $12,904,210 $12,045,709 $11,619,640 ACG $0 $0 $0 $0 $0
Work Study $196,396 $161,824 $160,380 $163,371 $171,760 SEOG $189,822 $160,871 $166,164 $174,988 $180,176
Federal Stafford Loan $9,718,577 $8,099,632 $6,752,452 $5,618,709 $5,494,148 ISAC $1,869,804 $1,869,804 $1,557,960 $1,275,437 $1,813,138
IL Vets $671,348 $389,304 $287,404 $270,959 $233,951 Source: Financial Aid Office
*Duplicated count (students may receive more than one type award) NOTE: Federal methodology changed for Pell Grant awards in FY07, thus reduced eligibility for application. Also, Federal allocation for Work Study awards reflects a reduction starting in FY07
Exhibit 8.6. Race/Ethnicity of Financial Aid for All Recipients*
Race/Ethnicity 2014-2015 2015-2016 2016-2017 N % N % N %
Asian or Pacific Islander 661 11.1% 519 9.41% 384 7.2% American Indian or Alaskan Native 27 0.5% 17 0.31% 11 0.2% Black 549 9.2% 377 6.83% 282 5.3% Hispanic 1,310 22.0% 1,114 20.19% 800 14.9% White 3,117 52.3% 3,253 58.95% 3,672 68.4% Unknown 294 4.9% 238 4.31% 222 4.1% Total 5,958 100.0% 5,518 100.00% 5,371 100.0%
Source: Financial Aid Office. * Unduplicated counts.