Palaeogeography, Palaeoclimatology, Palaeoecologypeople.rses.anu.edu.au/dedeckker_p/pubs/125.pdf ·...
15
Changes in monsoon and ocean circulation and the vegetation cover of southwest Sumatra through the last 83,000 years: The record from marine core BAR94-42 Sander van der Kaars a,b, ⁎, Franck Bassinot c , Patrick De Deckker d , François Guichard c a Centre for Palynology and Palaeoecology, School of Geography and Environmental Science, Monash University, Victoria, 3800, Australia b Department of Palynology and Climate Dynamics, Albrecht-von-Haller-Institute for Plant Sciences, University of Göttingen, Untere Karspüle 2, 37073 Göttingen, Germany c Laboratoire des Sciences du Climat et L'Environnement, Unité Mixte CNRS–CEA, 91198 Gif-sur-Yvette Cedex, France d Research School of Earth Sciences, The Australian National University, Canberra ACT 0200, Australia abstract article info Article history: Received 28 December 2009 Received in revised form 20 June 2010 Accepted 23 June 2010 Available online 30 June 2010 Keywords: Sumatra Monsoon Ocean circulation Quaternary Vegetation history Palaeoclimate We present the palynological record from deep-sea core BAR94-42 taken offshore of southwest Sumatra in the Indian Ocean. Refinement of a previous age model for the core has been made using 7 additional radiocarbon ages and 29 additional oxygen-isotope measurements. These analyses have substantially improved the previously published chronology, which has enabled revision of the results of sedimentological studies of the core. The pollen and re-interpreted biogenic and terrigeneous data were used to reconstruct monsoon circulation and vegetation of southwest Sumatra over the last 83,000 years (83 kyr). During marine isotope stage (MIS) 5a, southwest Sumatra was covered by rainforest, with open herbaceous swamps lining river courses and surrounding lakes. The SE component of the monsoon was stronger than the NW component, resulting in a humid climate with a short, dry season. During MIS 4, conditions were drier, fire activity increased and the monsoon was generally weaker. This latter pattern persisted until MIS1. The vegetation was most open during MIS 3, between ~52 and 43 kyr; identifying this phase as the driest of the last glacial. An increase in montane trees from ~ 52 kyr indicates the onset of cooler conditions, which lasted until the transition to MIS 1 at about 11.9 kyr. After ~43 kyr, an everwet climate gradually developed as monsoonal circulation intensified and the SE monsoon component became stronger. During this time, closed-canopy rainforest became dominant regionally over southwest Sumatra. Increased monsoonal activity during the early Holocene resulted in increased precipitation, river runoff, sediment discharge and offshore sediment transport from the continental shelf. © 2010 Elsevier B.V. All rights reserved. 1. Introduction Most knowledge of the history of the complex forests of the Indonesian archipelago has been derived from palynological studies, with many pollen records obtained from peat and fluvial swamp deposits in highland and lowland areas (Kershaw et al., 2007). In general, the highland sequences offer mostly continuous records of past changes through the last 40,000 years (40 kyr) and provide clear evidence of cooler glacial conditions, but shed little light on changes in the amount and seasonal distribution of precipitation. By contrast, many of the lowland sequences, although comparable in time-span, are discontinuous and, consequently, often miss (much) of the last glacial period. For some time, what is known of the history of variations in past vegetation and, increasingly, climate of the region has been derived from pollen records from marine cores (Kershaw et al., 2007). These records have provided (relatively) well dated, (mainly) continuous pictures of changes in the lowland tropical forests through glacial–interglacial cycles. In addition, these data are now most often fully integrated with oceanographic reconstructions of sea-surface temperature, salinity (d18Osw) and palaeoproductivity estimates through which past variations in monsoonal activity can be assessed. Previous palynological studies of Sumatra have been limited to the highlands of the centre and north of the island and include Danau Padang at 950 m asl (Morley, 1982), Rawa Sikijang at 1100 m asl (Flenley and Butler, 2001), Danau di Atas at 1535 m asl (Newsome and Flenley, 1988; Stuijts et al, 1988), Pea Bullok at 1400 m asl (Maloney and McCormac, 1995), Pea Sim-sim at 1450 m asl (Maloney, 1980, 1985) and Toa Sipinggan at 1445 m asl (Maloney, 1985). A combination of these records provides a vegetation record covering the last 35 kyr that shows maintenance of near continuous rainforest cover during the last glacial period, including the Last Glacial Maximum (LGM), with clear movement of montane trees to lower altitudes at most of these sites. This indicates cooler conditions than at present during the last glacial period. At Danau di Atas, a temperature lowering of about 6 °C is inferred for the LGM (Newsome and Flenley, 1988; Stuijts et al., 1988). Evidence for human impact in the study area comes from Palaeogeography, Palaeoclimatology, Palaeoecology 296 (2010) 52–78 ⁎ Corresponding author. Centre for Palynology and Palaeoecology, School of Geography and Environmental Science, Monash University, Victoria, 3800, Australia. E-mail address: [email protected] (S. van der Kaars). 0031-0182/$ – see front matter © 2010 Elsevier B.V. All rights reserved. doi:10.1016/j.palaeo.2010.06.015 Contents lists available at ScienceDirect Palaeogeography, Palaeoclimatology, Palaeoecology journal homepage: www.elsevier.com/locate/palaeo
-
Upload
hoangkhuong -
Category
Documents
-
view
214 -
download
0
Transcript of Palaeogeography, Palaeoclimatology, Palaeoecologypeople.rses.anu.edu.au/dedeckker_p/pubs/125.pdf ·...
Palaeogeography, Palaeoclimatology, Palaeoecology 296 (2010) 52–78
Contents lists available at ScienceDirect
Palaeogeography, Palaeoclimatology, Palaeoecology
j ourna l homepage: www.e lsev ie r.com/ locate /pa laeo
Changes in monsoon and ocean circulation and the vegetation cover of southwestSumatra through the last 83,000 years: The record from marine core BAR94-42
Sander van der Kaars a,b,⁎, Franck Bassinot c, Patrick De Deckker d, François Guichard c
a Centre for Palynology and Palaeoecology, School of Geography and Environmental Science, Monash University, Victoria, 3800, Australiab Department of Palynology and Climate Dynamics, Albrecht-von-Haller-Institute for Plant Sciences, University of Göttingen, Untere Karspüle 2, 37073 Göttingen, Germanyc Laboratoire des Sciences du Climat et L'Environnement, Unité Mixte CNRS–CEA, 91198 Gif-sur-Yvette Cedex, Franced Research School of Earth Sciences, The Australian National University, Canberra ACT 0200, Australia
⁎ Corresponding author. Centre for Palynology aGeography and Environmental Science, Monash Univer
E-mail address: [email protected]
0031-0182/$ – see front matter © 2010 Elsevier B.V. Adoi:10.1016/j.palaeo.2010.06.015
a b s t r a c t
a r t i c l e i n f oArticle history:Received 28 December 2009Received in revised form 20 June 2010Accepted 23 June 2010Available online 30 June 2010
Keywords:SumatraMonsoonOcean circulationQuaternaryVegetation historyPalaeoclimate
We present the palynological record from deep-sea core BAR94-42 taken offshore of southwest Sumatra inthe Indian Ocean. Refinement of a previous age model for the core has been made using 7 additionalradiocarbon ages and 29 additional oxygen-isotope measurements. These analyses have substantiallyimproved the previously published chronology, which has enabled revision of the results of sedimentologicalstudies of the core. The pollen and re-interpreted biogenic and terrigeneous data were used to reconstructmonsoon circulation and vegetation of southwest Sumatra over the last 83,000 years (83 kyr). During marineisotope stage (MIS) 5a, southwest Sumatra was covered by rainforest, with open herbaceous swamps liningriver courses and surrounding lakes. The SE component of the monsoon was stronger than the NWcomponent, resulting in a humid climate with a short, dry season. During MIS 4, conditions were drier, fireactivity increased and the monsoon was generally weaker. This latter pattern persisted until MIS1. Thevegetation was most open during MIS 3, between ~52 and 43 kyr; identifying this phase as the driest of thelast glacial. An increase in montane trees from ~52 kyr indicates the onset of cooler conditions, which lasteduntil the transition to MIS 1 at about 11.9 kyr. After ~43 kyr, an everwet climate gradually developed asmonsoonal circulation intensified and the SE monsoon component became stronger. During this time,closed-canopy rainforest became dominant regionally over southwest Sumatra. Increased monsoonalactivity during the early Holocene resulted in increased precipitation, river runoff, sediment discharge andoffshore sediment transport from the continental shelf.
nd Palaeoecology, School ofsity, Victoria, 3800, Australia.u.au (S. van der Kaars).
ll rights reserved.
© 2010 Elsevier B.V. All rights reserved.
1. Introduction
Most knowledge of the history of the complex forests of theIndonesian archipelago has been derived from palynological studies,with many pollen records obtained from peat and fluvial swampdeposits in highland and lowland areas (Kershaw et al., 2007). Ingeneral, the highland sequences offer mostly continuous records ofpast changes through the last 40,000 years (40 kyr) and provide clearevidence of cooler glacial conditions, but shed little light on changes inthe amount and seasonal distribution of precipitation. By contrast,many of the lowland sequences, although comparable in time-span,are discontinuous and, consequently, often miss (much) of the lastglacial period. For some time, what is known of the history ofvariations in past vegetation and, increasingly, climate of the regionhas been derived from pollen records from marine cores (Kershaw etal., 2007). These records have provided (relatively) well dated,(mainly) continuous pictures of changes in the lowland tropical
forests through glacial–interglacial cycles. In addition, these data arenow most often fully integrated with oceanographic reconstructionsof sea-surface temperature, salinity (d18Osw) and palaeoproductivityestimates through which past variations in monsoonal activity can beassessed.
Previous palynological studies of Sumatra have been limited tothe highlands of the centre and north of the island and includeDanau Padang at 950 m asl (Morley, 1982), Rawa Sikijang at 1100 masl (Flenley and Butler, 2001), Danau di Atas at 1535 m asl(Newsome and Flenley, 1988; Stuijts et al, 1988), Pea Bullok at1400 m asl (Maloney and McCormac, 1995), Pea Sim-sim at 1450 masl (Maloney, 1980, 1985) and Toa Sipinggan at 1445 m asl(Maloney, 1985). A combination of these records provides avegetation record covering the last 35 kyr that shows maintenanceof near continuous rainforest cover during the last glacial period,including the Last Glacial Maximum (LGM), with clear movement ofmontane trees to lower altitudes at most of these sites. Thisindicates cooler conditions than at present during the last glacialperiod. At Danau di Atas, a temperature lowering of about 6 °C isinferred for the LGM (Newsome and Flenley, 1988; Stuijts et al.,1988). Evidence for human impact in the study area comes from
53S. van der Kaars et al. / Palaeogeography, Palaeoclimatology, Palaeoecology 296 (2010) 52–78
two sites where swidden cultivation (slash-and-burn) of dry (non-irrigated) rice or root crops are inferred as early as 8.2 kyr BP atDanau di Atas (Newsome and Flenley, 1988) and 8 kyr BP at PeaBullok (Maloney and McCormac, 1995).
In southwest Sumatra palynological studies are lacking and thenearest sites are located on West Java and include Rawa Danau at90 m asl (van der Kaars et al, 2001a,b; Turney et al., 2006), SituBayongbong at 1300 m asl (Stuijts, 1984, 1993; Stuijts et al., 1988) andBandung Basin at 665 m asl (van der Kaars and Dam, 1995, 1997; vander Kaars, 1998). The record from the highland site at SituBayongbong provides considerable evidence for the maintenance ofrainforest and significant movement of montane trees to loweraltitudes during the last glacial period. At the lower altitude sites,Rawa Danau and Bandung Basin, increased representation of montaneelements are also recorded during the last glacial period. However, atboth these locations, it appears that, during the last glacial, closed-canopy forest vegetation was at least partly replaced by opengrasslands (van der Kaars et al, 2001a,b; Turney et al., 2006; van derKaars and Dam, 1995, 1997; van der Kaars, 1998).
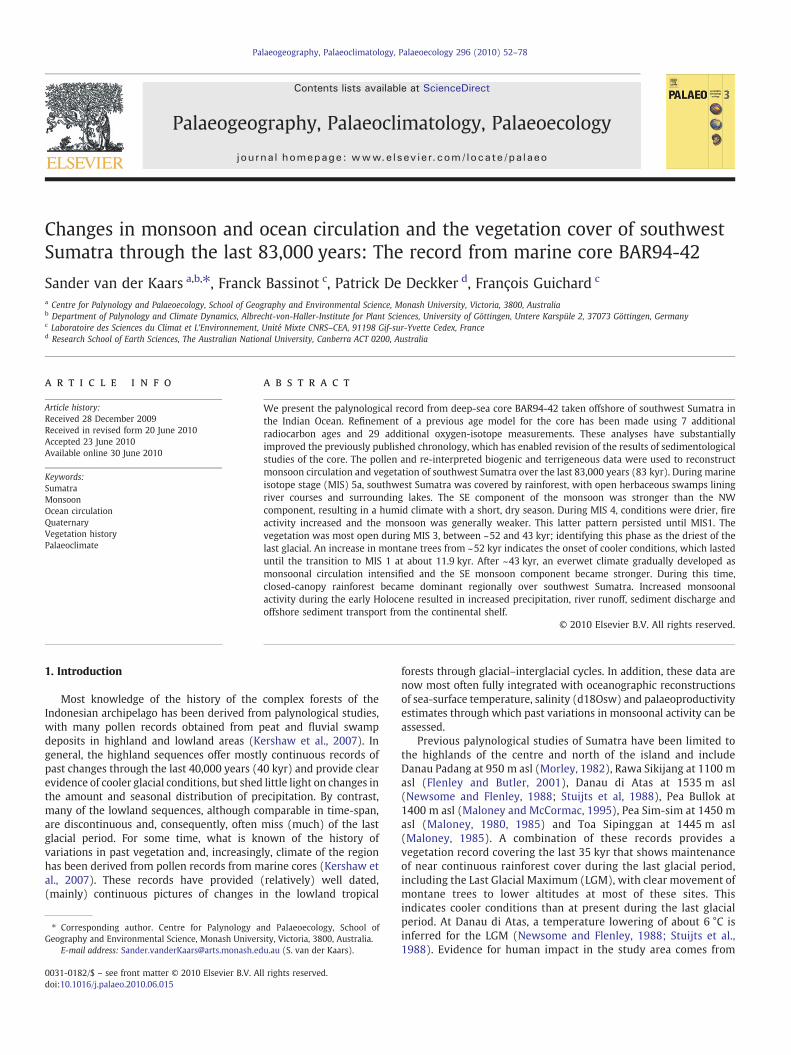
Marine core BAR94-42 (Fig. 1) has been the focus of a number ofstudies (see De Deckker and Gingele, 2002; Gingele et al., 2002) andcovers the last 83 kyr. In this present paper, we report on the results ofpalynological analysis of this core, and provide a continuous record ofvegetation change for southwest Sumatra covering the past 83 kyr,thereby extending the known vegetation history of Sumatra by anadditional 45 kyr. The results will be discussed in conjunction with arevised interpretation of the results of Gingele et al. (2002) in order toreconstruct monsoonal circulation and aspects of the concurrentoceanographic conditions in the adjacent Indian Ocean. The pollenrecord provides the first information on vegetation history of thelowlands of Sumatra and contributes to ongoing investigations intothe extent of the everwet core of the rainforest in the Indonesianregion during the last glacial period (see, for instance, Kershaw et al.,2001, 2007; Visser et al., 2004; Bird et al., 2005; Cannon et al., 2009).Our contribution is the first of a planned series that will present a
Fig. 1. The location of sites mentioned in the text shown in relation to the mean annual rainfadi Atas (2), core BAR94-42 (3), core BAR94-03 (4), core SO139-74KL (5), Rawa Danau (6), B(mm) is greater than four times the average temperature (°C) (PN4 T). The maps were coRainfall data were derived from the CRU CL 2.0 data set (New et al., 2002).
range of proxy evidence for Late Quaternary environmental changederived from a line of marine cores from the Indian Ocean thattransects the area from North Sumatra to Flores.
2. Environmental setting
2.1. Regional and local climates
The present climate across the Indonesian region is governed bymonsoonal circulation, themigration of the Intertropical ConvergenceZone (ITCZ), as well as the land–ocean distribution in the MalayArchipelago (Verstappen, 1975; Monk et al., 1997). During the australsummer, the northwest monsoon gathers large amounts of moisturewhile crossing the sea from the Asian high-pressure belt on its way tothe ITCZ, which reaches northern Australia in January. At the ITCZ, themoisture-laden air rises, resulting in heavy rains over Indonesia andnorthern Australia, while south of the ITCZ, precipitation decreasesrapidly. During the austral winter, the southeast monsoon originatesfrom the Southern Hemisphere high-pressure belt and is relativelydry and cool, but gathers moisture as it crosses the eastern Indonesianwaters on its way to the ITCZ which, in July, reaches the mainland ofSoutheast Asia.
A major geographic feature that drives climate within the region isthe Indo Pacific Warm Pool (IPWP) that plays a significant role intransferring global heat and moisture between ocean and atmosphereand, in doing so, is considered to be the world's ‘heat engine’.Specifically, heat and moisture rising from the IPWP drive the zonalWalker and meridional Hadley circulation cells making the IPWP animportant source of precipitation for the (austral) summer monsoon.Much of this heat and moisture is derived from shallow seas in theextensive areas of the continental shelf, particularly the Sunda andSahul Shelves, and from the Indonesian Throughflow (ITF) thatrestricts the movement of warm water from the Pacific to the IndianOcean. Thus, lowered sea levels during glacial periods are likely tohave had a major impact on the energy balance and rainfall
ll and the number of humid months in Sumatra andWest Java: Pea Sim-sim (1), Danauandung Basin (7) and Bayongbong (8). A month is classed as humid if the precipitationnstructed with Generic Mapping Tools, GMT version 4.5.1 (Wessel and Smith, 1998).
54 S. van der Kaars et al. / Palaeogeography, Palaeoclimatology, Palaeoecology 296 (2010) 52–78
distribution in the region. The energy provided by convective activitywithin the Maritime Continent (sensu Ramage, 1968) is the majorcontributor to the operation of the east–west Walker circulation thatbreaks down periodically, resulting in the movement of the warmwater banked up against the ITF eastwards, and resulting in asubstantial reduction in precipitation from all sources overmost of theregion.
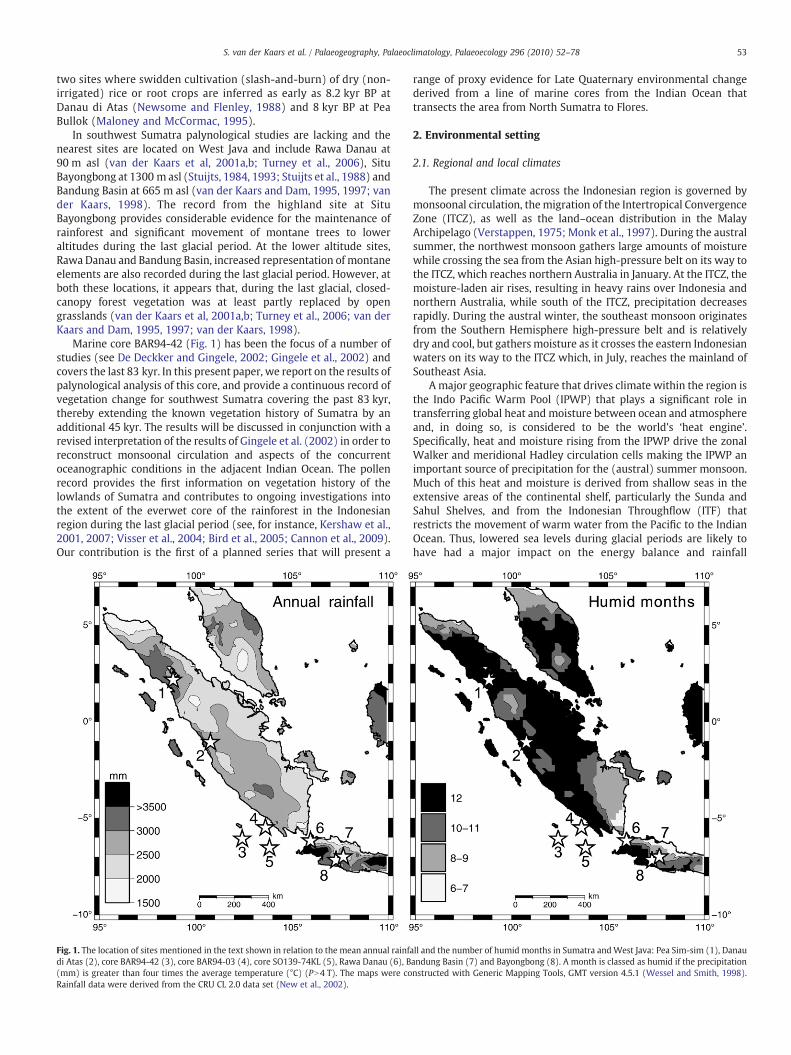
The local climate in the region of Sumatra and West Java ischaracterised by high annual precipitation, generally over 2000 mmand a very feeble or no dry season (virtually no months classified asdry) (Fontanel and Chantefort, 1978, Tapper, 2002) (Fig. 1). Theclimate of southwest Sumatra in the area adjacent to the BAR94-42core site and four key records in the region is presented in Fig. 2. Theeasternmost site, The Bandung Basin, experiences the greatest rainfalland seasonality of all locations discussed herewith, while the mostwestern site, Pim Sim-sim, experiences the most equably distributedrainfall and the least variability. On Sumatra, the period with lowestrainfall is threemonths (JJA) and is shorter than onWest Java where it
Fig. 2.Monthly rainfall (mm) and rainfall variability for Pea Sim-sim, Danau di Atas, southweal., 2002). The solid black line indicates the level for humid months when precipitation (mmindicates the level for drymonths when precipitation (mm) is less than twice the average temvariability of precipitation.
lasts four months (JJAS). In northern and central Sumatra, the numberof humid months is, in general, more extensive (10–12 months) thanin southern Sumatra and West Java (6–10 months) (Fig. 1).
2.2. Regional and local vegetation
The modern vegetation across the region exhibits a pronouncedeast–west gradient (Fig. 3), following annual precipitation and thelength of the dry season (Fontanel and Chantefort, 1978, Tapper,2002). Today, the natural vegetation of Sumatra and West Java islargely composed of evergreen lowland forest between sea level and1000 m, and evergreen highland forest between 1000 m and 3000 m(Collins et al., 1991). The natural vegetation of the area of southwestSumatra, immediately adjacent to the core location, consists ofaltitudinal gradients of dense moist evergreen forests that aredominated by Dipterocarpaceae, with some swamp forest in thecoastal regions in the area below 300 m; in the area from 300 to1000 mDipterocarpaceae, Burseraceae, Euphorbiaceae andMyrtaceae
st Sumatra Rawa Danau and Bandung Basin derived from the CRU CL 2.0 data set (New et) is greater than four times the average temperature (°C) (PN4 T); the dashed black lineperature (°C) (Pb2 T). The coefficient of variation of rainfall is a measure of the relative

Fig. 3. Simplified map of present-day vegetation of the Indonesian region showing extent of evergreen lowland rainforest, evergreen highland rainforest and raingreen forest andwoodland. The South Java Current is indicated by the arrows and letters SJC. Map constructed using information extracted from Kershaw et al. (2007). Locations of sites mentioned inthe text also shown: Pea Sim-sim (1), Danau di Atas (2), core BAR94-42 (3), core BAR94-03 (4), core SO139-74KL (5), Rawa Danau (6), Bandung Basin (7) and Bayongbong (8).
55S. van der Kaars et al. / Palaeogeography, Palaeoclimatology, Palaeoecology 296 (2010) 52–78
dominate; the area from 1000 to 1800 m is largely composed ofFagaceae, Myrtaceae, Lauraceae, Hamamelidaceae, Dacrycarpus imbri-catus and Shorea platyclados. Finally, in the area from 1800 to 2700 m,Fagaceae, Magnoliacaeae, Dacrydium elatum, Podocarpus and Vacci-nium are dominant (Laumonier et al., 1983). Grasses and sedges aremostly restricted to vegetation types found on disturbed sites, onfreshly exposed sediment and on newly created volcanic deposits(Whitten et al., 2000).
2.3. Oceanography
Sea-surface salinities to the southwest of Sumatra are lower thanin the central part of the Indian Ocean and display large variationsacross the year, owing to heavy seasonal rainfalls associated with thetropical monsoon systems that prevail over Indonesia. The monsoonsystems also lead to marked seasonal changes in current intensityand/or direction. During the austral summer, the South Java Current(SJC) is strengthened by the northeast Asian Monsoon, and,consequently, sea-surface salinities are lower (32‰) owing to theintense monsoonal rains over the Indonesian area. During the australwinter, the SJC weakens, making it possible for a larger throughflow ofwater from the Java Sea to pass through the Sunda Strait and bringsmore saline waters (34.2‰–34.4‰) as the monsoonal rains cease inthe Indonesian area. Those heavy monsoonal rainfalls wash muchriverborne material into the sea, including pollen, making marinesedimentary sequences a reliable recorder of vegetation changes inrelation to the climatic changes over Sumatra.
3. Material and methods
Deep-sea core BAR94-42was taken from awater depth of 2542 m atlocation 6°04.53′S and 102°25.09′E. The core is 9.8 m in length and isfully described in Gingele et al. (2002). In total, 53 samples wereanalysed for pollen content at the Centre for Palynology andPalaeoecology in the School of Geography and Environmental Science
atMonashUniversity. For every sample, 2 mlof sedimentwasprocessedusing the following method, adapted from van der Kaars et al. (2001a).The sediment was suspended in about 40 ml of tetra-sodium-pyrophosphate (±10%), sieved over 210 and 7 μm meshes, followedby potassium hydroxide (10%), hydrochloric acid (10%) treatment,hydrofluoric acid (50%) treatment, hydrochloric acid (10%) treatment,acetolysis and heavy liquid separation (sodium-polytungstate, SG 2.0,20 min at 2000 rpm, twice). Slidesweremounted in glycerol and sealedwith paraffin wax. A known amount of Lycopodium marker spores wasadded to each sample prior to treatment in order to establishpalynomorph concentrations. All slides were counted along evenlyspaced transects using a Zeiss Axioskop microscope at ×630 magnifi-cation. All percentage values were calculated on the total dryland treepollen sum (all tree pollen counted, excluding mangrove pollen). Theaverage number of all dryland pollen counted was 300 per sample andthe average pollen sum was 195. Zonation of the pollen diagram wasbased on the results of the stratigraphically constrained cluster analysisCONISS routine inTILIA (Grimm, 1987) using all drylandpollen taxa thatoccurred at least 3 times; in total 103 taxa were used.
A total of 116 samples was analysed for planktonic foraminiferoxygen isotopic ratios. Spatial sampling resolution averages 4 cm inthe upper 160 cm of the core (with a 2-cm spacing resolution acrossTermination I), and increases to 10 cm from 160 cm to the base of thecore. Analyses were performed on 6 to 30 tests of the surface-dwellingspecies Globigerinoides ruberwhite (senso stricto; Wang, 2000) pickedfrom the 250–315 μm size fraction. Tests were ultrasonically cleanedin a methanol bath to remove clays and other impurities. They wereroasted under vacuum at 380 °C for 45 min to eliminate organicmatter. Samples were analysed with a VG-Optima and a FinniganIsoPrime mass-spectrometers at the Laboratoire des Sciences duClimat et L'Environnement, Gif-sur-Yvette, France. All results areexpressed as δ18O in ‰ versus V-PDB with respect to NBS 19 and NBS18 standards. The internal analytical reproducibility as determinedfrom replicate measurements of a carbonate standard is ±0.05‰(1σ). Replicate measurements of G. ruber δ18O were performed on six
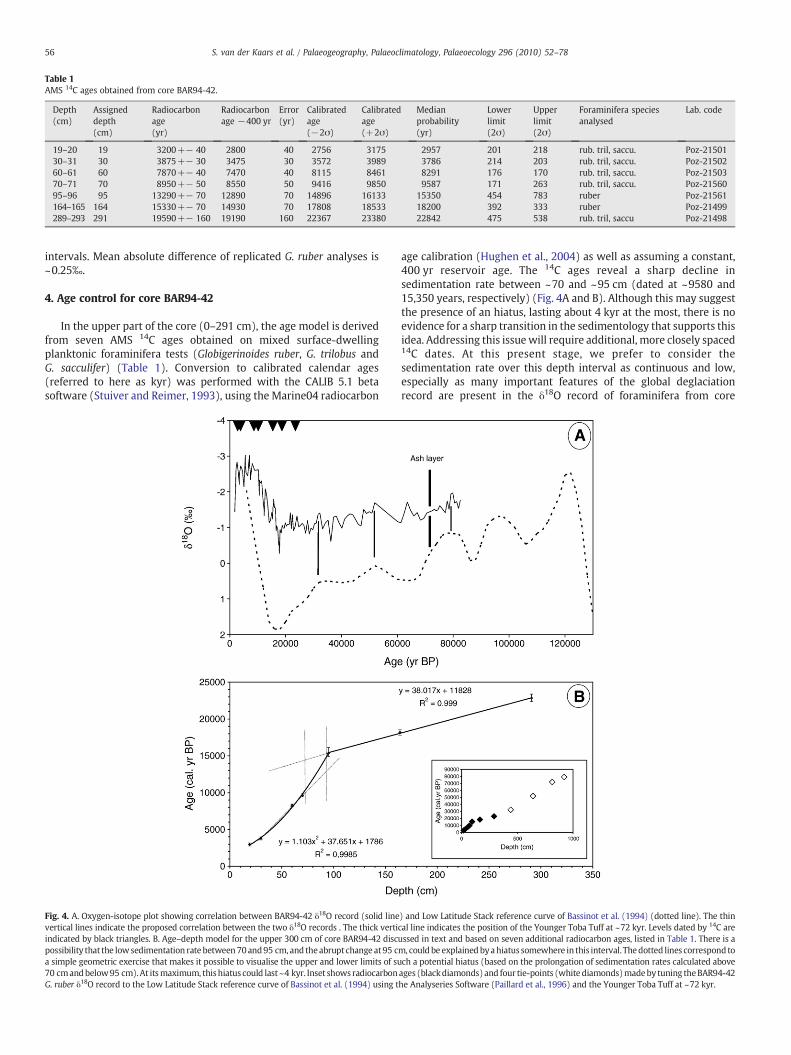
Table 1AMS 14C ages obtained from core BAR94-42.
Depth Assigneddepth
Radiocarbonage
Radiocarbonage −400 yr
Error Calibratedage
Calibratedage
Medianprobability
Lowerlimit
Upperlimit
Foraminifera speciesanalysed
Lab. code(cm)
(cm) (yr)(yr)
(−2σ) (+2σ) (yr) (2σ) (2σ)
19–20 19 3200+− 40 2800 40 2756 3175 2957 201 218 rub. tril, saccu. Poz-2150130–31 30 3875+− 30 3475 30 3572 3989 3786 214 203 rub. tril, saccu. Poz-2150260–61 60 7870+− 40 7470 40 8115 8461 8291 176 170 rub. tril, saccu. Poz-2150370–71 70 8950+− 50 8550 50 9416 9850 9587 171 263 rub. tril, saccu. Poz-2156095–96 95 13290+− 70 12890 70 14896 16133 15350 454 783 ruber Poz-21561164–165 164 15330+− 70 14930 70 17808 18533 18200 392 333 ruber Poz-21499289–293 291 19590+− 160 19190 160 22367 23380 22842 475 538 rub. tril, saccu Poz-21498
56 S. van der Kaars et al. / Palaeogeography, Palaeoclimatology, Palaeoecology 296 (2010) 52–78
intervals. Mean absolute difference of replicated G. ruber analyses is~0.25‰.
4. Age control for core BAR94-42
In the upper part of the core (0–291 cm), the age model is derivedfrom seven AMS 14C ages obtained on mixed surface-dwellingplanktonic foraminifera tests (Globigerinoides ruber, G. trilobus andG. sacculifer) (Table 1). Conversion to calibrated calendar ages(referred to here as kyr) was performed with the CALIB 5.1 betasoftware (Stuiver and Reimer, 1993), using the Marine04 radiocarbon
Fig. 4. A. Oxygen-isotope plot showing correlation between BAR94-42 δ18O record (solid linevertical lines indicate the proposed correlation between the two δ18O records . The thick vertiindicated by black triangles. B. Age–depth model for the upper 300 cm of core BAR94-42 discpossibility that the lowsedimentation ratebetween70and95 cm, and theabrupt changeat95 ca simple geometric exercise that makes it possible to visualise the upper and lower limits of su70 cmandbelow95 cm).At itsmaximum, thishiatus could last ~4 kyr. Inset shows radiocarbonG. ruber δ18O record to the Low Latitude Stack reference curve of Bassinot et al. (1994) using t
age calibration (Hughen et al., 2004) as well as assuming a constant,400 yr reservoir age. The 14C ages reveal a sharp decline insedimentation rate between ~70 and ~95 cm (dated at ~9580 and15,350 years, respectively) (Fig. 4A and B). Although this may suggestthe presence of an hiatus, lasting about 4 kyr at the most, there is noevidence for a sharp transition in the sedimentology that supports thisidea. Addressing this issuewill require additional, more closely spaced14C dates. At this present stage, we prefer to consider thesedimentation rate over this depth interval as continuous and low,especially as many important features of the global deglaciationrecord are present in the δ18O record of foraminifera from core
) and Low Latitude Stack reference curve of Bassinot et al. (1994) (dotted line). The thincal line indicates the position of the Younger Toba Tuff at ~72 kyr. Levels dated by 14C areussed in text and based on seven additional radiocarbon ages, listed in Table 1. There is am, could be explainedbyahiatus somewhere in this interval. Thedotted lines correspond toch a potential hiatus (based on the prolongation of sedimentation rates calculated aboveages (blackdiamonds) and four tie-points (white diamonds)madeby tuning theBAR94-42he Analyseries Software (Paillard et al., 1996) and the Younger Toba Tuff at ~72 kyr.

Fig. 5. Pollen diagram showing individual curves for pollen and spore taxa ecological groups, charcoal, influx data for Pteridophyta, charcoal and total dryland pollen grains and the results of the CONISS stratigraphically constrained cluster analysis. The heavy dashed horizontal line indicates the position of the Youngest Toba Tuff ash layer.
pp. 57–66S. van der Kaars et al. / Palaeogeography, Palaeoclimatology, Palaeoecology 296 (2010) 52–78
67S. van der Kaars et al. / Palaeogeography, Palaeoclimatology, Palaeoecology 296 (2010) 52–78
BAR94-42 (De Deckker and Gingele (2002); Gingele et al. (2002). Theoxygen-isotope curve shows its maximum at 17.75 kyr BP, which islater than in the global stratigraphy and does not correspond,therefore, to the Last Glacial Maximum. Interestingly, neighbouringcore GeoB 10029-4 (Mohtadi et al., 2010) also shows maximum G.ruber δ18O values around this time (17.85 kyr), as well as core MD98-2165 (~18 ka; Levi et al., 2007). This provides further support for thereliability of the 14C chronology proposed for core BAR94-42 andsuggests that the maximum planktonic δ18O event around 17.8–18 kais a genuine, regional feature.
From depth 291 cm to the base of the core, the age model isdetermined by tuning the G. ruber δ18O record to the Low LatitudeStack reference curve of Bassinot et al. (1994) using the AnalyseriesSoftware (Paillard et al., 1996). Ages were linearly interpolatedbetween control-points. The planktonic δ18O record of core BAR94-42does not show much contrast over the MIS 2–MIS 4 stratigraphicinterval, making the tuning exercise difficult. However, an ash layerwas identified in the interval 807–812 cm, at the transition betweenMarine Isotopic Stages (MIS) 5 and 4. Its stratigraphic positionindicates that it should correspond to the well-known, youngest Tobaeruption (De Deckker and Gingele, 2002).We use this age layer as anadditional control-point, ascribing it the age of ~72 kyr, in accordancewith Ar/Ar dating of onland Toba tuffs (73±4 kyr; Chesner et al.,1991) and with a calendar age obtained for the signature of the Tobaeruption in the GISP2 ice record (71±5 kyr; Zielinski et al., 1996).This ash layer tie-point aligns well with the other control-points,bringing additional confidence to our age model. This age modelindicates that the 980 cm-long core BAR94-42 covers the last 83 kyr.
The three 14C ages obtained in the interval 95–291 cm and theδ18O and ash layer tie-points in the lower part of the core (Fig. 4B),show that the sedimentation rate varies smoothly from ~10 cm/kyr(in the lower part of the record), to ~26 cm/kyr (upper part of MIS 2),with no evidence for a hiatus in any part of the record before the MIS2/MIS 1 deglaciation.
5. Palynological results from core BAR94-42 andpalaeoecological interpretation
The results of the palynological analyses are presented in adiagram showing the percentage curves for individual taxa that occurmore than once, ecological groups and charcoal particles (Fig. 5).Table 2 lists those taxa that occur only once. The pollen assemblagesshow great diversity in the taxa represented, with ~100 drylandpollen taxa dominated by arboreal elements. Pteridophyta andcharcoal values are generally high, while herbaceous taxa, dominatedby Cyperaceae and Poaceae, account for less than 40% of the totalpollen sum. Increases in the following taxa are interpreted in thespecific context of this record as indicators of greater than averageprecipitation: Alchornea-type (Euphorbiaceae), Anacardiaceae, Bac-caurea-type (Euphorbiaceae), Calophyllum (Guttiferae), Cunoniaceae,Dipterocarpaceae, Ilex (Aquifoliaceae), Leguminosae,Macaranga-type(Euphorbiaceae), Melanorrhoea (Anacardiaceae), Nauclea-type(Rubiaceae), Palmae, Sapotaceae/Meliaceae, Altingia (Hamamelida-ceae), Lithocarpus-type (Fagaceae), Quercus (Fagaceae), Dacrycarpus(Podocarpaceae) and Engelhardia (Juglandaceae). The pollen diagramis divided into 7 zones based on the results of the CONISS routine(Grimm, 1987). These zones will be discussed in conjunction with theδ18O stratigraphy/chronostratigraphy (see also Fig. 6), which providesthe global climatic framework.
Pollen zone 7 (980–800 cm; ~83–71 kyr) corresponds toMIS 5a. Inthis zone, lowland taxa are well represented and include Acacia-type,Anacardiaceae, Dipterocarpaceae, Leguminosae, Macaranga-type,Oleaceae, Rutaceae and Ulmus, as well as freshwater swampforesttaxa Gluta-type and Nauclea-type. Lower and upper montaneelements attain substantial values with noticeable numbers ofLithocarpus-type, Quercus, Dacrycarpus, Distylium, Engelhardia and
Podocarpus. The herbaceous taxa are dominated by Cyperaceae andPoaceae, with appreciable numbers of Asteraceae Tubuliflorae andTypha-type. Rhizophoraceae make up the majority of the mangrovetaxa, with a limited presence of Sonneratia. Pteridophyta and charcoalvalues are generally high, while at 809 cm core depth (within the ashlayer), we observe the only and significant presence of the freshwateralga Botryococcus together with a high peak in lowland andherbaceous taxa and charcoal. At the same point in time, there is asimultaneous decrease in montane taxa and Pteridophyta. A small buta noticeable peak in mangrove taxa Rhizophoraceae and Sonneratiafollows, and there is the only presence in this zone of Avicennia andNypa. The freshwater swampforest and backswamp element Steno-chlaena palustris-type is also present in moderate numbers.
The pollen assemblages in zone 7 suggest that the lowland, as wellas the montane vegetation belts of southwest Sumatra during MIS 5a,were dominated by species- and fern-rich closed-canopy rainforest. Inaddition, a substantial presence of open herbaceous swamps andmangroves occurred along the coast line. The climatic conditions thatcan be inferred from the vegetation reconstruction are annual rainfalland temperatures that were slightly lower than today. There is littleevidence for increased seasonality in rainfall distribution; nonethe-less, the significant fire activity suggests that important droughtsoccurred regularly. The sample at 809 cm depth (within the ash layer)probably reflects the in-wash of terrestrial material from the lowlandsand mangroves after a considerable landslide, which most likely wasassociated with the massive Toba eruption.
Pollen zone 6 (800–635 cm; ~71–52 kyr) corresponds to MIS 4and the earliest part of MIS 3. The overall composition of pollenassemblages shows little change compared with that of the previouszone. However, a number of the individual taxa do show somevariation in representation, for instance Acacia-type, Anacardiaceae,Dipterocarpaceae, Gluta-type, Oleaceae, Randia, Rutaceae, Ulmus,Typha-type and Rhizophoraceae are either absent or are present inlower numbers, while Freycinetia-type,Melanorrhoea-type, Pandanus,Rhamnaceae and Pinus show a slight increase.
The pollen composition in zone 6 indicates that both vegetationand climate in southwest Sumatra during MIS 4 and the earliest partof MIS 3 remained similar to those of MIS 5a. The rearrangement oftaxa may reflect the regeneration of lowland rainforest after a periodof disturbance following the Toba eruption. However, the increase inPinus might have resulted from increased influence of westerlycirculation patterns. Today, natural stands of Pinus merkusii areconfined to northern Sumatra, with one isolated stand in centralSumatra (de Laubenfels, 1988). It is possible then, that the presence ofPinus pollen in low numbers simply reflects long-distance transportby ocean currents or by the NW monsoon because Pinus are goodfloaters owing to their morphology (Heusser, 1978).
Pollen zone 5 (635–550 cm; ~52–43 kyr) corresponds to theearliest part of MIS 3. It is characterised by a marked increase inQuercus and Poaceae and reduction in lowland elements such asBaccaurea-type, Calophyllum, Moraceae/Urticaceae and Theaceae, andmangroves. Lowland elements Cunoniaceae and Gluta-type areabsent. There are simultaneous increases in lower montane andherbaceous taxa. The contribution of upper montane taxa remainsunchanged as do Pteridophyta values and the amount of charcoalrepresented.
The pollen assemblages in zone 5 indicate reduced rainforest andcooler, slightly drier climatic conditions. Vegetation cover most likelyconsisted of a matrix of rainforest with open herbaceous swamps onpoorly drained and disturbed sites. Montane trees formed animportant component of the lowland forest vegetation.
Pollen zone 4 (550–360 cm; ~43–27 kyr) corresponds to the laterpart of MIS 3 and the earliest part of MIS 2. Lowland taxa levels varybut remain broadly depressed. In general they are slightly lower thanin the previous zone. Values for upper montane element Dacrycarpusare notably greater than in the previous zone, while Poaceae
Table 2Pollen taxa with only one occurrence in core BAR94-42.
Taxon Core depth(cm)
Ganophyllum-type (Sapindaceae) 10Galium-type (Rubiaceae) 30Potamogeton-type (Potamogetonaceae) 150Gunnera (Gunneraceae) 210Nepenthes-type (Nepenthaceae) 230Duabanga-type (Sonneratiaceae) 290Sterculiaceae Reevesia-type 310Utricularia (Lentibulariaceae) 350Phyllocladus (Podocarpaceae) 450Winteraceae 640Cycas-type (Cycadaceae) 750Garcinia latissima-type (Guttiferae) 750Apocynaceae 770Longetia-type (Euphorbiaceae) 809Ludwigia-type (Onagraceae) 890Malvaceae 890Caryophyllaceae 978
68 S. van der Kaars et al. / Palaeogeography, Palaeoclimatology, Palaeoecology 296 (2010) 52–78
representation is lower. Gluta-type remains absent, while Nauclea-type is no longer present after 40 kyr. This zone marks the lastoccurrence of Nothofagus. Charcoal and Cyperaceae representationreduce markedly mid-zone, with a contemporaneous increase inPteridophyta numbers.
The pollen assemblages recorded in zone 4 indicate that forest coverhad increased gradually, at the expense of open herbaceous swampvegetation, while the number of montane trees in the lowland forestsincreased further. This indicates that the later part ofMIS 3 continued tobe cooler and drier than MIS 5a. The pattern in the Pteridophyta andcharcoal curves mid-zone suggests increased river input and reducedfire activity during the transition to MIS 2 when considerably morehumid climatic conditions appear to have developed. Alternatively, theintensity and frequency of droughtsmay have reduced to such anextentthat they had little environmental impact. Under the latter scenario,temperatures may have been slightly reduced causing a gradualincrease in humidity. The disappearance of the New Guinean taxonNothofagus by 40 kyr, the presence of which is a result of long-distancetransport by either wind or water, indicates reduced influence ofeasterly wind or ocean current circulation patterns.
Pollen zone 3 (360–140 cm; ~27 kyr–17 kyr) corresponds to MIS 2.It encompasses the LGM (~23–19 kyr) and a narrow interval of highδ18O values (153–147 cm; ~17.75–17.5 kyr). The most noticeablefeature of pollen zone 3 is the striking increase in Pteridophytanumbers; up to 4 times higher than in the previous zones. Othercharacteristics include increases in Acalypha-type, Calophyllum, Nau-clea-type, Sapotaceae/Meliaceae and Theaceae and decreases inMacaranga-type, Cyperaceae and Poaceae, with declining Dipterocar-paceae numbers in the upper part of this zone.
The vegetation cover remained largely unchanged from theprevious period. However, the decline in open herbaceous swampcover continued, while the contribution of montane trees to thelowland forest vegetation attained the highest levels overall duringthis period. The decline in dipterocarp numbers in the upper part ofzone 3 reflects reduced temperatures during MIS 2. The increase inmontane elements and decline in herbaceous taxa are in agreementwith this trend. While it might be logical to ascribe the massiveincrease in Pteridophyta numbers to increased riverine input and,consequently, increased precipitation, the pollen assemblages, how-ever, indicate only gradual changes to more humid conditionsthroughout this period and suggest that alternative possibilitiesshould be explored. In many marine cores from this region,concurrent changes have been observed between the δ18O recordand Pteridophyta curves produced for the same cores (e.g. Morleyet al., 2004; van der Kaars et al., 2000; van der Kaars, 1991). In the
BAR94-42 record, however, the pattern appears to be the reverse;highest Pteridophyta values occur during MIS 2 rather than theHolocene (Fig. 6). One explanation might stem from the significantlydifferent land–sea distributionwithin the archipelago at this time; thelowered sea level created a long and narrow embayment parallel tothe coast of southwest Sumatra that would have channelled riverineinput, including Pteridophyta spores, close to the BAR94-42 core site(Fig. 7). Some support for this hypothesis is provided by the generallymuch higher influx values of the Pteridophyta as well as the charcoaland dryland influx values from 83 to ~17 kyr than in the period from17 kyr to the present. The high values for these elements indicate thatrunoff, and therefore precipitation, in the hinterland along thesouthwest coast of Sumatra was substantial during the glacial.
Pollen zone 2 (140–80 cm; 17–11.9 kyr) corresponds to the lastdeglaciation (Termination I). Regular changes are observed in therepresentation of lowland, upper and lower montane, herbaceoustaxa and Pteridophyta. Lowland elements such as Baccaurea-type,Dipterocapaceae and Macaranga-type all resurge, while values for allmontane elements, with the notable exception of Engelhardia, aresuppressed. Pinus is no longer present. Rhizophoraceae, and to a lesserextent Stenochlaena palustris-type, increase, while montane andherbaceous taxa, and Pteridophyta are generally lower.
The significant reduction in montane taxa occupying the lowlandbelt, and in the area covered by open herbaceous swamps determinedfrom the pollen signal recorded in zone 2, reflects the onset of warmerand wetter climatic conditions very similar to those of today, possiblywith a brief reversal at mid-transition. Mangroves and backswampsbecome established as sea level rises and river valleys come undertidal influence.
Pollen zone 1 (80–0 cm; ~11.9–1.8 kyr) corresponds to theHolocene (MIS 1). There is a further increase in lowland elementsincluding, Alchornea-type,Glochidion, Gluta-type,Macaranga-type andPalmae Oncosperma-type as upper and lower montane taxa decreasein representation. Rhizophoraceae numbers peak at the base of thiszone and Cyperaceae and, especially, Poaceae numbers declinegreatly. Charcoal reduces and Pteridophyta resurge after the lowvalues in the previous zone.
The changes in taxa represented in zone 1 indicate that theHolocene expansion of lowland closed-canopy rainforest includesfreshwater swamp forest and, together with further reductions in fireactivity, indicates the establishment of today's perhumid climaticconditions wherein low intensity, low frequency droughts occur thathave little environmental impact.
6. Implications of the new chronology for the BAR94-42 biogenicand terrigeneous records of Gingele et al. (2002)
The recent addition of seven AMS-14C ages has substantiallyrefined the chronology proposed for core BAR94-42, making itnecessary to re-ascribe ages to events seen in the earlier study ofthis core by Gingele et al. (2002). A number of their original data setsare presented in Fig. 6 showing the original chronology for the core aswell as the revised one. A brief description of the new eventchronology and the implications for the interpretation of the biogenicand terrigeneous data sets is given here prior to incorporating therevised results into the general discussion in Section 7.
6.1. Biogenic proxies
Bulk biogenic carbonate percentage values are high from the base ofthe record until ~61 kyr, with a minimum around 72 kyr and amaximum from 82–80 kyr. From ~61–52 kyr values are low and from52–33 kyr are moderate followed by a gentle decline until a well-defined minimum from 23–17 ka and a pronounced maximum from17–11 kyr. From 11 ka to the top of the record, the bulk carbonatepercentage values are generally below average. The giant diatom
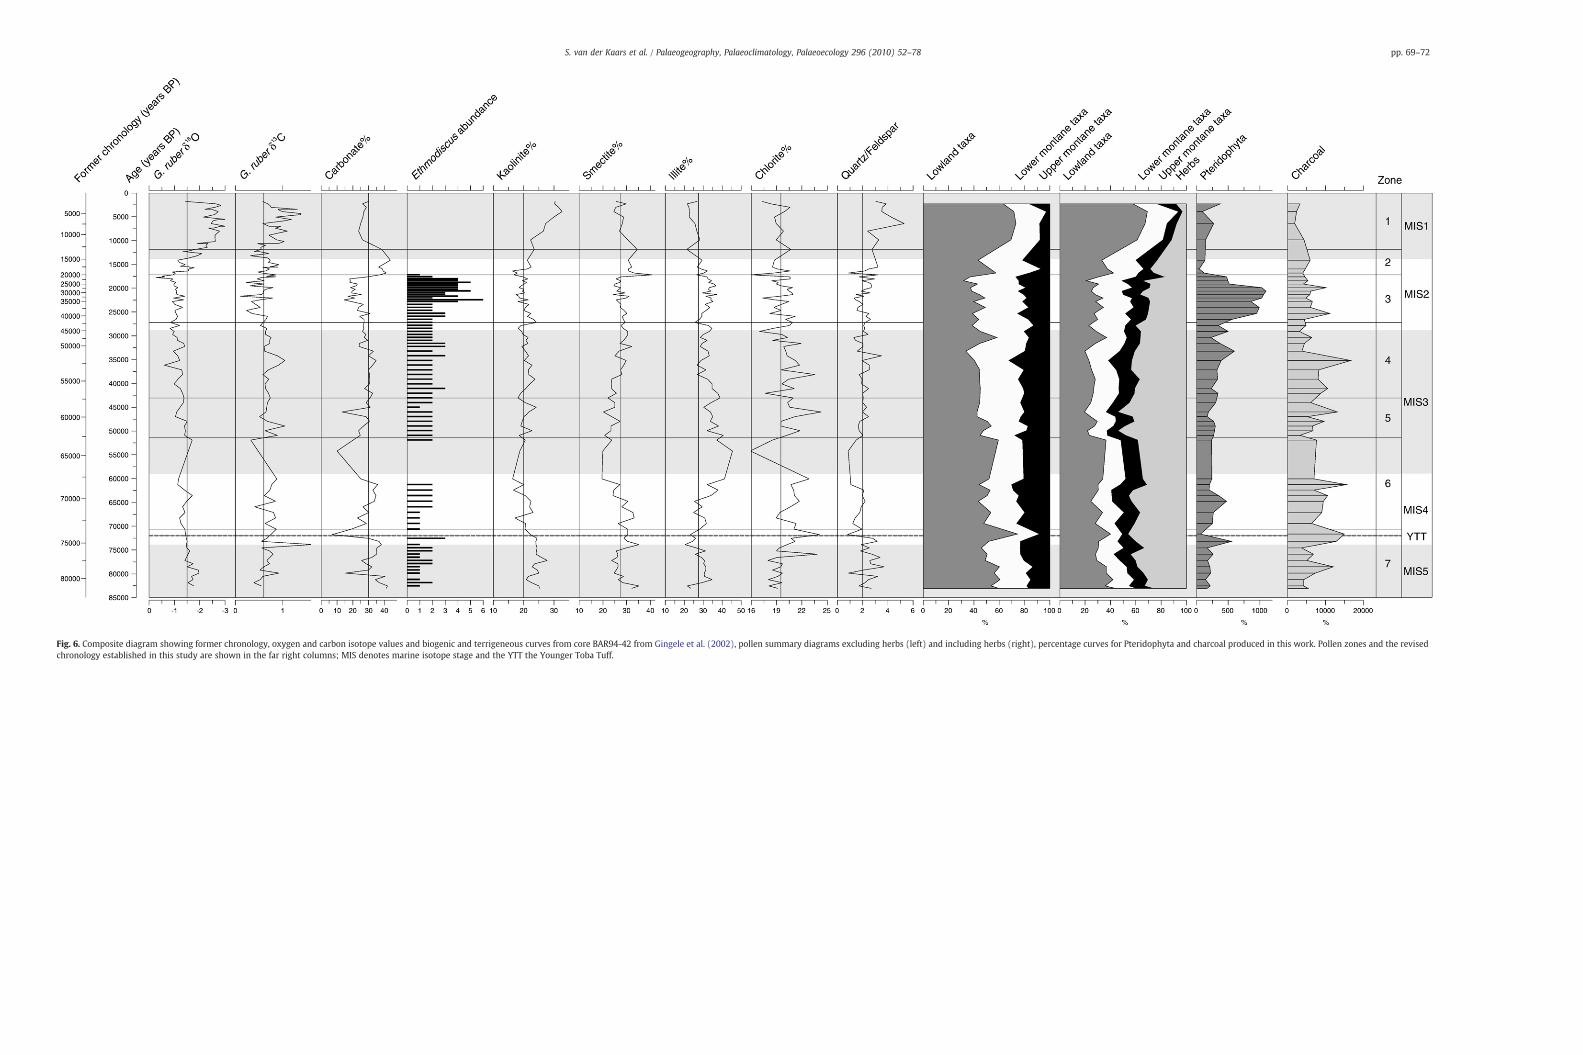
Fig. 6. Composite diagram showing former chronology, oxygen and carbon isotope values and biogenic and terrigeneous curves from core BAR94-42 from Gingele et al. (2002), pollen summary diagrams excluding herbs (left) and including herbs (right), percentage curves for Pteridophyta and charcoal produced in this work. Pollen zones and the revisedchronology established in this study are shown in the far right columns; MIS denotes marine isotope stage and the YTT the Younger Toba Tuff.
pp. 69–72S. van der Kaars et al. / Palaeogeography, Palaeoclimatology, Palaeoecology 296 (2010) 52–78
73S. van der Kaars et al. / Palaeogeography, Palaeoclimatology, Palaeoecology 296 (2010) 52–78
Ethmodiscus rex is present from 82–17 kyr with a distinct maximumshown from 23–17 ka. It is clear that, using the age model proposedhere, the highest peaks of E. rex now coincide with the LGM. Gingeleet al. (2002) proposed that reduced ocean circulation and increasedstratification in the water column during the last glacial period mayhave trapped nutrients in deeper water masses, especially in the period23–17 kyr, where they were utilised by E. rex. They also suggest thatfrom 17 ka onwards, conditions were more turbid, perhaps resultingfrom stronger glacial winds, which reachedmaximum strength in mid-MIS 2 and thatmay have recirculated nutrients to the surface, leading toincreased nanoplankton productivity and zooplankton (foraminifera)abundance, as well as carbonate preservation. The interpretations ofGingele et al. (2002) fit the newly proposed chronology very well.
6.2. Terrigeneous proxies
For most of their record, kaolinite values average ~20%. It is onlyduring the periods from 83–71 kyr, after 16 ka and, especially,immediately after 10 kyr, that higher values occur. According toGingeleet al. (2002), this pattern largely reflects the input ofwater from the JavaSea through the Sunda Strait during periods of high global sea level.Today, maximum kaolinite values occur in the Sunda Strait (Gingeleet al., 2001) and it is possible that clay minerals are transported to theBAR94-42 site when the SJC flows westward during the SE monsoon.Patterns displayed by the other clay mineral curves are more complex.Smectite percentages are high at 83 ka, below average until 75 kyr, riseagain from75–63 kyr, thenpresent a distinctminimum from63–37 kyr.From 37 kyr to the top of the record, values hover around 25–30%, withthe exception of a distinct maximum from 17–10 kyr. Gingele et al.(2002) identify the most likely source area for smectite is to the east ofthe core site and propose that smectite peaks reflect periods with astrong westward flow of the SJC, caused by intensification ofsoutheasterly winds during the austral winter monsoon.
The pattern shown in the illite curve is, largely, the reverse of thesmectite curve. A minimum at 83 kyr is followed by above averagevalues until 75 kyr and low values from 75 to 63 kyr. There is a distinctmaximum from 63–37 kyr then values vary from 25–35% during theperiod 37–17 kyr. After 17 kyr, and especially after 13 kyr, illitepercentages are mainly below 25. Gingele et al. (2001) consider thenorthern tip of Sumatra to be the main supply source of illite to thecore site. They propose that high illite values reflect increasedintensity of the eastward flow of the SJC driven by stronger NWwinds during the austral summer monsoon.
Chlorite values are constant throughout the record, fluctuatingfrom 17–22%. Gingele et al., 2001 report that the distribution ofchlorite along the Indonesian islands is uniform and, as a result,Gingele et al. (2002) consider downcore variations in chlorite valuesunlikely to be affected by changes in ocean currents. Instead, Gingeleet al. (2002) concluded that relatively high fluvial runoff and,therefore, precipitation, must have occurred during the glacial inorder to deliver chlorite to the BAR94–42 site. The quartz/feldsparratio is around 2 for much of the record, however, high values occurfrom 83–71 kyr, after 16 kyr and, especially, after 7 kyr. This patternlargely follows the kaolinite record and Gingele et al. (2002) proposethe Sunda Strait to be most likely source area.
7. Discussion addressing palaeoclimatic reconstructions andregional palaeoceanographic and palaeoenvironmental patterns
7.1. Reconstruction of palaeoclimatic and palaeoceanographicconditions from core BAR94-42 and adjacent marine records
The BAR94-42 kaolinite and quartz/feldspar records indicate thatthere were influxes of Java Sea water and a westward flow of the SJCdriven by a SE monsoon in the period spanning ~83–~75 kyr.However, the smectite and illite records show that the SJC flow
could have varied and that the eastward flow could have been moremoderate than at present. These findings are in agreement withconclusions from study of core SO139-74KL, taken to the east of coreBAR94-42, by Lückge et al. (2009) (Fig. 1). The SO139-74KLpalaeoproductivity record, based on total organic carbon (TOC)content, chlorine and alkenone concentrations, identifies the periodsfrom ~85–~75 kyr and the Holocene as the two phases of highestproductivity and, by inference, strengthened SE monsoonal winds(Lückge et al., 2009). The authors suggested that a strong link existsbetween seasonal upwelling off Sumatra and Java and the SEmonsoon intensity. They argued that, in the past, SE monsoonalwinds were strengthened during Northern Hemisphere insolationmaxima, resulting in increased upwelling and productivity.
During the bulk of the glacial period, from ~75 kyr to the onset ofthe Holocene, the predominance of rainforest taxa in the BAR94-42record indicates the climate was humid, with annual precipitation ofmore than 2000 mm, the chlorite and Pteridophyta curves indicatethat precipitation and runoff remained substantial and possibly, asindicated by the gradual increase in herb values, a short dry seasondeveloped. It is likely that the dry season occurred during the SEmonsoon and that it only lasted one to two months. The BAR94-42illite record suggests that, from ~75–~63 kyr, the eastward flow of theSJC had reduced, possibly driven by a weaker NW monsoon. TheBAR94-42 smectite record shows that the westward flow of the SJCand SE monsoon were strong. The palaeoproductivity proxies fromcore SO139-74KL also indicate that the NW component of themonsoon weakened and the SE component dominated monsoonalcirculation (Lückge et al., 2009). During this time, increased charcoaland herbs suggest that the dry season may have increased to twomonths. The chlorite and Pteridophyta records, together withincreased rainforest, show that precipitation and runoff remainedhigh.
In the period ~63–~37 kyr, the BAR94-42 illite record indicates anincrease in the eastward flow of the SJC under stronger NW windsduring the austral summer monsoon. Effective eastward transport issupported by the presence of long-distance transported Pinusmerkusii pollen during this period. The minimum in the smectiterecord at ~55 kyr might point to a reduction of the westward flow ofthe SJC and a weaker SE monsoon. These findings are generallyconsistent with the palaeoproductivity proxy record from coreSO139-74KL (Lückge et al., 2009), indicating a dominance of theNW monsoon for most of this period, but a swing to SE monsoonactivity at ~55 kyr, is suggested by the SO139-74KL TOC record. Forthe period ~52–43 kyr, there is relatively little change in the BAR94-42 palynological data; charcoal levels are high and herbs reach theirmaximum values here for the entire record. These patterns identifythis period as the driest phase of the last 83,000 years composed of ahumid monsoonal climate, with a dry season of two months. Thechlorite and Pteridophyta data support this idea of high precipitationand runoff throughout this time.
For the period from ~37–~27 kyr, reduction in the eastward flowof the SJC and weaker NW winds are indicated by the BAR94-42 illiterecord, however, the sustained presence of Pinus merkusii pollenshows that eastward transport remained effective. Strengthening ofthe westward flow of the SJC and the SE monsoon is indicated by theBAR94-42 smectite record. This interpretation is consistent with therecord of palaeoproductivity from core SO139-74Kl. Lower charcoalvalues and a gradual reduction in herb representation suggest agradual decline in the duration of the dry season, while the chloriteand Pteridophyta records point to high runoff and precipitation. Thesetrends continue in the period from ~27–17 kyr. Further reduction inthe length of the dry season is suggested by lower herb numbers,while substantial precipitation and runoff are indicated by signifi-cantly elevated Pteridophyta levels, as well as little carbonate. ThePteridophyta peak coincides with a peak in Ethmodiscus rexabundance, although it is not clear if there is a causal link between
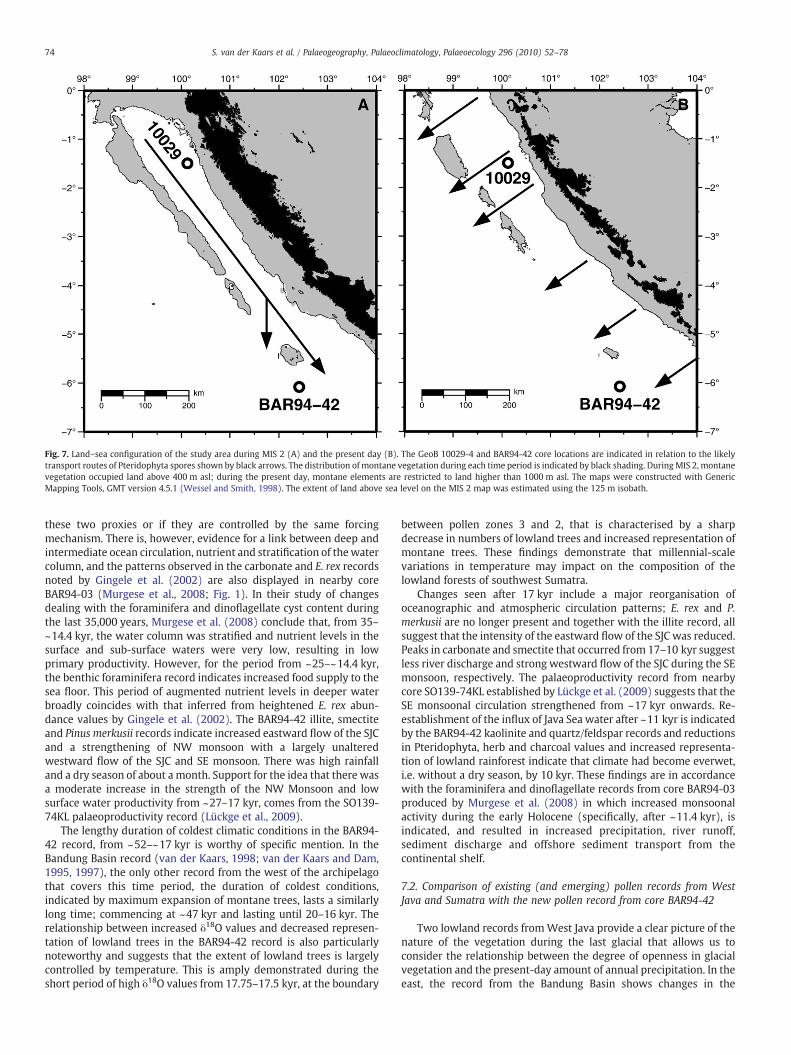
Fig. 7. Land–sea configuration of the study area during MIS 2 (A) and the present day (B). The GeoB 10029-4 and BAR94-42 core locations are indicated in relation to the likelytransport routes of Pteridophyta spores shown by black arrows. The distribution ofmontane vegetation during each time period is indicated by black shading. DuringMIS 2, montanevegetation occupied land above 400 m asl; during the present day, montane elements are restricted to land higher than 1000 m asl. The maps were constructed with GenericMapping Tools, GMT version 4.5.1 (Wessel and Smith, 1998). The extent of land above sea level on the MIS 2 map was estimated using the 125 m isobath.
74 S. van der Kaars et al. / Palaeogeography, Palaeoclimatology, Palaeoecology 296 (2010) 52–78
these two proxies or if they are controlled by the same forcingmechanism. There is, however, evidence for a link between deep andintermediate ocean circulation, nutrient and stratification of the watercolumn, and the patterns observed in the carbonate and E. rex recordsnoted by Gingele et al. (2002) are also displayed in nearby coreBAR94-03 (Murgese et al., 2008; Fig. 1). In their study of changesdealing with the foraminifera and dinoflagellate cyst content duringthe last 35,000 years, Murgese et al. (2008) conclude that, from 35–~14.4 kyr, the water column was stratified and nutrient levels in thesurface and sub-surface waters were very low, resulting in lowprimary productivity. However, for the period from ~25–~14.4 kyr,the benthic foraminifera record indicates increased food supply to thesea floor. This period of augmented nutrient levels in deeper waterbroadly coincides with that inferred from heightened E. rex abun-dance values by Gingele et al. (2002). The BAR94-42 illite, smectiteand Pinus merkusii records indicate increased eastward flow of the SJCand a strengthening of NW monsoon with a largely unalteredwestward flow of the SJC and SE monsoon. There was high rainfalland a dry season of about a month. Support for the idea that there wasa moderate increase in the strength of the NW Monsoon and lowsurface water productivity from ~27–17 kyr, comes from the SO139-74KL palaeoproductivity record (Lückge et al., 2009).
The lengthy duration of coldest climatic conditions in the BAR94-42 record, from ~52–~17 kyr is worthy of specific mention. In theBandung Basin record (van der Kaars, 1998; van der Kaars and Dam,1995, 1997), the only other record from the west of the archipelagothat covers this time period, the duration of coldest conditions,indicated by maximum expansion of montane trees, lasts a similarlylong time; commencing at ~47 kyr and lasting until 20–16 kyr. Therelationship between increased δ18O values and decreased represen-tation of lowland trees in the BAR94-42 record is also particularlynoteworthy and suggests that the extent of lowland trees is largelycontrolled by temperature. This is amply demonstrated during theshort period of high δ18O values from 17.75–17.5 kyr, at the boundary
between pollen zones 3 and 2, that is characterised by a sharpdecrease in numbers of lowland trees and increased representation ofmontane trees. These findings demonstrate that millennial-scalevariations in temperature may impact on the composition of thelowland forests of southwest Sumatra.
Changes seen after 17 kyr include a major reorganisation ofoceanographic and atmospheric circulation patterns; E. rex and P.merkusii are no longer present and together with the illite record, allsuggest that the intensity of the eastward flow of the SJC was reduced.Peaks in carbonate and smectite that occurred from 17–10 kyr suggestless river discharge and strong westward flow of the SJC during the SEmonsoon, respectively. The palaeoproductivity record from nearbycore SO139-74KL established by Lückge et al. (2009) suggests that theSE monsoonal circulation strengthened from ~17 kyr onwards. Re-establishment of the influx of Java Sea water after ~11 kyr is indicatedby the BAR94-42 kaolinite and quartz/feldspar records and reductionsin Pteridophyta, herb and charcoal values and increased representa-tion of lowland rainforest indicate that climate had become everwet,i.e. without a dry season, by 10 kyr. These findings are in accordancewith the foraminifera and dinoflagellate records from core BAR94-03produced by Murgese et al. (2008) in which increased monsoonalactivity during the early Holocene (specifically, after ~11.4 kyr), isindicated, and resulted in increased precipitation, river runoff,sediment discharge and offshore sediment transport from thecontinental shelf.
7.2. Comparison of existing (and emerging) pollen records from WestJava and Sumatra with the new pollen record from core BAR94-42
Two lowland records fromWest Java provide a clear picture of thenature of the vegetation during the last glacial that allows us toconsider the relationship between the degree of openness in glacialvegetation and the present-day amount of annual precipitation. In theeast, the record from the Bandung Basin shows changes in the

75S. van der Kaars et al. / Palaeogeography, Palaeoclimatology, Palaeoecology 296 (2010) 52–78
herbaceous–arboreal pollen ratio from 20:80 during the last inter-glacial to 90:10 during the last glacial period (van der Kaars, 1998; vander Kaars and Dam, 1995, 1997). Further to the west, the Rawa Danaurecord the herbaceous–arboreal ratio changes from 80:20 in the lastglacial period to 10:90 during the Holocene. In addition to thesesignificant changes in the degree of openess, other evidence for drierclimates comes from elevated charcoal levels and strongly reducedPteridophyta values (van der Kaars et al, 2001a, 2001b and Turneyet al., 2006). In contrast, the highland site at Situ Bayongbongmaintains an herbaceous–arboreal ratio of 10:90 during the lastglacial period (Stuijts, 1984, 1993). On Sumatra, only records fromhighland sites are yet available. The Danau di Atas record from centralSumatra, herbaceous taxa are dominated by Cyperaceae and Poaceae,in varying proportions throughout the last 35 kyr, however, therecord lacks a clear glacial–interglacial turnover pattern (Newsomeand Flenley, 1988; Stuijts et al., 1988). The herbaceous–arboreal ratioremains broadly around 25:75 throughout the last 35 kyr. The PeaSim-sim record from north Sumatra shows only slight change in theherbaceous–arboreal ratio; during the last glacial, the values are 10:90shifting to 5:95 in the Holocene (Maloney, 1980, 1985).
In contrast to many other marine pollen records from the region(e.g. Morley et al., 2004; van der Kaars et al., 2000; van der Kaars,1991), the maximum representation of herbaceous taxa in coreBAR94-42 does not occur during MIS 2 but in the period between 50and 45 kyr, demonstrating that there is no direct link betweenmaximum global aridity and the extent of herbaceous taxa in thisrecord. In the BAR94-42 record, the difference between the ratio of40:60 herbaceous–arboreal recorded in the period from 52–43 kyrand the ratio of 10:90 in the Holocene is clearly not as extreme as thechanges in openness seen in the records fromWest Java. That the sitemaintains a high proportion of forest indicates that rainfall remained
Fig. 8. Summary pollen diagrams for records from cores GeoB 10029-4 (van der Kaars, unputaxa and herbs as well as Pteridophyta percentages and influx values against age scale.
higher and changes in inter-annual variability were less extreme atthis location. These conditions indicate that the monsoon remainedactive throughout MIS 3. After ~43 kyr, the gradual reduction inopenness and fewer represented Pteridophyta indicate that aneverwet climate developed, likely in response to intensified mon-soonal circulation.
An emerging record from study of core GeoB 10029-4, located some500 km to the north of the BAR94-42 core site (Fig. 7) (van der Kaars,unpublished data), indicates that, on central Sumatra, little change in theherbaceous–arboreal ratio occurred over the last 18 kyr, values insteadremained stable at around 5:95 (Fig. 8) (van der Kaars, unpublisheddata). This suggests that rainforest cover in central Sumatra remainedand highlights the fact that BAR94-42 is located in a boundary position.Moreover, the patterns of Pterophyta representation in the GeoB 10029-4 sequence are comparable to the high percentage and influx valuesrecorded in the BAR94-42 core during MIS 2 (Fig. 8) (van der Kaars,unpublished data), providing support for our interpretation that rainfalland runoff levels during that period were as high as they are today.
From the comparison of these records, it is possible to deduce thatforest cover was maintained during glacial periods at sites that, underpresent climate conditions, have high and equably distributed rainfalland little inter-annual variability (Figs. 1 and 2). In contrast, it appearsthat at sites where precipitation is already more seasonal andprecipitation variability is higher today, forest cover was reducedduring the glacial period. The seasonality and variability in present-day rainfall in the Bandung Basin and Rawa Danau appear to explain,in part, the susceptibility of forest to reduced rainfall and increasedvariability during the glacial. The lesser seasonality and lesservariability at Pea Sim-sim and Danau di Atas today may partly explainwhy these site experienced lesser extremes in the past andmaintained more forest during the last glacial. In addition, in contrast
blished data) and BAR94-42 showing main ecological groups of lowland taxa, montane
76 S. van der Kaars et al. / Palaeogeography, Palaeoclimatology, Palaeoecology 296 (2010) 52–78
to eastern Sumatra and Java, rainfall in western Sumatra is notstrongly influenced by ENSO or by local SST (Aldrian and Susanto,2003).
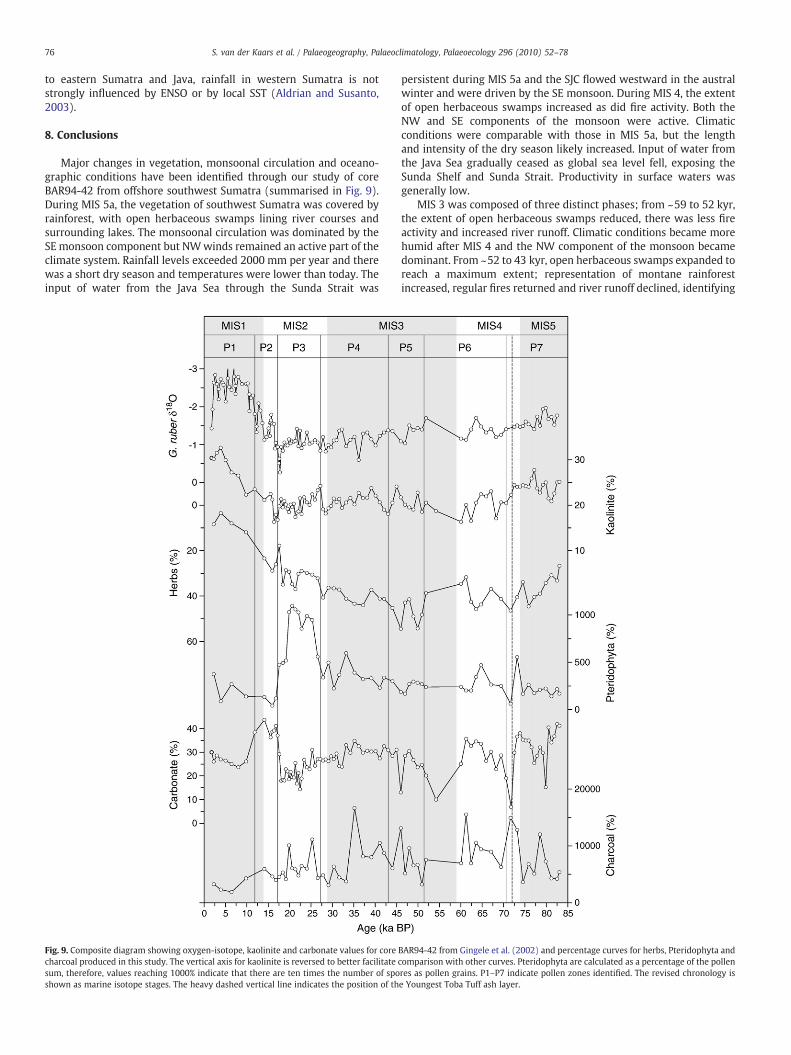
8. Conclusions
Major changes in vegetation, monsoonal circulation and oceano-graphic conditions have been identified through our study of coreBAR94-42 from offshore southwest Sumatra (summarised in Fig. 9).During MIS 5a, the vegetation of southwest Sumatra was covered byrainforest, with open herbaceous swamps lining river courses andsurrounding lakes. The monsoonal circulation was dominated by theSE monsoon component but NWwinds remained an active part of theclimate system. Rainfall levels exceeded 2000 mm per year and therewas a short dry season and temperatures were lower than today. Theinput of water from the Java Sea through the Sunda Strait was
Fig. 9. Composite diagram showing oxygen-isotope, kaolinite and carbonate values for corecharcoal produced in this study. The vertical axis for kaolinite is reversed to better facilitatesum, therefore, values reaching 1000% indicate that there are ten times the number of sposhown as marine isotope stages. The heavy dashed vertical line indicates the position of th
persistent during MIS 5a and the SJC flowed westward in the australwinter and were driven by the SE monsoon. During MIS 4, the extentof open herbaceous swamps increased as did fire activity. Both theNW and SE components of the monsoon were active. Climaticconditions were comparable with those in MIS 5a, but the lengthand intensity of the dry season likely increased. Input of water fromthe Java Sea gradually ceased as global sea level fell, exposing theSunda Shelf and Sunda Strait. Productivity in surface waters wasgenerally low.
MIS 3 was composed of three distinct phases; from ~59 to 52 kyr,the extent of open herbaceous swamps reduced, there was less fireactivity and increased river runoff. Climatic conditions became morehumid after MIS 4 and the NW component of the monsoon becamedominant. From ~52 to 43 kyr, open herbaceous swamps expanded toreach a maximum extent; representation of montane rainforestincreased, regular fires returned and river runoff declined, identifying
BAR94-42 from Gingele et al. (2002) and percentage curves for herbs, Pteridophyta andcomparison with other curves. Pteridophyta are calculated as a percentage of the pollenres as pollen grains. P1–P7 indicate pollen zones identified. The revised chronology ise Youngest Toba Tuff ash layer.

77S. van der Kaars et al. / Palaeogeography, Palaeoclimatology, Palaeoecology 296 (2010) 52–78
this phase as the driest period of the record and the onset of coldestconditions. Monsoonal patterns remained largely unchanged. From~43 kyr until the end of MIS 3, the amount of open herbaceous swamparea declined and, from about 35 kyr, fires became more infrequentand Pteridophyta numbers increased. After 33 kyr, river runoffincreased, the SE component of the monsoon and the westwardflow of the SJC became stronger. More humid conditions developedand the duration and intensity of the dry season reduced. High valuesfor montane tree indicate cool climatic conditions.
Montane trees and very high numbers of Pteridophyta persistedfor most of MIS 2 indicating that cold conditions continued. It ismooted that lowered sea level created a long and narrow embaymentparallel to the coast of southwest Sumatra that channelled riverineinput, including Pteridophyta spores, close to the BAR94-42 core site.Precipitation, in the hinterland along the southwest coast of Sumatrawas substantial during the glacial. The MIS 2–1 transition was a timeof major environmental upheaval and a reorganisation of oceano-graphic and atmospheric circulation patterns. During the transition E.rex populations collapsed, Pteridophyta, charcoal and pollen influxdeclined and mangroves marked the rise of sea level. During theHolocene, southwest Sumatra was covered again by tropical, everwetrainforest; comprised of lowland taxa and fewer montane trees.Increasedmonsoonal activity resulted in increased precipitation, riverrunoff, sediment discharge and offshore sediment transport from thecontinental shelf. Influx of Java Sea water through the Sunda Straitresumed and strong westward flow of the SJC was driven by areinvigorated SE monsoon resulting in increased upwelling andproductivity.
In addition to the specific record of palaeoenvironments sum-marised above, comparison of the BAR94-42 record with existingrecords contributes to assessment of the spatial extent of everwetrainforest during the last glacial. It is clear from our results that,despite the presence of extensive open herbaceous swamps insouthwest Sumatra during the last glacial, large tracts of tropicalrainforest remained. It is also clear that Pteridophyta comprised alarge part of the glacial vegetation assemblages. These findingssuggest that a mosaic of closed canopied rainforests and herbaceousswamps must have existed, in strong contrast with reconstructionsmade for the lowlands ofWest Java, that indicate that residual pocketsof rainforest existed in a matrix of open herbaceous swamps. The roleof Pteridophyta in the West Java assemblages was lesser than that onSumatra and fire activity was much greater. Comparison of our resultswith reconstructions from the highlands of northern and centralSumatra indicates that southwest Sumatra was on the margin of theeverwet core during the period from ~83–12 kyr. This finding furtheraugments the observations made by Kershaw et al. (2001, 2007) thatthe glacial vegetation of Indonesia was far from uniform, and clearlydemonstrates that the sensitivity of sites to changes in precipitation,e.g. between highland and lowland sites, must be considered whenassembling regional vegetation reconstructions for the Malay Archi-pelago. Consequently, we caution against regional generalisationsmade without consideration of local factors, such as site location andlocal topography (e.g. Visser et al., 2004); these merely lead toerroneous rejection of robust individual site interpretations.
Acknowledgements
Core BAR94-42 was obtained during BARAT cruise in 1994 and themaster and crew of the RV Baruna Jaya I are wholeheartedly thankedfor their hard work. Scientists from MGI (Bandung), BPPT and LIPI (inJakarta) participated in the cruise which was partly funded by INSU(CNRS France), CEA, IFREMER and the service culturel of the FrenchEmbassy in Jakarta. Operations at sea were performed with the helpof an Indonesian crew and 3 seamen from GENAVIR (IFREMER). Wethank The Centre for Marine Environmental Sciences (MARUM) atthe University of Bremen for access to core material from GeoB
10029-4 and Mayhar Mohtadi (also at MARUM) for his help samplingthat core and useful discussions. We thank Fabien Dewilde for stableisotopic analyses performed at the Laboratoire des Sciences du Climatet L'Environnement, Gif-sur-Yvette. Ursula Pietrzak from the Centrefor Palynology and Palaeoecology in the School of Geography andEnvironmental Science at Monash University is thanked for labora-tory processing of the BAR94-42 pollen samples. SvdK gratefullyacknowledges the support of a Logan Research Fellowship fromMonash University, Australian Research Council (ARC) funding andGerman Research Foundation (DFG) grant BE2116/10-1. We thankEllyn Cook for assistance sampling the GeoB 10029-4 core and forrevision of the text that greatly improved the manuscript. LydieDupont and one anonymous reviewer provided useful comments onthe manuscript.
References
Aldrian, E., Susanto, R.D., 2003. Identification of three dominant rainfall regions withinIndonesia and their relationship to sea-surface temperature. International Journalof Climatology 23, 1435–1452.
Bassinot, F., Labeyrie, L.D., Vincent, E., Quidelleur, X., Shackleton, N., Lancelot, Y., 1994.The astronomical theory of climate and the age of the Bruhnes–Matuyamamagnetic reversal. Earth and Planetary Science Letters 126, 91–108.
Bird, M.I., Taylor, D., Hunt, C., 2005. Palaeoenvironments of insular Southeast Asiaduring the Last Glacial Period: a savanna corridor in Sundaland? QuaternaryScience Reviews 24, 2228–2242.
Cannon, C.H., Morley, R.J., Bush, A.B.G., 2009. The current refugial rainforests ofSundaland are unrepresentative of their biogeographic past and highly vulnerableto disturbance. Proceedings of theNational Academy of Sciences 106, 11188–11193.
Chesner, C.A., Rose, W.I., Deino, A., Drake, R., Westgate, J.A., 1991. Eruptive history ofEarth's largest Quaternary caldera (Toba, Indonesia) clarified. Geology 19, 200–203.
Collins, N.M., Sayer, J.A., Whitmore, T.C., 1991. The Conservation Atlas of TropicalForests: Asia and the Pacific. Macmillan Press, London.
De Deckker, P., Gingele, F.X., 2002. On the occurrence of the giant diatom Ethmodiscusrex in a 80-ka record from a deep-sea core, southeast of Sumatra, Indonesia:implications for tropical palaeoceanography. Marine Geology 183, 31–43.
de Laubenfels, D.J., 1988. Coniferales. Flora Malesiana, Series I—Spermatophyta(flowering plants) 10 (3). Sijthoff-Noordhoff, Alphen a/d Rijn 337–453.
Flenley, J.R., Butler, K., 2001. Evidence for continued disturbance of upland rain forest inSumatra for the last 7000 years of an 11,000 year record. Palaeogeography,Palaeoclimatology, Palaeoecology 171, 289–305.
Fontanel, J., Chantefort, A., 1978. Bioclimats du monde Indonésien. Tome XVI, InstitutFrançais de Pondichéry. Pondichéry, India.
Gingele, F.X., De Deckker, P., Hillenbrand, C.-D., 2001. Clay mineral distribution insurface sediments between Indonesia and NW Australia — source and transport byocean currents. Marine Geology 179, 135–146.
Gingele, F.X., De Deckker, P., Girault, A., Guichard, F., 2002. High-resolution history ofthe South Java Current during the past 80 ka. Palaeogeography, Palaeoclimatology,Palaeoecology 183, 247–260.
Grimm, E.C., 1987. CONISS: a FORTRAN 77 program for stratigraphically constrainedcluster analysis by the method of incremental sum of squares. Computers andGeoscience 13 (1), 13–35.
Heusser, L., 1978. Spores and pollen in the marine realm. In: Haq, B.U., Boersma, E.(Eds.), Introduction toMarine Micropaleontology. Elsevier, New York, pp. 327–339.
Hughen, K.A., Baillie, M.G.L., Bard, E., Bayliss, A., Beck, J.W., Bertrand, C.J.H., Blackwell, P.G.,Buck, C.E., Burr, G.S., Cutler, K.B., Damon, P.E., Edwards, R.L., Fairbanks, R.G.,Friedrich, M., Guilderson, T.P., Kromer, B., McCormac, F.G., Manning, S.W., BronkRamsey, C., Reimer, P.J., Reimer, R.W., Remmele, S., Southon, J.R., Stuiver, M.,Talamo, S., Taylor, F.W., van der Plicht, J., Weyhenmeyer, C.E., 2004. Marine04marine radiocarbon age calibration, 26–0 ka BP. Radiocarbon 46, 1059–1086.
Kershaw, A.P., Penny, D., van der Kaars, S., Anshari, G., Thamotherampillai, A., 2001.Vegetation and climate in lowland southeast Asia at the Last Glacial Maximum. In:Metcalfe, I., Smith, J.M.B., Morwood, M., Davidson, I. (Eds.), Faunal and FloralMigration and Evolution in SE Asia–Australasia. Balkema, Lisse, pp. 227–236.
Kershaw, A.P., van der Kaars, S., Flenley, J.R., 2007. The Quaternary history of far easternrainforests. In: Bush, M.B., Flenley, J.R. (Eds.), Tropical Rainforest Responses toClimate Change. Springer, Berlin, pp. 77–115.
Laumonier, Y., Gadrinab, A., Purnajaya, 1983. Sumatra Sud, carte du tapis végétal et desconditions écologiques, Institut de la carte internationale du tapis vegetal/SEAMEO-BIOTROP, 1983, 1:1 000 000.
Levi, C., Labeyrie, L., Bassinot, F., Guichard, F., Cortijo, E., Waelbroeck, C., Caillon, N.,Duprat, J., de Garidel-Thoron, T., Elderfield, H., 2007. Low-latitude hydrologicalcycle and rapid climate changes during the last deglaciation. Geochemistry,Geophysics, Geosystems 8, Q05N12. doi:10.1029/2006GC001514.
Lückge, A., Mohtadi, M., Rühlemann, C., Scheeder, G., Vink, A., Lutz, R., Wiedicke, M.,2009. Monsoon versus ocean circulation controls on paleoenvironmental condi-tions off southern Sumatra during the past 300,000 years. Paleoceanography 24,PA1208. doi:10.1029/2008PA001627.
Maloney, B.K., 1980. Pollen analytical evidence for early forest clearance in NorthSumatra. Nature 287, 324–326.

78 S. van der Kaars et al. / Palaeogeography, Palaeoclimatology, Palaeoecology 296 (2010) 52–78
Maloney, B.K., 1985. Man's impact on the rainforests of West Malesia: the palynologicalrecord. Journal of Biogeography 12, 527–558.
Maloney, B.K., McCormac, F.G., 1995. A 30,000 year pollen and radiocarbon record fromhighland Sumatra as evidence for climatic change. Radiocarbon 37, 181–190.
Mohtadi, M., Steinke, S., Lückge, A., Groeneveld, J., Hathorne, E.C., 2010. Glacial toHolocene surface hydrography of the tropical eastern Indian Ocean. Earth andPlanetary Science Letters 292, 89–97.
Monk, K.A., de Fretes, Y., Reksodiharjo-Lilley, G., 1997. The Ecology of Nusa Tenggaraand Maluku. Periplus Editions, Singapore. 966 pp.
Morley, R.J., 1982. A palaeoecological interpretation of a 10,000 year pollen record fromDanau Padang, Central Sumatra, Indonesia. Journal of Biogeography 9, 151–190.
Morley, R.J., Morley, H.P., Wonders, A.A.H., Sukarno, van der Kaars, S., 2004.Biostratigraphy of modern (Holecene and Late Pleistocene) sediment coresfrom the Makassar Straits. Indonesian Petroleum Association Proceedings,Deepwater and Frontier Exploration in Asia & Australasia Symposium, December2004.
Murgese, D.S., De Deckker, P., Spooner, M.I., Young, M., 2008. A 35,000 year record ofchanges in the eastern Indian Ocean offshore Sumatra. Palaeogeography,Palaeoclimatology, Palaeoecology 265, 195–213.
New, M., Lister, D., Hulme, M., Makin, I., 2002. A high-resolution data set of surfaceclimate over global land areas. Climate Research 21, 1–25.
Newsome, J., Flenley, J.R., 1988. Late Quaternary vegetational history of the CentralHighlands of Sumatra. II Palaeopalynology and vegetational history. Journal ofBiogeography 15, 555–578.
Paillard, D., Labeyrie, L., Yiou, P., 1996. Macintosh program performs time-seriesanalysis. EOS Transactions, American Geophysical Union 379.
Ramage, C.S., 1968. Role of a tropical “maritime continent” in the atmosphericcirculation. Monthly Weather Review 96, 365–370.
Stuijts, I., 1984. Palynological study of Situ Bayongbong, West Java. Modern QuaternaryResearch in South-East Asia 8, 17–27.
Stuijts, I.-L.M., 1993. Late Pleistocene and Holocene vegetation onWest Java, Indonesia.Modern Quaternary Research in South-East Asia 12.
Stuijts, I., Newsome, J.C., Flenley, J.R., 1988. Evidence for late Quaternary vegetationalchange in the Sumatran and Javan highlands. Review of Palaeobotany andPalynology 55, 207–216.
Stuiver, M., Reimer, P.J., 1993. Extended 14C database and revised CALIB radiocarboncalibration program. Radiocarbon 35, 215–230.
Tapper, N., 2002. Climate, climatic variability and atmospheric circulation patterns inthe maritime continent region. In: Kershaw, A., David, B., Tapper, N., Penny, D.,Brown, J. (Eds.), Bridging Wallace's Line: The Environmental and Cultural Historyand Dynamics of the Southeast Asian — Australian Region. Catena Verlag,Reiskirchen, pp. 5–28.
Turney, C.S.M., Kershaw, A.P., Lowe, J.J., van der Kaars, S., Johnston, R., Rule, S., Moss, P.,Radke, L., Tibby, J., McGlone, M.S., Wilmshurst, J., Vandergoes, M., Fitzsimons, S.,Bryant, C., James, S., Branch, N.P., Cowley, J., Kalin, R.M., Ogle, N., Jacobsen, G., Fifield,L.K., 2006. Climate variability in the southwest Pacific during the Last Termination(20 – 10 kyr BP). Quaternary Science Reviews 25, 886–903.
van der Kaars, W.A., 1991. Palynology of eastern Indonesian marine piston-cores: a LateQuaternary vegetational and climatic record for Australasia. Palaeogeography,Palaeoclimatology, Palaeoecology 85, 239–302.
van der Kaars, S., 1998. Marine and terrestrial pollen records of the last glacial cyclefrom the Indonesian region: Bandung Basin and Banda Sea. Palaeoclimates 3,209–219.
van der Kaars, W.A., Dam, M.A.C., 1995. A 135,000-year record of vegetational andclimatic change from the Bandung area, West-Java, Indonesia. Palaeogeography,Palaeoclimatology, Palaeoecology 117, 55–72.
van der Kaars, S., Dam, R., 1997. Vegetation and climate change inWest-Java, Indonesia,during the last 135,000 years. Quaternary International 37, 67–71.
van der Kaars, S., Wang, X., Kershaw, A.P., Guichard, F., Setiabudi, D.A., 2000. A LateQuaternary palaeoecological record from the Banda Sea, Indonesia: patterns ofvegetation, climate and biomass burning in Indonesia and northern Australia.Palaeogeography, Palaeoclimatology, Palaeoecology 155, 135–153.
van der Kaars, S., Penny, D., Tibby, J., Fluin, J., Dam, R., Suparan, P., 2001a. LateQuaternary palaeoecology, palynology and palaeolimnology of a tropical lowlandswamp: Rawa Danau, West Java, Indonesia. Palaeogeography, Palaeoclimatology,Palaeoecology 171, 185–212.
van der Kaars, S., Kershaw, A.P., Tapper, N., Moss, P., Turney, C., 2001b. Pollen records ofthe last glacial cycle in the southern hemisphere tropics of the PEPII transect.PAGES News 9 (2), 11–12.
Verstappen, H.T., 1975. On palaeo climates and landform development in Malesia.Modern Quaternary Research in South-East Asia 1, 3–35.
Visser, K., Thunell, R., Goñi, M.A., 2004. Glacial–interglacial organic carbon record fromthe Makassar Strait, Indonesia: implications for regional changes in continentalvegetation. Quaternary Science Reviews 23, 17–27.
Wang, L., 2000. Isotopic signals in two morphotypes of Globigerinoïdes ruber (white)from the South China Sea: implications for monsoon climate change during the lastglacial cycle. Palaeoceanography, Palaeoclimatology, Palaeoecology 161, 381–394.
Wessel, P., Smith, W.H.F., 1998. New, improved version of Generic Mapping Toolsreleased. EOS. Transactions of the American Geophysical Union 79 (47), 579.
Whitten, T., Damanik, S.J., Anwar, J., Hisyam, N., 2000. The Ecology of Sumatra. PeriplusEdition, Hong Kong.
Zielinski, G.A., Mayewski, P.A., Meeker, L.D., Whitlow, S., Twickler, M.S., 1996. Potentialatmospheric impact of the Toba mega-eruption 71,000 years ago. GeophysicalResearch Letters 23 (8), 837–840.