Pakistan strategy 2019 final6-1-2019 - imtrade.biz · +3.0% vs. a median of +1.1% for EM and FM...
45
Intermarket Securities is the Local Research Partner of Exotix Capital To find our Research on Bloomberg, please type - IMKP <GO> Pakistan Strategy 2019 Research Entity Number – REP-085 www.jamapunji.pk ANALYST CERTIFICATION AND REQUIRED DISCLOSURES BEGIN ON PAGE 44 7 January 2019 IMS Research [email protected] +92-21-111-467-000 Ahead of the curve Pakistan’s economy saw a major reset in 2018, leading to a sharp correction in valuation multiples. However, with the Discount Rate up a swift 425bps to 10.5% and the PKR having already depreciated by c.25% vs. the US$, we believe the adjustment phase is nearing its end. The market now trades at a 2019f P/E of 7.4x vs. its cross- cycle average of 8.6x and a peak of more than 12x at EM upgrade in mid-2017. Out of the universe of more than fifty Emerging and Frontier countries, Pakistan is among the cheapest five markets even as its projected earnings growth is in the top five. We believe this valuation gap can start to close once Pakistan enters an IMF program, likely in 1Q 2019, which can convincingly address Balance of Payments concerns and potentially trigger foreign buying. There are risks to the EM status, as well as headwinds to significant valuation rerating, but we believe it is now difficult to ignore Pakistan. The risk-reward appears favorable; we think any downside will be limited while the KSE-100 has the potential to rally up to 45,000pts in 2019, 21% higher from 2018’s close. The KSE-100’s fall in the last eighteen months was precipitated by Balance of Payment concerns. 2019 is about getting back on track and course correction has already commenced. We recommend going Overweight on Pakistan. Economic stabilization measures have already been taken 2019 is likely to feature greater fiscal consolidation but we believe interest and exchange rates are now near equilibrium levels. Having already risen by a swift 425bps in 2018, we see the Discount Rate increasing by another 50bps to 11.0%. Similarly, further PKR weakness in 2019 may be limited to 7-8%, in our view - the market’s average dividend yield is enough to account for this level of currency risk. The economy will slow in the interim – we see GDP growth at 4.0% in 2019 vs. 5.8% in 2018 – but the corrective measures taken thus far can result in recovery from 2020, particularly if international oil prices remain soft. The import cover is still below two months but, importantly, fx reserves are finding a foothold. Reserves rebuilding should gather both momentum and credibility with entry into an IMF program, which we pencil in for 1Q 2019. Historically, rising fx reserves have acted as a key catalyst for the KSE-100 Index and a repeat can occur in 2019. Pakistan is standing out against peers Given that the adjustment to interest and exchange rates has been among the swiftest in the Emerging and Frontier universe, Pakistan appears ahead of the curve relative to peers that are in the early stages of their own course corrections. Real interest rates in Pakistan are +3.0% vs. a median of +1.1% for EM and FM markets. Similarly, the PKR’s rapid devaluation in 2018 – the most after Argentina and Turkey – has brought the REER down to 104 vs. 124 in Nov’17. Pakistan’s domestic-driven economy (exports are a limited 7% of GDP vs. a median of 20% for peers) can potentially also stand out in a global environment facing challenges to growth and trade. While we flag risks to Pakistan’s EM status – it could be put on watch for downgrade to FM – this may arguably be taken as a positive by investors. A combination of corrective macroeconomic measures (that have already taken place) and cheap valuations can also attract foreign buying, for the first time since 2014, especially if an IMF program comes through. Risk-reward is attractive Valuations are supportive – Pakistan trades at a 2019f P/E of 7.4x, the lowest since Nov’13, and at a 13% discount to its cross-cycle average (2006 till date) of 8.6x. On the basis of P/B and P/S, the discount is an even sharper 33% and 23%. Pakistan is among the cheapest markets in the Emerging and Frontier universe and also offers the 2nd highest dividend yield in this space. Despite the slower economy, headline earnings growth is resilient; the IMS Universe is projected to post growth of 13% in 2019f and 16% in 2020f. Although 2019 growth will primarily be driven by Banks and E&P, it will be more broad-based across the medium-term. We think that even if the market’s P/E remains confined to a tight band in 2019, the KSE-100 has the potential to rally towards 45,000pts (21% higher than the Index’s last close). This has precedence; range-bound valuations (average P/E of 6.3x) and strong earnings growth (22%pa) last occurred during CY09-12 when the KSE-100 returned a CAGR of more than 20%. Market Snapshot As of Dec’31, 2018 KSE 100 Index 37,067 Market Cap (PKRbn) 7,693 Market Cap (US$bn) 55 Market Free Float 28% CY18 Return (US$) -27% Forward PE (x) 7.4 Avg. Daily Vol (mn shrs) 184 Avg. Daily Td Val (PKR mn) 7,872 Avg. Daily Td Val (US$ mn) 65 CY18 KSE100 Index – High (pts) 46,638 CY18 KSE100 Index – Low (pts) 36,663 Macro Projections 2018 2019F 2020F CPI - FY avg. 3.9% 7.0% 8.0% DR - CY end 10.5% 11.0% 10.0% PKR/USD - CY end 138.9 151.9 157.0 Source: IMS Research IMS Top 5 Picks TP (PKR) Upside UBL 180 37% PPL 191 27% ENGRO 379 20% LUCK 580 31% NML 180 33%
Transcript of Pakistan strategy 2019 final6-1-2019 - imtrade.biz · +3.0% vs. a median of +1.1% for EM and FM...

Intermarket Securities is the Local Research Partner of Exotix Capital To find our Research on Bloomberg, please type - IMKP <GO>
Pakistan Strategy 2019
Research Entity Number – REP-085 www.jamapunji.pk
ANALYST CERTIFICATION AND REQUIRED DISCLOSURES BEGIN ON PAGE 44
7 January 2019 IMS Research [email protected] +92-21-111-467-000
Ahead of the curvePakistan’s economy saw a major reset in 2018, leading to a sharp correction in valuation multiples. However, with the Discount Rate up a swift 425bps to 10.5% and the PKR having already depreciated by c.25% vs. the US$, we believe the adjustment phase is nearing its end. The market now trades at a 2019f P/E of 7.4x vs. its cross-cycle average of 8.6x and a peak of more than 12x at EM upgrade in mid-2017. Out of the universe of more than fifty Emerging and Frontier countries, Pakistan is among the cheapest five markets even as its projected earnings growth is in the top five. We believe this valuation gap can start to close once Pakistan enters an IMF program, likely in 1Q 2019, which can convincingly address Balance of Payments concerns and potentially trigger foreign buying. There are risks to the EM status, as well as headwinds to significant valuation rerating, but we believe it is now difficult to ignore Pakistan. The risk-reward appears favorable; we think any downside will be limited while the KSE-100 has the potential to rally up to 45,000pts in 2019, 21% higher from 2018’s close. The KSE-100’s fall in the last eighteen months was precipitated by Balance of Payment concerns. 2019 is about getting back on track and course correction has already commenced. We recommend going Overweight on Pakistan. Economic stabilization measures have already been taken 2019 is likely to feature greater fiscal consolidation but we believe interest and exchange rates are now near equilibrium levels. Having already risen by a swift 425bps in 2018, we see the Discount Rate increasing by another 50bps to 11.0%. Similarly, further PKR weakness in 2019 may be limited to 7-8%, in our view - the market’s average dividend yield is enough to account for this level of currency risk. The economy will slow in the interim – we see GDP growth at 4.0% in 2019 vs. 5.8% in 2018 – but the corrective measures taken thus far can result in recovery from 2020, particularly if international oil prices remain soft. The import cover is still below two months but, importantly, fx reserves are finding a foothold. Reserves rebuilding should gather both momentum and credibility with entry into an IMF program, which we pencil in for 1Q 2019. Historically, rising fx reserves have acted as a key catalyst for the KSE-100 Index and a repeat can occur in 2019. Pakistan is standing out against peers Given that the adjustment to interest and exchange rates has been among the swiftest in the Emerging and Frontier universe, Pakistan appears ahead of the curve relative to peers that are in the early stages of their own course corrections. Real interest rates in Pakistan are +3.0% vs. a median of +1.1% for EM and FM markets. Similarly, the PKR’s rapid devaluation in 2018 – the most after Argentina and Turkey – has brought the REER down to 104 vs. 124 in Nov’17. Pakistan’s domestic-driven economy (exports are a limited 7% of GDP vs. a median of 20% for peers) can potentially also stand out in a global environment facing challenges to growth and trade. While we flag risks to Pakistan’s EM status – it could be put on watch for downgrade to FM – this may arguably be taken as a positive by investors. A combination of corrective macroeconomic measures (that have already taken place) and cheap valuations can also attract foreign buying, for the first time since 2014, especially if an IMF program comes through. Risk-reward is attractive Valuations are supportive – Pakistan trades at a 2019f P/E of 7.4x, the lowest since Nov’13, and at a 13% discount to its cross-cycle average (2006 till date) of 8.6x. On the basis of P/B and P/S, the discount is an even sharper 33% and 23%. Pakistan is among the cheapest markets in the Emerging and Frontier universe and also offers the 2nd highest dividend yield in this space. Despite the slower economy, headline earnings growth is resilient; the IMS Universe is projected to post growth of 13% in 2019f and 16% in 2020f. Although 2019 growth will primarily be driven by Banks and E&P, it will be more broad-based across the medium-term. We think that even if the market’s P/E remains confined to a tight band in 2019, the KSE-100 has the potential to rally towards 45,000pts (21% higher than the Index’s last close). This has precedence; range-bound valuations (average P/E of 6.3x) and strong earnings growth (22%pa) last occurred during CY09-12 when the KSE-100 returned a CAGR of more than 20%.
Market Snapshot
As of Dec’31, 2018 KSE 100 Index 37,067 Market Cap (PKRbn) 7,693 Market Cap (US$bn) 55 Market Free Float 28% CY18 Return (US$) -27% Forward PE (x) 7.4 Avg. Daily Vol (mn shrs) 184 Avg. Daily Td Val (PKR mn) 7,872 Avg. Daily Td Val (US$ mn) 65 CY18 KSE100 Index – High (pts) 46,638 CY18 KSE100 Index – Low (pts) 36,663
Macro Projections 2018 2019F 2020F CPI - FY avg. 3.9% 7.0% 8.0% DR - CY end 10.5% 11.0% 10.0% PKR/USD - CY end 138.9 151.9 157.0 Source: IMS Research
IMS Top 5 Picks
TP (PKR) Upside UBL 180 37% PPL 191 27% ENGRO 379 20% LUCK 580 31% NML 180 33%

2 | P a g e
Pakistan Strategy 2019
Contents
2018 Review: Another political transition, another BoP crisis 3 Pakistan Market Timeline 3
2019 Strategy Synopsis 4 IMS Top Picks 4
Economic stabilization measures have already been taken 5 A sustainable Fx reserves buildup is a key catalyst 6 Large adjustments to interest and exchange rates are behind us 6 More is needed on the fiscal side 8 Growth will slow in 2019 but a quick rebound is not impossible 9
Pakistan is standing out against peers 10 Looking good to attract foreign buying 11 Possible downgrade to FM may act like an upgrade 12
Risk-reward is attractive 13 Attractive levels for building positions 13 The GDP-Earnings disconnect 13 Earnings growth can drive the market, even if valuations are range-bound 14 Banks to drive 2019 growth; more broad-based growth in 2020 14 KSE-100 can rally up to 45,000pts in 2019 15 Risks 16
Sector Outlook 17 Banks: Back on the growth track 18 E&P: Cheap valuations but triggers ahead 19 Fertilizer: Risk-reward in balance 20 Cement: Stay selective 21 OMCs: Tough period ahead 22 Power: Expansion projects & circular debt settlement 23 Textile: Looking good thematically 24 Autos: Bumpy ride ahead 25 Steel: Awaiting triggers 26 Pharmaceuticals: Correction has opened entry points 27 Consumer (Dairy): Challenges aplenty but long-term theme is intact 28 Insurance: Life business will mitigate the cyclicality of general business 29
Top Picks United Bank Ltd: Offers great risk-reward 31 Habib Bank Ltd: Normalization is a matter of time 32 Bank Alfalah Ltd: Play on margin expansion 33 Pakistan Petroleum Ltd: Diversification on the rise 34 Engro Corporation Ltd: Valuations are attractive 35 Engro Fertilizer Ltd: Safest bet in the fertilizer space 36 Lucky Cement Ltd: Well-positioned amid resilient core competencies 37 Attock Petroleum Ltd: Deserves a premium over peers 38 Hub Power Co. Ltd: The only way from here is up 39 Nishat Power Ltd: Efficient IPP with renewed hope of payouts 40 Nishat Mills Ltd: Worst is priced in, valuations are attractive 41 Indus Motor Co Ltd: Outperforming peers amid regulatory fallout 42
IMS Universe Summary 43 Disclaimer & Disclosures 44

3 | P a g e
Pakistan Strategy 2019
2018 Review: Another political transition, another BoP crisis The KSE-100 shed 8% in 2018 (-27% in US$ terms), deeply underperforming the MSCI EM and FM indices that were down 17% and 19%, respectively. This was the 2nd year in a row with negative returns in Pakistan, which has not happened since the mid-1990s. While the year started on a buoyant note – led by foreign buying of US$86mn in Jan’18 - sharp FPI outflow over the next 11 months took the market lower. Foreign selling for the year eventually clocked in at US$537mn, taking cumulative outflows since 2015 to US$1.7bn. Weak investor confidence showed up in daily turnover falling to US$65mn, a 7 year low. Despite transfer of power from one elected government to another (PML-N to PTI), the democratic polity appeared to cede space. That said, major state institutions appear to be better aligned now, which is a positive. Similar to past political transitions, Pakistan faced a Balance of Payments crisis that led to corrective measures; interest rates increased 425bps to 10.5% and PKR devalued by c.25%. As a result, the KSE-100’s forward P/E fell from 9.1x at the start of 2018 to 7.4x at the end.
Consecutive negative years for the first time since the 1990s
-25%
74%
-5%
-27% -1
1%31
%-4
6%49
%7%
-16%
112%
66%
39% 54
%5%
40%
-58%
60%
28%
-6%
49%
49%
27%
2%46
%-1
5% -8%
-80%
-40%
0%
40%
80%
120%
160%
CY92
CY94
CY96
CY98
CY00
CY02
CY04
CY06
CY08
CY10
CY12
CY14
CY16
CY18
KSE100 Return
Source: PSX
Foreign selling accelerated but outlook for 2019 is better
26
526
-127
126
398 383
-315 -339-488 -537-600
-400
-200
0
200
400
600
CY09
CY10
CY11
CY12
CY13
CY14
CY15
CY16
CY17
CY18
FIPI Flows - US$mn
Source: NCCPL
Market activity was subdued in 2018
0
100
200
300
400
500
600
CY00
CY01
CY02
CY03
CY04
CY05
CY06
CY07
CY08
CY09
CY10
CY11
CY12
CY13
CY14
CY15
CY16
CY17
CY18
Td. Val (US$mn) Mkt Vol (shrs mn)
Source: PSX
Defensive sectors outperformed
8%
2%
-1%
-5%
-8%
-9%
-9%
-10%
-14%
-18%
-20%
-23%
-37%
-41%
-50%-40%-30%-20%-10%
0%10%20%
Fert
ilize
r
Othe
rs
Text
ile
Bank
s
OMCs
Pow
er
Tele
com
Phar
ma.
Food E&
P
Gas U
tiliti
es
Cem
ent
Auto
s
Engi
neer
ing
Source: PSX
35,000
37,000
39,000
41,000
43,000
45,000
47,000
49,000
Jan-18 Feb-18 Mar-18 Apr-18 May-18 Jun-18 Jul-18 Aug-18 Sep-18 Oct-18 Nov-18 Dec-18
Pakistan Market Timeline
Pak-US relations worsen
US acts on trade war
Monetary tightening begins / Fitch outlook turns negative
Senate elections2nd round of PKR depreciation
China responds on US tariffs
Amnesty scheme details announced
PML-N announces its last budget
US pulls out from Iran deal
Pak's weight stable in MSCI reblancing
Moody downgrades outlook
Nawaz Sharif sentenced to jail
PTI wins elections 3rd rate hike by US Fed
DR increased by 100bps
Gas price increased
Finance Minister states IMF is an option
Saudi Arabia announces FX support
UBL and LUCK downgraded to MSCI small cap
DR up by 150bps, cumulatively by 425bps
US China trade war truce
Fx support from UAE
Source: IMS Research

4 | P a g e
Pakistan Strategy 2019
2019 Strategy Synopsis
• Valuations are attractive: 2019f P/E of 7.4x is at a 13% discount to its cross-cycle average (since 2006) of 8.6x and a 40%+ discount from the peak of 12.0x+ at EM upgrade in mid-2017. With the bulk of the macroeconomic adjustment behind us, in our view, valuations appear to have room to expand rather than contract further.
• Headline earnings growth is resilient: The IMS Universe is projected to post 13%yoy growth in 2019f, concentrated in Banks and E&P. Earnings growth in 2020f is more inclusive and expected at 16%yoy. Even if valuation multiples fluctuate in a tight band, earnings growth has the potential to drive the market higher.
• Balance of Payment concerns are easing: We pencil in IMF program entry in 1Q 2019. Stabilization of fx reserves has already commenced due to bilateral assistance, and an IMF program will add both momentum and credibility to this exercise. Historically, rising fx reserves have acted as a strong catalyst for the market and the same can repeat in 2019.
• Foreign buying may return: Pakistan now appears attractive relative to other Emerging and Frontier market countries on (i) valuations, (ii) real interest rates, (iii) currency outlook and (iv) earnings growth. Lower oil prices are also a key positive. We believe there is a strong case for foreign buying in 2019, for the first time since 2014. It is possible that MSCI puts Pakistan on watch for downgrade to FM, but this may be taken as a positive by foreign investors.
• Domestic-driven theme: Pakistan has a limited connection to global headwinds on growth and trade, in our view. As Pakistan emerges out of its Balance of Payments issues – so often the key element of its boom and bust cycles - the market should depict a rebound even if global sentiment stays risk-off.
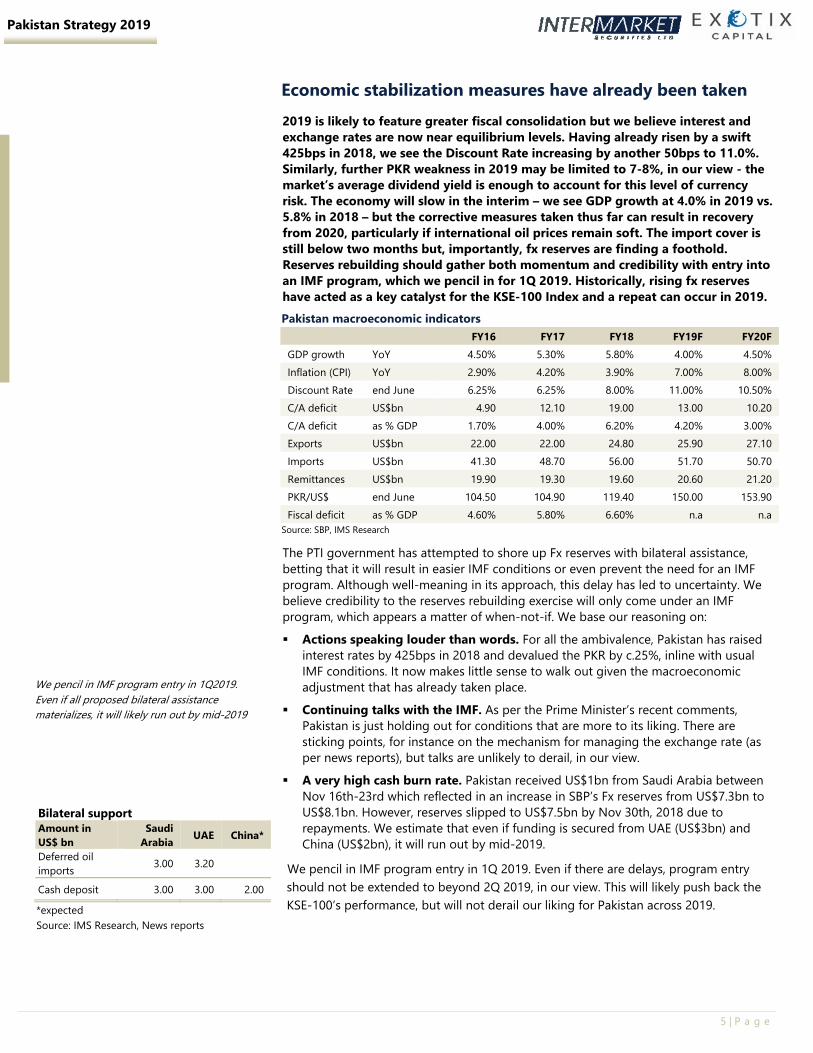
IMS Top Picks Mkt Cap Price TP Upside/ P/E (x) P/B (x) DY (%)
Top Picks (US$bn) (PKR/sh) (PKR/sh) downside 2019F 2020F 2019F 2020F 2019F 2020F UBL 1.16 131.6 180.0 37% 7.06 5.61 0.94 0.84 6.1% 7.6% HBL 1.30 123.5 175.0 42% 7.33 5.75 0.89 0.79 4.9% 6.5% BAFL 0.58 45.2 58.0 28% 5.65 5.30 0.93 0.83 6.6% 7.7% PPL 2.45 150.0 191.0 27% 6.08 5.67 1.22 1.10 4.7% 8.7% ENGRO 1.19 315.0 379.5 20% 7.55 5.68 0.79 0.68 9.2% 9.5% EFERT 0.69 72.2 89.0 23% 6.69 6.35 2.10 2.02 13.8% 13.8% LUCK 1.03 442.2 580.0 31% 9.91 9.38 1.18 1.07 2.8% 2.8% APL 0.32 450.0 606.0 35% 7.26 6.31 2.24 2.06 10.2% 12.0% HUBC 0.72 86.2 132.2 53% 7.68 4.77 2.00 1.45 5.8% 5.8% NPL 0.07 26.5 36.4 37% 2.34 2.11 0.48 0.42 7.5% 18.9% NML 0.34 135.4 180.0 33% 11.02 7.72 0.61 0.58 3.0% 5.2% INDU 0.68 1,200.0 1,580.0 32% 7.54 6.71 2.35 2.14 9.6% 10.8% Source: IMS Research
5 | P a g e
Pakistan Strategy 2019
Economic stabilization measures have already been taken 2019 is likely to feature greater fiscal consolidation but we believe interest and exchange rates are now near equilibrium levels. Having already risen by a swift 425bps in 2018, we see the Discount Rate increasing by another 50bps to 11.0%. Similarly, further PKR weakness in 2019 may be limited to 7-8%, in our view - the market’s average dividend yield is enough to account for this level of currency risk. The economy will slow in the interim – we see GDP growth at 4.0% in 2019 vs. 5.8% in 2018 – but the corrective measures taken thus far can result in recovery from 2020, particularly if international oil prices remain soft. The import cover is still below two months but, importantly, fx reserves are finding a foothold. Reserves rebuilding should gather both momentum and credibility with entry into an IMF program, which we pencil in for 1Q 2019. Historically, rising fx reserves have acted as a key catalyst for the KSE-100 Index and a repeat can occur in 2019.
The PTI government has attempted to shore up Fx reserves with bilateral assistance, betting that it will result in easier IMF conditions or even prevent the need for an IMF program. Although well-meaning in its approach, this delay has led to uncertainty. We believe credibility to the reserves rebuilding exercise will only come under an IMF program, which appears a matter of when-not-if. We base our reasoning on: Actions speaking louder than words. For all the ambivalence, Pakistan has raised
interest rates by 425bps in 2018 and devalued the PKR by c.25%, inline with usual IMF conditions. It now makes little sense to walk out given the macroeconomic adjustment that has already taken place.
Continuing talks with the IMF. As per the Prime Minister’s recent comments, Pakistan is just holding out for conditions that are more to its liking. There are sticking points, for instance on the mechanism for managing the exchange rate (as per news reports), but talks are unlikely to derail, in our view.
A very high cash burn rate. Pakistan received US$1bn from Saudi Arabia between Nov 16th-23rd which reflected in an increase in SBP’s Fx reserves from US$7.3bn to US$8.1bn. However, reserves slipped to US$7.5bn by Nov 30th, 2018 due to repayments. We estimate that even if funding is secured from UAE (US$3bn) and China (US$2bn), it will run out by mid-2019.
We pencil in IMF program entry in 1Q 2019. Even if there are delays, program entry should not be extended to beyond 2Q 2019, in our view. This will likely push back the KSE-100’s performance, but will not derail our liking for Pakistan across 2019.
Pakistan macroeconomic indicators FY16 FY17 FY18 FY19F FY20F
GDP growth YoY 4.50% 5.30% 5.80% 4.00% 4.50% Inflation (CPI) YoY 2.90% 4.20% 3.90% 7.00% 8.00% Discount Rate end June 6.25% 6.25% 8.00% 11.00% 10.50% C/A deficit US$bn 4.90 12.10 19.00 13.00 10.20 C/A deficit as % GDP 1.70% 4.00% 6.20% 4.20% 3.00% Exports US$bn 22.00 22.00 24.80 25.90 27.10 Imports US$bn 41.30 48.70 56.00 51.70 50.70 Remittances US$bn 19.90 19.30 19.60 20.60 21.20 PKR/US$ end June 104.50 104.90 119.40 150.00 153.90 Fiscal deficit as % GDP 4.60% 5.80% 6.60% n.a n.a
Source: SBP, IMS Research
We pencil in IMF program entry in 1Q2019. Even if all proposed bilateral assistance materializes, it will likely run out by mid-2019
Bilateral support Amount in US$ bn
Saudi Arabia UAE China*
Deferred oil imports 3.00 3.20
Cash deposit 3.00 3.00 2.00
*expected Source: IMS Research, News reports

6 | P a g e
Pakistan Strategy 2019
A sustainable Fx reserves buildup is a key catalyst Since the 1990s, Pakistan has faced a Balance of Payments crisis with predictable regularity, typically coinciding with political transitions. The only prolonged stretch without an IMF program was across the Musharraf era; since then a change in government has always ended in an IMF program, be it in 2008, 2013 or, as we now anticipate, in 2019. This is because of weak buffers, particularly on Fx reserves - on average Pakistan has maintained an import cover of just six months (peak of ten months). If a shock occurs or if political expediency takes precedence around elections, Fx reserves quickly plummet to alarming levels. When this happens, the KSE-100 also follows suit.
This cuts both ways though. As Fx reserves begin to rebuild, the equity market also starts to perform. If an IMF program is taken, as is likely, it will unlock greater funds from other multilateral lenders such as the World Bank, and also make it easier for Pakistan to issue fresh bonds. There may be question marks on timing but a reserves buildup in 2019, is very likely, in our view. As in past instances, this will be a key catalyst for the Pakistan market. Over the medium-term, there is a need to build fx reserves through structural reforms for instance by (i) reducing the trade deficit, (ii) focusing on increasing official remittances and (iii) encouraging FDI. In the near-term however, an inflection point in fx reserves will likely imply the same for the equity market.
Large adjustments to interest and exchange rates are behind us The Discount Rate rose by 425bps to 10.5% in 2018 while the PKR’s devaluation vs. the US$ in this cycle stands at c.25%. These are large moves by any standard and we believe further adjustments on these fronts are likely to be modest. We see the Discount Rate peaking at 11.0% in 2019. This is due to: • Deeply positive real interest rates. IMF’s average CPI forecast of 7.5% for 2019
implies real interest rates are at 3%. Even going by core inflation, real interest rates are at 2%.
• Softer oil prices that are easing inflationary pressures. CPI jumped from 5.1% in Sep’18 to 6.8% in Oct’18 before easing to 6.2% in Dec’18.
• Benign outlook for food inflation which has a c 35% weight in the CPI basket. Even if non-food inflation is higher (House Rent, Education, Health and Clothing - combined 36% weight in CPI - are all growing by 1-2ppt more than their long-term rate), the outlook for overall CPI is moderate.
Fx reserves vs. the KSE-100
0
10,000
20,000
30,000
40,000
50,000
60,000
-
5,000
10,000
15,000
20,000
Jan-
01
May
-02
Oct-0
3
Feb-
05
Jul-0
6
Nov-
07
Apr-0
9
Aug-
10
Jan-
12
Jun-
13
Oct-1
4
Mar
-16
Jul-1
7
Dec-
18
SBP Reserves (USD 'Mn) KSE100 Index - Rhs
Source: SBP, IMS Research
A sustainable rise in fx reserves will trigger market performance

7 | P a g e
Pakistan Strategy 2019
Similarly, we expect further PKR weakness this year to be limited to a modest 5%-7%. This is due to: • Significant improvement in the REER, which stood at 104 in Dec’18 vs. 124 in
Nov’17. The PKR’s c.25% devaluation since mid-Dec’17 has also made up for the managed rates during the PML-N term as the PKR is now back on its long-term average depreciation run rate vs. the US$ (c 7%pa).
• Fx reserves finding a foothold. The import cover is estimated at a c 1.7 months but should not fall further in our view, given expectations of assistance from UAE (US$3bn) and China (US$2bn). Sustainable fx reserves buildup is unlikely to happen without an IMF program, but there appears to be a floor on reserves.
• Improving current account: The CA deficit averaged US$1.6bn per month in FY18. It has averaged US$1.2bn per month in 5MFY19 and the monthly run rate is likely to fall below US$1bn due to the benefit of deferred oil payments, falling commodity prices and lower non-essential imports (e.g. machinery imports are reducing as early-stage CPEC projects are mostly complete).
Preemptive monetary tightening…
-
4.0
8.0
12.0
16.0
20.0
Jan-
10M
ay-1
0Se
p-10
Feb-
11Ju
n-11
Nov
-11
Mar
-12
Aug-
12De
c-12
Apr-
13Se
p-13
Jan-
14Ju
n-14
Oct
-14
Mar
-15
Jul-1
5De
c-15
Apr-
16Au
g-16
Jan-
17M
ay-1
7O
ct-1
7Fe
b-18
Jul-1
8N
ov-1
8
(%)
DR CPI
Source: SBP
…has led to positive real interest rates
(4.0)
(2.0)
-
2.0
4.0
6.0
8.0
Dec-
09Ju
n-10
Dec-
10Ju
n-11
Dec-
11
Jun-
12De
c-12
Jun-
13De
c-13
Jun-
14
Dec-
14Ju
n-15
Dec-
15Ju
n-16
Dec-
16Ju
n-17
Dec-
17
Jun-
18De
c-18
(%)
against Core against CPI Avg. Core Avg. CPI
Source: SBP
SBP Reserves vs. PKR
40.0
60.0
80.0
100.0
120.0
140.0
160.0
-
5,000
10,000
15,000
20,000
Jan-
01
Jun-
02
Dec-
03
Jun-
05
Dec-
06
Jun-
08
Dec-
09
Jun-
11
Dec-
12
Jun-
14
Dec-
15
Jun-
17
Nov-
18
FX Reserves (USD 'Mn) PKR/US$ - Rhs
Source: SBP
REER is now close to 100
90
100
110
120
130
140
150
Jul-1
4Se
p-14
Nov-
14Ja
n-15
Mar
-15
May
-15
Jul-1
5Se
p-15
Nov-
15Ja
n-16
Mar
-16
May
-16
Jul-1
6Se
p-16
Nov-
16Ja
n-17
Mar
-17
May
-17
Jul-1
7Se
p-17
Nov-
17Ja
n-18
Mar
-18
May
-18
Jul-1
8Se
p-18
Nov-
18
REER PKR-US$
Source: SBP

8 | P a g e
Pakistan Strategy 2019
More is needed on the fiscal side We believe that much of the monetary tightening and exchange rate adjustment has already completed but more needs to be done on the fiscal side. The fiscal deficit stood at a high 6.6% of GDP in FY18 and, while there is some improvement, the 1QFY19 deficit is also a high 1.4% of GDP. We see more emphasis on revenue generation across 2019 but it is possible that spending – both discretionary as well as developmental – also comes in for cuts. Possible revenue raising measures for 2019 could include: • Increasing GST (current rate is 17%) and removing GST exemptions on petroleum
products, tractors, agricultural machinery and urea. • Reinstating taxes on cellular services, subject to Supreme Court approval. This may
lift annual revenue by up to 0.3% of GDP. • Enhancing FED, possibly on Cements. This has been increased for the last few years
and currently stands at US$11/ton. • Further increase in energy tariffs; Circular debt of PKR750bn (2% of GDP) still
remains an issue and the recent increase in electricity prices will not address it completely.
• Further raising import duties. This can include raising custom duties on imports or hiking regulatory duties on imports deemed non-essential. More than 40% of FBR revenues already comes from the import stage.
• Pushing provinces to raise taxation on services they provide. In the medium-term, there is a need to revisit the distribution of the federal revenue pool to provinces (57.5% at present, which is arguably too high) but it appears unlikely for 2019, especially as PTI does not have a majority in the Senate.
• Potentially increasing the corporate sector tax rate or freezing at current rate. For companies other than banks, it stands at 29% currently, down from 35% in 2013 and will be lowered by 1% annually to 25%.
Possible cuts to spending in 2019 could emanate from: • PSDP cuts. Total public sector development spending (federal + provinces) is
budgeted at PKR725bn or 2% of GDP. It is possible that this figure comes in for downward revision.
• Making some cuts to current expenditures even as we flag that it is difficult to adjust chunky debt servicing and the defense budget.
• Stricter cost control at the provincial level to achieve surpluses. Other than Sindh, all provinces are under the PTI.
Fiscal deficit to GDP (%)
0.0%
2.0%
4.0%
6.0%
8.0%
10.0%
FY11 FY12 FY13 FY14 FY15 FY16 FY17 FY18Fiscal Deficit to GDP (%)
Source: IMS Research, SBP
The thrust of a new IMF program could be on fiscal consolidation. Government is expected to announce another mini-budget soon.

9 | P a g e
Pakistan Strategy 2019
Growth will slow in 2019 but a quick rebound is not impossible From 5.8% in 2018, real GDP growth is likely to reduce to 4.0% or lower in 2019. This deceleration is likely to be driven by the Manufacturing sector where a slowdown is already visible in key LSM sectors such as Iron & Steel, Food, Pharmaceuticals and Automobiles. This is corroborated by prior Balance of Payment crises - which necessitated measures to cool the economy and eventually concluded with entry into an IMF program. The first years of an IMF program are the most difficult, before a rebound sets in and picks pace. In this case, while the economy looks weak for 2019, corrective measures are largely in place and can result in a rebound from 2020. While we expect modest GDP growth of 4.5% in 2020, factors that could result in a V-shaped recovery include: • Continued softness in international oil prices where Pakistan is a large oil importer
(crude and refined products constitute c.25% of the import bill). Quick progress on structural reforms such as (i) curtailing the trade deficit, (ii) clamping down on informal channels for remittances and (iii) attracting FDI, will also help.
• A successful reversal in inflation trajectory which may lead to an earlier than expected commencement in monetary easing. Our base-case is that interest rates will begin to gradually reduce in 2020.
• Emergence of fiscal space that could allow the government to embark on construction projections such as the Prime Minister's low cost housing scheme and mega dams. Linkages to multiple sectors can drive GDP growth higher, similar to the PML-N government.
GDP growth to recover from 2020f
0.0%
1.0%
2.0%
3.0%
4.0%
5.0%
6.0%
7.0%
2012 2013 2014 2015 2016 2017 2018 2019f 2020f
GDP Growth (%) Source: IMS Research, SBP

10 | P a g e
Pakistan Strategy 2019
Pakistan is standing out against peers Given that the adjustment to interest and exchange rates has been among the swiftest in the Emerging and Frontier universe, Pakistan appears ahead of the curve relative to peers that are in the early stages of their own course corrections. Real interest rates in Pakistan are +3.0% vs. a median of +1.1% for EM and FM markets. Similarly, the PKR’s rapid devaluation in 2018 – the most after Argentina and Turkey – has brought the REER down to 104 vs. 124 in Nov’17. Pakistan’s domestic-driven economy (exports are a limited 7% of GDP vs. a median of 20% for peers) can potentially also stand out in a global environment facing challenges to growth and trade. While we flag risks to Pakistan’s EM status – it could be put on watch for downgrade to FM – this may arguably be taken as a positive by investors. A combination of corrective macroeconomic measures (that have already taken place) and cheap valuations can also attract foreign buying, for the first time since 2014, especially if an IMF program comes through.
Real interest rates are among the highest
-1.3
%
-0.3
%-0
.1% 0.5% 0.6% 0.7% 1.0% 1.1% 1.
5% 1.6% 2.
2% 2.3%
2.3% 2.4% 2.8% 3.0% 3.3% 3.4%
7.3%
-2%
0%
2%
4%
6%
8%
Pola
ndCh
ileBa
ngla
desh
Nige
riaTh
aila
ndPe
ruM
alay
siaM
oroc
coSo
uth
Afric
aIn
dia
Indo
nesia
Viet
nam
Braz
ilRu
ssia
Egyp
tPa
kist
anSr
i Lan
kaKe
nya
Turk
ey
Source: Bloomberg, IMS Research
Bulk of PKR devaluation is behind us
1.3%
0.1%
0.0%
-0.6
%
-0.7
%
-2.1
%
-2.1
%
-2.4
%
-4.1
%
-5.1
%
-5.7
%
-8.5
%
-14.
6%
-16.
1%
-17.
9%
-20.
5%
-28.
2%
-50.
6%
-60%
-50%
-40%
-30%
-20%
-10%
0%
10%
Keny
aTh
aila
nd UAE
Egyp
tNi
geria
Viet
nam
Mal
aysia
Mor
occo
S. K
orea
Phili
ppin
esIn
done
siaIn
dia
Braz
ilSr
i Lan
kaTu
nisia
Paki
stan
Turk
eyAr
gent
ina
2018 Currency performance
Source: Bloomberg
The SBP increased the DR by 425bps to 10.5% in 2018. Based on IMF’s projected CPI of 7.5% in 2019, real interest rates in Pakistan are +3.0%, one of the highest in the EM & FM space.
The PKR depreciated by 20%+ vs. the US$ in 2018, one of the highest among peers. With rebuilding of fx reserves underway, further PKR slippage is likely to be modest in our view.
Less exposed to global trade headwinds
5.9% 7.1%
7.9% 9.1% 10.1
%11
.1%
11.3
%11
.5%
14.6
%15
.8%
17.8
%20
.1%
20.3
%20
.4%
21.1
%24
.9% 38
.1%
43.5
%50
.5%
80.4
%
0%
20%
40%
60%
80%
100%
Keny
aPa
kist
anEg
ypt
Nige
riaIn
dia
Sri L
anka
Braz
ilBa
ngla
desh
Arge
ntin
aIn
done
siaPe
ruM
oroc
coSo
uth
Afric
aRu
ssia
Chile
Turk
eyPo
land
Thai
land
Mal
aysia
Viet
nam
Source: World Bank, IMS Research
Soft oil prices are a positive
0.1%
1.2%
2.2% 2.3% 2.5%
2.5% 2.7% 2.
9% 3.0% 3.1% 3.
4% 3.8% 4.
2%
5.7%
0.0%
1.0%
2.0%
3.0%
4.0%
5.0%
6.0%
Russ
ia
Arge
ntin
a
Nige
ria
Peru
Turk
ey
Indo
nesia
Pola
nd
Chile
Egyp
t
Sout
h Af
rica
Sri L
anka
Paki
stan
Indi
a
Mal
aysia
Source: World Bank, IMS Research
Pakistan’s Exports to GDP is 7% vs. a 20% median for peers. Exports need to grow and diversify but, given near-term headwinds, low exposure to global trade can enable Pakistan to stand out in 2019.
Fuel imports are c.4% of Pakistan’s GDP. If oil prices continue to tread lower, in keeping with the “lower for longer” outlook, Pakistan will likely be a key beneficiary.

11 | P a g e
Pakistan Strategy 2019
Looking good to attract foreign buying Pakistan is standing out relative to other Emerging and Frontier markets, in terms of both valuations and the pace with which it has adjusted interest and exchange rates. Pakistan has seen foreign selling of US$1.7bn over 2015-18 (US$537mn in 2018 alone) but we think foreigners can turn net buyers in 2019, for the first time since 2014. This foreign buying is likely to be led by returning frontier market fund managers, in our view. Foreigners recorded gross sell of US$534mn on the EM upgrade day, money that has yet to flow back into Pakistan. These were mostly active FM funds that may now find Pakistan again to their liking. Pakistan stands out due to: • Better placed relative to peers: Pakistan’s macroeconomic adjustment began
twelve months ago and appears to be largely complete. Real interest rates are among the highest in the EM and FM space, and only Argentina and Turkey have seen sharper currency devaluation in 2018. Limited exposure to global trade headwinds and softer oil prices support Pakistan’s case.
• Attractive valuations and a strong bottom-up argument: Pakistan trades at a 30% discount to the MSCI EM Index. The discount to its own cross-cycle valuation averages stands at 13%. The earnings growth on offer – 13% and 16% in 2019 and 2020, respectively – is higher than 6% and 14% growth in the MSCI EM and FM spaces. Pakistan also offers the highest dividend yield in the region, enough to cover for any further PKR weakness, in our view.
The valuation set is attractive
RussiaTurkey UAE
PakistanChinaHungary
Colombia
MSCI EMPoland
Brazil
Czech Republic
Taiwan PeruMexico
South Africa QatarThailand
Greece
IndonesiaMalaysia Philippines
India
-
5.0
10.0
15.0
20.0
25.0
-4.0% 0.0% 4.0% 8.0% 12.0% 16.0% 20.0% 24.0%
P/E
(x) 2
019f
EPS Growth 2019f (%) Source: Bloomberg
Dividend yield is very high – 2019f 1.
5% 1.7% 2.
5%2.
4% 2.9% 3.0%
3.0% 3.2% 3.3% 3.5%
3.4% 3.5%
3.4%
3.4% 4.
2%4.
1% 4.3%
4.3% 5.
1% 5.3% 5.5% 6.
2% 7.2%
0%1%2%3%4%5%6%7%8%
Indi
aPh
ilipp
ines
Kore
aIn
done
siaHu
ngar
yCh
ilePe
ruM
exico
Gree
ceCh
ina
MSC
I EM
Thai
land
Pola
ndM
alay
siaSo
uth
Afric
aBr
azil
Qata
rCo
lom
bia
Taiw
anCz
ech…
Turk
eyUA
EPa
kist
an
Source: Bloomberg
Pakistan’s offers a better risk-reward Dividend yield provides downside protection
Discount to EM can contract
-50%
-45%
-40%
-35%
-30%
-25%
-20%
-15%
2010
2011
2012
2013
2014
2015
2016
2017
2018
2019
f
Disc. to EM Source: Bloomberg
There is room to stock up on Pakistan
15%
20%
25%
30%
35%
40%
Jul-0
7Ja
n-08
Jul-0
8Ja
n-09
Aug-
09Fe
b-10
Aug-
10Fe
b-11
Sep-
11M
ar-1
2Se
p-12
Mar
-13
Oct-1
3Ap
r-14
Oct-1
4Ap
r-15
Nov-
15M
ay-1
6No
v-16
May
-17
Nov-
17Ju
n-18
Dec-
18
Securities held by Foreigners (as % of F.MCAP (All Share) Mean
Source: SBP, IMS Research
Cheap on both standalone and relative basis It is now difficult to ignore Pakistan completely

12 | P a g e
Pakistan Strategy 2019
Possible downgrade to FM may act like an upgrade Pakistan was upgraded to the MSCI EM Index in mid-2017. At the time, six Pakistani stocks (OGDC, HBL, MCB, UBL, LUCK, ENGRO) were part of the Standard Index. Since then, UBL, LUCK and ENGRO have been downgraded to small cap status. Of the remaining companies in the Standard Index, HBL is currently below the minimum market capitalization criteria while all three of OGDC, MCB and HBL are below the required free float market capitalization. Even after imposing buffers (2/3rd of minimum levels), HBL appears vulnerable where a fall in its market price and/or rapid PKR depreciation from current levels could threaten a downgrade to small cap status. This, in turn, could imperil Pakistan’s EM status given that at least three companies have to meet Standard Index criteria at all times. If HBL fails to meet EM criteria, it is possible that Pakistan is put on watch for possible downgrade in the May 2019 MSCI Review. This usually lasts for twelve months and the earliest Pakistan can be downgraded to FM, in our view, is effective end-Nov’20. The previous two downgrades from EM to FM have been Morocco (2013; low liquidity + dynamics were more consistent with FM than EM) and Argentina (in 2009; capital controls). Similar to Morocco, Pakistan’s characteristics are arguably also more in line with frontier countries rather than the emerging market classification. However, downgrade to FM or even being put on watch for downgrade is not a given. Peru was put on watch for downgrade in 2015 but stayed in EM as regulators exempted CGT, eased trading restrictions/fee, and gave a medium-term year plan to boost volumes. In Pakistan’s case, since EM upgrade took place in 2017, MSCI may give it more time. Technical exemptions are possible even if less than three companies meet EM Standard Index criteria.
A downgrad
Downgrade to FM status would not be the worst outcome, in our view. From a negligible weight in EM, Pakistan would likely have a c.10% weight in the FM space particularly as Argentina will be upgraded to the EM space next year. Based on our interaction with both local and foreign institutional investors, eventual downgrade to FM may work out in Pakistan’s favor given its large size in the FM Index will make it impossible to ignore. In this case, a downgrade may actually play out as an upgrade.
MSCI Criteria A Economic Development Frontier Emerging
A.1 Sustainability of economics development No requirement No requirement
B Size and Liquidity Requirements B.1 Number Of Companies meeting the following Standard Index criteria 2 3
Company size (full market cap) USD 741 mm USD 1482 MM Security size (float market cap) USD 69 MM USD 741 mm
Security liquidity 2.5% ATVR 15% ATVR
HBL OGDC MCB Ord. Mkt Cap
(US$mn) Free float Mkt Cap (US$mn) Ord. Mkt Cap (US$mn) Free float Mkt Cap (US$mn) Ord. Mkt Cap
(US$mn) Free float Mkt Cap (US$mn)
1,304.2 652.1 4,024.4 603.7 1,609.1 563.2
C Market Accessibility Criteria Frontier Emerging C.1 Openness to foreign ownership At least some Significant C.2 Ease of capital inflows / outflows At least partial Significant C.3 Efficiency of the operational framework Modest Good And tested C.4 Competitive landscape High High C.5 Stability of the institutional framework Modest Modest
Source: IMS Research, MSCI
Even if EM criteria is not met, it may be too soon for downgrade to FM and Pakistan may receive technical exemptions if needed.

13 | P a g e
Pakistan Strategy 2019
Risk-reward is attractive Valuations are supportive – Pakistan trades at a 2019f P/E of 7.4x, the lowest since Nov’13, and at a 13% discount to its cross-cycle average (2006 till date) of 8.6x. On the basis of P/B and P/S, the discount is an even sharper 33% and 23%. Pakistan is among the cheapest markets in the Emerging and Frontier universe and also offers the 2nd highest dividend yield in this space. Despite the slower economy, headline earnings growth is resilient; the IMS Universe is projected to post growth of 13% in 2019f and 16% in 2020f. Although 2019 growth will primarily be driven by Banks and E&P, it will be more broad-based across the medium-term. We think that even if the market’s P/E remains confined to a tight band in 2019, the KSE-100 has the potential to rally towards 45,000pts (21% higher than the Index’s last close). This has precedence; range-bound valuations (average P/E of 6.3x) and strong earnings growth (22%pa) last occurred during CY09-12 when the KSE-100 returned a CAGR of more than 20%. Attractive levels for building positions Outliers aside, the Pakistan market has historically traded at a forward P/E range of 6x-12x. Significant de-rating has taken place over the last 18 months, with the forward P/E falling from more than 12.0x at MSCI upgrade (mid-2017) to 7.4x at present. Current valuations levels are 13% lower than the historical cross-cycle average of 8.6x; on the basis of P/B and P/S, the discount is an even sharper 33% and 23%, respectively. Given our view that the macroeconomic adjustment in Pakistan has largely taken place, we reason that it is already in the price and that valuations allow for positions to be built. The GDP-Earnings disconnect Over the last five years, despite the acceleration in GDP growth under the PML-N, earnings growth lost momentum. This is due to the composition of the KSE-100 Index where Banks and E&P together have a 40% weight. Lower oil prices leading to lower interest rates benefitted the economy but pressed down on earnings for both heavyweight sectors. With demand compression measures in place, 2019 will likely see a slower economy (and lower profitability for sectors such as Cements and Automobiles). However, headline earnings growth stands to improve, driven by Banks (higher interest rates) and E&P (weaker PKR). The GDP-profit growths disconnect should thus persist, particularly in the next 1-2 years.
Historical P/E band
3.0
6.0
9.0
12.0
15.0
Jul-0
6
Jun-
07
May
-08
May
-09
Apr-1
0
Apr-1
1
Mar
-12
Mar
-13
Feb-
14
Feb-
15
Jan-
16
Jan-
17
Dec-
17
Dec-
18
(X)
SD-2 SD-1 FWD-PER SD+1 SD+2 Mean
Source: IMS Research
Valuation discount to long-term average
FWD-
P/B (x) FWD-P/S
(x) FWD-
PER (x) L.T average 1.79 0.94 8.57 2019f 1.20 0.72 7.44 Disc. To L.t -33% -23% -13% Source: IMS Research

14 | P a g e
Pakistan Strategy 2019
Earnings growth can drive the market, even if valuations are range-bound With the Discount Rate coming down to a record low 6.25%, valuation rerating was the key market driver during the PML-N government, at least until ex-PM Nawaz Sharif’s disqualification. While valuation multiples may stay in a tight band, precedence suggests this is not prohibitive for market returns. Between end-CY09 and end-CY12 (under the PPP government), the KSE-100 delivered a CAGR of more than 20% despite the market’s P/E averaging just 6.3x (vs. a cross-cycle average of 8.6x). Earnings growth during this period averaged 22% per annum, despite below par GDP growth of 3.8%. A similar situation appears to be unfolding now. If interest rates remain in double-digits (the DR currently stands at 10.5%), significant valuation rerating may not take place. However, headline earnings growth can drive the market higher.
Banks to drive 2019 growth; more broad-based growth in 2020 For the IMS Universe, we expect 13%yoy earnings growth in 2019f and 16%yoy growth in 2020f. Banks will be the key growth drivers this year with margin expansion expected to more than offset higher cost of risk. The ex-banks growth for 2019f is a more moderate 5%yoy, with major drag coming from Automobiles and Cements. In 2020f, however, growth should be more inclusive. Banks will continue to do well and will be joined by a rebound in Cements, Steel and Oil Marketing – sectors that will reflect the expected improvement in the economy after the consolidation in 2019.
GDP growth vs. Earnings growth
0.0%
1.0%
2.0%
3.0%
4.0%
5.0%
6.0%
7.0%
-20%
-10%
0%
10%
20%
30%
40%
2007 2008 2009 2010 2011 2012 2013 2014 2015 2016 2017 2018 2019f
IMS Universe Growth (%) GDP Growth (%) - Rhs
Source: IMS Research, SBP
Earnings growth to take precedence over valuation rerating
-80%-60%-40%-20%
0%20%40%60%80%
2007 2008 2009 2010 2011 2012 2013 2014 2015 2016 2017 2018
Earnings Growth (%) P/E expansion Index Return
Source: IMS Research

15 | P a g e
Pakistan Strategy 2019
KSE-100 can rally up to 45,000pts in 2019 The KSE-100 shed 8% in 2018 (-27% in US$ terms) and delivered a negative return for the second year in a row, which has not occurred since the mid-1990s. We think the Pakistan market will depict a rebound in 2019 on a combination of: (i) cheap valuations (7.4x forward P/E), (ii) easing Balance of Payment concerns, (iii) a quick adjustment in interest and exchange rates that places Pakistan ahead of other EM & FM countries, (iv) limited exposure to global trade headwinds, (v) softer oil prices and (vi) resilient headline earnings growth.
Although the economy will slow in 2019, we believe the improvement on the external side in particular can act as a major trigger. We think the KSE-100 has limited downside, while it can rally up to 45,000pts in 2019 (21.4% higher than 2018’s closing of 37,067pts). We base this on:
Index Target (pts) TP Mapping Analysts map their target prices on underlying companies of the KSE-100 45,000
E/Y vs. T-bill yield We assume that the differential reverts to long-term level of 2.9% 41,000 Target P/E We assign a target P/E of 8.5x vs. 7.4x at present 43,000
We would turn more bullish if: • It becomes clear that the IMF program will not face further inordinate delays • Regulatory policies turn more conducive especially on market leverage • New buyers such as local state-owned institutions or foreigners enter the market • There are signs that the macroeconomic environment can quickly turn for the
better
IMS Universe Sectors Earnings growth in 2019f and 2020f
-50%
-25%
0%
25%
50%
2019F 2020F Source: IMS Research

16 | P a g e
Pakistan Strategy 2019
Risks We think resorting to the IMF is inescapable, where we pencil in program entry in 1Q 2019. However, given that Pakistan is on course to receive bilateral assistance – which will temporarily lift Fx reserves - it is possible that the government continues to delay program entry. This will likely keep a lid on investor confidence and prevent foreign institutional money from flowing into Pakistan. We think the adjustments to the interest and exchange rates are largely complete. A large increase in interest rates and further sharp weakness in the PKR, over and above our estimates, would be a key downside risk particularly if it leads to an upward revision in the risk-free rate (currently assumed at 11.0%). This could potentially lead to the market’s P/E breaking below 7x. The thrust of macroeconomic adjustment in 2019 is likely to be on the fiscal side, particularly revenue generation. While not our base-case, it is possible that the government raises corporate income tax (currently 29% for companies and 35% for banks; ex-super tax). This would negatively affect our earnings estimates and reduce target prices. Double-digit interest rates have led to a shift of domestic liquidity from equities into fixed income where we understand the process is not yet complete. This was a key reason why local mutual funds were net sellers in 2018, albeit by a small quantum. If fresh inflows do not materialize – for instance from foreigners or from state owned institutions - weak liquidity dynamics could take the market lower. Global equity markets have been weak recently. Notwithstanding Pakistan’s domestic-driven economy, if global sentiment towards risk assets remains weak in 2019, it is possible that the KSE-100’s performance is also affected. Pakistan has to meet FATF conditions in 2019. Failure to do so may result in Pakistan being blacklisted which would be a significant negative. Security conditions have significantly improved over the last few years. However, with the US looking to withdraw from Afghanistan, it is possible that security conditions in Pakistan are adversely affected. That said, a more conciliatory stance by the US is a positive development.

17 | P a g e
Pakistan Strategy 2019
Sector Outlook

18 | P a g e
Pakistan Strategy 2019
Banks
Back on the growth track Margin expansion to drive profitability: The full effect of the 425bps
increase in interest rates in 2018 will be visible in 2019f. We see NIMs expanding by 40-104bps across our coverage universe (MEBL and BAFL are most sensitive). Even though loan growth is expected to decelerate from 11%yoy in 2018 to 8%yoy in 2019, rising margins will drive c 45% profit growth in 2019f (c 35% ex-HBL). Increasing yields on PIBs – 10yr paper in the last auction yielded more than 13% - is an upside risk.
Cost of risk should be manageable: Cost of risk will rise but should remain within manageable limits in our view (50-60bps). This is due to (i) high provisioning coverage of c 90%, (ii) limited consumer exposure (7% of the loan mix) and (iii) loans to the public sector (government guaranteed) having a c 20% share in total loans.
2018 bad news unlikely to repeat: This will be particularly positive for the large banks. Pension fund top-ups are over, UBL’s loan book cleanup in the GCC is nearly complete and HBL’s profitability should also begin to return to normalcy.
ROEs to enter secular expansion phase: ROEs for the banks we cover will rise by 4ppt to 14.0% in 2019f. Even if interest rates come off over the medium term, ROEs should retain their upward trajectory and cross 18% by 2022f. This should help rerate valuations where the sector trades at a median 2019f P/B of 1.0x and P/E of 7.5x.
Risks: (i) Major asset quality deterioration, (ii) fines on the US operations of HBL & UBL, (iii) FATF blacklisting, and (iv) IFRS 9 implementation.
Banks to see rapid margin expansion in 2019
3.0%
3.5%
4.0%
4.5%
5.0%
5.5%
6.0%
6.5%
7.0%
CY10 CY11 CY12 CY13 CY14 CY15 CY16 CY17 CY18F CY19F
Source: IMS Research
Valuations have room to expand, particularly for the big banks
Jan-
08
Feb-
09
Mar
-10
Apr-1
1
May
-12
Jun-
13
Jul-1
4
Aug-
15
Sep-
16
Oct-1
7
Dec-
18
(x)IMS Universe Banks Pbv (x) Band
2.00
1.50
1.00
0.50
Source: IMS Research
TP Upside P/E (x) P/B (x) DY (%) (PKR) (%) 19F 20F 19F 20F 19F
Banks 7.6 6.2 1.1 1.0 6.5% ABL 118 11% 7.9 6.9 1.1 1.0 7.5% MCB 210 11% 9.6 7.3 1.4 1.3 8.5% HBL 175 42% 7.3 5.8 0.9 0.8 4.9% UBL 180 37% 7.1 5.6 0.9 0.8 6.1% BAFL 58 28% 5.6 5.3 0.9 0.8 6.6% MEBL 107 19% 7.6 6.4 1.9 1.6 4.5%
Sector performance
-20%
-10%
0%
10%
20%
Dec-
17
Jan-
18
Mar
-18
Apr-1
8
May
-18
Jun-
18
Jul-1
8
Aug-
18
Sep-
18
Oct-1
8
Nov-
18
Dec-
18
KSE-100 Index IMS Banks Uni. Source: IMS Research
Raza Jafri, CFA [email protected] Yusra Beg [email protected]

19 | P a g e
Pakistan Strategy 2019
Cheap valuations but triggers ahead Significant undervaluation: Oil prices fell 17% during 2018 and E&P
stocks fell 19%, but this is more than warranted given low sensitivity to oil prices in case of OGDC and PPL. The two stocks are trading at an EV/EBITDA of just 2.5x and we estimate their stock prices imply oil prices of US$25/32 per barrel. Triggers during 2019 include (i) high-potential off-shore drilling and (ii) potentially, progress on a new Petroleum Policy.
PKR devaluation will drive earnings growth: Earnings growth in the sector will be a handsome 20% yoy on average, led mostly by PKR depreciation, as well as production growth in case of PPL. E&Ps are deploying a significant portion of their capex on mature fields to plateau production levels. PPL is slightly better because it is able to meaningfully grow production in large old fields like Kandkhot and Adhi.
New entrants to intensify competition: Exploration is key for future production growth. We think the opportunity in Khyber Pakhtunkhwa and Baluchistan still remains untapped and can be capitalized on in future. Most importantly, Pakistan’s second offshore well will commence drilling in Jan’19 in Indus G block, which promises large gas reserves. On the other hand, the government may mull upgrading the Petroleum Policy to encourage greater risk taking in the sector.
Risks: Key risk is oil prices which can further depress sentiment in the sector. Continued divestment by foreign investors in OGDC and PPL could keep these stocks under pressure. Furnace oil phase out will intermittently disrupt the energy chain and cut production.
E&Ps
Sector performance
-30%-20%-10%
0%10%20%
Dec-
17
Jan-
18
Mar
-18
Apr-1
8
May
-18
Jun-
18
Jul-1
8
Aug-
18
Sep-
18
Oct-1
8
Nov-
18
Dec-
18
KSE-100 Index IMS E&P Uni.
Source: IMS Research
Oil price outlook is “lower for longer” again
41 48
62 60 60 65
-
10
20
30
40
50
60
70
FY16 FY17 FY18 FY19f FY20f FY21f
US$/bbl
Source: IMS Research, Bloomberg
Implied oil prices suggest significant undervaluation
2532
48
0
10
20
30
40
50
60
OGDC PPL POL
US$/bbl
Current oil price
Source: Bloomberg, IMS Research
Muhammad Saad Ali, CFA [email protected]
TP Upside P/E (x) P/B (x) DY (%) (PKR) (%) 19F 20F 19F 20F 19F
E&P 6.3 5.9 1.1 1.0 7.8% OGDC 175 35% 6.0 5.7 0.9 0.9 9.2% PPL 191 27% 6.1 5.7 1.2 1.1 4.7% POL 497 16% 9.5 8.0 3.7 3.6 10.0%

20 | P a g e
Pakistan Strategy 2019
Sector performance
-20%-10%
0%10%20%30%
Dec-
17
Jan-
18
Mar
-18
Apr-1
8
May
-18
Jun-
18
Jul-1
8
Aug-
18
Sep-
18
Oct-1
8
Nov-
18
Dec-
18
KSE-100 Index IMS Fertilizer Uni. Source: IMS Research
Risk-reward in balance High retention prices may continue: The IMS Fertilizer Universe
outperformed the KSE-100 by 18% in 2018 due to improved pricing power. Urea inventory declined to 245K tons (down 86% since the May’17 peak) and subsidy removal in May’18 lifted retention prices. Given fiscal constraints, we foresee limited risk of subsidies in 2019, which may be earnings positive for the sector.
Risks to weigh on price performance: In 2019, risks of further gas price hike and/or GIDC removal may keep the sector’s price performance in check. The recent 10%-143% gas price hike raised PKR90bn, short of the initial target of PKR150bn. Pricing power in case of another gas price hike may be limited especially if demand supply dynamics become unfavorable (allocation of gas to FATIMA for year-round production and/or further urea imports). Our estimates only incorporate 50% (PKR60/bag) of the recent gas price hike pass-on in Urea prices, to reflect the aforementioned risks.
We like selected names: ENGRO is our top pick where we like its diversified exposure to fertilizer, power, consumer, and chemical sectors. ENGRO’s cash position of PKR62bn is a major potential upside trigger, if deployed in new investment avenues. In the event of further gas price hikes, companies with concessionary gas pricing (EFERT and FATIMA) may outperform.
Risks: (i) Subsidy on fertilizers, (ii) GIDC removal (iii) further gas price hikes and (iv) lower pricing power.
Recovery in Urea prices amid lower inventory
0
400
800
1,200
1,600
2,000
Jan-
17
Mar
-17
May
-17
Jul-1
7
Sep-
17
Nov-
17
Jan-
18
Mar
-18
May
-18
Jul-1
8
Sep-
18
Nov-
18
1,200 1,300 1,400 1,500 1,600 1,700 1,800 PKR/kgK tons
Urea Prices (PKR/Kg)- Rhs Urea Inventory (K tons) Source: NFDC, IMS Research
GMs have improved as a result
15%
18%
21%
24%
27%
30%
33%
800900
1,0001,1001,2001,3001,4001,5001,6001,700
2QCY17 3QCY17 4QCY17 1QCY18 2QCY18 3QCY18
Urea Prices FFC GMs (%) - Rhs Source: IMS Research, Company Accounts
Fertilizer Ailia Naeem [email protected]
TP Upside P/E (x) P/B (x) DY (%) (PKR) (%) 19F 20F 19F 20F 19F
Fertilizer 7.4 6.4 1.3 1.2 10.1% FFC 106 13% 8.4 7.8 3.6 3.5 10.7% EFERT 89 23% 6.7 6.4 2.1 2.0 13.8% FFBL 36 -1% 32.1 21.1 2.4 2.3 4.7% FATIMA 39 12% 5.0 4.7 1.1 1.0 8.7% ENGRO 379 20% 7.6 5.7 0.8 0.7 9.2%

21 | P a g e
Pakistan Strategy 2019
Cement
Stay selective Concerns on local demand growth: Deceleration in local demand seems
likely amidst an unfavorable macro environment. Local demand in 5MFY19 is down 4% yoy, where work on large private schemes in Karachi has reportedly been stopped after the Supreme Court’s crackdown against private scheme patrons. This can play a key role in decelerating private sector led demand, in our view. Furthermore, constrained fiscal space may limit the scale of PSDP spending.
Export growth is a much needed outlet: A positive sign, especially for the South players is the significant rise in sea exports, propelled by c.25% weaker PKR and slowing local demand. The significance of exports lies in managing the supply in the local market. With fresh sanctions on Iran, Pakistan can tap regional export markets.
More expansions are nigh: Next round of capacity expansions (CHCC and MLCF) will come online in 4QFY19. From the listed space, PIOC, LUCK and KOHC are next in-line to bring their respective expansions online. Rising cost of production has helped sustain pricing discipline. Though margin compression has stalled price declines, the industry’s true pricing power will be tested when upcoming expansions are online.
Risks: (i) Replay of pricing discounts by CHCC when its Line 3 is commissioned, (ii) further PKR depreciation and increase in coal prices, (iii) GoP levying more taxes on the sector. Upside risks include: (i) decline in coal prices amid global slowdown and US-China trade war, and (ii) commencement of Naya Pakistan Scheme and/or construction of mega dams.
Sector performance
-40%
-20%
0%
20%
40%
Dec-
17
Jan-
18
Mar
-18
Apr-1
8
May
-18
Jun-
18
Jul-1
8
Aug-
18
Sep-
18
Oct-1
8
Nov-
18
Dec-
18
KSE-100 Index IMS Cement Uni.
Source: IMS Research
Industry utilization rate expected to remain above 70% until FY21
0%
20%
40%
60%
80%
100%
120%
-
10
20
30
40
50
60
70
FY13 FY14 FY15 FY16 FY17 FY18 FY19f FY20f FY21f
mn tons
Local Exports Utilization-Rhs Source: Company Accounts, APCMA
Margin compression has dissuaded price competition
2832
3633
2521 20 19
0
5
10
15
20
25
30
35
40
FY14 FY15 FY16 FY17 FY18 FY19F FY20F FY21FEBITDA Margin
%
Source: Company Accounts, IMS Research
Muhammad Saad Ali, CFA [email protected]
TP Upside P/E (x) P/B (x) DY (%) (PKR) (%) 19F 20F 19F 20F 19F
Cement 9.1 7.7 0.9 0.8 4.6% DGKC 112 36% 12.1 9.8 0.4 0.4 3.9% LUCK 580 31% 9.9 9.4 1.2 1.1 2.8% MLCF 56 31% 6.3 4.0 0.8 0.7 7.0% CHCC 91 26% 7.4 6.4 1.0 0.9 5.6% FCCL 21 0% 8.2 8.6 1.4 1.3 9.5% ACPL 127 19% 9.2 7.4 0.8 0.8 7.5% KOHC 115 38% 7.5 4.7 0.9 0.8 5.4%

22 | P a g e
Pakistan Strategy 2019
OMCs
Tough period ahead Growth period is behind us: After four years of strong sales growth –
propelled by declining prices and a growing economy – OMCs are bracing for negative demand in 2019, and potentially slow recovery thereafter. Petrol and HSD volumes have declined by 1% and 21% yoy respectively, in 1HFY19. Amidst the recent slide in international crude oil prices, the GoP is likely to contain the decline in local prices to maintain its tax revenues.
Competition among incumbents will increase: Falling oil prices fueled discounting by smaller players such as HASCOL to gain market share. This will increase competition, particularly for PSO. APL and HASCOL may benefit from increased storages, while SHEL has regained much of its market share. We think the government will not table deregulation of OMC margins in 2019 given macroeconomic concerns. Deregulation will be negative for competition in a slowing demand scenario.
Sukuk issue for circular debt resolution: A key event could be the government raising PKR200-300bn from Islamic banks for partial resolution of outstanding balance of circular debt. While it will be a major positive for PSO, we advocate exiting the position in case of a rally, as we are not optimistic about its ability to contain market share loss.
Risks: (i) GoP allocating more LNG to the CNG sector, at subsidized rates (probable if oil prices fall further or LNG offtake becomes problematic) and, (ii) deregulation on OMC margins as it will lead to unhealthy competition, in our view. Upside risks include: (i) demand recovering stronger than expected, and (ii) sector ramps up payouts given lack of growth opportunity.
Sector performance
-20%-10%
0%10%20%30%
Dec-
17
Jan-
18
Mar
-18
Apr-1
8
May
-18
Jun-
18
Jul-1
8
Aug-
18
Sep-
18
Oct-1
8
Nov-
18
Dec-
18
KSE-100 Index IMS OMCs Uni.
Source: IMS Research
OMCs sales on a decline
9.09.6
7.4
4.2 3.92.9
7.88.5 9.0
7.7 7.4 7.6
5.86.6
7.4 7.78.1 8.6
-
2
4
6
8
10
FY16 FY17 FY18 FY19f FY20f FY21f
mn tons
FO HSD MS Source: OCAC, IMS Research
OMCs market share; smaller OMCs growing against PSO
0%
20%
40%
60%
80%
100%
1Q16
2Q16
3Q16
4Q16
1Q17
2Q17
3Q17
4Q17
1Q18
2Q18
3Q18
4Q18
1Q19
PSO SHEL APL HASCOL Others Source: OCAC, IMS Research
Muhammad Saad Ali, CFA [email protected]
TP Upside P/E (x) P/B (x) DY (%) (PKR) (%) 19F 20F 19F 20F 19F
OMCs 8.2 6.8 1.1 1.1 6.4% PSO 255 12% 7.4 6.3 0.7 0.7 4.8% APL 606 35% 7.3 6.3 2.2 2.1 10.2% HASCOL 161 13% 14.2 9.1 2.1 1.9 4.2% SHEL 289 4% 10.0 7.7 2.5 2.4 7.6%

23 | P a g e
Pakistan Strategy 2019
Power
Expansion projects & circular debt settlement Circular debt settlement on the cards: The government is reportedly
planning to issue Sukuk Energy Bonds amounting to PKR200bn initially, in early 2019. The money will likely be used to clear some portion of the outstanding circular debt (reportedly over PKR600bn). We believe the beneficiary companies will immediately deleverage as much as possible (earnings positive) and potentially resume stalled payouts (NPL, NCPL).
Pure D/Y plays may lag behind… For large payouts, we believe a greater than PKR200bn settlement will be needed. The sector’s earnings will rise but dividends need significantly improved cash flow. The average FY19F D/Y of the IMS Power Universe (ex-KAPCO), is c350bps lower than current 3yr PIB rate of 12.2%. As a result, investors looking for just dividends may not find current share prices to their liking.
…but growth projects to bring select names in limelight: There is more excitement on expansion projects (early harvest projects of CPEC), which may bring names such as HUBC into the limelight. While high debt resulting from project financing may keep bottomline growth in check for HUBC in 2019 (425bps higher interest rates), investor focus on earnings growth in the medium term can drive price performance.
Risks: (i) Delay in commissioning of upcoming power projects of IPPs under coverage, (ii) delay in materialization of Energy Sector Sukuks, and (iii) reemergence of circular debt if structural issues remain unresolved.
Sector performance
-20%
-10%
0%
10%
20%
Dec-
17
Jan-
18
Mar
-18
Apr-1
8
May
-18
Jun-
18
Jul-1
8
Aug-
18
Sep-
18
Oct-1
8
Nov-
18
Dec-
18
KSE-100 Index IMS Power Uni. Source: IMS Research
Trade Debts have been on a rising trend since 2013 settlement
243
72
168 162 162
194238
0%
20%
40%
60%
80%
100%
120%
0
50
100
150
200
250
300
FY12 FY13 FY14 FY15 FY16 FY17 FY18
Trade Debts - IMS Universe IPPs (PKRbn) As % of Sales - Rhs
Source: Company Accounts
Cash payouts have started feeling the pinch
1
6
12
17
23
28
FY12 FY13 FY14 FY15 FY16 FY17 FY18
NCPL NPL HUBC KAPCO
(%)
Source: Company Accounts
Ailia Naeem [email protected]
TP Upside P/E (x) P/B (x) DY (%) (PKR) (%) 19F 20F 19F 20F 19F
Power 5.2 3.9 1.3 1.1 10.2% NPL 36 37% 2.3 2.1 0.5 0.4 7.5% HUBC 132 53% 7.7 4.8 2.0 1.5 5.8% KAPCO 53 7% 4.1 3.7 1.2 1.1 20.2% NCPL 29 24% 2.3 2.1 0.6 0.5 12.8%

24 | P a g e
Pakistan Strategy 2019
Textile
Looking good thematically Weak beginnings… The textile sector enters 2019 on a weak note,
despite the 25% PKR devaluation in 2018. Demand from China (destination for 10% of Pakistan’s textile exports) has declined, indicated by a sharp 74/20% yoy dip in cotton/yarn volumes in 5MFY19. As a result, textile exports remained flattish at US$5.5bn in 5MFY19, after posting 5% yoy growth in FY18.
… but negatives are priced in: We believe the market has priced in the negatives given NML and NCL have corrected by 5/9% in 1m. We believe the operating environment favors players with higher contribution from value added products (NML). At the same time, sharp price correction has also opened up valuation upside for manufacturers with product mix skewed towards non-value added products (NCL).
Government incentives – potential upside trigger: The government has earlier hinted at an exports incentive package for the textile sector but has not followed through on it. Duty drawbacks could be an upside trigger – if they are announced at similar conditions as in the past, we estimate our earnings estimates for NML/NCL could rise by 33/21% in the 12mth period that drawbacks are in place. Meanwhile, PKR devaluation has led to continued upwards momentum in core earnings for IMS textile universe.
Risks: (i) Continued uptick in raw material prices, (ii) further slowdown in demand from China, and (iii) failure of government incentives to come through.
Sector performance
-20%
-10%
0%
10%
20%
Dec-
17
Jan-
18
Mar
-18
Apr-1
8
May
-18
Jun-
18
Jul-1
8
Aug-
18
Sep-
18
Oct-1
8
Nov-
18
Dec-
18
KSE-100 Index IMS Textiles Uni. Source: IMS Research
Textile exports on a downtrend, again…
-15%-10%-5%0%5%10%15%20%
900
950
1,000
1,050
1,100
1,150
1,200
Jan-
16
Apr-1
6
Jul-1
6
Oct-1
6
Jan-
17
Apr-1
7
Jul-1
7
Oct-1
7
Jan-
18
Apr-1
8
Jul-1
8
Oct-1
8
US$MN
3M Moving Avg. Textile Exports YoY increase (Rhs) Source: IMS Research, SBP
…but core earnings continue their momentum
-200
0
200
400
600
800
1,000
1QFY18 2QFY18 3QFY18 4QFY18 1QFY19
(PKRmn)
NML NCL Source: Company Reports
Ailia Naeem [email protected]
TP Upside P/E (x) P/B (x) DY (%) (PKR) (%) 19F 20F 19F 20F 19F
Textiles 8.2 8.2 6.7 0.6 0.6 4.1% NML 180 33% 11.0 7.7 0.6 0.6 3.0% NCL 69 42% 4.0 4.4 0.8 0.8 8.8%

25 | P a g e
Pakistan Strategy 2019
Autos
Bumpy ride ahead Sedans can outperform amid demand contraction: Higher car prices
(up 15% on average in 2018) and higher interest rates will negatively affect auto sales. We expect the industry’s unit sales to decline by 10%yoy in 2019. However, sedans (Corolla, Civic and City) can ride out a tougher macroeconomic environment with their demand less sensitive to pricing, in our view. The tractor space will also witness volumetric decline amidst a subdued agricultural outlook (higher fertilizer prices and water shortage concerns).
Margins to stay under pressure: Despite higher prices, the industry’s GMs fell to 9.5% in Jul-Sep’18 vs. 13.4% in Jul-Sep’17. We think margins have yet to bottom out, even in the premium cars segment, particularly if the PKR continues to weaken. For the auto sector, we expect profits to decline by c 25% in 2019f before 11% growth in 2020f and then 23%yoy in 2020f.
Trading below replacement values: Market capitalizations for HCAR (capacity: 50k units) and PSMC (capacity: 150k units) have come down to c.PKR25bn and c.PKR15bn, respectively. Despite the challenging macroeconomic backdrop, this appears cheap given that new investments in the auto space (e.g. Kia and Hyundai) for plant capacities of 30k units cost PKR15-20bn. INDU’s market capitalization is c PKR95bn but we still like it due to its relatively resilient earnings and high 10% dividend yield.
Risks: (i) Sharp PKR depreciation eroding margins further, (ii) falling profits leading to applicability of turnover tax, (iii) entry of new players over the medium term, (iv) delays in new model launches.
Sector performance
-60%
-40%
-20%
0%
20%
Dec-
17
Jan-
18
Mar
-18
Apr-1
8
May
-18
Jun-
18
Jul-1
8
Aug-
18
Sep-
18
Oct-1
8
Nov-
18
Dec-
18
KSE-100 Index IMS Autos Uni.
Source: IMS Research
GM squeeze amid PKR depreciation but INDU stands out
95
100
105
110
115
120
125
130
0%
4%
8%
12%
16%
20%
1QFY18 2QFY18 3QFY18 4QFY18 1QFY19
INDU HCAR PSMC USD-PKR- Rhs
Source: Company Accounts, IMS Research
1300cc+ segment sales appears to be slightly less cyclical
-60%
-40%
-20%
0%
20%
40%
60%
80%
FY07 FY08 FY09 FY10 FY11 FY12 FY13 FY14 FY15 FY16 FY17 FY18
Industry 1300cc+ Source: IMS Research, PAMA
Ahmed Raza [email protected]
TP Upside P/E (x) P/B (x) DY (%) (PKR) (%) 19F 20F 19F 20F 19F
Autos 8.0 7.2 1.5 1.4 7.9% PSMC 230 26% 12.4 7.8 0.5 0.5 1.4% HCAR 290 64% 6.6 7.2 1.3 1.2 7.3% INDU 1580 32% 7.5 6.7 2.3 2.1 9.6% GTYR 74 -6% 47.3 25.8 2.2 2.1 1.3%

26 | P a g e
Pakistan Strategy 2019
Steel
Awaiting triggers Further pressure on margins: Amid slower demand, steel manufacturers
have had to absorb the impact of PKR depreciation and higher fuel rates. This will likely compress margins through 2019 as well. Continued competition from imports will also keep pricing power in check. Higher primary spreads, however, can support earnings. That said, valuations are attractive with the sector trading at a discount to the broader market.
Overheads can escalate further: Despite the increase in both electricity and gas tariffs during Oct’18, further hikes cannot be ruled out, particularly as IMF negotiations are still underway. This will hurt long steel makers more (ASTL, MUGHAL) due to their power intensive production (25% of COGS) compared to flat steel (3% of COGS). Furthermore, much higher interest rates will raise financing costs – the average debt-to-asset ratio of the IMS Steel Universe stands at 48% (as of Sep’18), where newly commissioned capacities and higher working capital needs have elevated borrowings.
Triggers unlikely to materialize soon: Long steel players can witness a sustainable bull run scenario if projects such as a mass housing scheme or large dams are executed. Given weak fiscal position, this seems unlikely in 2019. For flat steel players, imposition of anti-dumping duty presents a short-term trigger.
Risks: (i) Extended slowdown in private sector construction is a major challenge as ASTL and MUGHAL see this as main area of growth. (ii) for ISL, dumping of Russian CRC and a new capacity by Aisha Steel are areas of concern.
Sector performance
-60%
-40%
-20%
0%
20%
Dec-
17
Jan-
18
Mar
-18
Apr-1
8
May
-18
Jun-
18
Jul-1
8
Aug-
18
Sep-
18
Oct-1
8
Nov-
18
Dec-
18
KSE-100 Index IMS Steel Uni.
Source: IMS Research
IMS Steel Universe is highly leveraged
0%
5%
10%
15%
20%
25%
30%
ISL ASTL MUGHAL
Source: IMS Research, Company Accounts
Fuel & Power as % of COGS – FY18
0%
10%
20%
30%
40%
50%
60%
ISL ASTL MUGHAL
Source: IMS Research, Company Accounts
Ahmed Raza [email protected]
TP Upside P/E (x) P/B (x) DY (%) (PKR) (%) 19F 20F 19F 20F 19F
Steel 7.0 5.4 1.5 1.3 8.9% ASTL 67 43% 8.5 5.2 1.0 0.9 3.2% MUGHAL 56 41% 5.7 5.0 1.1 1.0 8.1% ISL 100 48% 6.9 5.7 2.2 1.8 11.8%

27 | P a g e
Pakistan Strategy 2019
Pharmaceuticals
Correction has opened entry points Sector positives intact: Pakistan's Pharma industry has grown at a 10-yr
sales CAGR of 13%. This is via focus on volume expansion in core business and diversification into segments offering higher price control i.e. Nutraceuticals and Consumer Health. Together with a clear chalked out Drug policy, a consistent pricing mechanism should help sustain sales momentum, in our view. Although we are Neutral on both, we prefer SEARL over AGP for an impressive growth trajectory of 20%+ and a superior risk profile. Pharmaceuticals have corrected more than 20% from their CYTD high. This has opened up valuations – 2019f P/E is near 18x but 2020f P/E is now below 15x.
Margin compression will continue… Despite the PTI’s stated focus on healthcare, sector reforms may not come through in 2019. Growth will likely be volume led. With the possibility of further weakness in the PKR, sector GMs may come off to 30% (from 35%+ in CY17). However, the Impact may be cushioned to some extent by FY19’s CPI-linked price hike.
…but pharmaceuticals are better placed this time around: We think the bad is priced in for the sector, while pharmaceuticals have adequately budgeted the PKR at c. 147-149 to the US$ for next year. This, coupled with concessions/discounts from international vendors and change in home currency to CNY (for AGP’s imports), may allow stabilization in earnings from 2HCY19.
Risks: (i) Drug shortage due to pricing inefficiency,(ii) adverse legal rulings against the industry, (iii) inability to pass impact of PKR depreciation.
Sector performance
-40%-30%-20%-10%
0%10%20%30%
Dec-1
7
Jan-
18
Mar
-18
Apr-1
8
May
-18
Jun-
18
Jul-1
8
Aug-1
8
Sep-
18
Oct-1
8
Nov-1
8
Dec-1
8
KSE-100 Index Pharmaceutical Source: IMS Research
Profitability may improve gradually
-
2,000
4,000
6,000
8,000
10,000
12,000
- 10,000 20,000 30,000 40,000 50,000 60,000 70,000 80,000 90,000
2003
2004
2005
2006
2007
2008
2009
2010
2011
2012
2013
2014
2015
2016
2017
Net Sales (PKRmn) NPAT (PKRmn) - Rhs Source: Company Accounts
Sales uptick gradual but decisive
0
50
100
150
200
250
300
350
400
0
500
1,000
1,500
2,000
2,500
3,000
CY13 CY14 CY15 CY16 CY17
Sales (Unit'mn) Sales (PKRbn) - Rhs
Source: IMS Health
Yusra Beg [email protected]
TP Upside P/E (x) P/B (x) DY (%) (PKR) (%) 19F 20F 19F 20F 19F
Pharma 18.3 14.8 3.9 3.5 2.8% AGP 89 8% 18.1 13.4 3.4 3.0 2.4% SEARL 250 3% 18.4 15.6 4.2 3.8 2.9%

28 | P a g e
Pakistan Strategy 2019
Consumer (Dairy)
Challenges aplenty but long-term theme is intact Tough operating environment: Dairy producers have faced multiple
challenges in the last few years, including (i) increased competition, (ii) rising input costs, especially on imported skimmed milk powder (SMP), and (iii) negative media campaigns against packaged milk. As a result, the larger companies have lost market share while margins have also come off significantly. With inflation adding to input cost pressures amidst limited pricing flexibility, margins are likely to remain subdued, in our view.
Increasing interest in powder: Nestle has for long been the dominant player in the powder space. This is now changing with ICI setting up a Morinaga manufacturing facility and EFOODS recently launching a full-cream milk powder (FCMP) under its flagship Olpers brand. Given that EFOODS was successfully able to compete with Nestle in the UHT segment, it is possible that the new entrants in the powder space are able to experience the same success. That said, associated marketing costs for new entrants may delay meaningful profits by a few years.
Minimum pasteurization will be a key breakthrough: We estimate processed (UHT and powder) penetration in Pakistan is at 8.5% of the milk market. A step increase in loose-to-packaged conversion will represent a bull case for dairy producers. This could happen via implementation of a minimum pasteurization law. However, we do not yet think there is political consensus in place to implement such changes. That said, the long-term demand theme is intact and is leading to entry of foreign players in Pakistan’s dairy segment e.g. Royal FrieslandCampina with EFOODS and, possibly, Yili Group with Fauji Foods Ltd.
Risks: (i) Further dilution in market share through new entrants and (ii) swift rise in SMP prices.
Sector performance
-20%-10%
0%10%20%30%40%
Dec-
17
Jan-
18
Mar
-18
Apr-1
8
May
-18
Jun-
18
Jul-1
8
Aug-
18
Sep-
18
Oct-1
8
Nov-
18
Dec-
18
KSE-100 Index IMS Consumer Uni.
Source: IMS Research
Convergence out of loose milk has long slowed
7%
8%
8%
9%
9%
10%
10%
-
500
1,000
1,500
2,000
CY09
CY10
CY11
CY12
CY13
CY14
CY15
CY16
CY17
CY18
F
CY19
FMn Litres
Processed Milk Mkt Share - Rhs Source: Company Accounts, IMS Research
EDOODS: Sales and profitability recovering gradually
-
500
1,000
1,500
2,000
2,500
3,000
3,500
-
10,000
20,000
30,000
40,000
50,000
60,000
2011
2012
2013
2014
2015
2016
2017
2018
2019 PKRmnPKRmn
Sales - net PAT - Rhs Source: IMS Research
Yusra Beg [email protected]
TP Upside P/E (x) P/B (x) DY (%) (PKR) (%) 19F 20F 19F 20F 19F
Consumer 61.6 29.5 5.2 4.4 - EFOODS 66 -15% 61.6 29.5 5.2 4.4 -

29 | P a g e
Pakistan Strategy 2019
Insurance
Life business will mitigate the cyclicality of general business Non-life segment to decelerate: With economic growth set to slow
down, premiums growth will also moderate, particularly in the motor and property/fire segments. A decline in gross premiums is not expected, however (even in 2008, premiums grew by 3%). Claim ratios are likely to stay under control but this may not offset the slowdown in premiums. However, investment income may increase if, as we expect, the local equity market performs better in 2019f. Strict implementation of motor insurance laws, as reported in the media, will also be a key trigger but is unlikely to happen in our view.
Life business is more resilient: Pakistan’s life premiums have been growing comfortably in the double-digits (18% yoy growth in 2014 was the lowest in the last 10yrs). Other than under-penetration, a major reason is the appeal of life insurance as both a safety and saving product (unit-linked products). Upside can emanate from government life/health insurance schemes. Historically, state-owned State Life has won public tenders, but a larger population coverage might see participation from the private sector.
Overseas business to benefit: Continued PKR depreciation will result in earnings translation benefits companies with foreign operations (e.g. AICL derives 45% of net premiums from UAE). This should mitigate slowdown from local operations.
Risks: (i) Deterioration in law & order conditions which may affect claims, (ii) unfavorable regulations (e.g. higher taxes on premiums) and (iii) increased competition from smaller players.
Sector performance
-30%-20%-10%
0%10%20%
Dec-
17
Jan-
18
Mar
-18
Apr-1
8
May
-18
Jun-
18
Jul-1
8
Aug-
18
Sep-
18
Oct-1
8
Nov-
18
Dec-
18
KSE-100 Index IMS Insurance Uni.
Source: IMS Research
Life segment bucks cyclicality
0%5%
10%15%20%25%30%35%
CY07
CY08
CY09
CY10
CY11
CY12
CY13
CY14
CY15
CY16
CY17
1HCY
18
Gross Premium yoy% - Life Gross Premium yoy% - Non-life
Source: IAP, IMS Research
Non-life claims ratio is under control
0%10%20%30%40%50%60%70%80%
2006
CY07
CY08
CY09
CY10
CY11
CY12
CY13
CY14
CY15
CY16
CY17
1HCY
18
Net Claim Ratio % Average Source: IMS Research, IAP
Ahmed Raza [email protected]
TP Upside P/E (x) P/B (x) DY (%) (PKR) (%) 19F 20F 19F 20F 19F
Insurance 6.5 6.0 0.7 0.7 7.3% AICL 49 19% 6.5 6.0 0.7 0.7 7.3%

30 | P a g e
Pakistan Strategy 2019
Top Picks

31 | P a g e
Pakistan Strategy 2019
United Bank Ltd
United Bank Limited Price (PKR/sh) 131.56 TP (PKR/sh) 180.00 Stance Buy Upside (%) 36.8 Fwd D/Y (%) 6.1 Total Return (%) 42.9 Bloomberg / Reuters UBL PA/UBL.KA Mkt Cap (US$mn) 1,159 12m Hi-Low (PKR/sh) 215.16/122.64 6m Avg. D. Vol ('000 shrs) 2,252 6m Avg. Td Val (US$mn) 2.49
About the Company Owned by the Bestway Group, UBL is the 3rd largest bank in Pakistan. It is notable for having extensive operations in the GCC (overseas loans are c 25% of the mix) as well as a strong fee income franchise, punctuated by its first-mover advantage in branchless banking.
Raza Jafri, CFA [email protected]
Yusra Beg [email protected]
Rebound expected in 2019f UBL faced a series of one-offs in 2018 but the bad news is not expected to repeat in 2019f. Pension fund top-ups amount to c PKR9bn – higher than for peers – and the exercise appears complete. Similarly, the GCC loan book cleanup is almost over (overseas coverage is now 88% vs. 71% in Dec’17). Fee income also flattened in the last few years but is expected to revert to double-digit growth in 2019f, led by a push from domestic lines. We see 68% earnings growth for UBL in 2019f and a 3yr CAGR (2019-22f) of 23%.
Domestic asset quality is strong Consumer loans are less than 3% of the domestic loan book while 30% of the loan book is extended to the public sector (government guaranteed). As GCC provisions come off, UBL may be in a position to show lower cost of risk relative to peers. This should help offset UBL’s relatively low margin sensitivity to rising interest rates.
Attractive valuations UBL trades at a 2019f P/B of 0.9x and P/E of 7.1x, both at a c 30% discount to previous 5yr averages. With ROE projected to increase from c 14% in 2019f to more than 18% by 2022f, UBL should benefit from a strong rerating tailwind.
Catalysts • Completion of the loan book clean-
up in the GCC • PKR depreciation, which results in
translation gains • Quick recovery in fee income growth
Risks• A fine on US operations, similar to
HBL • Continuation of the 2018 bad news
into 2019 • Greater competition in branchless
banking
UBL - Valuation Snapshot CY17A CY18F CY19F CY20F CY21F
EPS (PkR) 21.39 11.09 18.64 23.44 28.14 EPS Growth -5.7% -48.2% 68.1% 25.7% 20.1% PER (x) 6.15 11.87 7.06 5.61 4.67 P/B (x) 0.92 0.99 0.94 0.84 0.74 P/B Tier I (x) 1.18 1.20 1.11 0.99 0.87 ROE 15.5% 8.0% 13.7% 15.8% 16.8% ROE (Tier-I) 20.2% 10.0% 16.3% 18.7% 19.8% DPS (PkR) 13.00 10.00 8.00 10.00 12.00 Dividend yield 9.9% 7.6% 6.1% 7.6% 9.1% NIMs 3.6% 3.4% 3.7% 4.0% 4.0%
Source: IMS Research
Offers great risk-reward
Symbol: UBL Rating: Buy TP: PKR180/sh

32 | P a g e
Pakistan Strategy 2019
Habib Bank Ltd
Habib Bank Limited Price (PKR/sh) 123.51 TP (PKR/sh) 175.00 Stance Buy Upside (%) 41.7 Fwd D/Y (%) 4.9 Total Return (%) 46.5 Bloomberg / Reuters HBL PA/HBL.KA Mkt Cap (US$mn) 1,304 12m Hi-Low (PKR/sh) 218.99/120.25 6m Avg. D. Vol ('000 shrs) 1,497 6m Avg. Td Val (US$mn) 1.67
About the Company Since privatization in 2004, HBL is 51% owned by the Aga Khan Fund for Economic Development (AKFED). It is the largest bank in Pakistan by branches (1600+) and balance sheet size (assets: c US$19bn) but has recently lost its top ranking in market capitalization to MCB.
Raza Jafri, CFA [email protected]
Yusra Beg [email protected]
Road to recovery starts from 2019 HBL has had a very tough 2017 and 2018, following the fine on the New York branch and its spillover. 2019f profitability will likely be suboptimal due to large legal and compliance costs, but HBL should begin to demonstrate its earnings and returns potential, particularly as the domestic franchise remains very strong.
The bad is priced in HBL trades at a 2019f P/B of 0.9x and P/E of 7.3x. On P/B, it is at more than a 40% discount to its previous 5 year valuation average. As ROE recovers to 18%+ through the cycle, HBL should experience significant valuation rerating, in our view. Much improved capital strength (Sep’18 CAR: 17.0%) has absorption capability in the unlikely event of a further fine by US regulators.
A new HBL Management attention is understandably on improving risk controls. This is coming at a cost (C/I may remain above 60% over the next 3yrs) but HBL should emerge as a much stronger institution. This is not the only focus area; management has outlined plans to (i) turnaround the international remittances business and (ii) push digital and branchless banking penetration, all while maintaining market leadership in deposits and corporate banking.
Catalysts • Closure of the New York branch
without any additional fine • Quick recovery in fee income
growth • Earlier than expected run down in
abnormal administrative expenses
Risks• Another fine by US regulators • Further PKR weakness, which
affects fx income on the income statement
• Higher than expected administrative expenses
HBL - Valuation Snapshot CY17A CY18F CY19F CY20F CY21F
EPS (PkR) 5.34 8.63 16.85 21.47 26.35 EPS Growth -77.0% 61.7% 95.2% 27.5% 22.7% PER (x) 23.14 14.31 7.33 5.75 4.69 P/B (x) 0.96 0.98 0.89 0.79 0.70 P/B Tier I (x) 1.10 1.10 1.00 0.89 0.79 ROE 4.1% 6.8% 12.7% 14.5% 15.8% ROE (Tier-I) 4.7% 7.7% 14.3% 16.3% 17.8% DPS (PkR) 8.00 4.00 6.00 8.00 10.00 Dividend yield 6.5% 3.2% 4.9% 6.5% 8.1% NIMs 3.9% 3.7% 4.5% 4.5% 4.5%
Source: IMS Research
Normalization is a matter of time
Symbol: HBL Rating: Buy TP: PKR175/sh

33 | P a g e
Pakistan Strategy 2019
Bank Alfalah Ltd
Bank Alfalah Limited Price (PKR/sh) 45.20 TP (PKR/sh) 58.00 Stance Buy Upside (%) 28.3 Fwd D/Y (%) 6.6 Total Return (%) 35.0 Bloomberg / Reuters BAFL PA/BAFL.KA Mkt Cap (US$mn) 577 12m Hi-Low (PKR/sh) 53.58/40.59 6m Avg. D. Vol ('000 shrs) 1,229 6m Avg. Td Val (US$mn) 0.46
About the Company BAFL was incorporated in 1992 and commenced operations in 1997. Owned by the Dhabi Group, BAFL is the 6th largest bank in Pakistan. BAFL has one of the highest proportion of current accounts in its deposit mix, and also has the largest Islamic window.
Highly leveraged to rising interest rates BAFL’s (i) high proportion of current accounts (c 43% of the deposit mix), (ii) funding cost advantages from its Islamic window and (iii) mostly domestic operations, result in high margin sensitivity to rising interest rates. We see BAFL’s margins rising by c 90bps in 2019f to 4.7%, which will extend the bank’s strong growth trajectory. This should drive c 22% earnings growth in 2019f.
Cost efficiency is improving BAFL’s cost control exercise is already showing results with admin expenses reducing by 3%yoy in 9M18. Together with rising revenue, we see the cost/income ratio coming down to less than 50% over the medium-term, from a previous 5 year average of 65%. This is a significant positive given that lack of adequate cost control was for long a sore point for BAFL. Stronger capital base CAR has improved to c 15%, the highest in at least the last 10yrs, and should enable a sustainable 40% cash payout ratio, in our view. Consistency on dividends can help ROE stay near 17% vs. an average of less than 15% in the last 5yrs. Moreover, if capital strength increases further, it is possible that separation of the Islamic window into a standalone bank becomes a viable option for BAFL going forward.
Catalysts • Increase in interest rates, given high
margin sensitivity • Greater than expected cost efficiency• Double-digit loan growth, provided
asset quality sustains
Risks• High Consumer and SME exposure
which can lead to a rapid increase in cost of risk.
• End to the cost control exercise. • Deceleration in fee income growth,
now that the base is higher
Play on margin expansion
Symbol: BAFL Rating: Buy TP: PRs58/sh
BAFL - Valuation Snapshot CY17A CY18F CY19F CY20F CY21F
EPS (PkR) 4.80 6.56 8.01 8.53 9.63 EPS Growth 7.9% 36.7% 22.0% 6.5% 12.9% PER (x) 9.42 6.89 5.65 5.30 4.70 P/B (x) 1.20 1.06 0.93 0.83 0.73 P/B Tier I (x) 1.36 1.17 1.03 0.91 0.81 ROE 13.3% 16.3% 17.5% 16.5% 16.6% ROE (Tier-I) 15.7% 18.3% 19.4% 18.2% 18.3% DPS (PkR) 1.36 2.50 3.00 3.50 4.00 Dividend yield 3.0% 5.5% 6.6% 7.7% 8.8% NIMs 3.6% 3.8% 4.7% 4.6% 4.5%
Source: IMS Research
Raza Jafri, CFA [email protected]
Yusra Beg [email protected]

34 | P a g e
Pakistan Strategy 2019
Pakistan Petroleum Ltd
Pakistan Petroleum Limited Price (PKR/sh) 149.96 TP (PKR/sh) 191.00 Stance Buy Upside (%) 27.4 Fwd D/Y (%) 4.7 Total Return (%) 32.0 Bloomberg / Reuters PPL PA/PPL.KA Mkt Cap (US$mn) 2,448 12m Hi-Low (PKR/sh) 193.88/147.75 6m Avg. D. Vol ('000 shrs) 645 6m Avg. Td Val (US$mn) 0.93
About the Company PPL is the second largest E&P in Pakistan by reserves, and is 67.5% owned by the Government of Pakistan. It operates some of the largest gas fields in the country and also has offshore investment in Iraq and Yemen. By virtue of GoP ownership, it enjoys large exploration acreage and stakes in the most promising hydrocarbon assets in the country. Its revenue is divided into 69% gas and 31% oil and other liquids.
Cheap valuations and triggers ahead PPL trades at an EV/EBITDA of 2.9x, despite relatively low sensitivity to oil prices given favorable gas tilt (only 10% of production is oil). We project PPL’s earnings to jump 22% in FY19 on the back of PKR depreciation and production growth in Gambat South. Potential resolution of circular debt through a PKR200-300bn Sukuk issue will resolve cash-flow issues and may lead to better payouts.
Many avenues for production growth Among the three E&Ps, PPL has the best production profile – growth is diversified, which somewhat de-risks the reliance on Sui. PPL has already commissioned a third gas processing plant at Gambat South (GPF-IV) and is expected to add GPF-III in 2HFY19 which will enhance gas production from the block to 110mmcfd, from 60mmcfd presently. Recent development efforts in mature assets have been successful in plateauing production.
Exploration could impress in 2019 Even though PPL has been aggressive on exploration, average reserve replacement ratio in the past three years has been a modest 33%. Potentially high-impact offshore drilling in 2019 could be a big turnaround.
Catalysts • Commissioning of GPF-III plant at
Gambat South block. • Success in offshore well in Indus G
(potentially large reserves). • Resolution of circular debt. • Favorable decision on terms of
conversion of three Tal block fields.
Risks• Further decline in oil prices will
depress sentiment in the sector. • Escalation of circular debt. • Unfavorable decision on Tal block
by IHC. • Potential SPO.
Diversification on the rise
Symbol: PPL Rating: Buy TP: PKR191/sh
PPL - Valuation Snapshot FY17A FY18A FY19F FY20F FY21F
EPS (PKR) 15.30 20.21 24.65 26.43 27.06 EPS Growth (%) 116.0% 32.1% 22.0% 7.2% 2.4% PER (x) 9.80 7.42 6.08 5.67 5.54 DPS (PKR) 7.83 4.78 7.00 13.00 14.00 DY (%) 5.2% 3.2% 4.7% 8.7% 9.3% PBV (x) 1.58 1.41 1.22 1.10 1.00 ROE (%) 17.0% 20.1% 21.5% 20.3% 18.9% EV/EBITDA (x) 4.15 3.59 2.89 2.51 2.14
Source: IMS Research
Muhammad Saad Ali, CFA [email protected]

35 | P a g e
Pakistan Strategy 2019
Engro Corporation Ltd
Engro Corporation Limited Price (PKR/sh) 314.99TP (PKR/sh) 379.00Stance BuyUpside (%) 20.3Fwd D/Y (%) 9.2Total Return (%) 29.5Bloomberg / Reuters ENGRO PA/EGCH.KAMkt Cap (US$mn) 1,18812m Hi-Low (PKR/sh) 350.22/284.836m Avg. D. Vol ('000 shrs) 7266m Avg. Td Val (US$mn) 1.79
About the Company ENGRO is a public listed company incorporated in Pakistan. The principal activity of the Company, is to manage investment in subsidiary companies, associated companies and joint ventures, engaged in fertilizer, PVC resin manufacturing and marketing, food, energy, LNG and chemical terminal and storage businesses. The Company is a subsidiary of Dawood Hercules Corporation Limited.
Favorable dynamics for underlying sectors The top-down industry dynamics for the fertilizer and polymer sectors are positive. These subsidiaries are expected to contribute 50% of the total CY19F earnings, despite the commissioning of ENGRO’s 1x330MW coal fired power plant. Moreover, if the recent PKR130/bag increase in urea prices is sticky, our target price stands to increase. ENGRO trades at CY19/20F P/E of 7.6/5.7 and offers a forward D/Y of 9.2%.
Power capacities about to come online ENGRO enters 2019 by deepening its presence in the power business which offers US$ hedged returns through 2x660MW mine-mouth coal fired power plants. These are expected to be completely operational by Jun’19. Earnings from the power portfolio are expected to lead a 3yr earnings CAGR of 28% for ENGRO and enable sustainably high cash payouts.
Cash rich books can fuel growth Despite new investments, and ongoing Thar projects, ENGRO still holds c. PKR62bn in net cash. We understand that the company aspires to put this cash to use in assorted growth avenues. Once this cash begins to be deployed, it could trigger improved price performance, where ENGRO will offer an attractive blend of both growth and a high dividend yield.
Catalysts • Sustainability of higher urea prices –
EFERT still forms 40% of ENGRO’s earnings
• Clarity on investment of PKR62bn cash for new ventures
• Timely completion of power projects
Risks• Negative event in fertilizer space
(higher gas price w/o any pass-on and GIDC removal)
• Delay or technical glitches in upcoming power projects
• Delay in deployment of cash
Valuations are attractive
Symbol: ENGRO Rating: Buy TP: PKR379/sh
ENGRO - Valuation Snapshot CY17A CY18F CY19F CY20F CY21F
EPS (PKR) 17.96 27.54 41.70 55.47 58.10 EPS Growth (%) -86.4% 53.3% 51.4% 33.0% 4.7% PER (x) 17.54 11.44 7.55 5.68 5.42 DPS (PKR) 21.00 21.00 29.00 30.00 36.00 DY (%) 6.7% 6.7% 9.2% 9.5% 11.4% PBV (x) 0.96 0.89 0.79 0.68 0.60 ROE (%) 5.5% 8.1% 11.1% 12.9% 11.8% EV/EBITDA (x) 5.64 5.45 4.20 2.66 2.16
Source: IMS Research
Ailia Naeem [email protected]

36 | P a g e
Pakistan Strategy 2019
Engro Fertilizer Ltd
Engro Fertilizers Limited Price (PKR/sh) 72.21 TP (PKR/sh) 89.00 Stance Buy Upside (%) 23.3 Fwd D/Y (%) 13.8 Total Return (%) 37.1 Bloomberg / Reuters EFERT PA/ENGR.KA Mkt Cap (US$mn) 694 12m Hi-Low (PKR/sh) 82.94/67.36 6m Avg. D. Vol ('000 shrs) 1,878 6m Avg. Td Val (US$mn) 1.12
About the Company EFERT was incorporated on June 29, 2009 in Pakistan as a wholly owned subsidiary of Engro Corporation Limited, which is a subsidiary of Dawood Hercules Corporation Limited. The principal activity of the Company is manufacturing, purchasing and marketing of fertilizers. It has the largest urea manufacturing capacity of 2.3mn tons in Pakistan.
Attractive valuations The recent price correction (down 10% in 1mth), despite higher urea prices (PKR130/bag in Oct’18), has opened up valuations. EFERT trades at a CY19/20F P/E of 6.7/6.3x and offers a D/Y of 13.8%, which is 160 bps higher than the 3yr PIB rate.
Bull case can lift current 2019f EPS estimate by 10% Healthy results on better retention prices, especially in 1H 2019 are expected to drive improved price performance. We have conservatively assumed c 50% of the already announced price hike (PKR60/bag) in our 2019f estimates - in our bull case assumption of Oct’18’s urea price hike of PKR130/bag sustaining across 2019, our EPS estimates will lift by 10%.
Effect of debottlenecking will be seen in 2019 EFERT completed debottlenecking on its EnVen plant in 4QCY18, which will enable the company to use the 780mmbtu gas more efficiently, and increase urea production by c. 75K tons (total 1.3mn MT). We have incorporated the same in our model, assuming a feed gas price of US$3.41/mmbtu. The earnings impact built in 2019f’s bottomline is PKR0.70/sh (c 6% of 2019f earnings).
Catalysts • Sustainability of high retention prices
throughout 2019 • Favorable demand-supply dynamics
resulting from gas non-availability for Agritech Ltd and Dawood Hercules
• Delay in subsidies on fertilizers
Risks• Allocation of any new gas
discoveries to fertilizer sector, and resultant glut in the urea market
• Further increase in gas prices (without a pass-on)
• GIDC removal
EFERT - Valuation Snapshot CY17A CY18F CY19F CY20F CY21F
EPS (PKR) 8.35 12.30 10.79 11.37 12.11 EPS Growth (%) 20.2% 47.2% -12.2% 5.3% 6.6% PER (x) 8.64 5.87 6.69 6.35 5.96 DPS (PKR) 8.50 10.50 10.00 10.00 11.00 DY (%) 11.8% 14.5% 13.8% 13.8% 15.2% PBV (x) 2.27 2.15 2.10 2.02 1.96 ROE (%) 26.6% 37.6% 31.7% 32.4% 33.4% EV/EBITDA (x) 5.55 4.51 4.25 4.13 3.95
Source: IMS Research
Safest bet in the fertilizer space
Symbol: EFERT Rating: Buy TP: PKR89/sh Ailia Naeem [email protected]

37 | P a g e
Pakistan Strategy 2019
Lucky Cement Ltd
Lucky Cement Limited Price (PKR/sh) 442.20 TP (PKR/sh) 580.00 Stance Buy Upside (%) 31.2 Fwd D/Y (%) 2.8 Total Return (%) 34.0 Bloomberg / Reuters LUCK PA/LUKC.KA Mkt Cap (US$mn) 1,029 12m Hi-Low (PKR/sh) 723.19/395.87 6m Avg. D. Vol ('000 shrs) 783 6m Avg. Td Val (US$mn) 2.94
About the Company Largest cement player in terms of size, owned by the Younus Brothers Group. The company also owns a 56% stake in ICI Pakistan which is one of the leading chemical company in Pakistan. In addition, the company has offshore investments in Iraq and DR Congo. LUCK is currently diversifying with an auto assembling unit (JV with Kia) and a 660MW coal IPP.
Best risk/reward in the sector Given concerns of slowing demand (tough macros and PSDP cuts) and limited pricing power, LUCK stands well-positioned in the sector. Its ability to readily export cement, presence in both regions, balance sheet strength and diversification – will enable it to better withstand industry headwinds than peers. Its core business is presently trading at an EV/ton of US$39/ton (new plant costs US$90/ton). Also, cumulatively, non-local cement operations contribute PKR230/sh or 40% of our TP.
Expect improvement in other businesses Although diversified in international cement operations, LUCK has faced issues in both Iraq and DR Congo. In both markets, influx of regional cement has dented margins. In DRC, however, culmination of elections is expected to lead to favorable policy changes to improve business for local plants. LUCK’s 660 MW coal based power plant is expected to achieve COD operations by Mar’21.
Potential foreign buying could unlock valuations While local fund managers are overweight in LUCK, the anticipated return of foreign investors in 2019 will likely be a major positive for LUCK given it is the best-in-class cement company in Pakistan. This could in turn help the stock regain position in the MSCI EM main index.
Catalysts • Decline in coal prices • Improvement in demand/margins in
export markets • Industry’s ability to raise prices • GoP expediting implementation of
mega construction projects
Risks• Competition from imported cement
in DR Congo • Delay in commissioning of power
plant • Gas tariff hikes • Persistent decline in margins in Iraq
LUCK - Valuation Snapshot FY17A FY18A FY19F FY20F FY21F
EPS (PKR) 50.10 45.83 44.62 47.13 64.48 EPS Growth (%) 8.9% -8.5% -2.6% 5.6% 36.8% PER (x) 8.83 9.65 9.91 9.38 6.86 DPS (PKR) 12.00 13.00 12.50 12.50 19.50 DY (%) 2.7% 2.9% 2.8% 2.8% 4.4% PBV (x) 1.49 1.31 1.18 1.07 0.96 ROE (%) 18.2% 14.4% 12.5% 12.0% 14.8% EV/EBITDA (x) 4.65 6.06 9.86 11.55 10.10
Source: IMS Research
Well-positioned amid resilient core competencies
Symbol: LUCK Rating: Buy TP: PKR580/sh Muhammad Saad Ali, CFA [email protected]
38 | P a g e
Pakistan Strategy 2019
Attock Petroleum Ltd
Attock Petroleum Limited Price (PKR/sh) 449.95 TP (PKR/sh) 606.00 Stance Buy Upside (%) 34.7 Fwd D/Y (%) 10.2 Total Return (%) 44.9 Bloomberg / Reuters APL PA/APL.KA Mkt Cap (US$mn) 322 12m Hi-Low (PKR/sh) 532.8/403.08 6m Avg. D. Vol ('000 shrs) 27 6m Avg. Td Val (US$mn) 0.11
About the Company APL is the third largest OMC in Pakistan with over 600 pumps, overall market share of c. 10%, and a dominant status in the deregulated product markets. The company is majorly owned by the Attock Group, which also owns an E&P and two refineries.
Emerges on top in the sector APL has long been a relatively safer bet in the OMC sector with decent growth and attractive dividend yield. In recent years, faster growth diverted investor preference to HASCOL. Of late however, APL has outperformed the sector in terms of growth and market share gain in a slowing market. Its concentration in Punjab, backward integration with group refineries, low reliance on imports and immunity from circular debt – will likely return premium valuations to the stock.
It’s all about storages APL’s upcoming storage expansion includes major additions (c. 37k tons in FY19F) at Shikarpur, Sahiwal, Daulatpur and Taru Jabba. The company has already added c. 5k tons of storage at Machike during FY18, which should help in meeting the minimum inventory cover of 20 days. This is critical because it enables APL to not only maintain market share but also grow when competitors are not able to supply fuel.
Blend of growth and yield We project c 10% profit growth in FY19F followed by 15% growth in FY20F Forward D/Y is a high 10%. Given its operational strengths, APL has a strong balance sheet which can be employed effectively if any M&A opportunity emerges in the sector.
Catalysts • Commissioning of new storages. • Rising oil prices will benefit margins
on deregulated products. • OMC margins increase
Risks• Greater CNG allocation in Punjab • Group refineries operating at
suboptimal capacity utilization. • Slowdown in construction activity
affecting demand for asphalt. • Stock liquidity issues
APL- Valuation Snapshot FY17A FY18A FY19F FY20F FY21F
EPS (PKR) 53.24 56.83 61.99 71.36 76.52 EPS Growth (%) 38.4% 6.7% 9.1% 15.1% 7.2% PER (x) 8.45 7.92 7.26 6.31 5.88 DPS (PKR) 35.42 33.33 46.00 54.00 61.00 DY (%) 7.9% 7.4% 10.2% 12.0% 13.6% PBV (x) 2.75 2.43 2.24 2.06 1.92 ROE (%) 34.6% 32.6% 32.1% 34.0% 33.8% EV/EBITDA (x) 5.30 5.49 4.29 3.63 3.28
Source: IMS Research
Deserves a premium over peers
Symbol: APL Rating: Buy TP: PKR606/sh Muhammad Saad Ali, CFA [email protected]

39 | P a g e
Pakistan Strategy 2019
Hub Power Co. Ltd
The Hub Power Company Limited Price (PKR/sh) 86.24 TP (PKR/sh) 132.20 Stance Buy Upside (%) 53.3 Fwd D/Y (%) 5.8 Total Return (%) 59.1 Bloomberg / Reuters HUBC PA/HPWR.KA Mkt Cap (US$mn) 718 12m Hi-Low (PKR/sh) 104.87/80.36 6m Avg. D. Vol ('000 shrs) 819 6m Avg. Td Val (US$mn) 0.57
About the Company HUBC was incorporated in Pakistan on August 01, 1991 as a public limited company. The principal activities of the Company are to develop, own, operate and maintain power stations. The Company owns two oil based power stations of 1200 MW in Balochistan and 214 MW in Punjab. In 2018, it was acquired by Mega Conglomerate from previous sponsor Dawood Group.
Power capacities’ CoD draw near The first unit of 2x660MW coal plants is expected to be operational in Jan’19, while the second unit comes online in Aug’19. The contribution from the new power capacities is expected to add PKR6.7/sh to HUBC’s earnings, amplified due to the weaker PKR. While dividends are expected at a low PKR5.0/sh during FY19/20F each, prospects for growth and better payouts in the medium-term from new projects may drive improved price performance hereon.
Circular debt settlement may ease the leverage position Up to 30% of the planned PKR200-300bn from sukuk bonds in early 2019 may make its way to Pakistan’s IPPs. Assuming a 50% of receivables settlement for HUBC (PKR37bn vs. overdue Trade debts of PKR74bn), HUBC should be able to retire most of its payables. A larger injection could also potentially lead to short term debt reduction, creating space for project financing.
Further expansion plans in line HUBC has acquired 37% of total shareholding of ThalNova power project (capacity: 330MW; fuel: local coal). The project is expected to add PKR1.11/sh (10% of FY18 EPS) post CoD and will increase our TP by PKR12/sh. However, we will incorporate the same in our estimates post financial close.
Catalysts • US$ hedged ROEs ranging from 27-
30% on upcoming projects • 1,500MW+ coal capacities to result
in 3 yr earnings CAGR of 34% • Circular debt settlement to ease
liquidity constraints
Risks• Further debt or rights issue to
finance expansions • Low dividends in the medium term • New power capacities to burden
cash payments to older, FO based plants
HUBC- Valuation Snapshot FY17A FY18A FY19F FY20F FY21F
EPS (PKR) 9.24 9.56 11.23 18.07 23.09 EPS Growth (%) -10.2% 3.4% 17.5% 61.0% 27.8% PER (x) 9.34 9.03 7.68 4.77 3.74 DPS (PKR) 7.50 7.40 5.00 5.00 9.00 DY (%) 8.7% 8.6% 5.8% 5.8% 10.4% PBV (x) 2.85 2.56 2.00 1.45 1.12 ROE (%) 31.3% 29.9% 29.2% 35.3% 33.9% EV/EBITDA (x) 9.53 6.70 7.20 7.58 6.44
Source: IMS Research
The only way from here is up
Symbol: HUBC Rating: Buy TP: PKR132.2/sh Ailia Naeem [email protected]

40 | P a g e
Pakistan Strategy 2019
Nishat Power Ltd
Nishat Power Limited Price (PKR/sh) 26.50 TP (PKR/sh) 36.40 Stance Buy Upside (%) 37.2 Fwd D/Y (%) 7.5 Total Return (%) 44.8 Bloomberg / Reuters NPL PA/NISH.KA Mkt Cap (US$mn) 68 12m Hi-Low (PKR/sh) 34.57/23.5 6m Avg. D. Vol ('000 shrs) 216 6m Avg. Td Val (US$mn) 0.04
About the Company NPL is a subsidiary of Nishat Mills Ltd (NML). The principal activity of NPL is to build, own, operate and maintain a fuel fired power station having gross capacity of 200 MW. The Company has a Power Purchase Agreement with its sole customer, National Transmission and Despatch Company Limited for 25 years which commenced from June 09, 2010.
Has corrected sharply; risk-reward now attractive NPL underperformed the market by 12% in 2018, as its payout ratio declined to 16.5% vs. a 55% historical average. Furthermore, being a pure D/Y play, the stock price has adjusted for the 425bps increase in interest rates last year. However, now that monetary tightening has largely ended and there are prospects for a better cash-flow position, NPL may depict a rebound in 2019.
Dispatches intact amid FO generation slowdown NPL has one of the most efficient furnace oil-based plants which has consistently been high up the merit list. While other furnace oil based plants operated at significantly lower levels, NPL operated at 68% in FY18, just 4ppts below the utilization levels during FY17. Having an efficient plant, NPL is less prone to delayed payments as new capacities come online.
Cash injection by GoP Anticipated cash injection of an estimated PKR100bn for IPPs out of the total proceeds from Energy Sukuk issue is likely to result in higher payouts from NPL. A 50% settlement of receivables (approximately PKR5bn) could result in PKR3.0/sh of potential payout in FY19F, netting off short term borrowings and payables.
Catalysts • Payouts to ramp up from 17% in
FY18 to >30% in medium term post likely trade debts settlement.
• Plant to remain operational despite FO based plants phase out.
• Guaranteed ROE payments to keep D/Y at, if not above, 10% even if dispatches slow down
Risks• Excess electricity supply to catalyze
FO phase out • Plant ageing to affect efficiency • Concerns of circular debt re-piling
in the absence of structural reforms.
NML - Valuation Snapshot FY17A FY18A FY19F FY20F FY21F
EPS (PKR) 8.15 9.07 11.32 12.53 5.49 EPS Growth (%) 1.2% 11.3% 24.8% 10.7% -56.2% PER (x) 3.25 2.92 2.34 2.11 4.83 DPS (PKR) 4.00 2.00 2.00 5.00 4.00 DY (%) 15.1% 7.5% 7.5% 18.9% 15.1% PBV (x) 0.68 0.57 0.48 0.42 0.41 ROE (%) 22.1% 21.2% 22.2% 21.1% 8.6% EV/EBITDA (x) 3.71 3.70 2.51 1.87 2.72
Source: IMS Research
Efficient IPP with renewed hope of payouts
Symbol: NPL Rating: Buy TP: PKR36.4/sh Ailia Naeem [email protected]

41 | P a g e
Pakistan Strategy 2019
Nishat Mills Ltd
Nishat Mills Limited Price (PKR/sh) 135.43 TP (PKR/sh) 180.00 Stance Buy Upside (%) 32.9 Fwd D/Y (%) 3.0 Total Return (%) 35.9 Bloomberg / Reuters NML PA/NISM.KA Mkt Cap (US$mn) 343 12m Hi-Low (PKR/sh) 171.56/124.04 6m Avg. D. Vol ('000 shrs) 620 6m Avg. Td Val (US$mn) 0.66
About the Company Nishat Mills Limited is the flagship company of the Nishat Group. It was established in 1951. It is one of the most modern, largest vertically integrated textile companies in Pakistan. Nishat Mills Limited has 227,640 spindles, 805 Toyota air jet looms. The Company also has the most modern textile dyeing and processing units, 2 stitching units for home textile, 2 stitching units for garments and power generation facilities with a capacity of 120 MW.
Continuation of duty drawbacks may be an upside trigger About 80% of NML’s sales are exports. That said, post discontinuation of duty drawbacks, sector exports have flattened out in 5MFY19. Continuation of duty drawbacks (4-7% across categories) will result in a 47% positive EPS impact for NML, assuming no conditions, and 33% positive EPS impact if duty drawbacks are conditional on 10% export growth.
Subsidized gas supply The ECC has approved provision of gas to exporters of five zero-rated sectors at a fixed rate of US$6.5/mmbtu until Jun’19. NML meets 30% of its power and fuel requirement through gas. Continuation of gas availability at these prices may have a positive EPS impact of 8% for NML over FY20-23F.
Less prone to risks With 53% contribution from value added products, NML is less prone to risks of: (i) varying primary margins, and (ii) low demand for non-value added products from China. Furthermore, 80% contribution from exports in total revenues also improves prospects for NML amid 20% weaker PKR in 2018 (gross margins improved 2.2ppt yoy to 12.6% in 1QFY19).
Catalysts • 12% PKR weakness over 1HFY19 to
reflect in earnings given 80% revenues are from exports.
• 50%+ revenues from value added segment, where price/demand dynamics look positive.
• Favorable government policies.
Risks• Recovery in energy prices to put
pressure on margins. • Delay in profitability of garments
segment. • Concerns of lackluster demand for
autos launched by NML Hyundai joint venture.
NML - Valuation Snapshot FY17A FY18A FY19F FY20F FY21F
EPS (PKR) 12.12 11.65 12.29 17.54 18.53 EPS Growth (%) -13.4% -3.9% 5.5% 42.7% 5.6% PER (x) 11.17 11.62 11.02 7.72 7.31 DPS (PKR) 5.00 4.75 4.00 7.00 7.00 DY (%) 3.7% 3.5% 3.0% 5.2% 5.2% PBV (x) 0.54 0.63 0.61 0.58 0.55 ROE (%) 5.0% 5.0% 5.6% 7.7% 7.7% EV/EBITDA (x) 8.20 7.79 6.17 5.21 4.86
Source: IMS Research
Worst is priced in, valuations are attractive
Symbol: NML Rating: Buy TP: PKR180/sh Ailia Naeem [email protected]

42 | P a g e
Pakistan Strategy 2019
Indus Motor Co Ltd
Indus Motor Company Limited Price (PKR/sh) 1,200.00 TP (PKR/sh) 1,580.00 Stance Buy Upside (%) 31.7 Fwd D/Y (%) 9.6 Total Return (%) 41.3 Bloomberg / Reuters INDU PA/INDM.KA Mkt Cap (US$mn) 679 12m Hi-Low (PKR/sh) 1941.95/1030.62 6m Avg. D. Vol ('000 shrs) 16 6m Avg. Td Val (US$mn) 0.16
About the Company Indus Motors Limited Company is a JV between the House of Habib and Toyota Motor Corporation Japan for assembling, manufacturing, and marketing of Toyota vehicles in Pakistan since July 01, 1990. INDU assembles three models locally including Corolla, Hilux and Fortuner.
Corolla sales bucking industry trend Auto industry sales are down 4%yoy in 5MFY19 on account of increased prices, higher interest rates and the ban on buyers who do not file taxes. However, led by Corolla, INDU’s sales are up 2%yoy during the same period. INDU appears less affected by the non-filer ban while pricing power has also not moderated much. 2018’s PKR devaluation is being passed through in phases and will complete in Jan’19 as per the company’s announced plan. This means the hit to margins may only be temporary.
Additional debottlenecking underscores management confidence INDU will carry another debottlenecking exercise (in FY21) which will add 11k units, taking annual capacity to 76k. This underscores management’s bullish view over the medium-to-long term despite current challenges and upcoming competition, in our view. This should address a weakness where INDU lost market share during FY17-18 due to capacity constraints. The additional capacity may be utilized for a new model (Toyota Vios as per news reports).
Next generation Corolla will be due in FY20 Taking cue from previous launches, we think the 12th generation Corolla will be due in FY20 (11th generation launched in FY15), which can be a major trigger. INDU trades at FY19/20F PE of 7.5/6.7x and also offers a high D/Y of c 10%
Catalysts • Launch of next generation Corolla (5
yr cycle will completed in FY20) • Introduction of a new variant (e.g.
Toyota Vios) to replace entry-level versions of Corolla.
• Ban or additional restrictions on usedimported cars
Risks• Inability to increase prices in case
of further PKR depreciation • Negative agricultural growth
impacting rural sales • Delay in launch of new Corolla,
especially if new players enter sedan segment
INDU - Valuation Snapshot FY17A FY18A FY19F FY20F FY21F
EPS (PKR) 165.41 200.66 159.13 178.70 216.04 EPS Growth (%) 13.5% 21.3% -20.7% 12.3% 20.9% PER (x) 7.25 5.98 7.54 6.71 5.55 DPS (PKR) 115.00 140.00 115.00 130.00 160.00 DY (%) 9.6% 11.7% 9.6% 10.8% 13.3% PBV (x) 3.02 2.57 2.35 2.14 1.95 ROE (%) 44.2% 46.4% 32.5% 33.3% 36.7% EV/EBITDA (x) 4.31 3.62 4.22 3.77 3.07
Source: IMS Research
Outperforming peers amid regulatory fallout
Symbol: INDU Rating: Buy TP: PKR1,580/sh Ahmed Raza [email protected]

43 | P a g e
Pakistan Strategy 2019
IMS Universe Summary*
P ric e TP (P KR) (P KR) 19 f 2 0 f 19 f 2 0 f 19 f 2 0 f 19 f 2 0 f 19 f 2 0 f 19 f 2 0 f 19 f 2 0 f
E&P 6.3 5.9 19% 6% 1.1 1.0 7.8% 10.2% 18% 18% 2.7 2.4 OGDC 4.02 130 175 35 B 21.76 22.62 6.0 5.7 19% 4% 0.9 0.9 9.2% 10.8% 16% 16% 2.4 2.2 PPL 2.45 150 191 27 B 24.65 26.43 6.1 5.7 22% 7% 1.2 1.1 4.7% 8.7% 21% 20% 2.9 2.5 POL 0.88 430 497 16 B 45.07 53.53 9.5 8.0 12% 19% 3.7 3.6 10.0% 11.9% 39% 45% 4.0 3.7 Banks 7.6 6.2 46% 22% 1.1 1.0 6.5% 7.5% 14% 16% n.a n.aABL 0.88 107 118 11 N 13.51 15.33 7.9 6.9 17% 13% 1.1 1.0 7.5% 8.4% 14% 15% n.a n.aMCB 1.61 189 210 11 N 19.70 25.68 9.6 7.3 25% 30% 1.4 1.3 8.5% 8.5% 15% 18% n.a n.aHBL 1.30 124 175 42 B 16.85 21.47 7.3 5.8 95% 27% 0.9 0.8 4.9% 6.5% 13% 15% n.a n.aUBL 1.16 132 180 37 B 18.64 23.44 7.1 5.6 68% 26% 0.9 0.8 6.1% 7.6% 14% 16% n.a n.aBAFL 0.58 45 58 28 B 8.01 8.53 5.6 5.3 22% 7% 0.9 0.8 6.6% 7.7% 18% 17% n.a n.aMEBL 0.76 90 107 19 B 11.82 14.03 7.6 6.4 59% 19% 1.9 1.6 4.5% 5.6% 29% 27% n.a n.aCement 9.1 7.7 -26% 18% 0.9 0.8 4.6% 5.5% 10% 11% 7.1 6.7 DGKC 0.26 82 112 36 B 6.78 8.37 12.1 9.8 -66% 23% 0.4 0.4 3.9% 3.9% 4% 4% 5.1 5.1 LUCK 1.03 442 580 31 B 44.62 47.13 9.9 9.4 -3% 6% 1.2 1.1 2.8% 2.8% 13% 12% 9.9 11.6 MLCF 0.18 43 56 31 B 6.77 10.54 6.3 4.0 -12% 56% 0.8 0.7 7.0% 13.5% 13% 18% 4.4 3.0 CHCC 0.09 72 91 26 B 9.71 11.27 7.4 6.4 -20% 16% 1.0 0.9 5.6% 5.9% 15% 16% 12.2 4.6 FCCL 0.21 21 21 (0) S 2.58 2.46 8.2 8.6 4% -5% 1.4 1.3 9.5% 9.5% 17% 16% 4.3 4.5 ACPL 0.11 107 127 19 B 11.55 14.49 9.2 7.4 -64% 25% 0.8 0.8 7.5% 9.8% 9% 11% 4.7 3.9 KOHC 0.12 83 115 38 B 11.05 17.55 7.5 4.7 -26% 59% 0.9 0.8 5.4% 8.4% 12% 17% 5.8 4.9 Fertilizer 7.4 6.4 16% 16% 1.3 1.2 10.1% 10.6% 18% 19% 4.7 3.8 FFC 0.85 93 106 13 N 11.17 12.03 8.4 7.8 8% 8% 3.6 3.5 10.7% 11.8% 44% 45% 6.5 6.3 EFERT 0.69 72 89 23 B 10.79 11.37 6.7 6.4 -12% 5% 2.1 2.0 13.8% 13.8% 32% 32% 4.2 4.1 FFBL 0.25 36 36 (1) S 1.13 1.73 32.1 21.1 53% 52% 2.4 2.3 4.7% 5.1% 8% 11% 23.1 16.6 FATIMA 0.52 35 39 12 N 6.84 7.30 5.0 4.7 16% 7% 1.1 1.0 8.7% 9.4% 24% 23% 3.5 3.4 ENGRO 1.19 315 379 20 B 41.70 55.47 7.6 5.7 51% 33% 0.8 0.7 9.2% 9.5% 11% 13% 4.2 2.7 OMCs 8.2 6.8 -8% 21% 1.1 1.1 6.4% 8.7% 14% 16% 5.7 4.7 PSO 0.64 228 255 12 N 30.84 36.01 7.4 6.3 -22% 17% 0.7 0.7 4.8% 7.0% 10% 11% 5.8 5.0 APL 0.32 450 606 35 B 61.99 71.36 7.3 6.3 9% 15% 2.2 2.1 10.2% 12.0% 32% 34% 4.3 3.6 HASCOL 0.19 143 161 13 N 10.04 15.75 14.2 9.1 5% 57% 2.1 1.9 4.2% 6.3% 16% 22% 6.2 4.9 SHEL 0.21 278 289 4 N 27.85 35.88 10.0 7.7 34% 29% 2.5 2.4 7.6% 10.8% 26% 32% 7.1 4.9 Engineering 7.0 5.4 6% 28% 1.5 1.3 8.9% 11.4% 21% 24% 5.3 4.1 ASTL 0.10 47 67 43 B 5.56 9.14 8.5 5.2 4% 64% 1.0 0.9 3.2% 7.9% 12% 18% 6.5 4.4 MUGHAL 0.07 40 56 41 B 7.01 8.00 5.7 5.0 37% 14% 1.1 1.0 8.1% 10.6% 22% 22% 4.3 3.7 ISL 0.21 68 100 48 B 9.83 11.83 6.9 5.7 -2% 20% 2.2 1.8 11.8% 13.3% 35% 35% 5.3 4.1 Power 5.2 3.9 11% 32% 1.3 1.1 10.2% 11.6% 26% 28% 5.1 4.5 NPL 0.07 27 36 37 B 11.32 12.53 2.3 2.1 25% 11% 0.5 0.4 7.5% 18.9% 22% 21% 2.5 1.9 HUBC 0.72 86 132 53 B 11.23 18.07 7.7 4.8 18% 61% 2.0 1.5 5.8% 5.8% 29% 35% 7.2 7.6 KAPCO 0.31 50 53 7 N 12.03 13.39 4.1 3.7 0% 11% 1.2 1.1 20.2% 22.2% 29% 31% 3.0 2.1 NCPL 0.06 23 29 24 B 10.01 11.02 2.3 2.1 8% 10% 0.6 0.5 12.8% 17.1% 27% 25% 11.3 3.2 Textiles 8.2 6.7 13% 21% 0.6 0.6 4.1% 5.7% 8% 9% 6.4 5.9 NML 0.34 135 180 33 B 12.29 17.54 11.0 7.7 5% 43% 0.6 0.6 3.0% 5.2% 6% 8% 6.2 5.2 NCL 0.08 49 69 42 B 12.30 11.03 4.0 4.4 25% -10% 0.8 0.8 8.8% 7.8% 21% 18% 6.8 7.4 Autos 8.0 7.2 -27% 12% 1.5 1.4 7.9% 8.8% 19% 20% 4.3 3.3 PSMC 0.11 182 230 26 B 14.63 23.35 12.4 7.8 -14% 60% 0.5 0.5 1.4% 2.5% 4% 6% 3.0 2.1 HCAR 0.18 177 290 64 B 26.90 24.52 6.6 7.2 -41% -9% 1.3 1.2 7.3% 6.8% 21% 18% 4.0 1.5 INDU 0.68 1200 1,580 32 B 159.13 178.70 7.5 6.7 -21% 12% 2.3 2.1 9.6% 10.8% 33% 33% 4.2 3.8 GTYR 0.06 78 74 (6) S 1.66 3.04 47.3 25.8 -76% 83% 2.2 2.1 1.3% 2.6% 5% 8% 14.5 11.2 Tractors 9.0 8.8 -17% 2% 5.7 5.3 9.9% 10.1% 64% 61% 5.6 5.7 MTL 0.25 777 1,040 34 B 107.94 107.40 7.2 7.2 -20% -1% 3.8 3.6 12.2% 12.2% 55% 51% 4.2 4.4 AGTL 0.23 557 480 (14) S 45.81 48.92 12.2 11.4 -11% 7% 12.0 10.9 7.4% 7.9% 104% 100% 8.1 7.8 ChemicalsICI 0.52 777 725 (7) S 25.75 29.63 30.2 26.2 -22% 15% 3.7 3.5 1.6% 1.9% 13% 14% 11.1 10.2 Pharma 18.3 14.8 3% 24% 3.9 3.5 2.8% 3.7% 22% 24% 13.8 11.0 AGP 0.17 82 89 8 N 4.52 6.12 18.1 13.4 1% 35% 3.4 3.0 2.4% 3.7% 20% 24% 14.2 10.6 SEARL 0.37 241 250 3 N 13.12 15.50 18.4 15.6 4% 18% 4.2 3.8 2.9% 3.7% 24% 26% 13.6 11.2 FoodEFOODS 0.43 78 66 (15) S 1.26 2.63 61.6 29.5 41% 109% 5.2 4.4 0.0% 0.0% 9% 16% 19.4 13.9 InsuranceAICL 0.10 41 49 19 B 6.29 6.81 6.5 6.0 16% 8% 0.7 0.7 7.3% 7.3% 12% 12% n.a n.aIMS-Universe 7.4 6.4 13% 16% 1.2 1.1 7.2% 8.6% 16% 17% 5.9 5.2
P BV (x) DY (%) ROE (%) EV /EBITDA +/ - (%) S ta nc e
Mkt Ca p (US $ Bn)
EP S Gth (%)P ER (x)EP S (P KR)
*as of Jan 3rd 2019 B=Buy, N=Neutral, S=Sell

44 | P a g e
Pakistan Strategy 2019
We, IMS Research Team, certify that the views expressed in the report reflect our personal views about the subject securities. We also certify that no part of our compensation was, is, or will be, directly or indirectly, related to the specific recommendations made in this report. We further certify that we do not have any beneficial holding of the specific securities that we have recommendations on in this report.
Ratings Guide* Upside Buy More than 15% Neutral Between 0% - 15% Sell Below 0% *Based on 12 month horizon unless stated otherwise in the report. Upside is the percentage difference between the Target Price and Market Price.
Valuation Methodology: We use multiple valuation methodologies in arriving at a Target Price including, but not limited to, Discounted Cash Flow (DCF), Dividend Discount Model (DDM) and relative multiples based valuations. Risks: Please refer to page 16. Disclaimer: Intermarket Securities Limited has produced this report for private circulation only. The information, opinions and estimates herein are not direct at, or intended for distribution to or use by, any person or entity in any jurisdiction where doing so would be contrary to law or regulation or which would subject Intermarket Securities Limited to any additional registration or licensing requirement within such jurisdiction. The information and statistical data herein have been obtained from sources we believe to be reliable where such information has not been independently verified and we make no representation or warranty as to its accuracy, completeness, and correctness. This report makes use of forward looking statements that are based on assumptions made and information currently available to us and those are subject to certain risks and uncertainties that could cause the actual results to differ materially. No part of the compensation of the author(s) of this report is related to the specific recommendations or views contained in this report. This report is not a solicitation or any offer to buy or sell any of the securities mentioned herein. It is meant for information purposes only and does not take into account the particular investment objectives, financial situation or needs of individual recipients. Before acting on any information in this report, you should consider whether it is suitable for your particular circumstances and, if appropriate, seek professional advice. Neither Intermarket Securities Limited nor any of its affiliates or any other person associated with the company directly or indirectly accepts any liability whatsoever for any direct or consequential loss arising from any use of this report or the information contained herein. Subject to any applicable law and regulations, Intermarket Securities Limited, its affiliates or group companies or individuals connected with Intermarket Securities Limited directly or indirectly may have used the information contained herein before publication and may have positions in, or may from time to time purchase or sell or have a material interest in any of the securities mentioned or may currently or in future have or have had a relationship with, or may provide investment banking, capital markets and/or other services to, the entities mentioned herein, their advisors and/or any other connected parties.
RESEARCH DISCLOSURES
Third Party Research This is third party research. It was prepared by Intermarket Securities Limited (IMS), with headquarters in Karachi, Pakistan. Intermarket Securities Limited (IMS) is authorized to engage in securities activities according to its domestic legislation. This research is not a product of Exotix USA, Inc, a U.S. registered broker-dealer. Intermarket Securities Limited (IMS) has sole control over the contents of this research report. Exotix USA, Inc does not exercise any control over the contents of, or the views expressed in, research reports prepared by Intermarket Securities Limited (IMS).
Intermarket Securities Limited (IMS) is not registered as a broker-dealer in the United States and, therefore, is not subject to U.S. rules regarding the preparation of research reports and the independence of research analysts. This research report is provided for distribution to “major U.S. institutional investors” and other “U.S. institutional investors” in reliance on the exemption from registration provided by Rule 15a-6 of the U.S. Securities Exchange Act of 1934, as amended (the “Exchange Act”).
Any U.S. recipient of this research report wishing to effect any transaction to buy or sell securities or related financial instruments based on the information provided in this research report should do so only through Exotix USA, Inc, located at Floor 36, 444 Madison Avenue, Floor 36, New York, NY 10022. A representative of Exotix USA, Inc. is contactable on +1 (212) 551 3480. Under no circumstances should any U.S. recipient of this research report effect any transaction to buy or sell securities or related financial instruments through Intermarket Securities Limited (IMS). Exotix USA, Inc accepts responsibility for the contents of this research report, subject to the terms set out below, to the extent that it is delivered to a U.S. person other than a major U.S. institutional investor.
None of the materials provided in this report may be used, reproduced, or transmitted, in any form or by any means, electronic or mechanical, including recording or the use of any information storage and retrieval system, without written permission.
Intermarket Securities Limited (IMS) is the employer of the research analyst(s) responsible for the content of this report and research analysts preparing this report are resident outside the U.S. and are not associated persons of any U.S. regulated broker-dealer. The analyst whose name appears in this research report is not registered or qualified as a research analyst with the Financial Industry Regulatory Authority (“FINRA”) and may not be an associated person of Exotix USA, Inc and, therefore, may not be subject to applicable restrictions under FINRA Rules on communications with a subject company, public appearances and trading securities held by a research analyst account.
Exotix USA, Inc. or its affiliates has not managed or co-managed a public offering of securities for the subject company in the past 12 months, has not received compensation for investment banking services from the subject company in the past 12 months, and does not expect to receive or intend to seek compensation for investment banking services from the subject company in the next three months. Exotix USA, Inc. has never owned any class of equity securities of the subject company. There are no other actual, or potential, material conflicts of interest of Exotix USA, Inc. at the time of the publication of this report. As of the publication of this report, Exotix USA, Inc. does not make a market in the subject securities.
About Exotix Capital Exotix Capital is a registered trade mark of Exotix Partners LLP. Exotix Partners LLP and its subsidiaries ("Exotix Capital") provide specialist investment banking services to trading professionals in the wholesale markets. Exotix Capital draws together liquidity and matches buyers and sellers so that deals can be executed by its customers. Exotix Capital may at any time, hold a trading position in the securities and financial instruments discussed in this report. Exotix Capital has procedures in place to identify and manage any potential conflicts of interests that arise in connection with its research. A copy of Exotix Capital’s conflict of interest policy is available at www.exotix.com/regulatory-information.
DistributionThis report is not intended for distribution to the public and may not be reproduced, redistributed or published, in whole or in part, for any purpose without the written permission of Exotix Capital. Exotix Capital shall accept no liability whatsoever for the actions of third parties in this respect. This report is for distribution only under such circumstances as may be permitted by applicable law.
This report may not be used to create any financial instruments or products or any indices. Neither Exotix Capital, nor its members, directors, representatives, or employees accept any liability for any direct or consequential loss or damage arising out of the use of all or any part of the information herein.
United Kingdom: Distributed by Exotix Partners LLP only to Eligible Counter parties or Professional Clients (as defined in the FCA Handbook). The information herein does not apply to, and should not be relied upon by, Retail Clients (as defined in the FCA Handbook); neither the FCA’s protection rules nor compensation scheme may be applied.
UAE: Distributed in the Dubai International Financial Centre by Exotix Partners LLP (Dubai) which is regulated by the Dubai Financial Services Authority (“DFSA”). Material is intended only for persons who meet the criteria for Professional Clients under the Rules of the DFSA and no other person should act upon it.
Other distribution: The distribution of this report in other jurisdictions may be restricted by law and persons into whose possession this document comes should inform themselves about, and observe, any such restriction.
Disclaimers Exotix Capital and/or its members, directors or employees may have interests, or long or short positions, and may at any time make purchases or sales as a principal or agent of the securities referred to herein. Exotix Capital may rely on information barriers, such as “Chinese Walls” to control the flow of information within the areas, units, divisions, groups of Exotix Capital.
Investing in any non-U.S. securities or related financial instruments (including ADRs) discussed in this report may present certain risks. The securities of non-U.S. issuers may not be registered with, or be subject to the regulations of, the U.S. Securities and Exchange Commission. Information on such non-U.S. securities or related financial instruments may be limited. Foreign companies may not be subject to audit and reporting standards and regulatory requirements comparable to those in effect within the United States. The value of any investment or income from any securities or related financial instruments discussed in this report denominated in a currency other than U.S. dollars is subject to exchange rate fluctuations that may have a positive or adverse effect on the value of or income from such securities or related financial instruments.
Frontier and Emerging Market laws and regulations governing investments in securities markets may not be sufficiently developed or may be subject to inconsistent or arbitrary interpretation or application. Frontier and Emerging Market securities are often not issued in physical form and registration of ownership may not be subject to a centralised system. Registration of ownership of certain types of securities may not be subject to standardised procedures and may even be effected on an ad hoc basis. The value of investments in Frontier and Emerging Market securities may also be affected by fluctuations in available currency rates and exchange control regulations. Not all of these or other risks associated with the relevant company, market or instrument which are the subject matter of the report are necessarily considered.

45 | P a g e
Pakistan Strategy 2019
IMS Team
Noor Hameed Chief Executive Officer 603 [email protected] Sales Team Designation Extension Email Wajid Hussain Head of Broking 201 [email protected]
M. Fahad Zia Head of Institutional Sales 213 [email protected]
Dr. Gohar Rasool Head of International Sales 601 [email protected] Burhan Moosa Institutional Sales 207 [email protected] Farooq Siddiqui Institutional Sales 203 [email protected]
Azeem Akhtar Institutional Sales 209 [email protected]
Research Team Designation Extension Email Sector covered Raza Jafri, CFA Director Research 301 [email protected] Strategy, Banks
Muhammad Saad Ali, CFA Head of Research 205 [email protected] Economy, Oil & Gas & Cements
Yusra Beg Senior Analyst 305 [email protected] Banks, Consumer & Pharma
Ailia Naeem Investment Analyst 306 [email protected] Fertilizer, Power, Chemicals & Textiles
Ahmed Raza Investment Analyst 101 [email protected] Autos, Steel & Insurance
Abdul Wadood Manager Research 302 [email protected] Database
Ubair Usman Assistant Database 302 [email protected] Database
Muhammad Rehan Library in-charge 304 [email protected] Database
Contact us
Intermarket Securities Ltd.
www.imsecurities.com.pk
Registered Office Corporate Office
Suite No. 309, 3rd Floor, Business & Finance Centre, 5th Floor, Bahria Complex IV-Extension Building,
I.I Chundrigar Road, Karachi 74000, Pakistan Chaudhry Khalique-uz-Zaman Road, Clifton, Karachi, Pakistan
Tel: +92-21-32473969-72 Tel: +92-21-37131600
Tel: +92-21-111-467-000 Fax: +92-21-35155129
Fax: +92-21-32473967