Pakistan Income Inequality Growth
35
INCOME INEQUALITIES IN PAKISTAN AND A STRATEGY TO REDUCE INCOME INEQUALITIES by A. R. Kemal This Study should not be reported as representing the views of the Ministry of Finance. This Study was commissioned under the “Support to PRSP-II Formulation Project”, as part of the consultative process for preparing PRSP-II. The views expressed in this Study are those of the author and do not necessarily represent those of the Ministry of Finance.
Transcript of Pakistan Income Inequality Growth
INCOME INEQUALITIES IN PAKISTAN AND A STRATEGY TO REDUCE INCOME INEQUALITIES
by
A. R. Kemal
This Study should not be reported as representing the views of the Ministry of Finance. This Study was commissioned under the “Support to PRSP-II Formulation Project”, as part of the consultative process for preparing PRSP-II. The views expressed in this Study are those of the author and do not necessarily represent those of the Ministry of Finance.
2
INCOME INEQUALITIES IN PAKISTAN AND A STRATEGY TO REDUCE INCOME INEQUALITIES
by
A. R. Kemal
I. INTRODUCTION The basic objective of economic development is improvements in the living standards of the common man and for that just economic growth would not be sufficient. This is because the growth and income distribution jointly determine improvements in the living standards of the common man. Unfortunately with an increase in poverty during the 1990s, focus of research shifted to estimation of the proportion of the poor and of the policymakers to reduce the proportion of the poor population rather than taking appropriate measures to improve income distribution.
That income distribution worsens in initial stages of economic growth and is
followed by improvements in income distribution later is a phenomenon known as Kuznet Curve. The phenomenon is believed to arise because of movements of labour from a more egalitarian agricultural sector to the industrial sector where higher income opportunities are exploited by the few. [See Kuznets (1955,1963)]. Kuznet curve, however, may be the result of various other mechanisms as well. For example Greenwood and Jovanovich (1990) point out that financial sector development may increase income inequalities in the initial stages when only a few have access to the bank credit and fall as more people are able to access the formal credit1. The Kuznet curve can also be result of the development of democratic institutions; income inequality rises initially with the establishment of democratic institutions as elite formulate the policies for their own benefit but income distributions starts improving as the democratic institutions mature2. See for example Gradstein and Milonovic (2000) and Chong (2001). The Kuznet curve may also result from the fact that in the initial stages rich accumulate physical and human capital while the common man is unable to do so but as income inequalities increase to an unacceptably higher level, threat of revolution forces elite to work for the common man and the rising income inequality trend is reversed.
Changes in income inequality in accordance with the Kuznet curve has been observed in a number of countries and across the countries. Nevertheless, it does not
1 Banergee and Newman (1993) and Galor and Zeira (1993) point out that if capital market imperfections and indivisibilities in investment in human or physical capital exist, the income inequalities may continue to remain high. 2With the spread of education common man is aware of their rights, media become independent and watch dogs appear with the result that democratic institutions make sure that the economic policies benefit common man.
3
imply that each nation must have increasing income inequalities in the earlier stages of economic development. Governments can take suitable measures to avoid increases or at least decelerate the rising income inequalities. For example, financial development accompanied with effective interventions to promote micro, small and medium enterprises would help in better income distribution. Similarly, increase in public consumption and investment, properly targeted would also help in improving income distribution3. Opening up media can be helpful in policy formulation for reducing income inequalities. Since growth and income inequality relationship is influenced by relative growth of various sectors, technological choices and employment generation, government may influence them through various policies including tax-cum-subsidy measures.
The subject matter of this study is to explore the possibilities to avoid any further
increases and if possible to reduce the income inequalities in Pakistan so that benefits of growth are equitably distributed to all sections of the population. Plan of the paper is as follows: After this introductory section various inequality measures, data availability to compute the inequality indices and trends in income inequality are examined in section II. An analysis of changes in income inequalities, the growth and inequality and the main drivers of economic inequalities are analysed in section III. The measures suggested in MTDF and PRSP for reducing income inequalities are reviewed in section IV. Main elements of strategy for reducing income inequalities are presented in section V. Main conclusions and policy recommendations are reported in section VI.
II. INCOME INEQUALITY TRENDS: MEASUREMENT AND
DATA AVAILABILITY While various income inequality indicators have been developed to examine trends in income inequalities the economic theory does not help in determining personal income distribution. However, it does explore relationship between growth and functional income distribution, i.e. distribution of GDP between labour and capital. Since there may exist a large gap between functional and personal income distribution because of variation in the distribution of assets across various sections of the society, one may be hesitant to draw any conclusions on personal income distribution on the basis of functional income distribution. Assuming that capital is generally owned by the richer sections of the society4 and the workers belong to the less well-off sections of the society and do not hold any assets, personal income distribution would be similar to the functional income distribution. II. 1. Income inequality Indices5 A large number of indices have been suggested in the literature to ascertain the income inequalities. These indices include statistical measures such as Lorenz curve, gini 3 See for example, Clarke, Xu, and Zou (2003). 4 We may note that the incomes of the proprietors of small informal sector enterprises are profits and these are part of returns to capital. 5 For details see Kemal (2003)
4
coefficients, log normal distribution, coefficient of variations, inter-quartile range, ratios of income received by highest and lowest income groups etc. and normative measures that take into consideration valuation of society towards welfare of various sections of population such as Theil’s entropy measure, Atkinson’s Index, Takayama Index, Sen’s Index etc. However, Lorenz curve and gini coefficients are the only ones that are generally used for ascertaining changes in income inequalities in Pakistan.
A good index of income inequality is expected to meet the following criteria6:
(i) Pigou-Dalton transfer sensitivity: Income inequality increases if income
is transferred from someone poorer to someone richer; (ii) Symmetry: Income inequality remains the same if two individuals merely
change places in the distribution; (ii) Independence: If incomes of everyone increase by the same proportion,
there would be no change in income inequality; and (iii) Population homogeneity: If the population of each income group rises
or falls by the same proportion, there would be no change in income inequality.
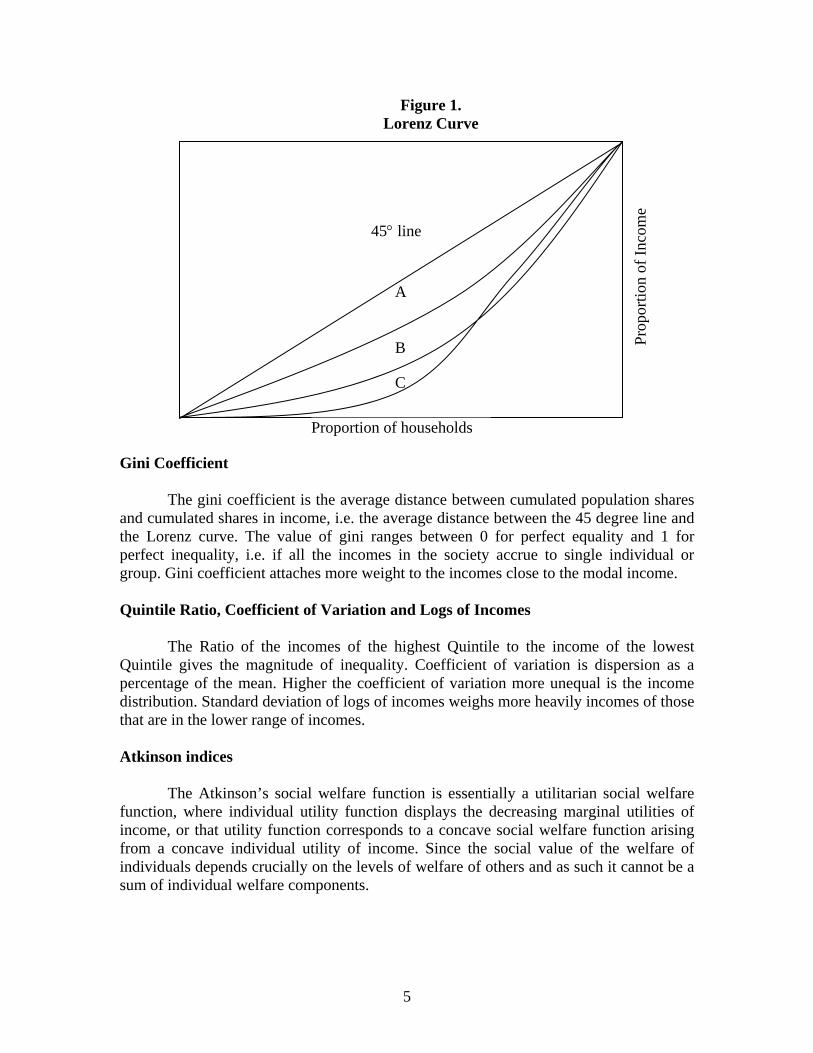
Lorenz curve The Lorenz curve provides complete information on the whole distribution of incomes as a proportion of the mean and gives a comprehensive description of the relative standards of living of various groups of households. Lorenz curve that is at a larger distance from the 45° line shows higher levels of income inequality than the one closer to the 45° line. In the figure 1, curve B shows higher income inequality compared to A. If everybody receives the same level of income, Lorenz curve coincides with 45° line. However, if the two Lorenz curves intersect then it is not possible to determine which curve shows higher or lower income inequalities. For example, one cannot say if the Lorenz curve B shows lower or higher income inequality than the Lorenz curve C.
6 Another criteria is that the indicator allows income inequality to be decomposed into subgroups or sources, is important but not necessary.
5
Figure 1. Lorenz Curve
Gini Coefficient
The gini coefficient is the average distance between cumulated population shares
and cumulated shares in income, i.e. the average distance between the 45 degree line and the Lorenz curve. The value of gini ranges between 0 for perfect equality and 1 for perfect inequality, i.e. if all the incomes in the society accrue to single individual or group. Gini coefficient attaches more weight to the incomes close to the modal income. Quintile Ratio, Coefficient of Variation and Logs of Incomes
The Ratio of the incomes of the highest Quintile to the income of the lowest
Quintile gives the magnitude of inequality. Coefficient of variation is dispersion as a percentage of the mean. Higher the coefficient of variation more unequal is the income distribution. Standard deviation of logs of incomes weighs more heavily incomes of those that are in the lower range of incomes. Atkinson indices
The Atkinson’s social welfare function is essentially a utilitarian social welfare
function, where individual utility function displays the decreasing marginal utilities of income, or that utility function corresponds to a concave social welfare function arising from a concave individual utility of income. Since the social value of the welfare of individuals depends crucially on the levels of welfare of others and as such it cannot be a sum of individual welfare components.
A
B
C
Prop
ortio
n of
Inco
me
Proportion of households
45° line
6
Theil’s Entropy Measure Theil’s index is a normative index and satisfies the decomposability criterion if
incomes are overlapping and non-disjoint, e.g., when an individual receives income from several different sources. Theil’s measures attach greater weight to larger incomes. II. 2. Availability and quality of data for computing inequality indicators
Household Income and Expenditure Survey (HIES) and Pakistan Integrated
Household Survey (PIHS) have been used to estimate income inequalities. However, a few studies have supplemented these data with the income tax data. Event though HIES data have been designed to study the consumption patterns, they have also been used to estimate the income inequalities. The HIES had a sample of 14000 households spread over the four provinces and four quarters and the households in each quarter have been different. Besides rural and urban division, the data are further disaggregated by provinces as well. However, the data at provincial level involve large sampling errors and therefore is not representative. Now the HIES and PIHS have been replaced with Pakistan Living Standard Measurement (PLSM) and Core Welfare Indicators (CWIQ) Surveys. The former with the sample size of 16,000 is more representative of the provinces than the HIES or PIHS and the latter survey with 74,000 households is representative by districts and has been specially designed to monitor the PRSP targets.
While HIES, PIHS and now PLSM data are quite rich, its utility in estimating income inequalities is limited due to doubtful quality of the data. See Kemal (1981) and Ahmad and Ludlow (1988). The problems regarding the quality of data may still be applicable to PLSM and CWIQ surveys. Firstly, as pointed out by Bergan (1967), the sample is relatively small for measuring income inequalities and the sampling error is quite large for thinly populated income groups. In particular, number of observations for the upper range of incomes is very small and consequently income accruing to the highest income group is seriously understated. This is also reflected in the fact that household incomes derived from the Survey are substantially less than the household incomes derived from National Accounts. Second, the non-response has generally been concentrated in the highest and the lowest income groups, resulting in the understatement of the income inequalities. Third, retained earnings of the corporate sector are not part of the personal incomes but they are part of their overall incomes, and to that extent personal incomes in HIES are under-estimated. Fourth, the income inequalities are biased downwards when rural-urban weights corresponding to an earlier period are used.
While these data limitations point out that income inequality would be understated, it may be argued that income inequality trends may not be affected. However, if incomes of those who are the major beneficiaries of growth process are left out of the survey, even the trends in inequality would be seriously distorted. Since the big industrialists and landlords are a very small proportion of the sample, it is not possible to discern the trends in income distribution with any degree of accuracy. Therefore, there is a pressing need to improve the quality of data and to supplement the PLSM data with data from other sources.
7
III.3. Trends in income inequalities
Whereas different studies provide estimates of various inequality indices in Pakistan the Lorenz curve and gini coefficients have been most commonly used in the policy discussions in Pakistan. Various studies on income inequality in Pakistan show different estimates arising due the following five important factors. Firstly, different studies use different data sets some are based on Household Income and Expenditure Surveys, others make use of income tax data, and some other studies splice the two sets of data. Second, while some studies consider inequalities in income, the others consider inequalities in the consumption expenditures. Third, while some studies are done for Pakistan as a whole, others examine income inequalities in both the rural and urban areas. Fourth, some studies report income inequalities across households; the others report inequalities across population or earners. Fifth, some researchers classify data by deciles prior to estimation of gini-coefficient; the others employ the income intervals that are not uniform. Therefore, the need for consistent income inequality of measures over time is imminent.
Anwar (2005) provides a consistent series of gini coefficients based on a
consistent methodology using grouped7 household income data. Gini coefficient is generally higher in the urban than in the rural areas because:
• Urban labour force is more diversified in terms of skill, education, union
membership, coverage by the minimum wage legislation and therefore the wage incomes are more unevenly distributed than in rural areas; and
• Income from self-employment is more concentrated in urban areas than in
rural areas because urban self-employed ranges from wealthy businessmen to poor workers whereas bulk of the rural self-employed are homogeneous and mostly in informal sector enterprises.
7 Grouped data assumes away the inequalities within each group.

8
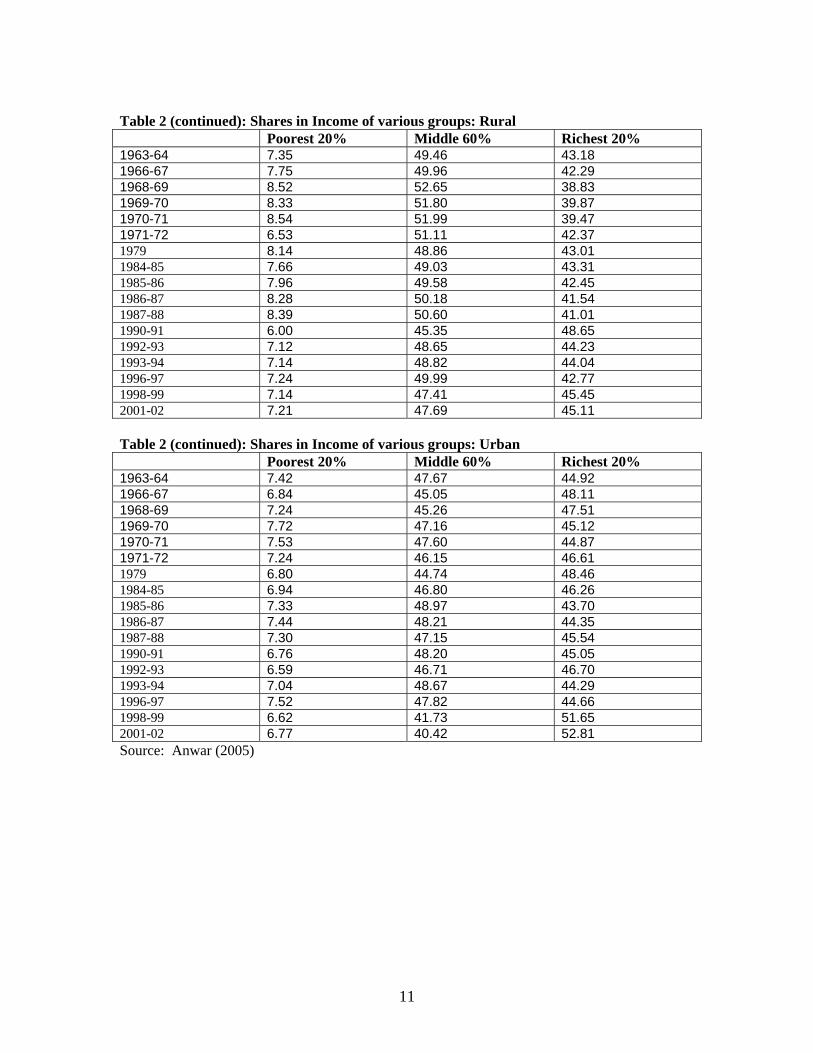
Source: Anwar (2005) The gini coefficients show different trends over time and across urban and rural areas. (Table1). In the urban areas gini coefficient increased sharply from 0.3698 to 0.4068 over 1963-67 but declined to 0.3694 by 1969-70. Income inequalities in rural areas, on the other hand, declined from 0.3543 to 0.3122 over the 1963-70 period. The shares of various quintiles in income also show similar trends (Table2). In the rural areas, income share of the poorest 20% increased from 7.35% to 8.54% and that of richest 20% declined from 43.18% to 39.87%. In urban areas, the poorest 20% lost the income share and the richest 20% gained significantly over the period 1963-67 but in the subsequent period changes in the shares reversed. The increase in income inequalities in urban areas up to 1967 indicate that high growth was job-less and real wage rates had been declining8. Improvements in gini coefficient in the subsequent period of the 1960s may have been due to increase in wages and legislation aimed at protecting the workers as a response to the demonstrations against the government policies that had led to rising income inequalities. The decline in inequalities in rural areas seems to have been due to green revolution – divisible technology – which might have benefited the poor as well. See Choudhary (1982).
Income inequalities increased during the 1970s; gini coefficient increased from 0.3394 to 0.3946 over 1970-79 period. Over the same period inequalities increased in rural areas from 0.3122 to 0.3450 and in urban areas from 0.3694 to 0.4118. The income share of the poorest 20% declined marginally while that of the richest 20% increased substantially. The gain to the richest 20% was more pronounced in rural areas than in
8 For example see Khan (1967).
9
urban areas. This is contrary to the general perception because land reforms, nationalization of major industrial and financial undertakings and the government focus on the basic needs strategy during the period were expected to result in lower income inequalities. Probably the sharp increase in inflation during the period had taken a toll of the poor resulting in a reduction in the share of income of the poor and the middle class.
During the 1980s gini coefficient in both the rural and urban areas declined
sharply over 1979-88 from 0.3450 to 0.3227 and from 0.4118 to 0.3782 respectively. Overall gini coefficient declined from 0.3946 to 0.3608. The income share of the poorest 20% increased and that of the richest 20% declined and the trend has been observed in both the rural as well as urban areas. Main factor behind the improved trends in income inequalities in 1980s has been the increases in employment and real wages in the agriculture and manufacturing sectors.
Whereas in the next three years, 1988-91, gini coefficient in the urban areas
remained somewhat constant it increased sharply in the rural areas. The ratios of shares of lowest and highest quintiles also show sharp increases in income inequalities. Rising income inequality in rural areas may have been due to the government policy to withdraw the subsidy on agricultural inputs and compensating the farmers with the increase in support prices which had differential impact on small and large farmers9. While income inequality widened both in urban and rural areas, the increase was more pronounced in urban areas than in rural areas.
In the rural areas the gini coefficient declined but there has been mixed trend in
urban areas up to 1996-97. However, to a smaller extent in the rural areas and to a large extent in the urban areas income inequalities have increased since then. Gini coefficient increased in rural areas from 0.3517 to 0.3762 and in urban areas from 0.3691 to 0.4615 over the 1997-2002 period. The overall gini coefficient over the period increased from 0.3598 to 0.4129.
Whereas the income inequality in 1996-97 had been low the inequalities have
been the maximum in the 1990s compared to any time period in the history of Pakistan. The poorest 20% lost share while the richest 20% gained in both the urban and rural areas between 1987-88 and 2001-02. While decline in income share of the poorest 20% was marginal because it was already meager, the erosion of income share of middle 60% was substantial resulting in considerable gain of the richest 20% indicating erosion of the middle class. The erosion of income share of middle 60% was more pronounced in urban than in rural areas. We may note that this has been the period when Pakistan followed Structural Adjustment and Stablisation Programs. All over the world such programs have led to increase in the income inequality. These have been noted in many studies and for example see Mahmood (2001).
9 While the withdrawal of subsidy increased the cost of inputs for both the small and large farmers, the benefit from increase in prices of output is proportional to the marketed surplus. The large farmers have proportionately larger marketed surplus than the small farmers.
10
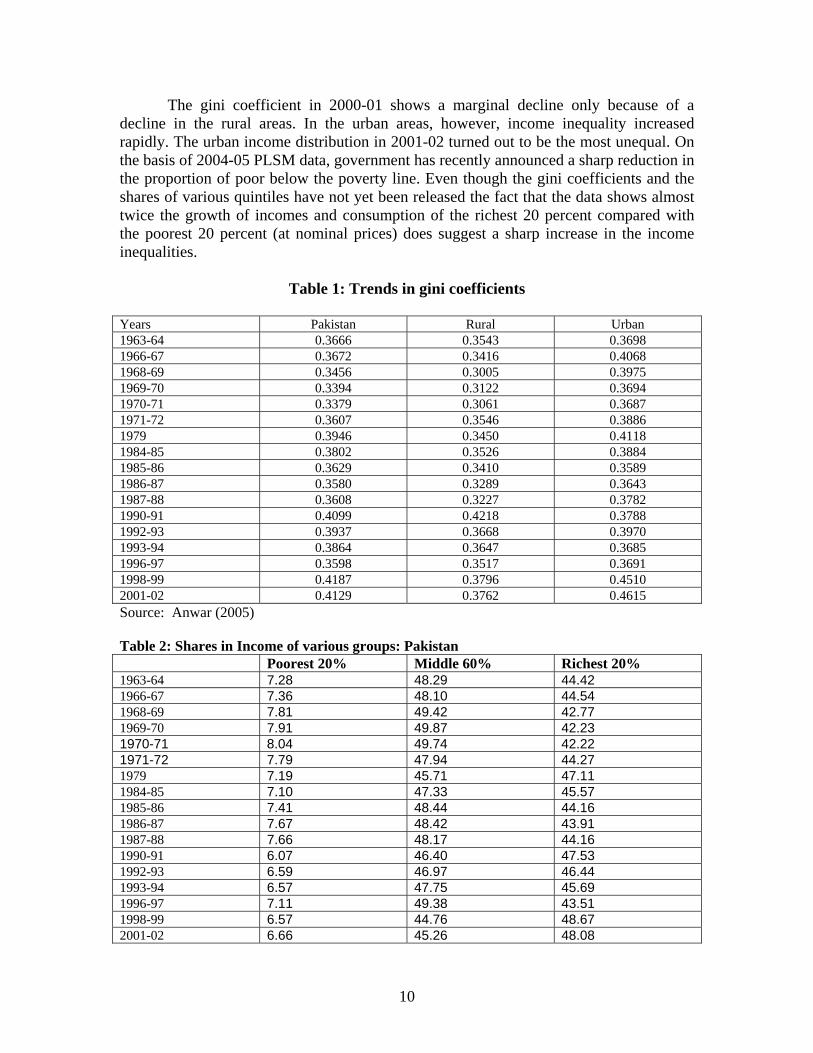
The gini coefficient in 2000-01 shows a marginal decline only because of a decline in the rural areas. In the urban areas, however, income inequality increased rapidly. The urban income distribution in 2001-02 turned out to be the most unequal. On the basis of 2004-05 PLSM data, government has recently announced a sharp reduction in the proportion of poor below the poverty line. Even though the gini coefficients and the shares of various quintiles have not yet been released the fact that the data shows almost twice the growth of incomes and consumption of the richest 20 percent compared with the poorest 20 percent (at nominal prices) does suggest a sharp increase in the income inequalities.
Table 1: Trends in gini coefficients
Years Pakistan Rural Urban 1963-64 0.3666 0.3543 0.3698 1966-67 0.3672 0.3416 0.4068 1968-69 0.3456 0.3005 0.3975 1969-70 0.3394 0.3122 0.3694 1970-71 0.3379 0.3061 0.3687 1971-72 0.3607 0.3546 0.3886 1979 0.3946 0.3450 0.4118 1984-85 0.3802 0.3526 0.3884 1985-86 0.3629 0.3410 0.3589 1986-87 0.3580 0.3289 0.3643 1987-88 0.3608 0.3227 0.3782 1990-91 0.4099 0.4218 0.3788 1992-93 0.3937 0.3668 0.3970 1993-94 0.3864 0.3647 0.3685 1996-97 0.3598 0.3517 0.3691 1998-99 0.4187 0.3796 0.4510 2001-02 0.4129 0.3762 0.4615 Source: Anwar (2005) Table 2: Shares in Income of various groups: Pakistan Poorest 20% Middle 60% Richest 20% 1963-64 7.28 48.29 44.42 1966-67 7.36 48.10 44.54 1968-69 7.81 49.42 42.77 1969-70 7.91 49.87 42.23 1970-71 8.04 49.74 42.22 1971-72 7.79 47.94 44.27 1979 7.19 45.71 47.11 1984-85 7.10 47.33 45.57 1985-86 7.41 48.44 44.16 1986-87 7.67 48.42 43.91 1987-88 7.66 48.17 44.16 1990-91 6.07 46.40 47.53 1992-93 6.59 46.97 46.44 1993-94 6.57 47.75 45.69 1996-97 7.11 49.38 43.51 1998-99 6.57 44.76 48.67 2001-02 6.66 45.26 48.08
11
Table 2 (continued): Shares in Income of various groups: Rural Poorest 20% Middle 60% Richest 20% 1963-64 7.35 49.46 43.18 1966-67 7.75 49.96 42.29 1968-69 8.52 52.65 38.83 1969-70 8.33 51.80 39.87 1970-71 8.54 51.99 39.47 1971-72 6.53 51.11 42.37 1979 8.14 48.86 43.01 1984-85 7.66 49.03 43.31 1985-86 7.96 49.58 42.45 1986-87 8.28 50.18 41.54 1987-88 8.39 50.60 41.01 1990-91 6.00 45.35 48.65 1992-93 7.12 48.65 44.23 1993-94 7.14 48.82 44.04 1996-97 7.24 49.99 42.77 1998-99 7.14 47.41 45.45 2001-02 7.21 47.69 45.11 Table 2 (continued): Shares in Income of various groups: Urban Poorest 20% Middle 60% Richest 20% 1963-64 7.42 47.67 44.92 1966-67 6.84 45.05 48.11 1968-69 7.24 45.26 47.51 1969-70 7.72 47.16 45.12 1970-71 7.53 47.60 44.87 1971-72 7.24 46.15 46.61 1979 6.80 44.74 48.46 1984-85 6.94 46.80 46.26 1985-86 7.33 48.97 43.70 1986-87 7.44 48.21 44.35 1987-88 7.30 47.15 45.54 1990-91 6.76 48.20 45.05 1992-93 6.59 46.71 46.70 1993-94 7.04 48.67 44.29 1996-97 7.52 47.82 44.66 1998-99 6.62 41.73 51.65 2001-02 6.77 40.42 52.81 Source: Anwar (2005)
12
III. FACTORS GIVING RISE TO INCOME INEQUALITIES
Factors behind changes in the income distribution patterns can best be explored through a full-fledged model comprising distribution of assets; functional income distribution determined by various factors including changes in the composition of sectoral output, technology employed, demand for labour by education, occupation, and skills, and wage rates; and the transfers payments. These factors may be influenced by major policy initiatives and as such can be rather helpful in better policy formulation to keep income distribution patterns in the acceptable limits.
Whereas a few studies have explored the policy parameters impacting the income
distribution in rural areas of Pakistan10, no such study is available for the urban areas. Nevertheless, the decomposition analysis of income inequalities into various components including the reallocation effect, i.e. changes in the inequality index due to a reallocation of resources from one sector to another; functional distribution effect, i.e. changes in inequality index arising from shifts in the relative factor shares within a sector; and factor effects, i.e. changes in the income inequality due to changes in the factor shares over time help in exploring the factors that may affect the income distribution in the urban areas as well. See Ahmad (2002) and Haq (1999).
The four main factors that govern personal income distribution include: • Distribution of assets; • Functional income distribution; • Transfers from other households, government and rest of the world; and • Tax and expenditure structure of the government.
Asset Distribution: Assets of a household are determined by the inheritance; cumulative savings and return on the investments; and changes in the valuation of assets. Pakistan inherited very uneven land distribution and the gini index of the land is around 0.60. Whereas in the urban areas the asset distribution at the time of independence may not be as uneven as in the rural areas, they have become even more skewed with the passage of time due to a number of factors. Firstly, large scale manufacturing and other enterprises have been provided with various incentives resulting in abnormal profits and rapid multiplication of assets. Second, rent seeking class has been promoted through land grants, import, investment and other licenses all of which carried premium and resulted in accumulation of assets by the privileged sections of the society. Third, access to credit has been rather skewed. For example 68.8 percent of the total bank advances are accounted for by just 0.4 percent of the account holders. Pakistan carried out land reforms in the 1960s and 1970s without any significant impact on the land distribution. Land distribution continues to be rather skewed and 56 percent of the total land is accounted for by just 14 percent of the landowners. Similarly,
10 For example see Adams (1990), Adams and Alderman (1992) and Adams and He (1996)

13
even though with the de-regulation and removal of distortions the rent seeking activities in urban areas have fallen, they still continue. Moreover, the banks were nationalized in the 1970s on the pretext that the small producers did not have access to credit the skewness in the credit continues to be high. Functional Income Distribution Functional income distribution is determined by the employment structure, distribution of labour force within various industrial and occupational groups and relative incomes in various industries and occupations11. The pattern of income distribution varies both across different activities and within each of the various activities12 and the inequalities within each of the activity is higher than across the activities. If the share of those industries rise which are more capital intensive, income inequalities would rise. Therefore allocations of resources to various economic activities assume great significance.
If the employment does not grow rapidly, the income inequalities tend to rise. The income inequalities in various groups are associated with the growth of employment, increase in productivity and subsequent changes in the wage and profit rates, nature of technological change and trade orientation of the policy. Incomes distribution is also influenced by changes in differences in mean incomes across industries. If the differentials in productivity across sectors narrow down, the income inequalities would also decline.
Household incomes may be divided into wage income, property income, and self-
employment income. It has been observed that wage incomes in urban areas of Pakistan are distributed more unequally than wage incomes in the rural areas. This is because urban labour force is heterogeneous, it is differentiated by skill, education, union membership, coverage by the minimum wage legislation etc. Similarly, urban self-employment income is more concentrated than the rural self-employment income. In rural areas, self-employed are quite homogeneous while in the urban sector they vary significantly. This leads to a very high skewed distribution of income amongst the self-employed. Even though land concentration is high in rural areas, the property incomes are more unevenly distributed in the urban areas. In view of the above it seems that increase in wages in urban areas and self-employment in the rural areas would have a positive impact on the income inequality.
Highest level of gini coefficient is observed amongst the skilled workers, i.e.
0.299, followed by the inequalities amongst the group of legislators, senior officials and managers, i.e. gini of 0.273. On the other hand gini coefficient among unskilled workers is 0.180 and surprisingly is the lowest amongst professional group, i.e. just 0.136. This
11 Typically proportion of self-employed and unpaid family helpers and that of piecemeal worker declines with the economic development while the share of employees goes up. 12 For example, inequalities in income distribution within large scale manufacturing are higher than average level of inequalities in other sectors. See Hsia and Chau (1978).
14
may have been due to the fact that most of them are government employees and the wage structure is more egalitarian in the government sector. For details see Ahmad (2002).
In the rural areas farm and non-farm sector needs to be distinguished. Since
income from the non-crop sector is strongly correlated with landownership which is quite unevenly distributed an increase in the incomes from the crop sector would result in an increase in income inequality. On the other hand the non-farm income which also represents the largest source of rural household income has a favorable impact on income distribution. As noted by Adam and Alderman (1992) non-farm income accounts for only a small proportion-between 6 and 18 percent of overall income inequality and livestock income makes the smallest contribution to overall inequality. In contrast, agricultural income makes the largest contribution to overall inequality. Depending on the year, agricultural income accounts for between 35 and 45 percent of overall income inequality. The additional increments of non-farm income tend to reduce overall income inequality in rural areas of Pakistan.
Transfers to the Households Transfer income mostly comes from remittances, both internal and external. These two types of remittances have very different effects on income distribution. Internal remittances are important for the poor: households in the lowest income quintile receive more than 75 percent of their total per capita transfer income from internal remittances. External remittances, however, tend to go to those who are relatively better off. As a result, external remittances represent an increasing source of income inequality accounting for between 58 and 91 percent of transfer income inequality (See Adams 1992). Incidence of Taxes
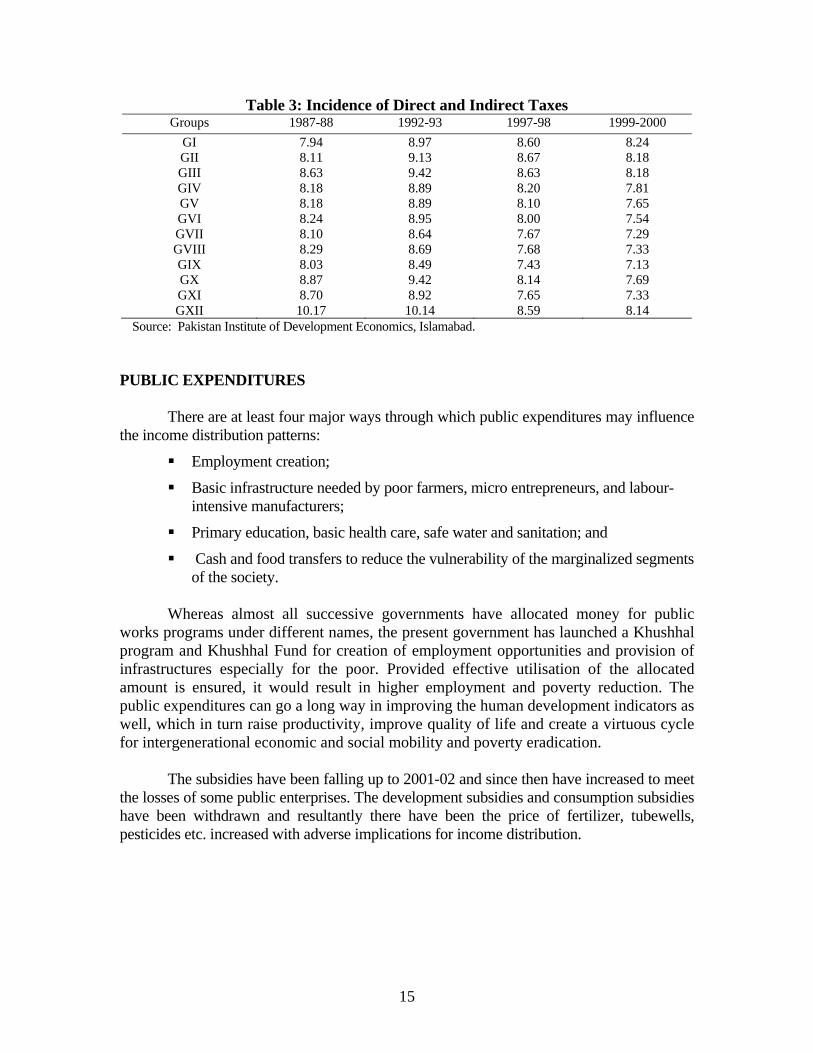
Pakistan has all along relied on indirect taxes which are generally regressive. However both because the indirect tax rates on the products consumed by the rich were higher as well as progressive, the incidence of taxes up to 1988 was higher on richer sections of the society. However, under the Structural Adjustment and Stablisation Program, decline in corporate income tax rates and tariff rationalisation has benefited the producers, while with the broadening of sale tax base, the tax burden on the poor has increased (Table 3).
15
Table 3: Incidence of Direct and Indirect Taxes Groups 1987-88 1992-93 1997-98 1999-2000
GI 7.94 8.97 8.60 8.24 GII 8.11 9.13 8.67 8.18 GIII 8.63 9.42 8.63 8.18 GIV 8.18 8.89 8.20 7.81 GV 8.18 8.89 8.10 7.65 GVI 8.24 8.95 8.00 7.54 GVII 8.10 8.64 7.67 7.29 GVIII 8.29 8.69 7.68 7.33 GIX 8.03 8.49 7.43 7.13 GX 8.87 9.42 8.14 7.69 GXI 8.70 8.92 7.65 7.33 GXII 10.17 10.14 8.59 8.14
Source: Pakistan Institute of Development Economics, Islamabad. PUBLIC EXPENDITURES There are at least four major ways through which public expenditures may influence the income distribution patterns:
Employment creation;
Basic infrastructure needed by poor farmers, micro entrepreneurs, and labour-intensive manufacturers;
Primary education, basic health care, safe water and sanitation; and
Cash and food transfers to reduce the vulnerability of the marginalized segments of the society.
Whereas almost all successive governments have allocated money for public
works programs under different names, the present government has launched a Khushhal program and Khushhal Fund for creation of employment opportunities and provision of infrastructures especially for the poor. Provided effective utilisation of the allocated amount is ensured, it would result in higher employment and poverty reduction. The public expenditures can go a long way in improving the human development indicators as well, which in turn raise productivity, improve quality of life and create a virtuous cycle for intergenerational economic and social mobility and poverty eradication.
The subsidies have been falling up to 2001-02 and since then have increased to meet
the losses of some public enterprises. The development subsidies and consumption subsidies have been withdrawn and resultantly there have been the price of fertilizer, tubewells, pesticides etc. increased with adverse implications for income distribution.
16
IV. MEASURES SUGGESTED IN PRSP AND MTDF TO IMPROVE INCOME DSITRIBUTION
In this section we examine the policies proposed in PRSP and MTDF and their possible implications for income distribution. THE MEASURES SUGGESTED IN PRSP
PRSP does not specifically outline strategy for reduction in the income inequalities but some elements of poverty reduction strategy may positively impact the functional and personal income distribution. These include policies to generate more employment opportunities; improved access to primary education, primary health care, drinking water, access to justice; improvement in governance and involvement of the poor in the formulation and implementation of the policies. The four elements of PRSP strategy are examined in the following. . ACCELERATING ECONOMIC GROWTH WHILE MAINTAINING MACROECONOMIC STABILITY
It includes macroeconomic framework, monetary and fiscal policy; financial sector reform; capital market development; trade liberalization and export growth; investment policy reform and privatization, streamlining the regulatory framework; improving the enabling environment for the SMEs; the provision of supportive infrastructure; rural development strategy and housing finance. Whereas most of the elements of the strategy outlined above essentially aim at improving the efficiency levels without much regard to their implications for income distribution, some of these have significant implications for income distribution. Employment Generation: Employment generation coupled with higher wage rates influence the functional distribution of income and under certain assumptions also the personal income distribution. The PRSP growth strategy13 aims at employment generation and its priorities include promotion of construction and housing sector; labor-intensive export especially high valued agriculture and garments; encouraging the SMEs and providing supporting infrastructure; and increasing labor based content in public sector investment, especially in infrastructure like roads, irrigation and rural development.
Small and Medium Enterprises: PRSP calls for development of agro-processing sector, mainly fruits, vegetables, dairy, and livestock, fair marketing, transportation, and handling of agricultural produce with a view to creating new avenues for employment and income generation. PRSP calls for more credit to micro, small and medium enterprises by further strengthening the regulatory environment, adjustment in prudential 13 PRSP within agriculture sector focuses on the non-crop agriculture sub-sectors including livestock, food processing industry, fisheries and in the manufacturing sector value-added textiles, and light-engineering industries.
17
policies, and provision of support services for enterprise establishment, development, quality improvement and export/local marketing in the short to medium term. It also calls upon the Small and Medium Enterprises Development Authority (SMEDA) to actively develop programs for managerial skill development, and provide technical and informative support to SMEs. The promotion of microfinance and SME sectors is expected to significantly improve income generating potential of the relatively poor in the rural and urban areas, creating employment opportunities; and providing forward linkages to the micro-enterprises benefiting from the availability of micro-credit.

18
Supportive Infrastructure: The PRSP strategy includes development of infrastructure especially for the poor through Khushal Pakistan programs and various other schemes including the community development programs. To improve the rural infrastructure, the Provincial Governments were to undertake major projects such as Farm to Market Roads to facilitate the rural population to access services and markets for the agricultural produce. Agriculture: For achieving pro-poor growth through agriculture, PRSP14 not only calls for increasing credit to small farmers but more importantly for the landless, tenants, agricultural artisans, women, and other disadvantaged groups who are disorganized. To ensure that farmers are able to respond to policy incentives and research and development (R & D), the strategy is to focus on the flow of information and secure water entitlements or rights15.
Livestock has tremendous scope for pro-poor growth as livestock is more evenly distributed than the land. The PRSP strategy focuses on genetic improvement of breeds of livestock; increased development of feed and fodder resources by establishing feed mills; eradication of diseases; state of the art slaughter houses; improved storage and processing of livestock products; access to markets and investment in infrastructure; automation of milk collection and establishing chilling and milk powder units through local dairy cooperatives, increasing efficiency, transparency, and fairness; procession and preservation of milk, and preventing spoilage; improvement in marketing of livestock and livestock products; extending credit especially to women for livestock development. Fisheries: PRSP target the fishermen without any boats and working as labourers and small boat owners and provide them the necessary equipment and training so that post harvest losses and deterioration of quality due to poor handling of fish and fish products is avoided. A program of streamlining existing extension service of fisheries has been one of the main elements of strategy besides promotion of fish and shrimp culture in coastal areas of Sindh and Baluchistan.
Land Distribution: PRSP proposes an accelerated distribution of state owned land to small farmers supported with the provision of infrastructure, availability of agricultural machinery and other inputs. With a view to having proper land records it also addresses the issue of “Benami”, i.e. allow financial and land assets in the name of a person who is not the true beneficiary. PRSP attempts to limit the Benami transactions and holdings.
14 The strategy includes development of high yielding varieties of improved and hybrid seed, balanced application of fertilizer, integrated pest management and improved agronomic management, and agriculture extension system, Commodity Boards, Integrated Pest Management Project, freeing up agricultural prices by removing market imperfections to safeguard farmers’ interests, corporate agriculture farming and increased agricultural credit. However, this may help in improving the productivity of agriculture and probably the poverty but it may tend to increase the income inequalities unless the efforts are made to reach the poor specifically. 15 The water strategy of PRSP is (a) integrating irrigation, hydropower and agricultural development investment; (b) modernize both the water infrastructure and the institutional and governance arrangements; and (c) balanced in investments in both water infrastructure and water management and in both supply management and demand management.

19
Housing Finance: Availability of land at affordable prices; mortgage loans, mortgage refinancing facility, and induction of insurance; providing incentives through tax rationalization, reduction in stamp duty and registration fee; simplification of procedures and enforcement of effective foreclosures laws; and encouraging the private sector would help in increasing the housing activity. While these initiatives may not necessarily have implications for income distribution the major initiatives of Provincial Governments to grant proprietary rights to those residing in houses constructed on “Shamlat deh” and state land and to regularize Katchi Abadis would have positive implications for income distribution. IMPROVING GOVERNANCE AND DEVOLUTION
The structural elements of improved governance are: devolution; fiscal decentralization; access to justice; police reforms; civil service reform; pay and pension reform; capacity building; anti-corruption strategy; procurement reform; freedom of information; fiscal and financial transparency and strengthening the system of information and statistics.
Good governance creates certainties about rights and obligations, enforcement of contracts and predictable consequences of breaches of rules and regulations. It is the governance in many of its manifestations that gives the agents the necessary confidence to participate in the process without fear of bias and discrimination. It has been observed that the poor governance has the most detrimental impact on the poor and the elite takes advantage of the poor and income distribution worsens.
A successful public policy requires emphasis on governance without which
service delivery cannot be ensured. The devolution of power, decentralization of administrative authority, de-concentration of management functions, diffusion of the power, distribution of resources through the mechanisms that facilitate equitable, transparent and predictable transfers to local governments, access to justice, police reforms, civil service reforms, pay and pension reform, capacity building, procurement reforms, anti-corruption strategy, anti-money laundering law, and freedom of information can go a long way in improving governance and better delivery of social services for the poor are the major elements of the PRSP governance strategy. INVESTING IN HUMAN CAPITAL
The structural elements are improvements in education and health delivery; drinking water and sanitation; youth development; and strengthening the commission for human development. In the education sector PRSP aims at a substantial increase in the literacy rate, universal gross primary enrolment, and technical education with specific skill programs. In the health sector key objectives include reduction in the widespread prevalence of communicable diseases, addressing inadequacies in primary/secondary health care services; promoting gender equity; correcting urban biases; bridging basic nutritional gaps; improved regulation of private health sector; removal of professional and managerial deficiencies in district health system; creating mass awareness in public health matter; and improving the drug sector to ensure the availability, affordability, and
20
quality of drugs. In the population welfare the objectives include stabilizing population growth and sensitizing all stakeholders to recognize population growth as a national concern and cross-cutting issue which needs priority attention. PRSP emphasises the access to safe drinking water and basic sanitation in both rural and urban areas. TARGETING THE POOR AND THE VULNERABLE
It includes expansion of micro-finance facility; streamlining programmes such as Khushal Pakistan/Tameer-e-Pakistan/Drought Emergency Relief Assistance; strengthening other safety nets and pension program for the private sector.
Micro Finance enables the poorer sections of the society to develop micro-enterprises and gradually build up their assets. PRSP calls for developing an enabling policy framework conducive to growth of micro finance; developing long-term mechanisms for social capital build-up of poor households; and restructuring of microfinance institutions. Khushal Pakistan Program/Tameer-e-Pakistan Program/DERA: The social intervention aimed at generating economic activity through public works and temporary employment covering 17 sectors including farm-to-market roads, water supply, sanitation, water courses, etc with the major thrust in the rural areas.
Other Social Safety Nets: The social safety nets for the vulnerable currently available in Pakistan include Workers Welfare Fund (WWF), Food Support Program, Social Security, Employees Old Age Benefit (EOBI), Pakistan Bait-ul-Mal (PBM) and Zakat Fund. The Poverty Reduction Strategy aims to strengthen the existing mechanism of cash transfers through Zakat, and the social protection system of EOBI and health care through Employees Social Security Institutions.
THE MEASURES SUGGESTED IN MTDF
Like PRSP the MTDF does not separately suggest measures to improve income distribution though it would have significant implications for income distribution. The policies impacting positively the income distribution includes pro-poor growth, generation of employment opportunities, improving access to human capital, and organisation of the poor for better access to various development activities and infrastructure. The agenda of MTDF is similar to that of PRSP.
The MTDF recognizes that a significant change in inequality in income and wealth is possible only in a long-term perspective. The focus of medium term framework is on the expansion of employment opportunities through priority to agriculture particularly agro-industry, agri-business and livestock, and water sector development; small and medium enterprises; and housing and construction industries.
Rural sector development: The MTDF recognizes enormous scope for accelerating growth in agriculture, creating new jobs through expansion of the area under irrigated cultivation, raising crop yields which increases labour intensity, and diversification of

21
cropping patterns from low value to high value crops such as fruits, vegetables, flowers and other horticulture crops for domestic consumption, processing and export. It notes that livestock and non-farm sector helps in decreasing income inequalities. Therefore it emphasises development of livestock, agro-industry and agri-business. Small & Medium Enterprises (SME): The strategy outlined in MTDF suggests that most of the jobs would come from development of Small and Medium Enterprises (SMEs). It is pointed out that SMEs are better insulated from the external shocks, more resistant to the stresses, and more responsive to the demands of the fast changing technology adoption, globalization and entrepreneurial development. A comprehensive package of venture capital, credit, liberalization of controls, technology, training, marketing and management measures is needed to ensure expansion of this sector. The development of agro-processing sector (mainly for fruits, vegetables, dairy, and livestock) and initiatives for fair marketing, transportation, and handling of agricultural produce present wide range of opportunities for private sector growth in the agro-based rural economy. Rural based agribusiness SMEs are a natural source for exploiting these opportunities that will provide new avenues for employment and income generation for rural population. Housing and Construction: The MTDF recognizes housing as a productive economic activity because it contributes through a high multiplier effect with a host of beneficial forward and backward linkages in the economy. It proposes construction of new housing units to meet the entire incremental housing needs by creating effective demand for the housing sector through provision of credit facilities, particularly micro-credit to the low income groups and incentives proposed in the PRSP. A rapid growth in housing finance will significantly contribute to the creation of jobs both directly as well as indirectly.
Income Generation Programmes: Income generation programmes obligate the recipient to exchange labour time for an income transfer. While public works can be used as temporary measure, credit-based livelihood programmes aim to raise the real incomes over a longer period. Khushhal Pakistan and Tameer-e-Pakistan Public Works Programmes provide essential public works on nationwide basis. The focus of the Programmes is on provision of sustainable sources of drinking water, local level infrastructure, restoration of existing physical works to raise the quality of life.
Social Protection: MTDF recognizes social protection as means of strengthening poor people’s capabilities to mitigate and manage risk and vulnerability, and thus, of impacting positively on underlying poverty and inequality. In addition to smoothing exposure to risk and vulnerability, social protection can also play a significant role in employment promotion for poverty reduction. The social assistance programmes in the public sector such as Food Support Programmes, Zakat, Pakistan Bait-ul-Mall, Employees Old-age Benefit Institution (EOBI), Social Security Schemes, and Social Welfare Programmes.
Human Resource Development: Improvements in education and health indicators are the essential prerequisite for raising agricultural, manufacturing and service sector productivity and providing job opportunities in both rural and urban areas. As a key
22
determinant for the overall socioeconomic development of the country, HRD is the main thrust area of MTDF. It is the primary and most effective means for reducing inequalities in income at present and reducing intergenerational income inequalities. Increasing overall literacy, through universal primary education, education for all and reducing the dropout rates of males and females at the primary level are the major interventions proposed under MTDF. Since earning capacity of the poor families is also linked to their health and nutritional status, MTDF specifically target preventable and community diseases, maternal and child health. Land Distribution: MTDF points out that 2.7 million acres of state land is available for distribution. MTDF suggest a transparent, targeted and coordinated redistributive initiative for land distribution.
23
V. ELEMENTS OF STRATEGY FOR IMPROVING INCOME DISTRIBUTION
The strategy for improving income distribution has been devised by taking into consideration the factors identified for changes in income distribution in section III and the poverty reduction strategies outlined in PRSP and MTDF. The strategy is presented under four heads viz., asset creation; improving the functional income distribution; transfers to the poor; and tax and expenditure policy A: ASSET CREATION FOR RELATIVELY LESS WELL-OFF Inequalities in income largely reflect inequalities in the distribution of assets. Since the poor have virtually no assets and the lower middle class own very few assets the income distribution is skewed. Therefore, access to means of production and the accumulation or transfer of assets to these two groups would help in improving income distribution. Distribution of state land; development of plots and houses for the common man at affordable prices and installments; regularization of Katchi Abadis; the sale of shares of public enterprises in smaller lots; human resource development; and credit to the micro, small and medium enterprises are some of the ways that might help the poor in acquiring assets. Distribution of agricultural land: In the rural areas inequalities in income distribution are mainly the result of uneven land distribution. Land reforms of 1960s and 1970s met with very limited success and there is little possibility that any meaningful land reforms are possible in the present scenario. Transparent distribution of 2.7 million acres state land would be helpful in reducing somewhat the inequalities in land distribution. To make sure that the asset distribution is meaningful such land should have access to water and the credit is made available for the purchase of agricultural inputs such as seed, fertilizer, pesticides etc. The Purchases of livestock: Since development of the livestock sector helps in reducing the income inequalities it needs to be promoted. While the inequalities in terms of ownership of livestock are less skewed the quality of animals owned by the poor can be significantly improved. The government may initiate programs that helps in enhancing the availability of more productive milch animals, makes available credit to small farmers for purchase of the better quality livestock and provide subsidies on livestock insurance.
Distribution of plots: The ownership of housing is not only unequal the inequality has increased further over time especially in the urban areas mainly because of the sharp increase in real estate prices. To reverse the trend, government may develop small plots and construct houses to provide these to the poor and middle class at affordable installments. Regularisation of Katchi Abadis: Most of the urban poor reside in Katchi Abadis without any right to land and the civic amenities. Regularisation of the Katchi Abadis would create assets for these households but that may encourage the others to set up
24
Katchi Abadis. Therefore, while the existing Katchi Abadis may be regularized, the administration should be vigilant that more of such are not created. The sale of shares of public enterprises: Even though a larger number of public enterprises have been privatized, government still retains a certain proportion of shares in some of the privatized units and some public enterprises are still to be privatised. The remaining shares of these public enterprises may be sold in small lots, as has been done in recent years, so that relatively less well-off sections of the society are able to acquire shares of these companies. It needs to be underlined that the poor and middle class are unaware of the sales-purchases method of the stock exchange market. Human capital: Education can be a great leveler16, provided the access to education is uniform. Over time quality of public universities has significantly deteriorated and the poor and middle class cannot afford the private sector fees. Improvements in the quality of education in public sector colleges and universities and fellowship/vouchers for quality education in the private sector would be helpful in improving the human resources of the less well-off sections of the society. Similarly, technical and vocational training facilities need to be enhanced and improved by way of updating labs, syllabi and teachers training. Availability of credit: Collateral based lending increases asset inequalities because the poor do not have any collateral and are denied access to formal credit. The innovative methods including venture capital, community collateral to ensure return of the loan, the formation of village and local organisations through rural support programs may have to be implemented. FUNCTIONAL INCOME DISTRIBUTION
Improvements in the asset distribution would help in increasing the incomes of the poor as they would share the incomes going to capital, but only if the functional income distribution improves the income inequalities would tend to fall. The workers’ share in GDP would rise provided both employment and wage rates rise and this would depend on:
- Sectoral distribution of the work force - Productivity level - Integration of small and large enterprises - Social protection of the workers
Sectoral Distribution Agriculture Sector
Agriculture is the most labour intensive and is relatively more egalitarian compared to the industrial sectors. Since the size of agriculture shrinks as the growth
16 In the literature it has been observed that income inequality is related to the stage of development in accordance with some sort of Kuznets relationship. It may also reflect the skill level of the population, as proxied by average educational attainment. See Checchi (2000)
25
process moves forward, inequalities rise as was hypothesized by Kuznets. However, a high growth rate of the agriculture sector would contain the rising income inequalities. Whereas agriculture sector is more egalitarian than the industrial sector within the agriculture sector the non-crop sectors especially the livestock are more egalitarian.
The incomes from crop sector are roughly proportional to the distribution of land
which is quite skewed and as such any subsidy to the crop sector would help more the large landlords more than the small farmers. Moreover, within the crop sector, different crops have differential impact on the income inequalities. As noted by Adam and He (1995) wheat and rice are also inequality-decreasing sources of agricultural income but sugarcane tends to increase the income inequalities. Therefore, government pricing policies are crucial to the income inequalities. Similarly, interventions with a view to improving the incomes through commercialization of the livestock sector and improvements in the productivity of livestock would go a long way in improving the income distribution.
While non-farm income as a whole reduces income inequality, not all sources of
non-farm income have a favorable effect on income distribution. Of the three main sources of non-farm income -unskilled labor, self-employment, and government employment- only the unskilled labor is an inequality-decreasing source of income. In contrast, non-farm government employment is an inequality-increasing source of income and accounts for a larger proportion, 21 to 31 percent, of nonfarm income inequality. Because it has higher entry costs, especially education requirements, this source of non-farm income is more accessible to richer households. A targeted approach in the rural areas to promote small-scale activities by removing constraints such as credit, lack of skills, physical infrastructure etc. would be helpful in reducing income inequalities.
Adams and Alderman (1992) point out that about 80 percent of rental income in rural areas is derived from land rent, in-kind or cash and because of uneven distribution of land most of the rental income goes to the rich. Households in the top income quintile receive almost 20 percent of their total per capita income from rental income, but households in the lowest quintile receive less than 5 percent of such income from this source. Manufacturing Sector Promotion of SME: The small scale manufacturing enterprises are labour intensive and can generate at least five times more jobs with the same amount of capital than the large scale enterprises can. It may be noted that that while some small manufacturing enterprises produce the products similar to those produced by the large enterprises, the others have complementary relationship and the strategy to promote the SMEs in the two case would be different. Even when small scale enterprises are producing similar products to that produced by large scale enterprises they suffer from poor quality and lack of standardization. Availability of credit to improve the equipment, improvements in the skills, better
26
marketing and meaningful pursuit of one-village-one product scheme can be helpful in the growth of small scale industries. When small manufacturing units are complementary to the large units, it needs to be ensured that sub-contracting is promoted. Extending all the benefits to the sub-contractor available to large producers would be quite helpful in this regard. Large Scale Manufacturing: Textile Sector: That the textile sector is labour intensive is manifested in the fact that compared to the share of textiles in the manufacturing output is 25 percent, its share in the manufacturing labour force is 46 percent. However, not all the textiles sub-sectors are labour intensive. Yarn is highly capital intensive and garments very labour intensive. With removal of quota restrictions on textiles, the sector is expected to grow rapidly and various actions shall have to be taken to promote the sector. Firstly, low productivity and poor product quality can be overcome through increased availability of quality human resources at all levels. Second, except for yarn and to some extent the fabrics the machinery is outdated and efforts need to be made to set up textile machinery units within the country and the credit to all especially the small enterprises for purchase of these machines. Third, the government should set up the labs for certification purposes which are counter accredited so that the exporters do not face any problems in the international market. Agricultural Processing: Pakistan has a great potential in agricultural processing but to-date it has not been realised. Whereas the tariff rationalisation is necessary to improve the profitability, the testing and compliance issues assume great significance in food industries. Similarly brand names are important and there is a need to attract private foreign investment in this industry. Leather Industry: Leather products are labour intensive and Pakistan has comparative advantage in the leather industry as well. However, the industry suffers from various problems including lack of design institutes in Pakistan. The development of leather cluster is expected to give boost to this industry. Because it is very labour intensive it is expected to improve income distribution. Light Engineering Industry: Pakistan also has comparative advantage in the light engineering industry which unfortunately in the past could not grow rapidly due to the high tariffs on the basic raw materials. The industry is labour intensive and would help in generating more employment. Software Industry: The software industry is skill intensive and would be helpful in income distribution provided the poor and middle class have access to quality computer education. It can be helpful in overcoming the unemployment amongst the educated youth and improving incomes of the middle class.
27
Housing and Construction The construction sector is labour intensive and also has high employment
elasticity. The demand for the construction sector is derived demand and it depends on the levels of investment in a country. Given that high levels of growth requires large investment levels the prospects of growth of construction sector are quite bright. Nevertheless each of the construction sub-sectors has different labour intensities and within each of them employment generation would depend upon the use of technology.
One of the main areas of construction is the housing. As has been observed in MTDF there is significant shortfalls of housing but these are the poor who are without housing and as such there is no effective demand for housing. Such demand can, however, be created through development of plots and housing in public sector for the less well-off sections of the society.
Services
The sector all over the world absorbs most of the labour especially that released by the agricultural sector. The General Agreement on Services, provide both employment and opportunities. Since services are skill intensive the advantage would accrue to the nations that have well developed human resources. While Pakistan’s track has not been all that good in human resource development more allocation of resources would help in improving the income distribution. Higher allocations to education and health are labour intensive and would generate employment amongst the educated workforce suffering from maximum unemployment rates. Improvement of Productivity of Labour
The skill development is crucial to the growth process and plays a major role in increasing the wages and incomes of the self-employed. However, not only the enrolments in vocational institutions are low, the quality of graduates also leaves much to be desired. Technical workers and floor and middle class supervisors are absolutely essential for improvements in the productivity levels. A number of measures need to be taken to improve the training facilities. Firstly, equipment must be such that the students are trained to skillfully handle the production machinery to produce quality goods with higher productivity. Second, practical training of the teachers should be arranged in the factories so that they are well aware of the factory requirement of a specific type of trained worker. The graduates must also be in close contact with the industry and without apprenticeship in an industry the diploma may not be awarded. Third, there is a need to establish curriculum development and review departments in each of the institutions. Teams of experts from specific fields, actually engaged in the teaching of specific subject and the technically qualified managers in the factories may develop the curriculum. The curriculum must be reviewed periodically by taking into consideration changes in the production techniques, introduction of new technology and the bottlenecks which the teacher and the students faced during the course of their studies.
28
Social Protection of Workers The social safety nets are needed to protect vulnerable segments of the society against unforeseen circumstances; they protect individuals, households and communities from acute deprivation or inadvertent decline in incomes through formal and informal arrangements. The social safety nets aim at enabling the poor to better manage the risk; preventing them from distress sale of their assets; provide them a system of income insurance to protect them through short term stress and calamities; and take care of their long term disability.
The social cost of adjustment has increased the vulnerabilities of the socially
disadvantageous groups. Social safety nets in Pakistan comprise food support programs, revamping of social protection system (primarily through Zakat17 and Bait-ul-Mal system), and expansion of micro credit facilities at the doorstep of the poor. In recent years, income generation and employment creation programmes through integrated small public works programs have also been initiated. Beside government institutions, civil society organizations such as mosques, financial institutions, non governmental organizations, and private philanthropists are also involved in the distribution of social services. There is however no umbrella institution to coordinate the services provided by these institutions for better coverage and delivery. Government may encourage the private sector through appropriate measures to set up such an organisation in the private sector. TRANSFER TO THE COMMON MAN
To improve the distributional effects of external remittances, steps need to be taken to help poorer households to have access to employment abroad. One measure that could be considered is the establishment of rural “migration centers” to process visas, work contracts, and loan arrangements for prospective external migrants. The system of migration needs to be regularized. The government may enter into agreements such as the agreement signed with Malaysia. The foreign missions should not only help in getting jobs, they should also monitor that Pakistani workers are not exploited. TAX AND EXPENDITURE POLICIES Expenditure:
The poor benefit more by increasing the share of public expenditure especially on primary education and on the health facilities. Besides public expenditure helps in generating more employment directly and by reducing transaction costs of private investors, indirectly. Similarly, targeted subsidies may also help in reducing the income inequalities Tax Structure: 17 Jehle (2003) points out the role of Zakat in reducing the poverty and improving the income distribution.

29
The public expenditure crucially depends on the availability of the public revenues. Since government is withdrawing withholding taxes they must be replaced with proper income taxation so that the indirect taxes on products consumed by less well-off are withdrawn.
GOOD GOVERNANCE
Major sufferers of poor governance are the common masses who are denied
justice and there is poor delivery of services. Poor governance results in distorted priorities, poor policy formulation and ineffective implementation with serious implications for social welfare. Three main areas of governance are civil service reforms, judicial & police reforms and devolution. Civil Service Reforms Efficient civil service not only helps in better policy formulation, it also helps in effective and fair implementation of laws. A civil service structure with a view to making public sector performance oriented, efficient, effective and responsive to public needs through a collaborative mechanism of governance between stakeholders and citizens with capability to meet the future requirements would be a very effective strategy. Nevertheless, for success of any civil service reform a long term vision is required. Such a vision may include the type of civil service being aspired, ownership by the government and the nation, and sequencing of reforms; endurance in the form of long-term investment in resources, policy attention, and sustained follow-through on the part of the government and institutional capacity. Access to Justice
Whereas administration of justice must inspire confidence of the common man in
the ability of courts to administer justice fairly and impartially, Pakistani justice system leaves much to be desired in respect of both. The access to justice is hampered due to a number of factors including delays, lack of automation and poor court information systems. The efforts under ADB loan for improved legal education and training, improving the infrastructures, better remuneration of the judges, independent judicial commission, automations and dissemination of information on legal procedures would improve the physical, human and information infrastructure. However, the most obvious flaw is political in nature because the influential are able to buy and manipulate justice. Therefore dispensation of justice can be ensured through a more equitable socio-economic distribution of wealth and assets, employment generation, education, economic growth and provision of opportunities to the poor and less influential sections of society. Devolution
The devolution system of Pakistan is based on five fundamentals; devolution of
political power; decentralization of administrative authority, deconcentration of management functions, diffusion of the power-authority nexus, and distribution of
30
resources to the district level. It aims at ensuring that the genuine interests of the people and their rights are safeguarded, and to create an enabling environment in which people can start participating in community welfare. It is expected to increase transparency and accountability.
Some of the areas that require early attention of the government include extending
administrative and fiscal autonomy; extending facility level oversight; reducing institutional complexities; raising the efficiency of the fiscal management; fiscal devolution; qualifying mechanism for conveying federal and provincial policy priorities; and reviewing alternative funding mechanism.
31
VI. CONCLUSIONS
Whereas growth and income distribution jointly determine improvements in the living standards of the common man, basic objective of any state, in Pakistan over the last 20 years focus had shifted to reduction in proportion of the poor rather than improving the income distribution. No doubt the income inequalities have been observed to rise in the initial stages of economic development but in no way it implies that each nation would necessarily have to pass the phase of rising income inequalities, and governments must take suitable measures to avoid increases or at least decelerate the rising income inequalities.
The income inequalities in Pakistan have increased sharply in the 1990s and the
PLSM data also shows that the trend continues even in the current decade even if the poverty may have declined. Moreover, income inequalities have been much higher than in the urban areas. The four main factors that govern personal income distribution include: distribution of assets; functional income distribution; transfers from other households, government and rest of the world; and tax and expenditure structure of the government. Assets of a household are determined by the inheritance; cumulative savings and return on the investments; and changes in the valuation of assets. Pakistan inherited very uneven land distribution and that continues to-date, in the urban areas even though the asset distribution at the time of independence may not have be as uneven, it has become quite skewed with the passage of time due to incentives to large scale manufacturing and other enterprises, promotion of rent seeking class through land grants, import, investment and other licenses all of which carried premium and resulted in accumulation of assets by the privileged sections of the society and skewed access to credit. Functional income distribution is determined by the employment structure, distribution of labour force within various industrial and occupational groups and relative incomes in various industries and occupations. If the employment does not grow rapidly, the income inequalities tend to rise. The income inequalities in various groups are associated with the growth of employment, increase in productivity and subsequent changes in the wage and profit rates, nature of technological change and trade orientation of the policy. Incomes distribution is also influenced by changes in differences in mean incomes across industries. If the differentials in productivity across sectors narrow down, the income inequalities may also decline.
Transfer income mostly comes from remittances, either internal remittances from within Pakistan or external remittances from abroad. These two types of remittances have very different effects on income distribution. Internal remittances are important for the poor: households in the lowest income quintile receive more than 75 percent of their total per capita transfer income from internal remittances. External remittances, however, tend to go to those who are relatively better off.
32
The tax structure of Pakistan that has been progressive despite the preponderance of indirect taxes until 1988 has turned regressive. On the other hand public expenditure has also declined and the major decline has been observed in subsidies. . Neither PRSP nor MTDF specifically outline the strategy for reduction in the income inequalities but some elements of poverty reduction strategy have positive implications for the functional and personal income distribution. These include policies to generate more employment opportunities; improved access to primary education, primary health care, drinking water, access to justice; improvement in governance and involvement of the poor in the formulation and implementation of the policies. The study outlines a strategy for improving income distribution in Pakistan. It calls for asset creation for relatively less well-off classes of the society through distribution of agricultural state land in a transparent way; initiating programs that helps in enhancing the availability of more productive milch animals, making credit available to small farmers to purchase the better quality livestock and provide subsidies on livestock insurance; development of small plots and constructing houses for the poor and middle class, regularisation of the Katchi Abadis, sale of the shares of public sector enterprise in small lots to the relatively less well-off sections of the society, development of human resources through provision of quality education and training and health facilities, and innovative methods including venture capital, community collateral to ensure return of the loan, the formation of village and local organisations through rural support programs, etc. etc.
Since agriculture is the most labour intensive sector it calls for promotion of the sector and within agriculture sector to the livestock sub-sector. The creation of jobs in the non-crop sector would be instrumental in reducing the income inequalities. Because of the higher labor intensity it calls for promotion of SME sector through availability of credit for improving the equipment, improvements in the skills, better marketing and meaningful pursuit of one-village-one product scheme can be helpful in the growth of small scale industries. Within the manufacturing sector it identifies textiles, agricultural processing, leather products, light engineering industry and software industry for promotion. Construction sector is also very labour intensive and that may help in reducing the income inequalities. So are the service sector but they are skill intensive and efforts have to be made to improve skills. For the skill development a number of measures have been suggested including modernisation of equipment, practical training of the teachers and students, development and continuous updating of the syllabi. The social safety nets are needed to protect vulnerable segments of the society against unforeseen circumstances; they protect individuals, households and communities from acute deprivation or inadvertent decline in incomes through formal and informal arrangements. The social safety nets aim at enabling the poor to better manage the risk; preventing them from distress sale of their assets; provide them a system of income insurance to protect them through short term stress and calamities; and take care of their long term disability.
33
The study notes that both in the private and public sector there are various social
safety nets but they are inadequate and for better coordination there is a need for an umbrella organisation in the private sector.
The study calls for establishment of rural “migration centers” to process visas, work contracts, and loan arrangements for prospective external migrants. The system of migration needs to be regularized. The government may enter into agreements such as the agreement signed with Malaysia.
The public expenditure crucially depends on the availability of the public
revenues. Since government is withdrawing withholding taxes they must be replaced with proper income taxation so that the indirect taxes on products consumed by less well-off are withdrawn.
Major sufferers of poor governance are the common masses who are denied
justice and there is poor delivery of services. Poor governance results in distorted priorities, poor policy formulation and ineffective implementation with serious implications for social welfare. Three main areas of governance are civil service reforms, judicial & police reforms and devolution.
34
References
Adams, Jr. Richard H. (1996), “Livestock Income, Male/Female Animals and Inequality in Rural Pakistan”, Discussion Paper No.21, International Food Policy Research Institution, Washington, D.C.
Adams, Jr. Richard H. and Harold Alderman (1992). “Source of Income Inequality in Rural Pakistan” Working Paper Series No. 836, The World Bank, Washington.
Adams, Jr. Richard H. and Jane, J. He (1995) “Sources of Income Inequality and Poverty in Rural Pakistan”, Research Report No.102, International Food Policy Research Institute, Washington, D.C.
Ahmad, Ehtisham and Ludlow, Stephen (1988), “On Changes in Inequality in Pakistan: 1979-84”, No. 13, The Development Economic Research Program, London School of Economics.
Ahmad, Mahboob (2002), “Income Inequality among various Occupations/Professions in Pakistan – Estimates based on Household Income Per Capita” The Lahore Journal of Economics, Vol. 7, No.1.
Anwar, Talat (2005) “Long Term Changes in Income Distribution in Pakistan: Evidence Based on Consistent Series Estimates” Discussion Paper Series No.3, Centre for Research on Poverty and Income Distribution (CRPRID), Islamabad.
Banerjee, A. and Andrew F. Newman (1993) “Occupational Choice and the Process of Development”, Journal of Political Economy, 101(2).
Bergan, Asbjorn (1967), Personal Income Distribution and Personal Savings in Pakistan, 1963/64. The Pakistan Development Review, Vol.7 No.2.
Checchi, Daniele (2000) “Does Educational Achievement Help to Explain Income Inequality? WIDER Working Papers No. 208.
Chong, Alberto (2001) “Inequality, Democracy and Persistence: Is there a Political Kuznets Curve?”Inter-American Development Bank and George Town University, Working Paper No. 445, Washington, D.C.
Chotikapanich, Duangkamon, Paul Flatau, Christina Owyong and Gavin Wood (2003), “Poverty and Income Inequality Measurement: Accommodating a Role of Owner Occupied Housing”, Economic Record, Vol. 79, Special Issue.
Choudhry M. Ghaffar (1982), Green Revolution and Redistribution of Rural Income: Pakistan Experience. The Pakistan Development Review Vol.21, No.3.
35
Clarke, George, Lixin Colin Xu, and Heng-fu Zou (2003). “Finance and Income Inequality: Tests of Alternative Theories” Policy Research Working Paper 2984, World Bank, Washington.
Galor, O. and J. Zeria (1993) “Income Distribution and Macroeconomics”, Review of Economic Studies, 60: 35-52.
Gradstein and Milonovic (2000), “A Survey of the Empirical Evidence on Link between Political Democracy and Income Inequality”. World Bank, Washington D.C. (Manuscript)
Greenwood, Jeremy and Boyan Jovanovic (1990). “Financial Development, Growth and the Distribution of Income, Journal of Political Economy, 98(5).
Haq, Rashida (1999) “Income Inequality and Economic Welfare: A Decomposition Analysis of the Household Sector in Pakistan, Research Report Series No. 170, Pakistan Institute of Development Economics, Islamabad.
HIES (1992/93), Federal Bureaus of Statistics, Statistic Division, Govt. of Pakistan.
Hsia, R. and Chau, L. (1978), Industrialisation, Employment and Income Distribution: A Case Study of Hong Kong . A study prepared for ILO London Croom Helm.
Iyigun, M. F. and A. L. Owen (2004) “Income Inequality, Financial Development and Fluctuations” Economic Journal, Vol. 114, No. 495.
Jehle, Geoffrey A. (1994) “Zakat and Inequality: Some Evidence from Pakistan”, Review of Income and Wealth, Series 40, No.2.
Kemal, A.R. (1981), Income Distribution in Pakistan: A Review. Research Reports Series No.123. Pakistan Institute of Development Economics, Islamabad.
Kemal, A.R. (2003), Income Distribution in Pakistan and Agenda for Future Direction of Research, Human Conditions Report, Centre for Research on Poverty and Income Distribution (CRPRID), Islamabad.
Khan, A. R. (1967), What has been Happening to Wages in Pakistan.
Kondor Yaakov (1975), The Gini Coefficients of Concentration and the Kuznets Measure of Inequality. A note Review of Income and Wealth series 21 No.3 Sept 1975.
Kuznets, S. 1955, Economic Growth and Income Inequality, American Economic Review, March.
Kuznets, S. (1963), Quantitative Aspects of Economic Growth of Nations: Distribution of Income by Size, Economic Development and Cultural Change Vol.II , 1963.
Mahmood (2001), Adjust and Beyond: The Reform Experience in South Asia, Palgrave.