Pakistan Development Policy Review - World...
67
Report No. 23916-PAK Pakistan Development Policy Review A New Dawn? April 3, 2002 Poverty Reduction and Economic Management Sector Unit South Asia Region Document of the World Bank
Transcript of Pakistan Development Policy Review - World...

Report No. 23916-PAK
Pakistan Development Policy Review A New Dawn?
April 3, 2002
Poverty Reduction and Economic Management Sector Unit South Asia Region
Document of the World Bank

Pakistan Development Policy Review
CURRENCY AND EQUIVALENTS
Currency Unit = Pakistan Rupee
US$1 = PKR 60.50
FISCAL YEAR
July 1 – June 30
ACRONYMS AND ABBREVIATIONS
ADBP Agricultural Development Bank of Pakistan NGOs Non-Governmental Organizations AsDB Asian Development Bank NPLs Non-Performing Loans ATC Agreement on Textiles and Clothing NPV Net Present Value CBR Central Board of Revenue NRB National Reconstruction Bureau CCBs Citizen Community Boards NSS National Saving Schemes CIRC Corporate and Industrial Restructuring Corporation NWFP North West Frontier Province CLs Contingent Liabilities O&M Operations and Maintenance DFIs Development Finance Institutions PAC Public Accounts Committee DPR Development Policy Review PC Paris Club DTRE Duty and Tax Remission for Exporters PIBs Pakistan Investment Bonds ES R Education Sector Reform PIHS Pakistan Integrated Household Survey FDI Foreign Direct Investment PNG Private Non-Guaranteed FY Fiscal Year (ending June 30 of designated year) PPAF Pakistan Poverty Alleviation Fund GDP Gross Domestic Product PPG Public and Publicly Guaranteed GoP Government of Pakistan PPRA Public Procurement Regulatory Authority GST General Sales Tax PRGF Poverty Reduction and Growth Facility Ha hectare PSC Punjab Seed Corporation HBL Habib Bank Limited PPRA Public Procurement Regulatory Authority HIPC Heavily Indebted Poor Countries SAP Social Action Program IFIs International Financial Institutions SBP State Bank of Pakistan IMF International Monetary Fund SECP Securities and Exchange Commission of Pakistan IPPs Independent Power Producers SITC Standard International Trade Classification I-PSRP Interim Poverty Reduction Strategy Paper SMEs Small and Medium Enterprises KESC Karachi Electricity Supply Company SMEDA Small and Medium Enterprise Dev. Agency LMM Locally Manufactured Machinery SOEs State-Owned Enterprises MCB Muslim Commercial Bank SRO Statutory Regulatory Order MLT Medium and Long-term TFP Total Factor Productivity NAB National Accountability Bureau UBL United Bank Limited NCBs Nationalized Commercial Banks UC Union Council NDFC National Development Finance Corporation WAPDA Water and Power Development Authority NDP National Drainage Program XGNFS Exports of Goods and Non-Factor Services
Vice President: Mieko Nishimizu, SARVP Country Director: John W. Wall, SACPK
Sector Director: Sadiq Ahmed Task Manager: John Williamson

Pakistan Development Policy Review
TABLE OF CONTENTS
EXECUTIVE SUMMARY................................................................................................................ i
1. DEVELOPMENT OUTCOMES ............................................................................................. 1
A. ECONOMIC PERFORMANCE........................................................................................... 1 B. RISE OF PUBLIC DEBT..................................................................................................... 3 C. THE SOCIAL GAP.............................................................................................................. 4 D. DETERIORATING INVESTMENT CLIMATE.................................................................... 5 E. RECENT POLITICAL AND ECONOMIC DEVELOPMENTS.............................................. 6
2. DEVELOPMENT POLICY AGENDA.................................................................................... 9
A. GOVERNANCE.................................................................................................................. 9 The Devolution Initiative ..................................................................................................... 9 Professionalization of the Civil Service............................................................................... 12 Reducing Corruption and Improving Public Financial Management...................................... 13 Budget Processes............................................................................................................... 14 Access to Justice (Police/Judicial Reforms)......................................................................... 14
B. INVESTING IN PEOPLE .................................................................................................. 15 The Social Action Program and its Shortcomings ................................................................ 17 Human Development Strategy in the I-PRSP....................................................................... 17 Evaluating Education and Health Strategies ........................................................................ 18
C. MACROECONOMIC SUSTAINABILITY ......................................................................... 19 Public Debt and Fiscal Sustainability.................................................................................. 20 Balance of Payments Sustainability and Paris Club Agreement............................................. 24 Conclusions ...................................................................................................................... 25
D. THE FINANCIAL SECTOR.............................................................................................. 26 Current Developments and Policies .................................................................................... 27 Directions for Further Reforms........................................................................................... 28
E. THE INVESTMENT CLIMATE......................................................................................... 30 Falling Investment and Exports .......................................................................................... 31 Textile and Clothing Exports.............................................................................................. 31 Trade Policy Regime ......................................................................................................... 32 Policy Uncertainty, Political Instability, and Law & Order................................................... 33 Infrastructure .................................................................................................................... 34 Information Technology .................................................................................................... 35 The Rural Non-Farm Sector ............................................................................................... 35
F. AGRICULTURE IN AN ERA OF WATER SCARCITY..................................................... 35 Sectoral Performance: Unrealized Potential and New Challenges......................................... 36 Strategies and Policies for Accelerating Growth .................................................................. 36 Summary: Overall Assessment.......................................................................................... 41
3. OUTLOOK AND RISKS....................................................................................................... 42
A. THE OUTLOOK FOR GROWTH....................................................................................... 42 B. RISKS................................................................................................................................ 45 C. CONCLUSION .................................................................................................................. 46

Pakistan Development Policy Review
TABLES
Table 1.1: Economic Indicators .......................................................................................................... 1 Table 1.2: Pakistan’s Social Indicators in International Perspective....................................................... 4 Table 2.1: Total Public Debt, as of June 30, 2001 .............................................................................. 20 Table 2.2: Basic Fiscal Indicators ..................................................................................................... 21 Table 2.3: Illustrative Public Debt Scenarios ..................................................................................... 24 Table 2.4: Gross Financing Requirements, FY02-FY04 ..................................................................... 25 Table 2.5: Structure of Financial Assets, 2000 ................................................................................... 26 Table 2.6: NPLs and Defaulted Loans (DLs) for Banks and DFIs ....................................................... 26 Table 2.7: Trends in Simple Average Tariffs, 1985-99 ....................................................................... 32 FIGURES
Figure 1: Exports of Goods & Services in Constant 1995 US$.............................................................. 5 Figure 2: Trends in Total and Private Fixed Investment........................................................................ 6 Figure 3: CBR Revenue ..................................................................................................................... 6 Figure 4: Gross Primary Enrollment Ratios by Per Capita Expenditure ............................................... 16 Figure 5: Trends in Interest, Defense and Development Spending, FY81-FY01 ................................... 20 Figure 6: Bank Deposits and NSS Instruments................................................................................... 26 Figure 7: Gap Between Surface Water Supply and Demand ............................................................... 40 BOXES
Box 1: A Profile of Poverty in Pakistan............................................................................................... 2 Box 2: Avoiding Macroeconomic Crisis.............................................................................................. 3 Box 3: The Interim Poverty Reduction Strategy Paper (I-PRSP)........................................................... 9 Box 4: The Social Action Program in Pakistan .................................................................................. 17 Box 5: Contingent Liabilities (CLs).................................................................................................. 22 Box 6: Public Debt Dynamics .......................................................................................................... 23 Box 7: Registry of Visits to Enterprises by Inspection Authorities – A Russian Idea ............................ 34 REFERENCES............................................................................................................................... 47
STATISTICAL ANNEXES
Table 1: Sectoral Origin of Gross Domestic Product.......................................................................... 49 Table 2: GDP by Expenditure........................................................................................................... 50 Table 3: Balance of Payments, 1995/96 – 2001/02 ............................................................................. 51 Table 4: Merchandise Exports and Imports........................................................................................ 52 Table 5: Profile of Domestic and Public Debt.................................................................................... 53 Table 6: Summary of Public External Debt and Debt Service, 1991/92 – 2000/01................................ 54 Table 7: Consolidated Government Budget, 1993-94 – 2001/02.......................................................... 55 Table 8: Monetary Developments, 1998/99 – 2001/02 ....................................................................... 56 Table 9: Social Indicators................................................................................................................. 57
Pakistan Development Policy Review
ACKNOWLEDGEMENT
This report was prepared by a team led by John Williamson (Task Manager) and including Brian Pinto (Deputy Task Manager), Safwat Abdel-Dayem, Asya Akhlaque, Derek Byerlee, Robert D. Ebel, Mudassir Khan, James A. Hanson, Nick Manning, William J. Martin, Taye Mengistae, Hanid Mukhtar, Ambar Narayan, John Panzer, Joseph Del Mar Pernia, Roxanne Scott and Tara Vishwanath. Bala Bhaskar Naidu Kalimili produced the statistical annex and Thelma Rutledge prepared the document. Parvez Hasan, Khadija Haq, Hafiz Pasha and Nicholas Stern served as peer reviewers. Guidance from Sadiq Ahmed, Abid Hasan, Zia Qureshi and John Wall is gratefully acknowledged.

Pakistan Development Policy Review
EXECUTIVE SUMMARY
1. In the first 20 years after independence in 1947, Pakistan had the highest growth rate in South Asia. In 1965 it exported more manufactures than Indonesia, Malaysia, Philippines, Thailand, and Turkey combined. It would have made anyone’s list of the Asian countries most likely to enjoy miracle -level growth rates over the ensuing decades. This did not happen. While the growth rate in the 1980s was still over 6 percent per year, after the early part of the 1990s it fell to around 4 percent a year. Pakistan became the slowest growing country in South Asia, an exact reversal of its previous role. Chronic fiscal deficits fed into mounting debt and rising interest spending, which combined with defense expenditures to cut sharply into development spending. The incidence of poverty, which declined from 46 percent in the mid-1980s to 34 percent in the early 1990s, has largely stagnated since, especially in rural areas, leading to a further widening of the rural-urban gap.
2. Successive governments attempted to respond during the 1990s by announcing measures to free interest rates, privatize, reduce protection, reform the banks, spur the development of small and medium-sized enterprises, and even (via the Social Action Program, SAP) to address the large social and gender gaps. However, the results were disappointing. The reforms were partial, while corruption and weak institutions did not provide a solid foundation for a market economy. The present government, which took office in October 1999, has sought to build upon the efforts of its predecessors by launching a comprehensive program that seeks to achieve sustained pro-poor growth by attacking the inter-linked problems of slow growth, the social gap and the heavy debt burden. This Development Policy Review (DPR) describes and evaluates GoP’s policies in the six critical areas that form the core of this agenda: governance, investing in people, macroeconomic sustainability, the financial sector, the investment climate for the private sector, and agriculture and irrigation.
3. Governance reforms are aimed at addressing four major issues: devolution, civil service reform, reduction of corruption and improvement of financial management, and institution of more realistic and open budget processes. Police and judicial reforms have also been initiated, but are less advanced. The first phase of the devolution initiative was completed on August 14, 2001, with elections held for the sub-provincial union, tehsil and district councils. If the next difficult step from political to fiscal decentralization can be made, and the requisite implementation and monitoring capacity developed, the system has the potential to deliver better local services while opening up political participation to a much wider number of citizens. So far, civil service reforms have been focused at the federal level, which, even though a small proportion of total public employment, sets the tone for the provinces. Some progress has been made in three key areas where reform was needed: (i) merit in recruitment and promotion; (ii) pay and pension reform – although concerns of a growing unfunded pension liability remain; and (iii) right-sizing and restructuring. Similar actions are needed at the provincial level. The National Accountability Bureau (NAB) established by the President in 1999 appears to have made a significant impact on the problem of “grand” corruption, but there is some evidence that the general public is not yet convinced of progress, particularly with regard to low-level corruption. Accountability within government has been improved significantly, especially the quality of the federal budget presentation. Planned reforms to the Central Board of Revenue, widely regarded as the most corrupt governmental institution, show considerable promise, with the assessment and collection functions being split and made anonymous. 4. On investing in people . Pakistan under-performs other countries with similar per capita income in just about all of the social indicators (for both expenditures and outcomes, across education, health, nutrition, and population growth)—a phenomenon called the “social gap”. The discrepancies are especially large for women, i.e. a “gender gap” reinforces the social gap. These twin gaps not only stunt

Pakistan Development Policy Review
ii
the lives of those who remain afflicted by illiteracy and ill-health, but they also limit the possibilities of economic growth, since no country can hope to make much progress in a globalized world economy without an educated and healthy workforce. The Social Action Program (SAP) that was developed in the 1990s to tackle these problems had some successes, perhaps most notably in the fields of population growth and rural water supply and sanitation, but its outcome was disappointing because of a decline in expenditure toward the end of the decade and particularly in the failure of educational enrollments to rise. The government has developed an I-PRSP that promises a new priority in spending commitments toward the social sectors, and is also hoping that the devolved local authorities will increase the effectiveness of service delivery. 5. Macroeconomic sustainability is a serious problem, because public debt is at an unsustainable level. Interest on public debt, together with defense spending, consumes 70 percent of total revenues, thus squeezing out development expenditure, including social spending. The debt-to-GDP ratio has risen almost uninterruptedly for the past two decades. The challenge is to move public debt dynamics to a downward trajectory, thereby improving the investment climate and lowering domestic interest rates, while adhering to the social spending levels envisaged in the I-PRSP. This will demand increased tax revenue, limitation of defense expenditure, reduction of the losses of state enterprises, and containment of contingent liabilities. The December 2001 Paris Club agreement and concurrent IFI package together give Pakistan three years of breathing space. While this period of time may not be enough for full implementation of the agenda of reforms, it is sufficiently long to establish policy credibility and move public debt dynamics to a favorable path.
6. The financial sector is dominated by the banking system, where state-owned institutions play a big role. Nationalized commercial banks (NCBs) account for some 50 percent of banking system deposits. Development Finance Institutions (DFIs) were important suppliers of long-term credit in the past. Non-performing loans are a serious problem, and accounted for 20 percent of the outstanding advances of NCBs and 60 percent of those of DFIs and specialized banks at the end of 2001. That plus limited competition plus high explicit and implicit taxes on intermediation have resulted in exceptionally high interest rate spreads. The challenge is to clean up the balance sheets of the NCBs and create conditions for a modern and efficient banking system, as well as to develop a vibrant capital market. Priorities include adhering to the privatization schedule for NCBs and closing most of the DFIs; it might also be worth re-considering whether DFIs are still needed for the under-served sectors of housing, SMEs and agriculture. Much necessary progress has been made in strengthening prudential regulations and supervision, for banks and the capital market, and this needs to be extended.
7. Both private investment and exports have tended to decline through the 1990s, a symptom of an inhospitable investment climate. While an unstable macroeconomic environment may help explain this, other factors have also been at play. The private sector has constantly complained about instability in the policy environment in relation to rules, taxes, and import tariffs. Such unpredictability has made it difficult to take a long view, while arbitrary use of SROs (statutory regulatory orders) has affected the level playing field needed for investors to compete based on business fundamentals rather than their ability to secure special deals. Bureaucratic harassment, problems of law and order, unreliable and expensive power, and inadequate infrastructure have also discouraged investment, and help explain why the private sector is reluctant to make long-term commitments in spite of the reforms of the past two years. 8. Agriculture is critical to poverty reduction, because about 80 percent of the poor live in rural areas. Even though agricultural growth has exceeded the average for low and middle -income countries in the 1990s, there is considerable unexploited potential. Policy priorities to accelerate agricultural growth center on markets, technology and water. Of these, the most progress has been made in liberalizing

Pakistan Development Policy Review
iii
markets, although there is still scope for further liberalization. Water availability is rapidly becoming a problem, not just because of the current drought, but also because of sedimentation of existing dams, aquifer depletion, and growing demand; it will demand a range of responses including a shift of the cropping pattern to less thirsty crops. Growing salinity, waterlogging, and untreated waste water demand completion of a national drainage system together with better O&M for the irrigation system, but progress on both construction of the drainage system and devolution of responsibility from the provincial irrigation departments to local user groups is lagging. Without a renewed commitment to these reforms at the highest level, water and associated drainage issues will become the binding constraint on agricultural growth. Research, extension, and education need both major institutional reforms and increased funding. Priorities Looking Ahead 9. The attached matrix summarizes the key elements of Pakistan’s development agenda. The matrix is organized around the six reform areas identified at the outset as key to stronger and sustained growth and poverty reduction. What could be regarded as immediate priorities (next 12-18 months) are indicated in bold. These include, for governance, defining measurable indicators for monitoring social service and articulating clear rules for inter-governmental fiscal relations; for investing in people, adhering to I-PRSP spending priorities and promoting gender equity; for macroeconomic sustainability, raising revenues by widening the tax base and tax administration reform, adhering to fiscal deficit targets, realizing more of the potential for agricultural income taxation, and containing the fiscal costs of contingent liabilities, particularly by reducing the losses of SOEs; for the financial sector, rationalizing and privatizing NCBs; for the investment climate, removing trade barriers to textile exports and eliminating cross-subsidies and theft in power sales; and for agriculture, defining a public sector role that limits market intervention while promoting technology and efficient water use. Risks 10. The risk that appears to be uppermost in the minds of the private sector is that the continuity of policy may be broken after the October 2002 elections for the national and provincial assemblies. Another risk is that the breathing space secured by the Paris Club agreement and exceptional financing from the IFIs might tempt the authorities into postponing the difficult reforms to which they have so commendably committed themselves. There is always a risk that exogenous shocks in the world economy will invalidate the prognostication of an improving debt profile. Pakistan’s difficult relations with India have been a longstanding source of weakness, and an intensification and prolongation of the current standoff could derail the attempt to control the fiscal deficit, and hurt the investment climate. There is also a risk that the mid-level bureaucracy will sabotage implementation of key reforms. Conclusion 11. Notwithstanding the above risks, GoP’s reform agenda embodies a courageous attempt to redress the problems of the past and create a foundation for sustained growth, with reasons (notably the determination to address the social and gender gaps) to hope that this will be more pro-poor than in the past. However, credibility is essential if investment is to rise again, and credibility is attained neither instantaneously nor permanently. The government will need to stay the course, maintaining a proper balance between increasing development spending and exiting the debt trap, and restoring democracy while trying to avoid the corruption and populism that marred its reputation in the past. So long as Pakistan’s policymakers pursue that agenda, there is well-founded hope for a better future for its people.

Pakistan Development Policy Review
iv
Pakistan: Key Elements of Development Agenda
Policy area Challenges/objectives Key Actions
Governance • use political and fiscal devolution to improve social service delivery
• ensure CCBs really empower the poor • complete civil service reform • reform the CBR and system of taxation • reduce corruption
• define rules for inter-governmental fiscal relations and establish clear budgetary procedures
• define measurable indicators for monitoring local social service delivery (with gender disaggregation )
• seek IFI and bilateral support for local capacity building • monitor women’s participation in local government • define arrangements for transferring responsibility for staff recruitment and discipline
from the provincial governments to the district governments • review pension reforms for fiscal sustainability • move to IT-based anonymous system of tax assessment and audit • formulate plan for attacking low-level corruption
Investing in people • reduce the social and gender gaps • curb population growth • learn from SAP
• maintain I-PRSP spending priorities for health, education, population, drinking water, basic sanitation
• promote gender equity through Lady Health Workers program and girls’ education
• implement ESR action plan of extending education to poor • raise public health spending with focus on prevention
Macroeconomics sustainability
• move public debt dynamics to favorable trajectory
• meet fiscal deficit target while maintaining I-PRSP spending
• use breathing space provided by December 2001 Paris Club agreement to establish credibility of reforms
• widen tax base and adhere to programmed fiscal deficit targets consistent with lowering debt burden
• realize more of the potential of agricultural income taxation by giving districts the right to raise this tax
• contain fiscal costs of contingent liabilities by reducing losses of SOEs like KESC and WAPDA, privatizing banks, limiting guarantees
Financial sector • reduce direct state role in financial sector
• curtail flow of new non-performing loans and increase competition to lower deposit-lending interest rate spreads
• strengthen supervision and regulation of banks and capital market
• improve access to credit
• adhere to rationalization and privatization schedule of NCBs • close most DFIs and reconsider whether DFIs need to be retained for the underserved
sectors (agriculture, SMEs, housing) • increase minimum capital for banks and non-bank financial institutions (NBFIs) as
per SBP’s plan, raise risk-weighted capital adequacy requirements and strengthen prompt corrective action framework
• increase authority of the Securities and Exchange Commission , not only in relation to capital markets, but also NBFIs
• increase reach of successful micro-credit programs

Pakistan Development Policy Review
v
Investment climate • create enabling environment for textile sector to take full advantage of 2005 abolition of Agreement on Textiles and Clothing by improving productivity and moving into high-value added lines of export
• foster greater competition within domestic industry, and remove remaining anti-export bias in policy
• create a predictable policy environment
• lower governance-related costs of doing business, for SMEs in particular
• improve provision of infrastructure services, including power supply, telecoms and freight transport
• eliminate duties on polyester and other intermediate inputs used by textile exporters
• eliminate delays in duty drawbacks and GST refund for exporters • confine policy statements and policy changes to regular and transparent forums such
as annual budgets • improve law and order and simplify registration and tax procedures • introduce mandatory register to track repeated visits by inspectors to enterprises • eliminate cross-subsidies and theft in power sales • reduce the state’s role in infrastructure and encourage greater private sector
participation by instituting a transparent regulatory system in which investors have confidence
Agriculture and irrigation • reflect changing domestic and international markets and Pakistan’s comparative advantage in agriculture strategy
• modernize regulation, re-define public sector role
• create incentives for more efficient and equitable water use
• reform the technology system
• define consistent and clear policies for limiting government intervention in input and output markets
• strengthen functioning of private markets through critical infrastructure, market information and commodity exchanges, with judicious public intervention for price stabilization only in wheat
• formulate and approve regulations for private R&D, such as bio-safety guidelines to avoid needless delays in use of latest technology, e.g., transgenic insect-resistant cotton
• invest in public goods like agricultural research and extension, education of farmers, farm-to-market roads and irrigation infrastructure
• repeal the benami law • commission analytical work to guide land market reforms • improve water system efficiency, implement conservation measures including low
water consuming crops and modern irrigation practices, restore lost water storage • accelerate the pace of institutional reform in irrigation to enhance efficiency of
water use and reduce subsidies to O&M; promote community managed tubewells and regulate ground water use
• prioritize construction of national drainage system
NB: Immediate priorities (next 12-18 months) are indicated in bold.

Pakistan Development Policy Review
1. DEVELOPMENT OUTCOMES 1.1 Pakistan did not appear to have bright economic prospects at the time of its independence in 1947. The western part of the country that constitutes today’s Pakistan had virtually no natural resources except a half (admittedly, perhaps the better half) of the largest area of irrigated agriculture in the world. Neither it nor the eastern wing of the country that today constitutes Bangladesh had much in the way of manufacturing industry. Poverty was endemic: the country had been fashioned from the poorest parts of British India. Yet in the ensuing 20 years this country had the highest growth rate in South Asia, and achieved the second highest per capita income. In 1965 Pakistan exported more manufactures than Indonesia, Malaysia, Philippines, Thailand, and Turkey—combined (Khan (1998), Table 1). It would have made anyone’s list of the Asian countries most likely to enjoy miracle -level growth rates over the ensuing decades. 1.2 As is now all too clear, this did not happen. The levels of educational expenditure that would have been needed to achieve the ambitious targets repeatedly proclaimed were diverted into military spending. Shortly after the partition of the country in 1971, the state took over the commanding heights of the economy—one of the last countries in the world to turn its leading sectors into lagging sectors before fashions changed and privatization replaced nationalization on the policy agenda. Protection was if anything further ramped up in the 1970s, even though Pakistan had clearly by then completed the first easy stage of industrialization where import substitution may make sense. The civil service was politicized. Local government was abolished. Corruption took hold. What we now regard as the institutional preconditions for a successful market economy were progressively undermined. A. ECONOMIC PERFORMANCE 1.3 While it never reached East Asian levels, the growth rate remained quite respectable—always over 5 percent after the 1950s, and in the 1980s over 6 percent per year. This was helped (except in the 1970s) by relatively strong agricultural growth. Since many poor people live in the countryside, this was quite effective in terms of reducing poverty. But the deceleration of industrial growth that was first evident in the 1970s had ominous implications for longer-term growth, which finally became clear in the 1990s: aggregate growth fell to less than 4 percent a year after the early part of the decade (Table 1.1). Pakistan became the slowest growing country in South Asia, an exact reversal of its previous role, explained partly by better performance elsewhere but also in part by the slowdown in Pakistan. Not only was its growth slower, but concerns about the buildup of both internal and external debt, fed by chronic fiscal deficits, progressively mounted. And the increasing international focus on governance accentuated concern about the country’s future.
Table 1.1: Economic Indicators
Annual Average for Indicator (%)
1980s 1990/91 – 1994/95 1995/96 – 1999/00 Compound growth rate of real GDP 6.5 4.9 3.3 Poverty incidence 46 (1985/86) 34 33 Inflation (period average) 7.2 11.5 7.9 Fiscal deficit/GDP (excl. grants) 7.1 7.2 6.5 Fiscal deficit/GDP (incl. grants) 6.4 6.7 6.4 Public debt/GDP 66 (mid-1980) 94 (mid-1990) 101 (mid-2000)
Source: Poverty incidence – Bank staff; public debt/GDP – Pakistan Debt Report; rest – Economic Survey, GoP.
1.4 Poverty, which declined sharply from 46 percent in the mid-1980s to 26 percent in 1992/93, has fluctuated stagnated since, but rose towards the end of the decade to 33 percent with a further widening of the rural-urban gap. Box 1 profiles poverty in Pakistan.

Pakistan Development Policy Review
2
Box 1: A Profile of Poverty in Pakistan
The poverty line in Pakistan is set at the income level needed to purchase a bundle of basic needs including food, fuel, housing, and clothing. It translates into a daily income of between $1 and $2. On that definition, the headcount index of the number of poor fell rapidly through the 1980s and into the early 1990s. Since then it has fluctuated, with the latest figure (for 1998-99) showing a rise back to 33 percent. The modest rise in per capita income was offset by greater inequality, both within urban areas and between urban and rural areas. As much as 43 percent of the population has income between 75 percent and 125 percent of the poverty line, resulting in significant vulnerability of the poverty rate to minor shocks. Poverty varies significantly among the provinces, from a low of 16 percent in Azad Jammu and Kashmir to a high of 44 percent in Northwest Frontier Province. People are more likely to be poor if: • They live in the countryside rather than in an urban area (36 percent of rural households are poor compared to 22
percent of urban households). In fact, 80 percent of the poor live in rural areas. • They do not own land (40 percent of rural landless households are poor, compared to less than 3 percent of those who
own more than 10 acres). • They live in a large family (48 percent of households with more than 15 members are poor compared to only 5
percent of those with 1 or 2 members). • They are illiterate (42 percent of households with an illiterate head are poor compared to 21 percent of those in
households with a literate head). • They live in a household headed by a self-employed or own-account worker, or in a rural household headed by a
wageworker or sharecropper. • They live in households headed by an aged person. 1.5 Policymakers were not indifferent to worries about the country’s slippage. They responded by initiating a number of important liberalizing reforms designed to modernize the economic model. Successive governments announced measures to free interest rates, privatize state industries, reduce protection, reform the banks, spur the development of small and medium-sized enterprises (SMEs), and even (via the Social Action Program, SAP) to address the large social and gender gaps. However, the results--in terms of growth, poverty reduction, and the social indicators--were disappointing. 1.6 Why did reform yield so little benefit in the 1990s? One reason is that the reform program was partial. In particular, it failed to address the fiscal problem, or to create the fiscal space for a serious attack on the lagging social indicators. Monetary policy was tight enough to prevent the fiscal deficit exploding into high inflation, but one consequence of this was the maintenance of a relatively strong exchange rate, which meant that an important part of the debt buildup was external. The interest rate liberalization also raised the cost of servicing the public debt and thus contributed to the emergence of unsustainable debt dynamics (see Chapter 2, Box 6). Not only was the reform program incomplete as a program of “first-generation” reforms, but also it neglected what are often called second-generation reforms—the complementary institutional reforms that are needed if a country is to benefit from liberalization. The corruption of much of the political class, the civil service, and even the police and judiciary deprived Pakistan of the sound institutional infrastructure needed to provide a foundation for a market economy. The realization that a debt problem was building up combined with unease about institutional weaknesses to erode governmental credib ility and hence the chance that reform would be rewarded with renewed investment and a revival of growth. 1.7 The inadequacies of the reform effort during the 1990s can be illustrated by the sad tale of foreign investment in power generation. By the early-1990s power shortages were becoming a critical constraint on economic growth. The government recognized that it did not itself have the financial resources to follow the traditional route of investing in additional generating capacity in the public sector, and therefore sought to attract FDI. Attractive terms, covering both the price and the level of guaranteed off take, were offered to attract independent power producers (IPPs) to the sector. The terms proved so attractive that too many IPPs came, and Pakistan was confronted with the prospect of more generating

Pakistan Development Policy Review
3
capacity than it could use, let alone afford to pay for on the guaranteed terms. A different government to the one that had signed the contracts was by then in office, and sought to impose unilaterally less favorable terms on the foreign investors, alleging that the previous terms were the product of bribery; whatever the truth of these allegations, the episode has left Pakistan with a scarred reputation as a host country for FDI. So here we see a realistic recognition that the traditional public sector approach needed to be replaced by use of the private sector, marred by incompetent (and perhaps corrupt) contracting procedures whose costs were then magnified by abandonment of the rule of law in attempting to revise the contracts. B. RISE OF PUBLIC DEBT 1.8 Reflecting consolidated fiscal deficits (including grants) that averaged close to 6.5 percent of GDP during the 1980s and 1990s, the ratio of public debt to GDP rose from 66 percent of GDP in 1980 to 101 percent by 2000 (Table 1.1). The interest burden of public debt grew even more sharply, quadrupling from a little less than 11 percent of total revenues over 1980-85 to 46 percent by 1999-2000. This debt buildup has already had several adverse implications: (a) real interest rates, which already rose as a by-product of the financial liberalization of 1989, have risen further; (b) vulnerability to exogenous political and economic shocks has increased; and (c) development spending has been squeezed in an attempt to contain the overall deficit, falling from close to 10 percent of GDP in 1980-81 to less than 3 percent by 2000-01 (see Chapter 2, Figure 5.).1 1.9 The squeeze on development expenditure has adverse consequences for growth via three channels. First, reductions in social spending stunt the development of human capital, which is at a premium in a globalized world economy (in addition to the direct impact on the quality of life). Second, cuts in public investment, especially in infrastructure such as roads, power, water supply and irrigation, create or perpetuate bottlenecks and raise the cost of doing business. Third, those cuts discourage private investment, which is complementary to public investment in infrastructure.
Box 2: Avoiding Macroeconomic Crisis An intriguing question is how Pakistan managed to avoid a collapse of the sort witnessed in Russia in 1998 and recently in Argentina, in spite of adverse public debt dynamics and negligible foreign exchange reserves over FY99-FY01. Speculative attacks, which triggered both the Russian crisis of 1998 and the recent Argentine crisis, typically happen when real interest rates exceed the growth rate, the government rolls over maturing debt creating a pyramid, and the market concludes that the government will eventually inflate away its debt and/or default, prompting an exit into hard currency. In conversations with the private sector, several reasons were given for why Pakistan was able to avoid such a full-blown crisis, including the following: (i) Pakistan never engaged in extensive borrowing from foreign commercial banks; (ii) various “extraordinary” measures to restructure foreign debt, including the freezing and forced restructuring of $9 billion in foreign currency deposits held by residents, and another $2.4 billion held by non-residents, in June 1998; Paris Club rescheduling agreements in January 1999 and again in January 2001; and the restructuring of $610 million in eurobonds on more favorable terms in December 1999; (iii) convert ibility restrictions ruled out the possibility of selling rupee-denominated government paper and converting the proceeds into dollars, except on a retail basis through the parallel market; (iv) ability to tap the parallel market, which has served as a conduit for workers’ remittances from overseas, which are estimated at around $2-4 billion per year; and (v) unification of the official and interbank exchange rates in May 1999, and an increased willingness to let the currency depreciate in FY01. In short, a combination of limited borrowing from foreign commercial banks, nonconvertibility, pragmatic use of the parallel foreign exchange market, and rolling over and restructuring external debt and foreign currency-denominated liabilities helped Pakistan to tide over a difficult period without a major macroeconomic crisis, albeit with heavy costs in terms of policy credibility.
1 Development spending as defined in Pakistan covers both the social sectors and infrastructure.

Pakistan Development Policy Review
4
1.10 A remarkable feature of Pakistan’s macroeconomic record has been its success in avoiding a major, disruptive crisis in spite of explosive debt dynamics. In the 1980s growth was robust and real interest rates tended to be low because of controls at home and a large fraction of concessional external funding. With financial liberalization starting in 1989, however, domestic interest rates went up. Initially, over 1990-95, this was offset by higher inflation. But then inflation slowed down and the real exchange rate depreciated, leading to real interest rates in excess of 5 percent. At the same time growth slowed from an average of 6.5 percent in the 1980s to 3.3 percent during the second half of the 1990s. Box 2 discusses what lies behind the government’s success in avoiding a full-blown debt crisis despite debt dynamics that were worse than those in a number of countries that succumbed to crisis. 1.11 Crises are usually immensely costly to growth, but avoiding crises is a necessary rather than a sufficient condition for high growth. A longstanding drag on Pakistan’s growth performance has been its weak record in human capital formation (the so-called social gap). C. THE SOCIAL GAP 1.12 Pakistan lags behind countries with comparable per capita income on most of the social indicators (Table 1.2). This is true both of the effort expended (e.g. expenditure on public health) and outcomes (e.g. infant mortality). Pakistan has grown much more than many other low-income countries, but failed to achieve social progress commensurate with its economic growth. For example, while infant mortality and female illiteracy rates declined by 73 and 60 percent from 1960 to 1998 for countries that grew at about the same rate, in Pakistan the declines were of the order of 43 percent and 20 percent respectively (Easterly 2001).
Table 1.2: Pakistan’s Social Indicators in International Perspective
Indicators Actual
Values for Pakistan
Predicted Values for
Countries with Similar Incomes
Difference between Actual and Predicted
Percentage difference of Actual from
Predicted Child (Under Age 5) Mortality Rate (1998) 120.0 101.0 19.0 18.8 Percent of childbirths with low birth-weight (1990s) 25.0 13.4 11.6 86.6 Public spending on health as percent of GDP (1996) -1.6 Gross primary enrollment (1990s) 67.3 88.1 -20.8 23.6 For females 42.7 83.2 -40.5 Illiteracy rate (1990s) 59.5 35.1 24.4 69.5 For females 70.0 37.8 32.2 Public spending on education as percent of GDP (1990s) 2.7 4.1 -1.4 Fertility rate (1998) 4.9 4.3 0.6 14.0 Contraceptive prevalence rate early-1990s) 15.0 36.0 -21.0 Proportion of females in total population (1999) 48.2 50.3 -2.1
Source: Easterly (2001). The predicted values column is derived from a cross-country regression aimed at explaining the indicator in question by per capita income. 1.13 One could formalize the concept of the social gap by taking a weighted average of the percentage shortfalls of a number of social indicators below the levels that would be predicted by a regression on per capita income. For example, Table 1.2 shows that child mortality is 19 per thousand above the level to be expected, of 101 per thousand, in a country of its per capita income, which implies that it is 18.8 percent higher than would be expected—a figure that is entered in the final column of Table 1.2. Similar calculations were made for the other variables shown in the final column of the table. A natural measure of the social gap is a weighted average of such figures. We have taken the non-gender specific social variables in Table 1.2 and weighted them equally, on which measure the social gap turns out to be 45

Pakistan Development Policy Review
5
Figure 1: Exports of Goods & Services in constant 1995 US$ (Index 1970 = 100)
050
100150200250300350400
1975 1978 1981 1984 1987 1990 1993 1996 1999
Source: World Bank
percent. (Of course, the weighting system is essentially arbitrary, and certain other variables, like clean drinking water supply and sanitation, have a claim to be included.) 1.14 Comparison of the fifth and seventh rows of Table 1.2 with the fourth and sixth rows suggests that gender disparities are even more acute than sex-neutral elements of the social gap. On the Gender-related Development Index produced by UNDP, which averages the gender discrepancies in the three variables that are weighted together to construct the Human Development Index (namely longevity, literacy, and combined enrollment ratio), Pakistan was number 117 out of 146 countries, in 2001. Clearly Pakistan has major problems regarding both social and gender gaps. And given that human capital is critical in achieving long-term economic growth, the widening social gap acts as a constraint to faster growth.2 The 1990s have seen a continued lag in human development indicators: indeed, gross primary enrollment has shown little improvement over the decade and none at all in more recent years, especially in rural areas where 70 percent of the population resides.
1.15 Recognizing the long-term pattern of under-achievement in human development, the SAP was launched by the Government of Pakistan in 1992/93, with the aid of donor financing and technical assistance. The SAP aimed at increasing public spending on social development, and improving the institutional and policy framework for service delivery. The record of SAP in terms of improving outcomes in the target sectors was generally disappointing. While improvements did occur in some health and population indicators, the gains were at best marginal in education. It appears that the first phase of SAP succeeded to some extent in terms of creating more physical facilities, but quality enhancement by improving accountability among service providers made little headway. Expenditure on the social sectors actually declined in the later years of SAP, with SAP’s defenders merely arguing that it helped to limit the decline. Pakistan remained with a major problem of weak social sectors when the present government took office. D. DETERIORATING INVESTMENT CLIMATE 1.16 Symptomatic of a weakening investment climate, exports, private investment, and CBR revenue all declined sharply during the latter half of the 1990s. Figure 1 shows that exports in constant prices, after rising steadily since 1975, registered a sharp decline starting in the mid-1990s. Private investment as a share of GDP also declined after the mid 1990s, as did total fixed investment, shown in Figure 2. And tax revenue collections by the CBR also fell sharply, reflecting the weak investment climate and flagging growth, as shown in Figure 3. While the revenue trend has been erratic, it was sharply downward after FY96. The investment climate is discussed further in Chapter 2, Section E.
2 Barro (1998) shows that health, education, and fertility indicators significantly affect growth outcomes.

Pakistan Development Policy Review
6
Figure 2: Trends in Total and Private Fixed Investment
0.0
5.0
10.0
15.0
20.0
25.0
Sources: IFS, IMF and Economic Survey 2001.
Total Fixed InvestmentPrivate Fixed Investment
E. RECENT POLITICAL AND ECONOMIC DEVELOPMENTS 1.17 The army returned to power on October 12, 1999, when General Pervez Musharraf removed the civilian government of Nawaz Sharif elected in February 1997. Appointing himself chief executive, Musharraf suspended the Parliament and Constitution and established a National Security Council. His role was “legitimized” in November 1999 by a Supreme Court judgment whereby he agreed to hold elections by October 2002, and was reinforced in June 2001 when he was sworn in as President. Promising reform of a corrupt, poor, and economically low performing country, the new government faced a formidable array of problems, including problematic governance, a large social gap, an unsustainable debt burden, preemption of most fiscal resources for interest payments and defense, low foreign exchange reserves and deteriorating terms of trade on account of the rise in oil prices. The top priority had to be continued avoidance of a full-blown crisis. 1.18 Budget revenues were increased through the adoption of quarterly price adjustments in petroleum product prices in line with rising international prices, and the extension of the general sales tax (GST) to electricity and natural gas. Expenditures on debt service were reduced by reforming the National Saving Schemes (NSS), which had previously paid extraordinarily generous yields. Foreign exchange reserves were strengthened through aggressive purchases of foreign exchange in the kerb market. Favorable performance of the agricultural sector helped achieve real GDP growth of 3.9 percent in 1999-2000, and inflation declined to 3.6 percent despite the increase in petroleum prices. 1.19 In December 1999, the holders of Pakistani eurobonds approved a restructuring of their assets that had been demanded by the Paris Club as a condition for its restructuring in January 1999. The IMF approved a new Stand-By Arrangement in November 2000. This was successfully completed a year later—the first time in a decade of IMF programs that one had ended with all the important performance criteria (except for the target for CBR revenue, for which a waiver had previously been granted) being observed. Despite the revenue shortfall, the budget deficit for 2000-01 hit its target (5.3 percent of GDP, compared to a deficit of 6.5 percent in the previous year). This was in part a result of restraints in provincial expenditures, but spending on the core pro-poor areas of basic education, health, population, and water supply nonetheless increased by roughly 16 percent in nominal terms and by 0.1 percent of GDP. Growth was weak, at 2.7 percent, partly because of the severe impact of the drought on agricultural output (which is estimated to have cost around 2.2 percentage points of lost growth – I-PRSP, Box 4.1). Inflation came in at 4.4 percent. One important policy embodied in the stand-by was greater exchange-rate flexibility, and the rupee depreciated against the dollar by some 23 percent in 2000-01 as a result.
Figure 3: CBR Revenue
9.5
10.0
10.5
11.0
11.5
12.012.5
13.0
FY80
FY81
FY82
FY83
FY84
FY85
FY86
FY87
FY88
FY89
FY90
FY91
FY92
FY93
FY94
FY95
FY96
FY97
FY98
FY99
FY00
FY01
Sources: IMF Staff estimates.
% o
f GD
P

Pakistan Development Policy Review
7
Export performance was strong, leading to a better-than-expected trade balance, and parallel market purchases helped ensure that the reserve objective was achieved. These good results, in conjunction with the events following September 11, 2001, paved the way for the favorable Paris Club restructuring of December 2001 and the PRGF loan from the IMF in January 2002. 1.20 Soon after taking office the government announced the creation of a high-level committee, under the chairmanship of Parvez Hasan, to design a strategy to escape the debt trap. This committee reported in March 2001: the content of this comprehensive report (referred to subsequently as the Pakistan Debt Report) is made use of in Chapter 2, Section C while discussing macroeconomic sustainability. A broader agenda was laid out in the I-PRSP that was discussed in the Boards of the Bank and the IMF in December 2001 and that formed the basis for the IMF’s PRGF loan. Some progress has already been made in addressing the common themes in those two reports, such as the need to increase tax revenue. The value added tax has been extended to cover services, a new income tax law has been issued to simplify the tax code, and all four provinces have finally imposed income tax on agriculture. The CBR has still missed its targets with monotonous regularity, but the trend decline in the ratio of CBR revenue to GDP was arrested after 1998-99 (at 10.5 percent) and edged up to 11.3 percent in 2000-01. The public investment program was rationalized by eliminating white elephants and reducing the number of projects, so as to avoid the waste represented by myriad incomplete projects. Domestic interest rates have been cut from an average of 15.2 percent in 1998-99 to 11.5 percent in 2000-01, mainly by reducing the very high returns formerly paid on NSS instruments. Perhaps the biggest disappointment has been the failure to curb the losses of a number of major state enterprises (WAPDA, KESC, and Pakistan Steel), although even here PIA is performing better and some effort is under way to cut KESC’s losses by disconnecting customers who do not pay their bills. 1.21 Agricultural prices have been liberalized, which in the longer term should benefit the sector although the current weakness of international commodity prices has prevented elimination of the implicit tax imposed by price controls yielding any short-term benefits. The maximum tariff rate was reduced to 30 percent, the number of tariff slabs was reduced from 5 to 4, and the government is attempting to reduce its use of SROs. Price controls have been eliminated on 64 of the 66 “essential commodities” to which they were previously applied. Both oil and gas prices are now regularly adjusted according to a cost-related formula. The policy backlog of duty refunds (which had been delayed to make the fiscal accounts look better) has been eliminated, although inefficient reimbursement remains a problem. Financial sector reform was resumed, with the most important step being the launch of Pakistan Investment Bonds, inter alia to provide a benchmark for both NSS instruments and commercial bonds—following which a small market for corporate bonds has indeed emerged. 1.22 The government also introduced important reforms relating to governance. Many of these are already at an advanced stage of implementation. A number of the fundamental institutions for economic and financial management, notably the State Bank of Pakistan (SBP), the Central Board of Revenue (CBR), and the Auditor General and Controller General of Accounts, have been restructured and given new leadership. Particular attention has been focused on improving financial management and accountability, with a view inter alia to increasing transparency. The civil service, police, and judiciary have all been the target of reform programs. A bold program of political devolution has been successfully initiated with the election of Nazims (mayors), Naib Nazims (Deputy Mayors), and councilors for three newly established “autonomous” sets of local governments—districts, tehsils, and union councils. Deputy Commissioners, who were career civil servants, have been replaced by District Coordinating Officers, who report to (and can be removed by) the elected Nazims. This change also involved stripping away the former judicial functions of the District Commissioners. A National Accountability Bureau is responsible for an anti-corruption drive. The Ministry of Privatization has formulated an aggressive agenda for resuming the stalled drive to privatize state enterprises in the coming months.

Pakistan Development Policy Review
8
1.23 The government has also put in place a strategy for improving education and health, with a view to reducing the social gap. Learning from experience with the SAP, the priority is to address, especially via devolution, the governance problems that undermined the effectiveness of what was admittedly an inadequate level of spending. The health strategy is focused on public sector health expenditures on prevention and control programs, especially in the areas of reproductive health, child health, nutrient deficiencies, and communicable diseases. The I-PRSP institutionalizes a commitment to increase expenditure on the social sectors over time, as fiscal circumstances permit. 1.24 The government has exhibited a new concern with the question of gender equity. Soon after it took over, the Ministry of Women’s Development submitted a 10-point agenda to amend laws that discriminate against women to the Chief Executive. The government created an independent Permanent Commission on the Status of Women in July 2000 to examine policy and programs as they relate to gender equality, to review laws, rules and regulations affecting women’s rights, and to suggest amendments or new legislation. After extensive consultations a number of laws were redrafted to make them gender sensitive. These include the Family Law Ordinance and Rules; Nikahnama form (marriage license); Family Court Act; Dissolution of Muslim Marriages Act; and Child Marriage Restraint Act. So far, however, the conservative religious lobby has prevented the enactment of these reforms. The government has also declared that all “honor killings” will be treated as murder. And it is seeking to improve women’s voice and access to resources by increasing their political representation: a third of local council seats have been reserved for women (resulting in a total of 36,007 women elected across all four provinces, although not all reserved seats were filled). The number of seats reserved for women in the future National Assembly will be increased from 20 to 60. 1.25 The present government has thus developed a program that addresses many of the concerns that have been expressed by the World Bank over the past decade. The remainder of this report is addressed to describing this program in more detail and analyzing whether it is indeed likely to succeed in leading Pakistan to a new dawn. Specifically, the next chapter describes and evaluates the government’s policies in six critical areas, while the final chapter summarizes the outlook suggested by that analysis and goes on to consider the risks that might torpedo the effort to put Pakistan back on the fast track to economic modernization.

Pakistan Development Policy Review
9
2. DEVELOPMENT POLICY AGENDA
2.1 The development policy agenda discussed in this chapter stems largely from GoP’s I-PRSP (Box 3), which was issued in November 2001. In a few areas, however, such as reform of the banking system and the CBR, the government’s program is actually ahead of its proposals in the I-PRSP. The present chapter discusses the key elements of the development policy agenda, starting with governance, and then moving on to investing in people, macroeconomic stabilization, the financial sector, the investment climate, and agriculture and irrigation.
Box 3: The Interim Poverty Reduction Strategy Paper (I-PRSP)
The I-PRSP specified five main goals of policy in the years ahead: engendering growth, reforming governance, creating income generating opportunities (specifically for the poor), improving human development, and reducing vulnerability to shocks (at the microeconomic level). Faster growth is to be pursued by a combination of prudent macroeconomic management coupled with a series of sectoral policies. The macroeconomic agenda stresses the importance of increasing tax revenue in order to provide more fiscal space for poverty reduction initiatives while also overcoming the adverse debt dynamics. Export growth is similarly recognized as vital to improving the external debt situation. Key sectors addressed include agriculture, small and medium enterprises (SMEs), the financial sector, infrastructure, energy, oil and gas, and telecoms. The I-PRSP argues that implementation of the government’s devolution strategy holds the promise of a “grass-roots” transformation of Pakistan's politics, and better citizen oversight of government programs. It envisages providing income-generating opportunities for the poor primarily through a housing program, the distribution of government-owned land to the poor, and improved access to microcredit. The human development strategy presents an integrated framework to address the critical bottlenecks in service delivery, especially in health and education, and describes the ongoing devolution plan as the major policy reform to improve access to education, health and other public services. As gender disparities remain substantial in all social indicators, targeted programs are considered essential to reduce these gaps, e.g., through subsidies for girls’ education, and through programs like the Lady Health Workers Program and Women’s Health Project. Shocks are to be better dealt with by revamping the Zakat system, revitalizing the food support program, and expanding the Khushal Pakistan Program. The I-PRSP envisages institutionalizing mechanisms to track poverty-related expenditures and monitor intermediate variables as well as outcomes. The I-PRSP does not discuss whether the program is consistent with achievement of the Millennium Development Goals for the year 2015, although a casual impression is that it would indeed put Pakistan on the road to achieving the goals. It is intended to address this issue in the full PRSP that is to be prepared in the coming months.
A. GOVERNANCE
2.2 The bold governance agenda being pursued by the federal government has already made substantial progress in addressing four major issues: devolution, professionalization of the civil service, reduction of corruption and improvement of financial management, and institution of more realistic and open budget processes. Police and judicial reforms have also been initiated, but are less advanced. These reforms will be important in improving the investment climate, and devolution in particular is expected to improve the delivery of social services. The Devolution Initiative 2.3 Pakistan’s turbulent history combined with a Post-WWII concept of development to create a highly centralized political and fiscal system. This centralization is widely regarded as a major factor in its poor recent record of economic growth, poverty reduction, and social progress. General Musharraf announced an ambitious plan to devolve political and fiscal central powers to a series of new local governments shortly after assuming office in October 1999. He instructed the National Reconstruction Bureau (NRB) that the government had created to launch this Devolution Initiative no later than August 14, 2001 (Pakistan’s Independence Day). Pakistan is thus joining many other countries in pursuing a policy of decentralization or devolution.

Pakistan Development Policy Review
10
2.4 The Pakistani initiative is among the boldest yet launched in the breadth of reforms and its fast-track timetable. If the next difficult step from political to fiscal decentralization can be made (and it will take time) and with support and buy-in from stakeholders, the system has the potential to deliver better services while opening up political participation to a much wider number of citizens. It is true that devolution has often led to a loss of fiscal control, but this is not a necessary consequence, and so far the Pakistani arrangements have been designed to maintain a hard budget constraint on local governments. 2.5 Political decentralization. Politically, the reforms are on-track. During the 18-month period from March 2000 to August 2001 the GoP successfully launched the first phase of a new federalism. Given the wide-ranging nature of the reform and the short time from planning to implementation, it is inevitable that the system is facing operational challenges. What is important–and for which Pakistan deserves worldwide recognition–is how much has been accomplished so quickly. 2.6 Administrative Structure. The former system embodied a measure of administrative decentralization, with three tiers of subnational governance (provinces, divisions, and districts). Instead, there are now, along with the provinces, three sets of elected local governments: districts (called city districts in the four provincial capitals); tehsils (called towns in the four city districts); and union councils. Although geographically there may be one or more tehsils (and several union councils) in a district, the intent is that there be no fiscal hierarchy among the three local governments.
2.7 There are 6,455 new local self-governments for a population of 141 million: 92 districts and 4 city districts; 307 Tehsil governments and 30 city towns; and 6,022 union councils. At some point it will be appropriate to question whether this has led to fragmentation (e.g., based on scale economies, overlapping tax and benefit areas for activities such as distribution of utility services), with too many local governments, thereby calling for amalgamation.
2.8 Improvements in local service delivery will depend on the interplay between the district councils and proposed Citizen Community Boards (CCBs), which are envisaged as a critical part of the mechanism for improving social service delivery. It was originally envisaged that 50% of total development expenditures out of the district budget would be reserved for CCBs, based on an 80% matching grant of district to CCB generated funds. To date, this has not been implemented; and it is possible that even if implemented, the parameters may change. Some people see the CCBs as a potential threat to the capacity of the elected local bodies and their staffs, particularly those of the union councils who, after all, are accountable at the ballot box. Moreover, there is concern that some CCBs may entrench the influence of local moneyed interests (particularly in the larger urban areas) rather than empower the poor, since it will be the rich who are most likely to have the time to develop the kind of development expertise an effective CCB will require and the money to attract matching funds from the district council.
2.9 Elections. The elections for each of the new local bodies were held sequentially between December 2000 and September 2001. With few exceptions (e.g., a boycott by one party in Karachi and prevention of women from contesting elections or casting their votes in parts of the NWFP), they were fair and impartial. The isolated NWFP experience notwithstanding, a key break from Pakistan’s political past was accomplished with the election of a large number of women councilors. Thirty-three percent of union, tehsil, and district council seats have been reserved for women (although of the 126,462 new union councilors, 16 percent of the seats reserved for women remain empty due to lack of a candidate). Indeed, the quota system (not only for women but also for peasants, workers, and religious minorities) has opened the doors to bring to the political system the views of socially disadvantaged groups that otherwise might have little chance of participating in local government decision making. 2.10 Training. Because there are so many new councilors who have never before held political office, it is critical that they be provided with appropriate training for their new role. This is always important,

Pakistan Development Policy Review
11
but particularly so for new Pakistani officials, since there is not only a large “newness” factor (e.g., 79% of women union councilors had never before run for political office), but also an issue of illiteracy (45 percent of women and 11 percent of male union councilors are illiterate). A potential solution is to seek IFI and bilateral partner collaboration in enhancing human and institutional capacity. With respect to the issue of gender, at least two efforts merit support: efforts by the Law Commission, Human Rights Commission and the National Commission on the Status of Women in Pakistan with respect to protection of women’s voting, electoral and representation rights; and the efforts of the Ministry of Women and Development to provide a strategic plan for national and local governments to effectively address the local needs of women. 2.11 Fiscal decentralizatio n. Now that political decentralization has been launched successfully, the next and more time-intensive step is fiscal decentralization–the permanent establishment of a set of budgetary practices whereby citizens, acting through their independently established local governments, are given the responsibility to make their own decisions for delivery of a set of public services, and the authority to impose taxes and fees to finance those services. Reflecting its fiscally centralized past, plus the decision of the federal government to provide a centrally funded grant as a replacement for the notoriously inefficient and corruption-prone octroi, the subnational governments are heavily dependent on federal transfers (an average 82 percent in 2000-01 for provinces and almost 100% for districts in 2001-02). In designing a system of intergovernmental fiscal relations, it will be important to secure transparency, to maintain hard local budget constraints, and to give local governments the opportunity to raise additiona l resources in response to local democratic processes. 2.12 A corollary to the requirement for federal grant transparency and increased flexibility in tax assignment is that the provinces and districts, which serve as fiscal conduits for the flow of federal funds to the tehsils and union councils, must make these funds available automatically. It should be unambiguous that the tehsil and union council decision to spend is not mandated by the province or the district. Similarly, the provincially-administered, collected and shared Urban Immovable Property Tax that is levied on property on behalf of the tehsils should flow to them with deliberate speed and certainty.
2.13 At present the intergovernmental flow of resources is a murky area. The provinces receive federal funds derived from a “distributable pool” of shared federal revenues (largely income, sales, and customs taxes). Each province determines how much of its total resources will be transferred to the districts, without any rules regarding a minimum amount to be so assigned or a distribution formula. Thus, even though there is ostensibly no hierarchical relationship among sub-national bodies, the districts are dependent on the federal-provincial distribution of resources. Similarly, a district may make grants to the tehsils, but there is no requirement to do so, nor is there a set formula once the decision is made to make a grant. Finally, what operating funds the union councils do have are derived from own fees and licenses plus a flow from a district Annual Development Fund. If devolution is to proceed in a well-designed manner, these fiscal flows must become more transparent and certain.
2.14 Of course, effective devolution requires local control on the spending side of the budget. This is particularly important for the districts, given that the provincially-adopted Local Government Ordinances give the district governments primary responsibility for health and education service delivery. On this matter, there is a potential bottleneck to reform: a civil service that is beyond the control of the district, tehsil, and union council to control through the ability to hire and fire. Civil servants are provincial employees (“paid” by the provinces out of district budgets) and will remain so until at least July 2003. This creates a concern that if the district does not take over the civil service (create a district civil service cadre), the civil servants may not be committed to effective district governance.
2.15 For FY 2001-02, Provincial Transition Committees have done the work of drawing up the budgets for each of the 96 districts. For effective devolution, the districts (and the tehsils and union

Pakistan Development Policy Review
12
councils) need soon to do their own budget preparation and management, with appropriate mechanisms for provincial monitoring. Since the 2002-03 budgets must be set by June 30, 2002, the first opportunity for this will be the FY 2003-04 budget (to be prepared by June 2003). Despite these concerns, the “top-down” devolution initiative is off to a very strong and promising start. Professionalization of the Civil Service 2.16 Although the federal civil service represents a comparatively small proportion of total public employment, reforms are critically important because they set standards that are emulated in regard to both pay and conditions of service in the provinces and, to a lesser degree, in state-owned enterprises. Some progress has been made in three key areas where reform was needed. 2.17 Merit in recruitment and promotion. The government has strengthened the authority and independence of the Federal Public Service Commission (FPSC), increased its financial autonomy, and expanded its role in recruitment. FPSC will:
• Recruit for all positions at grades16 and above, with no exceptions; • Recruit for grades 11-15 in 11 departments and organizations with relatively greater opportunities
for corruption (e.g., Central Board of Revenue, Federal Investigation Agency); • Review appointments made in contravention of established procedures, including contracts, and
terminate unqualified appointments; • Oversee promotions to grade 20; • Improve required training and examinations for promotion to grades 17, 19, and 20.
2.18 These are important reforms, designed to eliminate the politicization of civil service appointments that had been so damaging. Similar strategies have been followed in the provinces with varying degrees of vigor, with Sindh in the lead, and Provincial Public Service Commissions have been strengthened. 2.19 Pay and pension reform. A new pay and pension package went into effect on December 1, 2001. It includes a sizeable increase in salaries (although below the 75 percent increase in the CPI since the last adjustment in 1994) and significant changes in pensions. Basic government wages were very low (only about half the ratio of wages to per capita GDP in similar countries). The increase has lifted salaries but these remain low, especially for the higher grades. It did not decompress wages significantly, but it did reduce monetary allowances from nearly 40 percent of the wage bill to approximately 27 percent. 2.20 Actions are needed to improve the medium- and long-term fiscal sustainability of the pension system. The December 2001 changes to the pension system included (i) revising the commutation factors, (ii) capping pension credit for service after 30 years, and (iii) abolishing the restoration of commuted pensions and preventing pension augmentation. These changes served, in part, to counterbalance the effect of the pay reform on the government’s defined benefit pension liability (previously a serious constraint on raising pay). However, concerns remain that government has a growing unfunded pension liability, significantly driven by the cost of military pensions. This needs a comprehensive review. 2.21 Right-sizing and restructuring. The Committee on Right-sizing and Restructuring (Shahid Amjad Chaudhry, Chairman) proposed a series of reforms in 2001 to reduce in stages the ratio of staff (grades 1-16, 14,000 staff as of July 2001) to officers (grades 17-22) in the main ministries of civilian central government. Surplus staff would be placed in a pool (1,000 as of July 2001), with full salary and benefits for two years, followed by retrenchment if they have not been found other posts. This proposal has little fiscal impact because of the relatively small number of federal employees (if it meets its targets, the saving would be of the order of 1 percent of the total federal wage bill).

Pakistan Development Policy Review
13
2.22 The larger problem is that decades of patronage-based employment and inattention to skill mix undermined the work ethic and created an entitlement culture in which status and inter-cadre rivalries outweigh concerns about service to the public or to government. The significance of the Committee on Right-sizing and Restructuring will be the signals that it sends about government readiness to tackle the culture of entitlement and status. The middle level of the civil service suffered particularly from episodes of patronage and political manipulation, exacerbated by very low pay. The recent reforms have enhanced managerial flexibility in the federal civil service, but it will take many years for the newly reconstituted merit processes and emphasis on performance to reduce the numbers of non-performing staff at these middle levels. In the shorter term, a human resource management information system to track staff in post could help to improve staff deployment, and increased lateral entry could recruit new talent. The number of lower grade staff needs to be reduced, inter alia by greater us of IT. These reforms need to be replicated at the provincial level. Refinements to the Local Government Ordinance and associated rules are required urgently to enhance civil servant responsiveness to citizens and to pass responsibility for staff recruitment and discipline from the provincial governments to the districts, accompanied by a review of options for creating district cadres. Reducing Corruption and Improving Public Financial Management 2.23 The President established the National Accountability Bureau (NAB) in 1999. Its authorizing Ordinance gives the state extensive powers to investigate alleged corrupt behavior both by "Holders of Public Office" and members of the public. Most significantly, it allows for the presumption of guilt: "Where there are reasonable grounds to believe that the assets of a person or any part thereof were acquired through corruption or corrupt practices, and there was no other likely source of acquiring such assets or part thereof, it shall be presumed, unless proved to the contrary by the accused person, that such assets or part thereof were acquired, generated or obtained through corruption and corrupt practices" (Art 20 (c)). Initially this entailed three-month detention without trial, but this provoked some public concern and capital flight, and the policy was moderated. In July 2000, the government announced that it would reconcile its accountability drive with the pressing need to generate revenue and avoid alarming the business community. 2.24 While the NAB appears to have made a significant impact on the problem of “grand” corruption, there is some evidence that the general public is not yet convinced of its effectiveness, particularly with regard to low-level corruption. There are still many complaints, especially from SMEs, about the low-level bureaucracy, particularly in the CBR, but also in the labor ministry and the police, engaging in harassment and seeking to extract bribes. The people convicted by accountability courts include a former prime minister, five former chief ministers of Sindh, the Punjab and the NWFP, former federal ministers, provincial ministers and a former anti-terrorist court judge. NAB has been criticized for being soft on military transgressors, although it has imposed fines and stripped some of their military rank and pension. 2.25 Accountability within government has been improved significantly by the separation of auditing and accounting functions: • Establishment of the Office of the Comptroller General of Accounts under the Ministry of Finance; • Timely release of the FY2000 Audit Report to the Public Accounts Committee (for the first time in
more than a decade, the Committee is reviewing the accounts of a government in office); • Establishment of Departmental Accounts Committees to sift out minor issues and avoid the need for
the PAC to consider them.

Pakistan Development Policy Review
14
Budget Processes 2.26 The quality of the federal budget presentation has improved significantly, with the FY2002 budget showing contingent liabilities, tax expenditures, and subsidies. Budget preparation has improved with more realistic federal revenue projections. Sindh and NWFP have made an initial preparation of budgets within a medium-term framework. It is anticipated that this framework will be introduced in all provinces and for the federal government by FY04. 2.27 Nevertheless, budget presentation and management leave a lot to be desired. Recurrent and development expenditures are not systematically distinguished. Accounting, budgeting, payroll, and treasury systems are not linked. Budget planning and implementation are not integrated. Over 70 percent of federal and provincial budget expenditures are for debt service, salaries, and defense, leading to structural rigidity. 2.28 Planned reforms to the CBR show considerable promise. Historically, collusion between taxpayers and tax officials has been pervasive, facilitated by the discretionary powers of tax officials, complex rules, and weak staff supervision. The April 2001 report of the Task Force on the Reform of Tax Administration was endorsed in the 2001 budget and emphasizes seven areas for reform: (i) reduction in the number of federal and provincial taxes; (ii) reduction of tax rates and penalties; (iii) simplification of assessment and collection procedures; (iv) reforms in labor levies; (v) efficiency in dispute resolution; (vi) broadening the tax base; and (vii) honesty and efficiency in tax administration. 2.29 Tax administration reforms agreed to by the President in November 2001 include: (i) increased administrative and financial autonomy for the CBR, balanced by a Supervisory Council headed by the Minister of Finance; (ii) business process re-engineering and automation; (iii) significant human resources management improvements; and (iv) improved office facilities and equipment. Reengineering of CBR business processes will end the current arrangements under which one tax official can have responsibility for all tax functions. Under the new arrangements, these will be split between a range of staff, and staff will themselves be rotated. The intention is to ensure anonymity between staff and taxpayers, making corruption more difficult. 2.30 A new Income Tax Ordinance has placed income tax on a self-assessment basis, with audits, minimal exceptions, and more equitable rates; established uniform tax rates for all companies; and limited exemptions. 2.31 An ordinance creating the Public Procurement Regulatory Authority (PPRA) has been sent to the cabinet for approval. It is not yet clear whether the PPRA will improve the situation described in the recent “World Bank Country Procurement Assessment” report, that is, that prequalification excludes outside firms, mandatory registration of bidders facilitates collusion between bidders and procurers, and unrealistically low “schedules of rates” deter bids and leave the field open to insiders. Access to Justice (Police/Judicial Reforms) 2.32 The courts. The courts remain the most popular forums for dispute resolution, although the poor rely on informal justice and dispute resolution by local panchayats (traditional council of elders/leaders). But while the informal legal system is cheaper, enforcement of decisions can be problematic and judgments can be manipulated by local elites. The informal system is inadequate for market-based economic growth, and constrains the growth of SMEs. 2.33 The low level of public confidence in the judiciary, and particularly the district courts, is a clear constraint on Pakistan's economic, political, and social development. At least eight law reform

Pakistan Development Policy Review
15
commissions have been constituted since 1958: the commissions have strongly recommended strengthening the quality of faculty, students, standards, curriculum, and facilities in law schools, but virtually none of those recommendations were implemented. 2.34 Most civil and criminal disputes relate to land, but little has been done to improve titling and record management. With no professional managers and inadequate record-keeping in the courts, case management is poor and delays are chronic. The Asia Foundation found in 1999 that non-salary inputs declined as a percentage of the budget over the past 10 years to one of the lowest in the world. 2.35 There has been some significant institutional progress, however: the removal of judicial functions from the District Commissioner, abolition of the executive magistracy, and separation of the executive from the judiciary. A separate court system has for several years been instrumental in increasing the ability of banks to collect collateral on defaulted loans promptly. 2.36 The police. Weak incentive and sanction systems and political interference have eroded the capacity of law enforcement agencies, particularly the police. Small traders and the poor report harassment. Minority or socially excluded groups are particularly vulnerable to police extortion. The average cost of police services to the public is of the order of Rs 30,000-35,000 per transaction. 2.37 The Police Act of 1861 enshrined a colonial emphasis on control, which, coupled with inadequate funding, encouraged rent-seeking and extortion. The situation deteriorated as a consequence of politicization of recruitment and alliances between the local political elite, the district administration, and the magistracy when under the control of the executive. Prosecution functions are split among the provincial police, the department of law, and the Office of the Advocate General. Police sub-inspectors handle arraignment procedures and lower classes of offenses. The prosecution service is understaffed and under trained. Lack of operational independence enhances misuse of the office and facilitates political influence and prosecutorial misconduct. Watch and ward (e.g., patrolling the streets, controlling crowds) and investigation are handled by the same police officers, with the result that the former takes precedence. The Police Act 2002 will be introduced to replace the previous Police Act of 1861 on March 23, 2002. Planned Public Safety Commissions (PSCs) will provide more democratic control over the police and insulation from political interference. The new Police Ordinance will redefine the administrative structure and establish national, provincial, and district PSCs. B. INVESTING IN PEOPLE
2.38 Narrowing the large social gap discussed in the last chapter is the most pressing issue for Pakistan not just because it stunts the lives of those who remain illiterate and exposed to ill-health, but also because no country can expect to progress in a globalized world economy without an educated and healthy workforce. 2.39 Educational attainment in the 1990s made little progress, especially after the middle of the decade. Since 1995-96, gross enrollment rates have stagnated or even fallen (for males) in rural areas. Enrollments have also exhibited significant rural-urban differences, and while the gender gap closed slightly, this was in part due to a decline in male enrollments. Primary net enrollment rates – a better measure of educational attainment – tell an even starker story for the latest year with available data. The primary net enrollment rate for the entire country was 51 percent in 1998-99, which included large rural-urban (67 percent to 45 percent) and male -female (57 percent to 44 percent) differences. The primary net enrollment rate for girls in rural areas is as low as 36 percent, with rural Sindh and Balochistan having a particularly weak record. While a substantial improvement in the literacy rate occurred between 1990-91 and 1998-99, it remains low overall (43 percent), especially among women (27 percent), and even lower among rural women (17 percent).

Pakistan Development Policy Review
16
Figure 4: Gross Primary Enrollment Ratios by Per Capita Expenditure
0
20
40
60
80
100
1 2 3 4 5 6 7 8 9 10 Per Capita Exp. Deciles
% E
nrol
lme
nt
1991 1998-99
Source: Staff calculations, using PIHS (1998-99)
2.40 Educational attainment and literacy are closely related to poverty: the net primary enrollment rate is 59 percent for the non-poor versus 37 percent for the poor.3 Poor children also have relatively higher dropout rates, and greater proportions attending grades lower than those appropriate for age. Moreover, comparing 1991, and 1998-99 (Figure 4), gross primary enrollment ratios for the later year are lower than those for 1991 for all the lower expenditure deciles. Similar patterns are seen in secondary enrollment rates also, indicating rising inequality between the rich and the poor.
2.41 While enrollments have stagnated, the share of the private sector in schooling has increased between 1991 and 1998-99. In primary enrollment, the increase was from 14 to 28 percent. Between 1991 and 1995-96, enrollment in non-government primary schools increased by 70 percent compared to 4 percent for government schools. The shift in favor of private schools is believed to be primarily a parental response to concern about the inadequacy of public schooling. 4
2.42 While health indicators have improved over the decade, most indicators still compare poor ly with countries with similar levels of income. For example, the infant mortality rate fell during the 1990s, but it is now the highest in South Asia. Pakistan also has a high incidence of low birth-weight babies, one of the highest maternal mortality rates in the world, low indicators of maternal health, low incidence of pre- and post-natal medical consultation, and a high proportion of childbirths unattended by trained personnel. Progress in preventive health care has also been limited; only about half of the children in the country were immunized in 1996–97, including only about 40 percent of children from the lowest income quintile. Large variations exist in health indicators across regions, economic status and education levels of women in particular. Infectious and parasitic diseases, including malaria and tuberculosis, also remain severe threats.
2.43 Although knowledge of contraceptives rose from 38 percent in 1991 to 92 percent in 1998-99, the actual use of modern contraceptives has not increased proportionately, and remains very low (20 percent of married women of age 15-49), especially in rural areas. Fertility is still very high by contemporary Asian standards, at 4.8 children per woman, but the 1998 census brought clear evidence that the demographic transition has now begun. The population growth rate slowed from 3 percent per year a decade ago to the latest estimate of 2.2 percent.
2.44 While construction of additional facilities and enhanced funding are needed, the experience of the SAP demonstrates that this is not enough. The Human Development Strategy developed by the Government of Pakistan is articulated in the I-PRSP, and attempts to embody lessons from the difficulties encountered by SAP. Before examining the efficacy of the I-PRSP, it will be useful to briefly explore the experience with SAP, the primary social development program in Pakistan in the recent past.
3 Gross primary enrollment rate is the ratio of total primary enrollment to the total population in the primary school age-group; net primary enrollment rate is the ratio of total primary enrollment counting only those who are of primary school age to the total population in the primary school age-group. 4 A further 3 percent or so are believed to be enrolled in madrassas. It is not known how many of the madrassas at present provide a serious education, but President Musharraf announced in January 2002 that in the future all of them would be required to teach a minimum curriculum of modern subjects including English and IT.

Pakistan Development Policy Review
17
The Social Action Program and its Shortcomings 2.45 SAP was launched in 1992-93 as a major initiative of the GOP, with the aid of donor financing and technical assistance (see Box 4). The Program explicitly aimed at increasing the physical availability and improving the quality and efficiency of services, especially for the poor and for women, in four distinct target areas – elementary education, basic health care, family planning, and rural water supply and sanitation. The essential modalities were to support the provinces in expanding access to, and the quality of, each of these four areas.
Box 4: The Social Action Program in Pakistan One of the main reasons for Pakistan’s lackluster record in social development was the low level of public expenditure in this area. The SAP aimed at increasing public spending (especially non-salary operational expenditures) in four critical areas, and at improving the institutional and policy framework necessary to deliver services more effectively. The program was implemented in two project phases. The first phase, SAPP-1, covered the period from 1993-94 to 1996-97. The second phase, SA PP-II, began in 1997-98 with a planned duration of five years ending in the year 2001-02. The SAP agreements required the Government to raise the proportion of GDP spent on basic social services from 1.6 per cent in 1993-94 to 2.19 per cent by 2001-02 (now revised to 1.95 percent in view of the severity of the macroeconomic adjustment problems being faced by the country). A disquieting feature has been that the gap between the Government’s targeted and actual expenditure on SAP as a percentage of GDP has been increasing since its inception and has increased rather sharply in the last three years. In 1998-99, the Government’s contribution to SAP reached a low of 1.46 percent, compared to the target of 1.8 percent. But the significant increases in primary school enrollment that were expected to be the main force driving the need to expand total expenditures did not materialize. Enrollment rates were relatively flat overall, with some increases in girls’ enrollment, and in private schools, broadly offsetting enrollment declines for boys and in government schools. In this context, efforts to improve the quality and effectiveness of government schools (e.g., enhancing non-salary spending on school materials; in-service training of teachers; merit based recruitment; and reducing absenteeism) took on additional importance as ways to increase demand. While these efforts did not require substantial additional funds, they encountered persistent funding and implementation difficulties. Thus the impact of SAP in terms of improving outcomes, especially in education, was disappointing, although some improvements occurred in health indicators., Perhaps the most encouraging progress was in limiting fertility and increasing access to safe drinking water and sanitation: the percentage without access to safe drinking water declined from 50 percent in 1992-93 to 40 percent in 1995, and the proportion without access to adequate sanitation fell from 67 percent in 1993 to 53 percent in 1995. The program also had successes in areas like immunization and availability of Lady Health Workers, and (during SAPP-I) in terms of enhancing funding and expanding physical facilities, but not in the supply of educational materials and medicines and service delivery, or creating accountability among service providers. And its requirements for reimbursing expenditures created an administrative nightmare.
2.46 Despite its disappointments, SAP, along with the UNDP and South Asian Human Development Reports of the 1990s, may have contributed to changing attitudes towards social development, among the government and citizens alike. Social development is now on the center stage of public discourse, with the government committed to expanding social expenditure as expressed in the I-PRSP.
Human Development Strategy in the I-PRSP 2.47 The Human Development Strategy developed by GoP is articulated in the I-PRSP, and attempts to embody lessons from the difficulties encountered by SAP. Ongoing reforms are seeking to address some of the critical constraints in service delivery, by focusing on the core institutional factors that limited the success of SAP. The federal government has proclaimed an objective of Education for All and designed an Education Sector Reform (ESR) Action Plan that pilots some innovations in Islamabad and involves investments in school rehabilitation, teacher training, an adult literacy campaign, mainstreaming the madrassas, a pilot school nutrition program and technical stream in secondary schools, and reform of examination and assessment. The ESR also envisages partnerships among the private sector, civil society organizations, and the public sector. But the responsibility for education now rests primarily with the districts, and the biggest challenge will be to the provinces and districts to address fundamental governance, under-budgeting, access, and quality issues.

Pakistan Development Policy Review
18
2.48 On the health front, the share of consolidated public health expenditures has fallen, and institutional deficiencies have resulted in serious lack of capacity in district health offices and rural health facilities. The overall aim of the government’s medium term health strategy envisions raising public sector health expenditures, with a focus on prevention and control programs (especially in the area of communicable diseases), reproductive health, child health, and nutrient deficiencies. Programs include adoption of strategies against TB and malaria, measures for preventing the spread of Hepatitis B, and HIV/AIDS through immunization and public health campaigns. The strategy also aims at promoting gender equity through targeted interventions like the Lady Health Workers program and the Women’s Health Project. Specific short-term measures in the health sector include the reorganization of district health offices to make them community based and locally managed establishments, the consolidation of existing primary health-care network in rural areas, improvement in the administration and financial management of hospitals, and proper regulation of the private sector. Longer-term plans include giving more responsibility for health delivery mechanisms to the district level, and increasing cost recovery, with subsidies focused only on the poor through Zakat.
Evaluating Education and Health Strategies 2.49 The I-PRSP describes devolution as the major instrument to improve access to education, health, and other public services. Devolution will take time to become effective given the important challenges of addressing capacity constraints especially at the district level and below. The institutional changes introduced by devolution could increase the incentives of local government to improve service delivery, using electoral competitions through local elections, to weaken the systems of patronage that have often dominated in the past. Yet it is clear from both domestic and international experience that devolution is no panacea and at best it takes time to implement the essential institutional reforms. 2.50 Public-private partnerships can potentially help in improving access to and quality of service delivery. The ESR articulated in the I-PRSP incorporates some initiatives, but it falls short of exploiting the potential role of the private sector in bringing education to the underprivileged. Given the lower costs of the private sector, it is at least worth considering whether public subsidies – either in the form of vouchers to parents for the education of children at selected private schools, or as direct subsidies to private schools – might play a role in expanding the enrollment of poor children.5 Of course, the arguments in favor of such subsidies, on grounds of improving access, efficiency and quality, need to be weighed carefully against the possibility that scarce public resources would be better spent in improving the public school system that typically has more universal reach.
2.51 The government’s medium term health strategy is sensibly focused toward raising public sector health expenditures, concentrating on prevention and control programs. As in education, the success of the health strategy will crucially hinge on the extent to which devolution is able to improve incentives and accountability mechanisms of public service delivery. Accordingly, the I-PRSP recognizes the need to reorganize district health offices to make them community based and locally managed establishments. Again as in education, there is a large scope for targeted interventions devised at higher levels of government that focus on disadvantaged sections of society. In this context, the government’s plans to expand the Lady Health Workers Program and Women Health Project are to be welcomed. 2.52 Recent years have witnessed major progress on the gender front, but the gender gap remains large. The low educational attainment of girls can be partly ascribed to demand-side constraints, which
5 An example of success in such endeavors is the Quetta Urban Fellowship Program, where private schools controlled by the community in poor urban neighborhoods were encouraged to establish new facilities for girls through subsidies paid directly to the schools, resulting in a substantial positive impact on female enrollments in the target neighborhoods.

Pakistan Development Policy Review
19
are unlikely to be removed by devolution. Experience in other countries suggests that the incentives of local governments may be low or even perverse due to significant local opposition to reform, in which case the involvement of higher-level government becomes necessary if progress is to be made. Their interventions may take different forms: subsidies to households to send their daughters to school, or incentives to districts in the form of provision of goods (such as infrastructure) that are heavily demanded. 2.53 Public works programs that double by producing valuable assets to the community have traditionally played a less effective role as a safety net than they have in a number of other developing countries. The reason is that they have traditionally been captured by patronage politics.6 The Khushal Pakistan Program, as laid out in the I-PRSP, attempts to avoid this by incorporating active community participation. Funds are allocated under the Program to the districts through provincial governments, but the schemes under the program are identified and selected at the district level through active community participation, and the projects are implemented in partnership with the communities. As district governments start functioning under the devolution program, the government expects Khushal Pakistan to gain further importance and local ownership. A critical question is whether the Citizen Community Boards that are envisaged as initiating these programs will act in the interest of the poorer sections of the community, or whether they will be captured by the elite (see Ch. 2.1 above).
2.54 In sum, Pakistan faces a number of critical challenges in developing its human resources as a basis for sustained growth and poverty reduction as well as start to close the social and gender gaps. Earlier failures to develop human capital contributed to the recent malaise of the economy, and the slowdown in growth and poverty reduction during the last decade in turn led to further stagnation in human development indicators. In order to break this cycle of low capability and poverty, public policy must focus above all on measures to improve education and health outcomes. The devolution program offers a real possibility of bringing about the needed institutional changes, and its progress therefore needs to be monitored carefully. C. MACROECONOMIC SUSTAINABILITY 2.55 Pakistan has little chance of attaining public debt sustainability by the time the 3-year PRGF program ends; the Pakistan Debt Report speaks of a ten-year workout. Nevertheless, there is a good chance of moving public debt dynamics to a favorable downward trajectory. 7 This alone would mark a clean break with the past two decades, and help lower domestic interest rates by getting away from the crisis atmosphere that has plagued public finances and international liquidity since May 1998. Credibility is paramount to this process. As the Pakistan Debt Report notes, “Pakistan’s history is littered with failures of important economic initiatives”. The Paris Club agreement of December 2001and expected IFI support would provide significant cash flow relief for the next three years. While this is a short period for the reform agenda at hand, it is long enough to establish credibility, provided the continuity of reform is maintained.
2.56 Fiscal deficits have historically been large, and only after mid-1999 was a significant dent made in the deficit, which fell to 4 percent of GDP (after grants) in FY01. Chronically large deficits, plus takeover of contingent liabilities, added to debt and therefore to interest costs. Interest and defense spending have increasingly dominated public spending at the expense of development spending, as shown in Figure 5. By FY01, interest spending at about 7 percent of GDP, of which domestic debt accounts for
6 Examples include the Rural Works Program of 1962-72 and the Peoples Works Programs of 1972-83. 7 Based on standard measures. According to the Maastricht criterion, public debt should be less than 60 percent of GDP. The HIPC initiative launched by the World Bank and IMF seeks to bring the NPV of public external debt down to a level of 150 percent of exports.

Pakistan Development Policy Review
20
75 percent, and defense at about 4 percent of GDP, swallowed up 70 percent of total revenues. Development spending had shrunk to less than 3 percent of GDP from close to 10 percent in 1980-81.
Public Debt and Fiscal Sustainability 2.57 On June 30, 2001, public debt was about $61 billion at end-period exchange rates, distributed 44:56 between rupee and foreign currency debt, and amounting to 112 percent of FY01 GDP. Table 2.1 shows that Paris Club debt was 35 percent of foreign currency denominated public debt, of which about 69 percent was on ODA terms and 31 percent on commercial terms. Multilateral debt, to the AsDB, World Bank, and IMF, comprised 43 percent of external debt. The most expensive component of domestic debt was NSS instruments, which amounted to 40 percent of domestic debt, while short-term treasury bills constituted 43 percent.
Table 2.1: Total Public Debt as of June 30, 2001 a/
Foreign Currency debt $ Billions % Rupee debt $ Billions c/ % Paris Club 12.1 34.5 Long-term bonds 4.4 16.5 Other bilateral 0.6 1.7 Floating debt (t-bills) 11.5 43.2 Multilateral 15.1 43.0 Unfunded (NSS instruments) 10.7 40.3 Other MLT 1.5 4.3 Short-term 2.0 5.7 Special US$ bonds 1.4 4.0 Other FX liabilities 2.4 6.8 Total b/ 35.1 100.0 Total 26.6 100.0
a/ Based on Table 8.5, SBP (2001a) and Table 7 IMF (2002). The debt numbers have been recently reclassified. For example, special US dollar bonds, which were issued in exchange for frozen foreign currency accounts, are held by residents, and have been recently re-classified as domestic, instead of external, debt. We stick to the currency denomination of debt as the distinguishing criterion, which is more relevant from a fiscal point-of-view.
b/ National external debt also includes $2.45 b. of PNG, to give a total of $37.6 billion. c/ At end-period exchange rate of 64.4 Rs./$.
2.58 Public debt dynamics are determined by the primary fiscal balance, the real interest rate, growth, privatization revenues, takeover of contingent liabilities, and grants, as described analytically in Box 2. 8
8 The primary fiscal balance is defined as total revenues minus non-interest spending. The fiscal deficit = primary deficit + interest payments.
Figure 5: Trends in Interest, Defense and Development Spending
0.0
2.0
4.0
6.0
8.0
10.0
FY81 FY85 FY89 FY91 FY96 FY00 FY01
Source: Economic Survey and IMF staff estimates.
% o
f G
DP
Interest Payments Defense incl. pensions Development Spending

Pakistan Development Policy Review
21
2.59 Primary Fiscal Balances. Table 2.2 shows how primary fiscal surpluses are expected to increase up to mid-2004 under the PRGF program. The target is to increase revenues by 1.6 percentage points of GDP by FY04 relative to the outcome in FY01. Primary fiscal surpluses are projected to rise from 1.5 percent of GDP in FY01 to 2.4 percent by FY04. It is assumed that interest costs will decline significantly, despite the prospect of large costs from the maturing of zero-coupon NSS instruments in the coming years, as deficits decline and more resort is made to low nominal coupon foreign currency debt. Including grants, the overall fiscal deficit is projected to halve from 4 percent of GDP to 2 percent over the same period.
Table 2.2: Basic Fiscal Indicators (% of GDP)
Projections FY01 FY02 FY03 FY04 Revenue 15.7 16.9 17.3 17.3 Non-interest spending 14.2 15.7 15.2 14.9 Primary fiscal surplus 1.5 1.2 2.1 2.4 Interest 6.8 7.0 6.3 5.7 Fiscal balance (- = deficit) -5.3 -5.7 -4.2 -3.3 Grants 1.3 2.4 1.4 0.7 Fiscal balance incl. grants -4.0 -3.3 -2.9 -2.5 Memorandum items: Real GDP growth I-PRSP spending
2.7 3.4
3.3 3.7
4.7 3.9
5.2 4.2
Source: IMF PRGF program, Table 5, IMF (2002). Rounding off error exists. 2.60 Tax revenue is projected to grow by 1.3 percentage points, from 12.8 percent of GDP in FY01 to 14.1 percent of GDP by FY04.9 Achieving this target is to be pursued by a combination of eliminating exemptions, as tax rates are to be lowered as part of tax reforms, and fundamental institutional changes in the CBR, including computerization and moving to a new, anonymous system of assessment, collection and audit. Expected revenue includes a modest contribution from the agricultural income tax introduced two years ago. But the revenue collected so far amounts to less than 1 percent of total fiscal revenues compared to agriculture’s share of 25 percent in GDP. With devolution, and increased responsibilities at the district level, it should be asked whether agriculture should not be asked to provide more. 2.61 Defense spending, which has been on a downward trend throughout the 1990s, fell to 4.5 percent of GDP in FY01. It is projected at 4 percent of GDP in FY02, with a further decline to 3.3 percent of GDP by FY04.10 If regional tensions subside and the Kashmir dispute were resolved, this could provide a further fiscal cushion from a “peace dividend”. Conversely, a new arms race with India could be fiscally disastrous. Clearly the projected redirection of public expenditure, away from defense and interest and back toward the development budget, is fundamental to achieving the growth and social objectives that Pakistan has set for itself. 2.62 Contingent liabilities (CLs) are another crucial topic (Box 5). Assumption of contingent liabilities has been large in the past. The future annual cost could easily amount to 1-1.5 percent of GDP.
9 Total revenue is tax revenue plus non-tax revenue, the main item in the latter being SBP profits. 10 But these numbers exclude pensions; including pensions of about 0.7 percent of GDP would bring these numbers up to 4.7 percent and 4 percent respectively of GDP.

Pakistan Development Policy Review
22
Box 5: Contingent Liabilities (CLs) 11
Contingent liabilities (CLs) may stem from at least four sources: bailouts of nationalized commercial banks and DFIs; losses of state-owned enterprises, of which KESC and WAPDA are the most significant; guarantees; and unfu nded (or underfunded) pension liabilities. The non-performing loans (NPLs) of the banking system in December 2000 amounted to Rs. 282 billion, against provisions of Rs. 133 billion; the unprovided component is about 5 percent of GDP. The losses of state enterprises (among which KESC and WAPDA account for the bulk) amounted to Rs. 27.8 billion in 1999-2000 and an estimated Rs. 28.5 billion in 2000-01, close to 1 percent of GDP. In recent years the fiscal cost associated with various loan guarantees issued by the government has varied from 0.2 to 1.2 percent of GDP. Putting all these together could easily add up to 1.0-1.5 per GDP per year. There are at present no hard numbers available on the likely cost of underfunded pension obligations, but a “pension time bomb” cannot be ruled out in spite of recent reforms, and bears further analysis and monitoring. For FY02, identified CLs amount to Rs 56 billion (Rs 32 billion in KESC losses and Rs 24 billion in bonds to be issued to cover refunds to banks on advance income tax paid), or 1.5 percent of projected GDP, higher than the expected primary surplus of 1.2 percent of GDP. Some of this may be recovered from future privatization proceeds, and one may even argue that for GoP to assume past losses by issuing its own bonds is just making the existing situation more transparent. The crucial point therefore is to prevent further accumulation of losses in banks, avoid new guarantees, and reform KESC and WAPDA. 2.63 Privatization receipts could provide an offset, but privatization may not be easy in the present investment climate. (Moreover, the government will need to recognize the future foreign exchange cost of servicing privatized enterprises bought by foreign investors.) This emphasizes the importance of immediate actions to stem the continuing losses in the state-owned enterprises, notably KESC and WAPDA, through setting prices adequate to cover costs and requiring that bills for services provided are actually paid. Privatization, even when feasible, will involve GoP assuming some of the liabilities of these companies, which will swell the public debt, but this should not be a deterrent if privatization brings better management and hence stems the losses. Postponing privatization would only lead to the assumption of bigger liabilities in the future. 2.64 Interest Payments on Public Debt. Interest on domestic debt has accounted for at least 75 percent of the total nominal amount of interest paid on public debt in recent years. But (as noted in the Pakistan Debt Report) once capital gains and losses from inflation and exchange rate changes are factored in, the real cost of external debt actually exceeded that of domestic debt over the period 1996-99, even though the nominal interest rate on external debt was much lower. The real cost of external debt was abnormally large in FY01 because of the large depreciation of the rupee. It is usually likely to be less in the future, although some depreciation may be needed to maintain adequate competitiveness. Another helpful factor is that the NPV of Paris Club debt was reduced by $2.7 billion by the December 2001 agreement (see below). Over the PRGF period, domestic interest costs are likely to be more serious, especially since substantial zero-coupon NSS instruments issued over 1993-99, when returns were set at arbitrarily high levels, will be falling due over the next several years.12 2.65 A few changes have been made to lower domestic debt costs. Returns to NSS were subject to three cuts after May 1999, and in early 2001, were linked to the market-based yields on Pakistan Investment Bonds (PIBs), which were launched in December 2000. Further, in March 2000, institutional investment in NSS was banned, with PIBs providing the alternative.
11 This estimated fiscal impact of CLs is based on Box 7 of the Parvez Hasan Report and Table 3, Annex-I, page 254, of the 2000-01 Economic Survey. 12 Interest payments on these zero-coupon instruments are counted only when they mature, or are redeemed. We do not have the necessary data on the maturity structure or implied interest payments of these zero coupon instruments to examine the cash flow implications.

Pakistan Development Policy Review
23
2.66 Yields on treasury bills have fallen by about 5 percentage points compared to their level in August 2001, to about 6 percent, while those on PIBs have fallen by 2-3 percentage points since their inception in December 2000, to levels of 10-11 percent. This has been helped by the doubling of SBP’s reserves after September 11th. The rupee/dollar rate has strengthened by about 6 percent and inflation fell to less than 2 percent on a 12-month basis by December 2001. Does this decline reflect improved fundamentals and confidence, or is it a one-off event? Discussion with market participants suggests that, while fiscal and growth fundamentals have clearly not yet registered tangible improvement, and indeed suffered a setback consequent upon September 11th, the fiscal, structural and governance reforms that have been in process over the last two years are growing in credibility. Considerable confidence was expressed in the “Economic Team” and the reforms being implemented. This has been reinforced by what is perceived as lower polit ical risk after Pakistan joined the international coalition following September 11th, improving its image abroad while assuaging concerns about the influence of fundamentalist groups at home. This interpretation is supported by the observation that even the auction-based primary market yields on 10-year PIBs have fallen by 2 percentage points compared to December 2000. However, given the record of such past actions as the freezing of foreign currency deposits, considerable uncertainty about macroeconomic prospects, e.g., tax revenues, CLs, growth, a still heavy debt burden and a difficult reform agenda, it would be premature to declare victory.
2.67 Growth. The I-PRSP (on which the PRGF program is based) projects growth rising to 5 percent by FY04, but it is not clear that there is as yet any analytical basis for projecting such an improvement. Indeed, the I-PRSP (Box 4.1) estimates that the drought already cost Pakistan 2.2 percent off the growth rate in FY01, and the drought is not yet over. The growth outlook is further discussed in Chapter 3.
Box 6: Public Debt Dynamics In a simple world where the primary fiscal account is in balance and the real interest rate equals the growth rate of real GDP, the debt-to-GDP ratio remains constant. However, if real interest rates exceed growth rates, then the only way to avoid an increase in the debt-to-GDP ratio is to generate primary surpluses. In this case, the primary surplus needed to keep debt-to-GDP constant is given by the formula (r-g)d, where r is the composite real interest rate on domestic and foreign debt, g is the growth rate and d is the prevailing debt-to-GDP ratio. There are also other factors that come into play, either diminishing borrowing needs (such as privatization revenues) or augmenting the need to borrow (such as to meet contingent liabilities). The difference equation for public debt in the extended case is given by: (1) dt +1 = dt + (pdt+1 – pvtzn t+1 + clt+1 - grants t+1 )+ dt (r – g)/(1+g), where: d t +1 is the ratio of end-of-period public debt to GDP for period (t+1), d t is the value for the previous period, pd t+1 is the ratio of the primary fiscal deficit for period (t+1) to GDP, and pvtzn t+1 that of privatization revenues to GDP, clt+1 the fiscal cost of contingent liabilities to GDP, and grants t+1 that of grants to GDP, respectively.13 2.68 Illustrative Debt Dynamics. Table 2.3 presents five scenarios based on Box 6, assuming that all variables, except the debt ratio, are constant over time. In the table, do is the initial public debt-to-GDP ratio and is set equal to 1.0, as net public debt (public debt minus government deposits in the banking system) is approximately 100 percent of GDP today, and d10 is its value after 10 years. The base case Scenario 1 takes the primary fiscal surplus at 2 percent of GDP, which is less than the level of 2.4 percent to be achieved by FY04 under the PRGF, assumes small privatization revenues, significant contingent liability costs offset by grants, and growth of 4 percent, less than the 5.2 percent for FY04 under the PRGF. Critically, the real interest rate is held at 5 percent, which was the average over 1996-99 (Box 4 of the Pakistan Debt Report), which should be attainable if confidence is maintained. In this case, the ratio of public debt to GDP declines by 14 percentage points over 10 years. The decline would be a more significant 20-percentage points if CLs were halved (as in scenario 2). Scenario 3 shows the impact of
13 Note that seigniorage is already captured in the primary fiscal balance, which includes SBP profits as a component of non-tax revenue.

Pakistan Development Policy Review
24
keeping the primary surplus at a level of 2.5 percent of GDP, close to the target of FY04, while scenario 4 brings out the combined effect of an increase in growth to 4.5 percent and a 2.5 percent primary surplus – a reduction of 24 percentage points. In Scenario 5, this effect is augmented to 29 percentage points if in addition CLs are halved. But even in this best case the debt/GDP ratio does not decline to the 60 percent level set as a maximum by the Maastricht Treaty in the EU by FY04.
Table 2.3: Illustrative Public Debt Scenarios
Feature(s) d0 pd pvtzn cl grants r g d10
Scenario 1 Base case 1.0 -2.0 0.3 1.0 1.0 5.0 4.0 0.86
Scenario 2 CLs halved 1.0 -2.0 0.3 0.5 1.0 5.0 4.0 0.80
Scenario 3 Bigger primary surplus 1.0 -2.5 0.3 1.0 1.0 5.0 4.0 0.80
Scenario 4 Bigger primary surplus, higher growth 1.0 -2.5 0.3 1.0 1.0 5.0 4.5 0.76
Scenario 5 Bigger primary surplus, higher growth, lower CLs
1.0 -2.5 0.3 0.5 1.0 5.0 4.5 0.71
Balance of Payments Sustainability and Paris Club Agreement 2.69 Over 1990-99, the cumulative current account deficit was $32 billion, averaging 6 percent of GDP.14 While current account deficits create room for more investment, a prolonged period of “twin” fiscal and current account deficits is usually unsustainable, since real interest rates rise and investment gets crowded out as the country’s overall financing constraint becomes binding. Fiscal deficits fed into current account deficits and the external debt problem became part of the public debt problem. Public and publicly guaranteed external debt grew from a total of $19 billion in 1990 to $31 billion by 2001. External vulnerability increased, and Pakistan was able to stave off a crisis only by freezing and forcibly rolling over foreign currency deposits and rescheduling Paris Club debt. At the end of FY00, gross official reserves were less than a billion dollars, and even though reserves increased to $1.7 billion by the end of FY01, this was only 36 percent of short-term external debt, and about 7 percent of broad money. By this point, public external debt had a NPV of 270 percent of exports of goods and services. 15 2.70 International liquidity, actual and prospective, improved after September 11th. The increased scrutiny of bank accounts announced by several countries is believed to have induced both a repatriation of flight capital and increased use of the official interbank market (as opposed to the more risky kerb market). At the same time, the kerb market premium over the official rate has almost vanished. SBP seized this opportunity to buy reserves, which have doubled from $1.7 billion on June 30, 2001 to $3.4 billion on March 1, 2002, including an inflow of about $777 million in grants, largely on account of Pakistan’s role in the war against terrorism. A new agreement providing substantial cash flow relief was struck with the Paris Club in December 2001. In contrast to earlier agreements, this one considered the whole debt stock, not just payments falling due during the respective IMF program period. This agreement is expected to lower the NPV of external debt from 270 percent of exports on September 30, 2001, to 240 percent. The projected increase in exports (although less than that called for by the Pakistan Debt Report) should reduce this further to 210 percent by the end of FY04.16 At the same time, the agreement is expected to provide gross cash flow relief of about $3.6 billion ($2.8 billion net of
14 A lower number will be obtained if increases in resident foreign currency accounts are treated as a receipt instead of as a financing item, as the Parvez Hasan report rightly notes. 15 These numbers are from Table 8 and Box 3, IMF (2002). 16 These numbers are from Box 3 and Tables 6 and 7 of IMF (2002). External MLT PPG debt, which has a face value of $29.9 billion, had a NPV of $24.8 billion before the December PC agreement that fell to $22.1 billion after it ($2.7 billion relief in present value terms).

Pakistan Development Policy Review
25
moratorium interest) during the program period (FY02-FY04). Official reserves are targeted to go up to $4.6 billion by the end of FY04, while net lending from the IFIs is expected to amount to $3.6 billion over this period. Table 2.4 summarizes gross financing requirements over the PRGF period, and also shows the steady decline of external debt burden indicators.
Table 2.4: Gross Financing Requirements, FY02-FY04
2001-02 2002-03 2003-04
Exports fob 8914 9588 10351 Imports fob -9780 -10496 -11187 Services (net) -2957 -3095 -2990 Private transfers (net) 2459 2345 2469 Official transfers (net) 1491 925 241 Current account 127 -733 -1117 Debt amortization (incl. IMF) 6077 4609 4375 Gross reserves (- = increase) -1284 -1146 -923 Gross Financing Requirement 7234 6487 6414 FDI and portfolio investment 303 785 1000 Private debt financing 3051 2255 2032 Multilateral (AsDB, IMF, WB) 2177 2124 2094 PC debt relief (incl. moratorium interest) 1251 1223 1089 Other net 453 0 0 Financing Gap 0 100 200 Memorandum items PPG external debt as % of XGNFS Amortization and interest on MLT PPG ext
debt as % of XGNFS Total external debt as a % of GDP
317
36 60
298
32 57
277
28 54
Based on Tables 2, 6 and 7, IMF (2002). 2.71 Roughly 50 percent of the gross financing requirement comes from multilateral and bilateral official sources, while the share of private sources falls from 42 percent to 34 percent and 32 percent respectively for the three years. While the amount of private financing may appear large at first glance, on a net basis, the required flows are much smaller, namely, $76 million, $16 million and $560 million respectively for the three years. 2.72 Real Exchange Rate. In spite of the purchase of more reserves, the rupee/dollar rate appreciated by about 6 percent in nominal, and 7 percent in real terms, since September. While such appreciation lowered the debt-to-GDP ratio, it tends to undermine the competitive gains realized through the depreciation of FY01. Indeed, given the relief on external debt as a result of the Paris Club agreement, the trade-off in managing the exchange rate between making debt statistics look better and the competitiveness of exports and growth stimulus should favor the latter over the next few years. Conclusions 2.73 Pakistan’s public debt burden is an impediment to increasing outlays for social and public infrastructure expenditures. While there is little chance of attaining sustainable public debt levels over the horizon of the 3-year PRGF program, there is a good chance of putting the debt ratios on a favorable downward trajectory, provided the fiscal, structural and social reforms Pakistan has embarked upon are diligently implemented. This would lay the foundations for enhanced credibility and hence lower domestic interest rates, and create a more favorable investment climate. The December 2001 Paris Club agreement and the concurrent IFI package essentially give Pakistan three years of breathing space to lay the foundation for sustainable growth. There remain a number of critical issues, including interest costs
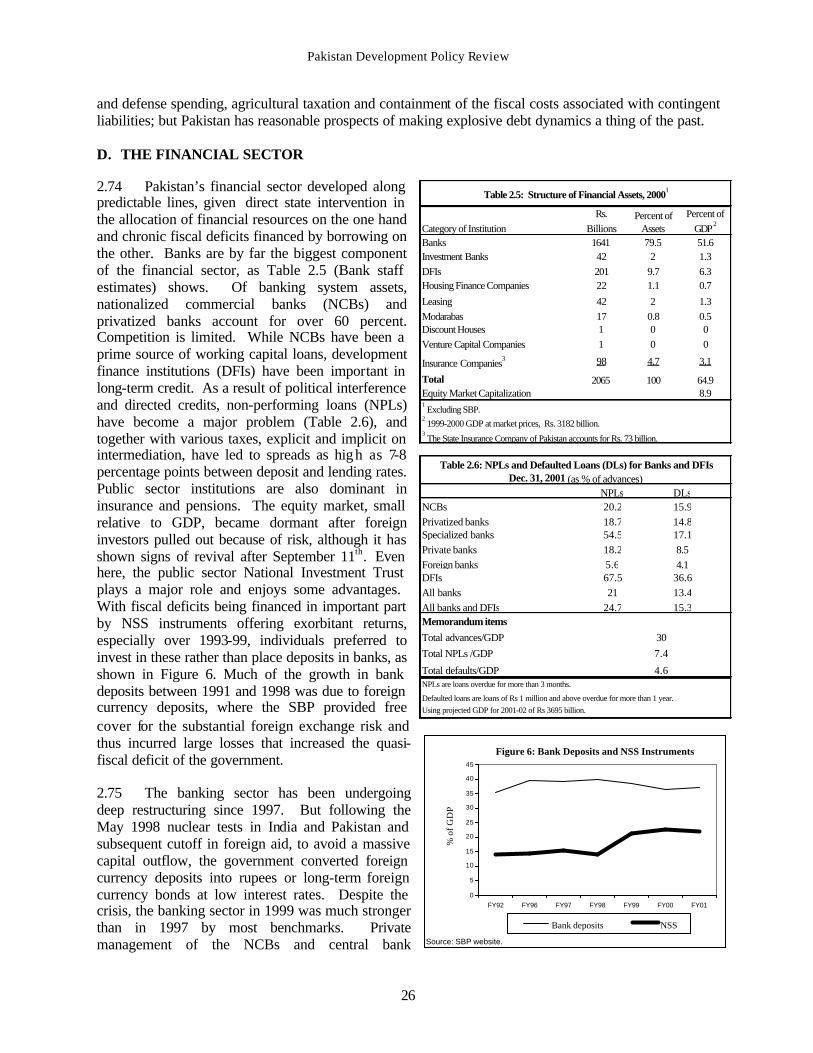
Pakistan Development Policy Review
26
Rs.Billions
Banks 1641 79.5 51.6Investment Banks 42 2 1.3DFIs 201 9.7 6.3Housing Finance Companies 22 1.1 0.7
Leasing 42 2 1.3Modarabas 17 0.8 0.5Discount Houses 1 0 0Venture Capital Companies 1 0 0
Insurance Companies3 98 4.7 3.1
Total 2065 100 64.9Equity Market Capitalization 8.91 Excluding SBP.
2 1999-2000 GDP at market prices, Rs. 3182 billion.
3 The State Insurance Company of Pakistan accounts for Rs. 73 billion.
Table 2.5: Structure of Financial Assets, 20001
Category of InstitutionPercent of
AssetsPercent of
GDP2
NPLs DLsNCBs 20.2 15.9Privatized banks 18.7 14.8Specialized banks 54.5 17.1Private banks 18.2 8.5Foreign banks 5.6 4.1DFIs 67.5 36.6All banks 21 13.4All banks and DFIs 24.7 15.3Memorandum itemsTotal advances/GDPTotal NPLs /GDP
Total defaults/GDP
Defaulted loans are loans of Rs 1 million and above overdue for more than 1 year.
4.6NPLs are loans overdue for more than 3 months.
Using projected GDP for 2001-02 of Rs 3695 billion.
Table 2.6: NPLs and Defaulted Loans (DLs) for Banks and DFIs Dec. 31, 2001 (as % of advances)
307.4
Figure 6: Bank Deposits and NSS Instruments
0
5
10
15
20
25
30
35
40
45
FY92 FY96 FY97 FY98 FY99 FY00 FY01
Source: SBP website.
% o
f GD
P
Bank deposits NSS
and defense spending, agricultural taxation and containment of the fiscal costs associated with contingent liabilities; but Pakistan has reasonable prospects of making explosive debt dynamics a thing of the past.
D. THE FINANCIAL SECTOR
2.74 Pakistan’s financial sector developed along predictable lines, given direct state intervention in the allocation of financial resources on the one hand and chronic fiscal deficits financed by borrowing on the other. Banks are by far the biggest component of the financial sector, as Table 2.5 (Bank staff estimates) shows. Of banking system assets, nationalized commercial banks (NCBs) and privatized banks account for over 60 percent. Competition is limited. While NCBs have been a prime source of working capital loans, development finance institutions (DFIs) have been important in long-term credit. As a result of political interference and directed credits, non-performing loans (NPLs) have become a major problem (Table 2.6), and together with various taxes, explicit and implicit on intermediation, have led to spreads as high as 7-8 percentage points between deposit and lending rates. Public sector institutions are also dominant in insurance and pensions. The equity market, small relative to GDP, became dormant after foreign investors pulled out because of risk, although it has shown signs of revival after September 11th. Even here, the public sector National Investment Trust plays a major role and enjoys some advantages. With fiscal deficits being financed in important part by NSS instruments offering exorbitant returns, especially over 1993-99, individuals preferred to invest in these rather than place deposits in banks, as shown in Figure 6. Much of the growth in bank deposits between 1991 and 1998 was due to foreign currency deposits, where the SBP provided free cover for the substantial foreign exchange risk and thus incurred large losses that increased the quasi-fiscal deficit of the government.
2.75 The banking sector has been undergoing deep restructuring since 1997. But following the May 1998 nuclear tests in India and Pakistan and subsequent cutoff in foreign aid, to avoid a massive capital outflow, the government converted foreign currency deposits into rupees or long-term foreign currency bonds at low interest rates. Despite the crisis, the banking sector in 1999 was much stronger than in 1997 by most benchmarks. Private management of the NCBs and central bank

Pakistan Development Policy Review
27
independence were responsible for strengthening the banking system to withstand the FCD stock. NCBs offered new attractive deposit products such that most FCDs were converted to rupees rather than dollar bonds, thereby extinguishing quasi-fiscal deficits rather than postponing their reckoning. Cash recovery on the loan defaults totaled Rs 70 billion during 1997-99, about one-third of the stock. The public sector banks cut operating losses by reducing staff by 30 percent and closing 500 loss-making branches. The new banking-court system processed 22,000 out of 52,000 loan default cases rapidly. The share of NPLs started to stabilize due to intensified recovery and work-outs and to better quality new loans. These measures, along with capital injections and substantial strengthening of disclosure standards, regulation, and supervision, improved the banks’ capital adequacy, asset quality, efficiency and profitability. Nonetheless, the public sector banks remained unprofitable taking into account provisions on their large NPLs. The public sector institutions remained dominant and the reform process slowed.
2.76 In mid-1999, interference in the banking system began to increase again through new, centrally mandated credit programs. Loan recovery slowed and bankruptcy procedures halted. Banks’ provisioning rules were weakened. Full privatization did not materialize, due, on the one hand, to weak market conditions, the country's deteriorating foreign investment climate and lack of sustained efforts, and, on the other, to the banks’ high cost operating structures and depleted balance sheets. The DFIs also remained unreformed but had ceased to provide significant new loans. The insurance and pension systems remained dominated by public sector institutions that invested mainly in government paper. Current Developments and Policies 2.77 Loan recovery efforts were intensified again in early 2001. Contingent liabilities (CLs) stemming from NPLs and the need to re-capitalize banks have become a serious fiscal problem. However, there is a plus side to CLs in the sense (a) that they have come to the fore partly as a result of stricter standards and better supervision; and (b) they create a compulsion for drastic change. As SBP’s strategy document notes, “The old model of long-term project financing through public sector owned and managed DFIs or specialized banks has become redundant and outdated…..Non-performing assets of DFIs and specialized banks account for 65 percent of their total advances thus affecting the overall quality of banking system assets” (SBP 2001b). The vision for the sector is for a market-oriented, predominantly private system that operates under a strong regulatory framework, is supported by an effective legal and judicial system, and intermediates resources in response to price signals, independently of vested interests. Further, as noted in Ch 2.3, PIBs were launched in December 2000 to replace FIBs and offer a market benchmark for the pricing of NSS instruments, which should reduce the disintermediation caused by exorbitant NSS returns. Institutional investment in NSS was banned in March 2000. A corporate bond market has begun to operate recently. 2.78 Privatization of NCBs is now high on the agenda. GoP plans to finish privatizing the partly privatized banks (as of 2001, the government had sold its remaining shares in MCB), and is seeking to find strategic investors for Allied Bank and UBL. It intends to fully privatize HBL and UBL, with risk-mitigating arrangements in view of their weak balance sheets. It also plans to take major steps towards preparing the National Bank of Pakistan, which now acts as an agent for the treasury as well as a commercial bank, for privatization. The DFIs are to play a much smaller role, with their numbers reduced to three, covering small industry, housing finance and small agriculture. The biggest one, NDFC, has been closed. With potential buyers of the banks reluctant to take on the management time and political and social risks of operational restructurings as well as the costs of balance sheet restructurings, the government is playing a major role in these operational restructurings, with the objective of substantially reducing staffing and the number of branches. 2.79 To improve loan recovery and facilitate privatization, the government also established an asset management agency, the Corporate and Industrial Restructuring Corporation (CIRC), which assumed all

Pakistan Development Policy Review
28
private sector NPLs over Rs. 10 million, starting with those that already have court orders for execution. With special legal powers, the CIRC is expected to be more successful in liquidating and disposing of assets than the banks. Together with an improving foreign investment climate, the expected economic turn-around, a more determined sales effort and assistance by top-notch financial advisors, this approach to bank privatization is expected to improve the outcomes. However, when the banks are sold, the government will have to recognize losses in the banks and DFIs related to shortfalls in provisioning and unfunded pension liabilities for bank staff. 17 Altogether these losses could require injections of between US$ 4 billion and US$5 billion of new government debt.
2.80 GoP has reduced the implicit and explicit taxes on banks. Specifically, it reduced the liquidity requirement (to 15 percent) and cash reserve requirement (to 5 percent), allowed future provisions to be deducted from taxable income, and reduced the 58 percent tax rate on banks’ income to 50 percent (still much higher than the 35 percent rate on other corporations). The government also still imposes a 30 percent withholding tax on interest on government securities and a 2 percent turnover tax. It has attempted to encourage competition by liberalizing branch opening and closure policy, which will mesh with the planned reduction in public sector bank branches. It has also removed the restriction that foreign currency deposits be placed in SBP, and replaced the illiquid tax refund claims with government bonds.
Directions for Further Reforms 2.81 Strong regulation and supervision are critical in a private financial system to reduce moral hazard. Currently, all the smaller private banks can operate profitably within the large spreads that the public sector banks need. Once the public sector banks are restructured and privatized, they will increase competition, creating pressure for the number of banks to decline. A prompt corrective action framework will be critical to ensuring that this decline occurs at minimal cost to the government.
2.82 Another area for improvement would be in recognizing and provisioning of NPLs. A higher capital requirement also would be desirable to reduce moral hazard. If an 8 percent figure applies in more developed, less risky markets, a higher figure would be desirable for Pakistan. India and Sri Lanka have raised the capital adequacy requirement from 8 percent of risk-weighted assets to 10 percent. It would also be desirable to increase the minimum capital requirement of existing banks, as well as new ones, to encourage mergers into larger, less risky institutions. Finally, of course, all these regulations will need to be enforced by high quality supervision, an area where Pakistan has made some improvements already by bringing in some new supervisors, but needs still more, and by avoidance of political interference. 2.83 Regulation and supervision of the non-bank sector also needs improvement. The need to make the Securities and Exchange Commission of Pakistan (SECP) more effective has been recognized in the Capital Markets Development Program of the AsDB. While a start has been made, many of the reforms remain to be implemented. The SECP does not yet have the capability to inspect capital market institutions. The stock exchanges, which are supposed to be self-regulatory, have yet to introduce licensing standards for brokers and minimum qualifications for professionals in the securities industry. 2.84 Issues in regulation and supervision of non-banks (under the SECP) include protection of the general public from risky operations, avoidance of regulatory arbitrage, and reducing the fragmentation of the financial system, some of which is due to regulation. A recent review of NBFIs carried out jointly by SBP and SECP concluded that the old model of NBFIs with a variety of separate, compartmentalized, specialized institutions, such as leasing, investment banks, and DFIs led to fragmentation of the financial sector and a proliferation of institutions with inadequate capital. The legal and regulatory framework for non-banks can be sharpened by focusing on the liabilities side of financial institutions, and clearly
17 The CIRC will not replace the loans they take over from the banks and DFIs with government bonds until these institutions are privatized or after three years, whichever is sooner, so as to ensure that the process does not result in premature recapitalization.

Pakistan Development Policy Review
29
demarcating borrowing from the general public (“widows and orphans”), in whatever form, from borrowing from sophisticated and institutional investors (“smart money”). Commercial banks are the principal mobilizers of retail deposits from the general public, and the public may have some expectation of government backing of deposits; as such they are tightly regulated and supervised by the central bank. In non-banks, it would be more desirable to limit risks to the general public by limiting the non-bank institutions’ ability to raise money from unsophisticated investors, not by limiting their business lines, which can easily lead to fragmentation rather than reduction of risk. Higher minimum capital would also be desirable. And, of course, the improvements in information quality and disclosure will improve the risk return tradeoff to the public and reduce the potential costs to the government. There is also an increasing danger of regulatory arbitrage. Investments in equities, modarabas, annuities, or other insurance products are alternatives to a bank deposit. A short term fixed certificate of investment with a leasing company or investment bank can compete effectively with deposits offered by a commercial bank. Hence efforts are needed to limit regulatory arbitrage between instruments. 2.85 Directed Credit and the DFIs. Despite the liberalization, a few major mandatory and subsidized credit programs remain in agriculture, locally manufactured machinery (LMM) and export financing, all of which could be phased out. The proposed Export Import Bank might also become an old style DFI if the government’s participation in it dominates that of the private sector. Moreover, government exposures in the eleven DFIs of Rs 125 billion are probably already lost and will not be available to recapitalize the remaining DFIs. 2.86 The programs undertaken in the past to reach the so-called “under-served sectors”--housing, small enterprises, and agriculture-- through directed and subsidized credits and the DFI system have failed. They more often served the politically powerful than their targeted beneficiaries. Moreover, the subsidies to these groups have substantially exceeded the interest subsidies, since the programs experienced large loan defaults. These schemes were justified on grounds of market failure. However, the failure to develop financing for housing, agriculture and small enterprises is more related to a failure to generate information about these sectors: they remain largely in the undocumented segment of the economy, and they lack the possibility of borrowing against collateral. Lending is also impeded by the high cost to the banks of default because of the weak legal and judicial system for enforcing contracts and executing collateral, and the high taxation of financial intermediation. Resolving these problems might go further in providing credit access to under-served sectors than government sponsored credit schemes and dedicated financial institutions. 2.87 Much of the small enterprises’ investment financing needs are being met by the leasing industry, and their working capital requirements by the small private banks. However, this could be happening by default rather than by an explicit market strategy since the current small capital base of these lenders does not allow them to lend to multinationals and large domestic companies. If they grow in size under a more deregulated environment, small enterprises would have to rely on niche players, who might develop since market specialization would be the only recourse for small institutions that don’t have the resources or opportunity to grow big. Promoting this development might lead to more sustainable results in small enterprise financing than going back to the failed DFI approach. 2.88 In rural finance, institutional credit is in short supply, reaching only 10 percent of farmers, mainly larger (and male) farmers, and has declined as a share of agricultural GDP. This is despite growing dependence of agricultural growth on purchased inputs and private capital investment. The ADBP has been the main source of such credit, but has served larger farmers and, with subsidized interest rates and poor loan repayment, has not been financially sustainable (Khandker and Faruquee 2001). Commercial bank credit is negligible , partly because of lack of collateral owing to the outdated land titling system. NGOs have been more successful, following micro credit schemes pioneered by the Aga Khan Rural Support Program and savings and loan associations of the Rural Support Programs. These approaches

Pakistan Development Policy Review
30
could be scaled up to serve small farmers, especially those in more remote areas and risky environments. Women have particular trouble in accessing credit, with the First Women’s Bank Limited being the only formal bank other than the ADBP that makes any attempt to cater to their needs. 2.89 The increased demand for microfinance has brought to the fore the need to secure a sufficient supply of funds for such initiatives on a sustainable and institutionalized basis. Two major on-lending institutions – the Pakistan Poverty Alleviation Fund (PPAF) and the Khushali Bank – have been set up with donor assistance and distanced from the government bureaucracy through the involvement of the NGOs and the private sector. While PPAF lends government money, Khushali Bank borrows from the nationalized banks. The ability to scale up existing programs will require an ability to borrow from formal markets. In keeping with this objective, the SBP has envisaged licensing categories of microcredit institutions at national, provincial and district levels, as public or private limited companies, to allow them to try to raise capital in financial markets. Expansion of the microfinance industry and its integration with the formal financial sector is seen as the key to providing financial services to the rural areas and the poor with adequate outreach and in a sustainable manner. 2.90 Long-Term Finance. There is no obvious market failure in the mobilization of long-term funds. Long-term savings abound in Pakistan’s financial markets, as proven by the long-term NSS. Private financial institutions are now issuing 5-year bonds. The problem is that the government has preempted most of these savings, either directly through the NSS or indirectly through insurance and pension funds that hold mainly government debt, leaving the private sector little access to them. The main lesson of the past is that it would be more effective for the government to remove the obstacles that prevent markets from functioning rather than embarking on its own credit schemes outside the market. The strategy should be to gradually eliminate such crowding-out and establish an institutional framework that encourages, rather than forces, markets and institutions to lend long in a prudent way. 2.91 Islamization. The government’s strategy for implementing the Supreme Court’s decision to transform the financial system to an Islamic one is consistent with its overall financial sector strategy. The government proposes to introduce an Islamic financial system gradually so as not to disrupt the current system and to learn from the experience of other countries. Following its vision for a market-based financial system, the government’s proposed approach is to provide choice to people and let the market work, so that those who want Islamic instruments can easily get them while those who are more risk averse and want to assure capital preservation can likewise have access to such instruments. The modaraba industry is in trouble – principally because of the limitations on its business imposed by regulation, rather than on its funding. In terms of transparency and governance, the building blocks for an Islamic system are the same as those for an interest-based one. In fact, disclosure standards, rating and other information systems, regulatory and supervisory systems, effective courts, and strong corporate governance must be even more stringent for an equity-based system. Work on these elements can only hasten overall reform implementation. In view of what the Court considers to have been good faith efforts by the government to lay down the building blocks for an Islamic system, the Court has agreed to the government’s request to review its decision. E. THE INVESTMENT CLIMATE 2.92 Chapter 1 posed the question: why have the various reforms implemented throughout the 1990s, even before the present government, not elicited a response from the private sector? One might also ask: why has private investment, especially in large-scale manufacturing, fallen in the last two years despite improved macroeconomic fundamentals (growing reserves, a shrinking deficit)? Chapter 1 suggested that the answer to the first question is that the reforms were incomplete, public institutions had become corrupted, and a debt problem was building up. Chapter 2, Section C suggested that the answer to the second question is that, given the track record, credibility is going to take time to establish. There is still

Pakistan Development Policy Review
31
– and will be for some years to come – a serious public debt problem. Will continuity of reform be maintained after the October elections? Will the serious tensions with Afghanistan, and even more with India, be resolved? All these factors are going to inhibit long-run investment until the uncertainty is resolved and policy credibility, which is attained neither instantaneously nor permanently, firmly established. Falling Investment and Exports 2.93 The 1990s witnessed lower business confidence and smaller private investment than in previous decades. Total investment as a share of GDP fell throughout the decade, from around 18 percent of GDP at the beginning of the 1990s to about 13 percent by 2000-01, reflecting declines both in the public sector (government and public enterprises) and in private investment. FDI bucked the trend for a time (because of investment in the power sector), but then fell too. Manufacturing investment has fallen steadily since 1993-94, falling more rapidly among large-scale firms than SMEs. After growing rapidly in the 1970s and 1980s (7.1 percent or more a year), Pakistan’s export earnings (in 1995 US$) fell 1.9 percent p.a. between 1992 and 1999, lagging behind low and middle -income countries and the rest of the South Asia region. This is a major reason why Pakistan’s external debt problem now looks so severe. 2.94 Low rates of private sector investment and the sluggish growth in exports have limited both employment generation and the growth in output. It is natural to ask whether they reflect problems with the prevailing investment climate and incentive regime 18. We illustrate the issues by examining the situation in Pakistan’s major export industry, namely textiles and clothing. We proceed to review developments in trade policy in general, and then examine other major influences on the investment climate including governance, public sector service delivery, and the provision of infrastructure. Textile and Clothing Exports 2.95 The quotas that have for decades constrained trade in this sector, which accounts for some 75 percent of Pakistan’s merchandise exports, are being expanded sharply in the EU and the US in 2001, and growing at accelerated rates until 2004, prior to being phased out in January 2005. This confronts the sector with both a risk and an opportunity. The risk is that Pakistan’s exporters of these products might treat the high quota growth rates of the next three years as an opportunity to increase exports without any need to invest in improved production techniques and technology, and then find themselves even more vulnerable to the shock that abolition of the Agreement on Textiles and Clothing (ATC) in 2005 will represent. The opportunity is that world-class producers will be able to get a head start in expanding their market share without artificial constraints. It is clearly a matter of major importance to Pakistan both for the government to create an enabling environment for the sector and for the industry to respond by raising its efficiency to world-class. 2.96 Pakistan has tended to rely increasingly on a few products and on exports with stagnating unit values, in contrast to the most successful Asian countries. Based on SITC data from the UN COMTRADE system, textiles and clothing accounted for 79 percent of all merchandise exports in 1999 compared to 64 percent in 1980. Pakistan’s exports of textile products increased about 2 percent per year faster than its markets expanded in the 1990s. Within the textiles and clothing group, Pakistan has focused primarily on a relatively narrow set of cotton-based products. Textile policies pursued by successive governments held the development of the textile and clothing industry hostage to the medium staple cotton grown in Pakistan. While this takes advantage of Pakistan’s static comparative advantage in production of cotton, it does little to enhance Pakistan’s export growth prospects, or to reduce its dependence on a single commodity. One impact was to increase the industry’s vulnerability to the cotton- 18 The World Bank is at present engaged in a survey of Pakistan’s investment climate, which should provide more insight into the factors that could stimulate investment.

Pakistan Development Policy Review
32
production shocks that have taken place since 1992-93. Until recently, the textile industry benefited from cheap cotton at the expense of cotton growers through the cotton export tax and export restrictions that were eventually relaxed during the 1990s. Perhaps more significantly, high import tariffs (25 percent to 35 percent) on imports of semi-manufactured textile inputs - particularly protection on polyester which remains at 25 percent - coupled with poorly functioning import duty and sales tax rebate schemes have been a major obstacle to improved export performance and diversification. They penalize the industry for any attempt to expand beyond the narrow and low quality range of yarn and cloth produced locally. Trade Policy Regime 2.97 Pakistan made impressive strides in creating a more open economy in the last decade. The average import tariff declined to just over 20 percent in 2001-02, which is less than half its level in the mid-1990s. Other barriers to trade, such as exchange market distortions and non-tariff barriers, have also been reduced. However, this action falls short of the reductions in protection made by countries such as Indonesia, Mexico, and Philippines with which Pakistan competes in world markets for labor-intensive products (Table 2.7).19 And Pakistan’s market share declined in most exports other than textiles.
Table 2.7: Trends in Simple Average Tariffs, 1985-99 (%)
Country 1985 1990 1995 1998 1999
Bangladesh 23.8 22.2 Brazil 51.0 32.2 11.1 14.6 13.6 Chile 20.0 15.0 11.0 11.0 10.0 China 40.3 16.8 India 81.8 41.0 30.0 32.2 Indonesia 27.0 20.6 9.5 10.9 México 25.2 11.1 13.1 13.3 10.1 Pakistan 77.0 64.8 50.7 46.5 20.4*
Philippines 27.6 27.8 20.0 10.7 10.1 South Africa 11.0 6.2 7.2 8.5 Taiwan, China 26.5 9.7 11.2 8.8 Thailand 41.2 39.8 23.1 20.1 17.1 European Union 8.7 6.8 6.0 5.6 Japan 6.3 5.5 5.2 United States 6.3 5.9 5.2 4.8 Average of all Developing Countries 27.2 23.2 16.1 13.1 11.3 Average Industrial Countries (23) 7.9 6.4 5.4 5.0 Source: F. Ng, Trade Team, World Bank www.worldbank.org/trade. Note: * indicates 2000-01 tariff for Pakistan from WTO (2002)
2.98 While changes in average tariff rates are important, they do not tell the full story because the rates actually applied were reduced for individual users by statutory regulatory orders (SROs).20 SROs have diminished somewhat in importance since 1997, but are still responsible for a 30 percent difference between what would have been collected if all imports had paid the full statutory duty and what was actually collected. Most of the reduction in the importance of SROs is related to the demise of location driven incentives (Special Industrial Zones) and energy related incentives (Independent Power Producers). The major remaining SROs fall within chemicals and engineering, and mostly target automobile assembly. But while SROs reduce the average level of protection, they do so in a way that opens the door to administrative discretion and rent-seeking.
19 By the time its WTO commitments have been phased in, China will also have substantially lower protection than Pakistan. 20 The statutory regulatory order (SRO) is the basic instrument used extensively by Government to make changes on a day-to-day basis and for directed incentives.

Pakistan Development Policy Review
33
2.99 Despite the general movement towards lower and fewer tariffs, a few significant domestic industries continue to benefit from high or even increased protection. For example, high import duties are maintained for steel (25-35%) and polyester fibers and fabrics (25 to 35%), and import tariffs were raised for tin plates in 2001 to 35%. The tariff on steel is a burden to the engineering industry while that on polyester is an obstacle to modernization of the textile industry. The government’s Textile Vision 2005 study (Government of Pakistan 2000) recommended its abolition, along with abolition of all other tariffs and non-tariff barriers on all textile items, from cotton to garments. Policy Uncertainty, Political Instability, and Law & Order 2.100 The investment climate in Pakistan has in the recent past been characterized by frequent unanticipated policy changes, exacerbated by domestic and regional political instability. Pakistani and foreign industrialists often cite this as an important contributing factor to the decline in domestic and foreign investment in the country. Policy uncertainty was in part a function of the macroeconomic crises of the late 1990s, but it also stemmed from policy slippages and reversals by successive governments throughout the decade. Trade policy, involving frequent changes in import duties, rates of duty drawbacks, or sales tax rebates to exporters, has been a particular source of complaint. The changes are effected through the issue of new SROs or the suspension of existing ones. The moves to phase out SROs are therefore a welcome contribution to increased stability. 2.101 Policy reversals in Pakistan have often been precipitated by sudden and unanticipated changes in government. Even in the absence of changes in policy, however, political shocks can create expectations of impending shifts in policy. Unanticipated changes of government of the sort that have characterized Pakistan in the past can therefore harm growth prospects. Although complaints about political instability are largely quiescent for the moment, there are apprehensions that the problem may return after the elections in October. The recent war in Afghanistan and other results of September 11th, and the current military and diplomatic standoff with India, are also bound to hurt the investment climate. Conversely, however, the prospect of a major international effort to finance the reconstruction of Afghanistan should have some spillover benefits for Pakistan. 2.102 The investment climate has also been prejudiced by widespread problems with law and order, particularly in Karachi, where businesses face problems ranging from petty theft to organized crime and sectarian violence. While the level of violence subsided in recent years, this may be because many businesses have resigned themselves to paying "protection money", not only to "the usual suspects" but also to the police. The problem is basically one of governance, involving the decay of law enforcement institutions in general and police corruption in particular.
2.103 SMEs are highly critical of what they perceive to be harassment by bureaucrats (mostly provincial ones) seeking bribes, with the CBR usually being the most bitterly criticized central government department. Box 7 outlines a Russian attempt to confront the same problem.

Pakistan Development Policy Review
34
Box 7: Registry of Visits to Enterprises by Inspection Authorities – A Russian Idea
A common complaint of the owners of SMEs is that they are frequently harassed by inspectors who visit on the pretext of upholding the law (taxes, boiler maintenance, worker and fire safety, etc.), but actually in the hope of obtaining a bribe. While legitimate visits are clearly necessary to uphold the law and protect workers, rampant abuse can waste the time of small business owners, not to mention increasing their costs. This sort of problem is not unique to Pakistan. Indeed, during a study of one of the Russian regions after the 1998 crisis, when financial resources had become scarce, the authorities realized that stimulating small businesses could serve two important purposes: absorb workers being laid off by large, Soviet-era enterprises; and provide an additional source of fiscal revenues. The Deputy Governor of the region came up with the idea of protecting SMEs from unnecessary harassment by inspectors through the simple expedient of introducing a Registry in which all visits, their findings and follow-up actions would be duly recorded. Filling in the register would be a legal requirement, thus helping keep track of repeated, unnecessary visits. As it turned out, this has now been enshrined in a Federal Law, No. 134-FZ of August 8, 2001. This idea could be adopted in Pakistan, with each SME receiving such a registry from the Government when it first registers, with a legal requirement that the register be filled out by all visiting inspectors.
Infrastructure
2.104 Power supply is chronically unreliable and to boot rather expensive so far as industrial consumers are concerned. High power tariffs are partly a legacy of what now seem to have been unreasonably favorable pricing concessions given by the government to foreign investors in power generation in the early 1990s. Despite that investment, the power sector remains largely under government control through WAPDA, the corporatized successor entities of WAPDA's power wing, and KESC. Supply shortages arise from under-investment in transmission and distribution capacity, and the SOEs seem content to acquiesce in practices that deny them the financial resources to make proper levels of investment in maintenance and new capacity. Specifically, the practice of subsidizing household and farm consumption at the expense of industry and commerce, and the failure of power companies to collect their bills, impose losses on KESC and WAPDA, in part because they oblige companies to build expensive captive power plants that then cut into the market for power.21 Any solution will need to tackle both the problem of cross subsidies, by raising the rates to households and farmers, and ensure that bills are collected in full and on time. An advantage of private ownership is that it would sharpen the incentive to collect bills (on which some effort is already underway) and increase pressure for the elimination of cross-subsidies. 2.105 State enterprises dominate the transport sector (railways, airlines, port) other than road transport services. Similarly production, transmission, and distribution of oil and gas are all dominated by state owned or state controlled joint ventures, with the state sector accounting for more than 80 percent of gas production and holding extensive assets in refineries as well as transport and retail outlets for petroleum. A state monopoly runs the sole provider of fixed telecom services. As in the case of the power sector, these state monopolies provide poor services, often at high cost, which directly translates into low productivity and growth in private industry and lost export markets. Again as in the power sector, the mechanism by which state monopoly has led to escalating cost of services in transport and the oil and gas industries is under-investment in maintenance and/or in new capacity. This under-investment can again be linked to some anti-industry cross-subsidy scheme aimed at benefiting households, farms, or some narrow interest groups within industry itself. In the case of the oil and gas industry, under-investment is evident in the under-exploitation of natural gas reserves and, perhaps more importantly, in the shortage of transmission capacity, and can largely be traced to massive subsidies to the fertilizer industry, refineries and households. The government has recently announced its intention to phase out all gas subsidies except those to the fertilizer industry. The ambitious agenda for privatization that is being pursued by the Ministry of Privatization should help ensure that similar problems do not recur in the future. 21 An informed estimate is that spending on captive power plants may amount to as much as 8 percent of investment in manufacturing industry.

Pakistan Development Policy Review
35
2.106 General disruption of telephone services or gas supplies occurs rarely, if at all, and there is not much complaint from the business community on that score. However, getting connected to service lines in either sector is a major undertaking for starting businesses, invariably involving the payment of large sums in "speed money" that smaller enterprises can find prohibitive. Most areas of industrial concentration being far away from the country's ports, inland transport cost would in any event constitute a significant problem for the competitiveness of Pakistan's exporting industries. However, domestic freight costs are far higher than they need be because of poor, and poorly maintained, roads and a fast diminishing rail transport industry of exceedingly unreliable and poor services. This is compounded by high costs at the main ports in Karachi and Qasim, where freight handling costs are estimated to be 1.5 times higher than in Bombay and 4.5 times higher than in Colombo. 2.107 A policy development that does not sit well with the recent trend towards a modern market economy is the "New Fertilizer Policy" that the government announced in August 2001. This has raised the price of the variety of natural gas used as the main input for the industry's major output, urea, which had been artificially kept very low since the early 1990s in order to encourage the growth of the industry. With the subsequent decontrol of the price of urea, the rationale for fixing its input prices also disappeared. However, the new policy at the same time guarantees the supply of natural gas to the fertilizer industry at prices that are well below its opportunity cost in the power industry. Neither the alleged volatility of fertilizer prices nor the need to honor promises made to the industry in the past can justify this reversion to the old practice of subsidies to special interest groups. The first of these arguments would at most justify export controls at times of high world prices. The second could more efficiently be met by a budgetary subsidy than by diverting scarce gas to where it cannot command a premium price.
Information Technology 2.108 One of the sectors that the government is hoping will develop rapidly in the future and generate substantial employment is software. At the moment there is a modest IT sector focused on the domestic market based in Karachi, and a nascent software export industry located in Lahore. Large numbers of young people are receiving training in IT. The longstanding weakness in telecommunications has recently begun to be addressed. There seems no reason why this sector should not thrive provided that telecoms continue to progress, which will be more assured if the sector is finally privatized. The Rural Non-Farm Sector 2.109 As an economy grows, non-farm activities become progressively more important relative to agriculture in the countryside, and an increasing number of these activities tend to sell their output to the non-farm sector of the economy. At present, however, there are few activities other than handicrafts that do not serve agriculture either directly or indirectly, and so the prosperity of the rural non-farm sector ultimately depends on that of agriculture. To be able to serve agriculture efficiently, the rural non-farm sector needs decent local infrastructure (primarily local roads and electricity) and access to functioning social services. These other activities are particularly important in terms of providing economic opportunities to women, whose opportunities in agriculture are limited by the dominance of men in the ownership of land. But today rural prosperity in Pakistan is primarily a function of agricultural fortunes, and so it is to that topic that we now turn. F. AGRICULTURE IN AN ERA OF WATER SCARCITY
2.110 Agriculture is central to Pakistan’s economy. It employs nearly half the labor force, accounts for a quarter of GDP, and supports, directly or indirectly, nearly two-thirds of exports. It is also critical to poverty reduction in rural areas, where 80 percent of the poor live. And since Pakistan probably has the

Pakistan Development Policy Review
36
largest percentage of its land irrigated of any major agricultural producer in the world, irrigation is central to its agriculture. Sectoral Performance: Unrealized Potential and New Challenges 2.111 Over the past 20 years, the agricultural sector has grown at an average rate of 4-5 percent annually, higher than the average for South Asia, and for low-income countries in general. The fastest growing sub-sectors in the past two decades have been cotton, livestock (especially poultry and milk), and fruits and vegetables. However, since 1985 agricultural growth has become more unstable due to pest epidemics, especially in cotton, exposure to fluctuating world prices with market liberalization, and, more recently, severe drought. 2.112 Beginning with the Green Revolution in the 1960s, agricultural growth has largely come from adoption of modern inputs, especially high yielding varieties, fertilizer and pesticides, combined with expansion of irrigated water supplies. The adoption of this technology has reached high levels, with 80 percent of land irrigated, over 90 percent of the area of the major crops under modern varieties (sugar cane is the exception), and fertilizer consumption of over 100 kg/ha. During the period 1970-95, input growth accounted for two thirds of output growth and total factor productivity (TFP) growth for the remaining one third, with technical change, infrastructure and education being the major drivers of TFP growth (Ali and Byerlee 2000).
2.113 Although Pakistan has experienced above average agricultural growth rates for low and middle -income countries even in the 1990s, a number of major problems are now evident. The Green Revolu tion strategy has been largely exhausted, with limited further prospects of increasing land area and water supplies, yet the productivity of the sector is still low in terms of efficiency of use of resources and inputs.22 Water has become the major factor limiting further growth, and land and water resources have been degraded—in the Punjab, resource degradation in the form of waterlogging and salinity, and soil nutrient mining, reduced TFP growth by one third from 1970 to 1995 (Ali and Byerlee 2000). 2.114 The I-PRSP emphasizes that the GOP has resolved to make agriculture a priority sector in its strategy to accelerate economic growth and reduce poverty. This is going to require a number of new strategic directions, chosen to exploit its comparative advantage in producing most crops (oilseeds, tea, and sugar are the main exceptions), and for expanding into high value export markets. With limited prospects for expanding land area and water supplies, growth must increasingly rely on improved management and technology to increase the productivity of existing resources and inputs.
Strategies and Policies for Accelerating Growth 2.115 The GOP recently updated an agricultural strategy23 that summarizes the current policy approaches to agriculture. It is also preparing a water resources policy and drainage strategy. These strategies indicate important new directions in Pakistan’s agricultural and irrigation policies. These are discussed under six strategic policy areas: (i) further liberalization of trade and markets, (ii) promoting private sector investment, (iii) increasing growth-enhancing public investments, (iv) reforming agricultural technology systems, (v) promoting more efficient land markets, and (vi) better managing the irrigation and drainage system.
22 Moreover, the rate of TFP growth at 1.3% has been lower than in other countries and regions experiencing rapid technological transformation: 1.9% for the Indian Punjab 1970-95, 2.2% for China 1965-85, 1.9% in Taiwan 1951-80, and 1.7% in Brazil in 1968-87. 23 Ministry of Food, Agriculture, and Livestock, Agricultural Strategy: An Action Plan, Islamabad, 2001.

Pakistan Development Policy Review
37
2.116 Liberalizing trade and markets. Historically, the government intervened heavily in the agricultural sector, subsidizing many inputs, but setting output prices below border-parity prices. This resulted in Pakistan having one of the highest rates of (implicit) “taxation” of the agricultural sector in the world (Schiff and Valdes 1992). The public sector dominated markets for major inputs and products through public corporations. Beginning in the 1980s and accelerating in the 1990s, Pakistan has liberalized its external trade and exchange rate regimes, privatized input markets (notably for fertilizers and pesticides), opened output markets to the private sector, removed input subsidies, and phased out public corporations serving the sector. Although this transition is still incomplete, the private sector is now playing a much greater role in agricultural marketing for all commodities, including wheat. Public subsidies for both inputs and products have in most cases been eliminated, including a large wheat subsidy that continued to 2001. The major remaining subsidy is for irrigation water, where O&M costs are only partially recovered (see below).
2.117 Under liberalization, prices for agricultural products have moved close to border-parity levels for major commodities, and implicit taxation of the sector has been sharply reduced. Although these measures should eventually result in improved incentives in the sector, recent liberalization has occurred at a time of unprecedented low commodity prices globally, especially for cotton and coarse rice, and three years’ drought over much of the country, resulting in a severe profit squeeze in the sector.
2.118 The GOP is concerned about price instability for major commodities and continues to announce “indicator prices” which are backed up in the case of wheat, and to some extent cotton, through public procurement. Livestock prices are also often controlled at the local level. Such initiatives should avoid undermining the incentive to produce and market high-quality produce that is a principal advantage of liberalizing output markets. The stated intention of these interventions is to address deficiencies in still developing private markets, without incurring trading losses, but policy is still evolving. A good case can be made for stabilization of wheat, and a variety of options should be evaluated to determine the most efficient approach, including operations in future markets, a government operated fund, and a limited strategic reserve (Faruqee and Coleman 1996). Private-sector approaches to price risk management could also be developed for cash commodities, especially cotton, through commodity exchanges, improved market information systems, and facilitation of private investment in critical infrastructure.
2.119 Although the stated policy is to promote exports (a policy that is of course impeded by agricultural protectionism in the industrial countries), the most recent agricultural strategy still preserves elements of an “import substitution mentality” by promoting production of oil palm and tea, even though Pakistan clearly has no comparative advantage in these products. 2.120 Promoting private -sector investment. Private investment has in the past been depressed by uncertainty resulting from ad hoc government interventions in the output and input markets, and lack of appropriate and transparent rules and regulations with consistent and fair enforcement. However, private sector activities have expanded rapidly in the 1990s under liberalization, and now account for more than 80 percent of total investment in the sector. There are some notable examples of the private sector creating new industries through contract farming with processors, such as modern milk processing, horticultural exports, and spring maize in the Punjab. While public sector corporations still dominate some input markets, notably seed, and continue to participate strongly in the fertilizer sector, the Sindh Seed Corporation is scheduled for privatization in 2002. There are also opportunities to privatize veterinary services and animal vaccine production. 2.121 In the irrigation sector, privatization of deep tubewells and private investment in shallow tubewells has played an important role in combating waterlogging by lowering the water table (although in some fresh groundwater areas this has gone to excess, depleting aquifers), supplementing irrigation supplies, and freeing public resources for operation and maintenance. However, the Ten Year Perspective

Pakistan Development Policy Review
38
Plan articulates a proposal to install new public sector tubewells. It is not obvious why the public sector should be reintroduced into an activity that the private sector has shown itself able to handle efficiently. Both growth and equity would be better served by promoting community-operated or owned tubewells instead--though new exploitation should be allowed only in areas where there is remaining sustainable aquifer capacity.
2.122 The regulatory environment for private investment is still lacking in significant areas. Pakistan has yet to implement plant varietal rights to provide incentives to private investment in agricultural technology, and biosafety rules to regulate import and release of genetically modified organisms. The long delay in approval of biosafety guidelines means that Pakistan is at least three years behind competing countries in the commercialization of transgenic insect-resistant cotton which has provided a cost advantage of 20-25% in countries as diverse as Mexico, China, and the USA, and will shortly be released in India.
2.123 Increasing growth-enhancing public investments. Even with a vibrant private sector, there are areas where agricultural growth requires public investment to create essential public goods. The main areas are agricultural research, farm to market roads, and upstream irrigation and drainage infrastructure. With phasing out of subsidies, it was expected that the saving would be translated into increased public investment. However, public expenditure in agriculture is low and falling—it now accounts for less than 1% of the total development budget, even though Pakistan already lags in most public goods needed to move to higher valued and more diversified agriculture, like rural roads and electrification. Public investment in research in Pakistan is only one half the Asian average of 0.6% of agricultural GDP, and has declined sharply in the 1990s. The priority among alternative investments also requires critical review. For example, provincial expenditures on extension are considerably higher than for research, which is contrary to global trends. 2.124 Revamping agricultural technology systems. Pakistan, with foreign assistance, built a respectable capacity in local adaptation and delivery of Green Revolution technologies, especially in the development of high yielding varieties. The cumulative effect of these efforts was the creation of a large public research and extension infrastructure, including five agricultural universities with a substantial human resource capacity for research. More recently, private sector R&D has expanded rapidly. This could be further enhanced by providing an appropriate regulatory environment (e.g., intellectual property rights) and turning over R&D and extension on commodities such as cotton, rice, sugarcane, and even wheat to the private sector and commodity associations, financed through a levy on marketed output.
2.125 The capacity of the agricultural technology system has declined sharply in recent years, only partly because of a funding shortfall. The present system is too centralized, bureaucratic, and supply-driven, with weak and unstable leadership. The research system needs to be restructured to make it more demand driven, accountable, and financially sustainable. Research organizations need enhanced autonomy from civil service (and political) interference, and increased responsiveness to farmers instead, combined with incentives to attract and maintain high quality leadership and scientists. The public extension model faces an even greater challenge. The devolution program includes devolving agricultural services to district councils, but the provincial governments are still trying to maintain de facto control. Terms of reference need to provide a clear role for the increasingly important farmer groups, water user associations, NGOs, and Rural Support Organizations. The private sector is also increasingly providing extension services, through commodity associations, contract farming, and processors. A new extension policy needs to be developed to address issues of decentralization, empowerment, accountability, and sustainable funding. 2.126 Promoting efficient land markets. Land markets operate very imperfectly, which slows the amalgamation of inefficient and very small farms that cannot provide a livelihood, reduces incentives for

Pakistan Development Policy Review
39
very large holdings to sell off underutilized land, and promotes fragmentation into small and scattered plots rather than consolidation of land holdings (Mahmood 1999). The land administration and registration system is antiquated, subject to abuse by local officials, and imposes high transactions costs in transferring land. Inheritance laws encourage fragmentation, the legal framework is outdated and unable to enforce existing laws (such as tenancy rights), and there is a lack of finance to facilitate land acquisition. The highly uneven distribution of land has an output cost due to the inverse relationship between farm size and land productivity that has been confirmed in studies in Pakistan (and elsewhere), as well as concentrating political power and thus promoting unequal access to public services, including irrigation and extension.
2.127 A number of measures could improve the functioning of land markets and encourage the move toward more efficient, equitable and competitive farms. The Punjab has already recognized the need to clarify property rights and modernize and computerize the land registration and records system, although progress has been slow. Land taxes have been imposed in each of the provinces based on the size of the land holding, although without any attempt to set tax levels to reflect productivity potential, so as to discourage underutilization of land on large holdings. Reforms in other areas, such as reduced subsidies for irrigation so that large landholders pay full O&M costs, and improved efficiency of financial markets to facilitate land transactions, would also promote market-based land consolidation and reform programs.
2.128 Past experience with land reform has yielded at best mixed results. The total area redistributed was very low, and the program may have increased insecurity of both tenants and landowners. At present the government has a limited program to distribute government-owned land to the landless, but no further land reform is contemplated. On the contrary, the current strategy encourages what is described as "corporate farming", especially to bring unused land into production. Exactly what is meant by corporate farming remains unclear, but it seems unlikely to solve basic agrarian problems and may aggravate income inequality. 2.129 It would seem more appropriate to direct attention to those limited areas (mainly in Sindh and southern Punjab) where very large scale and "quasi-feudal" systems still prevail and result in inefficient land use and extreme income inequality. Implementation of the 1972 land reform could redress many of these issues, but one could not expect those reforms to be effective until the "benami" law (which allows individuals to hold assets in the name of others) has been repealed, as is proposed. The Bank and the GOP should undertake comprehensive analytical and field work on the land distribution issue in these areas, with emphasis on market mechanisms to facilitate implementation of the law. These might include measures to improve efficiency of land markets combined with the provision of grants to landless workers and tenants to purchase land on the open market (so-called market-based land reform). A number of innovative measures by Rural Support Programs aimed at facilitating collective action by the landless poor to acquire land also merit careful study.
2.130 Reforming irrigation and drainage. In recent years the water allocations agreed in the Water Accord have not been delivered due to drought and loss of storage capacity due to sedimentation.24 The effects of these shortfalls have been exacerbated by the lack of transparent and effective water management in the major canal commands. The growing gap between supply and demand is a serious constraint on future agricultural growth (Figure 7). Important changes in water management and use policies are needed if future agricultural demands are to be met, and a new and transparent agreement about water allocation, that includes due consideration of environmental needs, will be essential.
24 A Water Apportionment Accord of the Indus River water was signed in 1991 as a basis for distribution of water among the provinces. The total annual allocation for the four provinces (Punjab, NWFP and Balochistan) is 141 BCM. The implementation of the accord is monitored by the Indus River Authority (IRSI).

Pakistan Development Policy Review
40
Figure 7: Gap Between Surface Water Supply and Demand
0
20
40
60
80
100
120140
160
180
200
2000 2010 2025
Source: Halcrow and ARCADIS (2001).
Vol
ume
in M
CM
Supply without additional storage Supply with additional storageSurface water demands
2.131 Additional storage is needed to compensate the capacity lost due to sedimentation and to increase the water delivered by the canal system. But even with potential additional storage, and assuming significant improvement in irrigation efficiency (from the current level of 40 percent up to 50-55 percent in field delivery), the gap between water supply and demand will persist (Halcrow and ARCADIS 2001). Improved water-use efficiency requires rehabilitation, modernization, and efficient maintenance of the irrigation and drainage systems. Equally important are on-farm conservation measures such as precision land leveling, zero tillage, and bed-furrow irrigation, some of which have proven effective in limiting the impact of the drought. Perhaps the most important counter could be a substitution of high-value, water-efficient crops such as vegetables and sugar beet for high water-consuming crops such as rice and sugar cane. Higher productivity could also help; an increase in irrigated wheat yields from the current level of 2.8 t/ha to an average of 5.0 t/ha (already achieved in Mexico, Indian Punjab and Egypt) would allow demand for wheat in 2025 to be achieved with 30 percent less water. (Indeed, it is rather remarkable that wheat and cotton yields held firm in 2000-01 despite a 30 percent aggregate water shortfall.)
2.132 Sustainable water use requires an integrated approach to conjunctive use of surface and groundwater, together with pricing mechanisms that reflect the scarcity of the resource. Groundwater exploitation has reached its upper limit in many parts of Pakistan. Groundwater tables are falling due to overpumping and water quality is deteriorating in several areas. A mechanism for regulating the exploitation and use of groundwater is needed and the Punjab has already made a start in this direction. Ideas like tradable water rights could be very valuable but any scheme would need careful preparation. 2.133 An institutional reform strategy for irrigation and drainage (I&D) was developed in 1995 to improve service delivery, reduce government expenditures on O&M, and increase cost recovery. The transition to the new institutional structure has proceeded much more slowly than planned, due to political resistance as well as procedural delays. Substantial effort is needed to drive the reforms forward, especially in the provincial irrigation departments. In Sindh, a promising start has been made as a result of high-level political support, which has led to the recruitment of committed and efficient staff from the open market, and implementation is now being scaled up to several pilot areas. Similar progress is lacking in other provinces. Continued failure could jeopardize the whole agricultural strategy.
2.134 Waterlogging and salinity result from canal seepage, a poorly managed water distribution system, and excessive irrigation. Salinity causes a 25 percent reduction in the productivity of major crops, or as much as 40-60 percent in Sindh (World Bank 1997). In spite of huge public investments, the problems of salinity and sodicity have become more acute in recent years, due to poorly maintained drainage systems and increased tapping of brackish groundwater for irrigation. The Left Bank Outfall Drain-I in Sindh is still the only outlet for disposing of the saline drainage effluent outside the Indus basin; at present huge salt loads brought by irrigation water are left to accumulate in the upper basin, with progressively more acute environmental effects. This is aggravated by about 80 percent of the supply of municipal and industrial water being returned untreated to rivers, canals and streams, and disposal of agricultural drainage water in fresh water bodies. In addition to health hazards, export of agricultural products could be jeopardized by the use of polluted water in irrigation. A national water quality management program to monitor water quality and enforce standards on effluent discharges into rivers and streams is urgently needed, and a proposed Basin Wide Environmental Management Plan included under the NDP needs to become operational.

Pakistan Development Policy Review
41
Summary: Overall Assessment 2.135 Pakistan’s agricultural sector possesses the potential to be a lead sector in accelerating economic growth and reducing poverty, but it has received less attention from the present government than other issues. The policies best able to accelerate agricultural growth center on markets, water, and technology. Of these, the GOP has made most progress in liberalizing markets; although there is still scope for further liberalization and the design of regulations and policies to make markets, including land markets, work more effectively. Markets need to be complemented by strategic public investments in infrastructure, most critically in the irrigation and drainage sector. A national drainage system that would complement the irrigation system is planned but behind schedule. Planned institutional reforms to enhance the efficiency and equity of water use and reduce government subsidies to O&M are lagging. Without renewed effort at the highest level, water and associated drainage issues threaten to become the binding constraint on faster agricultural growth. The slowest progress has been in reforming the technology system, despite the fact that technical change has to play an ever larger role in future growth of agriculture, and is critical to sector competitiveness with liberalized markets. Research, extension, and education need both major institutional reforms and increased funding.

Pakistan Development Policy Review
42
3. OUTLOOK AND RISKS
3.1 The international community is well aware that the GoP has taken a number of brave decisions since September 11, 2001. It is less well known that, since it took office in late 1999, the government has been resolutely implementing a carefully thought-out program for reversing the institutional and economic decline of the country notwithstanding a balance of payments crisis, high oil prices, sanctions after the May 1998 nuclear tests, and drought. This report has examined whether these measures promise the turnaround that the government is seeking, laying to rest the threat of a debt crisis, beginning to close the social and gender gaps, and securing a resumption of fast and equitable economic growth. 3.2 Our overall answer is positive. The DPR team was impressed to discover that most industrialists seem to have accepted that the economic model has irreversibly changed from that of the 1970s, with its focus on protection and special privileges. They are looking to the challenges of the future, particularly the opportunities that will be created by the end of textile quotas, not hankering for a return to special privileges like subsidized credit. One reason for this is doubtless that the reorientation in the direction of economic policy, toward a modern market economy, started much before the present government took office. Financial liberalization started in 1989. Privatization and deregulation were started in the early 1990s. Protection was already sharply reduced through the 1990s. SAP, and the increased attention to social issues that it signified, started in 1993. Banking reform started in 1997. SMEDA was created in 1998. The modernizing reforms of the present government are not a bolt from the blue. 3.3 Farmers seem less accepting of the change in the thrust of economic policy. This is not surprising, as agriculture was required to adjust to market pricing at a time of drought and very weak international prices for most of the commodities that Pakistan produces. The government has perhaps not yet given adequate priority to launching the sorts of reforms that would enable this, still by far the largest sector of the Pakistani economy, to adjust to the modern world while raising living standards in the countryside. 3.4 Reform is already yielding a number of positive results. Accusations of high-level corruption are no longer bandied around. Some of the social indicators are improving: literacy increased from 36% to 45% during the 1990s, gender attitudes are changing, population growth is beginning to slow, and the awareness of contraceptives has increased sharply. The I-PRSP that the government presented to the IMF and World Bank institutionalizes the decision to make social issues a major priority. The Paris Club deal has provided a breathing space on the macroeconomic front, and this (plus special aid receipts and some repatriation of Pakistani flight capital post September 11th) has been sensibly used to build up foreign exchange reserves and relax monetary policy. This will also put a lid on real appreciation that would otherwise threaten export competitiveness. A corporate bond market, albeit still small, has emerged. Of course, September 11th also brought with it some severe problems, notably cancelled export orders, which will slow growth and worsen the fiscal deficit in the short run.
A. THE OUTLOOK FOR GROWTH 3.5 It would be a mistake to expect rapid benefits from the reform program in which Pakistan is engaged. It inevitably takes time to raise educational and health standards, to build rural water supply schemes, to change attitudes towards women’s role in society—in short, to close the social and gender gaps. Social expenditure is going to be constrained for some time yet by the need to exit the debt trap, and it remains to be seen whether the new local authorities succeed in increasing the effectiveness of expenditure. Income distribution is a sticky variable, which is unlikely to change rapidly even though many of the presumptive causes of the deterioration in urban income distribution during the 1990s (special privileges for those with influence, the anti-export bias, and corruption) are now being tackled. So far as growth is concerned, the emergence of a degree of excess capacity (manifested in a rise in unemployment and a lot of idle capacity, at least in some regions), and the absence of inflationary

Pakistan Development Policy Review
43
pressures, give scope to allow demand to expand faster than supply capacity is growing in the short run, constrained only by the need to reduce foreign and domestic debt. This means, for example, that the government can spend any additional foreign grant aid that it might receive, and that it should welcome any export-led growth that may result from the trade concessions that Pakistan has obtained, but that it would be unwise to relax its drive to reduce the fiscal deficit (as measured by including grant aid as an above-the-line receipt). There may also be scope for some further relaxation of monetary policy in coming months in the interest of giving the economy a short-run stimulus. 3.6 But reducing poverty is a long-run challenge, not something that can be accomplished overnight. In the longer term, growth is constrained by the growth of the supply capacity of the economy, which depends upon investment and productivity growth. The present supply-side rate of growth in Pakistan may not exceed the average 4 percent growth achieved since 1992. The key question is whether policy reforms are going to improve the investment climate and increase productivity growth so as to raise that figure back into the range of 5 to 6 percent per year achieved in earlier decades, or even higher. Improved governance—the end to high-level corruption, a more professional civil service that is more transparent in its actions, judicial reform that eliminates delays and reduces the unpredictability of judgments, police reform that improves law and order, better auditing and accounting—will surely benefit the investment climate, to the extent that these reforms are actually translated into reality. The pursuit of a coherent debt strategy (as formulated in the Pakistan Debt Report) reduces the probability of a recurrence of macroeconomic crises with their debilitating effect on confidence. The devolution of power to local governments is designed to enable local communities to decide their own spending priorities and to increase the accountability of civil servants, and thus in due course to increase the supply of human capital and thereby make labor more productive. The leveling of the playing field between different sectors that has been achieved by liberalization, including in the marketing of agricultural products, and the removal of most price distortions, can be expected in due course to raise productivity by sending price incentives to produce goods of the greatest social value. Although we have no model that permits a quantification of the impact of all these changes, it seems quite plausible that their collective benefit could amount to an acceleration in the growth rate of as much as 2 percent a year. 3.7 Not only could one expect such policies, if systematically pursued, to increase the growth rate, but one could also expect that growth to be more pro-poor than in the past. The sectors that one would expect to expand under such policies include agriculture and SMEs, both of which are capable of generating many additional jobs (in the case of agriculture, a lot of them indirectly in the rural non-farm sector). Matching the increased demand for labor would be the increased quality of the labor force that would result from better education and better health. Money would no longer be funneled to inefficient enterprises that are incapable of servicing their debts and have to be bailed out at the expense of the public. And a civil service that aimed to serve the public rather than extract rents from it would enable business to devote more effort to increasing output and employment. 3.8 It is true that many of the recent initiatives have not yet impacted the public, so that there are still many complaints, especially from small business, of “business as usual”. This applies particula rly to complaints about the low-level bureaucracy, especially in the CBR but also in the labor ministry and the police, engaging in harassment and seeking to extract bribes. There are still big questions about the way in which the new district, tehsil, and union councils will work, and will interact with each other, and some functions that should have been devolved from provincial level (e.g. agricultural extension) are still not effectively controlled by the districts. Access to credit is still problematic for many SMEs, despite the revival of the SME bank and its ability to lend without collateral. The government has an ambitious privatization program for the coming months, but little privatization has actually occurred since the present government took office. There are still many people who do not pay their electricity bills, resulting in the high prices of power to industry that have been a perennial complaint of Pakistani industrialists in recent years. The benami law (which allows individuals to register their assets in the

Pakistan Development Policy Review
44
name of someone else, and thus impedes efficient administration of everything from taxes to land reform) has still not been repealed, although there is an intention to do that. The price of natural gas remains much below international levels, encouraging waste and jeopardizing the ability to gain a fair price for the country’s assets of gas when the gas companies are privatized, although the gas price is gradually being raised. But in these areas the government already has an action program, and the key question is the extent to which its actions will in fact resolve the problems in question. 3.9 In a number of other areas the government does not at present have a coherent program to address important issues. One of these concerns devolution from the federal government to the provinces, which was expected to happen in parallel to the active program to devolve powers from the provinces to the districts. Another concerns the fiscal relations between the different levels of government, which remain undefined. Although an agricultural income tax has finally been introduced, its yield remains small. Whatever arrangements are ultimately introduced for inter-governmental fiscal relations, there is likely to be a need to allow local authorities to raise more revenue for themselves, and it can be argued that a higher rate of agricultural income tax might be more acceptable if it were levied by the districts rather than the provinces. Agriculture and irrigation, which have not been a high priority of the present government, pose more concerns. There are chronic weaknesses in marketing agricultural products, and in agricultural research and extension, as a result of which Pakistan is in danger of falling behind its competitors (e.g. because national bio-safety regulations that would allow testing and release of bio-engineered cotton have not been approved). Land markets are impeded by poor registration and legal arrangements for transfer, thus creating obstacles both for land reform and for land consolidation that might combat increasing fragmentation. Pakistan’s water resources are rapidly approaching exhaustion, but there is no coherent program to save water by substituting less thirsty crops or creating legal property rights to water resources (a proposal that would admittedly need prior research to decide how best to implement it). The institutional reforms that were intended to devolve responsibility for maintaining water resources according to the subsidiarity principle have slowed to a snail’s pace. The ambitious and critically needed national drainage program has fallen way behind schedule, perhaps in part because the current drought has temporarily eased the problem of water-logging (although it has worsened the other problem the program is intended to address, that of salinity). This set of issues is in urgent need of much more concentrated high-level attention than they have received from the present government. 3.10 In a few areas, current government policies are questionable. The discussion of governance in Ch. 2 noted the danger that the CCBs as presently being developed, at least in some districts, were likely to entrench the influence of local moneyed interests rather than to empower the poor. There is also a risk that responsibility for staff recruitment and discipline will not be passed from the provincial governments to the districts, leaving the Nazim and council with staff that does not feel under particular pressure to respond to them. A few of the enterprises in need of reform, like WAPDA and Pakistan Steel, appear to be curiously exempt from action. While most of the price distortions that used to prevail in Pakistan (stemming from high protection and subsidized credit) have been eliminated or drastically reduced, there seem at present to be no plans to deal with three of the four that remain. (The general gas subsidy is already on its way out.) The first of these is the 25 percent duty on polyester imports: elimination of this would enable the textile industry to get on with upgrading its production to higher value-added products that incorporate polyester without the trouble of paying duty and then claiming the drawback. The second is the continuing subsidy to fertilizer production granted by the New Fertilizer Policy, which appears awfully like a throwback to the old policy of granting special favors to vested interests. The third is the cross-subsidy from industrial and commercial consumers of electricity to households and farmers. Elimination of this cross-subsidy, in conjunction with an increase in the reliability of power supply, would discourage the costly—and currently obligatory—practice of installing captive power plants. 3.11 Despite these continuing blemishes and the remaining areas in which the policy agenda needs to be better articulated, the overall thrust of present policies appears consistent with faster growth, better

Pakistan Development Policy Review
45
income distribution, and a reduction in the social and gender gaps. Nevertheless, Pakistan’s situation remains fragile and is likely to continue to be so for some time yet in several critical areas, notably with regard to debt (where the most one can hope is that debt dynamics have now turned positive, not that debt is now sustainable) and the social gap. While the authorities should continue to make reforms designed to reinforce the move to a modern economy, and to increase the development budget as fiscal circumstances permit, the primary need is to stay the course in order to give the reforms a chance to bear fruit. B. RISKS 3.12 What are the risks of this relatively optimistic scenario being derailed? Perhaps the biggest is the one that was frequently raised with the DPR mission by representatives of the private sector: the danger that the authorities will not stay the course after the elections that are due to be held in October. It has been asserted that the policy changes introduced by the present government will be irreversible, but such claims can never be fully credible: the nature of democracy requires that an elected government should be able to alter course. It would not be an answer to this risk to abandon the intention to restore democracy: given the importance that the international community nowadays attaches to the principle of democracy, this would at best jeopardize further trade concessions or abnormal aid of the type that Pakistan has received since September 11th last year. The most convincing way to make changes irreversible is for them to yield sufficiently positive results for a reversal of them to become tantamount to political suicide, but that is not going to happen before October 2002. One has to hope that the politicians will acknowledge that the reform program has in many respects carried further the program that they themselves had begun to implement in the 1990s, and will appreciate the national interest in their announcing that they have no intention of reversing the thrust of the program. 3.13 A second risk is that the authorities are tempted into premature relaxation, in terms of either the drive for institutional reform or the rigorous fiscal policy needed to overcome the debt crisis, or both, by the availability of additional foreign resources. Many countries have had the misfortune to have suffered excessively good fortune and been unable to resist the resulting temptation to relax. Pakistani policymakers showed immense skill between 1996 and 2001 in preventing the country falling into a full-blown debt crisis, in circumstances more difficult than those that confronted a number of countries where crises occurred. It would be a tragedy if this effort were to be wasted when a solution to the problem finally appears within reach. Donors have a role to play in not placing such temptations in Pakistan’s way, by avoiding offering non-concessional loans that would make life easy in the short run while rebuilding unmanageable debt servicing problems in the longer run. They should avoid all non-concessional loans for the time being, including export credits (especially for arms purchases). 3.14 A third risk is that external circumstances will turn out worse than expected. The current recession may last longer than presently anticipated, or (perhaps more likely in view of the current signs of short-run recovery without any correction of key asset prices in the United States) be followed rather rapidly by another recession. Oil prices might once again surge. Cotton prices might fall even further. It may prove difficult to sell Pakistani wheat on the international market, now that there is at last a surplus to sell. The developed countries might effectively renege on their promise to liberalize the textile trade in 2005, e.g. by launching a barrage of anti-dumping actions. Alternatively, producers like Pakistan might find themselves overwhelmed by Chinese competition without the protection that the quota system has provided. We do not rate any of these developments as highly likely, but it is quite likely that at some time in the next few years there will be some severe exogenous shock that will force a revision in current expectations. Most likely this will be something quite unexpected, not something included in the preceding list. While such shocks are not always unfavorable, a prudent policy strategy demands perpetual vigilance and a preparedness to react rapidly to a shock that is unfavorable. (It has been said that a prudent policymaker treats all positive shocks as temporary and all negative shocks as permanent until the evidence is in to justify a different judgment.) Until Pakistan emerges from its debt difficulties,

Pakistan Development Policy Review
46
negative shocks will demand a willingness to tighten fiscal policy and to allow—or, if necessary, encourage—the exchange rate to depreciate. 3.15 Fourth, there are severe risks arising from Pakistan’s strained relations with its large neighbor India. At its worst, the Kashmir crisis could end in a nuclear exchange that would wreak enormous physical and economic devastation in both India and Pakistan. This document would become irrelevant were such a disaster to occur. Much more likely, the current stand-off will be maintained longer than has heretofore been assumed. Some 400,000 troops are currently on the frontier in a high state of readiness, which is presumably the main reason for the additional Rs 15 billion expected in defense spending in FY02. This is a sum that Pakistan with its debt problems and unfulfilled social needs can ill afford. If instead the Kashmir crisis was to be resolved and Indo-Pakistani relations were to be normalized, the benefits would be enormous for both countries, but proportionately larger for Pakistan. Not only could defense expenditure be prudently cut further, releasing fiscal resources for the development budget, but trade would be expected to expand dramatically from its pitifully low current level, with India taking a derisory 0.9 percent of Pakistan’s exports. Lahore would regain much of its natural hinterland from which it has been cut off for decades. The engineering industry would have the chance of competing in the large Indian market and obtaining access to a wide range of intermediate goods that are produced efficiently in India. The temporary surplus in generating capacity that emerged in Pakistan following the investments of the IPPs could be exploited to sell power to India. A pipeline to bring natural gas from Iran or Central Asia to the Indian market would yield transit fees to Pakistan while also enabling Pakistan to supplement local production by cheap imports. The benefits of peace with India would be manifold. 3.16 The government is planning a major effort to monitor the implementation of the measures in the I-PRSP. This can be expected to increase transparency, and so reduce the risk that the social program will founder in the way that SAP did. Nevertheless, one needs to acknowledge a danger that the mid-level bureaucracy will sabotage the implementation of key reforms. This is clearly a problem that has arisen in the agricultural sector, e.g. in modernizing research and extension services and in devolving responsibility for irrigation O&M from the provincial irrigation departments to local user groups. It may also explain why capacity building is lagging in some areas, e.g. why the recommendation of the Pakistan Debt Report to create a debt-monitoring unit in the Ministry of Finance staffed by personnel with a high level of technical ability has not been implemented. It is probably a rather general danger. C. CONCLUSION 3.17 Until about 1970 Pakistan appeared to be well placed to emerge as one of the second-generation Asian tigers. However, in the early 1970s it abandoned the East Asian path which it had previously been largely following in favor of the then South Asian model of heavy protection, public ownership of what ought to have been the leading sectors of the economy, subsidized credit to the favored, and neglect of the social sectors. Although good agricultural growth stemming from the spread of the Green Revolution held up GDP growth right through the 1980s, the slowdown in industrial growth that resulted from this policy shift eventually transformed Pakistan from a leader to a laggard in South Asian growth while the largest social and gender gaps in the region emerged. 3.18 Today Pakistan is making a major effort to reverse the mistakes of the early 1970s. It has adopted a policy stance that in most respects seems well designed to do that, although only time will permit a judgment on whether it is delivering all that is hoped. But the main message to Pakistani policymakers is to stay the course, maintaining a balance between the competing priorities of increasing development spending and exiting the debt trap, and restoring democracy while trying to avoid the corruption and populism that so marred its reputation in the past. So long as Pakistan’s policymakers pursue that agenda, the country deserves the continuing support of the international community in its quest for a new dawn.

Pakistan Development Policy Review
47
References/Bibliography Ali, M., and D. Byerlee. 2000. “Productivity Growth and Resource Degradation in Pakistan’s Punjab: A Decomposition Analysis.” Policy Research Working Paper No. 2480, The World Bank. Barro, Robert. 1998. Cross-country Determinants of Growth. Cambridge, MIT Press. Easterly, William. 2001. "Pakistan's Critical Constraint: Not the Financing Gap but the Social Gap." Background Paper for Pakistan Poverty Assessment, 2000/2001. The World Bank. Ercelawn, Aly, and S. Akbar Zaidi. 1999. "Is the Social Action Program Working? Observations from a Field Survey." Appendix 18.2 in Zaidi, S. A., ed., 1999: Issues in Pakistan's Economy. Karachi, Pakistan: Oxford University Press. Government of Pakistan. 2001. Report of the Committee on Restructuring and Rightsizing of the Federal Ministries/Divisions. Planning Commission, Islamabad. (Shahid Amjad Chaudhry, Chairman). Government of Pakistan. 2001. A Debt Burden Reduction and Management Strategy – Summary Report. Debt Reduction and Management Committee, Finance Division. March 2001. (Pakistan Debt Report). Government of Pakistan. 2001. Reform of Tax Administration in Pakistan: Report of the Task Force on Reform of Tax Administration. April 14, 2001. (Shahid Husain, Chairman). Government of Pakistan. 2001. Textile Vision 2005: Reflections and Future Directions. Islamabad. Government of Pakistan. 2001. Interim-Poverty Reduction Strategy Paper (I-PRSP). Jointly prepared by the Ministry of Finance and Planning Commission, Islamabad. November 2001. Government of Pakistan. Economic Survey. Various issues. Faruqee, R., and J. R. Coleman. 1996. “Managing Price Risk in the Pakistan Wheat Market.” World Bank Discussion Paper No. 334, The World Bank. Halcrow and ARCADIS. 2001. “Pakistan National Water Sector Profile - A water resources strategy study.” AsDB TA 3130, PAK, (Draft Report), November. International Monetary Fund. 2002. Pakistan – First Review Under the Three-Year Arrangement Under the Poverty Reduction and Growth Facility, and Request for Waiver and Modification of Performance Criteria. EBS/02/43, March 12, 2001. Washington D.C.. Kathuria, S., Martin, W., and Bhardwaj, A. 2002. “Implications of MFA abolition for India and South Asia.” In Stern, R.M. ed. South Asia and the WTO , University of Michigan Press. Also available as World Bank Policy Research Working Paper 2721. Khan, Ashfaque H. 1998. “The Experience of Trade Liberalization in Pakistan.” Pakistan Development Review. Winter 1998. Khandker, S. R., and R. R. Faruqee. 2001. “The Impact of Farm Credit in Pakistan.” Policy Research Working Paper 2653, Development Research Group, The World Bank.

Pakistan Development Policy Review
48
Mahmood, M. 1999. “Reforming the Agrarian Land Market.” In R. Faruqee (ed), Strategic Reforms for Agricultural Growth in Pakistan, WBI Learning Series, World Bank, Washington, 1999. Martin, W. 2002. “Outgrowing resource dependence: theory and evidence.” Mimeo., The World Bank. Ministry of Food, Agriculture, and Livestock, GoP. 2001. “Agricultural Strategy: An Action Plan.” Islamabad. National Accountability Bureau Ordinance XVIII. 1999. (as Amended through Ordinance No. XIX of 1999 and Ordinance No. IV of 2000). State Bank of Pakistan. 2001a. Annual Report 2000-2001. State Bank of Pakistan, 2001b. “Financial Sector in Pakistan – Future Strategic Direction.” Draft SBP strategy paper, December. . Schiff, M.W., and A. Valdes. 1992. The Plundering of Agriculture in Developing Countries. The World Bank. The World Bank. 1997. “Staff Appraisal Report. National Drainage Project.” Rural Development Sector Unit, South Asia Region. The World Bank. 2001. Global Economic Prospects and the Developing Countries. Washington DC. The World Bank. 2002. Private Sector Strategy for Pakistan. US Customs Service. 2001. US Customs Service Textile Status Report. Washington, D.C.. World Trade Organization. 2002. Trade Policy Review: Pakistan. Geneva.

Pakistan Development Policy Review
49
Table 1: Sectoral Origin of Gross Domestic Product
Sources: Data provided by the Federal Bureau of Statistics and the Planning Commission, World Bank and Fund staff estimates.
1990/91 1991/92 1992/93 1993/94 1994/95 1995/96 1996/97 1997/98 1998/99 1999/00 2000/01
(Rs. billion at 1980-81 prices)Agriculture and allied 114.54 125.43 118.80 125.01 133.22 148.83 149.02 155.75 158.78 168.54 164.50 Agriculture 108.67 119.64 112.75 118.37 126.96 143.02 142.87 149.53 152.54 160.89 156.40 Fishing 4.43 4.65 4.91 5.44 5.05 4.90 5.14 5.31 5.48 6.01 5.79 Forestry 1.45 1.14 1.13 1.19 1.21 0.91 1.00 0.91 0.77 1.64 2.31
Industry 113.50 121.63 127.59 132.46 138.03 144.55 144.08 152.89 160.42 160.31 167.52 Mining and quarrying 2.50 2.57 2.64 2.77 2.65 2.83 2.89 2.74 2.83 3.01 2.99 Manufacturing 77.11 82.68 86.35 90.19 92.56 96.02 95.95 102.59 106.77 108.28 116.40 Construction 18.46 19.57 20.70 21.04 21.25 21.94 22.18 22.46 21.36 22.46 22.37 Utilities 15.42 16.82 17.90 18.46 21.57 23.76 23.07 25.09 29.46 26.57 25.75
Services 216.10 230.71 241.40 251.50 263.61 276.77 286.77 291.48 306.03 320.69 334.74 Transport, storage, and communication 42.72 47.19 50.33 52.17 54.34 54.80 56.86 60.96 64.09 66.41 69.16 Commerce 73.38 78.76 81.06 83.34 87.25 92.54 93.21 92.16 94.89 97.64 101.34 Finance and Insurance 9.91 10.34 11.07 12.63 13.43 15.28 17.04 12.96 15.40 16.67 17.06 Ownership of dwellings 24.31 25.59 26.94 28.36 29.86 31.44 33.10 34.84 36.68 38.62 40.66 Public administration and defense 31.68 32.50 33.30 33.76 34.81 35.92 36.71 37.46 38.40 41.09 42.32 Other services 34.11 36.34 38.71 41.24 43.93 46.80 49.85 53.11 56.58 60.27 64.21
GDP at factor costs 444.14 477.76 487.78 508.96 534.86 570.16 579.87 600.13 625.23 649.54 666.76Net indirect taxes 53.96 58.72 58.13 57.22 59.56 53.07 49.69 45.48 44.00 49.36 56.12GDP at market prices 498.10 536.48 545.91 566.19 594.42 623.23 629.55 645.61 669.24 698.90 722.24
(annual change in %)Agriculture and allied 9.5 -5.3 5.2 6.6 11.7 0.1 4.5 1.9 6.1 -2.4 Agriculture 10.1 -5.8 5.0 7.3 12.7 -0.1 4.7 2.0 5.5 -2.8 Fishing 5.0 5.6 10.9 -7.3 -2.8 4.8 3.3 3.2 9.7 -3.6 Forestry -21.2 -0.6 5.3 1.6 -24.9 10.5 -9.8 -14.9 113.0 40.4
Industry 7.2 4.9 3.8 4.2 4.7 -0.3 6.1 4.9 -0.1 4.5 Mining and quarrying 2.4 3.0 4.7 -4.3 7.1 1.9 -4.9 3.2 6.1 -0.4 Manufacturing 7.2 4.4 4.5 2.6 3.7 -0.1 6.9 4.1 1.4 7.5 Construction 6.0 5.8 1.6 1.0 3.3 1.1 1.3 -4.9 5.2 -0.4 Utilities 9.1 6.4 3.2 16.8 10.1 -2.9 8.8 17.4 -9.8 -3.1
Services 6.8 4.6 4.2 4.8 5.0 3.6 1.6 5.0 4.8 4.4 Transport, storage, and communication 10.5 6.7 3.7 4.2 0.8 3.8 7.2 5.1 3.6 4.1 Commerce 7.3 2.9 2.8 4.7 6.1 0.7 -1.1 3.0 2.9 3.8 Finance and Insurance 4.3 7.0 14.1 6.3 13.8 11.5 -24.0 18.9 8.2 2.3 Ownership of dwellings 5.3 5.3 5.3 5.3 5.3 5.3 5.3 5.3 5.3 5.3 Public administration and defense 2.6 2.5 1.4 3.1 3.2 2.2 2.0 2.5 7.0 3.0 Other services 6.5 6.5 6.5 6.5 6.5 6.5 6.5 6.5 6.5 6.5
GDP at factor costs 7.6 2.1 4.3 5.1 6.6 1.7 3.5 4.2 3.9 2.7Net indirect taxes 8.8 -1.0 -1.6 4.1 -10.9 -6.4 -8.5 -3.2 12.2 13.7GDP at market prices 7.7 1.8 3.7 5.0 4.8 1.0 2.6 3.7 4.4 3.3

Pakistan Development Policy Review
50
Table 2: GDP by Expenditure
Sources: Data provided by the Federal Bureau of Statistics and the Planning Commission, World Bank and Fund staff estimates.
1990/91 1991/92 1992/93 1993/94 1994/95 1995/96 1996/97 1997/98 1998/99 1999/00 2000/01
(Rs. billion at current prices)Nominal GDP at market prices 1016.72 1205.20 1333.04 1561.10 1865.92 2120.17 2428.31 2677.66 2938.38 3182.82 3472.15
Net exports of goods and nonfactor services -15.87 -38.20 -81.77 -43.12 -50.62 -95.92 -113.85 -27.91 -47.40 -50.85 -68.69 Exports 172.81 209.22 217.37 254.19 311.80 358.38 390.52 441.41 451.14 514.39 604.24 Imports 188.68 247.41 299.15 297.31 362.41 454.29 504.37 469.31 498.54 565.24 672.92
Gross domestic expenditure 1032.59 1243.40 1414.82 1604.22 1916.54 2216.09 2542.16 2705.56 2985.77 3233.68 3540.84
Gross capital formation 193.45 244.06 277.74 305.48 346.51 403.42 436.04 475.28 457.36 496.82 509.34 Gross fixed capital formation 177.65 225.36 256.64 280.88 318.31 369.08 397.77 403.88 409.36 445.12 453.14 Public 86.42 106.48 121.88 130.51 155.09 175.30 166.04 141.38 177.81 182.90 191.23 Private 91.23 118.88 134.77 150.37 163.22 193.78 231.73 262.50 231.54 262.22 261.91 Change in Stocks 15.80 18.70 21.10 24.60 28.20 34.34 38.28 71.40 48.00 51.70 56.20
Consumption 839.15 999.34 1137.07 1298.75 1570.03 1812.67 2106.12 2230.28 2528.42 2736.86 3031.50 Public 145.58 155.57 174.68 189.10 219.13 268.10 288.81 301.61 304.42 351.30 366.08 Private 693.57 843.77 962.39 1109.64 1350.91 1544.57 1817.30 1928.67 2224.00 2385.56 2665.42
Gross national savings .. . . .. . . 272.50 250.35 298.16 402.35 350.75 430.60 444.16 Public .. . . .. . . 8.60 -9.79 -53.55 -70.97 -30.86 -65.16 -26.09 Government .. . . .. . . -35.95 -55.36 -74.16 -99.51 -88.60 -115.75 -61.26 Public enterprises .. . . .. . . 44.55 45.57 20.60 28.54 57.74 50.60 35.17 Private .. . . .. . . 263.91 260.14 351.71 473.33 381.61 495.76 470.24
Gross domestic savings .. . . .. . . 242.51 228.45 256.55 355.22 312.17 383.87 375.03 Public .. . . .. . . 29.96 16.70 -22.54 -42.23 7.13 -20.26 25.11 Private .. . . .. . . 212.54 211.76 279.09 397.45 305.05 404.12 349.92
(% of GDP)Net exports of goods and nonfactor services -1.6 -3.2 -6.1 -2.8 -2.7 -4.5 -4.7 -1.0 -1.6 -1.6 -2.0 Exports 17.0 17.4 16.3 16.3 16.7 16.9 16.1 16.5 15.4 16.2 17.4 Imports 18.6 20.5 22.4 19.0 19.4 21.4 20.8 17.5 17.0 17.8 19.4
Gross domestic expenditure 101.6 103.2 106.1 102.8 102.7 104.5 104.7 101.0 101.6 101.6 102.0
Gross capital formation 19.0 20.3 20.8 19.6 18.6 19.0 18.0 17.7 15.6 15.6 14.7 Gross fixed capital formation 17.5 18.7 19.3 18.0 17.1 17.4 16.4 15.1 13.9 14.0 13.1 Public 8.5 8.8 9.1 8.4 8.3 8.3 6.8 5.3 6.1 5.7 5.5 Private 9.0 9.9 10.1 9.6 8.7 9.1 9.5 9.8 7.9 8.2 7.5 Change in Stocks 1.6 1.6 1.6 1.6 1.5 1.6 1.6 2.7 1.6 1.6 1.6
Consumption 82.5 82.9 85.3 83.2 84.1 85.5 86.7 83.3 86.0 86.0 87.3 Public 14.3 12.9 13.1 12.1 11.7 12.6 11.9 11.3 10.4 11.0 10.5 Private 68.2 70.0 72.2 71.1 72.4 72.9 74.8 72.0 75.7 75.0 76.8
Gross national savings .. . . .. . . 14.6 11.8 12.3 15.0 11.9 13.5 12.8 Public .. . . .. . . 0.5 -0.5 -2.2 -2.7 -1.1 -2.0 -0.8 Government .. . . .. . . -1.9 -2.6 -3.1 -3.7 -3.0 -3.6 -1.8 Public enterprises .. . . .. . . 2.4 2.1 0.8 1.1 2.0 1.6 1.0 Private .. . . .. . . 14.1 12.3 14.5 17.7 13.0 15.6 13.5
Gross domestic savings .. . . .. . . 13.0 10.8 10.6 13.3 10.6 12.1 10.8 Public .. . . .. . . 1.6 0.8 -0.9 -1.6 0.2 -0.6 0.7 Private .. . . .. . . 11.4 10.0 11.5 14.8 10.4 12.7 10.1

Pakistan Development Policy Review
51
Table 3: Balance of Payments, 1995/96 – 2001/02 (in millions of US dollars)
Sources: State Bank of Pakistan; Ministry of Finance; and Fund staff estimates. 1/ Includes a grant from Saudi Arabia in the form of oil that has been agreed through 2001/02. 2/ Includes repayments of FCDs held in NBFIs and banks (reschedulings shown as exceptional financing). 3/ Excluding new FCDs held with the SBP, and net of outstanding short-term foreign currency swap and forward contracts.
2001/02Proj.
Current account (excluding official transfers) -4,820 -3,851 -1,922 -2,699 -2,208 -1,946 -1,364Current account balance (including official transfers) -4,593 -3,562 -1,702 -2,126 -1,282 -1,128 127Trade balance -3,704 -3,145 -1,868 -2,085 -1,411 -1,245 -866Exports f.o.b. 8,311 8,096 8,433 7,528 8,191 8,926 8,914Imports f.o.b -12,015 -11,241 -10,301 -9,613 -9,602 -10,171 -9,780Services (net) -3,499 -3,662 -3,264 -2,619 -2,795 -3,130 -2,957 Of which: interest payments -1,631 -1,745 -1,763 -1,460 -1,676 -1,620 -1,543Private transfers (net) 2,383 2,956 3,210 2,005 1,997 2,429 2,459 Of which: Workers' remittances 1,461 1,409 1,490 1,060 983 1,086 1,722Official transfers (net) 1/ 227 289 220 573 926 818 1,491 Of which: Saudi oil facility .. .. .. .. 791 683 609 Of which: additional grant pledges .. .. .. .. .. .. 767 Of which: grants for Afgan refugees pledges .. .. .. .. .. .. 13
Capital account 4,163 2,530 1,421 -1,017 -2,610 -604 -2,526Public medium- and long-term capital 936 747 1,001 591 -1,452 -670 -962Public sector short-term (net) 180 30 173 -968 -221 -5 -725Private medium- and long-term 1,700 1,493 735 466 273 337 -182 Of which: FDI 1,102 682 601 472 471 322 355Private short-term (including errors & omissions) 2/ 1,347 260 -488 -1,106 -1,211 -266 -658Overall balance (before debt relief ) -431 -1,032 -281 -3,143 -3,892 -1,732 -2,400
Financing 431 1,032 281 3,143 3,892 1,732 2,400Reserve assets (increase -) 395 1,199 148 -1,254 208 -1,091 -1,284Use of Fund credit (net) 36 -167 133 430 -280 85 -195Net exceptional Financing 0 0 0 3,969 3,965 2,738 3,878
Current account (excl. Official transfers) -7.6 -6.1 -3.1 -4.6 -3.6 -3.3 -2.3Current account balance (incl. Official transfers) -7.2 -5.7 -2.7 -3.6 -2.1 -1.9 0.2Trade balance -5.8 -5.0 -3.0 -3.6 -2.3 -2.1 -2.2
Exports f.o.b. -2.6 4.2 -10.7 8.8 9.0 -0.1Imports f.o.b. -6.4 -8.4 -6.7 -0.1 5.9 3.8
Memorandum items:End-period gross official reserves 3/ 2053 1141 932 1672 908 1681 2647(In weeks of imports of goods and nonfactor services) 7.8 4.8 4.3 7.7 3.9 7.5 11.0
2000/01
(In millions of U.S. dollars)
(in percent of GDP)
(Annual percentage change)
1995/96 1996/97 1997/98 1998/99 1999/00

Pakistan Development Policy Review
52
Table 4: Merchandise Exports and Imports (in millions of US Dollars)
1991/92 1992/93 1993/94 1994/95 1995/96 1996/97 1997/98 1998/99 1999/00 2000/01
MERCHANDISE EXPORTSTotal exports, fob 1/ 6,762 6,782 6,685 7,759 8,311 8,096 8,433 7,528 8,191 8,926Adjustment for freight and valuation 1/ -198 -90 -118 -378 -396 -224 -218 -253 -406 -276Total exports (f.ob., customs basis) 6,960 6,872 6,803 8,137 8,707 8,320 8,651 7,781 8,569 9,202
Cotton 518 271 80 62 506 31 126 2 73 139Rice 415 317 242 454 504 469 562 533 540 525 Basmati rice 230 199 126 184 295 205 253 283 291 236 Other varieties 185 118 116 270 209 264 309 251 249 289Petroleum products 83 90 75 86 67 82 45 47 82 184
Cotton manufactures 3,616 3,722 3,775 4,627 4,981 4,993 4,866 4,538 5,092 5,210 Yarn 1,173 1,121 1,259 1,529 1,540 1,412 1,160 945 1,072 1,074 Cloth 819 863 821 1,080 1,276 1,262 1,250 1,115 1,096 1,032 Ready-made garments 614 618 612 642 648 734 747 651 772 827 Tents and canvas 51 40 29 38 39 36 58 41 53 49 Hosiery 425 464 509 689 703 689 697 742 887 911 Towels and other made-up articles 534 616 544 649 775 859 955 1,044 1,213 1,317
Other traditional exports 1,004 1,082 1,178 1,199 1,067 1,100 1,198 902 1,036 1,204 Leather 241 223 224 272 260 240 208 178 175 233 Carpets 230 173 151 198 209 199 200 203 264 288 Fish products 115 182 155 154 141 149 172 122 139 138 Synthetic textiles 418 504 648 575 457 512 618 398 458 545
Other exports (excl. oil exports) 1,324 1,390 1,453 1,709 1,582 1,647 1,831 1,759 1,746 1,929 Of which: Leather garments and leather gloves 399 389 340 333 364 343 334 339 Sports goods 131 199 264 248 309 384 256 279 Surgical goods 102 92 114 127 126 125 112 120 Fruits and vegetables 53 56 51 54 89 90 107 122 Petroleum and petroleum products 82 54 81 67 78 75 47 82
MERCHANDISE IMPORTSTotal imports (fob) 8,998 10,049 8,685 10,296 12,015 11,241 10,301 9,613 9,602 10,171Total imports (cif) 9,732 10,929 9,460 11,204 13,048 12,209 11,219 10,457 10,357 11,046
Petroleum products 1,377 1,578 1,450 1,722 2,010 2,246 1,750 1,485 2,783 3,327 Crude oil (cif) 527 538 442 483 509 581 453 431 790 1,362 Fuel oil (fob) 161 238 254 402 540 584 536 432 906 821 Other petroleum products (fob) 690 802 755 837 961 1,081 761 622 1,087 1,144
Wheat 251 390 199 357 455 477 709 407 284 0Fertilizer (public&private sector) 259 249 266 128 345 387 208 265 198 171
Edible oils (pub./priv. sectors) 403 584 488 997 855 611 768 824 414 327 Palm oil 324 452 408 831 738 493 669 597 325 283 Soy oil 79 132 80 166 117 118 99 227 88 44
Project-related 974 925 1,153 1,310 1,133 1,047 859 1,013 611 445Defense-related imports 1,060 793 586 839 1,093 891 862 630 507 498Other public sector imports 393 409 220 380 377 316 285 260 215 270
Other private sector imports (excl. edible oils) 4,718 5,817 4,764 4,991 6,688 6,155 5,691 5,546 5,320 5,726 Power generating machinery 359 198 254 505 742 996 462 235 n.a. n.a. Energy projects n.a. n.a. n.a. 250 n.a. 750 450 100 n.a. n.a. Nonenergy private imports 4,359 5,619 4,510 4,486 5,946 5,159 5,229 5,312 5,320 5,726Baggage/NRI 207 127 141 114 72 78 86 26 24 29Afghan refugee assistance 90 57 12 28 20 1 1 2 1 1
Memorandum itemsManufactures Exports 5,944 6,194 6,406 7,535 7,630 7,739 7,894 7,199 7,874 8,344Nonoil imports (cif) 8,355 9,351 8,010 9,483 11,038 9,963 9,469 8,973 7,574 7,719

Pakistan Development Policy Review
53
Table 5: Profile of Domestic and Public Debt
Notes: 1. Explicit liabilities include Special US Bonds, FEBCs, FCBCs and DBCs; of which US Bonds are foreign
liabilities, while others also foreign liabilities but payable in rupees. Outstanding stock is computed on a monthly basis by adding to the previous Rupee stock, so revaluation effect is not included.
2. It includes repayment of foreign debt.
Source: State Bank of Pakistan Annual Report 2000-01.
1997/98 1998/99 1999/00 2000/01
(Rs. billion)Total debt 2671.9 3135.4 3416.2 4003.3 Domestic debt 1176.2 1375.9 1559.9 1708.5 External debt 1483.1 1695.9 1788.4 2223.8 Explicit liabilities 1/ 12.6 63.6 67.8 71.0
Total debt service 278.3 343.1 353.9 325.0 Interest payments 191.6 220.1 256.8 237.1 Domestic 160.1 178.9 206.3 178.8 Foreign 28.7 38.0 44.9 50.5 Explicit liabilities 2.8 3.2 5.6 7.8 Principal payments 2/ 86.7 123.0 97.1 87.9
(% of GDP)Total debt 99.8 106.7 107.3 115.3 Domestic debt 43.9 46.8 49.0 49.2 External debt 3/ 55.4 57.7 56.2 64.0 Explicit liabilities 0.5 2.2 2.1 2.0
Ratio of external debt servicing to Export Earnings 55.4 35.3 36.5 37.4 Foreign exchange earnings 34.9 23.6 23.4 23.3
Ratio of total debt servicing to Tax revenue 78.4 87.8 87.2 68.9 Total revenue 64.8 73.2 65.9 57.0 Total expenditure 43.9 53.0 47.6 49.5 Current expenditure 52.5 62.7 55.0 49.3

Pakistan Development Policy Review
54
Table 6: Summary of Public External Debt and Debt Service, 1991/92 – 2000/01
Sources: State Bank of Pakistan, Ministry of Finance and Fund staff estimates.
1991/92 1992/93 1993/94 1994/95 1995/96 1996/97 1997/98 1998/99 1999/00 2000/01
Total public and publicly guaranteed external debt 22,097 23,712 25,425 27,973 28,121 28,709 29,000 29,318 29,757 31,398Medium- and Long-term debt 20,238 21,658 22,783 24,936 24,967 25,726 25,776 25,445 26,009 27,826Project & nonproject aid 17,361 19,044 20,333 22,117 22,275 23,145 23,042 23,101 23,834 25,810Commercial banks and IDB 158 115 260 543 647 701 1,100 730 560 698Other (including securities) 2,719 2,499 2,190 2,276 2,045 1,880 1,634 1,614 1,615 1,319
Short-term Debt (by initial maturity) 855 927 1,235 1,407 1,619 1,667 1,809 2,049 2,253 2,069Commercial banks and IDB 429 434 724 818 873 418 298 583 671 918FEBCs and DBCs 426 493 511 589 496 414 328 196 147 90Deposits of nonresidents with the SBP 250 835 1,183 1,270 1,435 1,061
Fund credit and loans 1,004 1,127 1,408 1,630 1,535 1,316 1,415 1,825 1,496 1,503
Service of medium- and long-term public and publicly guaranteed debt 1,930 2,480 2,614 3,000 3,307 3,794 3,393 3,634 3,654 3,283 Amortization 1,175 1,546 1,616 1,989 2,201 2,679 2,282 2,569 2,452 2,072 Interest 755 934 998 1,011 1,106 1,115 1,111 1,065 1,202 1,211Interest on public and publicly guaranteed short-term debt 71 35 44 66 94 97 98 92 117 86
Total public and publicly guaranteed external debt 45.2 45.9 48.6 45.7 44.2 45.8 46.4 50.0 48.3 52.7Long-term 41.4 41.9 43.6 40.8 39.2 41.0 41.3 43.4 42.2 46.7 Of which: project and nonproject aid 35.5 36.8 38.9 36.2 35.0 36.9 36.9 39.4 38.7 43.3Short-term 1.7 1.8 2.4 2.3 2.5 2.7 2.9 3.5 3.7 3.5Fund credit and loans 2.1 2.2 2.7 2.7 2.4 2.1 2.3 3.1 2.4 2.5
Service of medium- and long-term public and publicly guaranteed debt 3.9 4.8 5.0 4.9 5.2 6.0 5.4 6.2 5.9 5.5 Amortization 2.4 3.0 3.1 3.3 3.5 4.3 3.7 4.4 4.0 3.5 Interest 1.5 1.8 1.9 1.7 1.7 1.8 1.8 1.8 2.0 2.0Interest on public and publicly guaranteed short-term debt 0.1 0.1 0.1 0.1 0.1 0.2 0.2 0.2 0.2 0.1
Total public and publicly guaranteed external debt 287.6 307.0 333.8 322.1 304.9 318.9 310.6 354.2 328.7 319.3Service of medium- and long-term public and publicly guaranteed debt 25.1 32.1 34.3 34.5 35.9 42.2 36.3 43.9 40.4 33.4Amortization 15.3 20.0 21.2 22.9 23.9 29.8 24.4 31.0 27.1 21.1Interest 9.8 12.1 13.1 11.6 12.0 12.4 11.9 12.9 13.3 12.3
Memorandum item :Implicit interest on public and publicly guaranteed external debt 7.5 4.2 4.2 4.0 4.3 4.3 4.2 4.0 4.5 4.2Total external debt 25,355 28,068 30,804 32,718 34,684 35,766 35,782 35,309 34,338 37,110(In percent of GDP) 51.9 54.3 58.9 53.5 54.5 57.0 57.3 60.2 55.7 62.3
(In millions of U.S. dollars)
(In percent of GDP)
(In percent of exports of goods and nonfactor services)

Pakistan Development Policy Review
55
Table 7: Consolidated Government Budget, 1993/94 – 2001/02 (% of GDP)
2001/02Proj.
Revenue and grants 17.6 16.8 17.7 16.1 15.8 16.2 16.6 17.0 19.3Revenue 17.3 16.5 17.5 16.1 15.8 16.2 16.5 15.7 16.9
Tax revenue 13.7 13.7 15.0 13.4 13.0 13.2 12.8 12.8 13.2Federal 13.2 13.2 14.5 12.9 12.5 12.7 12.2 12.3 12.6
CBR Revenue 10.9 11.6 12.5 11.6 10.8 10.6 10.9 11.3 11.2 Direct tax 3.1 3.1 3.8 3.4 3.7 3.5 3.4 3.7 4.0 Federal excise duty 1.7 2.0 2.0 2.1 2.2 2.1 1.8 1.4 1.3 Sales tax 1.7 2.3 2.2 2.4 1.8 2.3 3.7 4.4 4.6 Customs duties 4.4 4.2 4.4 3.7 3.0 2.7 2.0 1.9 1.4
Petroleum surcharge 1.3 0.9 1.2 0.9 1.4 1.8 0.8 0.5 0.9 Gas surcharge 1.0 0.8 0.9 0.4 0.4 0.3 0.4 0.4 0.4 Other .. .. .. .. .. .. 0.0 0.0 0.0
Provincial 0.5 0.5 0.5 0.6 0.5 0.5 0.6 0.6 0.6Nontax revenue 3.6 2.7 2.5 2.7 2.8 2.9 3.7 2.9 3.8
Federal 3.2 2.4 2.2 2.4 2.4 2.4 3.1 2.4 3.2Provincial 0.4 0.3 0.3 0.3 0.4 0.5 0.6 0.6 0.6
Grants 0.4 0.3 0.2 0.0 0.0 0.0 0.1 1.3 2.4
Expenditure 23.9 23.2 25.3 22.9 23.5 22.2 23.0 21.0 22.7Current expenditure 19.1 18.4 20.1 19.2 19.5 19.2 20.3 18.9 19.1
Federal 15.0 14.2 15.2 14.6 15.5 15.4 15.4 14.5 14.5Interest payments 6.0 5.2 6.2 6.5 7.3 7.3 7.6 6.8 7.0
Domestic 4.8 4.0 4.9 5.2 6.3 6.0 6.2 5.3 5.3Foreign 1.3 1.1 1.2 1.3 1.1 1.3 1.4 1.5 1.7
Defense 1/ 6.0 6.1 5.6 5.5 5.1 4.9 4.7 3.8 4.0Running of the civil government 1/ 2.1 2.2 2.1 1.9 1.8 1.6 1.5 1.3 1.4Pensions 0.0 0.0 0.0 0.0 0.0 0.0 0.0 0.9 0.9Subsidies 0.3 0.2 0.4 0.4 0.2 0.3 0.6 0.4 0.4Grants 0.2 0.3 0.1 0.2 0.2 0.1 0.4 0.7 0.5Other 0.8 0.3 0.7 0.5 0.4 0.5 0.3 0.0 0.2
Provincial 4.1 4.2 4.9 4.6 4.0 3.8 4.9 4.3 4.6 Development expenditure and net lending 4.8 4.8 5.2 3.7 3.9 3.0 2.8 2.2 3.6
Public Sector Development Program 2/ 5.2 5.0 5.6 3.8 3.9 3.7 3.2 2.7 3.4 Federal 2/ 3.9 3.3 4.2 3.0 3.0 2.9 2.0 2.0 2.6 Provincial 1.3 1.7 1.4 0.8 0.9 0.8 1.1 0.7 0.8
Net lending -0.4 -0.2 -0.3 -0.1 0.0 -0.7 -0.4 -0.5 0.1
Budget balance (excluding grants) -6.7 -6.7 -7.8 -6.8 -7.7 -6.0 -6.5 -5.3 -5.7Budget balance (including grants) -6.3 -6.4 -7.6 -6.8 -7.7 -6.0 -6.4 -4.0 -3.3
Financing 6.7 6.7 7.8 6.8 7.7 6.0 6.4 4.0 3.3External 1.5 1.7 1.8 1.0 1.5 5.0 2.2 2.3 1.5Domestic 5.0 4.4 5.4 5.7 6.2 1.0 4.2 1.7 1.6
Bank 1.5 2.0 2.4 3.0 1.8 -2.6 1.3 -0.9 -0.2Nonbank 3.5 2.5 3.0 2.8 4.4 3.5 3.0 2.6 1.8
Privatization proceeds 0.1 0.6 0.6 0.0 0.0 0.0 0.0 0.0 0.2
Memorandum item:Primary balance -0.7 -1.5 -1.7 -0.3 -0.3 1.3 1.1 1.5 1.2GDPmp (Rs. Billion) 1561 1866 2120 2428 2678 2938 3183 3472 3695
1993/94 1994/95 1995/96 1996/97 1997/98 1998/99 1999/00 2000/01

Pakistan Development Policy Review
56
Table 8: Monetary Developments, 1998/99 – 2001/02
Sources: State Bank of Pakistan; and Fund staff estimates.
1/ At indicative program exchange rates, equivalent to actual end of June 2001 exchange rate. 2/ As reported in EBS/01/197.
2001/02Proj.
Net foreign assets -71 -45 28 80
Net domestic assets 1,351 1,446 1,499 1,586
Net claims on government 551 630 583 550Of which:
Net bank borrowing 506 546 514 507Commodity operations 67 107 95 70
Net claims on nongovernment 817 843 912 1,013Private sector 735 753 801 881Public sector 82 90 111 133
Privatization account -3 -3 -3 -3
Other items, net -14 -24 7 26
Total liquidity (broad money) 1,281 1,401 1,527 1,666Of which:
Rupee liquidity 1,132 1,288 1,373 1,515
Net foreign assets 1.6 2.0 5.2 3.4Net domestic assets 4.5 7.4 3.8 5.7
Of which:Net bank borrowing by govt. -3.9 3.1 -2.3 -2.1Net claims on private sector 8.5 1.4 3.4 5.2
(Changes over 12 months; in percent)
Broad money 6.2 9.4 9.0 9.1Net claims on private sector 16.2 2.5 6.4 9.9
Memorandum item:Indicative Program exchange rate … … 63.98 63.98
(Changes in percent of stock of broad money at the beginning of the fiscal year)
(End-of-period stocks in billions of Pakistani rupees)
1998/99 1999/2000 2000/01

Pakistan Development Policy Review
57
Table 9: Social Indicators
CAS Annex B5. This table was produced from the CMU LDB system. Note: 0 or 0.0 means zero or less than half the unit shown. Net enrollment ratios exceeding 100 indicate
discrepancies between the estimates of school-age population and reported enrollment data.
Latest single year Same region/income group
South Low-
1970-75 1980-85 1994-00 Asia income
POPULATION Total population, mid-year (millions) 71.0 94.8 138.1 1,354.7 2,458.7 Growth rate (% annual average for period) 3.2 2.7 2.4 1.9 1.9Urban population (% of population) 26.4 29.8 37.0 28.4 31.9Total fertility rate (births per woman) 7.0 6.5 4.8 3.4 3.7
POVERTY(% of population)National headcount index .. .. 32.6 .. .. Urban headcount index .. .. .. .. .. Rural headcount index .. .. .. .. ..
INCOMEGNI per capita (US$) 150 330 440 460 420Consumer price index (1995=100) 20 42 146 136 142Food price index (1995=100) .. 39 134 .. ..
INCOME/CONSUMPTION DISTRIBUTIONGini index .. .. 31.2 .. ..Lowest quintile (% of income or consumption) 8.0 .. 9.5 .. ..Highest quintile (% of income or consumption) 41.8 .. 41.1 .. ..
SOCIAL INDICATORS
Public expenditure Health (% of GDP) .. .. 0.9 0.9 1.2 Education (% of GNI) 2.2 2.9 2.7 3.1 3.3 Social security and welfare (% of GDP) 0.3 0.9 .. .. ..Gross primary school enrollment rate(% of age group) Total .. .. 69 100 96 Male .. .. 77 110 102 Female .. .. 60 90 86Access to an improved water source(% of population) Total .. 38 88 87 76 Urban .. 77 96 92 88 Rural .. 22 84 85 70Immunization rate(% under 12 months) Measles .. 38 81 63 64 DPT .. 77 80 75 70Child malnutrition (% under 5 years) .. 22 38 47 ..Life expectancy at birth(years) Total 52 57 63 63 59 Male 52 57 62 62 58 Female 52 58 64 63 60Mortality Infant (per thousand live births) 134 122 90 74 77 Under 5 (per thousand live births) 183 161 126 99 116 Adult (15-59) Male (per 1,000 population) 339 283 186 223 288 Female (per 1,000 population) 381 291 153 212 258 Maternal (per 100,000 live births) .. .. 340 .. ..Births attended by skilled health staff (%) .. .. .. 49 ..