Identification of Barrett’s esophagus patients at higher risk for adenocarcinoma development
Paired Exome Analysis of Barrett’s Esophagus and Adenocarcinoma
CitationStachler, M. D., A. Taylor-Weiner, S. Peng, A. McKenna, A. T. Agoston, R. D. Odze, J. M. Davison, et al. 2015. “Paired Exome Analysis of Barrett’s Esophagus and Adenocarcinoma.” Nature genetics 47 (9): 1047-1055. doi:10.1038/ng.3343. http://dx.doi.org/10.1038/ng.3343.
Published Versiondoi:10.1038/ng.3343
Permanent linkhttp://nrs.harvard.edu/urn-3:HUL.InstRepos:26318782
Terms of UseThis article was downloaded from Harvard University’s DASH repository, and is made available under the terms and conditions applicable to Other Posted Material, as set forth at http://nrs.harvard.edu/urn-3:HUL.InstRepos:dash.current.terms-of-use#LAA
Share Your StoryThe Harvard community has made this article openly available.Please share how this access benefits you. Submit a story .
Accessibility

Paired Exome Analysis of Barrett’s Esophagus and Adenocarcinoma
Matthew D. Stachler1,2,*, Amaro Taylor-Weiner3,*, Shouyong Peng2, Aaron McKenna4, Agoston T. Agoston1, Robert D. Odze1, Jon M. Davison5, Katie S. Nason5, Massimo Loda1,2, Ignaty Leshchiner3, Chip Stewart3, Petar Stojanov3, Sara Seepo3, Michael S. Lawrence3, Daysha Ferrer-Torres6, Jules Lin6, Andrew C. Chang6, Stacey B. Gabriel3, Eric S. Lander3,7, David G. Beer6, Gad Getz3,8,#, Scott L. Carter3,9,#, and Adam J. Bass2,3,#
1Department of Pathology, Brigham & Women’s Hospital and Harvard Medical School, Boston, Massachusetts 02115, USA
2Department of Medical Oncology, Dana-Farber Cancer Institute, Boston, Massachusetts 02215, USA
3The Eli & Edythe L. Broad Institute, Cambridge, Massachusetts 02142, USA
4University of Washington, Seattle, Washington, 98104, USA
5University of Pittsburgh Cancer Institute, University of Pittsburgh, Pittsburgh, Pennsylvania, USA
6Section of Thoracic Surgery, University of Michigan, Ann Arbor, Michigan, USA
7Department of Biology, Massachusetts Institutes of Technology, Cambridge, Massachusetts, USA
8Department of Pathology, Massachusetts General Hospital, Boston, Massachusetts 02114, USA
Users may view, print, copy, and download text and data-mine the content in such documents, for the purposes of academic research, subject always to the full Conditions of use:http://www.nature.com/authors/editorial_policies/license.html#terms
Correspondence to: S.L.C ([email protected]), G.G ([email protected]) or A.J.B ([email protected]).*Contributed equally#These authors jointly supervised this work
Conflict of Interest Statement: The authors report no conflict of interest
Author Contributions:MDS performed experiments and interpretation results. A.T.M., S.P., A.M., P.S., I.L., M.S.L., and S.L.C performed computational analysis. A.T.A. and R.D.O. performed pathologic slide review. J.M.D., K.S.N., D.F.T., J.L., A.C.C., and D.G.B. contributed samples and clinical annotation. M.L. contributed laser capture microdissection guidance and manuscript review. C.S., S.S., S.B.G and E.S.L organized and supervised sequencing. G.G. and S.L.C. and A.J.B. supervised all studies. M.D.S., A.T.M., S.L.C., G.G., and A.J.B. prepared the manuscript and all authors read and approved the final manuscript.
Data accession:Binary sequence alignment/map (BAM) files were deposited in the database of Genotypes and Phenotypes (phs000598).
Competing Financial Interests:The authors declare no competing financial interests.
URLsMutSig Algorithm, http://confluence.broadinstitute.org/display/CGATools/MutSig; CCDS, http://www.ncbi.nlm.nih.gov/CCDS/; Broad Institute Picard Sequencing Pipeline, http://broadinstitute.github.io/picard/; Broad Institute Firehose Pipeline, http://www.broadinstitute.org/cancer/cga; Oncotator, www.oncotator.org
HHS Public AccessAuthor manuscriptNat Genet. Author manuscript; available in PMC 2016 March 01.
Published in final edited form as:Nat Genet. 2015 September ; 47(9): 1047–1055. doi:10.1038/ng.3343.
Author M
anuscriptA
uthor Manuscript
Author M
anuscriptA
uthor Manuscript
9Joint Center for Cancer Precision Medicine, Dana-Farber Cancer Institute/Brigham and Women’s Hospital/the Broad Institute of Harvard and MIT, Harvard Medical School, Boston, MA 02215, USA
Abstract
Barrett’s esophagus, is thought to progress to esophageal adenocarcinoma (EAC) through a step-
wise progression with loss of CDKN2A followed by p53 inactivation and aneuploidy. Here, we
present whole exome sequencing from 25 pairs of EAC and Barrett’s and five patients whose
Barrett’s and tumor were extensively sampled. Our analysis revealed that oncogene amplification
typically occurred as a late event and that TP53 mutations often occur early in Barrett’s
progression, including in non-dysplastic epithelium. Reanalysis of additional EAC exome data
revealed that the majority (62.5%) of EACs emerged following genome doubling and that tumors
with genomic doubling had different patterns of genomic alterations with more frequent oncogenic
amplifications and less frequent inactivation of tumor suppressors, including CDKN2A. These data
suggest that many EACs emerge not through gradual accumulation of tumor suppressor alterations
but rather through a more direct path whereby a TP53-mutant cell undergoes genome doubling,
followed by acquisition of oncogenic amplifications.
Introduction
Barrett’s esophagus (BE), the intestinalization of the lower esophagus, develops in response
to chronic gastric reflux and is the precursor to esophageal adenocarcinoma (EAC)1,2,3.
While BE is estimated to exist in at least 1:100 adults4, relatively few progress to cancer.
Those that do develop cancer are typically diagnosed at an advanced, incurable stage.
Therefore, there is substantial interest in defining the molecular and genomic features of
aggressive BE to enable means to prevent cancer or identify disease when most curable. The
transformation of BE to EAC follows the progressive development of increasing grades of
dysplasia, leading to invasive carcinoma. Several studies have characterized differences
between BE, dysplasia, and EAC, looking at genomic copy-number5–8 and focused analysis
of specific cancer-associated genes5,9–12. Through studies of BE, a linear model of
progression has emerged whereby early non-dysplastic BE represents a clonal or polyclonal
expansion, typically following inactivation of the tumor suppressor CDKN2A5,7–10. Further
sub-clonal expansions are thought to occur, often leading to the emergence of a dysplastic
clone with TP53 inactivation and other somatic alterations, including frequent genome
doubling and increasing genomic disruption, leading to malignant transformation7,9. We
sought to further clarify the process underlying transformation of BE to EAC by performing
genomic analysis on BE and EAC samples derived from the same patient. We then extend
this analysis to a cohort of previously sequenced EAC samples.
Results
Paired Barrett’s and esophageal adenocarcinoma analysis
We first performed whole exome sequencing (WES) on 25 patient-matched ‘trios’,
including fresh-frozen EAC, BE, and non-malignant, distant gastric or esophageal squamous
tissue as a germline comparator (Supplementary Table 1). All samples were obtained by
Stachler et al. Page 2
Nat Genet. Author manuscript; available in PMC 2016 March 01.
Author M
anuscriptA
uthor Manuscript
Author M
anuscriptA
uthor Manuscript

surgical resection from patients without prior chemo/radiotherapy, with BE intentionally
isolated from a region not immediately adjacent to the tumor (when possible) during
processing to avoid contamination of the BE with EAC cells. Upon pathologic review, 14
BE samples contained no dysplasia (BENoDys) and 11 of the BE samples showed evidence
of dysplasia (BEDys). Of the 11 dysplastic samples, six contained changes consistent with
high-grade dysplasia (HGD). Following somatic mutation calling (Supplementary File 1),
we inferred the degree of shared ancestry of the paired BE and EACs based upon the
number of shared mutations. In 11 of the 25 trios the specific region of sequenced BE
appeared to be clonally unrelated to the sampled tumor as they lacked shared somatic
mutations (Supplementary Fig. 1, Supplementary File 2). In addition, hierarchical clustering
of the paired samples using somatic copy number alterations (SCNAs) failed to cluster these
unrelated sample-pairs together (Supplementary Fig. 2). In the remaining 14 trios, the
sampled regions of BE and EAC showed evidence of having emerged from a common
neoplastic clone, as they shared 3.4 – 64% of coding point mutations with cancer cell
fraction (CCF) of 1 (i.e., are present within all neoplastic cells in the tissue sample). Overall,
we found no association between presence of dysplasia and whether the BE and EAC
samples are clonally related (Fisher’s exact test, P=0.69). Among the six samples with
HGD, five were clonally related to the EAC (P=0.18).
Our Initial analyses compared the degree of genomic disruption between BE and EAC
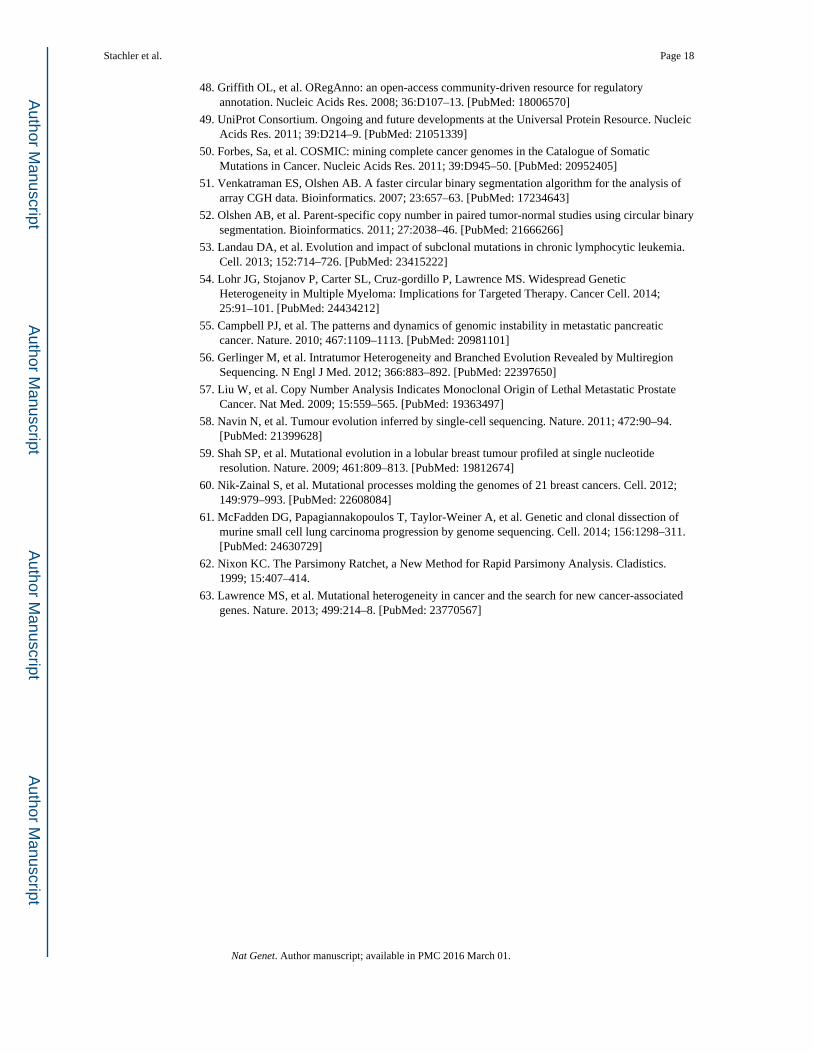
samples. The somatic mutation frequencies of BE ranged 1.3 – 5.4 mut/Mb – demonstrating
that even non-dysplastic BE has mutation frequencies higher than many common invasive
cancers (Fig. 1a). Mutational densities increased from BENoDys (2.8 mut/Mb) to BEDys (4.9
mut/Mb, Student t-test P=0.05), but were similar between BEDys and EAC (4.1 mut/Mb,
P=0.43). We also evaluated the base context of mutations in BE to query the presence of the
common pattern of A to C transversions at the 3′ adenine at AA dinucleotides that we
described in EAC13. The predilection for these transversions was also present in BE (Fig.
1b), suggesting these mutations occur early during neoplastic progression, possibly caused
by exposure to bile and acid reflux. Within the 14 clonally related cases, we separately
analyzed the mutation spectra of the early shared mutations compared to those that were
private to either the BE or the EAC. While there was a trend in increased A to C mutations
private to BE, this was not statistically significant (Supplementary Fig. 3).
Our analysis of structural genomic changes revealed that, in contrast to point mutations,
there was a greater increase in structural genomic disruption with progression to cancer. The
mean number of focal deletions per sample increased steadily between BENoDys (10.43),
BEDys (20.73) and the paired EAC samples (40.20, P<0.01 for both) (Fig. 1c). More
significantly, the number of amplifications was strongly associated with progression from
BEDys to EAC (Fig. 1d). BENoDys and BEDys averaged 0.42 and 0.91 amplifications per
sample, respectively, while EACs averaged 8.44 amplifications per sample (P<0.001 for
both) suggesting that amplifications may be key mediators of oncogenic transformation.
Even between BE with HDG and EAC, we still found a significant increase in
amplifications, P=0.009 (Supplementary Fig. 4). When we lowered amplification threshold
to include lower-level gains the significant increase with progression persisted
(Supplementary Fig. 5).
Stachler et al. Page 3
Nat Genet. Author manuscript; available in PMC 2016 March 01.
Author M
anuscriptA
uthor Manuscript
Author M
anuscriptA
uthor Manuscript

We evaluated specific oncogenic alterations within the trios, starting with tumor suppressor
gene (TSG) alterations (Supplementary File 1, Supplementary Table 2). Within the 11 BE
samples clonally unrelated to the paired EAC, only one harbored a TP53 mutation (Fig. 2a).
While four of these BE cases possessed a homozygous CDKN2A deletion, the EACs that
emerged in those patients lacked detectable somatic CDKN2A alterations. When we next
evaluated the clonally related cases, we found that three of the four most distantly related
trios (sharing 3.4%, 4.5%, and 7.8%, of mutations) had TP53 mutations shared between the
BE and EAC (Fig. 2a, b), indicating that these TP53 mutations were among the earliest
somatic mutations in the development of these tumors. All three of these tumors with early
shared TP53 mutations were determined to have undergone whole genomic doubling
(WGD) using the ABSOLUTE algorithm14.
Furthermore, in these patients with evidence for an early TP53 mutation, shared CDKN2A
somatic alterations were not observed. Seven of the 14 related BE/EAC cases had shared
mutations in TP53 but not CDKN2A, which was either unaltered or had distinct inactivating
events in the BE/EAC samples, suggesting that TP53 mutation was not preceded by
CDKN2A inactivation in these cases (Fig. 2a, c). Only two of the 14 related cases appeared
to clearly follow the classic model whereby the BE and EAC share a CDKN2A alteration but
not a TP53 alteration, indicating that CDKN2A inactivation occurred before TP53. These
results suggest that TP53 mutations may be an earlier event in BE pathogenesis in relation to
other genomic alterations than previously recognized, often preceding (or occurring without)
CDKN2A inactivation.
In contrast to the prevalent TSG alterations in BE, oncogenic activation events were far less
prevalent in the sampled BE lesions, Fig. 3, even in those samples with advanced dysplasia
or where the sampled BE appeared to be closely related to the cancer (Supplementary Fig.
6). High-level amplification of oncogenic cell-signaling proteins, cell-cycle modulators, and
transcription factors were recurrently present in EACs but more infrequent in BE (Fig. 3,
Supplementary Fig. 7 and 8). In addition, activating mutations of oncogenes were
uncommon in BE, with only one known activating mutation identified, a PIK3CA E545Q
mutation (Supplementary File 1), which was shared with the paired EAC. Oncogenic
mutations in the 25 EAC were also uncommon, with two PIK3CA and one CTNNB1 hotspot
mutation identified (Fig. 3). Together, oncogenes in cell signaling proteins (64% vs. 12%,
P=0.0003), cell-cycle modulators (40% vs. 8%, P=0.0181), and transcription factors (64%
vs. 20%, P=0.0037) were much more likely to have an activating event in the EAC than the
paired BE. These data suggest that while BE harbors common TSG inactivation; oncogene
activation is a late step and may mediate transformation to cancer. In the patient sample
(#63) available for confirmatory testing, fluorescent in-situ hybridization (FISH) for ERBB2
confirmed our sequencing analysis showing high level amplification in the EAC sample and
no amplification within the BE tissue (Supplementary Fig. 8).
Expanded multi-sample analysis via laser capture microdissection
To better understand the progression of BE to EAC we identified 5 additional patients
(Supplementary Table 3) with a broad field of BE who underwent surgical esophagectomies
(without neoadjuvant therapy), from which we obtained paraffin-embedded samples
Stachler et al. Page 4
Nat Genet. Author manuscript; available in PMC 2016 March 01.
Author M
anuscriptA
uthor Manuscript
Author M
anuscriptA
uthor Manuscript

representing multiple distinct stages of BE/EAC. We utilized laser capture microdissection
to isolate normal tissue and pathologic samples spanning non-dysplastic BE, BE with low-
grade dysplasia (LGD), BE with HGD, EAC, and nodal metastatic foci. The number of
neoplastic samples characterized per patient ranged from 5 to 11 (Fig. 4 – 5). Laser capture
microdissection allowed us to sample regions of BE in closer proximity to the tumor than
feasible with the earlier trios from fresh tissue. With DNA from these newly dissected
samples, we performed WES and processed data to identify somatic copy-number
alterations, mutations, and genomic doubling (Supplementary Fig. 9). We then constructed
phylogenetic trees indicating the evolutionary relationships between the subclones detected
in each sample (Fig. 4 – 5; Supplementary Figs. 10 – 13). In three of the five cases all of the
identified BE regions (both non-dysplastic and dysplastic) were clonally related to the EAC
(Fig. 4). In the other two cases, all sampled regions of non-dysplastic BE were clonally
unrelated to the EAC but we identified dysplastic BE samples related to the sampled tumor
(Fig. 5). Most individually dissected tissue-samples were sufficiently diverged from one
another such that no sharing of minor subclones occurred (mutations with CCF < 1 in two or
more samples). However, patients 3 and 7 appeared to contain samples with partially
overlapping subclones (Fig. 4f, Fig. 5b).
BE samples from two of the five esophagectomy cases supported our earlier observations
that TP53 mutations may occur earlier than previously thought in BE pathogenesis. In P1
and P7 (Fig. 4b, 4f) TP53 missense mutations were shared by all sampled tissues, including
regions of non-dysplastic BE (Supplementary Fig. 14). Furthermore, these two patients also
demonstrated how oncogene amplification can be a late event mediating transformation. In
P1, we identified a focal CDK6 amplification present in the two EAC samples but not in the
BE or HGD samples. However, in the TP53-mutant regions of non-dysplastic BE and HGD,
we detected a GATA6 amplification that is absent from the tumor (Fig. 4b) demonstrating
that amplifications are not exclusive to EAC. In P7, we identified a high level KRAS
amplification in the tumor and in a focus of HGD immediately adjacent to the cancer
(HGD1; Fig. 4f). The KRAS amplification was notably absent from other regions of low and
high-grade dysplasia more distant to the tumor (LGD1 and HGD2). FISH for KRAS
confirmed these findings with high-level (>25 copies) amplification present in the EAC and
absence of amplification in HGD2 or LGD1 (Supplementary Fig. 15).
Individually dissected samples within P7 also demonstrated substantial overlap of distinct
subclonal populations. Sample LGD1 contained a major subpopulation (subclone 1a; CCF =
0.80 – 0.85) that was closely related to the last common ancestor of all neoplastic cells
sampled in the patient. In addition, sample LGD1 contained a minor subpopulation
(subclone 1b; CCF = 0.15 – 0.2) defined by 12 additional mutations, as well as single-copy
loss of chromosomes 5q, 11p, and 13, and copy-neutral LOH of chromosomes 7 and 21
(Supplementary Fig. 9 – 12). Subclone 1c was descended from a cell closely resembling
subclone 1b, with 10 additional mutations; subclone 1c was sampled only in HGD2.
Subclone 1c closely resembled the common ancestor of all the subclones sampled in MET1,
HGD1, EAC2, and EAC1 (none of which contained shared minor subclones with CCF<1).
Sample BE1 contained two major subpopulations (subclone 2a; CCF = 0.4 – 0.6 and
subclone 2b; CCF = 0.5 – 0.6). Subclone 2a was descended from a subclone closely
Stachler et al. Page 5
Nat Genet. Author manuscript; available in PMC 2016 March 01.
Author M
anuscriptA
uthor Manuscript
Author M
anuscriptA
uthor Manuscript

resembling subclone 1a, defined by 7 additional mutations. Subclone 2b was descended
from a cell closely resembling subclone 2a, defined by 23 additional mutations (including
AKT1 p.G10V) and gains of chromosomes 10 and 18p (Supplementary Fig. 9 – 12). We re-
drew the phylogenetic tree to represent the relationships between all subclones identified
and overlaid the tissue-samples onto the tree (Fig. 4f)
P4 (Fig. 4c, 4d), exemplified a situation where a CDKN2A deletion is present through all
sampled regions of BE and EAC. We therefore inferred that a CDKN2A-null progenitor
gave rise to five distinct non-dysplastic BE subclones and one focus of LGD, all lacking
TP53 alteration. However, we identified another subclonal branch in this case, consisting of
five HGD/EAC samples all containing a TP53 mutation (p.R175H), focal low level (2 extra
copies) amplification of MET, and genomic doubling, consistent with a cancer in which
TP53 mutation occurred later in clonal evolution, following CDKN2A inactivation.
Moreover, this case also supports the potential for oncogenic amplification to mediate
transformation, as the one EAC sample harbored amplifications at CCNE1, GATA6, AKT2,
and 3q26 that were absent from all other samples. Samples HGD1, HGD2, and HGD3 all
harbored a 7Mb gain with approximately 3 extra copies compared to a 4N baseline on 17q
including ERBB2, not present in the EAC.
Analysis of tissue from P3 and P6 (Fig. 5) demonstrated the potential for heterogeneity
within the field of both BE and EAC. P3’s case contained three separate neoplastic regions,
each clonally unrelated to the others. A first region contains an area of non-dysplastic BE
with a focal CDKN2A deletion. From this region emerged a segment of LGD with biallelic
loss of ARID1A. Separate from this region of BE were two clonally unrelated primary
cancers (Supplementary Fig. 16). The sample EAC1 contained a mix of two distinct
populations. Subclone 1 harbored 182 unique mutations (including SMARCA4) and
additional copy-number alterations, including a CCND1 amplification. EAC1 also contained
a subpopulation of cells (subclone 2), that closely resembled the common ancestor of all
subclones in the samples of more advanced disease, HGD1, EAC2, and Metastasis 1, with
125 mutations unique to their branch and unrelated to subclone 1. HGD1/EAC2 and
Metastasis 1 also underwent WGD, which was not evident in EAC1/Subclone 1. Our
focused analysis of this branch of advanced neoplastic tissues demonstrated how oncogene
amplification can lead to transformation. The sample of HGD contained low-level segmental
gains on chromosomes 6, 7, 8, and 17. The EAC and metastasis possessed additional
amplifications, often occurring on top of these gains in the HGD. EAC2 harbored a more
focal MYC (chr 8) amplification and focal amplifications of 3q26 and MET (chr 7) not
identified in the region of HGD. In addition, Metastasis 1 (from a local lymph node) had an
increased ERBB2 amplification (chr 17), demonstrating further heterogeneity.
Our analysis of patient 6 revealed one region of clonally distinct non-dysplastic BE as well
as two EAC foci and two of HGD, which all emerged with WGD and a shared ATM
nonsense mutation. Interestingly, a focal CDKN2A deletion was present in one of dysplastic
samples (HGD1) but not in the HGD2 or EAC samples – another demonstration of a late
CDKN2A inactivation. The two EAC samples, both shared a MET amplification not present
in the dysplastic tissue.
Stachler et al. Page 6
Nat Genet. Author manuscript; available in PMC 2016 March 01.
Author M
anuscriptA
uthor Manuscript
Author M
anuscriptA
uthor Manuscript
Wider analysis of esophageal adenocarcinoma exomes
In order to validate our findings and better estimate the fraction of EAC cases that do not
follow the conventional EAC evolution model, we reanalyzed whole-exome sequencing data
from 144 microsatellite-stable EACs that we recently presented13,15. Consistent with the
conventional progression model, these tumors showed marked aneuploidy15 and harbored
TP53 mutations in 97/144 (67%) of cases. However, we identified CDKN2A inactivation via
inactivating mutations or homozygous deletions in only 39/144 (27%) of tumors14.
We reanalyzed the EAC WES profiles using ABSOLUTE14 to make WGD calls and to
determine whether specific mutations likely occurred prior to or following doubling. The
majority (62.5%) of EACs showed evidence of WGD, corroborating previous findings14.
While WGD and non-WGD tumors showed different ploidy and genomic disruption,
mutation densities were not different between these two groups (Supplementary Figs. 17,
18). TP53 mutations were distributed evenly across WGD (67% TP53 mutant) and non-
WGD EACs (69% TP53 mutant). Within the WGD samples, 54/60 (90%) of the TP53
mutations were determined to have occurred prior to doubling. We compared the timing of
TP53 mutations with that inferred for other mutated TSGs, including CDKN2A. TP53 was
the only gene whose mutations were statistically more likely to have occurred prior to
doubling (P=8.7×10⁻⁷; Supplementary Fig. 19, Supplementary Table 4) suggesting TP53’s
role as an antecedent to genomic doubling16,17.
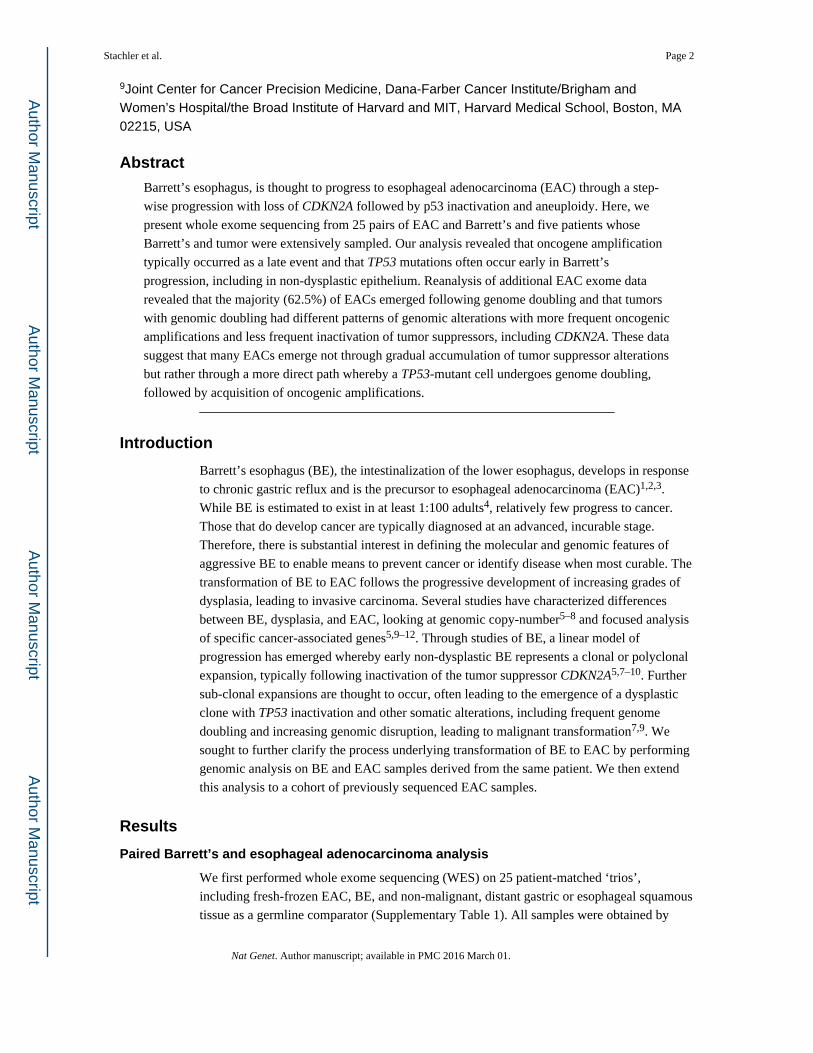
Next, we searched for genomic characteristics that differentiate WGD and non-WGD EAC,
finding early evidence for a different spectrum of TSP alterations. CDKN2A and SMAD4
mutations were found in only 8% and 1% of WGD EACs, respectively, but are present in
19% (P=0.065) and 20% (P=0.0001) of non-WGD tumors (Fig. 6a). Broadening our TSG
analysis, we found TSG losses involving chromatin modification (P =0.005), cell cycle
(P=0.027), and the TGF-β pathway (P=0.0001) were all more frequent in the non-GD EACs
(Fig. 6b, Supplementary Tables 5 – 6). While we found that the mean number of deleted
segments was not statistically different between WGD and non-WGD tumors, (29.13 vs.
30.93; P=0.28), there was a trend for increased homozygous deletions in the non-WGD
samples (1.46 for non-WGD vs. 0.867 for WGD; P=0.104; Supplementary Fig. 20), as
previously observed in serous ovarian cancer14. The observation that tumors that emerge out
of WGD have fewer somatic alterations of TSGs suggested that different alterations might
drive transformation in these cases.
Therefore, we next evaluated patterns of oncogene activation, finding that alterations
predicted to activate oncogenic signaling molecules, KRAS, RTKs, or PI3-kinase signaling,
did not differ between the WGD and non-WGD groups (64% vs. 54%, P=0.22 for KRAS/
RTKs and 9% vs. 13%, P=0.57 for PIK3CA) (Fig. 7). However, tumors with WGD showed
more frequent amplification of oncogenic transcription factors (43 vs. 22%; P=0.012) and a
trend towards higher rates of amplifications of cell-cycle mediators (40 vs. 24%; P=0.069).
More frequent CCNE1 amplifications in genome doubled EACs (16% vs. 6%) paralleled
recent analyses across tumor types which identified correlations of CCNE1 amplifications
and WGD18,19. These findings indicate that the absence or presence of WGD in BE
modifies the most likely pathway available to undergo transformation to cancer.
Stachler et al. Page 7
Nat Genet. Author manuscript; available in PMC 2016 March 01.
Author M
anuscriptA
uthor Manuscript
Author M
anuscriptA
uthor Manuscript

Discussion
When the results of the EAC reanalysis is interpreted jointly with our earlier data on
genomic analysis of paired BE/EAC cases, the results lead us to refine the previous model of
the emergence of EAC from BE. EAC has been thought to follow the progressive
accumulation of genomic alterations, starting with CDKN2A followed by expansion of a
TP53 mutant dysplastic clone that is able to develop tetraploidy and genomic instability7,20.
Consistent with this idea we confirm that BE harbors frequent TSG alterations, even in BE
segments clonally unrelated to the cancer, corroborating reports of TSG inactivation in non-
dysplastic BE21 and clonal diversity within BE22. Our data reinforce models that underscore
the importance of TP53 mutation in neoplastic progression of BE23. However, our results
also suggest that, in many cases, TP53 mutations occur earlier in the disease process relative
to other alterations (including loss of CDKN2A) and can be detected in the non-dysplastic
BE of those which progress to cancer. In addition, our data suggest that oncogene activation
via amplification may often be a critical later event in transformation to invasive EAC. This
sequence of events is in contrast to that seen in pancreatic or colorectal cancer where
oncogene activation via mutation is believed to occur earlier, typically before TP53
inactivation24 – 27.
Our data therefore suggests that the traditional BE progression model conflates two general
pathways for oncogenic transformation (Fig. 8). One pathway, starting similarly to the
traditional model, appears to involve progressive accumulation of TSG losses (commonly
CDKN2A and TP53 and also frequently including SMAD4 and alterations of chromatin
modifying enzymes), leading to genomic instability and oncogenic amplifications without an
antecedent WGD. Despite the prevalence of clonal expansions of BE tissues with somatic
inactivation of TSGs such as CDKN2A and ARID1A, a minority of EACs appear to emerge
following such a path without WGD. Instead, the majority of EACs apparently develop
following expansion of a TP53 mutant clone that undergoes WGD, with WGD
predominately seen in tissues with dysplasia. Genomic doubling has been documented to
facilitate the acquisition of genomic instability16,28,29. Consistent with this, those tumors
that emerged following WGD harbored marked genomic disruption and oncogene
amplification, with amplifications of known oncogenes observed in 77/90 WGD EAC
samples. Following WGD, homozygous inactivation of tumor suppressors becomes more
difficult due the additional number of events required14. Once WGD occurs, the more
expedient pathway to transformation is thus likely that of acquisition of oncogene activation
via structural genomic instability. The predilection for instability following WGD16,29–31
likely contributes to catastrophic genomic disruptions resulting in a large number of copy
number alterations, as recently identified by whole genome sequencing of EAC32. This
alternative pathway to transformation whereby a WGD dysplastic clone acquires oncogene
activation via amplification is supported by our findings that oncogene amplification is
typically a later event in the progression to EAC. Such episodes of genomic disruption could
lead to positive selection for distinct amplifications that bypass the need for the loss of
tumor-suppressors, as more frequently occurs in non-WGD EACs (Fig. 3). We note that it is
also possible that WGD cells are better able to survive catastrophic genomic disruption (e.g.
since such events are unlikely to generate complete gene knockouts), and may be less
Stachler et al. Page 8
Nat Genet. Author manuscript; available in PMC 2016 March 01.
Author M
anuscriptA
uthor Manuscript
Author M
anuscriptA
uthor Manuscript
subject to negative selection. While our limited dataset did not identify differences in
clinical stage between WGD and non-WGD EACs (Supplementary Fig. 21), future studies
will be needed to identify whether tumors following these distinct paths have other
distinguishing clinical features.
Both WGD and TP53 mutations have been recognized for over a decade to be risk-factors
for the development of EAC in patients with BE7,23,33,34. Here we are able to refine the
conventional model of how these tumors emerge, finding that TP53 mutations may be
earlier events than previously recognized. Following TP53 mutation many EACs may
follow a distinct pathway to cancer involving WGD with subsequent transformation to
cancer via catastrophic aneuploidy and oncogene amplification. Our model is therefore
consistent with a recent complementary report which characterized the copy-number profiles
of serially collected BE biopsies by Li et al. in which the authors noted that in the 24 months
prior to cancer diagnosis a marked increase in DNA content occurred, suggestive of WGD7.
Our refined model positing a potentially more rapid path to transformation following
acquisition of a TP53 mutation and WGD may help explain the failure of endoscopic
screening of BE patients to prevent cancer diagnoses and deaths. Screening strategies are
largely premised upon the concept that BE is at risk of gradual accumulation of genomic
alterations leading to progression to cancer. This model would predict that just as aging
predisposes to cancer, duration of BE would also enhance cancer risk. However, contrary to
this concept, studies of population cohorts of patients with diagnoses of BE show that the
majority of EACs are detected within the first two to three years of initial endoscopic
diagnosis of BE, even when the incident endoscopy fails to identify dysplasia or cancer35–38.
If most EACs emerge from BE following a more rapid process involving TP53 mutation and
emergence of an unstable genomically doubled intermediate, new diagnostic strategies may
be required that seek out these TP53-mutant precursors and intermediates as a means of
detecting and preventing this deadly disease.
Online Methods
Sample selection and DNA extraction (fresh frozen)
Samples were obtained with documented informed consent and institutional IRB approval.
Fresh frozen samples were obtained at the time of surgical esophagectomy from patients
with a diagnosis of esophageal adenocarcinoma and without neoadjuvant therapy from the
University of Michigan. Samples of BE were selected not immediately adjacent to the tumor
(when possible) to minimize tumor contamination within the BE sample. Hematoxylin and
eosin (HE) stained slides from 27 cases were examined by a pathologist with sub-specialty
training in gastro-intestinal pathology. Slides from BE tissue were classified as either non-
dysplastic or dysplastic. Samples with high and low grade dysplasia were combined for
primary analysis due to overall low numbers and the diagnostic challenges and controversies
associated with distinguishing between these entities (especially on frozen section slides).
Additional subanalyses looked separately at these diagnoses. Two cases were excluded from
further analysis as one case contained too low of a percentage of BE and one BE tissue was
contaminated with invasive tumor. DNA was extracted using phenol chloroform and ETOH
precipitation and quantified using Picogreen dsDNA Quantification Reagent (Invitrogen).
Stachler et al. Page 9
Nat Genet. Author manuscript; available in PMC 2016 March 01.
Author M
anuscriptA
uthor Manuscript
Author M
anuscriptA
uthor Manuscript
Sample selection and DNA extraction (formalin fixed and paraffin embedded)
With documented informed consent and institutional IRB approval, formalin fixed paraffin
embedded (FFPE) esophagectomy samples without neoadjuvant therapy were identified in
the pathology archives of the University of Pittsburgh Medical Center and Brigham and
Women’s Hospital. HE slides were reviewed by two gastrointestinal pathologists to
determine consensus areas of BE, BE with low grade dysplasia, BE with high grade
dysplasia, and esophageal adenocarcinoma. If uncertainty for a diagnosis was present, a
third pathologist reviewed the sample. Any sample without a consensus diagnosis was
eliminated from analysis. Ten 8 micron sections were cut onto PEN membrane frame slides
(Life Technologies, Grand Island, NY) bracketed by standard slides for HE staining. The
frame slides were stained using Arcturus paradise plus stain (Life Technologies) following
the manufacturers recommendations. The areas of interest were microdissected using the
ArcturusXT laser capture microdissection Instrument (Life Technologies). DNA was
isolated using the Qiagen (Valencia, CA) FFPE DNA isolation kit following the
manufacturers protocol with the exception that the tissue was digested with proteinase K
overnight. DNA was quantified using Picogreen dsDNA Quantification Reagent.
Whole exome sequencing
Whole-exome capture libraries were constructed from 100ng of DNA following shearing,
end repair, phosphorylation and ligation to barcoded sequencing adapters39. DNA was size-
selected for lengths between 200–350bp and subjected to exonic hybrid capture using
SureSelect v2 Exome bait (Agilent). Samples were multiplexed and sequenced on multiple
Illumina HiSeq flow cells. Mean target exome coverage of 95x was achieved in the Barrett’s
DNA, 85x in the neoplastic DNA, and 87x in the normal tissue.
Sequencing data processing
Exome sequence data processing and analysis were performed using Broad Institute
pipelines as previously described40–43. A BAM file aligned to the hg19 human genome
build was generated from sequencing reads for each sample by the “Picard” pipeline.
Mutation calling
The MuTect algorithm was used to identify somatic mutations41,42,44. We required a
minimum of 14 reads covering a site in the tumor and 8 in the normal for declaring a site is
adequately covered for mutation calling. We determined the lowest allelic fraction at which
somatic mutations could be detected on a per-sample basis, using estimates of cross-
contamination from the ContEst pipeline45. Small somatic insertions and deletions were
detected using the Indelocator algorithm after local realignment of tumor and normal
sequences44. All somatic mutations detected by WES were analyzed for potential false-
positive calls by performing a comparison to mutation calls from a panel of 2,500 germline
DNA samples. Mutations found in 2% of the germline samples or 2% of sequencing reads
were removed from analysis.
Because of our goal of comparing the presence and absence of mutations between distinct
samples taken from the same patient, we utilized a tool designed to specifically query
evidence for mutations or insertions/deletions called in one sample for evidence of their
Stachler et al. Page 10
Nat Genet. Author manuscript; available in PMC 2016 March 01.
Author M
anuscriptA
uthor Manuscript
Author M
anuscriptA
uthor Manuscript
presence, even at low allelic fraction, in other samples from the same patient. The strong
prior of having been called de-novo in one sample allows for more sensitive detection in
other related samples. This method, termed ‘force calling’, utilizes outputs from MuTect and
Indelocator to generate an aggregate set of somatic events for each patient. Then, it adopts
Samtools to count the number of reads supporting the reference or alternate alleles at those
sites in the other matched samples. Reads are considered if they are from unique pairs, have
a base quality at the site of interest of greater than or equal to 20, and read quality greater
than or equal to 5.
Mutation annotation
Somatic single-nulcleotide variants, insertions, and deletions were annotated using
Oncotator (www.oncotator.org), which uses information from publicly available
databases46–50.
Calculation of total and allelic copy-numbers from whole exome sequencing data
Genome-wide copy-ratio profiles were inferred using CAPSEG. Read-depth at informative
capture targets in tumor samples was calibrated to estimate copy-ratio using depths observed
in a panel of normal (non-cancer) diploid genomes. The resulting copy-ratio profiles were
then segmented using the circular binary segmentation (CBS) algorithm51. Allelic copy-
number analysis was then performed by examination of alternate and reference read counts
at heterozygous SNP positions (as determined by analysis of the matched normal sample).
These counts were used to infer the contribution of the two homologous chromosomes to the
observed copy-ratio in each segment. Further analysis of change-points in these allelic-ratios
was performed using PSCBS52, refining the segmentation. Finally, for each segment, we
combined the copy-ratio and allelic data to derive allelic copy-ratios, which were input for
analysis with ABSOLUTE14.
The ABSOLUTE14 computational tool (v1.2) was used to provide computational estimates
of several parameters for each neoplastic sample in this study. These estimates include: (i)
the purity of each sample (fraction of nuclei in the sample originating from tumor or BE);
(ii) the average ploidy of the cancer or BE genome; (iii) the presence of antecedent genomic
doubling for each genome; and (iv) the absolute allelic copy-number across the genome.
ABSOLUTE takes as input the segmented allelic copy-number ratio data (as described
above) as well as the allele fractions of somatic point mutations (aberrant reads as a ratio of
total reads covering the locus), and then determines possible combinations of tumor purity,
ploidy and antecedent genomic doubling which fit the allelic copy-number ratio data and
point-mutation variant allele fraction (VAF; Supplementary Fig. 9). The ABSOLUTE
solutions were reviewed manually to maximize concordance with the data (A.T.W.).
Calculation of point-mutation CCF distributions
For each somatic mutation, we computationally estimated the fraction of neoplastic cells
within a specific DNA sample that harbors the mutation, i.e. its cancer cell fraction (CCF).
This fraction is represented as a distribution between 0 and 1.14,53,54 A CCF value of 1
corresponds to a mutation present in 100% of neoplastic cells in a sample. A CCF value of
<1 indicates that the mutation is present in a subset of the neoplastic cells in a sample and
Stachler et al. Page 11
Nat Genet. Author manuscript; available in PMC 2016 March 01.
Author M
anuscriptA
uthor Manuscript
Author M
anuscriptA
uthor Manuscript
thus is subclonal. Probability distributions for CCF values were computed by correcting
mutant and reference read counts from Illumina sequencing for the estimated sample purity
and local copy-number14 (Supplementary Fig. 9), as previously described.53,54
After the initial determination of a CCF distribution for each mutation, we then perform an
additional analysis to refine our CCF estimates, based on the assumption that each
neoplastic sample contained a small (but unknown) number of distinct populations defined
by mutations that share the same CCF. This clustering is performed using Bayesian
clustering that jointly estimates the CCF values and number of populations based upon the
set of CCF distributions from each sample. This technique utilizes sampling from a mixture
of Dirichlet processes using a Monte Carlo Markov Chain (MCMC) sampler, as previously
described (Supplementary Fig. 11a, b)53,54. We used 250 MCMC iterations where the 125
initial were discarded as ‘burn-in’. A prior over the number of mutation clusters in a given
sample was specified using a negative binomial distribution (r=10, mu=3), which favored
1–5 clusters (Supplementary Fig. 11d). A partition of mutations was obtained based on how
often each pair of mutations was assigned to the same cluster during the MCMC simulation
(after convergence). A distance metric was generated from the inverse of each pair-count,
and hierarchical clustering was performed using complete linkage. The resulting tree was
divided into k clusters, with k chosen as the lowest number of sampled clusters in the
MCMC (Supplementary Fig. 11c, d).
Calculation of statistical power for detection of shared somatic mutations
To calculate power, we considered the expected variant allele fraction (VAF) of a point
mutation with CCF=1 and multiplicity=1, given the sample purity and local copy number.
For mutations detected in only a subset of the tissue samples comprising a given case, we
calculated the paired-detection power. Because shared mutations with a single supporting-
read matching the called allele were called by the forced-calling procedure (described
above), we calculated power as the probability of observing one or more such read, given its
expected VAF and sequence coverage.
Relatedness calculations
Relatedness was calculated by taking the total number of shared mutations that were present
at CCF=1 in both samples divided by the sum of the total number of with CCF=1 mutations
in either sample (Supplementary Fig. 1). The relatedness using all mutations (CCF=1 and
CCF<1) was also calculated and reported in Supplementary Table 1. We also searched for
evidence of shared copy-number aberrations, which would provide independent support for
a potential common origin in a EAC/BE pair beyond shared point mutations, For each
segment in the EAC samples with copy number greater than 2.5 or less than 1.5 we looked
at the matched Barrett’s sample to see if there is also a segment greater than 2.5 or less than
1.5 that is 50% mutually overlapping with the segment in the EAC. If so, it was called
shared. Using this analysis, we did not find any additional shared EAC/BE pairs not detected
based upon shared somatic mutations.
Stachler et al. Page 12
Nat Genet. Author manuscript; available in PMC 2016 March 01.
Author M
anuscriptA
uthor Manuscript
Author M
anuscriptA
uthor Manuscript

Phylogenetic inference
Tumors can exhibit genetic heterogeneity both across different regions55–58 and within
single cancer-tissue samples.14,53,54,59,60,61 Heterogeneity within individual tissue samples
presents a difficulty to standard phylogenetic inference algorithms, which typically
distinguish only between the presence or absence of mutations in each sample. These
algorithms attempt to construct phylogenetic trees relating each tissue sample, which may
not accurately reflect the evolutionary relationships between the neoplastic cell-populations
represented in the tissue samples. For example, shared mutations (present in multiple
samples) due to overlapping subclonal populations would be mistaken as evidence for
shared ancestry between the samples.
To address this difficulty, we utilized quantitative information about each mutation’s
prevalence in each neoplastic tissue sample (CCF) in order to determine whether the tissue
samples were sufficiently diverged from one another such that no detectable overlap of
minor subclones (CCF < 1) occurred, a scenario we term the branched-sibling model. In this
scenario, it is valid to construct standard phylogenetic trees relating each tissue sample, with
minor subclones (CCF < 1) private to each tissue sample represented as subtrees
(“microphylogenies”) grafted on to each sample tip. The branched-sibling scenario implies
that such trees accurately represent the evolutionary relationship of all subclonal populations
detected in the sampled neoplastic tissues. A corollary of the branched-sibling model is that
all mutations shared in two or more samples must have CCF=1 wherever they are present
(Supplementary Fig. 12a, b). Thus, the appearance of mutations shared in two or more
samples with CCF<1 in any of them either represents technical artifact or constitutes
evidence that the branched-sibling approximation is not an accurate description of those
samples.
We constructed phylogenetic trees representing the evolutionary relationship between the
neoplastic tissue-samples sequenced from each patient using a semiautomated four-stage
process, described below. First, we searched for the optimal tree that would explain the
observed matrix of binary point-mutation presence or absence data in each sample, given the
standard phylogenetic assumptions that specific mutations arise uniquely in each patient and
that there were negligible rates of mutation loss (e.g. due to chromosomal deletion of a
mutant allele). We searched for the phylogenetic tree with maximum parsimony using the
standard parsimony-ratchet method.62
Second, we applied the Bayesian CCF-clustering procedure described above to each sample
individually, retaining all mutations provisionally called with > 0 supporting reads in that
sample. A single pseudo-count observation was added corresponding to a cluster at CCF=1.
We then identified all provisional mutation calls (> 0 supporting reads) made in at least two
samples of the case that were assigned to a CCF cluster with posterior mode < 1.0
(Supplementary Fig. 12). These mutation calls represent either sequencing artifacts or
evidence for overlapping minor subclones in the sampled neoplastic tissues (violating the
branched-sibling approximation). We rejected such sites if the number of supporting reads
was < 3, and this modified matrix of mutation calls was then used to assign each mutation to
a branch of the phylogenetic tree (Supplementary Fig. 12b).
Stachler et al. Page 13
Nat Genet. Author manuscript; available in PMC 2016 March 01.
Author M
anuscriptA
uthor Manuscript
Author M
anuscriptA
uthor Manuscript

We also distinguished mutations that were underpowered for detection in some samples (as
described above). For each sample, the number of mutations in each category is shown in
Supplementary Fig. 12c. Assignment of gene-level SCNAs to branches was performed in a
similar manner (Supplementary Fig. 12d).
Third, we refined the tips of each phylogenetic tree by distinguishing between private
mutations that occurred in all neoplastic cells of given sample (CCF=1) compared to those
that occurred in only a minor subclone (CCF < 1) specific to that sample. For this distinction
we applied Bayesian clustering techniques (described above) to the mutations identified only
in that sample. We added N pseudo-count observations of CCF=1, with N representing the
number of mutations called in >1 samples of the case that were also called in the sample
being considered. This process partitioned the private mutations in each sample into putative
subclones with common CCF values (Supplementary Fig. 10). We modified the
phylogenetic trees by replacing each (non-germline) tip with the subtree consistent with the
maximally branching microphylogeny respecting the rule that the sum of sibling-subclone
CCF values cannot exceed that of their most recent common ancestor; Fig. 4 and 5,
Supplementary Fig. 13).
Fourth, we examined whether evidence that the branched-sibling model was not an adequate
approximation of the sampled neoplastic tissues could be discerned. For each case, we
analyzed the two-dimensional CCF distributions of point mutations for all unique tissue-
sample pairs (Supplementary Fig. 11) using a 2D version of the Bayesian clustering
algorithm described above.63 Examination of these data revealed robust clusters of
mutations with CCF=1 in both samples of clonally related pairs. In addition, many pairs
harbored mutations with CCF=1 in one sample that were undetected in the paired sample
(and vice-versa). Most samples also harbored mutations with CCF<1 that were undetected in
the paired sample. Furthermore, for most patients only a small fraction of mutations with
CCF<1 appeared to be detected in both sample-pairs, and did not tend to form strong
clusters (consistent with sequencing artifacts; Supplementary Fig. 11). Taken together, these
observations implied that most tissue samples were well approximated by the branched-
sibling model (Supplementary Fig. 11), since true overlap of minor populations from distinct
subclonal branches would tend to displace the CCF values of mutations private to each
sample, so that none would have CCF=1.
In the two cases where evidence contradicting the branched-sibling model was observed,
phylogenetic trees were manually adjusted (as described below) to accurately reflect the
evolutionary relationship between the different clonal lineages as shown in Fig. 4, 5. This
was done in a manner analogous to that described in a recent report61; here we extended
similar logic to the scenario where the same subclone was present in multiple tissue samples.
Detailed analysis of mutation CCFs for each patient, including the automatically generated
phylogenetic trees (prior to manual adjustment), are available in Supplementary Files 3, 4.
For patients 4 and 6, nearly every shared mutation had CCF=1. For patient 1, the shared
mutations with CCF<1 did not appear to form a strong cluster, or to displace other clusters
away from CCF=1. We therefore assumed that these mutations did not constitute strong
Stachler et al. Page 14
Nat Genet. Author manuscript; available in PMC 2016 March 01.
Author M
anuscriptA
uthor Manuscript
Author M
anuscriptA
uthor Manuscript
evidence of a branched-sibling violation, and accepted the automatically produced
phylogenies for these cases.
For patient 3, we detected a minor population in sample EAC1 (subclone1; CCF=0.2)
defined by 45–200 mutations (which were present at CCF=1 in the shared MET1/HGD1/
EAC2 branch. We adjusted the phylogenetic tree (Fig. 5b) to move EAC1 onto a distinct
branch from these samples in order to represent the dominant subclone (subclone2;
CCF=0.8) in EAC1, which had an evolutionary origin distinct from that of subclone1. In
addition, samples HGD1 and MET1 appeared to share a small subclone (CCF=0.05) defined
by 5 mutations that did not appear elsewhere in the case. We removed the shared branch
defined by these mutations from the phylogeny as they did not reflect shared recent ancestry
of the dominant subclones in HGD1 and MET1 (Fig. 5b). For patient 7, the details regarding
the phylogenic tree generation are detailed in the main text.
Fluorescent in-situ hybridization
In P3, we wanted to confirm the genome doubling status in two apparent genomically
unrelated tumors. ABSOLUTE predicted that one of the samples has undergone a genomic
doubling event, whereas the other did not. We performed FISH analysis co-labeling a 4 μm
FFPE section with two differently labeled centromeric markers for chromosomes that are
relatively stable in EAC (CEP 2 and CEP 4). After review and identification of the areas of
interest, the probes were enumerated by two senior research technologists within the
Brigham and Women’s cytogenomics core facility. Each technologist counted 50 cells per
sample and the number of CEP 2 and CEP 4 probes per cell were averaged. In P7, we
performed FISH for KRAS and CEP 12 from samples LGD1, HGD2, and EAC1 to confirm
the finding that the amplification was present EAC1 but not the premalignant lesions. FISH
was performed on the paired samples BE 63 and EAC 63 for ERBB2 and CEP 17. All FISH
studies were performed with standard techniques. The gene to CEP ratio was calculated and
a ratio of greater than 2 was considered positive.
Supplementary Material
Refer to Web version on PubMed Central for supplementary material.
Acknowledgments
We thank the members of the Broad Institute Genome Sequencing Platform and the Molecular laboratories at Brigham and Women’s and Massachusetts General Hospital for their assistance. We are grateful to the patients and families who agreed to contribute their samples to enable this research and to the physicians and hospital staff whose effects to collecting these samples is essential to this work. This work was supported by the National Institutes of Health T32 HL007627 and the Dana-Farber/Harvard GI Cancer Specialized Programs of Research Excellence P50CA127003 (M.D.S), National Human Genome Research Institute (NHGRI) Large-Scale Sequencing Program (U54 HG0003067; E.S.L), U54 CA163059 (D.G.B), Broad Institute SPARC funding (A.J.B., S.L.C, and G.G.), Research Scholar Grant from the American Cancer Society (A.J.B.), and the National Cancer Institute (P01 CA098101; U54 CA163004 A.J.B.)
References
1. Nehra D, Howell P, Williams CP, Pye JK, Beynon J. Toxic bile acids in gastro-oesophageal reflux disease: influence of gastric acidity. Gut. 1999; 44:598–602. [PubMed: 10205192]
Stachler et al. Page 15
Nat Genet. Author manuscript; available in PMC 2016 March 01.
Author M
anuscriptA
uthor Manuscript
Author M
anuscriptA
uthor Manuscript

2. Wild CP, Hardie LJ. Reflux, Barrett’s oesophagus and adenocarcinoma: burning questions. Nat Rev Cancer. 2003; 3:676–84. [PubMed: 12951586]
3. Lagergren J, Bergstromeinhold R, Lingren A, Nyren O. Symptomatic Gastoroesophageal Reflux as a Risk Factor for Esophageal Adenocarcinoma. NEJM. 1999; 340:825–831. [PubMed: 10080844]
4. Ormsby AH, et al. The Location and Frequency of Intestinal Metaplasia at the Esophagogastric Junction in 223 Consecutive Autopsies: Implications for Patient Treatment and Preventive Strategies in Barrett’s Esophagus. Mod Pathol. 2000; 6:614–620. [PubMed: 10874664]
5. Galipeau PC, Prevo LJ, Sanchez Ca, Longton GM, Reid BJ. Clonal Expansion and Loss of Heterozygosity at Chromosomes 9p and 17p in Premalignant Esophageal (Barrett’s) Tissue. JNCI J Natl Cancer Inst. 1999; 91:2087–2095. [PubMed: 10601379]
6. Gu J, et al. Genome-wide catalogue of chromosomal aberrations in barrett’s esophagus and esophageal adenocarcinoma: a high-density single nucleotide polymorphism array analysis. Cancer Prev Res. 2010; 3:1176–1186.
7. Li X, et al. Temporal and spatial evolution of somatic chromosomal alterations: A case-cohort study of Barrett’s esophagus. Cancer Prev Res. 2013
8. Li X, et al. Single nucleotide polymorphism-based genome-wide chromosome copy change, loss of heterozygosity, and aneuploidy in Barrett’s esophagus neoplastic progression. Cancer Prev Res. 2008; 1:413–423.
9. Reid BJ, et al. Barrett’s esophagus: ordering the events that lead to cancer. Eur J cancer Prev. 1996; 5:57–65. [PubMed: 9061296]
10. Wong DJ, et al. p16 INK4a Lesions Are Common, Early Abnormalities that Undergo Clonal Expansion in Barrett’s Metaplastic Epithelium p16 INK4a Lesions Are Common, Early Abnormalities that Undergo Clonal Expansion. Cancer Res. 2001; 61:8284–8289. [PubMed: 11719461]
11. Zhang S, Wang XI. SIRT1 is a Useful Biomarker for High-Grade Dysplasia and Carcinoma in Barrett’s Esophagus. 2013; 43:373–377.
12. Paulson TG, et al. p16 mutation spectrum in the premalignant condition Barrett’s esophagus. PLoS One. 2008; 3:e3809. [PubMed: 19043591]
13. Dulak AM, et al. Exome and whole genome sequencing of esophageal adenocarcinoma identifies recurrent driver events and mutational complexity. Nat Genet. 2013; 45:1–21. [PubMed: 23268125]
14. Carter SL, et al. Absolute quantification of somatic DNA alterations in human cancer. Nat Biotechnol. 2012; 30:413–21. [PubMed: 22544022]
15. Dulak AM, et al. Gastrointestinal adenocarcinomas of the esophagus, stomach, and colon exhibit distinct patterns of genome instability and oncogenesis. Cancer Res. 2012; 72:4383–93. [PubMed: 22751462]
16. Fujiwara T, et al. Cytokinesis failure generating tetraploids promotes tumorigenesis in p53-null cells. Nature. 2005; 437:1043–7. [PubMed: 16222300]
17. Davoli T, de Lange T. Telomere-driven tetraploidization occurs in human cells undergoing crisis and promotes transformation of mouse cells. Cancer Cell. 2012; 21:765–76. [PubMed: 22698402]
18. Zack TI, et al. Pan-cancer patterns of somatic copy number alteration. Nat Genet. 2013; 45:1134–1140. [PubMed: 24071852]
19. Etemadmoghadam D, et al. Resistance to CDK2 inhibitors is associated with selection of polyploid cells in CCNE1-amplified ovarian cancer. Clin Cancer Res. 2013; 19:5960–71. [PubMed: 24004674]
20. Maley CC, et al. Selectively advantageous mutations and hitchhikers in neoplasms: p16 lesions are selected in Barrett’s esophagus. Cancer Res. 2004; 64:3414–3427. [PubMed: 15150093]
21. Weaver JMJ, et al. Ordering of mutations in preinvasive disease stages of esophageal carcinogenesis. Nat Genet. 2014; 8:837–43. [PubMed: 24952744]
22. Maley CC, et al. Genetic clonal diversity predicts progression to esophageal adenocarcinoma. Nat Genet. 2006; 38:468–73. [PubMed: 16565718]
23. Reid BJ, et al. Predictors of Progression in Barrett’s Esophagus II: Baseline 17p (p53) Loss of Heterozygosity Identifies a Patient Subset at Increased Risk for Neoplastic Progression. Am J Gastroenterol. 2001; 96:2839–2848. [PubMed: 11693316]
Stachler et al. Page 16
Nat Genet. Author manuscript; available in PMC 2016 March 01.
Author M
anuscriptA
uthor Manuscript
Author M
anuscriptA
uthor Manuscript
24. Van Wyk R, et al. Somatic mutations of the APC, KRAS, and TP53 genes in nonpolypoid colorectal adenomas. Genes Chromosomes Cancer. 2000; 27:202–8. [PubMed: 10612810]
25. Prestlow T, Prestlow T. No Mutant KRAS in aberrant crypt foci (ACF): Initiation of colorectal cancer? Biochim Biophys Acta. 2005; 1756:83–96. [PubMed: 16219426]
26. Lüttges J, et al. The K-ras mutation pattern in pancreatic ductal adenocarcinoma usually is identical to that in associated normal, hyperplastic, and metaplastic ductal epithelium. Cancer. 1999; 85:1703–10. [PubMed: 10223563]
27. Deramaudt T, Rustgi A. Mutant KRAS in the initiation of pancreatic cancer. Biochim Biophys Acta. 2005; 1756:97–101. [PubMed: 16169155]
28. Gordon DJ, Resio B, Pellman D. Causes and consequences of aneuploidy in cancer. Nat Rev Genet. 2012; 13:189–203. [PubMed: 22269907]
29. Dewhurst SM, et al. Tolerance of whole-genome doubling propagates chromosomal instability and accelerates cancer genome evolution. Cancer Discov. 2014; 4:175–85. [PubMed: 24436049]
30. Davoli T, de Lange T. The causes and consequences of polyploidy in normal development and cancer. Annu Rev Cell Dev Biol. 2011; 27:585–610. [PubMed: 21801013]
31. Ganem N, et al. Cytokinesis failure triggers hippo tumor suppressor pathway activation. Cell. 2014; 158:833–48. [PubMed: 25126788]
32. Nones K, et al. Genomic catastrophes frequently arise in esophageal adenocarcinoma and drive tumorigenesis. Nat Commun. 2014; 5:5224. [PubMed: 25351503]
33. Rabinovitch P, Reid B, Haggit R, Norwood T, Rubin C. Progression to cancer in Barrett’s esophagus is associated with genomic instability. Lab Invest. 1989; 60:65–71. [PubMed: 2911184]
34. Davelaar AL, et al. Aberrant TP53 detected by combining immunohistochemistry and DNA-FISH improves Barrett’s esophagus progression prediction: A prospective follow-up study. Genes Chromosomes Cancer. 2015; 54:82–90. [PubMed: 25284618]
35. Bytzer P, Christensen PB, Damkier P, Vinding K, Seersholm N. Adenocarcinoma of the Esophagus and Barrett’s Esophagus: A Population-Based Study. 1999; 94:1–6.
36. Westona P, et al. Long-term follow-up of Barrett’s high-grade dysplasia. Am J Gastroenterol. 2000; 95:1888–93. [PubMed: 10950031]
37. Corley D, Levin TR, Habel L, Weiss NS, Buffler P. Surveillance and survival in Barrett’s adenocarcinomas: A population-based study. Gastroenterology. 2002; 122:633–640. [PubMed: 11874995]
38. Hvid-Jenson F, Pedersen L, Drewes A, Sorensen H, Funch-Jensen P. Incidence of adenocarcinoma among patients with Barrett’s esophagus. N Engl J Med. 2011; 365:1375–1383. [PubMed: 21995385]
39. Fisher S, et al. A scalable, fully automated process for construction of sequence-ready human exome targeted capture libraries. Genome Biol. 2011; 12:R1. [PubMed: 21205303]
40. Berger MF, et al. The genomic complexity of primary human prostate cancer. Nature. 2011; 470:214–20. [PubMed: 21307934]
41. Chapman M, Lawrence M, Keats J. Initial genome sequencing and analysis of multiple myeloma. Nature. 2011; 471:467–472. [PubMed: 21430775]
42. Barbieri CE, et al. Exome sequencing identifies recurrent SPOP, FOXA1 and MED12 mutations in prostate cancer. Nat Genet. 2012; 44:685–9. [PubMed: 22610119]
43. Stransky N, et al. The mutational landscape of head and neck squamous cell carcinoma. Science. 2011; 333:1157–60. [PubMed: 21798893]
44. Cancer genome action network. Integrated genomic analyses of ovarian carcinoma. Nature. 2011; 474:609–15. [PubMed: 21720365]
45. Cibulskis K, et al. ContEst: estimating cross-contamination of human samples in next-generation sequencing data. Bioinformatics. 2011; 27:2601–2. [PubMed: 21803805]
46. Fujita, Pa, et al. The UCSC Genome Browser database: update 2011. Nucleic Acids Res. 2011; 39:D876–82. [PubMed: 20959295]
47. Sherry ST, et al. dbSNP: the NCBI database of genetic variation. Nucleic Acids Res. 2001; 29:308–11. [PubMed: 11125122]
Stachler et al. Page 17
Nat Genet. Author manuscript; available in PMC 2016 March 01.
Author M
anuscriptA
uthor Manuscript
Author M
anuscriptA
uthor Manuscript
48. Griffith OL, et al. ORegAnno: an open-access community-driven resource for regulatory annotation. Nucleic Acids Res. 2008; 36:D107–13. [PubMed: 18006570]
49. UniProt Consortium. Ongoing and future developments at the Universal Protein Resource. Nucleic Acids Res. 2011; 39:D214–9. [PubMed: 21051339]
50. Forbes, Sa, et al. COSMIC: mining complete cancer genomes in the Catalogue of Somatic Mutations in Cancer. Nucleic Acids Res. 2011; 39:D945–50. [PubMed: 20952405]
51. Venkatraman ES, Olshen AB. A faster circular binary segmentation algorithm for the analysis of array CGH data. Bioinformatics. 2007; 23:657–63. [PubMed: 17234643]
52. Olshen AB, et al. Parent-specific copy number in paired tumor-normal studies using circular binary segmentation. Bioinformatics. 2011; 27:2038–46. [PubMed: 21666266]
53. Landau DA, et al. Evolution and impact of subclonal mutations in chronic lymphocytic leukemia. Cell. 2013; 152:714–726. [PubMed: 23415222]
54. Lohr JG, Stojanov P, Carter SL, Cruz-gordillo P, Lawrence MS. Widespread Genetic Heterogeneity in Multiple Myeloma: Implications for Targeted Therapy. Cancer Cell. 2014; 25:91–101. [PubMed: 24434212]
55. Campbell PJ, et al. The patterns and dynamics of genomic instability in metastatic pancreatic cancer. Nature. 2010; 467:1109–1113. [PubMed: 20981101]
56. Gerlinger M, et al. Intratumor Heterogeneity and Branched Evolution Revealed by Multiregion Sequencing. N Engl J Med. 2012; 366:883–892. [PubMed: 22397650]
57. Liu W, et al. Copy Number Analysis Indicates Monoclonal Origin of Lethal Metastatic Prostate Cancer. Nat Med. 2009; 15:559–565. [PubMed: 19363497]
58. Navin N, et al. Tumour evolution inferred by single-cell sequencing. Nature. 2011; 472:90–94. [PubMed: 21399628]
59. Shah SP, et al. Mutational evolution in a lobular breast tumour profiled at single nucleotide resolution. Nature. 2009; 461:809–813. [PubMed: 19812674]
60. Nik-Zainal S, et al. Mutational processes molding the genomes of 21 breast cancers. Cell. 2012; 149:979–993. [PubMed: 22608084]
61. McFadden DG, Papagiannakopoulos T, Taylor-Weiner A, et al. Genetic and clonal dissection of murine small cell lung carcinoma progression by genome sequencing. Cell. 2014; 156:1298–311. [PubMed: 24630729]
62. Nixon KC. The Parsimony Ratchet, a New Method for Rapid Parsimony Analysis. Cladistics. 1999; 15:407–414.
63. Lawrence MS, et al. Mutational heterogeneity in cancer and the search for new cancer-associated genes. Nature. 2013; 499:214–8. [PubMed: 23770567]
Stachler et al. Page 18
Nat Genet. Author manuscript; available in PMC 2016 March 01.
Author M
anuscriptA
uthor Manuscript
Author M
anuscriptA
uthor Manuscript
Figure 1. Barrett’s esophagus has a mutation frequency comparable to many invasive cancers but shows few genomic amplificationsa) Mutation density (mutations per Mb of sequenced exome) of Barrett’s (BENoDys),
Barrett’s with dysplasia (BEDys), and esophageal adenocarcinoma (EAC) compared to
several other invasive cancers. Mutation density displayed on a logarithmic scale. Box plot
shows the median, limited by the 25th (Q1) 75th (Q3) percentiles, with the upper and lower
whiskers denoting the extreme most data point within Q_3 + 1.5*IQR or Q_1 – 1.5*IQR
respectively. N = 133 for prostate, 889 for breast, 14 for BE NoDys, 233 for colorectal, 141
for EAC, 11 for BEDys, and 401 for lung. b) “Lego” plots of mutation frequencies across 25
Barrett’s samples (left) and esophageal adenocarcinoma (right). Base substitutions are
divided into six categories to represent the six possible base changes (each category
represented by a different color). Substitutions are further divided by the 16 possible
flanking nucleotides surrounding the mutated base as listed in the corresponding box legend.
The inset pie chart indicates the distribution of all mutations for a given base. c) Mean
number of deletions per sample. d) Mean number of amplifications per sample. * denotes
statistically significant difference (P <0.05).
Stachler et al. Page 19
Nat Genet. Author manuscript; available in PMC 2016 March 01.
Author M
anuscriptA
uthor Manuscript
Author M
anuscriptA
uthor Manuscript
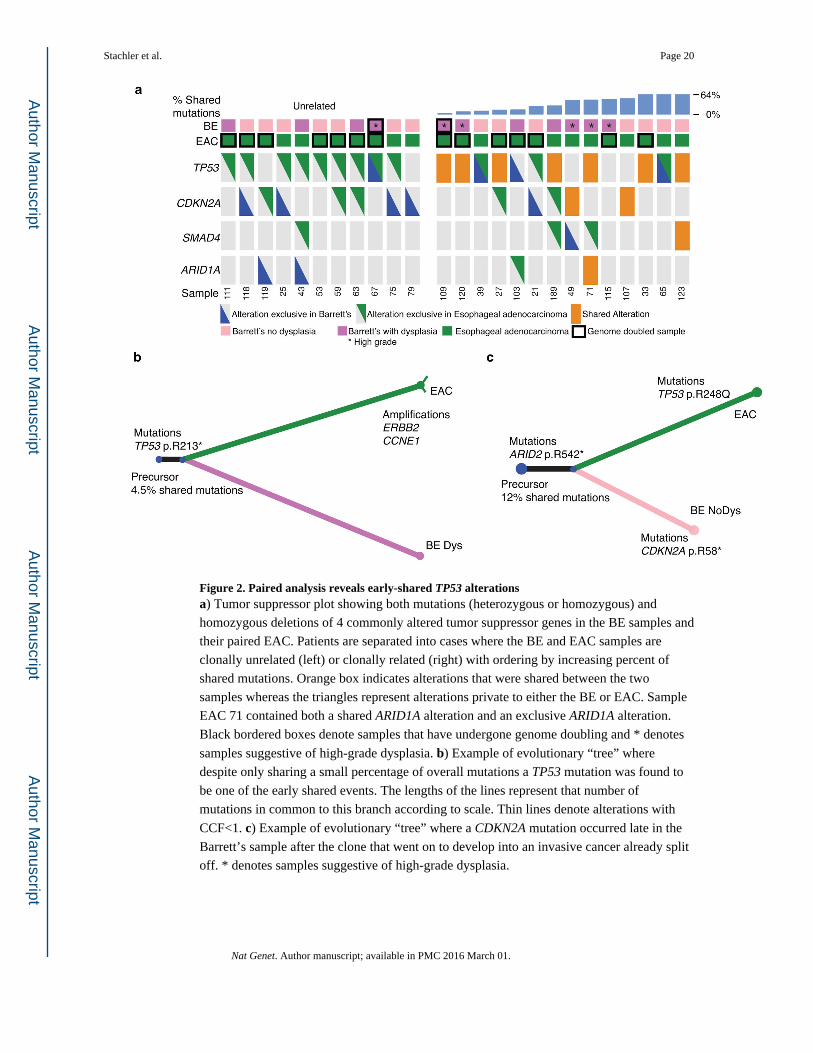
Figure 2. Paired analysis reveals early-shared TP53 alterationsa) Tumor suppressor plot showing both mutations (heterozygous or homozygous) and
homozygous deletions of 4 commonly altered tumor suppressor genes in the BE samples and
their paired EAC. Patients are separated into cases where the BE and EAC samples are
clonally unrelated (left) or clonally related (right) with ordering by increasing percent of
shared mutations. Orange box indicates alterations that were shared between the two
samples whereas the triangles represent alterations private to either the BE or EAC. Sample
EAC 71 contained both a shared ARID1A alteration and an exclusive ARID1A alteration.
Black bordered boxes denote samples that have undergone genome doubling and * denotes
samples suggestive of high-grade dysplasia. b) Example of evolutionary “tree” where
despite only sharing a small percentage of overall mutations a TP53 mutation was found to
be one of the early shared events. The lengths of the lines represent that number of
mutations in common to this branch according to scale. Thin lines denote alterations with
CCF<1. c) Example of evolutionary “tree” where a CDKN2A mutation occurred late in the
Barrett’s sample after the clone that went on to develop into an invasive cancer already split
off. * denotes samples suggestive of high-grade dysplasia.
Stachler et al. Page 20
Nat Genet. Author manuscript; available in PMC 2016 March 01.
Author M
anuscriptA
uthor Manuscript
Author M
anuscriptA
uthor Manuscript
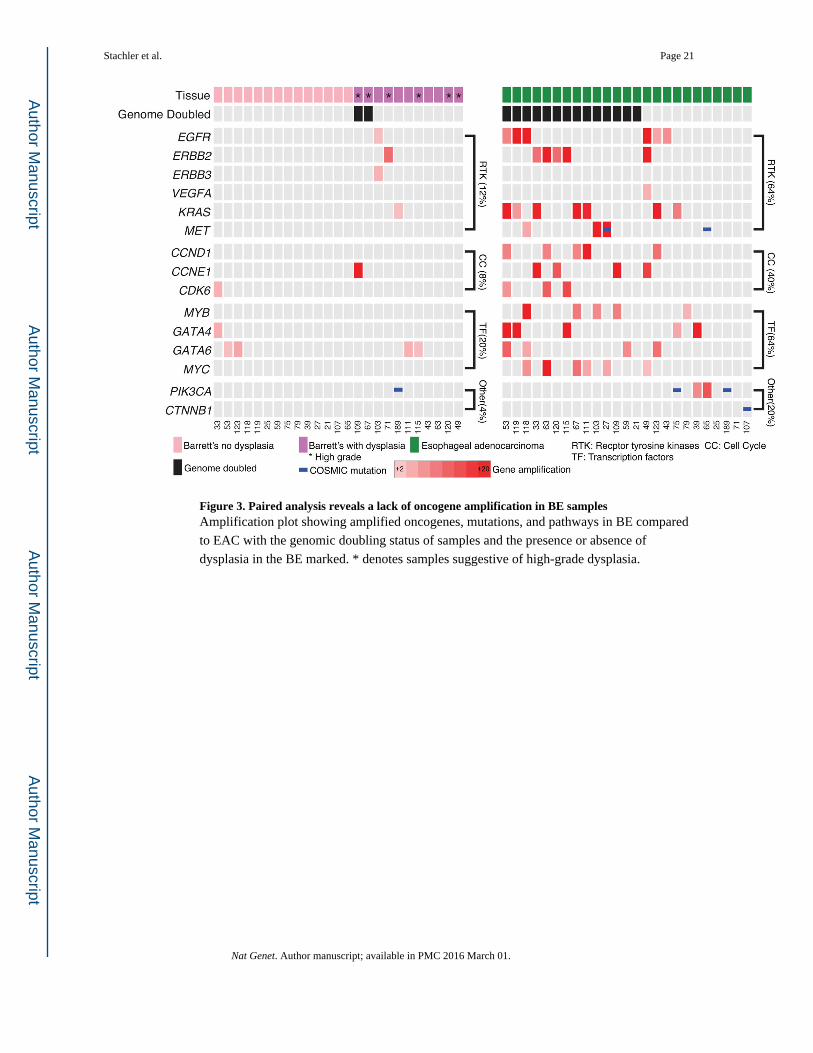
Figure 3. Paired analysis reveals a lack of oncogene amplification in BE samplesAmplification plot showing amplified oncogenes, mutations, and pathways in BE compared
to EAC with the genomic doubling status of samples and the presence or absence of
dysplasia in the BE marked. * denotes samples suggestive of high-grade dysplasia.
Stachler et al. Page 21
Nat Genet. Author manuscript; available in PMC 2016 March 01.
Author M
anuscriptA
uthor Manuscript
Author M
anuscriptA
uthor Manuscript
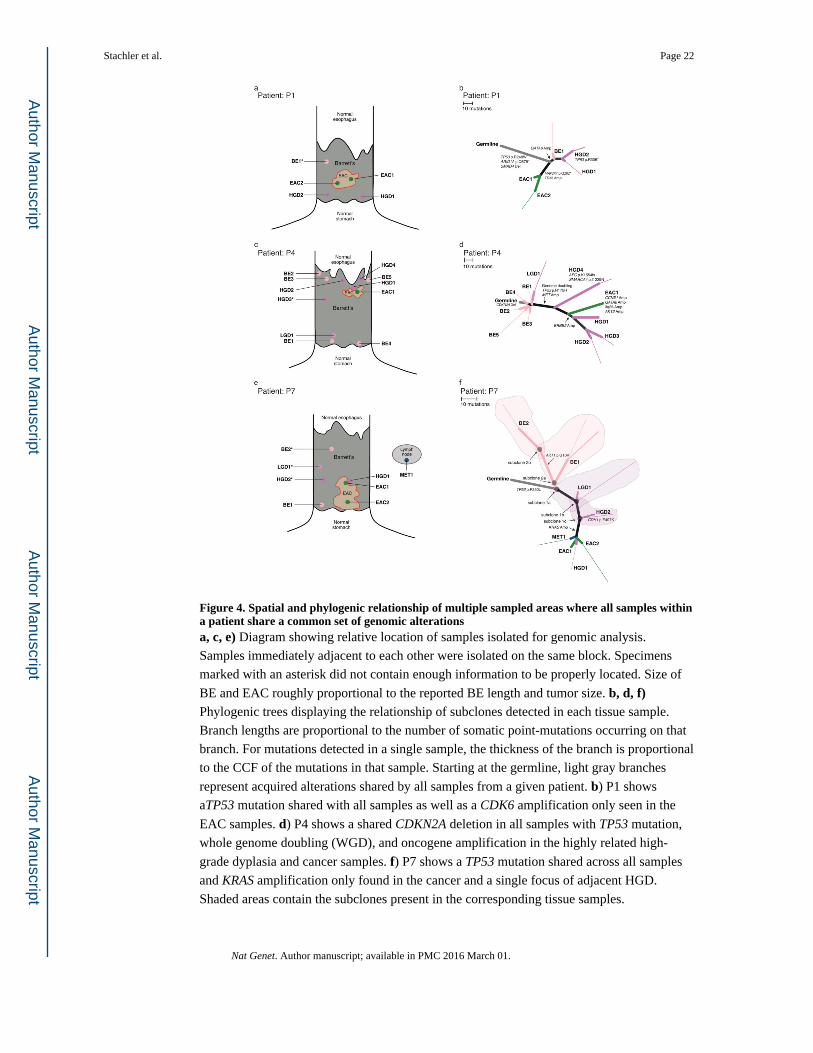
Figure 4. Spatial and phylogenic relationship of multiple sampled areas where all samples within a patient share a common set of genomic alterationsa, c, e) Diagram showing relative location of samples isolated for genomic analysis.
Samples immediately adjacent to each other were isolated on the same block. Specimens
marked with an asterisk did not contain enough information to be properly located. Size of
BE and EAC roughly proportional to the reported BE length and tumor size. b, d, f) Phylogenic trees displaying the relationship of subclones detected in each tissue sample.
Branch lengths are proportional to the number of somatic point-mutations occurring on that
branch. For mutations detected in a single sample, the thickness of the branch is proportional
to the CCF of the mutations in that sample. Starting at the germline, light gray branches
represent acquired alterations shared by all samples from a given patient. b) P1 shows
aTP53 mutation shared with all samples as well as a CDK6 amplification only seen in the
EAC samples. d) P4 shows a shared CDKN2A deletion in all samples with TP53 mutation,
whole genome doubling (WGD), and oncogene amplification in the highly related high-
grade dyplasia and cancer samples. f) P7 shows a TP53 mutation shared across all samples
and KRAS amplification only found in the cancer and a single focus of adjacent HGD.
Shaded areas contain the subclones present in the corresponding tissue samples.
Stachler et al. Page 22
Nat Genet. Author manuscript; available in PMC 2016 March 01.
Author M
anuscriptA
uthor Manuscript
Author M
anuscriptA
uthor Manuscript

Figure 5. Spatial and phylogenic relationship of multiple sampled areas in patients showing distinct clonal evolutiona, c) Diagram of sample location and diagnosis within the patient’s field of BE. Size of BE
and EAC roughly proportional to the reported BE length and tumor size. Specimens marked
with an asterisk did not contain enough information to be properly located. b, d) Phylogenic
trees displaying the relationship of subclones detected in each tissue sample. Branch lengths
are proportional to the number of somatic point-mutations occurring on that branch. For
mutations detected in a single sample, the thickness of the branch is proportional to the CCF
of the mutations in that sample. Black circles mark the starting point (germline) as there
were no somatic alterations common to all samples. b) P3 shows three distinct clonally
unrelated branches. The branch with BE2/LGD1 shows a CDKN2A deletion in the BE and
LGD samples only. The green shaded region represents tissue sample EAC1, which
contained a mixture of distinct cell populations, subclones 1 and 2. d) P6 shows a region of
Stachler et al. Page 23
Nat Genet. Author manuscript; available in PMC 2016 March 01.
Author M
anuscriptA
uthor Manuscript
Author M
anuscriptA
uthor Manuscript

BE tissue unrelated to the other high-grade and cancer samples, all of which share ATM and
SMAD2 mutations and WGD.
Stachler et al. Page 24
Nat Genet. Author manuscript; available in PMC 2016 March 01.
Author M
anuscriptA
uthor Manuscript
Author M
anuscriptA
uthor Manuscript
Figure 6. Tumor suppressor gene alterations are more common in non-genome doubled EACa) Representation of alterations of common tumor suppressors in a larger cohort of EAC
samples showing truncating mutations, missense mutations of hotspot site (as determined by
presence in the COSMIC repository at least 3 times) and homozygous deletions. Samples
are divided into cases that have undergone genome doubling (left) and those that have not
(right). The type of mutation identified is represented by the color of the mutation box. b) Expanded analysis of the fraction of genome doubled and non-genome doubled cases with
alterations in the given tumor suppressor pathways (genes in pathway with multiple
identified alterations listed on right). Statistically significant differences are highlighted.
Genes in the individual pathways are also shown in Supplementary Table 5.
Stachler et al. Page 25
Nat Genet. Author manuscript; available in PMC 2016 March 01.
Author M
anuscriptA
uthor Manuscript
Author M
anuscriptA
uthor Manuscript
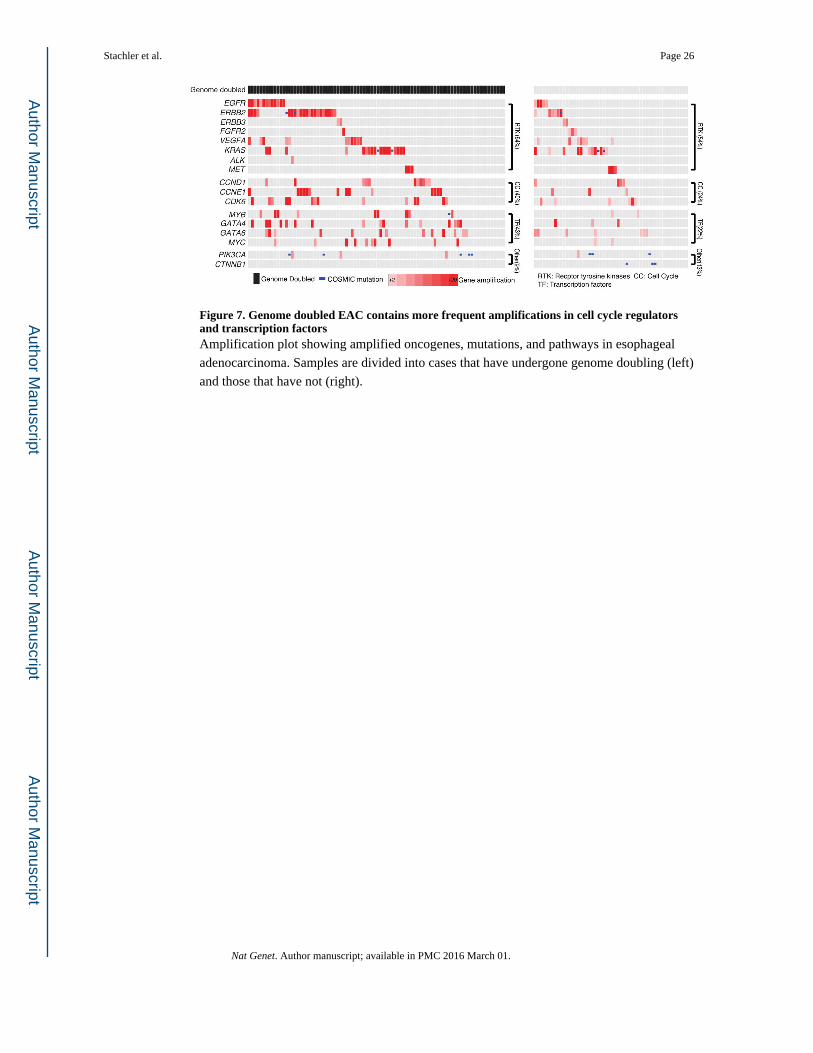
Figure 7. Genome doubled EAC contains more frequent amplifications in cell cycle regulators and transcription factorsAmplification plot showing amplified oncogenes, mutations, and pathways in esophageal
adenocarcinoma. Samples are divided into cases that have undergone genome doubling (left)
and those that have not (right).
Stachler et al. Page 26
Nat Genet. Author manuscript; available in PMC 2016 March 01.
Author M
anuscriptA
uthor Manuscript
Author M
anuscriptA
uthor Manuscript
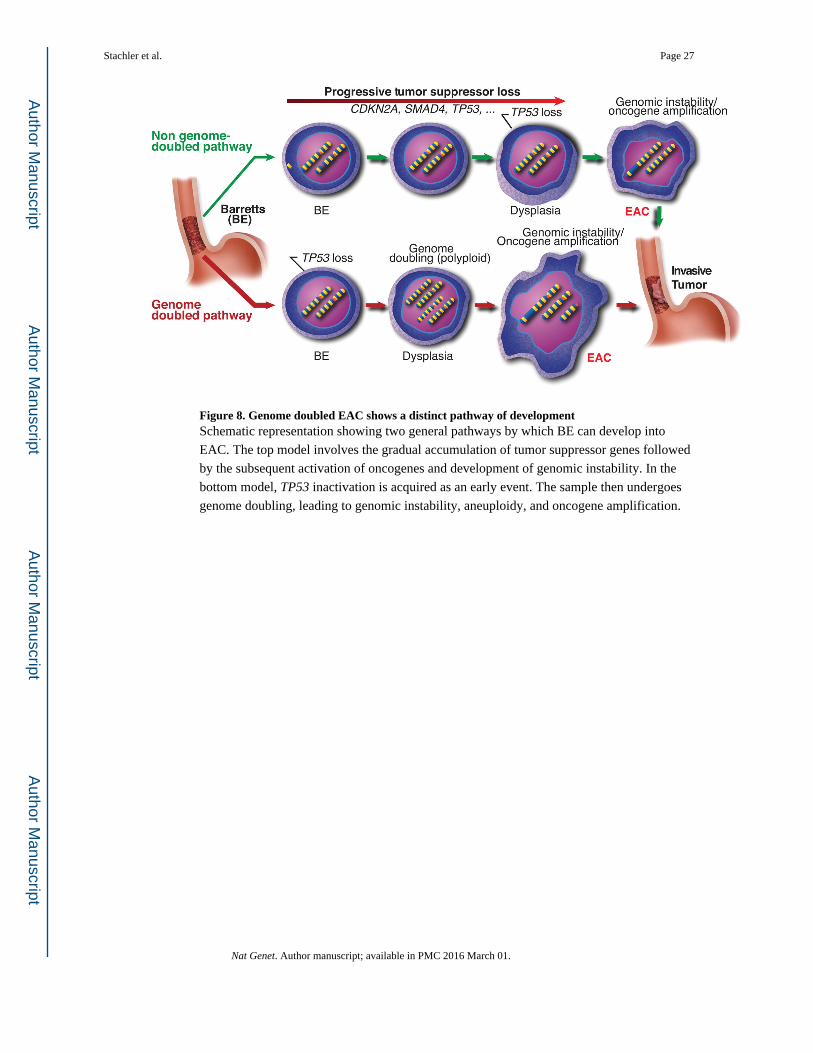
Figure 8. Genome doubled EAC shows a distinct pathway of developmentSchematic representation showing two general pathways by which BE can develop into
EAC. The top model involves the gradual accumulation of tumor suppressor genes followed
by the subsequent activation of oncogenes and development of genomic instability. In the
bottom model, TP53 inactivation is acquired as an early event. The sample then undergoes
genome doubling, leading to genomic instability, aneuploidy, and oncogene amplification.
Stachler et al. Page 27
Nat Genet. Author manuscript; available in PMC 2016 March 01.
Author M
anuscriptA
uthor Manuscript
Author M
anuscriptA
uthor Manuscript


![Barrett’s esophagus and new therapeutic modalitiesThe prevalence of Barrett’s esophagus in the adult population is 0.4–1.6% [1,3,12,13]. Assum-ing a US adult population in 2007](https://static.fdocuments.net/doc/165x107/5f4d5b4d6dfbad3c763bb443/barrettas-esophagus-and-new-therapeutic-modalities-the-prevalence-of-barrettas.jpg)