Page Proof - University of North Carolina at Chapel Hill
15
Page Proof June 20, 2018 8:58 1850025 International Journal of Neural Systems, Vol. 28, No. 0 (2018) 1850025 (15 pages) c World Scientific Publishing Company DOI: 10.1142/S0129065718500259 Extracting and Classifying Spatial Muscle Activation Patterns in Forearm Flexor Muscles Using High-Density Electromyogram Recordings Chenyun Dai ∗ and Xiaogang Hu † Joint Department of Biomedical Engineering University of North Carolina — Chapel Hill and North Carolina State University Raleigh, NC, USA ∗ [email protected] † [email protected] Accepted 25 May 2018 Published Online The human hand is capable of producing versatile yet precise movements largely owing to the complex neuromuscular systems that control our finger movement. This study seeks to quantify the spatial acti- vation patterns of the forearm flexor muscles during individualized finger flexions. High-density (HD) surface electromyogram (sEMG) signals of forearm flexor muscles were obtained, and individual motor units were decomposed from the sEMG. Both macro-level spatial patterns of EMG activity and micro- level motor unit distributions were used to systematically characterize the forearm flexor activation patterns. Different features capturing the spatial patterns were extracted, and the unique patterns of forearm flexor activation were then quantified using pattern recognition approaches. We found that the forearm flexor spatial activation during the ring finger flexion was mostly distinct from other fingers, whereas the activation patterns of the middle finger were least distinguishable. However, all the different activation patterns can still be classified in high accuracy (94–100%) using pattern recognition. Our findings indicate that the partial overlapping of neural activation can limit accurate identification of specific finger movement based on limited recordings and sEMG features, and that HD sEMG recordings capturing detailed spatial activation patterns at both macro- and micro-levels are needed. Keywords : Finger flexion; high-density EMG; forearm flexor muscles; flexor digitorum superficialis; muscle compartment; pattern recognition; flexor activation. 1. Introduction The human hand is capable of producing a wide variety of functional tasks involving grasping, object manipulation, and playing musical instruments, which are unmatched by the function of any cur- rent robotic hand. The versatility and fierce preci- sion in the control of our hand is largely attributed to the intricate biomechanical and neural structures that allow individualized as well as coordinated con- trol of different digits. 1,2 At the biomechanical level, the individual phalanges are driven by muscles with distinct anatomical compartments and separate ten- dons, 3–5 allowing dexterous finger movement. Mean- while, tendon re-branching and tissue connections between tendons to the individual fingers can lead to coordinated motions. 6,7 At the neural level, there is evidence that individual compartments are con- trolled through subpopulations of the motoneu- ron pool, and the different groups of motoneurons receive both unique and shared synaptic input from spinal and supraspinal pathways. 8–11 These complex biomechanical and neural control properties have † Corresponding author. 1850025-1
Transcript of Page Proof - University of North Carolina at Chapel Hill

Page Proof
June 20, 2018 8:58 1850025
International Journal of Neural Systems, Vol. 28, No. 0 (2018) 1850025 (15 pages)c© World Scientific Publishing Company
DOI: 10.1142/S0129065718500259
Extracting and Classifying Spatial Muscle ActivationPatterns in Forearm Flexor Muscles Using High-Density
Electromyogram Recordings
Chenyun Dai∗ and Xiaogang Hu†
Joint Department of Biomedical EngineeringUniversity of North Carolina — Chapel Hill and North Carolina State University
Raleigh, NC, USA∗[email protected]†[email protected]
Accepted 25 May 2018Published Online
The human hand is capable of producing versatile yet precise movements largely owing to the complexneuromuscular systems that control our finger movement. This study seeks to quantify the spatial acti-vation patterns of the forearm flexor muscles during individualized finger flexions. High-density (HD)surface electromyogram (sEMG) signals of forearm flexor muscles were obtained, and individual motorunits were decomposed from the sEMG. Both macro-level spatial patterns of EMG activity and micro-level motor unit distributions were used to systematically characterize the forearm flexor activationpatterns. Different features capturing the spatial patterns were extracted, and the unique patterns offorearm flexor activation were then quantified using pattern recognition approaches. We found that theforearm flexor spatial activation during the ring finger flexion was mostly distinct from other fingers,whereas the activation patterns of the middle finger were least distinguishable. However, all the differentactivation patterns can still be classified in high accuracy (94–100%) using pattern recognition. Ourfindings indicate that the partial overlapping of neural activation can limit accurate identification ofspecific finger movement based on limited recordings and sEMG features, and that HD sEMG recordingscapturing detailed spatial activation patterns at both macro- and micro-levels are needed.
Keywords: Finger flexion; high-density EMG; forearm flexor muscles; flexor digitorum superficialis; musclecompartment; pattern recognition; flexor activation.
1. Introduction
The human hand is capable of producing a widevariety of functional tasks involving grasping, objectmanipulation, and playing musical instruments,which are unmatched by the function of any cur-rent robotic hand. The versatility and fierce preci-sion in the control of our hand is largely attributedto the intricate biomechanical and neural structuresthat allow individualized as well as coordinated con-trol of different digits.1,2 At the biomechanical level,the individual phalanges are driven by muscles with
distinct anatomical compartments and separate ten-dons,3–5 allowing dexterous finger movement. Mean-while, tendon re-branching and tissue connectionsbetween tendons to the individual fingers can leadto coordinated motions.6,7 At the neural level, thereis evidence that individual compartments are con-trolled through subpopulations of the motoneu-ron pool, and the different groups of motoneuronsreceive both unique and shared synaptic input fromspinal and supraspinal pathways.8–11 These complexbiomechanical and neural control properties have
†Corresponding author.
1850025-1

Page Proof
June 20, 2018 8:58 1850025
C. Dai & X. Hu
limited our ability to systematically quantify theactivation patterns of the muscles in the forearm.
Previous studies have investigated the degreeof independence among individual fingers, focusingon the biomechanical coupling and neural controlaspects. Specifically, the extent of selective activa-tion of the flexor digitorum superficialis (FDS) hasbeen examined using focal intramuscular electromyo-gram (EMG) recordings.5 A high degree of inde-pendence between the index and middle finger com-partments of the FDS has been observed, and toa less degree in the ring and little compartments.These findings are largely in agreement with behav-ioral findings in finger kinematics with a low levelof enslaving between the index and middle fingers,and a relatively high level of enslaving between thering and little fingers.11,12 Using recently developedhigh-density (HD) EMG recording techniques withclosely distributed electrode grid placed on the skinsurface, several studies have quantified the overallpatterns of muscle activation on different extrinsicfinger extensor muscles.13,14 However, the featuresof distinct activation patterns of forearm flexor mus-cles, which include both global muscle and localizedmotor unit activities during individual finger flex-ions, have not been fully investigated.
Accordingly, the objective of this study wasto quantify the spatial activation patterns of theforearm flexor muscles during individualized fin-ger isometric flexions at different force effort levels.Specifically, HD EMG signals were obtained from theforearm flexor muscles, and were used to explore themacro-level spatial patterns of EMG activity andmicro-level motor unit distribution. The extent ofunique patterns of muscle activation during indi-viduated finger flexion was quantified using patternrecognition approaches. Our main findings revealedthat the partial overlapping of neural activation ofthe forearm flexor muscles can limit us in uniquelyidentifying specific finger movement based on lim-ited recording channels and limited EMG features,and that HD EMG recordings capturing detailed spa-tial activation patterns at both macro- and micro-levels may be necessary to address the issue. Onemajor advantage of our approach is that it allowsus to accurately capture individual finger move-ment using noninvasive recordings, which can facili-tate further development of rehabilitation or assistivetechnologies. The rest of the paper is organized in the
following sections. Section 2 introduces the experi-mental protocol, the features of quantifying muscleactivation and the method of pattern recognition.Section 3 reports the summary of muscle activationfeatures and the performance of classification. Sec-tion 4 provides the implications of our findings, guid-ance for future work, and a summary of our currentwork.
2. Materials and Methods
2.1. Subjects
Experimental data from nine right-dominant healthyhuman volunteers (7 male, 2 female; aged 19 to35) were recruited. All subjects provided writteninformed consent, and none of them reported a previ-ous history of arm or hand pathology or surgery. Theexperimental protocols were approved by the Insti-tutional Review Board at the University of NorthCarolina at Chapel Hill.
2.2. Experimental setup and protocols
Subjects were seated upright in the experimentalapparatus, with the right arm comfortably placedon the horizontal table, the proximal forearm andelbow stabilized on a padded platform, and thepalm oriented at a neutral position with respectto flexion/extension. Their four fingers (index, mid-dle, ring, and little) spread comfortably, and eachfinger was secured via a velcro strap to one loadcell (Interface, SM-100N), which measured the forcegenerated from individual fingers. To avoid utilizingother muscles to generate the force, their wrist wasin 0◦ (radial or ulnar) deviation and secured withtwo padded boards fixed on the table. During theexperiment, subjects were asked to isometrically flextheir proximal interphalangeal joints of one desig-nated finger (index, middle, ring, or little) againsta load cell. Four-finger concurrent isometric flexionwas also tested for data normalization. At the begin-ning of each recording session, the maximum vol-untary contraction (MVC) of each individual fingerwas measured, in which subjects were asked to pro-duce their maximum force using the instructed fin-ger and were asked to maintain the force for 3 s. Foreach recording trial, the subjects were required torest at the initial 5 s which was used for baselinenoise calculation, and then to ramp up to the tar-get force within 5 s and maintain that force effort
1850025-2
Page Proof
June 20, 2018 8:58 1850025
Extracting and Classifying Spatial Muscle Activation Patterns
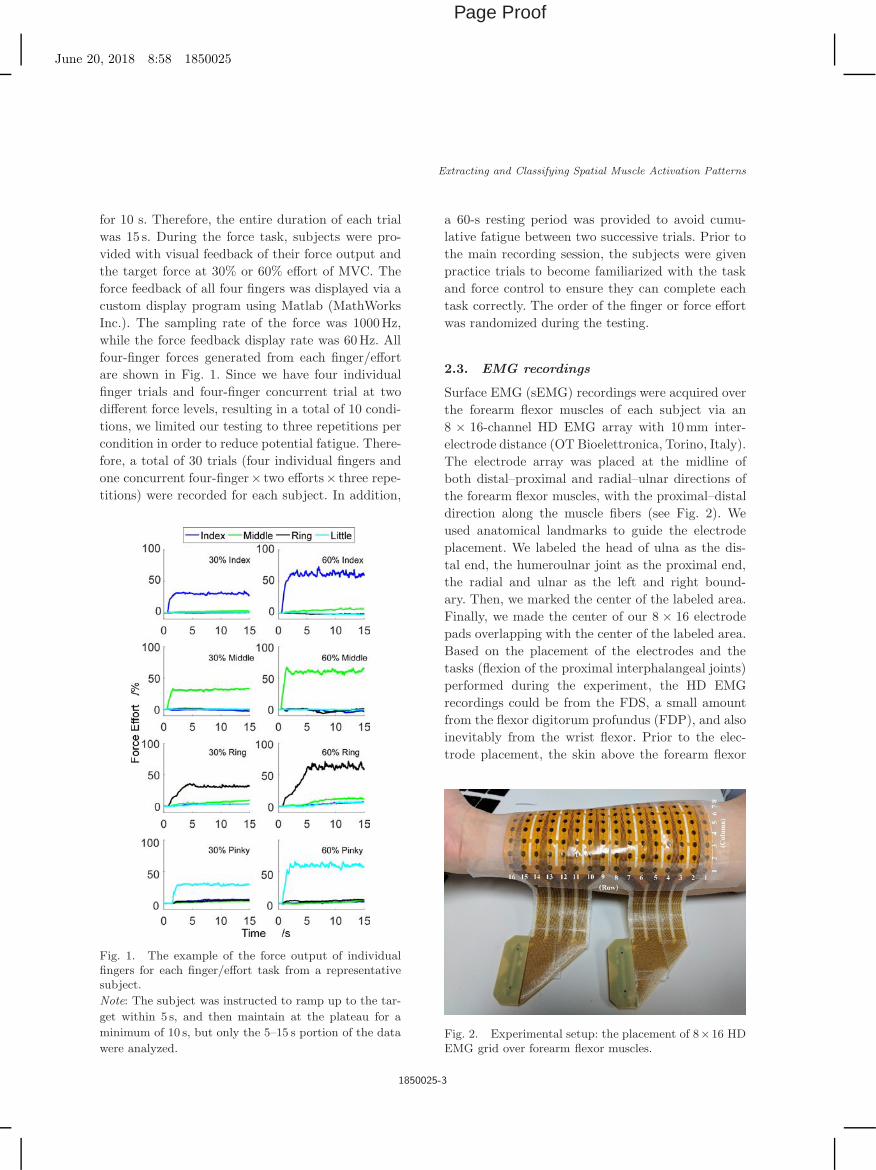
for 10 s. Therefore, the entire duration of each trialwas 15 s. During the force task, subjects were pro-vided with visual feedback of their force output andthe target force at 30% or 60% effort of MVC. Theforce feedback of all four fingers was displayed via acustom display program using Matlab (MathWorksInc.). The sampling rate of the force was 1000Hz,while the force feedback display rate was 60Hz. Allfour-finger forces generated from each finger/effortare shown in Fig. 1. Since we have four individualfinger trials and four-finger concurrent trial at twodifferent force levels, resulting in a total of 10 condi-tions, we limited our testing to three repetitions percondition in order to reduce potential fatigue. There-fore, a total of 30 trials (four individual fingers andone concurrent four-finger× two efforts× three repe-titions) were recorded for each subject. In addition,
Fig. 1. The example of the force output of individualfingers for each finger/effort task from a representativesubject.
Note: The subject was instructed to ramp up to the tar-
get within 5 s, and then maintain at the plateau for a
minimum of 10 s, but only the 5–15 s portion of the data
were analyzed.
a 60-s resting period was provided to avoid cumu-lative fatigue between two successive trials. Prior tothe main recording session, the subjects were givenpractice trials to become familiarized with the taskand force control to ensure they can complete eachtask correctly. The order of the finger or force effortwas randomized during the testing.
2.3. EMG recordings
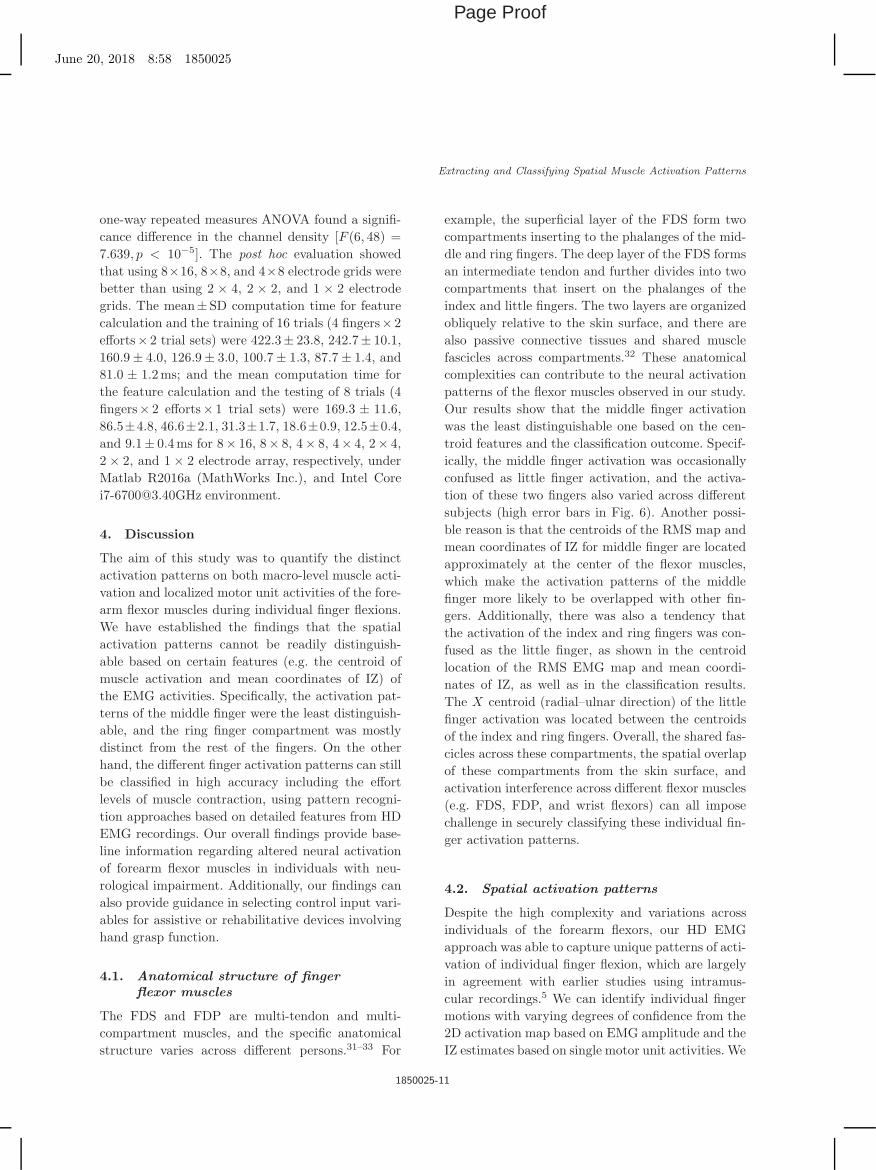
Surface EMG (sEMG) recordings were acquired overthe forearm flexor muscles of each subject via an8 × 16-channel HD EMG array with 10mm inter-electrode distance (OT Bioelettronica, Torino, Italy).The electrode array was placed at the midline ofboth distal–proximal and radial–ulnar directions ofthe forearm flexor muscles, with the proximal–distaldirection along the muscle fibers (see Fig. 2). Weused anatomical landmarks to guide the electrodeplacement. We labeled the head of ulna as the dis-tal end, the humeroulnar joint as the proximal end,the radial and ulnar as the left and right bound-ary. Then, we marked the center of the labeled area.Finally, we made the center of our 8 × 16 electrodepads overlapping with the center of the labeled area.Based on the placement of the electrodes and thetasks (flexion of the proximal interphalangeal joints)performed during the experiment, the HD EMGrecordings could be from the FDS, a small amountfrom the flexor digitorum profundus (FDP), and alsoinevitably from the wrist flexor. Prior to the elec-trode placement, the skin above the forearm flexor
Fig. 2. Experimental setup: the placement of 8×16 HDEMG grid over forearm flexor muscles.
1850025-3

Page Proof
June 20, 2018 8:58 1850025
C. Dai & X. Hu
muscles was vigorously scrubbed with abrasive alco-hol pad and then with regular alcohol pad. A double-sided sticker was used to attach the electrode arrayto the skin surface. The monopolar EMG signalswere sampled via EMG-USB2+ (OT Bioelettronica,Torino, Italy) at 5120Hz, with a gain of 1000, and abandwidth of 10–900Hz.
2.4. Data analysis
All experimental data were analyzed offline in Mat-lab (MathWorks Inc.). The data analysis mainlyincluded two sections. In the first section, the fea-tures of activation were extracted via the 128-channelHD EMG recordings. In the second section, a classifi-cation was performed across different finger flexions.A block diagram of the entire process of the methodsis shown in Fig. 3.
2.4.1. Feature extraction
Activation map: To characterize the overall spatialdistribution of the forearm flexor muscle activation,the two-dimensional root-mean-squared (2D RMS)values of the 8×16 channel monopolar EMG record-ings were calculated. The RMS values of the ini-tial 2-s rest period and the 10-s steady contractionperiod for each trial were both calculated. To reducepotential interference, the 2D RMS maps (Fig. 4)were obtained by subtracting the RMS value of theresting period from the steady contraction period.The RMS subtraction from the resting period wasto reduce the effect of noise and undesired residualmuscle activities, even when the subjects (especiallyin clinical populations, such as stroke survivors) wereinstructed to relax their muscles. Figure 4 shows anexample of the 2D RMS map of the EMG from arepresentative subject at 30% effort.
To this end, two reduced features of the 2D RMSmap, the mean amplitude, and the centroid coordi-nates, were calculated. These features were used toquantify the difference of 2D RMS map across differ-ent finger activations. The mean value of the 2D mapwas acquired by averaging the RMS values across the128 channels. In order to reduce cross-subject vari-ability, the RMS of the four-finger flexion at 60%effort (with the maximum RMS) was used for thenormalization of the RMS values of all other trialswithin a subject. The centroid coordinates were cal-culated through Eqs. (1) and (2) (the pseudo-codewas also provided):
Cx =
∑8i=1
∑16j=1 (RMSij · i)
∑8i=1
∑16j=1 (RMSij)
, (1)
Cy =
∑8i=1
∑16j=1 (RMSij · j)
∑8i=1
∑16j=1 (RMSij)
, (2)
where Cx and Cy are the centroid positions in theX- and Y -axes; and RMSij represents the i × jthelement in the 8 × 16 RMS grid.
Innervation Zone (IZ): The location of IZ, whichreflects the regions of motor nerve innervation withthe muscle fibers,15 was exacted as a classifica-tion feature in this study. The HD EMG record-ings were automatically decomposed into individualmotor units using FastICA combined with the con-volution kernel compensation (CKC) algorithm.16,17
This method has been validated as highly accurate,and has been applied for multiple HD EMG-basedstudies.18,19 The decomposition processing was per-formed offline in OT biolab (version 2.0.6092.0,Torino, Italy). The 10-s steady contraction period foreach trial was used for decomposition. The parame-ters of decomposition algorithm were selected basedon the previous studies17 and were the same for each
Fig. 3. Block diagram for the entire data analysis.
1850025-4

Page Proof
June 20, 2018 8:58 1850025
Extracting and Classifying Spatial Muscle Activation Patterns
Fig. 4. Exemplar 2D RMS map of EMG in individ-ual finger from a representative subject at 30% effort.The black circular markers represent the centroid RMSpositions. The white lines represent the IZs. The dig-its indicate the number of overlapped IZs with the samelocation. The RMS maps were linearly interpolated sixtimes only for plotting, but not for the following meanRMS or centroid points calculation.
subject or trial (see Table 1). A post-decompositionprocessing based on previous studies was performedto remove motor units with potential decompositionerrors:
(1) The firing rate of each motor unit must be within5 Hz to 50Hz.20
(2) The pulse-to-noise (PNR) examination metric21
was used. The decomposition accuracy of eachmotor unit typically has an accuracy >90% witha PNR larger than 30 dB.
Only motor units which satisfied these conditionswere used for further IZ analysis. The IZ representsthe origin of the motor unit action potential (MUAP)
Table 1. The main parameters used for EMGdecomposition.
Parameter Value
Number of iteration 100Total number of extended channels 512Max iteration per fixed point 100Eigenvalues removal 10%Tolerance on fixed point iterations 0.0001SIL threshold 0.9
which propagates along the muscle fibers towardstwo opposite directions. Since each column of thegrid was placed along the muscle fibers, an obviousphase reversal of bipolar MUAPs can be observed.22
The lag cross-correlation as a common IZ identifica-tion method23,24 was utilized in this study. The pro-cedures of the lag cross-correlation method in ourstudy were conducted as follows:
(1) The spike triggered average (STA) algorithm25
was used to extract the MUAP templates of8 × 16 monopolar channels based on the firingspikes obtained from the EMG decomposition(see Fig. 5(a)).
(2) The peak-to-peak (P2P) values of 8×16 channelswere calculated. The P2P value of each chan-nel was divided by the channel with maximumP2P value. The channels with large P2P ratiovalues (>0.2) were considered as active channels(shown in red in Fig. 5(a)). Due to the require-ment of lag cross-correlation calculation, onlythe columns with ≥4 continuously active chan-nels were selected for further IZ detection.
(3) For each selected column, the lag cross-correlation of two adjacent rows of bipolar gridwas calculated through Eq. (3) (the pseudo-codewas also provided right after the equations).Since the bipolar EMG grid has 15 channels ineach column (Fig. 5(b)), a total of 14 pairs of lagcross-correlation were obtained (i.e. pair 1: chan-nel 1 versus channel 2, pair 2: channel 2 versuschannel 3, . . . , pair 14: channel 14 versus chan-nel 15) as illustrated in Fig. 5(c):
R(k, τ ) =
1/NPN
i=1 (xk,i − x̄k)
× (xk+1,i+τ − x̄k+1)
1/N
vuutPN
i=1 (xk,i − x̄k)2
× PNi=1 (xk+1,i − x̄k+1)
2
, (3)
1850025-5

Page Proof
June 20, 2018 8:58 1850025
C. Dai & X. Hu
Fig
.5.
(Colo
ronline)
Blo
ckdia
gra
mof
the
IZdet
ecti
on
for
one
exem
pla
rm
oto
runit
.(a
)T
he
MU
AP
obta
ined
by
STA
alg
orith
musing
8×
16
monopola
rE
MG
reco
rdin
g.M
UA
Ps
inre
dpre
sent
act
ive
channel
sfo
rIZ
calc
ula
tion.T
he
colu
mns
5–8
wer
ese
lect
edfo
rth
efo
llow
ing
IZdet
ecti
on
base
don
our
act
ive
channel
sele
ctio
nalg
orith
m.(b
)T
he
MU
AP
usi
ng
bip
ola
rE
MG
for
IZdet
ecti
on.T
he
MU
AP
ssh
own
inre
dre
pre
sent
the
act
ive
ones
use
dfo
rth
eca
lcula
tion.
(c)
An
exam
ple
of
the
IZca
lcula
tion
for
the
7th
colu
mn
of
the
MU
AP
grid.E
ach
row
repre
sents
the
lag
cross
-corr
elati
on
of
an
adja
cent
pair
of
elec
trodes
.(d
)M
axim
um
abso
lute
valu
esof
each
pair
of
the
corr
elation
vec
tor.
Each
blu
etr
iangle
repre
sents
one
maxim
um
valu
eof
corr
espondin
gpair.
The
ref
circ
lere
pre
sents
the
loca
tion
ofIZ
,w
hic
his
the
10th
row
inth
eco
rres
pondin
g8×
16
MU
AP
grid.
1850025-6

Page Proof
June 20, 2018 8:58 1850025
Extracting and Classifying Spatial Muscle Activation Patterns
where R(k, τ) is the value of the lag cross-correlation with τ phase shift in kth pair; xi,k
is the ith data point in kth pair; N is the num-ber of data points; and τ is the temporal phaseshift between the two adjacent signals.
(4) The maximum of the absolute cross-correlationvalue in each column of R matrix was identifiedto form a 1 × 14 maximum lag cross-correlationvector, and if a negative value was identified,the chosen maximum value was assigned with anegative sign (Fig. 5(d)).
(5) The location of the IZ was indicated as the chan-nel number of the lowest cross-correlation valuebetween two peak values in maximum lag cross-correlation vector (see red circle in Fig. 5(d)).In addition, to avoid falsely detecting a noisedchannel as an IZ, this channel must satisfythe criterion that its monopolar MUAP has acorrelation coefficient >0.9 with the adjacentchannels.24
Finally, the mean positions of the IZ (IZx andIZy) in the X- and Y -axes were calculated to quan-tify the location of IZ by averaging the x- and y-axescoordinates of all IZs in each trial.
2.4.2. Classification
After feature extraction, two common classifiers formyoelectric pattern recognition, linear discriminantanalysis (LDA) and support vector machine (SVM),were employed.26–28 A linear kernel function wasused for SVM. The linear kernel always showed thebest performance on our datasets, compared withother kernels (e.g. polynomials). The objective ofclassification was to present the difference of the fea-tures extracted from different forearm flexor mus-cles or muscle compartments, and examine whetherdifferent activation patterns can be securely dis-tinguished. The classifiers were trained and testedwithin each subject, and only test performance wasreported in the results section. Two of the threerepeated trials for each task were used to train theparameters of the classifiers, and the remaining onewas used to test the classifier performance. Since thetrial number of each condition was small, a three-foldcross-validation was provided to reduce the possiblebias. A total of eight classes (four fingers× two forceefforts) were evaluated.
Furthermore, two sets of features were also con-sidered separately for the classification. First, weused “full features” including all the RMS valuesin the entire 2D RMS map and all the identifiedIZ locations. Since the number of motor units var-ied after decomposition and selection, each trial mayhave a different number of IZs. A bootstrap methodwas used to resample the IZ locations to make theIZ feature an equal length for the classification. TheMatlab function “bootstrap” was used to randomlyresample the IZ location of each trial, while main-taining the mean of the resampled data the same asthe mean of the original data. After the bootstrapprocedure, all the three trials would have the samenumber of data samples, which can then be used forclassification. Second, only five “reduced” features ofthe 2D RMS map and IZs were employed, includingthe mean RMS value, Cx, Cy, IZx, and IZy. Thesereduced features have been widely used to under-stand the muscle activation patterns. However, froma computational efficiency perspective, the calcula-tion of these reduced features can add extra compu-tation load, and make the classification inefficient.
Finally, we also presented the classification accu-racy of using the 2D RMS map only (without IZ).In addition, the number of EMG channels was pro-gressively reduced to investigate the relation betweenthe channel number and the classification accuracy.During each step, the rows or columns of the 8 × 16grid were downsampled by 2. The rows and columnswere downsampled sequentially, and the channels ineach row or column were evenly down samples (i.e.every other channel was chosen). Therefore, 8 × 8,4 × 8, 4 × 4, 2 × 4, 2 × 2, and 1 × 2 electrode gridswere progressively utilized for the classification.
2.4.3. Statistical comparisons
To quantify the difference of muscle activationacross different finger flexions and efforts, a two-way [finger× effort] repeated measures ANOVAwas performed on each of the five reduced fea-tures (mean RMS, Cx, Cy, IZx and IZy). A two-way [classifer× feature] repeated measures ANOVAwas performed. To satisfy the normal distribu-tion assumption of the ANOVA, arcsine-square-roottransformation29,30 was performed on the accuracyresults of the classification. The post hoc pair-wise comparisons with Bonferroni correction were
1850025-7

Page Proof
June 20, 2018 8:58 1850025
C. Dai & X. Hu
conducted when a significance was found. All differ-ences were considered as significance with p < 0.05.
3. Results
A total of 216 HD EMG recordings (four fin-gers× two efforts× three trials× nine subjects) wereanalyzed. The mean of the MVC forces generatedfrom index, middle, ring, and little fingers across ninesubjects were 49.3±10.6N, 36.3±4.8N, 28.2±5.8N,and 27.5 ± 3.2N, respectively.
3.1. Reduced feature comparisons
First, we began by comparing each of the five reducedfeatures (mean RMS, Cx, Cy , IZx, and IZy) across
Table 2. The overall results of five reduced features.Symbol “*” denotes significant difference.
different finger flexions at two different force efforts.The overall results are shown in Table 2.
3.1.1. Mean RMS
The overall results of normalized mean RMS areshown in Fig. 6. The two-way repeated measuresANOVA showed a significant interaction [F (3, 24) =4.687, p = 0.01] between finger and force effort. Fur-ther pairwise post hoc comparisons showed that (1)the mean RMS of the 60% force effort was signif-icantly higher than the 30% effort for any finger(p < 0.05); (2) only the mean RMS of the little fin-ger was significantly lower than the rest of the threefingers at 60% force effort (p < 0.05).
3.1.2. Centroids (Cx, Cy) of 2D RMS map
The X- and Y -coordinates of the centroids of 2DRMS map are shown in Fig. 7. Separate two-way [fin-ger× force effort] repeated measures ANOVAs wereperformed on each of the coordinates. The ANOVAresults of the X-coordinate showed a significantinteraction [F (3, 24) = 4.965, p = 0.008]. The posthoc comparisons revealed that only the X centroidof the little finger showed a significant differencebetween 30% and 60% force efforts (p < 0.05). TheX centroid of the ring finger was also different fromthe rest of the three fingers at 30% force effort.The comparison between pairs of the two fingersat 60% force effort showed a significant difference(p < 0.05) except for the pair of index and middlefingers (p = 0.14).
Fig. 6. Mean RMS in different tasks. Err bars representstandard errors across subjects.
1850025-8

Page Proof
June 20, 2018 8:58 1850025
Extracting and Classifying Spatial Muscle Activation Patterns
Fig. 7. The X (top) and Y (bottom) coordinates of thecentroids of the 2D RMS map. Err bars represent stan-dard errors across subjects.
The ANOVA results of the Y coordinate onlyshowed a significant difference across four fingers[F (3, 24) = 4.757, p = 0.01]. Further post hoc com-parisons performed on finger revealed that only theY centroids of the little and ring fingers had a sig-nificant difference (p = 0.01).
3.1.3. Mean (IZx, IZy) of the IZ
The X and Y coordinates of the mean locations ofthe IZ are illustrated in Fig. 8. Separate two-way [fin-ger× force effort] repeated measures ANOVAs weretested on each of the coordinates. The results of theX mean coordinate indicated a significant differenceacross different fingers [F (3, 24) = 20.039, p < 10−5].The post hoc comparison of the finger factor showedthat only the X mean coordinate of the ring finger
Fig. 8. The X (top) and Y (bottom) mean coordi-nates of the IZ. Err bars represent standard errors acrosssubjects.
was significantly different from the rest of the threefingers (p < 0.05).
The ANOVA results of the Y mean coordinaterevealed a significant interaction between finger andforce effort [F (3, 24) = 5.055, p = 0.007]. Further,post hoc comparisons were performed on these twofactors separately. For each finger, only the Y meancoordinates of the index finger showed a significantdifference between 30% and 60% force efforts (p =0.001). The Y mean coordinate of the ring fingerwas significantly different from the rest of the threefingers at both 30% and 60% force efforts (p < 0.05).
3.2. Performance evaluation ofclassification
We compared the results of two classifiers com-bine with two different feature sets within each
1850025-9

Page Proof
June 20, 2018 8:58 1850025
C. Dai & X. Hu
subject. The classifiers were challenged to identifyeight classes: four fingers× two force efforts.
The mean accuracies of the four classifica-tion model combinations within each subject were89.35±3.99 (Fig. 9(a)), 96.76 ± 1.71 (Fig. 9(b)),89.35± 2.28 (Fig. 9(c)), and 94.45± 1.73 (Fig. 9(d)).The two-way [classifier× feature set] repeated mea-sures ANOVA showed that only the feature set wassignificant [F (1, 8) = 9.429, p = 0.015]. The post hocevaluation of the feature set showed that using thefull feature set was significantly better than using thefive reduced features (p = 0.015).
In addition, the results of the confusion matrix forthe different finger pairs under individual classifierswere illustrated in Fig. 10. For example, if “1.9” wasshown in the index row and middle column, it meansthe percentage of the classifier falsely detecting mid-dle finger as index finger was 1.9%. The results gener-ally revealed that the full feature set tended to yielda better classification accuracy. Specifically, the ringfinger tended to have the best performance and themiddle and index fingers tended to have worse per-formance, compared with the other two fingers.
Finally, we also tested the accuracy using2D RMS map only (without IZ features). The
Fig. 9. The overall accuracy results of the four clas-sification models for nine subjects. “M” represents themean accuracy of the total nine subjects. Err bars rep-resent standard errors across subjects. Reduced featureindicates that the classifier used the five reduced features(mean RMS, Cx, Cy, IZx, and IZy). Full feature indicatesthat the classifier used the 2D RMS map and the entireIZ locations.
Fig. 10. The overall results (in %) of confusion matrixfor different finger pairs. Reduced feature indicates thatthe classifier used five reduced features (mean RMS, Cx,Cy, IZx, and IZy). Full feature indicates the classifierused the 2D RMS map and entire IZs.
corresponding mean accuracies of the four classi-fication model combinations within each subjectdecreased to 87.96± 3.37, 95.37± 1.96, 87.50± 2.82,and 93.52 ± 1.82 from 89.35 ± 3.99, 96.76 ± 1.71,89.35± 2.28, and 94.45± 1.73. In addition, the accu-racy after reducing the density of channels in theHD EMG electrode grid is shown in Fig. 11. Onlythe results from LDA classifier (highest accuracy)with full feature were presented. The accuracies ofusing 8 × 16, 8 × 8, 4 × 8, 4 × 4, 2 × 4, 2 × 2, and1× 2 electrode grids are summarized in Fig. 11. The
Fig. 11. The accuracy of classification after reducing thedensity of electrode grid.
1850025-10
Page Proof
June 20, 2018 8:58 1850025
Extracting and Classifying Spatial Muscle Activation Patterns
one-way repeated measures ANOVA found a signifi-cance difference in the channel density [F (6, 48) =7.639, p < 10−5]. The post hoc evaluation showedthat using 8×16, 8×8, and 4×8 electrode grids werebetter than using 2 × 4, 2 × 2, and 1 × 2 electrodegrids. The mean±SD computation time for featurecalculation and the training of 16 trials (4 fingers× 2efforts× 2 trial sets) were 422.3± 23.8, 242.7± 10.1,160.9 ± 4.0, 126.9 ± 3.0, 100.7 ± 1.3, 87.7 ± 1.4, and81.0 ± 1.2ms; and the mean computation time forthe feature calculation and the testing of 8 trials (4fingers× 2 efforts× 1 trial sets) were 169.3 ± 11.6,86.5±4.8, 46.6±2.1, 31.3±1.7, 18.6±0.9, 12.5±0.4,and 9.1± 0.4ms for 8× 16, 8× 8, 4× 8, 4× 4, 2× 4,2 × 2, and 1 × 2 electrode array, respectively, underMatlab R2016a (MathWorks Inc.), and Intel [email protected] environment.
4. Discussion
The aim of this study was to quantify the distinctactivation patterns on both macro-level muscle acti-vation and localized motor unit activities of the fore-arm flexor muscles during individual finger flexions.We have established the findings that the spatialactivation patterns cannot be readily distinguish-able based on certain features (e.g. the centroid ofmuscle activation and mean coordinates of IZ) ofthe EMG activities. Specifically, the activation pat-terns of the middle finger were the least distinguish-able, and the ring finger compartment was mostlydistinct from the rest of the fingers. On the otherhand, the different finger activation patterns can stillbe classified in high accuracy including the effortlevels of muscle contraction, using pattern recogni-tion approaches based on detailed features from HDEMG recordings. Our overall findings provide base-line information regarding altered neural activationof forearm flexor muscles in individuals with neu-rological impairment. Additionally, our findings canalso provide guidance in selecting control input vari-ables for assistive or rehabilitative devices involvinghand grasp function.
4.1. Anatomical structure of fingerflexor muscles
The FDS and FDP are multi-tendon and multi-compartment muscles, and the specific anatomicalstructure varies across different persons.31–33 For
example, the superficial layer of the FDS form twocompartments inserting to the phalanges of the mid-dle and ring fingers. The deep layer of the FDS formsan intermediate tendon and further divides into twocompartments that insert on the phalanges of theindex and little fingers. The two layers are organizedobliquely relative to the skin surface, and there arealso passive connective tissues and shared musclefascicles across compartments.32 These anatomicalcomplexities can contribute to the neural activationpatterns of the flexor muscles observed in our study.Our results show that the middle finger activationwas the least distinguishable one based on the cen-troid features and the classification outcome. Specif-ically, the middle finger activation was occasionallyconfused as little finger activation, and the activa-tion of these two fingers also varied across differentsubjects (high error bars in Fig. 6). Another possi-ble reason is that the centroids of the RMS map andmean coordinates of IZ for middle finger are locatedapproximately at the center of the flexor muscles,which make the activation patterns of the middlefinger more likely to be overlapped with other fin-gers. Additionally, there was also a tendency thatthe activation of the index and ring fingers was con-fused as the little finger, as shown in the centroidlocation of the RMS EMG map and mean coordi-nates of IZ, as well as in the classification results.The X centroid (radial–ulnar direction) of the littlefinger activation was located between the centroidsof the index and ring fingers. Overall, the shared fas-cicles across these compartments, the spatial overlapof these compartments from the skin surface, andactivation interference across different flexor muscles(e.g. FDS, FDP, and wrist flexors) can all imposechallenge in securely classifying these individual fin-ger activation patterns.
4.2. Spatial activation patterns
Despite the high complexity and variations acrossindividuals of the forearm flexors, our HD EMGapproach was able to capture unique patterns of acti-vation of individual finger flexion, which are largelyin agreement with earlier studies using intramus-cular recordings.5 We can identify individual fingermotions with varying degrees of confidence from the2D activation map based on EMG amplitude and theIZ estimates based on single motor unit activities. We
1850025-11

Page Proof
June 20, 2018 8:58 1850025
C. Dai & X. Hu
found that the activation of the ring finger is locatedin the most ulnar and proximal region and is distinctfrom the rest of the fingers, and that the classificationaccuracy is not surprisingly high. The activation ofthe middle finger was located in the most radialregion with some degree of overlap with the indexand little fingers. Unlike the extensor digitorum mus-cle activation,3,13 the activation patterns of flexors inthe proximal–distal direction is less distinguishable,despite the elongated muscle orientation. Overall, theIZ distribution is more distinct across different fin-gers in comparison with the macro-level muscle acti-vation (RMS map) patterns. Namely, the centroids ofthe RMS map typically span within a 10 cm region,but the mean coordinates of the IZ cover over threeelectrode columns (the physical distance is 20 cm) inthe radial–ulnar direction and over six electrode rows(or 50 cm) in the proximal–distal direction. Theselarge differences can facilitate accurate identificationof the involved compartments during individual fin-ger motions.
4.3. Pattern recognition
Our classification results show that both the LDAand SVM approaches based on the full features canprovide the best identification results. The LDA clas-sifier exhibits a small improvement (∼2.5%) than theSVM classifier, consistent with earlier myoelectriccontrol studies.27,34 Both classifiers also performedbetter on the full feature space compared with thereduced feature space based on centroids distribu-tions. Overall, the classification accuracy of usingfull feature was approximately 7% and 5% higherthan that of using reduced feature for LDA clas-sifier and SVM classifier, respectively (see Fig. 9).Furthermore, an obvious decrease of the accuracycan be observed when reducing the density of theEMG recording channels (see Fig. 11). This is largelydue to the fact that the topological information,such as the shape, unimodal versus multi-modal dis-tribution, and orientation of the activation, is lostduring the centroid or mean coordinate calculation.The high accuracy of the classification of individ-ual finger flexions including the effort level indicatesthat our approach can be used to identify individ-ual finger flexion accurately based on forearm mus-cle activations. Additionally, our HD EMG record-ings combined with the simple LDA classifier can
potentially be used for the control of individual fin-ger movement of prosthetic hand or hand orthosis.The 128 HD EMG grid allows us to quantify theentire muscle activation of the forearm flexor muscleswith high resolution, and obtain the motor unit acti-vation using HD decomposition approach. For real-time control, to further improve the efficiency ofthe classification, we also investigated the effects ofexcluding IZ feature which requires high computa-tion resources, and the effects of decreasing the den-sity of the electrodes. We found that the accuracyof different classifiers only reduced about 1–2% afterwe remove the IZ feature, because this feature is notcompletely independent from the 2D RMS map orRMS centroids (see Fig. 4). In addition, we founda high (93.52%) classification accuracy even if onlyeight electrodes (2 × 4 grid) were used. The “redun-dant” number of electrodes can help improve therobustness of the classification, in situations includ-ing noisy/nonfunctioning channels or electrode posi-tion shift. However, our results indicated that wemay not need such a large number of electrodes forthe classification in this particular situation. Ourclassification accuracy was a bit (<2%) lower thansome of the previous similar studies,35 large becausewe tested two different MVCs, which could haveinduced most of the errors.
Brain–computer interface36–40 has been an activeresearch area for the control of robotic devices,through the decoding of neural control signalsdirectly from electroencephalogram (EEG) or indi-vidual cortical neuron discharge activities. Ourmyoelectric-based control approach can be comple-mentary to these approaches for neural-machineinterface. Specifically, the electrophysiological sig-nals at different levels of the neural system canbe fused together with biomechanical variables ofthe user in order to establish more effective andmore robust communication and control strategiesbetween humans and machines/external world.
Other algorithms41 have been proposed for IZidentification based on bipolar EMG. A recentstudy41 has used a more straightforward approachusing the slope of MUAP from monopolar. In ourcurrent study, lag cross-correlation of bipolar MUAPwas used to calculate the IZ, since it has been verifiedas an accurate method.23 In addition, this approachcan be robust, even if the FDS muscle fibers are notrunning parallel to the skin surface, since only the
1850025-12

Page Proof
June 20, 2018 8:58 1850025
Extracting and Classifying Spatial Muscle Activation Patterns
phase reversal of the bipolar EMG is identified andis not based on the propagation delay.
4.4. Limitations
The classification results show that the full featuresincluding the 2D activation map and the motorunit IZ features provide the most accurate perfor-mance. However, the high feature space can be com-putationally inefficient, which poses challenge forreal-time classification and control. Additionally, themotor unit decomposition in our study was per-formed offline, although online EMG decompositionhas been studied,42 much work still need to be per-formed before motor unit features can be used forreal-time classification. To reduce the computationload, we also showed the classification performanceusing the 2D RMS map with reduced density of elec-trodes. Our findings revealed that the accurate per-formance (∼93.52%) can still be acquired using 2DRMS map only with eight electrodes, though therobustness of the classification in daily activities orduring long-term recordings need to be further eval-uated. Other studies43,44 have also investigated therobustness of pattern recognition for myoelectric con-trol when some channels of HD electrodes are cor-rupted or the location of electrodes is shifted.
For the RMS calculation, we subtracted the RMSvalue of the resting period from the steady con-traction period to reduce the influence of noise andundesired residual muscle activities. Since the signalcomponents are not orthogonal and the calculationitself is not linear, our direct subtraction cannot com-pletely remove the interference effects.
Although multiple finger movement covers a widerange of daily tasks, here we focused on the indi-vidual finger movement because many daily tasksrequire individualized finger movement (e.g. typingor dexterous object manipulation) and it can be usedas the foundation for the multiple finger study.
Finally, the relative location of electrodes wasplaced based on anatomical landmarks of the arm,and was consistent across different subjects. Giventhat our electrode pad has a fixed area, differentsubjects with different arm sizes could give rise tovariations in the spatial features of the centroid cal-culations. However, it did not affect our classificationresults, since all our pattern recognitions were per-formed within each subject.
5. Conclusions
Overall, using HD EMG recording and processingtechniques, we observed distinct activation patternsof the forearm flexor muscles during individual fin-ger flexions. Our overall results revealed that thespatial activation of the ring finger compartmentwas mostly distinct from the rest of the finger com-partments, whereas the activation patterns of themiddle finger were the least distinguishable. In con-trast, the different finger activation patterns can stillbe classified in high accuracy (∼97%) including thelevels of muscle contraction, using pattern recog-nition approaches. These results can provide guid-ance, at both macro- and micro-levels, in locatingthe different compartments of the finger flexors. Ourfindings may provide baseline information for theevaluation of altered activation of the forearm flexormuscles in clinical populations, and provide feasiblecontrol input variables that can be used in rehabili-tation/assistance of individual finger control.
References
1. S. Kilbreath and S. Gandevia, Limited independentflexion of the thumb and fingers in human subjects,J. Physiol. 479 (1994) 487.
2. V. M. Zatsiorsky, Z.-M. Li and M. L. Latash, Coor-dinated force production in multi-finger tasks: Fin-ger interaction and neural network modeling, Biol.Cybern. 79 (1998) 139–150.
3. T. L. McIsaac and A. J. Fuglevand, Motor-unitsynchrony within and across compartments of thehuman flexor digitorum superficialis, J. Neurophys-iol. 97 (2007) 550–556.
4. D. A. Keen and A. J. Fuglevand, Role of inter-tendinous connections in distribution of force in thehuman extensor digitorum muscle, Muscle Nerve28 (2003) 614–622.
5. T. Butler, S. Kilbreath, R. Gorman and S. Gandevia,Selective recruitment of single motor units in humanflexor digitorum superficialis muscle during flexion ofindividual fingers, J. Physiol. 567 (2005) 301–309.
6. M. M. Malerich, R. A. Baird, W. McMaster andJ. M. Erickson, Permissible limits of flexor digito-rum profundus tendon advancement — An anatomicstudy, J. Hand Surg. 12 (1987) 30–33.
7. J. Leijnse, E. Walbeehm, G. Sonneveld, S. Hoviusand J. Kauer, Connections between the tendons ofthe musculus flexor digitorum profundus involvingthe synovial sheaths in the carpal tunnel, Cells Tis-sues Organs 160 (1997) 112–122.
8. D. A. Keen and A. J. Fuglevand, Common input tomotor neurons innervating the same and different
1850025-13

Page Proof
June 20, 2018 8:58 1850025
C. Dai & X. Hu
compartments of the human extensor digitorummuscle, J. Neurophysiol. 91 (2004) 57–62.
9. V. M. Zatsiorsky, Z.-M. Li and M. L. Latash, Enslav-ing effects in multi-finger force production, Exp.Brain Res. 131 (2000) 187–195.
10. D. A. Keen and A. J. Fuglevand, Distributionof motor unit force in human extensor digitorumassessed by spike-triggered averaging and intraneuralmicrostimulation, J. Neurophysiol. 91 (2004) 2515–2523.
11. M. H. Schieber and M. Santello, Hand function:Peripheral and central constraints on performance,J. Appl. Physiol. 96 (2004) 2293–2300.
12. C. E. Lang and M. H. Schieber, Human fingerindependence: Limitations due to passive mechan-ical coupling versus active neuromuscular control,J. Neurophysiol. 92 (2004) 2802–2810.
13. X. Hu, N. L. Suresh, C. Xue and W. Z. Rymer,Extracting extensor digitorum communis activationpatterns using high-density surface electromyogra-phy, Front. Physiol. 6 (2015) 279.
14. N. van Beek, D. F. Stegeman, J. C. van den Noort, D.H. Veeger and H. Maas, Activity patterns of extrin-sic finger flexors and extensors during movementsof instructed and non-instructed fingers, J. Elec-tromyogr. Kinesiol. (2017).
15. A. Rainoldi, G. Melchiorri and I. Caruso, A methodfor positioning electrodes during surface EMGrecordings in lower limb muscles, J. Neurosci. Meth-ods 134 (2004) 37–43.
16. A. Holobar and D. Zazula, Multichannel blind sourceseparation using convolution kernel compensation,IEEE Trans. Signal Process. 55 (2007) 4487–4496.
17. F. Negro, S. Muceli, A. M. Castronovo, A. Holobarand D. Farina, Multi-channel intramuscular and sur-face EMG decomposition by convolutive blind sourceseparation, J. Neural Eng. 13 (2016) 026027.
18. A. M. Castronovo, F. Negro, S. Conforto and D.Farina, The proportion of common synaptic inputto motor neurons increases with an increase in netexcitatory input, J. Appl. Physiol. 119 (2015) 1337–1346.
19. C. M. Laine, E. Martinez-Valdes, D. Falla, F. Mayerand D. Farina, Motor neuron pools of synergisticthigh muscles share most of their synaptic input,J. Neurosci. 35 (2015) 12207–12216.
20. R. M. Enoka and A. J. Fuglevand, Motor unitphysiology: Some unresolved issues, Muscle Nerve24 (2001) 4–17.
21. A. Holobar, M. Minetto and D. Farina, Accurateidentification of motor unit discharge patterns fromhigh-density surface EMG and validation with anovel signal-based performance metric, J. NeuralEng. 11 (2014) 016008.
22. R. Merletti, A. Holobar and D. Farina, Analysis ofmotor units with high-density surface electromyog-raphy, J. Electromyogr. Kinesiol. 18 (2008) 879–890.
23. T. W. Beck, J. M. DeFreitas and M. S. Stock, Accu-racy of three different techniques for automaticallyestimating innervation zone location, Comput. Meth-ods Programs Biomed. 105 (2012) 13–21.
24. T. Masuda and T. Sadoyama, Skeletal muscles fromwhich the propagation of motor unit action poten-tials is detectable with a surface electrode array,Electroencephalogr. Clin. Neurophysiol. 67 (1987)421–427.
25. X. Hu, W. Z. Rymer and N. L. Suresh, Reliabil-ity of spike triggered averaging of the surface elec-tromyogram for motor unit action potential estima-tion, Muscle Nerve 48 (2013) 557–570.
26. L. J. Hargrove, K. Englehart and B. Hudgins, Acomparison of surface and intramuscular myoelec-tric signal classification, IEEE Trans. Biomed. Eng.54 (2007) 847–853.
27. A. Phinyomark, F. Quaine, S. Charbonnier, C.Serviere, F. Tarpin-Bernard and Y. Laurillau, EMGfeature evaluation for improving myoelectric patternrecognition robustness, Expert Syst. Appl. 40 (2013)4832–4840.
28. M. A. Oskoei and H. Hu, Support vector machine-based classification scheme for myoelectric controlapplied to upper limb, IEEE Trans. Biomed. Eng.55 (2008) 1956–1965.
29. M. M. Rao, Some asymptotic results on transfor-mations in the analysis of variance, AeronauticalResearch Laboratories, Air Force Research Division,Air Research and Development Command, UnitedStates Air Force (1960).
30. B. J. Winer, Statistical Principles in ExperimentalDesign (McGraw-Hill, New York, 1991).
31. M. N. Foote, The principles of anatomy as seen inthe hand, Ann. Surg. 72 (1920) 533.
32. O. Ohtani, Structure of the flexor digitorum superfi-cialis, Okajimas Folia Anat. Jpn. 56 (1979) 277–288.
33. P. W. Brand and A. Hollister, Clinical Mechanics ofthe Hand (Mosby, St. Louis, 1999).
34. P. Kaufmann, K. Englehart and M. Platzner, Fluc-tuating EMG signals: Investigating long-term effectsof pattern matching algorithms, in 2010 Annual Int.Conf. IEEE Engineering in Medicine and BiologySociety (EMBC) (IEEE, New York, 2010), pp. 6357–6360.
35. A. Al-Timemy, G. Bugmann, N. Outram, J. Escud-ero and H. Li, Finger movements classificationfor the dexterous control of upper limb prosthesisusing EMG signals, in Conf. Towards AutonomousRobotic Systems (Springer, Berlin, 2012), pp. 434–435.
36. A. Burns, H. Adeli and J. A. Buford, Brain–computer interface after nervous system injury, Neu-roscientist 20 (2014) 639–651.
37. A. Ortiz-Rosario and H. Adeli, Brain–computerinterface technologies: From signal to action, Rev.Neurosci. 24 (2013) 537–552.
1850025-14
Page Proof
June 20, 2018 8:58 1850025
Extracting and Classifying Spatial Muscle Activation Patterns
38. A. Ortiz-Rosario, H. Adeli and J. A. Buford, Waveletmethodology to improve single unit isolation inprimary motor cortex cells, J. Neurosci. Methods246 (2015) 106–118.
39. A. Ortiz-Rosario, I. Berrios-Torres, H. Adeli andJ. A. Buford, Combined corticospinal and reticu-lospinal effects on upper limb muscles, Neurosci.Lett. 561 (2014) 30–34.
40. E. Yin, T. Zeyl, R. Saab, D. Hu, Z. Zhouand T. Chau, An auditory-tactile visual saccade-independent P300 brain–computer interface, Int. J.Neural Syst. 26 (2016) 1650001.
41. J. Rodriguez-Falces, A new method for the local-ization of the innervation zone based on monopolarsurface-detected potentials, J. Electromyogr. Kine-siol. 35 (2017) 47–60.
42. V. Glaser, A. Holobar and D. Zazula, Real-timemotor unit identification from high-density sur-face EMG, IEEE Trans. Neural Syst. Rehabil. Eng.21 (2013) 949–958.
43. L. Pan, D. Zhang, N. Jiang, X. Sheng and X.Zhu, Improving robustness against electrode shift ofhigh density EMG for myoelectric control throughcommon spatial patterns, J. NeuroEng. Rehabil.12 (2015) 110.
44. A. Stango, F. Negro and D. Farina, Spatial correla-tion of high density EMG signals provides featuresrobust to electrode number and shift in patternrecognition for myocontrol, IEEE Trans. NeuralSyst. Rehabil. Eng. 23 (2015) 189–198.
1850025-15