
PAGE NO. 1. 2. 3. 4. - Dover District Council · PAGE NO. 1. Size and Density D2 2. Ward Level...
20
Leadership Support Team: State of the District 2015: Population Profile Page D1 PAGE NO. 1. Size and Density D2 2. Ward Level Mid-Year Population Estimates D3 3. Population Density by Electoral Ward D4 4. Age and Gender Profile D4 a) Average Age D4 b) Gender D5 c) Broad Age Groups D5 d) Distribution of People in the Dover District aged 16-64 years D5 5. Children and Young People D6 a) Population aged under 20 in Dover district D6 b) Age profile of Children and People by Gender D6 c) Distribution of Children in the Dover District Aged 0 - 4 Years D6 d) Distribution of Children in the Dover District Aged 0 - 19 Years D7 e) Teenage Conception D7 6. Older People D8 a) Distribution of people in Dover District aged 65+ years D8 b) State Pension Claimants D8 c) Disability Living Allowance D9 d) Attendance Allowance D9 e) Limiting long-term illness aged 60+ D9 f) Unpaid care D10 7. Change In Population D10 a) Population Time Series 1998-2013 D10 b) Components of Population Change D10 8. Population Forecasts D11 a) Population forecasts for the Dover District 2011-2031 D11 b) Projected population change from 2014, for 2015-2019 by Broad Age Group D11 c) Population change between wards D12 9. Equality and Diversity D12 a) Ethnicity: D12 o Broad Ethnic Group D12 o BME population as a % of total resident population D13 o Ethnicity: Population Change, Census 1991, 2001, 2011 D14 o Ethnicity by age group D14 o Country of Birth D14 o Length of residency in the UK D14 o Year of Arrival in UK D14 o Household language D15 o Proficiency in English D15 b) Religion and Belief D16 c) Sexual Orientation D16 d) Marital and Civil Partnership Status D16 e) Socio Economic Position D17 f) MOSAIC Profile for Dover D18
Transcript of PAGE NO. 1. 2. 3. 4. - Dover District Council · PAGE NO. 1. Size and Density D2 2. Ward Level...
Leadership Support Team: State of the District 2015: Population Profile Page D1
PAGE NO.
1. Size and Density D2 2. Ward Level Mid-Year Population Estimates D3 3. Population Density by Electoral Ward D4 4. Age and Gender Profile D4
a) Average Age D4 b) Gender D5 c) Broad Age Groups D5 d) Distribution of People in the Dover District aged 16-64 years D5
5. Children and Young People D6 a) Population aged under 20 in Dover district D6 b) Age profile of Children and People by Gender D6 c) Distribution of Children in the Dover District Aged 0 - 4 Years D6 d) Distribution of Children in the Dover District Aged 0 - 19 Years D7 e) Teenage Conception D7
6. Older People D8 a) Distribution of people in Dover District aged 65+ years D8 b) State Pension Claimants D8 c) Disability Living Allowance D9 d) Attendance Allowance D9 e) Limiting long-term illness aged 60+ D9 f) Unpaid care D10
7. Change In Population D10 a) Population Time Series 1998-2013 D10 b) Components of Population Change D10
8. Population Forecasts D11 a) Population forecasts for the Dover District 2011-2031 D11 b) Projected population change from 2014, for 2015-2019 by Broad Age Group D11 c) Population change between wards D12
9. Equality and Diversity D12 a) Ethnicity: D12
o Broad Ethnic Group D12 o BME population as a % of total resident population D13 o Ethnicity: Population Change, Census 1991, 2001, 2011 D14 o Ethnicity by age group D14 o Country of Birth D14 o Length of residency in the UK D14 o Year of Arrival in UK D14 o Household language D15 o Proficiency in English D15
b) Religion and Belief D16 c) Sexual Orientation D16 d) Marital and Civil Partnership Status D16 e) Socio Economic Position D17 f) MOSAIC Profile for Dover D18

Leadership Support Team: State of the District 2015: Population Profile Page D2
1. SIZE AND DENSITY Each year the Office for National Statistics (ONS) produces mid-year population estimates. These are calculated using the population count in the last available census as a base then adding the number of births and inward migrants and taking away the number of deaths and outward migrants. The ONS releases the district-level mid-year population estimates in June each year. However, ward-level population estimates are not available until autumn each year. To maintain consistency, this report uses the ONS Mid-Year Estimates 2013, which is available at both district and ward levels.
Key Facts Population 112,300 Area (hectares) 31,484 Proportion Urban (% by Area) 20.7 Proportion Rural (% by Area) 79.3 Density (persons per hectare) 3.6 Source: ONS Mid-Year Estimates 2013
• The population of the Dover district is 112,3001. This is an increase of 600 people (+0.5%) from 2012.
• There are slightly more female residents than male with 57,200 (50.9%) being female and 55,200 (49.1%) male. This is a pattern seen in all of the districts in Kent.
• The working age population of the Dover district (16 – 64 years) is falling and is currently 67,700 (60.3% of total population). This is lower than the average for the South East (62.7%) and Great Britain (63.8%). Of this number, 33,600 are males and 34,000 are females.
• The 65+ age group has risen to 24,600 people (+21.9%) and the 0-15 age group has increased to 20,000 people (+17.8% of total population).
• The population in the Dover district grew by +0.5% between 2012 and 2013. This is lower than the county average (+0.9%) and only Tunbridge Wells and Shepway saw a smaller growth rate (+0.1% respectively). Dartford saw the largest population increase in percentage terms with +1.6%.
• The Dover district has the fourth smallest local authority population in the Kent – equivalent to 7.5% of the Kent population. Dartford has the smallest local authority population with 100,600 people (6.7%) and Maidstone the highest with 159,300 people (10.7%).
• People living in the urban areas of the Dover district (73,980 people in 13 wards) make up 65.9% of the population but occupy only 20.7% of the total land area. The remaining 34.1% of people living in the rural areas of the district (38,360 people in 8 wards) occupy 79.3% of the land in the district.
• The population density in the Dover district is 3.6 persons per hectare, which is below the county average of 4.2, regional average of 4.6 and national average of 4.1 people per hectare. Dartford is Kent’s most densely populated district with 13.8 people per hectare and Ashford is the least densely populated district with 2.1 persons per hectare.
• The urban population density in the Dover district is 11.28 people per hectare, compared to a rural population density of 1.54 people per hectare.
• The most densely populated ward is Tower Hamlets, with 68.28 people per hectare. The least densely populated ward is Little Stour and Ashstone with 1.06 people per hectare.
• There has been a small decline in the population in Buckland (-0.1%), Whitfield (-0.3%), Aylesham (-0.5%), Little Stour and Ashstone (-0.2%) and St. Margaret’s-at-Cliffe (-1.2%).
• District-level mid-year population estimates for 2014 shows that the population in the Dover district has grown by a further 800 people (0.7%) to 113,100. Ward level data is not available until November.
1 Source: 2013 ONS mid-year population estimates published 26 June 2014

Leadership Support Team: State of the District 2015: Population Profile Page D3
2. WARD LEVEL MID-YEAR POPULATION ESTIMATES (MYPE)2
Dover District Council Total 21 wards
2013 MYPE Area (Ha) 2013 MPYE Density
112,300 31,484 3.55 Urban population 73,980 6,509 11.28 Rural population 38,360 24,975 1.54 Deal Urban Area Total 4 wards
2013 MYPE Area (Ha) 2013 MPYE Density
30,200 1,701 17.64 C1 Middle Deal and Sholden 7,450 956 7.74 C1 Mill Hill 7,910 283 27.94 C1 North Deal 7,430 132 55.48 C1 Walmer 7,430 330 22.34 Dover Urban Area Total 9 wards
2013 MYPE Area (Ha) 2013 MPYE Density
43,800 4,808 9.03 C1 Buckland 7,640 195 39.18 C1 Castle 2,320 171 13.21 C1 Lydden and Temple Ewell 2,390 1,148 2.06 C1 Maxton, Elms Vale & Priory 7,910 342 22.83 C1 River 4,580 1,555 2.94 C1 St Radigunds 5,680 244 22.96 C1 Tower Hamlets 6,060 88 68.28 C1 Town and Pier 2,100 367 5.63 C1 Whitfield 5,100 698 7.32 Aylesham Rural Settlement Total 1 ward
2013 MYPE Area (Ha) 2013 MPYE Density
4,960 1,552 3.21 D1 Aylesham 4,960 1,552 3.21 Sandwich Rural Settlement Total 1 ward
2013 MYPE Area (Ha) 2013 MPYE Density
6,970 3,518 1.96 D1 Sandwich 6,970 3,518 1.96 Dover Rural Area Total 6 wards
2013 MYPE Area (Ha) 2013 MPYE Density
26,400 19,905 1.33 D1 Capel-le-Ferne 2.400 1,443 1.65 D1 Eastry 5,190 4,637 1.12 D1 Eythorne and Shepherdswell 4,810 3,460 1.38 E1 Little Stour and Ashstone 6,930 6,572 1.06 D1 Ringwould 2,030 638 3.16 E1 St Margaret's-at-Cliffe 5,080 3,155 1.63 Rural and Urban Classification: The 2011 Rural Urban Classification for Small Area Geographies was released in August 2013. There are eight separate classifications for wards: Urban - A1, B1, C1, C2; Rural - D1, D2, E1, E2. However, only three classifications are applicable to the Dover district: C1 = Urban city and town D1 = Rural town and fringe E1 = Rural village and dispersed
2 Source: ONS 2013 Ward Level MYPE (from KCC Business Intelligence Statistical Bulletin November 2014). These are classed as ‘experimental statistics’ as the margin for error in the modelling process used is larger for smaller areas.
Leadership Support Team: State of the District 2015: Population Profile Page D4
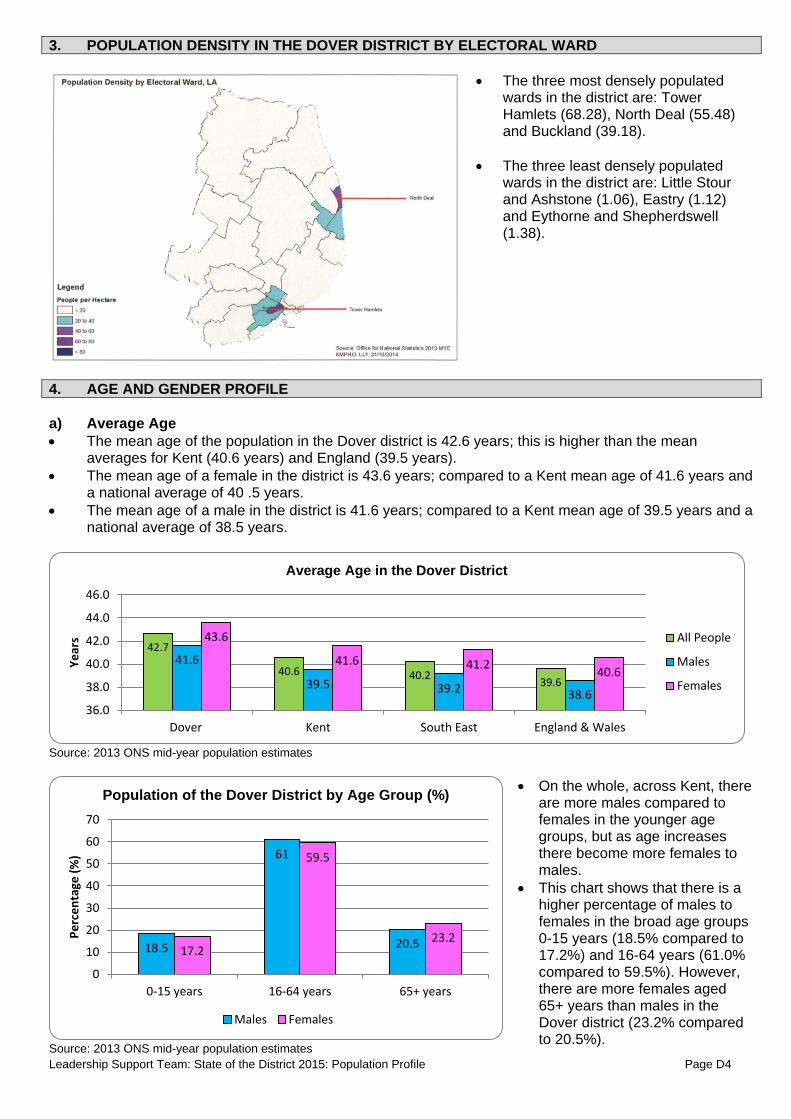
3. POPULATION DENSITY IN THE DOVER DISTRICT BY ELECTORAL WARD
• The three most densely populated
wards in the district are: Tower Hamlets (68.28), North Deal (55.48) and Buckland (39.18).
• The three least densely populated
wards in the district are: Little Stour and Ashstone (1.06), Eastry (1.12) and Eythorne and Shepherdswell (1.38).
4. AGE AND GENDER PROFILE a) Average Age • The mean age of the population in the Dover district is 42.6 years; this is higher than the mean
averages for Kent (40.6 years) and England (39.5 years). • The mean age of a female in the district is 43.6 years; compared to a Kent mean age of 41.6 years and
a national average of 40 .5 years. • The mean age of a male in the district is 41.6 years; compared to a Kent mean age of 39.5 years and a
national average of 38.5 years.
Source: 2013 ONS mid-year population estimates
Source: 2013 ONS mid-year population estimates
• On the whole, across Kent, there are more males compared to females in the younger age groups, but as age increases there become more females to males.
• This chart shows that there is a higher percentage of males to females in the broad age groups 0-15 years (18.5% compared to 17.2%) and 16-64 years (61.0% compared to 59.5%). However, there are more females aged 65+ years than males in the Dover district (23.2% compared to 20.5%).
42.7
40.6 40.2 39.6
41.6
39.5 39.2 38.6
43.6
41.6 41.2 40.6
36.0
38.0
40.0
42.0
44.0
46.0
Dover Kent South East England & Wales
Year
s
Average Age in the Dover District
All People
Males
Females
18.5
61
20.5 17.2
59.5
23.2
0
10
20
30
40
50
60
70
0-15 years 16-64 years 65+ years
Perc
enta
ge (%
)
Population of the Dover District by Age Group (%)
Males Females
Leadership Support Team: State of the District 2015: Population Profile Page D5
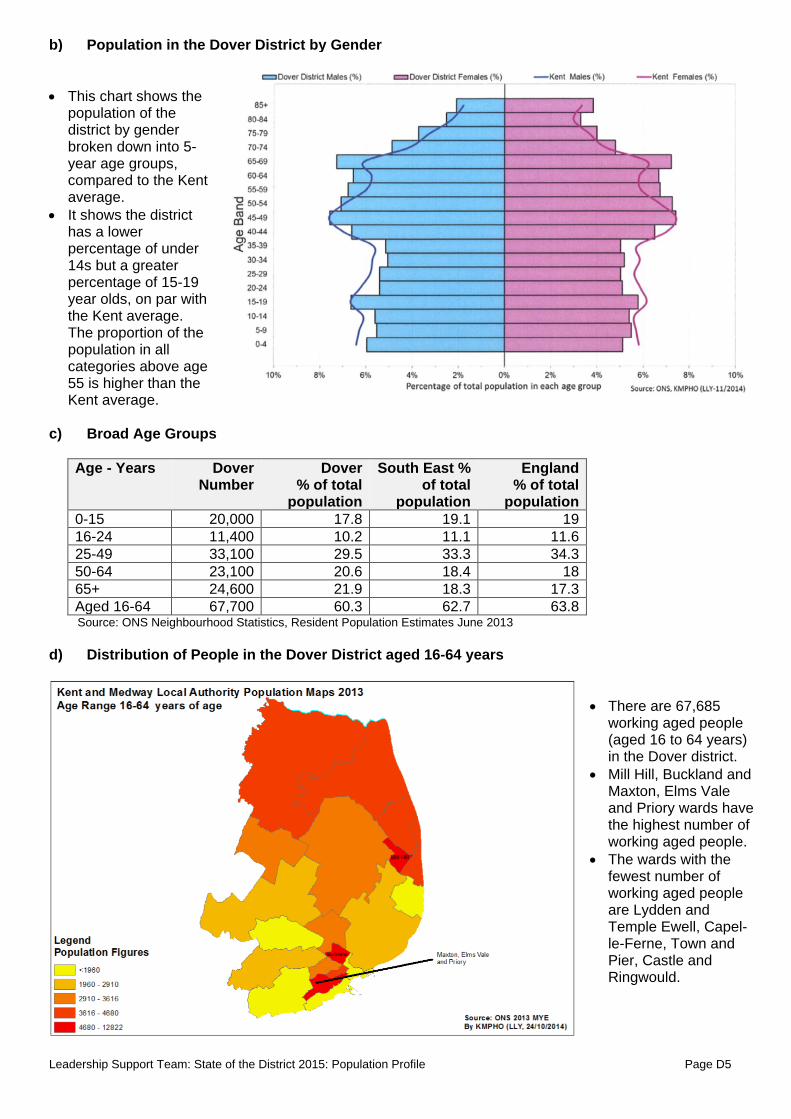
b) Population in the Dover District by Gender
• This chart shows the population of the district by gender broken down into 5-year age groups, compared to the Kent average.
• It shows the district has a lower percentage of under 14s but a greater percentage of 15-19 year olds, on par with the Kent average. The proportion of the population in all categories above age 55 is higher than the Kent average.
c) Broad Age Groups
Age - Years Dover
Number Dover
% of total population
South East % of total
population
England % of total
population 0-15 20,000 17.8 19.1 19 16-24 11,400 10.2 11.1 11.6 25-49 33,100 29.5 33.3 34.3 50-64 23,100 20.6 18.4 18 65+ 24,600 21.9 18.3 17.3 Aged 16-64 67,700 60.3 62.7 63.8
Source: ONS Neighbourhood Statistics, Resident Population Estimates June 2013
d) Distribution of People in the Dover District aged 16-64 years
• There are 67,685
working aged people (aged 16 to 64 years) in the Dover district.
• Mill Hill, Buckland and Maxton, Elms Vale and Priory wards have the highest number of working aged people.
• The wards with the fewest number of working aged people are Lydden and Temple Ewell, Capel-le-Ferne, Town and Pier, Castle and Ringwould.

Leadership Support Team: State of the District 2015: Population Profile Page D6
5. CHILDREN AND YOUNG PEOPLE a) Population aged under 20 in Dover district (Mid-2013) Total Males Females
0-3 years Early Years children 4,900 2,600 2,300 4-10 years Primary age children 8,700 4,300 4,400
11-18 years Secondary age children 10,800 5,500 5,200 10-17 years Age group covered by youth offending service 10,600 5,400 5,200 14-19 Years Age group for Key Qualifications 8,300 4,300 4,000
0-19 years All children & young people 25,600 13,100 12,500 Source: 2013 Mid-year population estimates, ONS; KCC Area Profile. All numbers are separately rounded to the nearest 100. b) Age profile by Gender • All children and
young people under the age of 20 make up 22.8% of the total population of the Dover district.
• There is a higher percentage of boys than girls in all categories, except the 4-10 years age group (primary age children).
Source: 2013 Mid-year population estimates, ONS; KCC Area Profiles
c) Distribution of Children in the Dover District Aged 0 - 4 Years
• There are 6,219 children aged
0 to 4 in the Dover district. • Buckland, St Radigunds,
Tower Hamlets and Maxton, Elms Vale and Priory have the highest number of children aged 0 to 4.
• The wards with the fewest number of children aged 0 to 4 are Lydden and Temple Ewell, River, Capel-le-Ferne, Town and Pier and Ringwould.
53.1
49.4
50.9
50.9
51.8
51.2
46.9
50.6
48.1
49.1
48.2
48.8
0
10
20
30
40
50
60
0-3 years 4-10 years 11-18 years 10-17 years 14-19 Years 0-19 years
Perc
enta
ge(%
)
Population aged under 20 in Dover district (%), (Mid-2013)
Males Females

Leadership Support Team: State of the District 2015: Population Profile Page D7
d) Distribution of Children in the Dover District Aged 0 - 19 Years
• There are approximately 25,600 children aged 0 to 19 in the Dover district.
• Buckland and Maxton, Elms Vale and Priory have the highest number of people aged 0 to 19.
• The wards with the fewest number of people aged 0 to 19 are Lydden and Temple Ewell, Capel-le-Ferne, Town and Pier, Castle and Ringwould.
e) Teenage Conception
• In general, there are low teenage
conception rates across the Dover district.
• The ward with the highest teenage conception rate is Tower Hamlets, which has one of the highest rates in Kent and Medway.
• Buckland and St. Radigunds have the next highest teenage conception rates.
• These three wards are in the most deprived quintile of all wards in the district.
Source: ONS, Produced by KMPHO

Leadership Support Team: State of the District 2015: Population Profile Page D8
6. OLDER PEOPLE
• There are 32,000 people (28.5% of
the total population) 60+ years in the Dover District.
o 7,400 (6.6%) are in the 60-64 years age band.
o 8,100 (7.3%) are in the 65-69 years age band.
o 5,400 (4.8%) are in the 70-74 years age band
o 4,400 (3.9%) are in the 75-79 years age band.
o 3,300 (2.9%) are in the 80-84 years age band.
o 2,100 (1.9%) are in the 85-89 years age band.
o 1,300 (1.1) are aged 90+ years. Source: 2013 ONS Mid-Year Population Estimates
a) Distribution of people in Dover District aged 65+ years
• There are 24,604 people aged 65
plus in the Dover district. • Little Stour and Ashstone,
Sandwich, Middle Deal and Sholden, Mill Hill and Walmer have the highest number of people aged 65 plus.
• The wards with the fewest number of people aged 65 plus are Lydden and Temple Ewell and Town and Pier.
• There are 3,362 people aged 85 plus in Dover.
• Sandwich, Middle Deal and Sholden and Walmer have the highest number of people aged 85 plus.
• The wards with the fewest amount of people aged 85 plus are Aylesham and Capel-le-Ferne.
b) State Pension Claimants
• As at November 2014, there
were 26,520 state pension claimants in the Dover district. This is up from 26,330 as at August 2013.
• Of these, 15,240 (57.5%) are female and 11,280 are male (42.5%).
• There were also 4,410 people claiming pension credit, an income-related benefit. This is down from 4,780 as at August 2013.
Source: DWP, KCC Area Profiles
8 6 4 2 2 4 6 8
60-6465-6970-7475-7980-8485-89
90+
Percentage of total population (%)
Age
Gro
up (Y
ears
)
Population aged 60+ in the Dover District, Mid-2013
Males Females
-
2,000
4,000
6,000
8,000
10,000
aged 60-64
aged 65-69
aged 70-74
aged 75-79
aged 80-84
aged 85-89
aged 90and over
State Pension Claimants by Age in Dover District
Males Females

Leadership Support Team: State of the District 2015: Population Profile Page D9
Source: DWP, KCC Area Profiles
c) Disability Living Allowance • Disability Living Allowance (DLA)
helps people with care or mobility needs.
• As at November 2014, there were 2,590 DLA claimants over the age of 60 in the Dover district.
• The highest number of these claimants are in the 65-69 years age band (810 people), followed by the 60-64 years age band (680 people).
• DLA has now been replaced by Personal Independence Payment (PIP) for all new claimants.
d) Attendance Allowance • Attendance Allowance can
help someone stay independent in their own home.
• As at November 2014, there were 3,600 Attendance Allowance claimants in the Dover district.
• The highest number of these claimants are in the 85-89 year age band (870 people), 80-84 years (840 people) and those aged 90+ (800 people).
Source: DWP, KCC Area Profiles
e) Limiting long-term illness aged 60+
Source: ONS Census 2011, KCC Area Profiles
• As at the Census 2011, there were 11,236 people aged 60+ years with a limiting long-term illness (LLTI).
• Of these, 6,246 (55.6%) were female and 4,990 (44.4%) male. The largest proportion of these people are in the 75-79 years age group (2,137), followed by the 70-74 years age group (2,106).
-
100
200
300
400
500
600
700
800
900
aged 60-64
aged 65-69
aged 70-74
aged 75-79
aged 80-84
aged 85-89
aged 90and over
Num
ber o
f peo
ple
Disability Living Allowance Claimants by Age & Gender
Males Females
0100200300400500600700800900
1,000
aged 65-69 aged 70-74 aged 75-79 aged 80-84 aged 85-89 aged 90 andover
Num
ber o
f peo
ple
Attendance Allowance Claimants By Age & Gender
Males Females
-
500
1,000
1,500
2,000
2,500
aged 60-64 aged 65-69 aged 70-74 aged 75-79 aged 80-84 aged 85-89 aged 90 andover
Num
ber o
f Peo
ple
People aged 60+ with a limiting long term illness by age and gender
Males Females

Leadership Support Team: State of the District 2015: Population Profile Page D10
f) Unpaid Care
• As at the Census 2011, there were 3,093 people aged 60+ years providing unpaid care.
• Of these, 1,356 people are aged 65-74 years (43.8%).
Source: ONS Census 2011, KCC Area Profiles
7. CHANGE IN POPULATION
a) Population Time Series 1998-2013
• Over this 15-year period, the
population in the Dover district has grown by 8,700 people (8.3%).
• This is below the averages for Kent (14.3%), South East (11.5%) and England (10.3%).
b) Components of Population Change
• Between 2012 and 2013, the population in the Dover district is estimated to have grown by 600 people
(0.5%). Migration was the largest component of this population change (500 people) in the district (more people entering the district than leaving). This is the same position for the rest of Kent apart from Gravesham and Tunbridge Wells, where natural change (surplus of births minus deaths) was the largest component3.
• Natural change in the coastal districts (Dover, Shepway and Thanet) has historically been negative, meaning there are more people dying than are being born. This is attributed to the older age profile of these districts.
Source: ONS (Crown Copyright). Presented by KCC Business Intelligence, Research & Evaluation
3 Source: KCC BIS Bulletin July 2014 - What’s causing Kent’s population growth?
- 200 400 600 800
1,000 1,200 1,400 1,600
60-64 65-74 75-84 85-89 90+
Num
ber o
f Peo
ple
People aged 60+ providing unpaid care by age and gender
Males Females
95,000100,000105,000110,000115,000
Num
ber o
f Peo
ple
Year
Dover District Population Time Series 1998-2013
Mid Year Population Estimate
-1000-500
0500
10001500
Num
ber o
f Peo
ple
Timeseries: Components of Population Change in the Dover District
Natural Change Migration Total Change

Leadership Support Team: State of the District 2015: Population Profile Page D11
8. POPULATION FORECASTS
a) Population forecasts for the Dover District 2011-2031 Total 0-15 16-64 65+ 2011 111,700 20,200 68,800 22,700 2016 117,800 21,300 69,500 27,000 2021 125,900 23,400 71,900 30,600 2026 134,000 24,700 74,500 34,800 2031 134,700 23,600 72,000 39,100 KCC Strategy Forecasts - November 2014
• The Dover district faces demographic changes over the next 15 years that, unchecked, will see the population age dramatically.
• The identified demographic trend is one of the main challenges for the Dover district given its potential impact in terms of a declining working age population, increased public spending in areas of health and social care and being able to provide appropriate services.
• The overall population is expected to rise by 23,000 by 2031, which would increase the population size to
134,700 (20.6%). • Population forecasts show the 65+ age group will rise by 72.2% from 2011-2031, which is a significantly
faster rate of increase than the 0-15 and 16-64 year olds age groups, which are predicted to rise by 16.8% and 4.7% respectively.
b) Projected population change from 2014, for 2015-2019 by Broad Age Group in the Dover District
• Population projections from the Office for National Statistics (ONS) show a rise in the 65-84 and 85+ age groups with the largest projected increase (20.70%) by 2015 for the 85+ age group.
• There is a projected decrease for the 0-4, 0-19 and 20-64 age groups. The overall population projected increase for Dover for 2019 is just 2.13%.
• This would result in the size of the population being 114,145.847 approximately (based on projections).
2011 2016 2021 2026 2031
Forecast population growth from 2011 in the Dover area (2011 = 100)
0-15 16-64 65+
Source: KCC Strategy Forecasts Nov 2014; Research & Evaluation Kent County Council

Leadership Support Team: State of the District 2015: Population Profile Page D12
c) Population change between wards
• Overall population increase is expected to be at least 5% across Dover, and over 10% in six of the wards (Aylesham, Eastry, Middle Deal and Sholden, St. Margaret’s-at-Cliffe, St. Radigunds, Town and Pier).
• An increase in the under 8 population of over 7% is anticipated in the same six wards. • For the population aged 18 to 64 years, one ward has an expected decrease in population between 2013
and 2020 (Capel-le-Ferne). Seven wards have an increase of over 4% (Aylesham, Eastry, Maxton, Elms Vale and Priory, Middle Deal and Sholden, St. Margaret’s-at’Cliffe, St. Radigunds, Town and Pier).
• Population growth for people aged 65+ is greatest, with at least a 13% increase across all wards. Eight wards have an increase of over 19% ((Aylesham, Eastry, Maxton, Elms Vale and Priory, Middle Deal and Sholden, Sandwich, St. Margaret’s-at-Cliffe, St. Radigunds, Town and Pier).
• The General Fertility Rate (GFR) measures the ratio between the number of new born babies to the number of females aged 15 to 44 in each year. The GFR for the Dover district has risen steadily in recent years to a high of 71.2 in 2011. The trend in rising GFRs is also seen across the other local authorities in the area with the exception of Canterbury.
• There are considerable differences in the GFRs for each electoral ward in the district between 2009-2013. The highest rates are in Lydden and Temple Ewell, Castle and Town and Pier. The lowest rates are found in Little Stour and Ashstone, Walmer and River.
9. EQUALITY AND DIVERSITY a) ETHNICITY
Source: 2011 Census, ONS (Local Profiles)
Broad Ethnic Group
• The 2011 Census provides details on 18 separate ethnic categories, which can be aggregated into 5 broad ethnic groups.
• The population of the Dover district is predominantly White, with 107,966 people (96.7%) of White ethnic origin and 3,708 of Non-White ethnic origin (3.3%).
• The Dover district has the lowest number and proportion of residents from a BME group in Kent. The rate of 3.3% is considerably lower than the averages for Kent (6.3%), South East (9.3%) and nationally (14.6%).
• Out of the twelve local authority districts within Kent, Gravesham has the highest number and proportion of residents from a BME group with 17,494 people (17.2%). Please see following map of Kent:
96.7 90.7
85.4
0.9 1.9 2.3 1.8 5.2 7.8 0.4 1.6 3.5 0.3 0.6 1
0
20
40
60
80
100
Dover South East England
Perc
enta
ge (%
)
Population by Broad Ethnic Group (%), Census 2011
White Mixed / Multiple ethnic groupsAsian / Asian British Black / African / Caribbean / Black BritishOther ethnic group

Leadership Support Team: State of the District 2015: Population Profile Page D13
Black Minority Ethnic (BME) population as a % of total resident population across Kent
Source: ONS Census 2011; Produced by Business Intelligence, KCC; © Crown Copyright and database right 2012, Ordnance Survey 100019238 • The Asian/Asian British is the second largest ethnic group in the Dover district after the ‘White’ ethnic
group, with 1.8% (2,031 people) of the total population. This compares with 5.2% of the total population in South East and 7.8% in England.
• The third largest ethnic group in the district is the mixed-multiple ethnic group with a population of 1,029 people. This equates to 0.9% of the total population.
• The Black/ African/ Caribbean/ Black British groups accounts for 0.3% of the total population in the district. This is equivalent to 0.3% of the total population.
• The smallest ethnic group is the ‘Other’ ethnic group, with 262 people or 0.2% of the total population in the district.
Ethnicity: Population Change, Census 1991, 2001, 2011 1991-2001-2011 White Population change in the Dover District
1991 2001 2011 1991 to 2001 change 2001 to 2011 change 1991 to 2011 change
Number % Number % Number % 102,331 103,023 107,966 692 0.7 4,943 4.8 5,635 5.5
1991-2001-2011 BME Population change in the Dover District
1991 2001 2011 1991 to 2001 change 2001 to 2011 change 1991 to 2011 change
Number % Number % Number % 885 1,543 3,708 658 74.4 2,165 140.3 2,823 319
• In the Dover district, from 2001 to 2011, the population increased by over 7,100 people (+6.8%). People
of White ethnic origin contributed the largest number change increasing by nearly 5,000 people (+4.8%). • The BME population in the Dover district has increased by +140.3% over the past ten years, which is an
extra 2,165 people. This increase is higher than the county rate of +123%, regional rate of +106% and national rate of +73.4%.
• The Dover district’s White population has increased by +5.5% over the past twenty years (1991-2011). This is equal to an extra 5,635 people, and is lower than the county and regional rates (+10.2% and +11.2% respectively) but higher the national rate of +2.6%.

Leadership Support Team: State of the District 2015: Population Profile Page D14
• Between 1991 and 2011, the BME population in the Dover district increased by an additional 2,823 people or +319%. This compares to +275.4% in Kent, +268.9% across the south east and +165.6% nationally. Within Kent, Shepway saw the largest increase in the twenty year period, with an extra 4,720 people, which equates to +456.5%. The percentage increases are large because the BME population was very small in 1991.
Ethnicity by Age Group • The graph below shows that the percentage of the BME population is higher in those of working age
compared to 0 to 15 years and those who have retired:
Source: ONS, Census 2011
Source: ONS, Census 2011 and KCC District Profile
Country of Birth • In 2011, over 103,500 residents of
the Dover district were born within the UK. This equates to 92.7% of the total population and is a higher proportion than that seen nationally (86.2%), regionally (87.9%) and at county level (90.9%).
• Of the 8,167 (7.3%) Dover district residents not born in the UK, 3,871 people (3.4%) were born in Europe and 4,296 people (3.8%) were born in countries outside Europe.
Length of residency in the UK
• At the time of the Census 2011, 92.7% of residents in the Dover district had been born in the UK. • 7.3% (or 8,167 people) were born outside of the UK. Just over 53% of this total (4,340 people) has been
resident in the UK for more than 10 years. • Those who have been resident in the UK for less than 2 years make up the smallest proportion of the
district’s migrant population: o Less than 2 years: 12.9% (1,052 people) o 2 to 5 years: 15.7% (1,279 people) o 5 to 10 years (1,496 people)
All ages 0-15 Working Age PensionersOther 262 38 212 12Black or Black British 386 63 300 23Asian or Asian British 2,031 548 1,399 84Mixed 1,029 435 535 59White 107,966 19,208 66,419 22,339
020,00040,00060,00080,000
100,000120,000
Num
ber o
f Peo
ple
Ethnicity by Age Group, Census 2011
White Mixed Asian or Asian British Black or Black British Other
Europe, 96.4%
Country of birth (world area) 2011
Africa
Middle East & Asia
The Americas & the Caribbean
Antarctica & Oceania
Dover District

Leadership Support Team: State of the District 2015: Population Profile Page D15
Year of Arrival in UK
• The largest number of migrants to the Dover district arrived during 2007-09 (1,500 people or 1.3% of the total population); 2004-06 (1,342 people or 1.2%) and 1991-2000 (1,200 people or 1.1%).
• The majority of the Dover district’s migrant population were aged 44 and younger when they arrived in the UK. 3,591 residents were aged 0-17 when they arrived in the UK, which is equivalent to 44.0% of the total migrant population. This is higher than the proportion for Kent (38.1%), South East (36.2%) and England (33.3%).
• The second largest proportion of migrants arrived here between the ages of 25 to 44. 2,352 people were within this age group when they arrived in the UK, which is equivalent to 28.8% of the total migrant population. It is possible that people from these two age groups arrived together as families.
Household language • The 2011 Census shows us for the first time the proportion of households that have at least one resident
who has English as their main language. • In the Dover district there are 46,557 households (96.4%) in which all people aged 16 and over had
English as their main language. This proportion is higher than the Kent figure of 94.8%, South East figure of 93.2% and national figure of 90.9%.
• Of the 3.6% households in the Dover district in which not all occupants had English as their main language, 1.8% of households had no residents with English as a main language.
Source: ONS 2011 Census, KCC District Profile
Proficiency in English
Source: ONS, Census 2011
• Of those residents in the Dover district who do not have English as their main language, 1.3% of said they can speak English very well and a further 1.3% well. 0.6% cannot speak English well and 0.1% cannot speak English.
All people aged 16 and over in household have
English as a main language, 96.4%
Other, 3.6%
Household Language, 2011
At least one but not all peopleaged 16 and over in householdhave English as a mainlanguage
No people aged 16 and over inhousehold but at least oneperson aged 3 to 15 hasEnglish as a main language
No people in household haveEnglish as a main language
Dover District
00.5
11.5
22.5
33.5
Can speakEnglish very well
Can speakEnglish well
Cannot speakEnglish well
Cannot speakEnglish
Perc
enta
ge (%
)
Proficiency in English, where main language is not English
Dover Kent South East England

Leadership Support Team: State of the District 2015: Population Profile Page D16
b) RELIGION AND BELIEF • The religion question was the only voluntary question on the 2011 Census and 7.8% of residents (8,688
people) in the Dover district chose not to answer it. • Christianity remains the largest religion in the Dover district. A total of 71,541 residents said that they
were Christians, which is equivalent to 64.1% of the total population. This is a higher proportion than the figures for Kent (62.5%), South East (59.7%) and England (59.4%).
• 29,047 people, or 26% of the district population, stated they do not have a religion. The largest non-Christian religious groups in the district are Hindu 0.6% (682 people); Buddhist 0.5% (523 people); Muslim 0.5% (521 people) and Jewish 0.1% (97 people).
Religion in the Dover district Christian Buddhist Hindu Jewish Muslim Sikh All other
religions No religion
Religion not stated
64.1% 0.5% 0.6% 0.1% 0.5% 0.0% 0.5% 26.0% 7.8%
Religion in the Dover District, Census 2011
Source: ONS Census 2011 • Between 2001 and 2011 there has been a decline in the number of people in the Dover district who
identify themselves as being Christian. The Christian population has fallen by -8,552 (-10.7%). • In the Dover district, the Hindu (328.9%) and Buddhist (193.8%) religions have seen the greatest
increases in percentage terms. The reason for such a large percentage increase is that the initial numbers in the district were very low in 2001.
c) SEXUAL ORIENTATION
• At this time no information is available at local level. However, the Census does provide information on
Marital and Civil Partnership Status. d) MARITAL AND CIVIL PARTNERSHIP STATUS • At the time of the 2011 Census, 44,096 people (48.3%) were married in the Dover district. This is below
the average for Kent (48.8%) and South East (49.3%) but higher than the average for England (46.6%). • The proportion of single people in the district (29.5% or 26,924 people) was lower than the averages for
Kent (31.3%), South East (31.9%) and England (34.6%). • The proportion of people in a registered same-sex civil partnership in the district (0.3% or 242 people) is
slightly above the averages for Kent, South East and England (all 0.2%).
Christian 64.1%
Buddhist Hindu Jewish Muslim Sikh All other religions
No religion
Religion not stated
Other
Buddhist
Hindu
Jewish
Muslim
Sikh
All other religions
No religion
Religion not stated

Leadership Support Team: State of the District 2015: Population Profile Page D17
Source: ONS Census 2011 e) SOCIO ECONOMIC POSITION
• The National Statistics Socio-economic Classification (NS-SeC) provides an indication of socio-
economic position based on occupation and is coded to Standard Occupational Classification. • To assign a person (aged 16 to 74) to an NS-SeC category, their occupation title is combined with
information about their employment status, whether they are employed or self-employed and whether or not they supervise other employees.
Source: ONS Census 2011 QS607EW • The majority of usual residents aged 16-74 years old in the district at the time of the Census fell within the
“2: Lower managerial, administrative and professional occupations” category (20.7% or 16,726 people).
0102030405060
Single (nevermarried or never
registered a same-sex civil
partnership)
Married In a registeredsame-sex civilpartnership
Separated (but stilllegally married or
still legally in asame-sex civilpartnership)
Divorced orformerly in a same-sex civil partnershipwhich is now legally
dissolved
Widowed orsurviving partnerfrom a same-sexcivil partnership
Marital and Civil Partnership Status, Census 2011
Dover Kent South East England
6,157
16,726
10,513
8,564 6,843
13,757
9,140
4,040
5,046
National Statistics Socio-economic Classification of Dover District
1. Higher managerial, administrativeand professional occupations
2. Lower managerial, administrativeand professional occupations
3. Intermediate occupations
4. Small employers and own accountworkers
5. Lower supervisory and technicaloccupations
6. Semi-routine occupations
7. Routine occupations
8. Never worked and long-termunemployed
Not classified

Leadership Support Team: State of the District 2015: Population Profile Page D18
Source: ONS Census 2011 QS613EW
• Social grade is the socio-economic classification used by the Market Research and Marketing Industries, most often in the analysis of spending habits and consumer attitudes.
• Although it is not possible to allocate Social Grade precisely from information collected by the 2011 Census, the Market Research Society has developed a method for using census information to provide a good approximation of social grade.
• The majority of usual residents aged 16-64 years old in the district at the time of the Census fell within the C1 social grade (30.8% or 20,984 people).
o AB: Higher and intermediate managerial/administrative/professional occupations o C1: Supervisory, clerical and junior managerial/administrative/professional occupations o C2: Skilled manual occupations o DE: Semi-skilled and unskilled manual occupations; unemployed and lowest grade occupations
CENSUS 2011 • A census is a count of all people and households in the country. Taken once every ten years, the last
census for England and Wales took place on 27 March 2011 and involved around 25 million households. • It is the only survey to provide a detailed picture of the entire population and is unique because it covers
everyone at the same time and asks the same core questions everywhere. This makes it easy to compare different parts of the country.
• The census is taken by the Office for National Statistics (ONS) and the results provide population statistics from a national to neighbourhood level for use by government, local authorities and business and communities to help plan the local services needed like schools, transport, housing and health.
• The Office for National Statistics (ONS) has published a wide range of information from the Census 20114 and it is not possible to include everything in the State if the District Report.
f) MOSAIC PROFILE FOR DOVER
Mosaic is a classification system designed by Experian to profile the characteristics of the UK population. Each household in the UK is classified as belonging to one of 15 groups and 66 types. These groups identify clusters of individuals and households that are as similar as possible to each other, and as different as possible to any other group. They describe the residents of a postcode in terms of their typical demographics, their behaviours, their lifestyle characteristics and their attitudes.
4 http://www.ons.gov.uk/ons/guide-method/census/2011/index.html
12,212
20,984 16,926
17,951
Approximated Social Grade in the Dover District
Approximated socialgrade AB
Approximated socialgrade C1
Approximated socialgrade C2
Approximated socialgrade DE

Leadership Support Team: State of the District 2015: Population Profile Page D19
Mosaic Group Definitions
A Country Living - Well off owners in rural locations enjoying the benefits of country life
B Prestige Positions - Established families in large detached homes living upmarket lifestyles
C City Prosperity - High status city dwellers living in central locations and pursuing careers with high rewards
D Domestic Success - Thriving families who are busy bringing up children and following careers
E Suburban Stability - Mature suburban owners living in settled lives in mid-range housing
F Senior Security - Elderly people with assets who are enjoying a comfortable retirement
G Rural Reality - Householders living in inexpensive homes in village communities
H Aspiring Homemakers - Younger households settling down in housing priced within their means
I Urban Cohesion - Residents of settled urban communities with a strong sense of identity
J Rental Hubs - Educated young people privately renting in urban neighbourhoods
K Modest Traditions - Mature homeowners of value homes enjoying stable lifestyles
L Transient Renters - Single people privately renting low cost homes for the short term
M Family Basics - Families with limited resources who have to budget to make ends meet
N Vintage Value – Elderly people reliant on support to meet financial or practical needs
O Municipal Challenge – Urban renters of social housing facing an array of challenges These mosaic Group definitions have changed from last year
0% 2% 4% 6% 8% 10% 12% 14% 16% 18%
Group AGroup BGroup CGroup DGroup EGroup FGroup GGroup HGroup IGroup JGroup KGroup L
Group MGroup NGroup O
Mosaic Profile - 2014 - Dover
Source: 2014 Experian Ltd.
0.0%2.0%4.0%6.0%8.0%
10.0%12.0%14.0%16.0%18.0%
GroupA
GroupB
GroupC
GroupD
GroupE
GroupF
GroupG
GroupH
GroupI
GroupJ
GroupK
GroupL
GroupM
GroupN
GroupO
perc
enta
ge
Mosaic Profile 2014: Dover and Kent Comparison
Dover Kent

Leadership Support Team: State of the District 2015: Population Profile Page D20
• The largest grouping in the Dover district is ‘Group G: Rural Reality - Householders living in inexpensive
homes in village communities’. At 16.6% this is significantly higher than the Kent average of 7.1%. o Rural Reality are a mix of families, mature couples and older singles living in rural locations in lower
cost housing. Some live in developments that have sprung up around villages, others in scattered hamlets or in remote communities.
o These tend not to be picture-postcard country properties, but more affordable two or three bedroom bungalows, semis or terraces often built post-war or more recently. Seventy per cent of this group own their own homes, while others rent from social landlords.
o Overall more people are employed than retired. Those employed may work in agriculture and related industries, or in local manufacturing or retail. People are more likely to have lower level supervisory roles, routine and semi-routine jobs than managerial roles. A relatively high proportion of these people are self-employed.
• The next highest grouping is ‘Group A: Country Living - Well off owners in rural locations enjoying the benefits of Country life’. At 10.6% this is again higher than the Kent figure if 8.5%. o Country Living consists of affluent people who can afford to live in pleasant rural locations surrounded
by agricultural landscapes. This population is divided between those still in work and retired people. o These people live in attractive, spacious detached homes that are often period properties or named
buildings, and the majority are owned. o Incomes are good, either derived from occupational pensions, commuting to well-paid professional
jobs or running successful farms or their own businesses - Country Living contains the highest proportion of self-employed people of any group. Asset holdings in the form of stocks and shares are high.
• This is followed by ‘Group F: Senior Security – Elderly people with assets who are enjoying a comfortable retirement’ (10.1% compared to 10.2% for Kent). o Senior Security is the most elderly group of all, their average age is 75, and almost all are retired.
Some are living with their long-time spouse, but a larger number are now living alone, and women outnumber men.
o During their working lives Senior Security were employed in a range of managerial and intermediate occupations. They had sufficient income to buy their own homes with a mortgage which they have now paid off, leaving them with considerable equity in their homes.
o These homes are comfortable semi-detached three bedroom houses and bungalows in pleasant suburbs. They are generally very settled, long-standing residents of their local communities and have the longest length of residency of any group, having lived in their homes for nearly 25 years, on average.
• The Dover district has a low percentage of: o ‘Group C: City Prosperity - High status city dwellers living in central locations and pursuing careers
with high rewards’ (0.0% compared to 0.4% for Kent) o ‘Group I: Urban Cohesion - Residents of settled urban communities with a strong sense of identity’
(0.7% compared to 1.4% for Kent) o ‘Group O: Municipal Challenge – Urban renters of social housing facing an array of challenges’
(1.3%, which is the same as Kent).


![Copyright © C. J. Date 2005page 97 S#Y S1DURINGS3DURING [d04:d10][d08:d10] S2DURINGS4DURING [d02:d04][d04:d10] [d08:d10] WITH ( EXTEND T2 ADD ( COLLAPSE.](https://static.fdocuments.net/doc/165x107/56649c765503460f9492abbb/copyright-c-j-date-2005page-97-sy-s1durings3during-d04d10d08d10.jpg)


