Page [D Projections of return filings, 1982-1990 ... · ~ Taxpayer usage of Form 1040 and Form...
48
Statistics of Income Department of the Treasury Internal Revenue Service Volume 1, Number 3 Contents of This Issue Page [D Projections of return filings, 1982-1990 0 Individual income tax returns, 1980 Taxpayer usage of Form 1040 and Form 1040A, 1980 l23l Unincorporated business activity, 1979 1431 Windfall profit tax, first quarter, 1981 Publication 1136 (Rev. 1-82) Winter 1981-82
Transcript of Page [D Projections of return filings, 1982-1990 ... · ~ Taxpayer usage of Form 1040 and Form...
Statistics of Income
Department of the Treasury Internal Revenue Service
Volume 1, Number 3
Contents of This Issue Page
[D Projections of return filings, 1982-1990
0 Individual income tax returns, 1980
~ Taxpayer usage of Form 1040 and Form 1040A, 1980
l23l Unincorporated business activity, 1979
1431 Windfall profit tax, first quarter, 1981
Publication 1136 (Rev. 1-82)
Winter 1981-82

Statistics of income
Department of the Treasury Internal Revenue Service
Internal Revenue Service
Roscoe L. Egger, Jr. Commissioner Russell E. Dyke Assistant Commissioner (Planning and Research)
BULLETI Pub. 1136 1Rev.1-82)
Statistics Division
Fritz Scheuren Director Noreen Hoffmeier Editor Ruth Wise Copy Editor
This report contains information on: projections of the major types of returns to be filed from 1982-1990; individual income tax returns for 1980, covering financial data as well as taxpayer reporting characteristics; unincorporated business data, both sole proprietorships and partnerships, for 1979; and first quarter 1981 windfall-profit tax liability.
Additional unpublished data concerning these topics are currently available upon request. Further information may be obtained by writing to the Statistics Division, Internal Revenue Service, Washington, DC 20224.
Suggested Citation
Internal Revenue Service Statistics of Income Bulletin, Winter 1981-82 Washington, D.C. 1982
For sale by the Superintendent of Documents, U.S. Government Printing Office, Washington, D.C. 20402

COMMISSIONER OF INTERNAL REVENUE
Washington, DC 20224
The Honorable Donald T. Regan Secretary of the Treasury Washington, DC 20220
Dear ~1r. Secretsry:
January 4, 1982
I am transmitting the Winter 1981-82 issue of the Statistics of Income Bulletin. This report has been produced in accordance with the mandate of section 6108 of the Internal Revenue Code which requires the preparation and publication of statistics reasonably available with respect to the operation of the internal revenue laws.
In this issue, four subjects are presented and discussed. The first relates to the projected filings of the major types of returns through the end of the decade, reflecting recent tax law changes and economic conditions. There are two articles on the second subject, 1980 individual income tax returns. The first of these contains detailed income size and geographic statistics, while the second presents taxpayer reporting characteristics.
Sole proprietorship and partnership activity for 1979 is described in the third topic, on unincorporated businesses. Finally, windfall profit tax liability for the first quarter of 1981 is shown, including data on the types of exempt oil.
With kind regards,
Sincerely,
~e~«
Department of the Treasury Internal Revenue Service
Projections of Returns to be Filed in Fiscal Years 1982-1990
By Kenneth Utter and Max Johns•
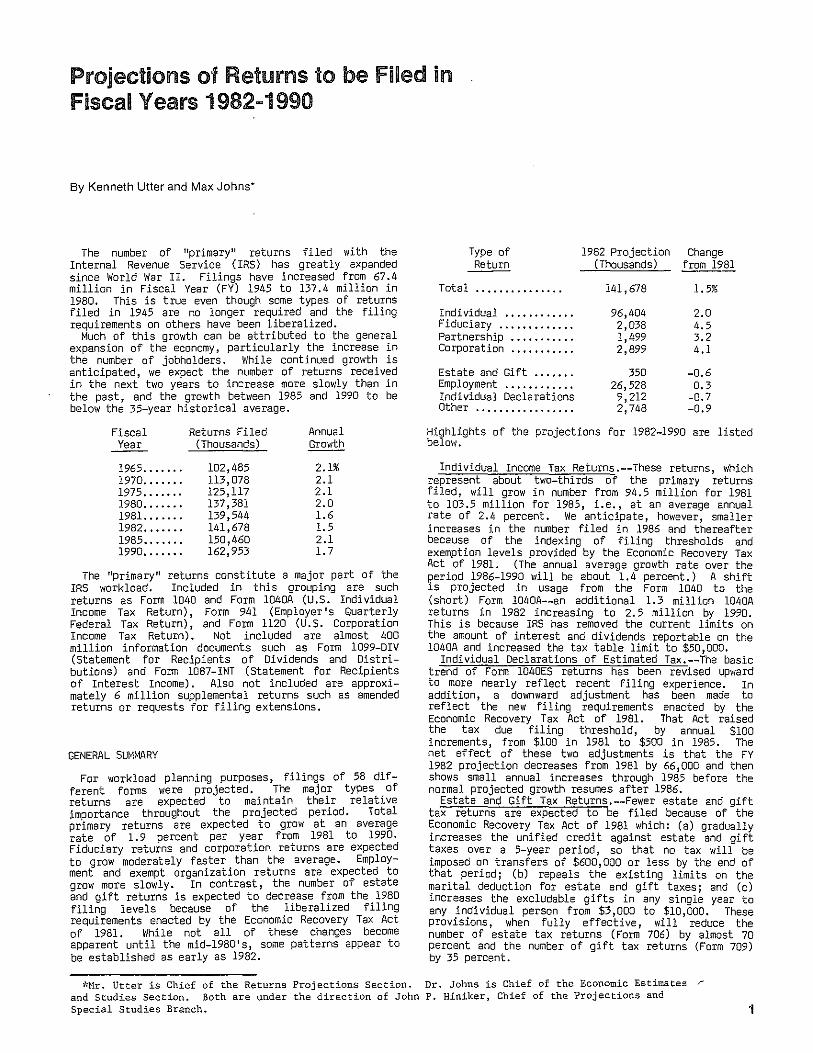
The number of "primary11 returns filed with the Internal Revenue Service (IRS) has greatly expanded since World War II. Filings have increased from 67.4 million in Fiscal Year (FY) 1945 to 137.4 million in 1980. This is true even though some types of returns filed in 1945 are no longer required and the filing requirements on others have been liberalized.
Much of this growth can be attributed to the general expansion of the economy, particularly the increase in the number of jobholders. While continued growth is anticipated, we expect the number of returns received in the next two years to increase more slowly than in the past, and the growth between 1985 and 1990 to be below the 35-year historical average.
Fiscal Year
1965 ...... . 1970 ..... .. 1975 ...... . 1980 ...... . 1981. ..... . 1982 ...... . 1985 ...... . 1990 ...... .
Returns Filed (Thousands)
102,485 113,078 125,117 137,381 139,544 141,678 150,460 162,953
Annual Growth
2.1% 2.1 2.1 2.0 1.6 1.5 2.1 1.7
The "primary" returns constitute a major part of the IRS workload. Included in this grouping are such returns as Form 1040 and Form 1040A (U.S. Individual Income Tax Return}, Form 941 (Employer's Quarterly Federal Tax Return), and Form 1120 (U.S. Corporation Income Tax Return). Not included are almost 400 million information documents such as Form 1099-DIV (Statement for Recipients of Dividends and Distributions) and Form 1087-INT (Statement for Recipients of Interest Income). Also not included are approximately 6 million supplemental returns such as amended returns or requests for filing extensions.
GENERAL SUH~IARY
For workload planning purposes, filings of 58 different forms were projected. The major types of returns are expected to maintain their relative importance throughout the projected period. Total primary returns are expected to grow at an average rate of 1.9 percent per year from 1981 to 1990. Fiduciary returns and corporation returns are expected to grow moderately faster than the average. Employment and exempt organization returns are expected to grow more slowly. In contrast, the number of estate and gift returns is expected to decrease from the 1980 filing levels because of the liberalized filing requirements enacted by the Economic Recovery Tax Act of 1981. While not all of these changes become apparent until the mid-1980's, some patterns appear to be established as early as 1982.
Type of 1982 Projection Change Return (Thousands) from 1981
Total ............... 141,678 1. 5%
Individual ............ 96,404 2.0 Fiduciary ............. 2,038 4.5 Partnership ........... 1,499 3.2 Corporation ........... 2,899 4.1
Estate and Gift ······. 350 -0.6 Employment ······ ...... 26,528 0.3 Individual Declarations 9,212 -0.7 Other ... ······ ······ .. 2,748 -0.9
Highlights of the projections for 1982-1990 are listed below.
Individual Income Tax Returns.--These returns, which represent about two-thirds of the primary returns filed, will grow in number from 94.5 million for 1981 to 103.5 million for 1985, i.e., at an average annual rate of 2. 4 percent. We anticipate, however, smaller increases in the number filed in 1986 and thereafter because of the indexing of filing thresholds and exemption levels provided by the Economic Recovery Tax Act of 1981. (The annual average growth rate over the period 1986-1990 will be about 1.4 percent.) A shift is projected in usage from the Form 1040 to the (short) Form l040A--an additional 1.3 million 1040A returns in 1982 increasing to 2. 5 million by 1990. This is because IRS has removed the current limits on the amount of interest and dividends reportable on the l040A and increased the tax table limit to $50,000.
Individual Declarations of Estimated Tax.--The basic trend of Form 1040ES returns has been revised upward to more nearly reflect recent filing experience. In addition, a downward adjustment has been made to reflect the new filing requirements enacted by the Economic Recovery Tax Act of 1981. That Act raised the tax due filing threshold, by annual $100 increments, from $100 in 1981 to $500 in 1985. The net effect of these two adjustments is that the FY 1982 projection decreases from 1981 by 66,000 and then shows small annual increases through 1985 before the normal projected growth resumes after 1986.
Estate and Gift Tax Returns.--Fewer estate and gift tax returns are expected to be filed because of the Economic Recovery Tax Act of 1981 which: (a) gradually increases the unified credit against estate and gift taxes over a 5-year period, so that no tax will be imposed on transfers of $600,000 or less by the end of that period; (b) repeals the existing limits on the marital deduction for estate and gift taxes; and (c) increases the excludable gifts in any single year to any individual person from $3,000 to $10,000. These provisions, when fully effective, will reduce the number of estate tax returns (Form 706) by almost 70 percent and the number of gift tax returns (Form 709) by 35 percent.
*Mr. Utter is Chief of the Returns Projections Section. Dr. Johns is Chief of the Economic Estimates ~ and Studies Section. Both are under the direction of John P. Hiniker, Chief of the Projections and Special Studies Branch. 1
2
Exempt Organization Returns.--Only a modest increase from the FY 1980 fillng level is expected by 1990. The projection reflects a relatively high level of filing with IRS because of an agreement between IRS officials and State government representatives that, in response to the Paperwork Reduction Act of 1980, allows a single form to satisfy both Federal and State filing requirements. The projection does not take into account possible increases in the income filing requirements (from $10,000 to $25,000) presently under consideration for Form 990.
Excise Tax Returns.--A modest increase by 1990 is expected for excise tax returns. The projected levels include an additional 20,000 Form 720 returns in 1981 and an additional 10,000 each year through 1989.
These addi tiona! returns are expected as a result of the Crude Oil Windfall Profit Tax of 1980. The projections also assume the expiration of the telephone excise tax on January 1, 1985, as provided for by the Economic Recovery Tax Act of 1981.
BASIC TABLE INFORMATION
Projections for the major types of primary returns for Fiscal Years 1982-1990 are shown in Table 1. For comparison purposes, actual receipt figures are shown for 1980 and estimated receipts are given for 1981. Following the table is a description of the methodology used to derive these projections.
Table 1.--Number of Returns Filed by Type, Fiscal Years 1980-1990
(Thousands)
Actual Estimated Projected Type of return
1980 19811 1982 1983 1984
(1) (2) (3) (4) (5)
Total primary returns ...•...•.....•. 137,381 139,544 141,678 144,572 147,631
Individual, total •....•.•.. , ...•... ,, •.... 93,144 94,513 96,404 98,842 101,264 Form 1040A .•....•••.•...•.••..•......•.• 37,691 36,837 38,146 39,078 40,521 Form 1040 .••..•.•...................•.•. 55,301 57,511 58,091 59,595 60,573 Other2 ... , .•. , .••.• , ..•... , •. , •.•. , ..•. , 152 165 167 169 171
Individual Declaration of Estimated Tax .•• 8,699 9,278 9,212 9,236 9,322 Fiduciary •....•..•......•.•••.•••...•...•. 1 ,8:n 1,951 2,038 2,128 2,222 Partnership •...•.••••..•.....••.•..•...••. 1,390 1,452 1,499 1,547 1,595 Corporation3 .•.•. , .....................•.• 2, 717 2,785 2,899 3,008 3,119 Estate ••.......•• , ..........•........... ,. 148 142 136 128 111 Gift ..•.•..•.•.••......•........•..•...•.• 216 210 214 130 122
Employment4, ...••... , •.•......•....•...•.. 26,499 26,442 26,528 26,763 27,047 Exempt Organization.5 •. , ......•.•..•..•...• 444 453 465 476 488 Employee P1an6 .• , .....•.........•...•..••. 792 819 845 872 894 Alcohol, Tobacco, and Firearms? ....•..•... 547 547 548 549 550 ExciseS •. , ••.•. , •.•.......•.....•.•... , .•• 909 953 888 893 897
Projected--Continued Type of return
1985 1986 1987 1988 1989 1990
(6)
Total primary returns .•... , ....•...• 150,460
Individual, total .•••...•.••. , •... , ..••.•• 103,499 Form 1040A .............................. 41,800 Form 1040 ............................... 61,525 Other2 ....••.....••.•••..•.•••...•.....• 174
Individual Declaration of Estimated Tax .•• 9,352 Fiduciary, •..••......••...••.........•• , .. 2,319 Partnership ..••....•.••.•.•....•.....•.•.• 1,643 Corporation3, ..•.. , ........•... , ....• , •.•. 3,233 Estate ..••••••.......•..•.•.....••••...•.. 88 Gift •..•.•.••....•.•.•....••...•.•...• ··· .• 125
Employment4., ...•.. ,, ........•.. , ..•.• ,, .. 27,328 Exempt .Organization.5 .•....•.•...........•• 500 Employee Plan6 .•.••.•..•..•....•...••.•..•• 920 Alcohol, Tobacco, and Firearms? ....•..•• ,. 550 ExciseS, ..•....•.• , .•..•....•.•.•..•.•..•. 903
lEased on receipts through June 30, 1981. 2Forms 1040NR, 1040PR, 1040SS, 1040C, and 1042. 3Includes Forms 1120, 1120F, 1120-DISC, 1120-POL,
11208, and 1120-H. 4Forms 940, 940PR, 941, 941E, 941PR, 941SS, 941M,
942, 942PR, 943, 943PR, CT-1 and CT-2.
NOTE: Detail may not add to total because of rounding.
(7) (8) (9) (10) (11)
153,163 155,944 158,436 160,724 162,953
105,284 107,121 108,640 109,941 111,117 43,115 43,738 44,028 43,898 43,768 61 '993 63,204 64,430 65,857 67,161
176 179 182 185 188
9,680 10,031 10,387 10,739 11,148 2,420 2,528 2,642 2,761 2,887 1,691 1,739 1,788 1,836 1,885 3,349 3,472 3,601 3,732 3,870
71 48 39 41 43 129 134 138 142 147
27,620 27' 911 28,206 28,503 28,794 512 524 536 548 560 948 970 986 1,001 1,017 550 551 551 551 551 909 915 922 928 934
5Forms 990, 990-PF, 990-C, 990-T, 4720, and 5227. 6Forms 5500, 5500-C, 5500-G, and 5500-K. 7Forms 7, 8, 11, 4705, 4706, 4707, 4708, and Alcohol
and Tobacco forms. 8Forms llC, 720, 720M, 730, and 2290; 11B, and 4638
(1980 only).

BASIC METHODOLOGY AND ASSUMPTIONS
The number of returns filed represents receipts of primary returns at IRS Service Centers during a fiscal year. Receipts for FY 1980 and earlier years are at the level reported in the Annual Report of the Commissioner of Internal Revenue. Data for FY 1981 include actual receipts through June with the remainder of the fiscal year estimated. The estimated part in most cases was based on receipt patterns in FY 1979. Until FY 1976, fiscal years were from July through June; beginning in FY 1977, fiscal years were from October through September.
The projections are based on regression models in val ving independent economic and demographic variables or on observed trends over time [1]. The models were updated to incorporate recent trends in return filing patterns and current economic outlook. The models are developed for calendar years because most filing requirements are on a calendar year basis.
The fiscal · year projections are derived from calendar year projections by one of three methods. The method used most frequently employs the Census Bureau's X-llQ Seasonal Adjustment Program [2] to obtain seasonal factors. The method used next most frequently is to compute a ratio based on the filing experience of one or more previous years. The third method, which is used in instances where filing trends are not well defined, is to assume a logical pattern.
To illustrate the general process, projections for the combined total of Forms 1040 and l040A for calendar years were prepared using a regression model which makes the projection a function of the forecasted values of total employment, employed married women, pension beneficiaries and annuitants, and a step function variable to adjust for the effect of the Tax Reduction and Simplification Act of 1977. The base period used was 1949-1981, with 1981 estimated based on January-June receipts.
Calendar year projections for Forms 1040 and 1040A were separately estimated (before forcing to the combined total) using regression models with employment, time, and a step function variable to adjust for the special emphasis by IRS to convert eligible filers to using Form l040A. The resulting projections were then adjusted for the effects of the
3
Economic Recovery Tax Act of 1981 and the increased filing limit for Form 1040A. Other individual return forms in this group were each projected using similar types of models. After the calendar year projections were completed, they were converted to fiscal year projections by using X-llQ seasonal factors for Forms 1040 and 1040A and the filing experience in 1980 for the remaining forms.
Economic Assumptions
Since many projections are. based on regression models involving economic variables, economic assumptions about the future greatly affect the projections.
It is assumed that tax cuts enacted by the Economic Recovery Tax Act of 1981 will bolster personal incomes and business cash flows by sufficient amounts to forestall as sharp declines in spending as might otherwise be expected from severely tight money and high interest rates. At the same time, the monetary constraints are assumed to restrain the economy from strong growth in real economic activity during the year ahead.
For the years beyond 1982, the Census Bureau anticipates that sharp decreases will occur in the growth rate of total population and the working-aQe population. Real output growth will be maintained 1n the face of a slowdown in this basic determinant of labor supply by further increases in the labor force participation rate and by productivity growth.
References
[1] Internal Revenue Service, 11 Number of Returns to be Filed: Statistical Methodology, 11 Calendar Year Projections series, Document 6186-B.
[2] U.S. Bureau of the Census, "The X-ll Variant of the Census Method II Seasonal Adjustment Program, 11
Technical Paper No. 15 (1967 revision).
Preliminary Income and Tax Statistics From 1980 Individual Income Tax Returns
By Noreen Hoffmeier•
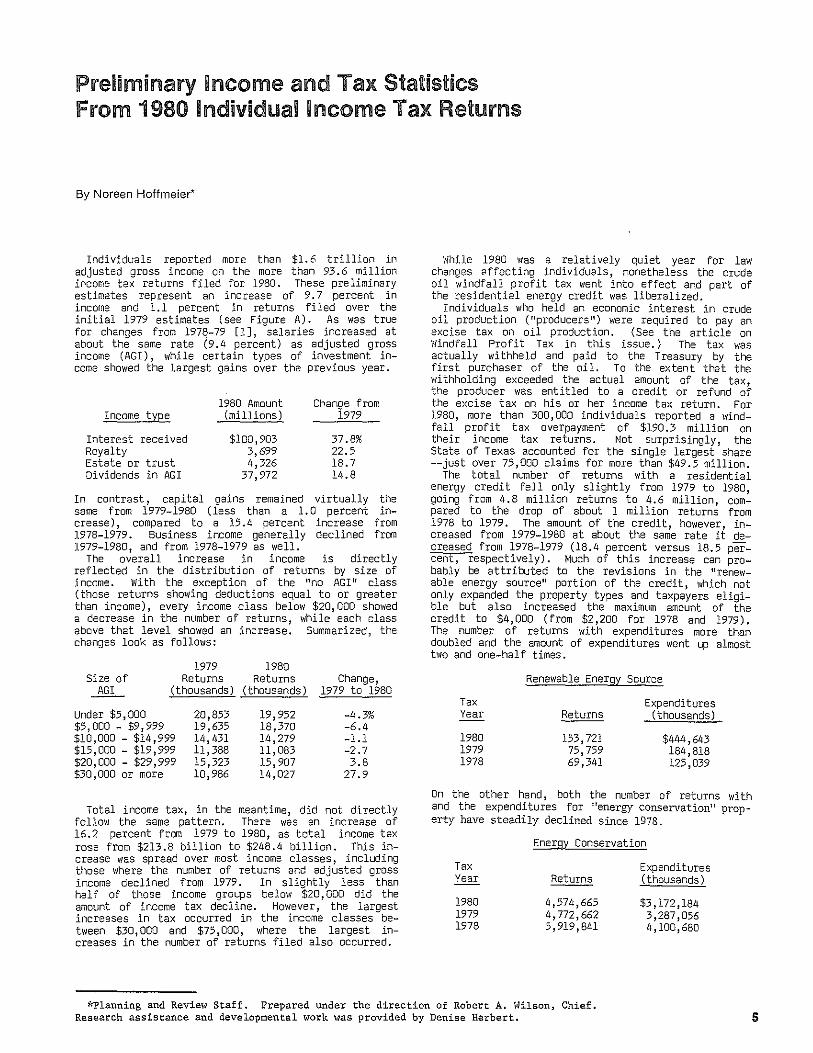
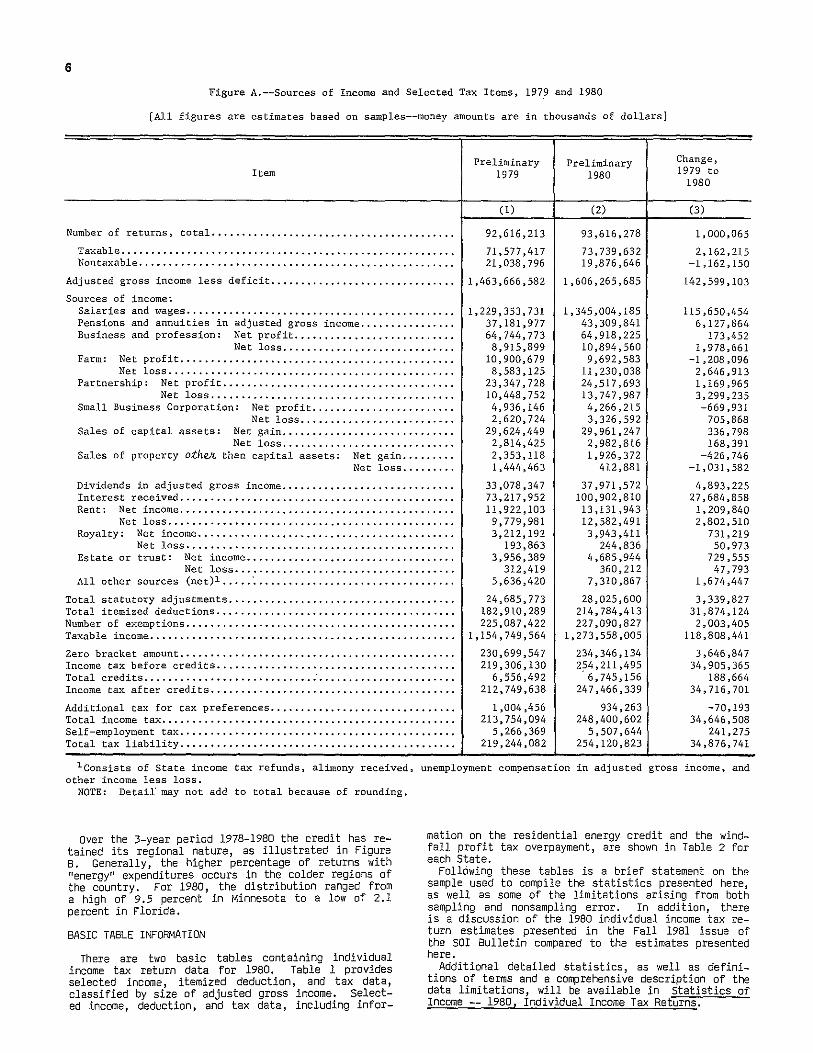
Individuals reported more than $1.6 trillion in adjusted gross income on the more than 93.6 million iflcome tax returns filed for 1980. These preliminary estimates represent an increase of 9. 7 percent in income and 1.1 percent in returns filed over the initial 1979 estimates (see Figure A). As was true for changes fror.~ l97E}-79 [l], salaries increased at about the same rate (9.4 percent) as adjusted gross income (AGI), while certain types of investment income showed the largest gains over the previous year.
Income type
Interest received Royalty Estate or trust Dividends in AGI
1980 Amount (millions)
$100,903 3,699 4,326
37,972
C\"'lanoe from 1979
37.8% 22.5 18.7 14.8
In contrast, capital gains remained virtually the same from 1979-1980 (less than a 1.0 percent increase), compared to a 15.4 percent increase from 1978-1979. Business income generally declined from 1979-1980, and from 1978-1979 as well.
The overall increase in income is directly reflected in the distribution of returns by size of income. With the exception of the 11 no AGin class (those returns showing deductions equal to or greater than income), every income class below $20,000 showed a decrease in the number of returns, while each class above that level showed an increase. Summarized, the changes look as follows:
1979 1980 Size of Returns Returns Change, .J!QL (thousands) (thousands) 1979 to 1980
Under $5,000 20,853 19,952 -4.3% $5,000- $9,999 19,635 18,370 -6.4 $10,000 - $14,999 14,431 14,279 -1.1 $15,000 - $19,999 11,388 11,083 -2.7 $20,000 - $29,999 15,323 15,907 3.8 $30,000 or more 10,986 14,027 27.9
Total income tax, in the meantime, did not directly follow the same pattern. There was an increase of 16.2 percent from 1979 to 1980, as total income tax rose from $213.8 billion to $248.4 billion. This increase was spread over most income classes, including those where the number of returns ar:d adjusted gross income declined from 1979. In slightly less than half of those income groups below $20, 000 did the amount of income tax decline. However, the largest increases in tax occurred in the income classes between $30,000 and $75,000, where the largest increases in the number of returns filed also occurred.
~lhile 1980 was a relatively quiet year for law changes 8ffecting individuals, nonetheless the crude oil windfall profit tax went into effect and part of the residential energy credit was liberalized.
Individuals who held an economic interest in crude oil production ( 11 producers 11
) were required to pay an excise tax on oil production. (See the article on Windfall Profit Tax in this issue.) The tax was actually withheld and paid to the Treasury by the first purchaser of the oil. To the extent that the withholding exceeded the actual amount of the tax, the producer was entitled to a credit or refund of the excise tax an his or her income tax return. For 1980, more than 300,000 individuals reported a windfall profit tax overpayment of $190.3 million on their income tax returns. Not surprisingly, the State of Texas accounted for the single largest share --just over 75,000 claims for more than $49.5 million.
The total number of returns with a residential energy credit feJl only slightly from 1979 to 1980, going from 4.8 million returns to 4.6 million, compared to the drop of about 1 million returns from 1978 to 1979. The amount of the credit, however, increased from 1979-1980 at about the same rate it decreased from 1978-1979 (18.4 percent versus 18.5 percent, respectively). ~1uch of this increase can probably be attributed to the revisions in the "renewable energy source" portion of the credit, which not only expanded the property types and taxpayers eligible but also increased the maximum amount of the credit to $4,000 (from $2,200 for 1978 and 1979). The number of returns with expenditures more than doubled and the amount of expenditures went up almost two and one-half times.
Renewable Energy Source
Tax Expenditures Year Returns (thousands)
1980 153,721 $444,643 1979 75,759 184,818 1978 69,341 125,039
On the other hand, both the number of returns with and the expenditures for "energy consenration" property have steadily declined since 1978.
Energy Conservation
Tax Expenditures Year Returns (thousands)
1980 4,574,665 $3,172,184 1979 4,772,662 3,287,056 1978 5,919,841 4,100,680
*Planning and Review Staff. Prepared under the direction of Robert A. Wilson, Chief. Research assistance and developmental work was provided by Denise Herbert. 5
6
Figure A.--Sources of Income and Selected Tax Items, 1979 and 1980
(All figures are estimates based on samples--money amounts are in thousands of dollars]
Item
Number of returns, total .••.•..... , .......•..••...•... , •...•.....
Taxable •............ , •...••. , .. , .....•..... , ..•.•.. , ... , ......• Nontaxable ...•....•.......•....•... , ............ , ... , .....•....
Adjusted gross income less deficit •.•.•.•.....••••...•.•.••......
Sources of income: Salaries and wages ..•.•...••....•. , ..•...•. , ... , .. , ........ , .. . Pensions and annuities in adjusted gross income ...••....•••.... Business and profession: Net profit .•.•.•......••.•..•........
Net loss ....•... , •....•.....•..•. · .. . Farm: Net profit .•...••..... ,., ....•... ,., ...•. , ......... , ... .
Net loss .•..••.....•..........•.•...•.•...........•..... Partnership: Net profit .••.•..... , ..........•......•...... , ...
Net loss .•.•...•....•...•..•...•.•...........••.. Small Business Corporation: Net profit .•......................
Net loss ............•....•........ Sales of capital assets: Net gain .. , .. , ... , ....•........ , ....•
Net loss, .. , ..••...•. ,., ............ . Sales of property oth~ than capital assets: Net gain ...•.....
Net loss .•. , ..•..
Dividends in adjusted gross income .....•.••...•••..•.......•.. , Interest received .... , .... , .. , ...•..........•..• , .......... , •.. Rent: Net income, •..••.. , •. , .. , .. , ........... , ......... ,, •....
Net loss ..•......•.••.......•...........•.•..••......•.. Royalty: Net income .....•... ,,, .. , ...•............•..•.....•..
Net loss ....•..•.......•.•.•......... , ...•.•..•.•.... Estate or trust: Net income., ..•.........•........•..•..•..•..
Net loss •..........••....•..... , .•.••...••.•. All other sources (net)l ..••. · .......•....•....•. , .••. ,., ...... .
Total statutory adjustments ............•... ,, .......• , .......•... Total itemized deductions ...•... , •..........•.. , .•.•........ , .•.• Number of exemptions ....•........•. , .. ,, .....•.•. , .... , ........• , Taxable income •..............•...... , .•..•.....•....•........•...
Zero bracket amount .•••..........•.•.•...•.• , ... , ...........•.... Income tax before credits •........ , .......... , •..... , .•..•.•. , ..• Total credits •........•..••. , .•..•.....•• ; •....•... , .•..•... , ... , Income tax after credits ...•..• , ... , .....................•••...•.
Additional tax for tax preferences •.••..•..•.•....•.....•..•..... Total income tax •..•.••..••..••.. , ...•...•...... , •.•........ , .... Self-employment tax ......•...•...... , •...... , .. , .•..... , ...•.... , Total tax liability .•...•.••..••..... , ...•. , ..••....•. , .•.•......
Preliminary 1979
(I)
92,616,213
71,577,417 21,038,796
1,463,666,582
1,229,353,731 37,181,977 64,744,773
8,915,899 10,900,679 8,583,125
23,347,728 10,448,752 4,936,146 2,620,724
29,624,449 2,814,425 2,353,118 1,444,463
33,078,347 73,217,952 11,922' 103
9, 779,981 3,212,192
193,863 3,956,389
312,419 5,636,420
24,685,773 182,910,289 225,087,422
1,154,749,564
230,699,547 219,306,130
6,556,492 212,749,638
1,004,456 213,754,094
5,266,369 219,244,082
Preliminary 1980
(2)
93,616,278
73,739,632 19,876,646
1,606,265,685
1,345,004,185 43,309,841 64,918,225 10,894,560 9,692,583
11,230,038 24,517,693 13,747,987 4,266,215 3,326,592
29,961,247 2,982,816 1,926,372
412,881
37,971,572 100,902,810 13,131,943 12,582,491 3,943 ,4ll
244,836 4,685,944
360,212 7,310,867
28,025,600 214,784,413 227,090,827
1,273,558,005
234,346,!34 2?4. 211,495
6,745,156 247,466,339
934,263 248,400,602
5,507,644 254,120,823
Change, 1979 to
1980
(3)
1,000,065
2,162,215 -1,162,150
142,599,103
115,650,454 6,127,864
173,452 1,978,661
-1,208,096 2,646,913 1,169,965 3,299,235 -669,931
705,868 336,798 168,391
-426.746 -1,031,582
4,893,225 27,684,858
1,209,840 2,802,510
731,219 50,973
729,555 47,793
1,674,447
3,339,827 31,874,124
2,003,405 118,808,441
3,646,847 34,905,365
188,664 34,716,701
-70,193 34,646,508
241,275 34,876,741
1 Consists of State income tax refunds, alimony received, unemployment compensation in adjusted gross income, and other income less loss.
NOTE: Detait may not add to total because of rounding.
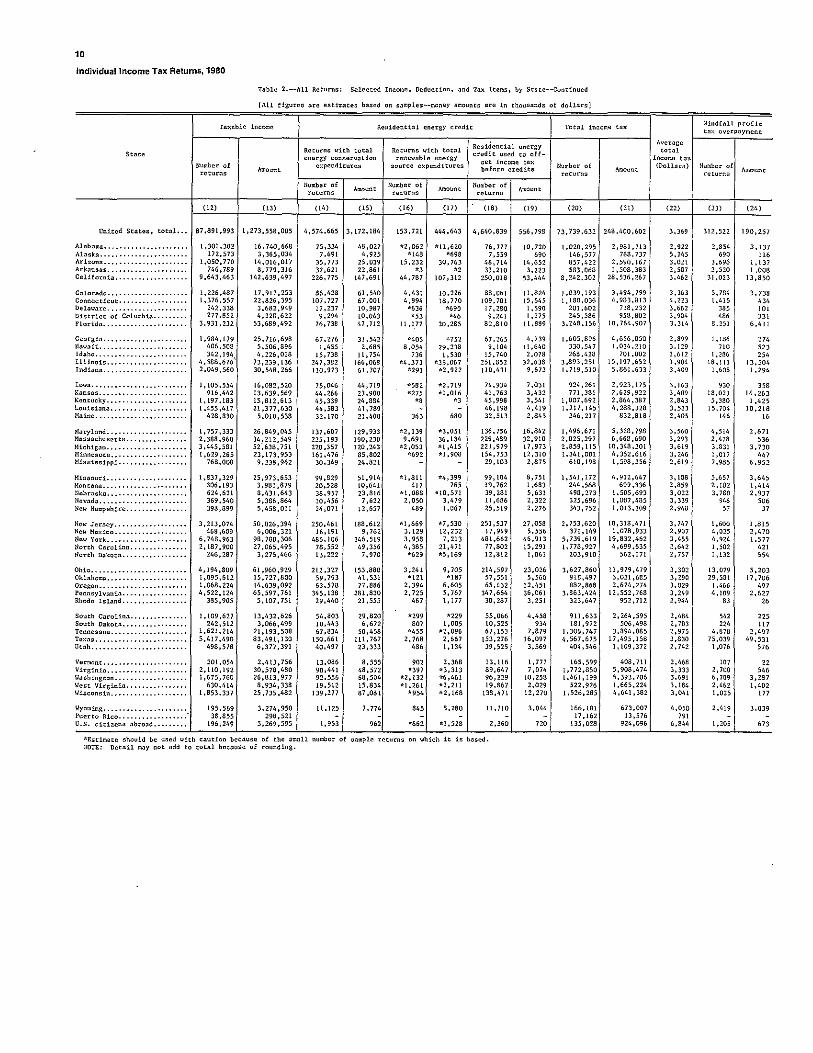
over the 3-year period 1978-1980 the credit has retained its regional nature, as illustrated in Figure 8. Generally, the higher percentage of returns with 11 energyrr expenditures occurs in the colder regions of the country. Far 1980, the distribution ranged from a high of 9. 5 percent in Minnesota to a low of 2.1 percent in Florida.
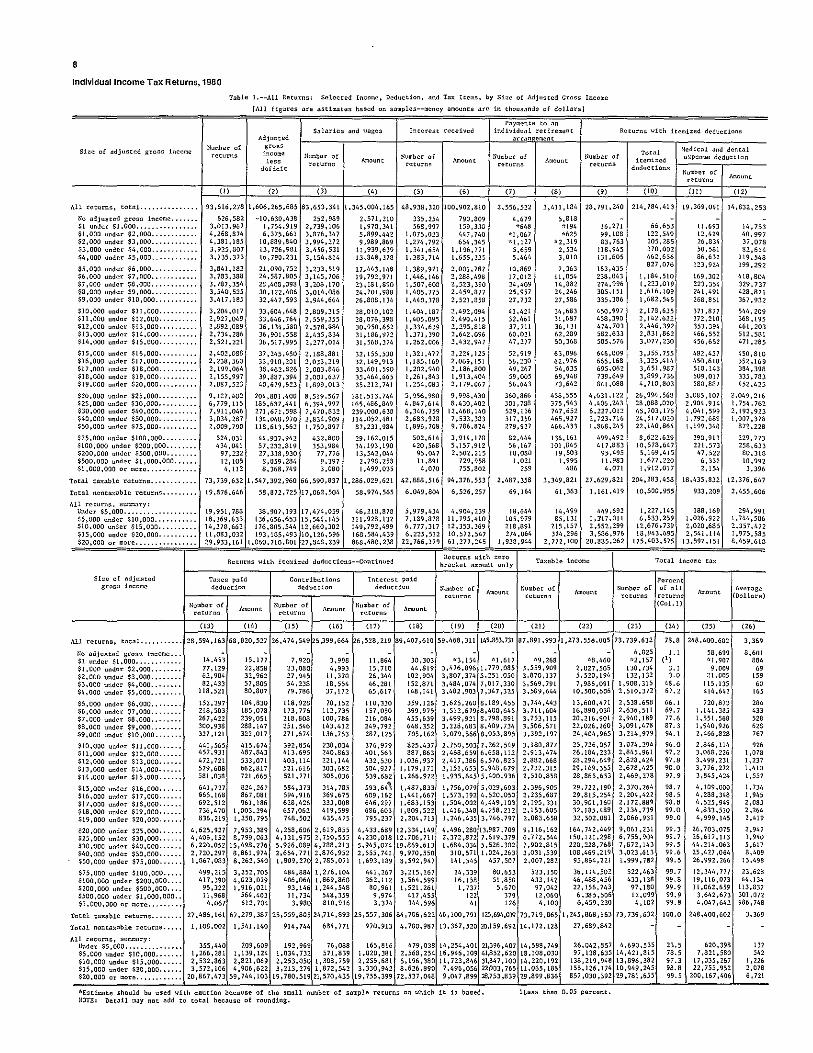
BASIC TABLE INFORMATION
There are twa basic tables containing individual income tax return data for 1980. Table 1 provides selected income, itemized deduction, and tax data, classified by size of adjusted gross income. Selected income, deduction, and tax data, including in for-
mation an the residential energy credit and the windfall profit tax overpayment, are shown in Table 2 for each State.
FollOwing these tables is a brief statement on the sample used to compile the statistics presented here, as well as some of the limitations arising from bath sampling and nonsampling error. In addi tian, there is a discussion of the 1980 individual income tax return estimates presented in the Fall 1981 issue of the SOI Bulletin compared to the estimates presented here.
Additional detailed statistics, as well as definitions of terms and a comprehensive description of the data limitations, will be available in Statistics of Income -- 1980, Individual Income Tax Returns.

Figure B Returns with Residential Energy Expenditures as a Percent of All Returns, by State, 1980
COMPARISON OF 1980 ESTIMATES
The data for individual income tax returns presented in this issue are based on a probability sample. Data published in the Fall issue of the Bulletin were based on mid-year actual filings of returns, adjusted and projected to a year-end total. The results from the "early" estimates are generally quite close to the "preliminary" estimates, as shown below:
D ~ L:.:..;.j
E2J -Under3%
3%-5%
5°/q -7%
7% or more
Because the estimates published here are based on about 93 percent of the complete sample to be used to estimate Tax Year 1980, some revisions will be made to the estimates when the final sample is tabulated. [2] In most cases it is expected that estimates from the complete sample will lie between the preliminary sample estimates shown here and those published earlier in the Fall issue.
[Numbers are in thousands--money amounts are in millions of dollars)
Early as Early Preliminary Percent of
7
Estimate Estimate Preliminary
Number of returns •.••••••••••••••..•••••.•.•.••••.••••••.••••.•..•.• Adjusted gross income ••••••••.••••••••••.••..••••••••••.•.•...••••••
Salaries and wages: Number ••••.•..••••••••••.••••.••••••.•••••••••••••.••••••••.•••••. Amount •• , •.•.•.•••••• , •.••.•••••.••• , ••.•• ,, ••••.•••.• ,.,.,,,,., •.
Dividends in adjusted gross income: Number .••• ,.,.,.,.,., .•.•••••••••••••••••••••.••••••.•..• • •••..•.• Amount •..••••• , •••••••..•••••••••••••••.••••••••... • ..... • ••••.•••
Interest received: Number ••.••.••• , •••• , •.•.••••••••••••••••••••.•.••..••... • •. • ..... .o\mount •••••.•••••• ,., •••..•..••••••••••••••••••••••••••••••.•.•...
Total tax liability: Number •••••••••••••••.•..••••••••••••••••••••••••••••...••••••.••• Amount •••.•.• , •••• , •• , •• , •••••• , ••••..••.••..•••••••••••••••••••••
94,454 $1,618,070
84,249 $1,349,532
10,715 $38,497
49,412 $107,792
77,399 $255,203
93,616 100.9% $1,606,266 100.7
83,653 100.7 $1,345,004 100.3
10,647 100.6 $37,972 101.4
48,938 101.0 $100,903 106.8
75,127 103.0 $254,121 100.4
8
Individual Income Tax Returns, 1980
Table I.--All Returns: Selected Income, Deduction, and Tax Items, by She of Adjusted Gras~ Income
[All figures are estimates based on samples--money amounts arc in thousands of dolhrs)
Si~e of adjusted ~ross inCO<Oe
All returns, totaL ......... .
No adjusted gross income ••••••• $1 under $1,000 •••. Sl,OOO under $2,000 ..•••••••••. ~2,000 under $3,000 •.• ,, ••••••· $3,000 under $4,000 .•••• $4,000 llnder $5,000 ...
~5,000 under $6,000 •••• $6,000 under $7,000 ••. $7,000 under $8,000. $8,000 under $9,000 ..• $9,000 under $10,000 .••••••••••
$10,000 unde• $11,000 ••••.•. $ll,OOO under H2,000 ••••• H2,000 under $!3,000 ••••.• $13,000 und"r $14,000 ••• $14,000 und"r $15,000.
$15,000 under $16,000 •••.• $16,000 under $17,000 •••••••••• $17,000 uncle• $18,000 ......... . $18,000 undc> $19,000 •• ,,,,,,. $19,000 under $20,000 ........ ..
$20,000 und<>r $25,000 ••• $25,000 under $30,000 •••••• $30,000 unde• $40,000 ••••.• $40,000 under $50,000 ••••••••. $50,000 under $75,000 .........
$75,000 unde> $100,000 •••. $100,000 under $20(1,000 •• $200,000 und"" $500,000 ••• $500,000 under $1,000,000 ••• $1,000,000 or mo>c ••••••
Totnl tnxnble r<>turns •••••.••••••
Total nontnxablc ><>turns •••••••••
All r<>tnrns, sum:'lary: Under $5,000 •••••. $5,000 under $10,000 •.••••••••• $10,000 under $15,000 •••.
under $20,000 ••• , . , • , •• more •••••••••••••••.
Size of ndjur.tcd gro~s income
All retu>nn,
Nn ~dju~ted grog,; incorn<> •. $1 under $1.000 ...... H ,00(1 under $2,000 •••• $2,000 under $3,000 .••••••• $3,00() ur.de> $4,000 •••••••• $4,000 unde> $5,000 ••••••••
$5,000 under $6,000 ••• $6,000 under $7,000 ••. $7,000 under $8,000 •• $8,000 under $9,000 ••.••• $9,000 under $10,000 ..•••.
$10,000 under $11,000 ••. $11,000 uncle• $12,000 ..... $12,000 under $13,000 ••••• $13,000 under $14,000 ••••• $14,000 ur.der $15,000.
$15,000 und<>r $16,000 •• $16,000 under $17,000 ..... $!7,000 under $!8,000 ••. $18,000 under $19,000 •• $19,000 unde• no,ooo.
Salaries and uages
Number of returns
Adjuned gross
income less
ddicit
Number of returns
93 ,616,278J' ·'"'· '"'·"" 626,582
3,013,967 4,268,874 4,381,185 3,925,807 3, 735,373
-10,630.438 1,754,919 6,375,661
10,889.340 13,726,981 1b,790,23l
21,090,752 3,233,519 24,587,805 3,145,706 28 ,403 ,098 3 '206 '170 30,122,406 3,014,086 32,447,593 2,944,664
33,604,648 2,809,315 33,646,764 2,559,255 36,134,580 2,578,884 36,90!,558 2,435,834 36,517,995 2,277,0!4
37,245,450 2,188,881 36,910,201 2,033,219 38,462,826 2,003,846 39,887,394 2,001,637 40,679,623 1,899,013
44,937,942 57,232,819 27,338,930 8,059.284 8,368,749
8,5!9,567 6,394,997 7,470,832 2,834 '909 I, 750,897
432,800 353,984
77,776 9,397 3,080
Amount
17,443,148 19,792,971 23,181, 24,701' 26,803' 134
28,010,102 28,076,398
3t,1B6,n2 31,568,374
32,155,530 32,149,913 33,601, 35,464,665 35.212,741
!81,513,744 16$,486,849 239,000,638 114,052,481 87,231,984
Interest received
!lumber of return"
335,254 568.997
1,075,023 1,27<\,792 I ,341,654 1,383,714
llmount
790,809 159,338 447,740 654,345
1,196,771 1,655,23~
lr£gei=te should b~ used with cnution because of the s=ll number of sample retu>ns on which it is based. IIOTE: Detail rnay not add to totnl because of rounding.
lluTJber of returns
2,556,522
4,679 *648
*1 ,067 "1, 127
5,659 5,464
41,421 32,!o61 37, ill 60,021 47,277
52,919 56,230 49,267 59,005 56,643
360,366 301,788 529,136 317,256 279,927
5,818 *194 *625
*2,319 2,534 3,010
7,363 I t,OS~ 14,$82 24,246 27' 5$6
34,683 31,687 36,131 62,239 50,368
Number of <eturns
Total Medical and dental
d!~~~~:~~s t--"-"c'"-"-"-"-'-"'r"-"-"-"-"-Number of
returns ;\~.ount
"·'"'·''"114,832,253
14,753 40.997 37,078 82,614
119,548 199,292
4!$,804 329,737 428,821 367,932
544' 209 368,!95 461,203 512,5!>1 471,285
450,810 352,169 384,398 335.783 452.425
2,049,216 1,754,762 2,192,923 1,007.378
372,228
229,773 258,633 80,318 10,992 3,396
294,991 1,744,586 2,357,472 1,975,585 8,459,618
8,601
"" " '" 60 <65
284 m 528
"' "'
132 542
I ,226 2,078 6,721

9
Individual Income Tax Returns, 1980
Table 2.--All !tcturns: Selected lncome, Deduction, and Tax Itnms, by State
[All figures are estimates based on snmpha--.,onay moounU are in thou5nnds of dollars]
Adjusted Average Salaries and wngcs lnterest received
Total itemized Returns with ~cto
l!umbar of gross adjusted deductions bracket amount only
St<>tn return~
incom<': gross Zaro less incoo>n Nu:obcr of
Amount Huttbcr of
Amount Number of
klount Number of
brackat deficit (Dollars) returns raturns raturns returns
amount
'" (2) (3) ,,, ,,, (6) (7) (8) (9) {10) (II)
United States, total. ..•...... 93,616,278 1,606,265,685 17,158 83,653,341 1,345,004,185 48,938,320 100,902,810 28,791,240 214,784,413 59,468,311 145,853,731
Alabama •••••••••••••• , •••••••••••••• 1,394,881 21,424,985 15,360 1,273,820 18,695,594 578,051 1,102,120 427,820 2,759,746 879,983 2,188,361 Alaska •••• , ••••••••••• ,, •••• ,.,,,, .. \83,002 4,086,376 22,330 172,653 3,741,130 89,007 113,291 61,800 536,463 111,732 265,422 Ari:<ona •••• ,, .................. , .... 1,107,71.5 18,236,489 16,463 969,319 14,810,619 575,396 1,404,011 416,044 2,996,773 639,690 1,537,168 Arkansas •••••••••.•• ,,, ....... • • ·, •• 808.748 11,212,471 13,864 711,989 9,406,925 3)3,312 787,156 183,082 1.175,869 565,588 1,421,630 California,, ........... , ••••••••• ,,, 10,314,329 188,802,596 18,305 9,144,035 157,025,466 5,348,423 13,469,874 3,96!,981 36,496,618 5,805,420 13,799,961
Colorado •••• ,., ......... ,., ••••••••• 1,291,567 22,731,853 17,600 1,184,588 19,427,261 686,842 1,086,155 512,245 3,875,399 722,399 1,677,603 Connecticut •••• ,, •••••••••• , •••••••• 1,442,089 27,948,944 19,381 I ,261,813 23,122,068 922,684 1,892,262 444,400 3,372,239 939,314 2,277,664 D!!laware. , ......... •.,,, ...... • • • ••• 252,714 4,597,449 18,192 226,783 3,823,145 130,533 221,971 80,672 591,024 161' 760 385,566 Oi§ttict of Colu01bia.,, ............. 306,412 5,550,310 18,114 273,079 4,325,852 114,253 237,562 102,485 899,510 175,819 401,619 Florida, ••••• , .... , .. , •••••• , ....... 4,173,1!6 67,012,795 16,058 3,468,835 49,214,094 2,021,876 6,422,897 1,019,169 7.371,182 2,922,207 7,260,463
Georgia ............ , ........... , •••• 2,125,095 33,028,680 15,542 1,979,254 29,003,203 815,631 1,624,597 607,894 4,400,056 1.383,008 3,403,698 Hawaii ••• , ••••••• ,, •••••• , •••.• ,,, •• 422,727 7,280,769 17,223 382,054 6,026,064 281,266 457,461 157,647 1,342,903 250,137 567,309 Idaho •• ,.,., ........................ 357,712 5,452,327 15,242 305,722 4,401,590 199,427 449,171 ll1, 759 782,573 233,336 588,497 lllinoh •••• , •••••••.••••••••.••. , , , 4,831,157 90,049,822 18,639 4,335,611 76,091,053 2, 789,842 5,761,969 1,565,856 10,916,497 3,034,896 7,258,135 Indiana,,, •••••••••••••••••••••••••• 2,200,373 37,195,255 16,904 2,001,815 32,202,938 1,137,180 1,798,200 567,953 3,570,223 1,488,181 3, 770,567
Iova ................ , ............... 1,189,252 19,845,651 16,688 981,350 14,840,285 772,605 1, 746,176 358,626 2,316,607 751,261 1,937,588 \<llnSa§,,,,,,.,., .. ,,,,,,,,,,,,.,,,,, 989,784 16,866,491 17,041 871,426 13,522,975 541,152 1,133,136 269,886 1,925,120 652,155 1,639,841 Kentucky ..... , .......... ,,,,, ....... 1,303,258 19,900,365 15,270 1,153,574 16,975,304 582,519 948,108 348,968 2,268,925 848,755 2,201,854 Louisi11na •••.• , ....... , • , •. , ..... , •• 1,566,477 26,276,065 16,774 1,427,395 22,283,704 615,802 1,263,336 374,924 2,532,558 1,084,264 2,736,310 M11ine ............................... 459,229 6,339,836. 13,805 408,231 5,240,461 232,508 408,045 95,291 605,081 335,258 842,745
Macyl11nd.,,, •• ,., ••••••• , ... , , , •••• , 1,868,204 34,304,751 18,362 1,695,395 28,864,350 982,652 1,927,085 -704,960 5,512,779 1 ,053. 796 2,482,079 MaGsachusetu •• ,., ••••••• , ....... ,., 2,528,608 42,919,741 16,974 2,295,948 36,052,010 1,622,672 2,548,063 849,661 6,001,736 1,544,830 3,585,523 Michignn ..... , ••• , ........ ,, ... ,, ... 3,654,866 66,514,526 18,199 3,309,542 57,272,200 2,054,264 3,648,552 1,399,984 9, 736,992 2,054,235 4,894,277 Minn .. sOtll ................... • • .. · ... 1,732,985 29,596,278 17,078 1,488,147 24,546,851 1,073,138 1,816,267 623,082 4,581,167 1,010,724 2,398,836 MisGiS§ippi. ........................ 858,999 11,950,645 13,912 793,010 10,214,158 271,424 536,232 196,050 1,316,846 574,305 1,414,980
Mbsouri •••••••.•• , •••• ,•,, •.•••••••• 1,976,250 32,234,532 16,311 1,713,253 26,484,211 1,152,615 2,424,765 543,359 3,604,400 1,300,208 3,295,987 Montttna ................... , .•••••••• 330,270 4,998,013 15,133 274,475 3,815,744 199,747 453,660 99,094 M9,762 209,120 505,041 Nebr11llk11.,,., •••.. , ••••••.•••••••••• 660,957 10,484,352 15,862 560,518 8,220,497 407,149 785,095 175,596 1,25\,328 450,502 1,121,384 Nevad;l •• ,,, , • , • , , , , , , , ••••••. ,, , • , • , 391,833 6,736,263 17,192 361,132 5,819,561 157,337 396,276 119,473 940,494 251,389 623,932 Ucv H=pshirc., ..... ,, ••••• , • .. " .. 411,057 6,711J,546 16,325 373,766 5,657,152 242,931J 391,230 96,388 632,633 303,000 772,335
New Jersey., •• ,, .................... 3,345,224 62,628,591 18,722 3,044,639 53,612,834 1,901,482 3,510,187 1,065, t29 8, 152,829 2. 160,097 5,197,345 New M<>>:ico ......... • .......... • • • ••• 515,631 7,703,0Zl 14,939 459,664 6,531,651 216,999 426,452 129,872 923,053 339,793 844,381 Ne" York., •••• ,, .......... ,,,,, •••. , 7,123,635 126,464,239 18,034 6,368,806 105,964,766 4,219,311 9,251,691 2,650,732 21,530,833 4,119,186 9,715,687 North Carolina •••••• , ............... 2,334,560 34,360,387 14,718 2,155,608 29,608,418 959,797 1,591,900 601,282 3,925,409 1,586,736 3,957,846 l/orth Dakot;> ........................ 270,171 3,976,459 14,718 218,055 2,954,815 174,909 406,062 59,302 393,110 188,273 479,925
Ohio., ................... , .......... 4,471,755 76,189,456 17,038 4,009,388 65,564,855 2,494,025 4,581,052 1,219,802 7,800,031 2,985,567 7,461,987 Oklaho01a •••••• ,,, .... ,,., •• ,,, ...... 1,175,297 19,573,844 16,654 1,034,690 16,087,992 489,652 1,150,796 336,569 2,494,251 767,090 1,989,935 Oregon,.,,., ••.• ,. •••. ,, ••••. , ...... 1,126,868 18,588,316 16,496 982,890 15,027,341 624,169 1,342,165 396,432 2,858,676 671,272 1,586,961 Pennsylvania ••. , •••••. , ............. 4,828,065 80,815,702 16,739 4,300,443 68,390,731 2,757,006 4,813,584 1,296,881 8,631,692 3,238,113 8,104,809 Rhode hlllnd ........................ 405,621 6,363,916 15,689 371,053 5,316, 761 219,876 402,484 106,157 709,251 279,896 666,610
South Qlrolina ...................... 1,181,230 17,316,843 14,660 1,110,015 15,497,078 443,422 625,860 350,186 2,261,806 762,894 1,897,5to South D<~kotn •••••• " ................ 277,512 3,731,939 13,448 220,104 2,676,598 161,907 418,619 48.774 311,585 194,127 502,691 Tennessee ......... ,, ................ 1,760,645 26,644,880 15,134 1,608,567 23,061,940 724,874 1,441,538 355,523 2,403,909 1.267,098 3,251,808 Tc>:as ......................... , ••••• 5,799,972 102,441,619 17,662 5,305,942 86,795,300 2.291,191 5,662,440 \,283,818 9,975,089 4.151,178 10,585,403 Utah ................................ 536,374 8,719,255 16,256 492,391 7,483,939 270,781 388,204 224,520 1,722,147 280,188 651J,II2
Vermont ............................. 209,074 3,028,237 14,484 186,812 2,453,640 122,268 183,648 45,237 300,848 156,234 393,018 Virginia,, •.• ,,,, ••• ,.,,,, •••••• , •• , 2,222,860 38,687,686 17,40~ 2,029,236 33, 152,751 1,088,698 1,876,903 706,61!1 5,417,612 1,415,270 3 .~45, 580 Washington •••••••• •., ••••••••• • • • • • • 1,784,175 32,638,369 18,293 1,564,512 26,761,554 I ,015,562 2,309,763 545,204 3,751,591 1,136,729 2,825,635 West Virginia •••••••• ,, ............. 673,535 10,882,892 16,158 614,320 9,460,281 333,884 540,968 113,333 720,245 519,063 1,372,952 Wi~con~in •••••••••••• ,., ...... • • • .. • 1,969,7]3 32,743,362 16,623 1,768,013 27,646,445 1,232,068 2,019,231 668,648 4,584,233 1,186,999 2,822,087
Wyo01ing •• ,., ....................... , 209,474 3,941,753 18,817 190,091 3,268,433 115,075 240,531 57,273 403,224 138,636 356,564 Puerto Rica, .............. , ••••••••• 41,677 471,499 11,313 34,100 404,800 5,301 5,590 1,353 15,008 37,502 101,681 u.s. cithens abra11d,, •••••••••••••• 219,484 6,064,144 27,629 185,470 6,154,799 143,826 457,818 50,423 534,476 149,098 384,822
Footnote at end of t11ble.
10
lndlviduallncome Tax Returns, 1980
Table 2.--All Rceurn~: Selected lnco:no., Deduction, and tn>< Itcmn, by Stllte--Continucd
(All figures are esti~:~ates based on samples--money ""ounts are in thousands of dollars)
Taxable income Reuidentlnl energy cudit Total income tm< Windfall p<ofit tn>: overpayment
Residential c.nergy Avera~;c
State Returns with total Returns with total credit used to off-
total energy conservation rnnewable energy
set illCOOIC '"" inco:ne tar.
!lu::tbcr of expenditurcs source expenditures Number of (Dollars) llumber of returns Amount before credits
r"turns Amount
returns Amount
!lumber of Amount
Number of Amount Number of Amount returns returns r<:turns
(12) (!3) (14) {15) (16) (17) (18} (19) (20) (21) (22) (23) (24}
United States, total. .• 87,891,993 1, 273,558,005 4,574.665 3,172,184 153,721 444,643 4,M0,839 556' 793 73,739,632 243,400,602 3,369 312,522 190,257
A1abar.~a •• , •••••.•.•.••••••••• 1,301,302 !6,740,668 75,334 48,027 *2,062 *!1,620 76,777 !0,720 !,020,295 2,98!,7!3 2,922 2,854 3, !37 Alt!ska ••••••••• • .••• ., • • • • • • • 172,573 3,365,034 7,691 4,925 "148 *698 7,559 '" !46,577 768,737 5,245 '" "' Arhona •.••••••••.•••••••••.• !,050,770 !4,016,017 35,773 25,039 15,232 30,763 48,714 14,652 857,422 2,590,167 3,021 3,696 1,!37 Arkangas .••••••••••••••••••• , 746,789 a, 779,316 32,621 22,861 ., ., 33,210 3,223 583,068 1,508,383 2,587 2,520 1 .oos California •••••.•. 9,643,463 142,639,497 226,775 147,691 44,787 107,312 250,018 53,444 8,242,302 28,536,267 3,462 31,023 13,350
Colorado .••••••••.••. 1,226.487 17,917,253 86,428 61,540 4,431 10,226 88,061 11,824 ),039,193 3,494,799 3,363 5,784 3,738 Connncticut •••••.••.•.••••••• 1,376,557 22,826,395 107.727 67,001 4,991i 18,770 109,701 15,51i5 1' 180,036 4,983,813 4,223 1,415 "' Dela1.1are .••••••••..•••••••••• 242,338 3,682,949 17,237 10,987 *636 *690 !7' 280 1,590 201,602 ns, 232 3,662 "' '" Distt'ict of Columbia .•••••••• 277,852 4,328,622 9,29/i !0,043 '" "' 9,241 1,275 245,586 958,802 3,904 486 m Florida ••••• 3,931,232 53,689,492 76,738 47,712 ll ,172 20,285 82,810 !1,889 3,248,156 10,764,907 3,314 8,251 6,411
Geoq~ia •.•••••.••• , ...... 1,984,179 25,716,698 67,276 31,542 *405 "752 67,265 4, 739 ),605,896 4,656,050 2,899 I ,186 "' Jla"aiL .................... 406,508 5,506,896 I ,455 2,685 8,054 29,238 9,104 !1,MO 330,547 1,034,210 3,129 '" 523 Idaho. ............. 31i2,194 li,226,0!8 15,738 II' 754 "' I ,530 15,740 2,078 268,428 701,002 2,612 1,286 254 Illinois ••••.•••••••• •• 4,588,676' 73,239,136 247,382 166,068 *4,373 *35,067 251,852 32,638 ),893,251 15,197,652 3.904 18, Ill 13,504 Indiana •• ............ 2,049,560 30,548,266 110,973 61,707 *291 *2,922 Jl0,4JI 9,673 1.719,510 5,861 ,6)3 3,409 1,608 1 ,294
lo1.1a •••••••••.••••••••.•••••• 1,105,554 16,082,520 75,046 4/i, 7!9 *582 *2,719 74,934 7,031 924,261 2,923,175 3,163 '" "' Konsa~ •••••••.••••••••.•••••• 916,1i42 13,639,569 44,266 23,900 *275 *1,016 41,763 3,432 771,381 2,629,922 3,409 18,023 14,263 Kentu~ky ..................... I, 197,183 15,812,613 45,339 24,884 •• ., 45,998 J,51il 1,007,692 2,864,387 2,M3 5,380 I ,425 Louisiana •••••••. I ,455 ,lit 7 21,377,630 44,583 41,789 46,198 4,419 !,217,145 4,288,328 3,523 15,704 10,218 Maine •••• , ................... 428,830 5,010,538 32.170 21,400 "' '"' 32,513 2,845 346,217 832,818 2,405 '" " !!~ryland ..................... 1,757,333 26,849,045 137.607 !29,933 *2,139 >'<3,051 136,756 )6,842 1,496,671 5,328,798 3,560 4,514 2,671 Mass~~husetts. .............. 2,388,960 ;i;~;~:~~~ 225,193 190,230 9,691 36,134 229,489 32,910 2,025,297 6,668,690 3,293 2,478 "' Michigan ••••••••••••• 3,445,581 220,357 120,243 *2,053 *I ,415 221,979 J7. 973 2,859,115 10,348,301 3,619 3,831 3, 730 Minnesota •••••••••••••.•••••• 1,629,265 23,173,953 161.1i76 85,802 *692 *1,908 !54, 753 12,310 1,341,001 4,352,616 3,246 1,017 "' Mississippi •• ............... 768,008 9,238,962 30,349 21i,821 29,103 2,875 610,198 1,598,256 2,619 7,985 6,952
Mi~snuri. ••••••• , ............ 1,837,329 25,973,653 99,829 51,914 *1,811 *4,399 99,104 8, 751 \,541,172 4,912,647 3,188 5,657 3,645 Mont~n~ ................ • • .. • • 306,193 3,981,879 20,528 !0,641 "' "' !9, 762 1,683 244,568 699,336 2,859 2,182 1 ,Iilli Hebnwka ••••• , ••••••• • • • • • • .• 624,621 8,43t,61i3 38,957 23,816 *!,OilS "10,571 39,281 5,631 498,273 1,505,693 3,022 3,780 2,937 Hcvadco ................... 369,540 5,386,861i 10,456 7,622 2,050 3,479 1!,686 2,322 325,696 1,087 ,li8S 3,339 "' "' )lew Hampshire ••••••••••••••.• 398,899 5,458,0tt 24,071 !2,657 '"' 1,067 25,519 2,276 343,752 1,0!3,309 2,948 " " Hew Jer11ny ........... 3,213,074 50,026,394 250.461 188,612 >'<1,669 *7,530 251,537 27,058 2,753,620 10,318,471 3,747 1,600 I ,815 Hew Mcxi~o ................... 468 ,609 6,006,321 16,191 9, 762 3,129 12,232 17,949 5,556 371,149 1,078,933 2,907 4,025 2,470 lla1.1 York.,, .................. 6,748,963 98,780,306 485,106 346,519 3,958 7,213 481,662 1i6,9!3 5,739,619 19,832,462 3,455 4,9Z4 l ,577 llorth Carolina ••••••••.•••••• 2,187,900 27,065,495 78,552 49,356 4,385 21,471 77,802 !5,291 1.778,927 1,,699,635 2,61,2 1,502 421 North Dakota ................. 246,287 3,275,466 13,222 7,970 *629 *5,169 12,812 1,061 203,9!0 562,171 2, 757 1,132 '" Ohio ......................... 4,194,809 61,960,929 212,327 153,880 3,241 9,705 214,597 23,026 3,627,860 !1,979,479 3,302 13,079 5,203 Oklaholllll ••••••••.• • •• • • • • • • • • 1,095,612 15,727,800 59' 793 41,531 *121 *187 57,551 5,560 918,497 3,021,635 3,290 29,581 17.706 Oregon ............ 1,068,224 14,639,092 63,578 71,886 2,394 6,605 65,432 12,451 882,868 2,674,274 3,029 I ,466 "' Penngylv<lnia .... , •.•••••••••• 4,522,124 65,597,761 345,138 281,830 2, 725 5, 767 347,664 36,061 ),863,424 12,552,768 3,249 4,109 2,627 Rhnde bland ................. 385,905 5,107. 751 29,440 21,555 "' 1,177 30,287 3,251 323,61,7 952,712 2,944 "' " South Carolina ............... 1,109,627 13,432,626 51i,803 29,820 *299 *229 55,066 4,458 911,633 2,264,595 2.~8~ 542 225 South Dakota ••••••••••••.•••• 242,512 3,066,499 10,443 6,672 "" 1,005 10,525 '" !81,972 506,498 2, 783 22~ '" Tennessee ••••• . . . . . . . . . . . . . . 1,621,214 21,193,508 67,834 SO,Ii58 *455 ~2,096 67,153 7,879 1,306,747 3,894,085 2,975 li,878 2,497 Texas ••••••••••••••••••••. , .• 5,417,490 83,491,130 150,661 111,767 2,768 2,667 153,276 16,097 4,567,675 17,495,158 3,830 75,039 ~9,531
Utah .......... .............. 498,578 6,377,391 40,497 23,333 '"' 1,134 39,525 3,569 404,546 1,109,372 2,742 I ,076 "' Vermont •••. , ................. 201,054 2,413,756 13,086 8,555 '" 2,368 13,116 1,777 165,599 408,711 2,468 '" n Virginia, .................... 2,110,192 30,578,480 90,441 48,572 ~397 *3,313 89,647 7,074 1 '772,850 5,908,474 3,333 2,700 "' W~shingtce •••••••••••••••.••• 1,675,760 26,813,977 92,556 68,504 *2,132 *6,461 96,229 10,258 \,461' 199 5,393, 706 3,691 6, 709 3,287 \lest Virginia •••••.•.•••••••• 630,414 8,934,338 19,512 15,834 *1,261 *2,211 19,867 2,029 522,926 1,665,224 3,184 2,462 1,402 Wisconsin •••••••••••.•.•••••• I ,853,337 25,735,482 139,277 87,081 *954 *2,168 138,471 12,270 1,526,285 4,64!,382 3,01tl 1,025 "' llyoming •.•••••• •., ..... • • .. • • 195,569 3,274,950 11,125 7' 774 "' 5,280 l!,7JO 3,044 166,181 673,007 4,050 2,419 3,039 Puerto Rico .................. 38,855 298,521 17,162 13,576 "' u.s. citizens ~broad ••••••.•• 196,249 5,269,595 1,953 '" *662 *1,528 2,360 no 135,028 924,096 6,84/i 1,205 "'
*Estim:ltn should be usad with ~aution b~causc of the small numbar of s~mpln returns en 1.1hi~h it is based. NOT£; Detail lllll)' not add to total because of rounding.

11
Figure C.--Estimated Number of Returns for Selected Upper Limit Coefficients of Variation by Size of Adjusted Gross Income/Deficit, 1980
[Cells are estimated number of returns]
Size of adjusted gross income/deficit Coefficient of
variation (C.V.) Under $10,000 $15,000 $20,000 $30,000 $50,000 $100;000 $200,000 $500,000 (Percent) $10,00()1 under under under under under under under and over
$15,000 $20,000 $30,000 $50,000 $100,000 $200,000 $500,000
(1) (2) (3) (4) (5) (6) (7) (8) (3)
2 .............. 6,527,000 6,163,500 4,639,800 5,191,600 3,791,900 1,094,600 256,200 73,600 2,200
5 .............. 1,044,300 986,200 742,400 830,700 606' 700 175,100 41,000 11,800 300
10 ............. 261,100 246,500 185,600 207,700 151,700 43,800 10,200 2,900 90 20 ............. 65,300 61,600 46,400 51' 900 37,900 10,900 2,600 700 20
30 ............. 29,000 27,400 20,600 23' 100 16,900 4,900 1,100 300 10
35 ............. 21,300 20,100 15,200 17,000 12,400 3,600 800 200 7 502 •••••••••••• 10,400 9,900 7,400 8,300 6,100 1,800 400 100 3
1This column should be used for estimated number of returns not classified by adjusted gross income/deficit. 2Estimates with C.V. 's of SO percent have standard deviations which are about one-half as large as the estimates
themselves. NOTE: This table is applicable to frequencies only and not to estimated amounts.
DATA SOURCES AND LIMITATIONS
These preliminary statistics were based on a sample of unaudited individual income tax returns, Forms 1040 and l040A. The sample was stratified based on the presence or absence of a Schedule C, the State from which the return was filed, size of adjusted gross income or deficit, or largest source of income or loss, and size of business plus farm receipts. The 1980 returns were selected at rates ranging from 0.05 percent to 100 percent. There were 160,213 returns in the 1980 preliminary sample, estimating a total population of 93,827,000. The corresponding sample size and population for 1979 were 187,262 and 92,616,213, respectively.
Because the estimates are based on a sample, they are subject to sampling error. The return data are also subject to nonsampling error due to taxpayer reporting variations and to discrepancies introduced during statistical processing.
Sampling Error
The upper limits of the coefficients of variation for 1980 shown in Figure C (for frequency estimates only) are intended as a general indication of the reliability of the data.
Addi tiona! measures of the coefficients of variation for various data items will be presented in the forthcoming Statistics of Income complete report for Tax Year 1980. The computed coefficients of variation of estimates previously published in the 1978 Statistics of Income report can be used as an approximate measure of the reliability of similar estimates for 1980.
Nonsampling Error
Nonsampling error was controlled during statistical processing by a variety of methods. Among them was a systematic verification, at all field processing locations, of the manual abstraction of data. As a further check on the quality of the abstraction, small subsamples selected after verification were reprocessed in the National Office. Also, 100 percent verification of the key-entered data was performed at the field processing locations.
Prior to tabulation, numerous computer tests were applied to each return record to check an inconsistencies. Lastly, prior to publication, all statistics and tables were reviewed for accuracy and reasonableness in light of provisions of the tax laws, taxpayer reporting variations and limitations, economic conditions, and comparability with other statistical series.
DEFINITIONS AND LAW CHANGES
In general, the definitions of the terms used here are the same as those shown in the complete report, Statistics of Income--1978, Individual Income Tax Returns and the Summer 1981 SOl Bulletin. Updated definitions will be available in the Statistics of Incame--1979, Individual Income Tax Returns. However, the statistics shown for 1980 were affected by the following tax law changes. +
(1) That portion of the residential energy credit based on renewable energy source costs was increased from 30 percent of the first $2,000 plus 20 percent of the next $8,000, to 40 percent of the first $10,000 spent on solar, geothermal, or windpowered equipment. (2) The refundable portion of the business energy investment credit was abolished for 1980. The nonrefundable portion, however, remained in effect. (3) The windfall profit tax became effective for Tax Year 1980.
REFERENCES
[1] Comparisons for 1978-79 data were published in the Summer 1981 SOI Bulletin. Data for 1978 are from the complete report, Statistics of Income--1978, Individual Income Tax Returns, while the 1979 data are based on a preliminary (generally smaller) sample. If the comparisons were based on the two respective complete reports, somewhat different changes would be obtained.
[2] For further background on estimation methods, see Dumais, J., and Shadid, R., 11 Individual Statistics of Income: Advancing the Closeout Date," 1981 Proceedings, American Statistical Association Section on Surve Research ~1ethods to appear .

Individual income Tax Returns: Selected Characteristics From the 1980 Taxpayer Usage Study
By Paul Grayson•
Since 1970 the Taxpayer Usage Study (TPUS) of the Internal Revenue Service has provided, shortly after the close of each filing period, early indications of how taxpayers are using the current-year Form 1040 and 1 040A "rndi vidual Income Tax Returns. In view of changes in the tax laws, redesign of the tax forms and other factors, IRS officials have found this early analysis of the characteristics of income tax returns useful for a variety of planning purposes involving processing workloads, forms design, taxpayer reporting behavior, and the like. The study is based on a sample of about 7, 500 Forms 1040 and l040A filed between January 1 and about May 1 each year. The study report is normally released _during the summer, providing frequency information on return entries made by taxpayers, and other key characteristics of the returns filed.
THE SIGNATURE OF A PREPARER
Whether more or fewer taxpayers--and what kind-engage the services of return preparers is significant for a variety of reasons. From the IRS standpoint, a preparer return is likely to be more expensive for IRS to process than a self-prepared one, as evidenced by data presented here. From a broader perspedive, tf-le incidence of preparer returns can be viewed as a reflection of the complexity of the tax law and the tax return. From the taxpayers' standpoint, their perceptions of the need to employ preparers result in additional costs to them. in. complying with the tax laws. In addition, one may view the return preparer as a medium whose cooperation IRS can enlist to improve the tax administration system. What, then, do we know about preparer returns and their characteristics?
The Taxpayer Usage Study employs, as an indicator of a "preparer return," the presence of an accepted signature on the line of the return for "Paid Preparer's Use Only--Preparer' s signature and date." Other returns are designated "self-preparer\" (Included in this latter category are returns with a signature on the line made by a family member or inadvertently by the taxpayer. Also classed as "self-preparer" are returns signed by identifiable unpaid preparers such as IRS personnel.)
In terms of speci fie forms filed for 1980, 52 percent of Forms 1040 were signed by preparers as opposed to ]7 percent of Forms 1040A. The trend in average usage of preparers over recent years is as follows:
Preparer Preparer Tax returns Tax returns year (Percent) year (Percent)
1980 ...... 38 1976 ...... 47 1979 ••••.• 39 1975 ...... 46 1978 .•.•.• 39 1974 ...... 43 1977 ...... 42 1973 ...... 48
The downward trend of the last four years is accentuated by the drop in 1976-1977. Beginning with 1977, the law has called for the signature of only paid preparers. The 1976-1977 shift can undoubtedly be attributed to the change in the requirement: meny unpaid preparers, such as friends and relatives, no longer felt obligated to sign the returns they prepared.
Tables 1 and 2 provide comparative "profiles" of pre parer and sel f-preparer returns filed during January through April of 1981, for Tax Year 1980. Eightytwo percent of preparer returns were filed on Form 1040; only 46 percent of self-preparer returns were 1040's. Preparer returns were more likely to have entries for income tax liability, but less likely to have refunds, than self-preparer. Preparer returns were less likely to have the label, envelope and return that IRS provides in the mailing package--a consistent TPUS finding over the course of several years.
Table 2 shows that certain attached forms and schedules are more frequent among preparer returns than among self-preparer, but that thjs does not hold for all attachments. Schedule A, for example, accompanied about one-half the 1040 1 s filled out by pre parers and about the same proportion of self preparer 1040 1 s. (The names of these schedules may be found at the end of thj s article.) Schedules C and E represent the more common condition: each was relatively more frequent among preparer than self-preparer Forms 1040.
Table I.--Percentage Frequency of Selected Items Among Preparer and Self-Preparer Returns, Tax Year 1980
Individual returns
Item Self-All Pre parer preparer
(1) (2) (3)
Form 1040 .• , ....•••.•.....•.• 59.3 81.8 45.5 Income tax liability ••.••..•• 79.5 84.9 76.3 Refund •.•••• , •.•...•.••..•.•. 70.2 65.5 73. 1 Presidential campaign fund
contribution .•..•.. , ...••... 34.2 29.5 37.1 Official preaddressed label •. 59.3 56.1 61.3 Official IRS envelope •.•.•••. 79.8 66.3 88.1 IRS mailed package return .••• 58.1 30.9 74.7
NOTE: Of the 89,154,000 total returns, there were 33,820,000 preparer and 55,333,000 self-preparer returns.
*Dr. Grayson is Chief of the Special Studies Section. He is under the direction of John P. Hiniker, Chief of the Projections and Special Studies Branch. 13

14
Table 2.--Percentage Frequency of Selected Forms and Schedules Among Preparer and Self-Preparer
Form 1040 Returns, Tax Year 1980
Form 1040 returns
All SelfPreparer preparet
(1) (2) (3)
Schedule: A •.• .. ... . .. . .. .. .. .. . ...... 51.7 51.9 51.3 B •• ..... .. . .. .. .. . .... . . . . 42.5 43.4 41.4 c. .... ... .. ... .. . .. ... .... ... 15.5 19.5 11.2 D •• .. ... .. ... .. .. . .. . . ...... 12.1 14.6 9.3
E •• • ••••• • ••••• • .. ....... .... 19.3 24.7 13.5 F ••••• .. ... . .. .. ..... ....... 4.2 5.7 2.5 G. .. ... .. .... ... .. ... ... .... 9.3 11.7 6.7
Form: 2106 •. ...... ... .... ..... .. . . 10.1 9.8 10.2 2210 •.. .. ..... ........ .... .. 5. 7 9.4 1.7 2441. ••. .. ... .. .. ... .. .. .. . . 8.0 7.9 8.1 3468 .•. .. .. ······· ...... .... 6.5 10.2 2.3 4797 .•• ..... .. ... .. . . .. .. . . 2.5 4.4 (1) 5695 ..•••.•.••.. ... ... . ...... 8.8 8.7 8.8
1Less than 0.05 percent. NOTE: Of the 52,841,000 total Form 1040 returns,
there were 27,673,000 preparer and 25,168,000 selfpreparer returns. See page Zl.for identity of forms and schedules.
When 'a form or schedule accompanies a self -preparer 1040, it is almost invariably a standard form designed and printed by IRS--99 percent of the time. Not so with preparer returns, where more than one-fourth of the attachments are of the preparer•s design, or from some other non-IRS source. The 1980 TPUS, in covering 18 types of attachments, each with at least 400,000 filed, found that preparer returns contributed over 20 million attachments in a non-standard form. Selfpreparer returns, in contrast, contributed only about 700,000.
Thus, for several reasons, preparer returns are likely to be more expensive for IRS to process than self-preparer returns: the former are less likely to have the official mailing label, they frequently have more attached forms and schedules, and their attachments are less likely to be in a standard form.
As shown below, pre parer returns for 1980, taken as a group, had a median adjusted gross income (AGI) of about $16,500; the median for self-preparer returns was $11,600. However, wl"len this comparison is made within Form· 1040 and l040A returns separately, the d5.fference between preparer and self-preparer returns almost vanishes.
Median Adjusted Gross Income, Returns for Tax Year 1980
Return
Self-All Preparer preparer
Total .....•.••••.. $13,000 $16,400 $11,600
Form 1040 •.........••.•. 20,000 19,200 20,800
Form 1040A •••..•.....•.• 7,500 7,500 7,500
The explanation of the apparent paradox is both the generally higher AGI of 1040 returns and, as previously noted, the greater frequency of 1040 usage among preparer returns.
The Table 3 data (portrayed in Figure 1) show, for Form 1040A, a mild tendency for the proportion of preparer returns to decline in the higher AGI classes. The line for Form 1040 shows an even stronger tendency to fall as AGI increases--except in the highest class, for $50, 000 and over. For "All Returns," the line moves progressively upward with increasing size of AGI. This is another version of the "paradox" of the medians, and the explanation is essentially the same. Form 1040 filers generally use preparers more heavily than 1040A filers; and, with increasing income, the proportion of returns filed on Form 1040 increases at the expense of the 1040A. Thus in computing the average percentage of all preparer returns, the (high) percent of preparer returns among 1040's gets an ever-increasing weight as AGI increases .
Table 3.--Percent of Returns With Entry for Paid Preparer's Signature by Type of Return and by Size of Adjusted Gross Income, Tax Year !980
Return Size of adjusted gross income
All Form Form 1040 1040A
(1) (2) (3)
Total •........••.......• 37.9 52.4 16.9
Under $5,000 •..•.•.••.•...••.. 27.7 59.7 15.8 $5,000 under $10,000 ..••...••• 33.8 54.0 19.6 $10,000 under $15,000 •......•. 34.3 52.8 15.3 $15,000 under $20,000 .•...•..• 41.4 53.9 16.8 $20,000 under .30,000 .....••.. 45.4 50.0 16.1 $30,000 under $50,000 .•.....•• 47.8 48.8 *14·.3 $50,000 and over .•....••.•..•• 55.3 55.3 (1)
*Estimate should be used with caution because of small number of sample returns on which it is based.
1No returns in sample.
Table 4 and Figure 2 show that the 1980 11All returns" pattern was basically the same as the average for the entire 1977-1980 period, i.e., higher·income taxpayers tended to· use preparers more than did lower income taxpayers. The 1975-1976 line suggests that, prior to 1977, taxpayers in the "middle income" levels ($15,000 to $30,000) tended to use preparers somewhat less than those with incomes of $5,000 to $15,000. The decline in indicated average usage appears concentrated in the income classes below $15,000.
If most of the indicated decline for 1976-1977 was due to the nonsigning of returns by unpaid preparers after 1976, it may be that unpaid preparers were--and perhaps still are--relatively more important in the lower income classes than in the higher ones.
THE WAGE AND TAX WITHHOLDING STATEMENT, FORM W-2
The Form W-2 is the mo~ w important of a small family of forms dealing with tax withheld. It relates to more taxpayers, covers more dollars of income, and there are more of them than any other in the "W" group. (In 1981, about 150 million Forms W-2 were filed with tax returns.) Per square inch, the W-2 probably contains r ...... re information than any other tax

Figure 1
Percentage Frequency of Preparer Returns by Adjusted Gross Income Class by Type of Return, Tax Year 1980
Paid pre parer returns as percent of AGI class
', Forms 1040
'-----............ / ----
Forms: 1 040A
,,,~,,, ,, ____ /__ ""'"" ... ___ --------
Data shown at representative points for each AG I class.
Table 4.--Percent of Returns With Entry for Preparer Signature by Size of Adjusted Gross Income, Tax Years 1969, 1975-1980
Size of adjusted gross income
Tax year Average Under $5,000 $10,000 $15,000 $20,000 under under under under $5,000 $10,000 $15,000 $20,000 $30,000
(I) (2) (3) (4) (5) (6)
1980 ........................ 37.9 27.7 33.8 34.3 41.4 45.4 1979 .•.....•.•..•.••...•..•• 39.3 28.8 35.1 39.0 43.3 46.0 1978 •.....••.•.••.•.•....•.. 39.3 27.7 35.4 39.1 44.6 49.0 1977 ....•.•.••.•..•.•...•. :. 42.4 32.7 38.8 45.0 48.2 51.6
1976 .•••..•...•.••.•.•.••.•• 47.3 41.0 47.7 52.5 48.8 47.1 1975 •..•.•.•..•••.•......•.• 45.5 40.1 46.0
' 47.7 47 .5J 46.9
1969 ..•.•..•.•.•..•...•..••• 52.9 46.0 59.6 55.5 55.5
NOTE: For 1977-1980: Returns read essentially, 11Paid preparer's signature"; for other years, simply "Preparer' s signature. 11
15
$30,000 and over
(7)
49.2 52.9 54.6 55.1
56.4 58.5
74.8
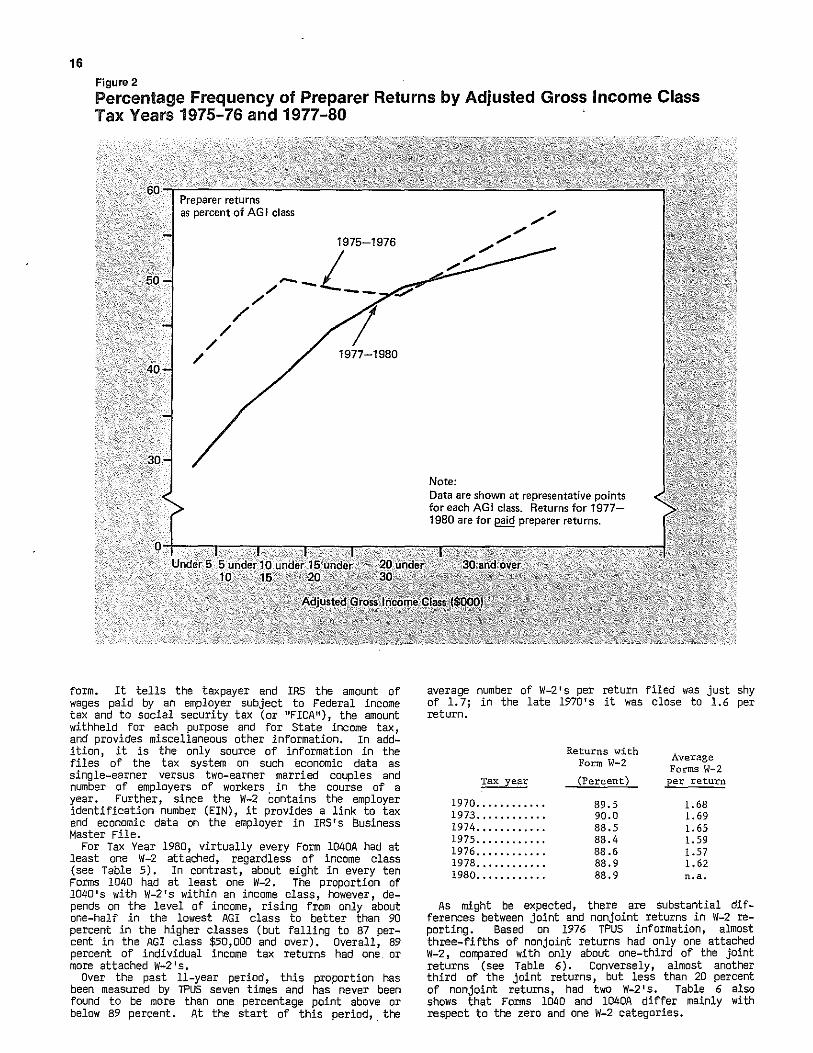
16 Figure 2
Percentage Frequency of Preparer Returns by Adjusted Gross Income Class Tax Years 1975-76 and 1977-80
1975-1976
--1 / -- ~ /
/// 1 / 1977-1980
form. It tells the taxpayer and IRS the amount of wages paid by an employer subject to Federal income tax and to social security tax (or "FICA"), the amount withheld for each purpose and for State income tax, and provides miscellaneous other information. In addition, it is the only source of information in the files of the tax system on such economic data as single-earner versus two-earner married couples and number of employers of workers in the course of a year. Further, since the W-2 Contains the employer identification number (EIN), it provides a link to tax and economic data on the employer in IRS's Business Master File.
For Tax Year 1980, virtually every Form 1040A had at least one W-2 attached, regardless of income class (see Table 5). In contrast, about eight in every ten Forms 1040 had at least one W-2. The proportion of 1040's with W-2's within an income class, however, depends on the level of income, rising from only about one-half in the lowest . AGI class to better than 90 percent in the higher classes (but falling to 87 percent in the AGI class $50,000 and over). Overall, 89 percent of individual income tax returns had one. or more attached W-2's.
Over the past 11-year period, this proportion has been measured by TPUS seven times and has never been found to be more than one percentage point above or below 89 percent. At the start of this period, . the
Note: Data are shown at representative points for each AGI class. Returns for 1977-1980 are for e!!k! preparer returns.
average number of W-2' s per return filed was just shy of 1.7; in the late 1970's it was close to 1.6 per return.
Tax year
1970 ...•••.•.••• 1973 .•..•.••...• !974 .••....••... 1975 ••..••••..•• 1976 •.•••....••. 1978 .••...••••.. 1980 ..•....•••..
Returns with Form W-2
(Percent)
89.5 90.0 88.5 88.4 88.6 88.9 88.9
Average Forms W-2 per return
!.68 !.69 !.65 !.59 !.57 !.62 n.a.
As might be expected, there are substantial differences between joint and nonjoint returns in W-2 reporting. Based on 1976 TPUS information, almost three-fifths of nonjoint returns had only one attached W-2, compared with only about one-third of the joint returns (see Table 6). Conversely, almost another third of the joint returns, but less than 20 percent of nonjoint returns, had twa W-2' s. Table 6 also shows that Forms 1040 and 1040A differ mainly with respect to the zero and one W-2 categories.

Table 5.--Percent of Returns With Form W-2 by Type of Return and by Size of Adjusted Gross Income,
Tax Year 1980
All Form Form Size of adjusted gross income 1040A 1040 returns returns returns
(1) . (2) (3)
Total, •..•.••.•..•••... 88.9 82.4 98.5
Under $5,000 ••••.•••••.•••... 85.0 51.0 97.6 $5,000 under $10,000 ••..•.•.• 84.2 63.4 98.8 $10,000 under $15,000 •..•.••• 88.8 79.4 98.4 $15,000 under $20,000 .••.•••• 91.3 87 .• 1 99.7 $20,000 under $30,000 ..•.•.•• 94.1 93.2 100.0 $30,000 under $50,000 ....•••• 94.1 93.9 100.0 $50,000 and over .•.•.•.•. , •.. 87.0 87.0 (1)
1No returns in sample.
Table 6.--Percentage Distribution of Returns by Number of AttaChed Forms W-2 by Filing Status;
by Return Type, Tax Year 1976
Filing Type of status return Number of
Forms W-2 Total Non- Form Form Joint joint 1040 l040A
( 1) (2) (3) ( 4) (5)
Total .•.•...•. 100.0 100.0 100.0 100.0 100.0
o ........•.......... 11.8 11.8 11.8 18.2 1.8 1. .•..•....•...••... 46.0 34.6 58.7 39.6 58.7 2 •...••••.••.•.•.••• 26.0 32.6 18.7 26.7 24.2 3 •.•..•.......•.••.• 10.4 12.9 7.7 10.2 10.4 4 •..•.•...•••..••... 3.5 4.8 2.1 3.4 3.0 5 or more ... , .•.••.• 2.2 3.4 0.9 2.0 2.0
Average per return •• 1.57 1.77 1.33 1.50 1.63
17
Tables 7 and 8 focus on joint returns. In Table 7 we note, ·for example, that about 17 percent of the joint tax returns had no W-2 for the husband; about one-half had no W-2 for the wife. We also note that about 43 percent of the joint returns had two earners reported (for 1970, the comparable figure was 41 percent). Table 8, for jointly filed Forms 1040A, shows the steady increase in the proportion of dual-earner returns as income increases. In this case, dualearner status is presumably a prime determinant of higher income.
CARRYING OUT THE STUDY
In December of each year, instructions are sent to all 10 Internal Revenue service centers (where all income tax returns are filed) to select a systematic sample of 1/13,000th of all mail items received between the following January 1 and June 30. (The bulk of the selection is made through the use of a counting device on the automatic envelope opening machines.) If the selected item contains a Form 1040 or l040A, the entire contents are reproduced, including the envelope. If it does not include a 1040 or 1040A, only page 1 of the contents is reproduced. On Friday, the accumulated weekly sample is express-mailed to the IRS statistics Division for Monday or Tuesday delivery. Weekly reports on key items on Forms 1040 and 104DA are issued by Thursday.
Table 7.--Percentage Distribution of Joint Returns by Number of Forms W-2 for.Husband by Number for Wife,
Tax Year 1976
Number of Forms W-2 for husband
Number of Forms W-2 Total for wife 0 1 2 or
more
(1) (2) (3) ( 4)
Total .•. , ..•...• 100.0 17.4 60.3 22.3
0 •.•..•.•.••.•.••...•. 51.4 11.8 29.9 9.7
1. ......•.•...•..•.•.• 39.5 4.7 25.5 9.3
2 or more ...•.•....... 9.1 0.9 4.9 3.3
Table 8.--Percent of Jointly Filed Form 1040A Returns by Number of Spouses With Form W-2 and by Size of Adjusted Gross Income, Tax Year 1980
Size of adjusted gross income
Item Total Under $5,000 $10,000 $15,000 $20,000 $5,000 under under under
and ave~ $10,000 $15,000 $20,000
(1) (2) (3) ( 4) (5) (6)
All joint Forms 1040A filed ..•.•••. 100.0 100.0 100.0 100.0 100.0 100.0
At least one spouse indicated on Form(s) W-2 ...•..•.•. ,, ... ,, .. , ....•••.... , ...• 99.6 98.9 99.4 99.4 100.0 100.0
One spouse only •.•.. , .•.•• , , ..•• , •..•. 52.3 73.9 72.1 53.9 43.0 34.9
Two spouses ••.•••...•..••••..•••••..•• 47.3 25.0 27.3 45.5 57.0 65.1
No Form W-2 attached •••.•.••.•...•••... , . ~0.4 *1. l *0.6 *0.6 - -
*Estimate should be used with caution because of the small number of sample returns on which it is based,
18
Uncorrected data--as entered on the tax return--are manually abstracted to checksheets a.nd later transcribed into magnetic form; both operations are 100 percent verified. The magnetic data file is tested and corrected to eliminate processing error. The major report is based on sampling through about ~1ay 1, so that the larae influx of tax returns filed around April 15 can be- covered. By the May 1 cutoff, the TPUS sample consists of a total of about 7,500 current-year returns filed on Forms 1040 and 1040A. (Prior-year returns are considered "out of scope. u) Sample returns received between May 1 and June 30-about 300 in number--are separately tabulated; these will be later referred to as the "Late Sample. 11 Returns In the 11 regular" and late samples are permanently retained.
The designed sampling rate has been set at 1/13, ODD to yield a sample of about 7, ODD. However, in most recent years the average effective sampling rate has exceeded the designated rate; in addition, the effective rate for l04DA's has exceeded that for the 1040's. Research to date on the responsible factors has been inconclusive.
The estimation procedure is based on using the inverse of the effective sampling rates for Forms 1040 and 1040A weighted separately. For example, in 1981, the official IRS count of Forms 1040 received by May 1 was 52,841, 000, while the number of sample 1040 1 s was 4,367. Thus the effective sampling rate for 1040's was 1/12,100 and the weight assigned was 12,100. For Forms 104DA, the weight was 11,448.
Because the TPUS samples are unstratified, data from them are fundamentally of one kind--frequency of occurrence, generally presented both in absolute numbers at the population level, and as percentage frequencies. Items selected for tabulation predominantly deal with the presence of line item entries and types of attached forms and schedules.
LIMITATIONS OF TPUS
As previously indicated, the TPUS sample--the whole TPUS program, in fact--was designed with a clearly defined objective in mind: to provide 11characteristictype" data and to provide them as early in the filing year as possible. The sample is therefore small, has a uniform designated sampling rate, and is not stratified in the customary sense. (From one point of view, the TPUS sample might be termed stratified by service center and week of receipt of the tax return. While more research might be done in this area, the relative efficiency of these strata with respect to reducing the sampling variability of most items is likely to be quite insignificant.)
The characteristics of the TPUS sample have been important in a variety of. ways. Because of t~ sample 1 s relatively small s1ze and lack of stratification, calculated sampling errors are larger than those experienced in the much larger Statistics of Income sample of individual income tax returns--which has ranged to 150 ,ODD returns or more in the recent past--and is highly stratified to boot. IRS administrators and others have, nevertheless, made extensive use of the TPUS reports for characteristic-type data.
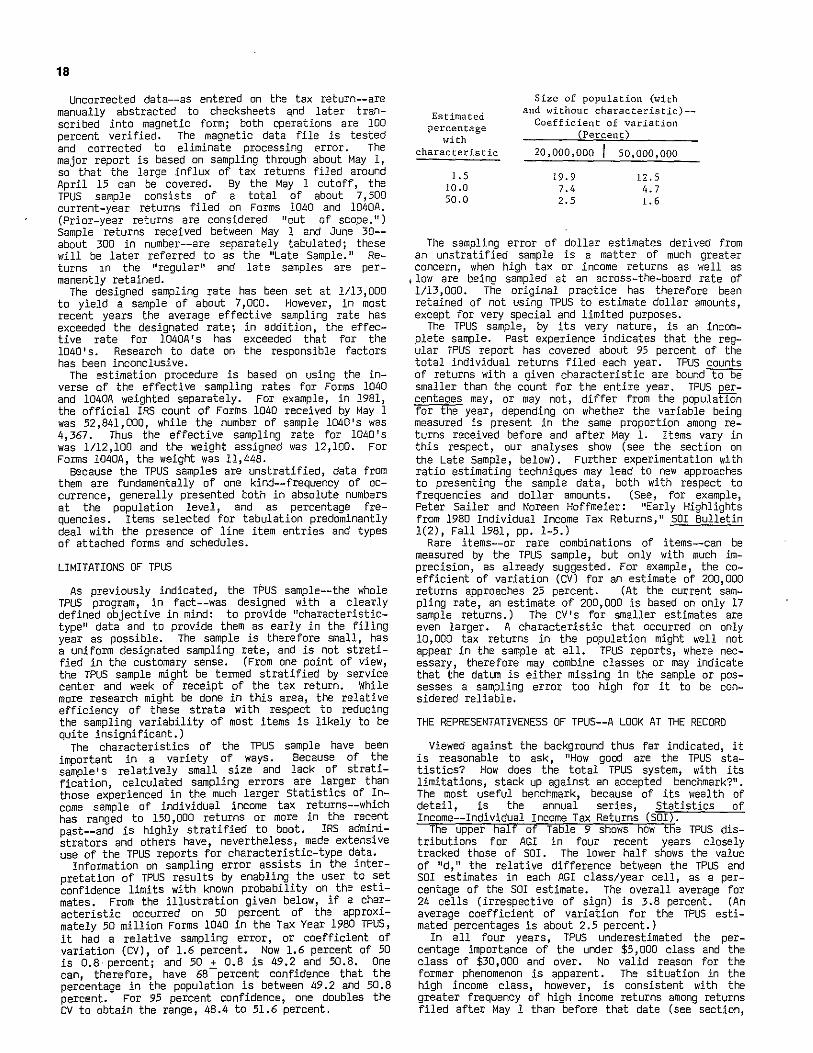
Information on sampling error assists in the interpretation of TPUS results by enabling the user to set confidence limits with known probability on the estimates. From the illustration given below, if a characteristic occurred on 50 percent of the approximately 50 million Forms 1040 in the Tax Year 1980 TPUS, it had a relative sampling error, or coefficient of variation (CV), of 1.6 percent. Now 1.6 percent of 50 is 0.8 percent; and 50 .:!:. 0.8 is 49.2 and 50.8. One can, therefore, have 68 percent confidence that the percentage in the population is between 49.2 and 50.8 percent. For 95 percent confidence, one doubles the CV to obtain the range, 48.4 to 51.6 percent.
Estimated percentage
with characteristic
1.5 10.0 50.0
Size of population (with and without characteristic)-
Coefficient of variation (Percent)
20,000,000
19.9 7.4 2.5
50,000,000
12.5 4.7 1.6
The sampling error of dollar estimates derived from an unstratified sample is a matter of much greater concern, when high tax or income returns as well as
1 low are being sampled at an across-the-board rate of 1/13,000. The original practice has therefore been retained of not using TPUS to estimate dollar amounts, except for very special and limited purposes.
The TPUS sample, by its very nature, is an incomplete sample. Past experience indicates that the regular TPUS report has covered about 95 percent of the total individual returns filed each year. TPUS counts of returns with a given characteristic are bound to be smaller than the count for the entire year. TPUS ~centaaes may, or may not, differ from the population for the year, depending on whether the variable being measured is present in the same proportion among returns received before and after May l. Items vary in this respect, our analyses show (see the section on the Late Sample, below). Further experimentation with ratio estimating techniques may lead to new approaches to presenting the sample data, bath with respect to frequencies and dollar amounts. (See, for example, Peter Sailer and Noreen Hoffmeier: "Early Highlights from 1980 Individual Income Tax Returns," SOI Bulletin 1(2), Fall 1981, pp. 1-5.)
Rare items--or rare combinations of items--can be measured by the TPUS sample, but only with much imprecision, as already suggested. For example, the coefficient of variation (CV) for an estimate of 200,000 returns approaches 25 percent. (At the current sampling rate, an estimate of 200,000 is based on only 17 sample returns.) The CV 's for smaller estimates are even larger. A characteristic that occurred on only 10,000 tax returns in the population might well not appear in the sample at all. TPUS reports, where necessary, therefore may combine classes or may indicate that the datum is either missing in the sample or possesses a sampling error too high for it to be considered reliable.
THE REPRESENTATIVENESS OF TPUS--A LOOK AT THE RECORD
Viewed against the background thus far indicated, it is reasonable to ask, ''How good are the TPUS statistics? How does the total TPUS system, with its limitations, stack up against an accepted benchmark?11 •
The most useful benchmark, because of its wealth of detail, is the annual series, Statistics of Income--Individual Income Tax Returns (SOI).
The upper half of Table 9 shows how the TPUS distributions for AGI in four recent years closely tracked those of SO I. The lower half shows the value of "d," the relative difference between the TPUS and SOI estimates in each AGI class/year cell, as a percentage of the SOI estimate. The overall average for 24 cells (irrespective of sign) is 3.8 percent. (An average coefficient of variation for the TPUS estimated percentages is about 2.5 percent.)
In all four years, TPUS underestimated the percentage importance of the under $5, ODD class and the class of $30,000 and aver. No valid reason for the former phenomenon is apparent. The situation in the high income class, however, is consistent with the greater frequency of high income returns among returns filed after May 1 than before that date (see section,
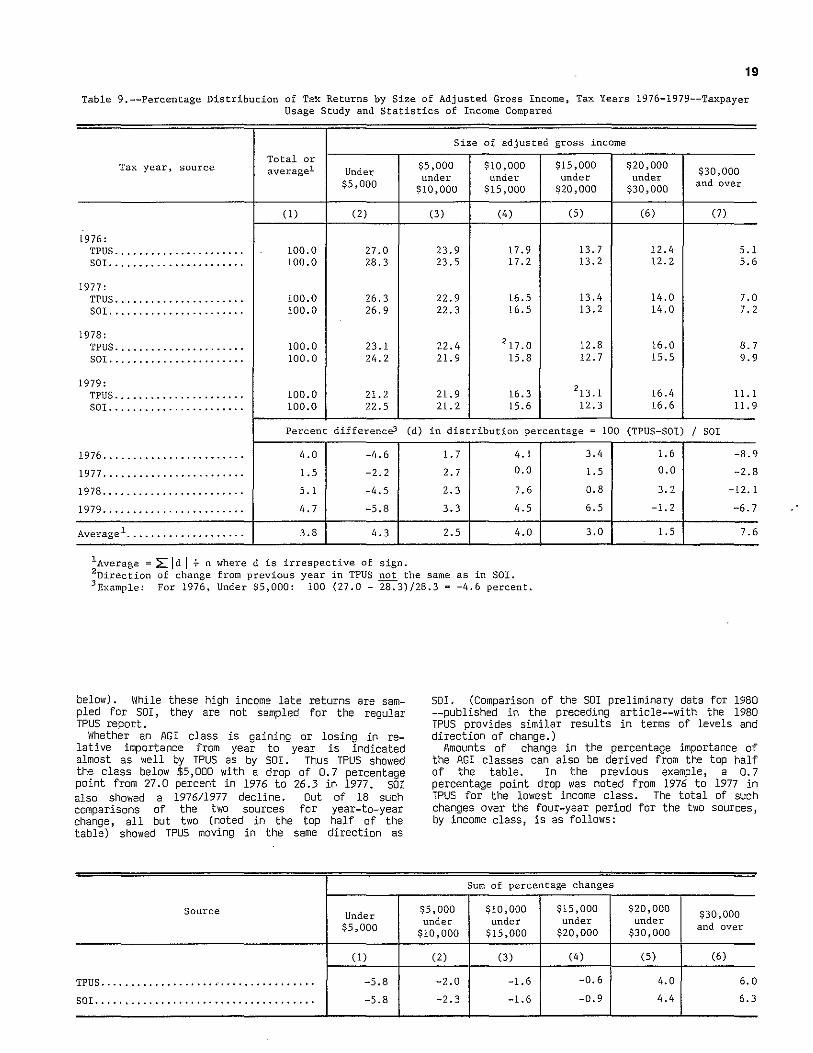
19
Table 9.--Percentage Distribution of TaX Returns by Size of Adjusted Gross Income, Tax Years 1976-1979--Taxpayer Usage Study and Statistics of Income Compared
Size of adjusted gross income
Total or $5,000 $10,000 $15,000 $20,000 Tax year, source average1 Under $30,000
$5,000 under under under under and over
$10,000 $15,000 $20,000 $30,000
(1) (2) (3) (4) (5) (6) (7)
1976, TPUS., •.••••.•.••..••••••. 100.0 27.0 23.9 17.9 13.7 12.4 5.1 SOl ••.•••••..••••••••••••• 100.0 28.3 23.5 17.2 13.2 12.2 5.6
1977' TPUS •••• ,., ••••••••••••••• 100.0 26.3 22.9 16.5 13.4 14.0 7.0 SOl. ...................... 100.0 26.9 22.3 16.5 13.2 14.0 7.2
1978, 2 17.0 TPUS ••••••••••••••••.••••• 100.0 23.1 22.4 12.8 16.0 8.7
SOl •..•.••••...••••••.••.• 100.0 24.2 21.9 15.8 12.7 15.5 9.9
1979, 213. 1 TPUS ••••••••••••••• • • • • • • • 100.0 21.2 21.9 16.3 16.4 11. 1 SOl. ...................... 100.0 22.5 21.2 15.6 12.3 16.6 11.9
Percent difference3 (d) in distribution percentage = 100 (TPUS-SOI) I SOl
1976 ........................ 4.0 -4.6 1.7 4.1 3.4 1.6 -8.9
1977 ........................ 1.5 -2.2 2.7 0.0 1.5 0.0 -2.8
1978 ........................ 5. 1 -4.5 2.3 7.6 0.8 3. 2 -12. 1
1979 ........................ 4.7 -5.8 3.3 4.5 6.5 -1.2 -6.7
Average 1 ............•....... 3.8 4.3 2.5 4.0 3.0 1.5 7.6
1Average ~ 2:ld I 7 n where dis irrespective of sign. 2Direction of change from previous year in TPUS not the same as in SOl. 3Example: For 1976, Under $5,000: 100 (27.0- ~3)/28.3- -4.6 percent.
below). While these high income late returns are sampled for SOl, they are not sampled for the regular TPUS report.
~Jhether an AGI class is gaining or losing in relative importance from year to year is indicated almost as well by TPUS as by SOI. Thus TPUS showed the class below $5, DOD with a drop of 0. 7 percentage point from 27.0 percent in 1976 to 26.3 in 1977. SOI also showed a 1976/1977 decline. Out of 18 such comparisons of the two sources for year-to-year change, all but two (noted in the top half of the table) showed TPUS moving in the same direction as
Source Under $5,000
(1)
TPUS ......................•.....•....•... -5.8
SOl •... ,,,, .......•..........•.........• -5.8
SOL (Comparison of the SOl preliminary data for 1980 --published in the preceding article--with the 1980 TPUS provides similar results in terms of levels and direction of change.)
Amounts of change in the percentage importance of the AGI classes can also be derived from the top half of the table. In the previous example, a 0. 7 percentage point drop was noted from 1976 to 1977 in TPUS for the lowest income class. The total of such changes over the four-year period for the two sources, by income class, is as follows:
Sum of percentage changes
$5,000 $10,000 $15,000 $20,000 $30,000 under under under under
and $10,000 $15,000 $20,000 $30,000
over
(2) (3) ( 4) (5) (6)
-2.0 -1.6 -0.6 4.0 6. 0
-2.3 -1.6 -0.9 4.4 6.3

20
These are rather remarkable results, comparable to an engineering structure that resists much higher stresses than it was designed to withstand. There are limits, however, to the 11Strength" of the TPUS system, and the primary ones must be borne in mind: the small sample size and the concentration on the first four months of receipts.
Both the strength and weakness of the total TPUS program are further revealed by a consideration of the counts of certain characteristics published in the TPUS report. One of the major areas covered in each report is the counts of Form 1040 returns with specified forms and schedules attached. Historically, TPUS counts have fallen short of SOI indications. (Since SOI does not count, for example, "returns with Schedule A," the SO! count of "returns with itemized deductions" can be taken as the equivalent.)
The accompanying table of Tax Year 1978 data (Table 10) supports the basic soundness of TPUS sampling and processing, but also indicates the limitations placed on the program by the need for a report based on an early May cut-off. About 4 million returns, represented by about 300 late TPUS sample returns, are filed in May and June. About one or two million more returns are received in the rest of the year. Taking Schedule A as an example, one notes that the regular TPUS reported 23.8 million returns with this schedule, or 27.5 percent of all returns covered by the regular sample. With the addition of the late sample, the number of returns with Schedule A becomes 25. 7 million (compared with SCI's 25.8 million) and comprises 28.4 percent of the augmented population (compared with SOI's 28.8 percent).
The data from the regular TPUS on the presence of the indicated schedules, in other words, is entirely reasonable for the period covered by the report, When the regular TPUS counts and percentages are supplemented by late sample data, the combined results are virtually an a par with sor.
Comparing the L~te Sample to the Regular Sample
The late sample of returns filed during May and June is characterized by somewhat higher adjusted gross income .compared with the earlier returns filed. Table 11 indicates that incomes below $10,000 are less common in the late sample, while incomes over $50,000 are more frequent.
Table 10 has already shown (see. the second and fourth columns) that the late sample, compared with the regular sample, is much more prone to have attached schedules such as Schedules A, C, D, and G. Close to one-half of the late sample, for example, had an attached Schedule A compared with only a bit more than one-fourth of the regular sample.
Two features that further contrast late and regular TPUS samples (see Table 12) are the preponderance of the Form 1040 and the greater frequency of the signature of paid preparers among the late sample returns. Undoubtedly asso-::iated with these characteristics are the significantly lower levels of usage in the late sample of official IRS label, official eFJvelope, and mailed package return. Requests for refund, as might be expected, were only 76 percent as frequent in the 1979 late sample as in the regular sample, but entries for income tax occurred about equally often in the two groups.
Returns received after April, then, are likely to be more expensive per unit to process; they are more likely to have attached schedules and thus be more complex, to have higher income, and to be less likely to be associated with the standardized forms, labels and envelopes that would simplify IRS processing.
Table 10.--Returns With Five Selected Schedules, Tax Year 1978--Taxpayer Usage Study and Statistics of Income Compared
[Numbers of returns in millions]
TPUS sor
Regular Late sample Combined Schedule
Percent Percent Percent Percent Number with Number with Number with Number with
schedules schedules schedules schedules
(!) (2) (3) (4) (5) (6) (7) (8)
Total returns .. 86.4 - 4.2 - 90.6 - 89.7 -
Schedule: A •••••••.••••.••• 23.8 27.6 !.9 45.8 25.7 28.4 25.8 28.8 c ................ 7.5 8.7 !.3 30.9 8.8 9.7 8.2 9.1 D •••••••.•••••••• 7.4 8.6 0.9 21.0 8.3 9.2 8.6 9.6 F • ••••.•••••.•••• 2.6 3.0 0.2 4.8 2.8 3. 1 2.9 3.0 G •••••• • • •••••••• 3.5 4.0 0.6 15.3 4. 1 4.6 4.5 5.0
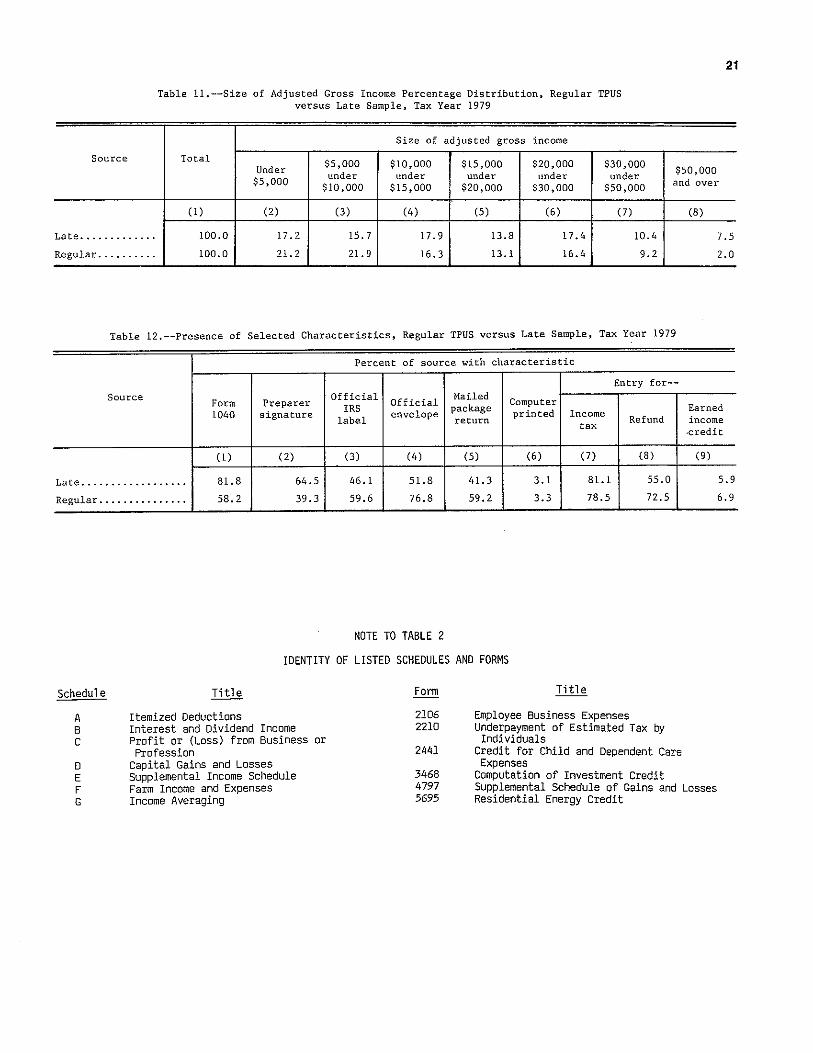
Source
Table 11.--Size of Adjusted Gross Income Percentage Distribution, Regular TPUS versus Late Sample, Tax Year 1979
Size of adjusted gross income
Total $5,000 $10,000 $15,000 $30,000 Under $20,000
21
$50,000 under under under under under $5,000 $10,000 $15,000 $20,000 $30,000 $50,000 and over
(1) (2) (3) (4) (5) (6) (7) (8)
Late •............ 100.0 17.2 15.7 17.9 13.8 17.4 10.4 7.5
Regular .•.•...... 100.0 21.2 21.9 16.3 13.1 16.4 9.2 2.0
Table 12.--Presence of Selected Characteristics, Regular TPUS versus Late Sample, Tax Year 1979
Percent of source with characteristic
Entry for--Source Form Preparer Official
Official Mailed Computer
1040 signature IRS envelope package printed Income Earned
label return Refund income tax
.credit
(1) (2) (3) ( 4) (5) (6) (7) (8) (9)
Late ..•......•..•..... 81.8 64.5 46.1 51.8 41.3 3.1 81.1 55.0 5.9
Regular .......•....... 58.2 39.3 59.6 76.8 59.2 3.3 78.5 72.5 6.9
NOTE TO TABLE 2
IDENTITY OF LISTED SCHEDULES AND FORMS
Schedule
A B c
0 E F G
Title
Itemized Deductions Interest and Dividend Income Profit or (Loss) from Business or Profession
Capital Gains and Losses Supplemental Income Schedule Farm Income and Expenses Income Averaging
2106 2210
2441
3468 4797 5695
Title
Employee Business Expenses Underpayment of Estimated Tax by
Individuals Credit for Child and Dependent Care Expenses
Computation of Investment Credit Supplemental Schedule of Gains and Losses Residential Energy Credit

Unincorporated Businesses for 1979
By Robert A. Wilson•
Income Year 1979 saw new records established by the Nation's unincorporated businesses. The number of sole proprietorships and partnerships grew to 13.6 million and the receipts they reported amounted to $746.0 billion. Below is a comparison of the number of businesses and their receipts for 1978 and 1979.
Unincorporated businesses
1978 1979 ~mber (thousands)
Total. ............. . Sole proprietorships .. . Partnerships .......... .
13,252 12,018 1,234
13,629 12,330
1,300
Total receipts (billions)
Total. ............. · Sole proprietorships ••. Partnerships ......•....
$662.5 443.4 219.2
SOLE PROPRIETORSHIP ACTIVITY
$746.0 487.8 258.2
The first detailed statistics from business schedules attached to individual income tax returns for Income Year 1979 show that there were aver 300,000 more sole proprietorships in operation than there were for 1978. Businesses engaged in providing services, in particular business services, led the way with an increase of more than 180,000. Retailers and real estate agents, brokers and managers also showed increases over the year before: 77,000 and 76,000, respectively. For sOme activities, there were declines, however. Farming, manufacturing and wholesaling each dropped off in terms of the number of businesses.
The table below by industrial division compares the number of businesses in 1979 with 1978. Retailers and real estate proprietorships are also shown.
Sole Proprietorships by Industry
Number (thousands)
Industry
Total Agriculture, forestry and !i:hing .................. .
M1n1ng .................... . construction .............. .
Manufacturing ............. . Transportation and utilities Trade ..................... .
Retail trade ..••..•.•...
Finance, insurance and real estate ................... .
Real estate ............ . Services .................. . Not allocable .•..••.•..•...
1978
12,018
3,387 82
1,069
241 413
2,334 1,908
984 738
3,473 36
' 12,330
3,263 97
1,097
236 415
2,455 1,986
1,058 . 805
3,654 55
Business receipts, which, for the most part, comprised the gross receipts from sales and operations, approached $500 billion for 1979. All industrial divisions shared in the $45 billion increase over 1978, with the exception of construction where a slight decline occurred. Receipts for 1979 and for recent prior years are presented below. The amounts for business receipts and, later on in this discussion, for other amounts as well, are in "current dollars11 for the years involved and, therefore, are not adjusted for the effects of inflation.
Business receipts (billions)
Annual Increase
1979 ......•.... 1978 ......... .. 1977 .......... . 1976 .......... . 1975 .......... .
$487.8 443.4 393.9 375.0 339.2
10.0% 12.6 5.0
10.6
The overall profits of sole proprietorships were at a record high for 1979 at $60.8 billion, up slightly from the 1978 previous record of $59.0 billion. As shown in the following 2-year comparison, about twothirds of all firms reported a profit for 1979 (amounting to $80.3 billion), while the remaining third reported a deficit (amounting to $19.5 billion).
Sole Proprietorships
Total. .................. . With net income ........... . Without net income ........ .
Total .. · ........ · ...... .. With net income ........... . Without net income ........ .
1978 1979 NUiiiber (thousands)-
12,018 8,255 3,763
12,330 8,331 3,999
Net income (billions)
$59.0 75.3
-16.3
$60.8 80.3
-19.5
The increase in profits for 1979 was dampened by the continued increase in the deduction for interest paid on business indebtedness, up by nearly 25 percent over the year before, from $10.9 billion to $13.6 billion. In large part a reflection of the rise in interest rates, more than half of the total aeduction was reported for farm businesses.
Around 45 percent of the interest deduction for 1979 (as well as for 1978) was reported by businesses that operated at a loss. While the average interest deduction reported by businesses operating at a profit was under $900 for 1979, the average for those that operated at a loss was about $1,550. Figure A shows the trend in profits and in the deduction for interest paid beginning with 1970.
PARTNERSHIP ACTIVITY
The number of partnerships filing returns for Income Year 1979 was over 65,000 more than for 1978, according to initial statistics for the year. The
*Chief, Planning and Review Staff. Technical assistance was provided by Patrick Piet (partnerships) and Raymond Wolfe (sole proprietorships), Business and Pension Statistics Section. 23
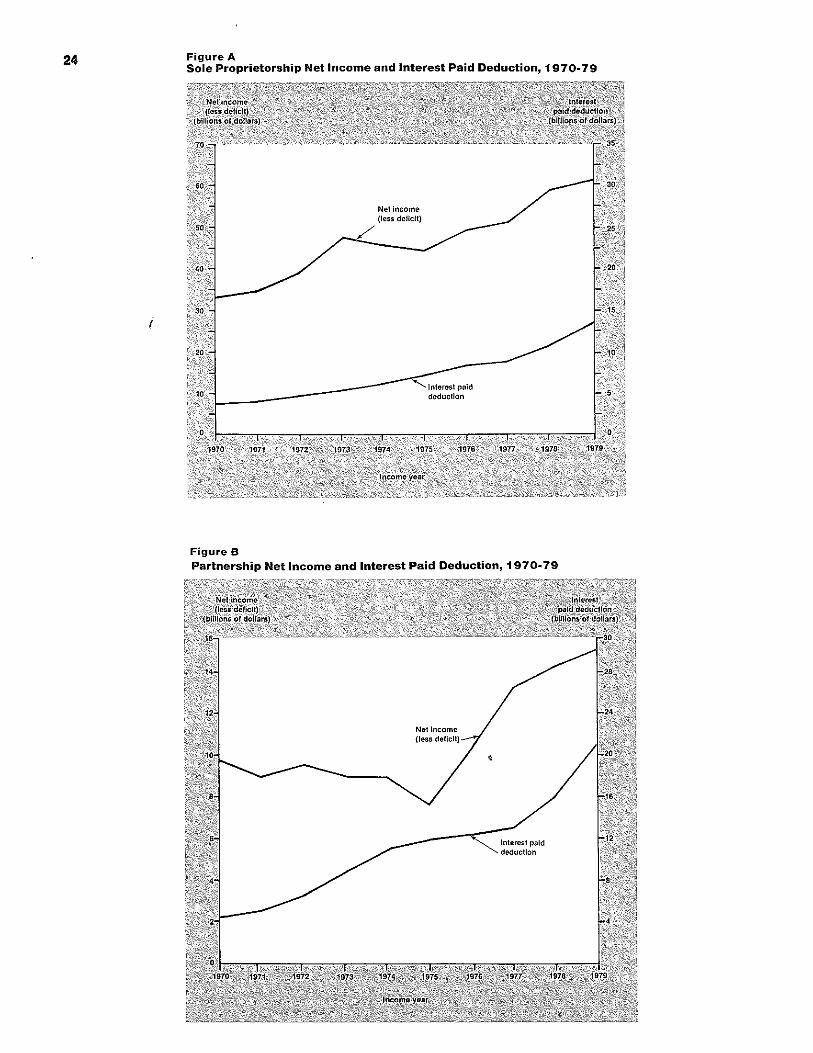
24
i
Figure A Sole Proprietorship Net Income and Interest Paid Deduction, 1970-79
Figure B
Net income (less deHc!l)
Partnership Net Income and Interest Paid Deduction, 1970-79
Net Income (less

numbers by industrial division were more or less stable in comparison to 1978, except for finance, insurance and real estate. The increase for this division was almost equal to the total increase in partnerships. Within the finance division, the increase can be further pinpointed to real estate and, within real estate, to operators and lessors of buildings. Counts of partnerships by industrial grouping for 1978 and 1979 are presented in the following table:
Partnerships by Industry
Number (thousands)
Industry 1978
Total ................... 1,234 Agriculture, forestry and
fishing . • . . • . . • . • . . . • . • • . 127 Mining . . . . . . . . . . . . . . . . . . . . 24 Construction .............. 78
Manufacturing ............. 28 Transportation and utilities 20 Trade . . • . . • . • . • . . . • . • • • . • . 200
Retail trade • • • • . • • • . • . 170
Finance, insurance and real estate . . . • . • . • . . . • . • . • . • . 516
Real estate • . • . • .. • • . . • • 391 Services . . . . . . . . . . . . . . . . . . 241
1979
1,300
125 28 75
30 20
205 173
577 431 239
Unlike sole proprietorships, partnerships are required to report investment income (with certain exceptions), in addition to their gross receipts from sales and operations. (In the case of sole proprietorships, such income was attributed directly to the owner and, therefore, was not considered to be income from the business). Investment income was usually incidental to the principal business activity of the partnership. However, for partnerships classified in finance, insurance or real estate, investment income often represented the major operating income of the business. Therefore, to facilitate economic analysis, the data below summarizing operating receipts for 1975-79 include investment income for returns classified in the finance division, in addition to the regularly-defined 11business receipts 11 shown in Table 2.
Income Year
1979 ...•..• 1978 ..••... 1977 ...•.•. 1976 ..•..•. 1975 ••.•...
Receipts from Operations (billions)
$253.0 214.9 176.5 157.6 146.0
Annual Increase
17.7% 21.8 12.0 7.9
The increase in receipts over 1978, about 18 percent overall, was evident in all industrial divisions. It was particularly so in mining, dominated by oil and gas extraction, where receipts rose by 48 percent. Notable increases were also reported for partnerships classified in trade (from $52.9 billion to $58.2 billion), services (from $43.5 billion to $49.7 billion), and especially in finance, insurance
25
and real estate (from $62.8 billion to $76.3 billion). In the latter division, real estate partnerships accounted for most of the increase (from $42.3 billion to $51.8 billion). Within real estate, operators and lessors of buildings were the major reason for this increase; receipts for them went fr.om $31.7 billion for 1978 to $38.8 billion for 1979.
Partnership profits for 1979 topped $15.2 billion which, as Figure B shows, was the highest on record. While the number of firms reporting a net income for the year increased only slightly over 1978, total net income reported increased by 19 percent. Deficits reported by partnerships without net income, however, increased by 29 percent, partly reflecting the sharp rise in the number of firms with deficits for 1979.
Partnerships
Total ................. .. With net income··········· Without net income········
Total .................. . With net income · · · · · · · · · · · Without net income········
1978 1979 Nuiiiber ( thousalidsl
1,234 762 472
1,300 766 534
Net income (billions)
$14.5 33.7
-19.2
$15.2 40.0
-24.8
The presence of significantly large amounts deducted for interest paid on indebtedness was notable, just as it was for sole proprietorships, with the deduction itself up by nearly a third over the year before, from $16.0 billion to $21.3 billion. Unlike sole proprietorships though, operators and lessors of buildings accounted for most of the deduction as well as for most of the increase over 1978. Also unlike sole proprietorships, most of the total amount deducted (64 percent) was due to partnerships without net income, thus contributing in large part to the 29 percent deficit increase noted above. An indication of the effect of the deduction for interest paid on partnerships is the size of the average interest deduction reported by partnerships without net income ($25 ,597), in contrast to the average for partnerships with net income ($9,934).
In addition to showing the trend in profits, Figure B shows how the deduction for interest paid increased over the 10-year period ending with 1979.
BASIC TABLE INFORMATION
Table 1 provides selected income and deduction data for detailed industry groupings for sole proprietorships; separate data are presented for businesses with net income. Table 2 presents detailed income statement data for summarized industry groupings for partnerships; separate data are also presented for businesses with net income.
Information on the samples used for the statistics, on sampling and nonsampling error, and on definitions and law changes may be found immediately following Table 2.
Additional 1979 information about these two legal forms of business will be included in Statistics of Income--1979-80, Sole Proprietorship Returns, and Statistics of Income--1979, Partnership Returns. These reports will also include complete definitions of terms and discussions of data limitations.

Table 1.-Sole Proprietorship Businesses: Business Receipts, Selected Deductions, and Net Income, by Industry. I
[All figure tes based on samples-mona 1nts !hOI ds of dollars] re est' . --- -- ····-
Businesses wilt\ and Wllt\out net 1ncomo
Industry Number of Business Tnxes pa1d Interest Nut income Number or Busmess businessm> receipts 0Cf)focinl~n deduction pa1d Payroll {I~ businesses recelpls daflcjl)
'" '" "' ,,,
'" "' '" '"' '" AU Industries ...........•.............•.................................... . 12,329,98 2 487,607,38 24,170,602 9,903,00 5 13,629,18 4 42,366,14 9 60,756,789 8,330,81 8 408,773,03
All nonfarm Industries .............................•..•..........•. 9,343,60 3 395,669,59 12,929,133 7,484,662 6,366,472 38,281,64 2 56,528,403 6,753,606 342,751,75 AgriCulture, forestry, and fishing .....•.....•.•..•..•..•.........•..•...... 3,262,59 !I 98,568,11 2 11,756,794 2,543,391 7,419,463 5,055,952 5,225,460 1,743,37 5 71,429,443
Farms, tota! . 2,986,379 92,137,791 11,241,466 2,418,343 7,242,712 4,084,507 4,230,385 1,577,012 66,021,277 Field crop .. ............... 1,337,958 36,924,075 5,309,980 1,279,725 3,139,959 1,569,698 4,674,401 886,651 26,577,729 Vegetable and melon .. 45,617 2,158,362 205,660 64,081 140,465 274,891 6,589 18,934 1,222,240 Fruit and tree nut .......... 79,654 2,405,065 262,267 92,669 t68,904 424,463 179,922 43,165 1,749,699 Horticullural specialty .. ...... 15,060 301,639 30,146 12,626 20,701 60,764 -6,860 7,766 209,050 Beef came feedlots .. 2,650 t,026,466 19,979 4,026 30,162 11,477 -9,321 1,964 649,600 Bee! cattle, except leedlots ... ............. , .. 661,086 23,595,014 2,230,866 447,476 1,766,532 679,092 -587,654 281,635 15,924,600
Hogs, sheep, and goats .. 241,994 6,841,245 813,508 140,493 523,110 170,772 -223.530 66,705 4,493,647 Dairy !arms .. 174,331 11,342,153 t,550,645 222,2t7 914,410 612,958 1,077,772 129,017 8,637,176 Poultry and eggs ............................... ::::::·· ....... 42,895 1,935,631 169,895 21,359 102,710 97,466 92,669 26,107 1,276,875 General livestock, oxcopt animal specialty . ....... 79,924 4,166,460 276,031 44,025 250,815 74,215 -23t,593 23,399 2,363,290 Animal specially ..... 93,486 593,257 156,735 15,926 55,599 45,366 -377,616 14,169 274,965 Farms not allocable ...... .. .... 211,524 646,202 215,753 73,497 107,324 43,126 -363,994 53,300 640,205
Farms, operators only, total . 2,578,70 87,559,507 t0,686,469 1,987,003 7,056,665 4,014,072 2,273,909 1,235,076 61,9t4,925 Field crop .. . ............. 1,004,929 33,216,370 5,051,554 923,651 2,998,773 1,551,046 2,918.606 599,g57 25,102,611 Vegetable and melon .. .. ........ 44,120 2,145,268 204,316 63,367 140,267 274,650 172 17,442 t,209,193 Fruit and tree nut .. 76,231 2,342,845 259,065 91,125 t86,993 409,300 156,806 41,970 1,696,t52 Horticultural specialty .. .. ..... t3,435 286,603 23,257 12,328 19,652 60,784 -7,376 6,141 196,014 Beef ca!Ue feedlots .. 2,650 1,028,466 19,979 4,026 30,162 11,477 -9,321 1,964 649,600 Beef cattle, except feedlots ................ . ..... 649,53 23,363,65 2,214,601 437,080 1,759,991 674,752 --634,507 272,26 t5,791,95
Hogs, sheep, and goats ..... 236,529 6,674,776 806,765 128,396 522,292 t69,922 -231,626 64,631 4,419,509 Dairy farms .. 172,362 11,276,526 1,539,375 2t7,914 900,067 611,207 1,070,144 127,396 8,596,756 Poutlry and eggs ................................. 42,197 1,930,332 166,45t 20,278 102,555 97,319 93,267 26,100 1,276,763 General livestock, except animal specialty .... .............. 79,915 4,159,129 276,011 44,025 250,589 74,21 -231,79 23,390 2,355,93 Animal specialty ................... . .................. 92,094 581,410 155,663 15,6g9 55,521 44,409 -383,496 12,621 263,682 Farms not allocable .. 164,491 532,119 t65,431 26,913 86,004 34,992 ------466,962 20,996 354,750
Farms, landlords only, total .. 407,670 4,578,263 354,979 431,340 183,847 70,435 ~:~;~:~~ 341,936 4,106,351
Field crop ...... ................. 333,029 3,707,705 258,42 356,074 141,186 38,85 266,894 3,475,11 Vegetable and melon ................ t,497 t3,094 1,344 714 '219 "240 6,417 t,492 t3,048 Fruit and tree nut ....... 3,423 62,221 3,202 1,764 t,911 t5,163 23,117 1,195 53,548 Horticultural specially .. '1,625 '13,036 "6,869 "296 '1,050 - '496 '1,625 '13,036
Baef catt!e feedlo!s ....... - - - - - - - -. -Beef cattle, except feedlots ..... 11,550 211,356 16,267 10,395 8,540 4,340 46,653 9,369 132,843
Hogs, sheep, and goats .. 5,465 166,467 4,744 12,097 "819 '650 8,098 '4,074 '74,138
Dairy farms .. 1,949 65,624 11,270 4,304 '6,343 '1,751 7,628 1,621 40,420 Poultry and eggs ..................................... '69 "5,49 "1,4-44 '1,06 '154 '147 '-596 '7 '111
Genera! livestock, except animal specialty .. '9 '7,351 '20 - "226 - "199 '9 '7,351
Animal specialty .. . .......... '1,392 "11,848 '1,051 ., '76 '956 '5,660 '1,346 '11,264
Farms not allocable .. . .......... 47,033 314,063 50,323 44,564 2t,320 8,134 t02,968 32,302 285,456
Agricultural services ........ 199,260 4,763,659 342,73 102,64 t39,119 768,768 642,875 119,435 4,014,064
Veterinary services ... 16,151 1,066,731 44,767 24,06 29,476 163,364 312,032 13,592 993,503 Livestock breeding ......................................................... 10,159 96,6t6 13,054 1,019 5,064 1,490 -22,272 2,293 81,064 Animal services, except livestock breeding and veterinary ... 52,536 637,764 70;90t 12,983 33,358 63,750 -74,52t 19,385 466,330
landscape and horticultural services .. 84,092 1,665,935 111,527 35.419 24,779 269,393 325,530 61,666 1,402,356
Other agricultural services .. 36,320 1,274,611 102,465 29,136 46,439 250,771 102,106 22,299 1,066,811
Forestry .. 11,823 t85,t70 15,817 5,02 5,454 22,715 16,488 5,332 136,120
Rs!1ing, hunting, and trapping .. 65,137 1,481,294 156,775 17,373 32,196 179,962 335,711 4t,596 t,257,963
Mining ................................................................................... 97,488 6,084,218 400,916 224,02 204,421 325,036 90,45 48,690 4,616,215
Metal mining . 4,702 27,750 3,546 783 793 1,887 --83,602 347 20,636
Coat mining .... .. .. 3,922 466,363 59,131 15,924 17,653 76,871 -30,142 1,124 266,152
Oi! and gas extraction .... . ............... 65,735 5,319,929 316,742 t96,817 178,147 207,215 218,532 45,894 4,t24,206
Nonmeta!ric minemts, except fuels .. • ............. _:_:__:_j__ 3,129 268,157 21,498 8,504 7,828 39,062 -14,336 1,325 203,220
Footnolos at end of table.
Businesses with nel Income
Taxes paid lntemst Oilprcciation deduction paid Payroll Net .ncome
(10) (11) (12) (13) (14)
15,435,186 7,524,184 7,414,19 5 34,664,36 4 60,277,325
8,873,347 5,959,592 3,915,39 7 32,243,97 5 67,076,636 6,669,904 1,661,159 3,591,42 3 3,256,34 0 14,633,895
6,561,639 1,564,592 3,498,797 2,420,389 13,198,687 3,464,896 g12,524 t,647,561 1,036,575 7,593,046
85.237 23,616 41,391 137,730 192,050 125,762 57,566 50,361 262,933 490,534 21,067 5,064 10,Q15 38,014 35,207 12,266 1,505 16,085 5,493 44,3~2
1,057,654 244,958 830,234 314,749 2,020,997
439,669 84,465 206,124 76,195 607,030 1,096,717 162,124 540,665 434,412 1,457,768
100,834 11,905 56,520 55,519 228,t08 109,105 17,932 71,416 29,376 206,174 22,287 3,214 5,053 15,768 66,133 26,322 3g,698 21,352 9,60t 257,266
6,317,969 1,192,645 3,400,179 2,372,653 t1,048,295 3,266,763 597,112 1,564,292 1,010,525 5,735,622
83,923 22,912 41,238 137,491 165,539 t23,539 56,028 49,425 24g,a54 465,316 14,178 4,766 6,965 36,014 34,709 12,266 1,505 16,065 5,493 44,342
1,049,767 238,39 627,069 3t3,44 1,955,972
436,567 74,562 206,109 77,502 596,003 1,090,666 158,515 539,732 434,267 1,446,116
t00,803 11,894 58,516 55,51 228,082 t09,06 17,~~! 71,19 29,37 205,975 21,423 3,192 4,976 14,942 60,1t9
9,008 5,629 12,562 6,219 86,296
243,849 371,947 96,618 47,736 2,t50,392 196,135 315,413 . 83,269 28,050 1,657,224
1,314 704 "t53 '240 6,540 2,223 1,540 '937 '13,079 25,216
'6,889 '296 '1,050 - '498 - - - - -
7,667 6,559 3,145 1,300 65,025
"3,122 '9,923 '15 '693 "9,027 6,049 '3.609 '953 '146 t1,650 ., ., ., - '26 ., - '226 - '199 '864 '21 '77 '846 '6,0t4
17,314 33.669 6,790 3,383 166,972
208,575 81,359 76,502 665,348 972,755 36,964 21,373 17,705 t40,566 320,144
2,264 "' 1,260 ·sos 17,328 21,742 7,413 12,442 63,407 68,127 77,277 26,763 t4,105 233,662 364,106 68,308 23,395 30,971 226,907 163,049
7,160 2,895 973 14,510 40,369 92,331 12,3t4 15,t51 156,093 422,085
233,997 156,261 86,82 206,028 1,066,922 '747 '376 '210 ·sao 7,522
25.297 7,127 4,659 32,166 24,482 t95,257 142,651 78,166 145,535 1,004,033 12,696 5,906 3,767 27,445 30,864
"" "'
"' 0 ii , 0 , ::!. CD
8' iil ::r .;;· ::0 !2. r:: ~
" re. ~
<D
"' <D

Table 1.-Sole Proprietorship Businesses: Business Receipts, Selected Deductions, and Net Income, by Industry-Continued [A!I ligures are estimates based on samples-money amounts are in thousands of dollars} -
Businesses with and with<:lut net income Businesses with net income
Industry Number or Business Taxes p<~id Interest Net ir>CQme Number of Business Ta><es paid Interest businesses mceipts DeprecLation deduction paid Payroll (less businesses rece•pts Oepreciahon deduction paid deficit)
"' ,,,
'" "' 151 '" ,,, '" "' (10) (11) (12)
Construction ........................................................................ 1,097,41 7 50,942,938 1,722,012 882,504 761,750 a, 103,729 7,947,840 933,457 45,209,490 1,318,039 745,596 543,597
General building contractors and operative builders . 233,779 19,351,815 393,896 264,719 355,006 2,841,027 1,964,180 187,261 16,592,851 303,124 213,554 235,002 General building contractors .• 230,423 18,550,700 383,478 253,467 317,681 2,776,962 1,918,625 184,641 15,969,385 295,315 206,314 211,329 Operative buildars .. 3,356 801,115 10,418 11,252 37,326 64,066 45,554 2,620 623,466 7,809 7,240 23,673
Heavy construction contractors . 27,723 1,757,002 173,731 42,829 43,682 297,238 179.857 18,466 1,359,755 110,892 31,467 27,292 Highway and street constroction. 8,320 746,521 77,434 18,186 15,993 131,945 28,783 4,547 541,522 39,007 12,167 8,044 Heavy construction, except highway .. 19,403 1,010,481 96,297 24,643 27,690 165,293 151,073 13,919 818,234 71,885 19,300 19,248
Special trade contractors .......... 787,396 28,185,647 1,105,463 543,146 337,221 4,759,095 5,530,334 687,479 25,858,996 874,384 479,793 262,268 Plumbing, heating, and air conditioning .. 74,984 4,686,585 126,909 100,267 43,550 741,304 616,109 60,277 4,119,776 100,849 8>1,350 33,225 PainUng, paper hanging, and decoraling. 119,536 2,794,157 74,160 64,109 24,010 605,920 710,690 105,225 2,603,754 63,265 59,768 17,894 Elec1rical work .. 55,313 2,546,270 75,044 55,716 23,062 416,246 425,189 47,054 2,262,242 62,131 46,336 19,683 Masonry, stonework, tile setting, and plastering . 91,803 4,171,934 93,382 68,473 20,351 920,570 841,443 84,533 4,028,924 84,363 66,485 18,790
Carpen1ering and llooring .. 239,736 4,662,074 123,078 54,495 47,570 592,575 1,403,776 222,931 4,405,071 108,166 49,535 39,700 Roofing and sheet metal work .. 42,743 1,766,665 46,759 27,402 15,660 308,056 343,421 38,358 1,661,490 38,>137 24,633 11,277 Concrete work .. 22,327 1,361,767 52,819 28,924 14,513 272,659 184,901 18,821 1,227,629 44,533 24,477 12,730 Water well drilling ............ 7,133 353,509 29,789 7,431 6,289 44,941 64,894 5,022 331,109 21,046 6,790 5,124 Miscellaneous special trade con!rac!ors .. ......... 133,821 5,820,488 463,504 136,329 142,215 854,824 939,712 105,258 5,199,002 351,573 117,399 103,647
Contractors not allocable .. 48,519 1,646,474 48,921 31,810 25,841 206.370 273,470 40,251 1,397,887 29,639 20,783 19,034
Manufacturing ....................................................................... 235,52 6 12,928,527 702,296 314,644 228,781 2,240,025 1,512,431 151,128 10,941,164 493,909 256,495 146,422
Food and kindred products. 4,303 1,074,563 25,163 12,311 8,618 100,448 45,394 3,202 921,969 21,079 10,947 6,634 Textile mill products .. 2,274 129,509 3,705 4,117 '2,218 '21,189 " 1,216 49,075 "673 '598 '160 Apparel and other textile products ... 10,413 560,550 9,704 25,065 3,987 213,174 59,686 8,441 486,158 6,159 23,574 2.360 Lumber and wood products, except furniture .. 66,559 3,611,004 278,475 76,969 88,065 540,143 381,102 46,611 3,041,265 210,564 63,846 58,899 Furniture and fixtures .... 5,89 355,561 11,423 .,, 3,77 62,911 44,55 3,454 345,464 10,23 7,95 3.361
Printin-g, publishin-g, and allied induslries .. 53,484 2,806,322 147,929 78,742 38,140 528,518 357,997 34,257 2,432,029 92,212 64,297 25,994 Chemicals and allied products .. 1,344 184,687 5,463 3,164 2,6-48 19,765 14,616 1,025 161,347 '3,419 '2,525 "1,757 Leather and leather products .. '455 "7,891 "166 "220 . ., '1,906 '236 '243 '6,667 ., '191 "16 Stone, clay, and glass products .. 15,059 479,930 23,481 13,109 8,432 58,170 17,097 5,587 320,784 11,518 8,677 3,350 Primary metal industries .. ....... 1,405 138,747 4,400 2,530 "1,986 17,387 29,036 1.0S2 126.478 3,224 1,933 "1,375
Fabricated metal products ... 8,744 546,562 21,352 16,811 8,868 106,525 87,328 6,631 439,911 16,871 t1,269 5,159 Machinery, except electrical .. 21,999 1,437,846 96,373 39,558 30,119 342,176 290,852 14,812 1,327,483 75,923 35,879 21,824 Electrical and electronic equipment .. 6,319 301,384 16,516 7,906 10,852 51,570 18,879 3,252 215,919 11,825 3,194 4,351 Transportalion equipment .......... 2,939 218,586 7,621 6,471 4,221 25,552 --4,623 1,435 147,838 3,257 5,892 1,664 Other manufacturing industries ... 31,119 925,986 42,052 15,883 13,812 126,332 155,945 17,963 815,036 21,372 13,822 7,310 Manufacturing not allocable .. 3,214 129,200 8,474 3,715 2,977 22,261 \4,304 1,937 103,740 3,519 1,895 '2,207
Transportation, communlcallon, electric, gas, and sanitary 1,741,726 1,748,440 295,192 14,592,510 1,195,506 services ............................................................................. 415,47 2 18,069,893 547,807 563,272 1,956,999 411,277 373,239
local and interurban passenger !ransit.. 50,892 941,666 73,172 29,519 18,324 156,523 176,324 40,345 815,261 59,977 24,230 15,495 Taxicabs ... 36,807 460,699 24,677 12,765 6,053 45,201 107,250 29,720 420,359 20,219 11,093 5.608 Other passenger !ransportation .... 14,085 460,967 48,494 16,754 12,272 111,321 69,074 10,625 394,902 39,758 13,137 9,887
Trucking and warehousing .. 292,336 14,253,843 1,449,103 466,984 463,397 1,289,225 1,605,174 214,568 !1,438.017 1,028,751 347,435 320,659 Trucking, local and long distance .. 290,321 14,031,550 1.438,296 463,410 456,305 1,270,085 1,590,121 213,230 11,272,945 1,023,159 344,868 316,189 Public warehousing and trucking terminals ... 2,017 222,293 10,605 3,574 7,093 19,139 15,052 1,338 165,072 5,592 2,566 4,470
Water transportation .. 6,572 262,575 50,873 3,621 26,627 16,395 20,277 3,231 195,718 13,435 2,162 6,288 Air transportation .. 7,676 204,225 38,436 3,516 16,607 8,675 -15,645 4,278 147,413 14,662 1,905 8,1-29 Transportation services .. . ...... ) .. 21,886 1,395,825 30,151 14,376 14,491 113,732 47,747 13,974 1,075,853 15,205 10,450 4,203
Passenger !ransportation arrangement .. 15,581 994,672 7,712 10,606 7,852 81,871 20,188 9,746 725,328 4,181 7,414 1,553 Freigh! transportation arrangement .. 1,387 95,209 3,614 1,324 1,507 "3,617 13,157 836 89,289 '1,175 '983 '141 Other transportation services ... 4,918 305,945 18,825 2,446 5,133 28,243 14,402 3,392 261,236 9,849 2,053 2,510
Communication . 5,159 174,076 27,962 6,328 4,220 42,856 12,368 3,522 162,013 10,766 3,839 2,062 Electric, gas, and water services .. 1,764 191,203 5,398 2,517 1,542 '14,608 12,205 1,537 188,345 4,874 2,485 '1,355 Sanitary services ... -
27,185 646,480 66,631 20,946 18,065 106,426 98,549 13,737 569,886 47,835 18,771 15,048
Footnotes at end 01 table.
Payroll
(13)
6,956,712
2,315,543 2,258,751
56,792
212,155 97,627
114,528
4,259,610 624,769 549,111 347,431 876,655
546,434 274,990 230,463
41,762 765,756
169,404
1,848,716
85,005 "4,668
174,386 435,606
61,26
431,6-45 '16,739
"1,906 41,298 14,038
86,752 319,752
26,235 20,290
113,006 "16,124
1,356,158
133,135 '42,072 91,063
968,596 954,22t
14,374
13.153 5,353
80,435 52,269 '3,139 25,027
40,262 .14,560 100,645
Net mcome
(14)
8,706,79
2,298,91 2,236.61
62,3€
247,\C 64,0'
183,0{
5,856,3" 684,1( 739,6; 451,6( 856,5f
1,452,3( 357,3{ 193,91
77,9: 1,042,61
304,31
1,890,4i
60,9! 5,5!
72,0( 465,1•
48,5(
439,81 22,11
"4j 43,5• 29,9:
95,8( 314,01
44,8! 19,8:
204,7• 23,1:
2,616,51
200,7( 119,0{ 61,6:
2,046,9( 2,025,4•
21,4!
74,7' 20,3• 95,0: 56,8; 15,5; 20,51
41,01 12,3•
0
,, ,g ,,
6
5 ,, 0
125,44-
en 0 iD , i3 "tl ~
~ iil ;;r -;;· ll 1 c: ~
" "' ..... ~
!!]
"'
N ....

Table 1.-Sole Proprietorship Businesses: Business Receipts, Selected DeduCtions, and Net Income, by Industry-continued [All fir:JUres are estimates based on samples--money amounts are in thousands of dollars]
Bus'rnasses with and without net income Sus·rnessos woth net income
Industry Number of Business Taxes paid fntwest Net income Number ol Business Taxes paid fnlerost businesses •eceipls Depreciation deduction paid Payroll (loss businesses receipts Oi:precrahon deductron pard deficit)
"' '" '" '" "' (6) "' "' '" (10) (1t) (12)
Wholesale and retail trade ............................................... 2,454,720 195,654,64 2,916,906 3,266,452 1,798,57 7 12,681,765 11,173,789 1,515,131 167,175,15 2,107,764 2,624,360 1,216,109
Wholesale trade ......................................... 314,727 43,800,602 526,608 392,628 301,604 1,573,101 3,194,048 236,768 38,180,874 416,877 338,615 220,226 Motor vehicles and automotive equipmant • 12.962 2,426,756 17,881 27,103 15,326 125,521 165,463 10,899 2,134,274 16,326 24,273 13,188 Lumbar and construclion materials .. 6,886 1,043,018 25,669 16,169 14,363 74,063 77,913 5,397 942,925 23,105 14,943 12,129 Electrical goods .. 11,316 898,875 15,959 12,462 7,664 62,796 118,528 7,413 781,649 10,381 8,881 4,834 Hardware, plumbing, and heating equipment.. 9,097 893,374 16,479 12,688 5,901 50,583 114,379 7,429 796,417 15,075 11,337 4,962 Farm machinery and equipment.. . .. ... 7,822 2,337,563 22,721 20,204 25,606 113,277 94,629 5,842 1,976,042 17,553 17,477 20,160
Other machinery. equipment, and supplies ... 27.66 2,601.409 59,241 36,754 31,99 200,71 306,856 21,799 2,604,39 51,94 33,144 23,784 Other durable goods .. 55,920 4,886,861 78,817 35.780 46,655 183,661 552,287 39,193 4,476,690 61,184 30,635 36,077 Drugs, chemicals, and lollied products .. t0,453 699,963 9,430 3,256 3,262 11,886 83,925 6,150 554,442 7,782 2,530 1,766 Apparel, piece goods, and nolions .. 13,968 628.707 5,043 3,824 2,907 18,579 141,351 10,812 566,403 4,215 2,986 2.206 Groceries and related products .. 37,055 7,258,230 74,85 44,40 34,50 272,768 371,198 29,807 6,382,679 60.09 33,916 21,976
Farm-product raw materials .. 10,840 7,478,065 36,354 10,490 32,686 58,678 84,959 8,350 5,777,516 25,092 8,350 20.102 Alcoholic boverages ........... 1,516 651,667 9,505 5,739 4,969 35,589 30,660 1,017 613,367 6,426 4,425 2,619 Other nondurable goods ... 54,911 9,537,110 118,346 145,872 64,009 295,671 454,045 38,743 8,533,942 89,455 130,424 46,312 Wholesalers not allocable .. .. ... 54,312 2,259,003 36,312 17,880 11,753 69,313 597,857 43,917 2,040,133 28,242 15,493 10,110
Retail trade .. 1,985,755 146,100,911 2.258,775 2,787,829 1,444,133 10,793,298 7,341,923 1,178,955 124,150,636 1,609,788 2,219,322 959,897 Building materials, paint, hardware, garden supply, and mobile
home dealers ............................................. 67,350 7,091,833 144,380 143,827 117,775 559,763 469,085 42,835 6,188,536 103,909 119,074 74,590 lumber and other building ma1erials dealers .. 12,524 2,048,862 40,048 47,871 24,044 186,457 128,277 9,836 1,812,828 32,883 41,781 14,508 Paint, glass, and wallpaper stores .. 8,879 773,093 13,279 15,492 7,838 101,573 62,328 6,591 698,500 11,276 14,609 6,622 Hardware stores • 17,704 2,102,075 33,675 33,985 38,159 133,219 164,441 11,949 1,841,566 24,287 27,287 24,840 Relail nurserias and garden supply stores .. 21,765 1,102,750 30,919 23,136 10,776 101,840 68,156 10,267 945,534 21,061 18,255 6,878 Mobile home dealers .... 6,478 1,065,052 26,458 23,343 36,958 36,673 45.883 4,192 890,110 14,403 17,142 21,743
General merchandise stores .. 28,303 3,656,999 43,190 51,979 34,255 172,337 178,526 19,316 3,240,312 35,200 45,144 30,778
Variety stores ... 5,262 524,023 5,991 7,903 4,648 42,220 43,331 3,732 493,517 4,705 7,191 4,133
Other general merchandise stores .. 23,041 3,132,976 37,199 44,076 29,607 130,117 135.194 15,584 2,746,795 30,495 37,953 26,645
Food stores .. ~~u~~ 27,096,966 323,976 370,114 188,907 1,543,207 1,011,956 123,309 23,071,907 241,881 304,945 127,101
Grocery stores ...... 22,170,113 230,76 297,421 148,370 1,122.221 706,472 80,001 18,859.057 173,091 245,910 100,818 Meat and fish markets, including freezer provisioners . 13,417 1,543,149 20,729 15,082 11,853 89,679 65,219 9,453 1,228,180 15,828 10,442 7,326
Fruit stOfes and vegetable markets .. .. ...... 10,324 711,377 9,775 6,069 3,680 32,692 37,839 7,025 633,735 7,617 4,776 2.860 Candy, nut, and confectionery stores .. 5,873 297,965 5,054 4,417 1,421 12,535 14,054 4,378 269,401 4,025 4,015 "532
Dairy products stores ... ............... 6,054 697,642 15,371 10,90 8,76 54,353 35,885 4,176 560,34 9,443 8,497 5,129
Retail bakeries ... .. ... .. . 16,496 963,627 30,982 22,895 11,525 191,521 100,458 11,998 868,706 23,435 18,821 8,257
Miscellaneous food stores .......... . ................ 9,471 713,095 11,298 13,328 3,297 40,205 52,028 6,278 652,463 8,442 12,483 2,178
Automotive dealers and service staliOns .. 219,067 48,886,939 385,454 676,351 314,395 2,471,511 1,935,242 161,261 42,912,515 308,377 574,988 219,689
Motor vehicle dealers - new car dealers (franchised) ..... ,. ... 5,449 3,268,869 14,248 21,873 53,816 144,51 35,27 3,343 2,488,99 9,659 15,95 36,02
Motor vehicle dealers . used cars only ..... 42,493 5,549,975 36,961 48,210 61.324 175,974 119,968 25,726 3,865,653 23,493 30,177 33,369
Auto and home supply stores ... 31,210 3,490,307 60,874 68,388 41,092 303,592 225,961 21,609 3,001,806 46,788 58,533 29,297
Gasoline service stations .. 121,076 34,381,127 235,197 511,636 106,548 1,734,727 1,513,266 100,100 31,682,187 207,225 450,405 87,799
Boat dealers .... . .............. .. .......... 5,933 573,042 11,572 7,699 20,337 41,144 7,905 2,167 372,084 7,323 5,405 10,941
Recreational vehicles .... .. ........................ 3,515 434,623 5,056 2,890 8,621 13,507 -955 2,620 365,317 3,633 2,190 5,183
Motorcycle dealers........................................ . •..•.. 3,073 556,029 4,586 7,691 10,663 36,474 17,153 2,405 510,973 4,052 6,852 8,966
Miscellaneous aircraft and automotive dealers .. 6,318 630,967 16,980 7,564 11,973 21,583 16,652 3,271 425,495 6,202 5,472 8,114
Apparel and accessory stOfes . 71,199 4,652,161 71,715 102,513 61,984 462,961 349,57( 45,152 3,826,327 45,466 77,181 38,497
Men's and boys' clothing and furnishings stores .. 3,844 443,410 3,576 6,454 2,977 39,480 64,717 3,387 430,339 3,477 5,947 2,673
Women's ready·to·wear stores ........... 16,283 1,080,323 19,302 27,933 12,45 112,451 43,013 8,445 817,647 1~:~~ 18,443 6,590
Women's accessary and specially stores .... .... 6,63 213,294 3,528 i::? 3,38 30,85 10,683 4,06 154,669 ., 2,361 '1,362
Children's and Infant wear stores .... 4,489 322.567 5,192 6,258 29,329 16,640 2,283 244,261 3:135 5,442 3,347
Family clothing stOfes ... 13,689 655,366 19,334 22,795 14,172 72,511 27,797 7,161 618,697 6,762 16,990 6,795
Shoe stores .................. 9,449 947,172 7,370 16,409 12,057 96,570 95,163 7,643 851,561 6,302 14,004 9,914
Furril!fS and fur shops ................ "1,074 '91,652 "408 "931 '538 '14,32 '16,71 '998 '84,300 '28 '76 ., Apparel and accessory stores, not elsaw~__r_e classified . 15,736 698,37 13,006 16,011 10,144 65,446 72,645 11,175 624,634 11,012 13.214 7,497
Footnotus at end of table.
~
Payroll
{13)
10,369,330
1,355,176 114,717 69,105 56,888 43,347 98,310
185,518 170,357
10,511 15,223
216,381
45,700 32,989
237,286 58,844
8,761,718
474,501 154,497 90.140
108,147 89,493 32,224
161,220 41,645
119,575
1,271,630 930,408
67,691 30,720
6,376 36.894
162,725 36,814
2,134,969 109,16 119,092 239,691
1,578,398 28,606 10,313 31,881 17,622
347,924 38,072 76.066
'13,77 23,452 42,129 85,493
'13,72 53,211
Not rncomo
(t4)
14,378,969
3,604,376 178,296 81,400
132,412 t21.429 115,631
340,320 611,109 106,628 153,271 407,220
117,264 43,297
564,263 631,836
9,956,190
567,375 149,265 71,479
203,359 96,365 66,908
218,588 45,372
173,216
1,255,361 882,771
89,135 44,477 21,857 42,960
112,725 61,438
2,275,699 52,958
211,291 273,141
1,637,396 28,396 11,921 23,102 37,491
511,793 65,460 92,826 21,808 26,10S 77,756
106,832 '19,883 101,121
"' co
(/) 0 i> , 0 , "· 1 0 iil 2: , JJ
"' ;: ~
::l
"' ..... -"' "" "'
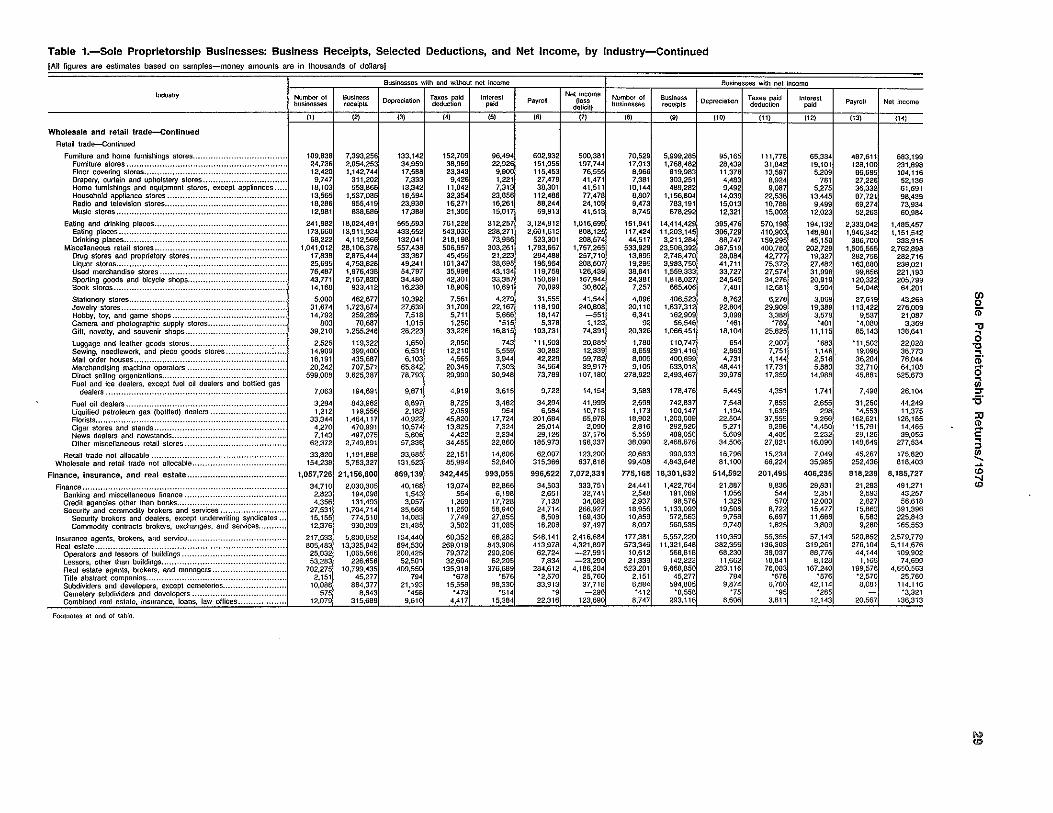
Table 1.-Sole Proprietorship Businesses: Business Receipts, Selected Deductions, and Net Income, by Industry-continued (All figures are estimates based on samples-money amounts are in thousands of dollars!
Businesses with and with-out nat income
Industry Net income
Businesses with net Income
Number ot Business Taxes paid Interest Number of Business Taxes paid lntorost businesses rtx:oipls Dopreciatlon deduction paid Payroll {less businesses receipts Depreciation deduction paid deficit)
"' ,,,
"' '" '" '" ,,, (6) '" (10) (11) (12)
Wholesale and retail trade-Continued
Ratail lrada--Continued
Furnltura and home furnishings stores .. 109,838 7,393,256 133,142 152,709 96,494 602,932 500,381 70,529 5,999,285 95,165 111,778 65,334 Furniture stores ...................... 24,736 2,054,253 34,959 38,969 22,926 151,056 197,744 17,013 1,768,482 28,439 31,842 19,101 Floor covering storas .... 12,420 1,142,744 17,588 2~:~~~ 9,900 115,453 76,555 8,966 819,983 11,376 13,597 5,209 Drapery, curtain and upholstery stores ................................. 9,747 311,202 7,333 1,221 27,479 41,471 7,381 303,251 4,483 8,924 761 Homa furnishings and equipment stores, except appliances .. 16,103 553,665 13,342 11,042 7,313 38,301 41,511 10,144 469,282 9,492 9,087 5,275 Household appliance stores ..... 13,565 1,537,086 16,594 32,354 23,656 112,466 77,476 8,807 1,156,804 14,039 22,538 13,445 Radio and television stores .............. 18,266 955,419 23,936 16,271 16,261 68,244 24,109 9,473 783,191 15,013 10,786 9,499 Music stores ...... 12,961 838,666 17,386 21,305 15,017 69,913 41,513 8,745 678,292 12,321 15,002 12,023
Eating and drinking places ... 241,862 16,024,491 565,593 761,226 312,257 3,124,912 1,016,699 161,941 14,414,429 395,476 570,198 194,132 Eating places .. ........... 173,660 13,911,924 433,552 543,030 236,271 2,601,612 608,125 117,424 11,203,145 306,729 410,903 148,981 Drinking places .... .............. 68,222 4,112,566 132,041 218,198 73,98 523,301 208,574 44,517 3,211,284 88,747 159,295 45,150
Miscel!aneous retail stores .. 1,041,012 28,106,378 557,436 506,957 303,261 1,793,667 1,757,265 533,929 23,506,392 367,519 400,760 202,728 Dfug stores and proprietary stores .. 17,838 2,875,444 33,387 45,459 21,223 294,488 257,710 13,895 2,748,470 28,084 42,777 19,327 Liquor stores .. 25,695 4,753,828 49,241 101,347 36,695 196,864 208,507 19,295 3,983,750 41,711 75,372 27,482 Used merchandise stores ... 76,487 1,976,438 54,797 35,998 43,134 119,759 126,439 38,841 1,559,333 33,727 27,574 31,998 Sporting goods and bicycle shops .. 43,771 2,167,830 34,480 42,301 33,387 150,691 167,944 24,381 1,818,027 24,545 34,276 20,919 Book stores .. ............ 14,166 933,412 16,238 18,909 10,691 70,099 30,802 7,257 665,406 7,461 12,681 3,504
Stationery stores .. 5,000 462,877 10,392 7,561 4,279 31,555 41,544 4,096 406,523 6,762 6,278 3,069 Jewelry stores .. 31,674 1,723,674 27,639 31,709 22,167 118,190 240,808 20,110 1,637,312 22,804 29,909 19,389 Hobby, toy, and game shops .. 14,792 259,289 7,518 5,711 5,666 18,147 -551 6,341 162,909 3,099 3,388 3,579 Camera and photograpl1ic supply stores .. 803 70,687 1,015 1,250 '515 5,378 1,123 92 56,546 '461 "789 '401 Gill, novelty, and souvenir shops .. 39,210 1,255,248 28,223 33,226 16,815 103,731 74,391 20,326 1,066,451 16,104 25,825 11,115
Luggage and leather goods stoms .. 2,526 119,322 1,650 2,050 743 '11,503 20,865 1,780 110,747 654 2,007 '683 Sewing, needlework, and pieco goods stores .. 14,909 399,400 6,531 12,210 5,559 30,282 12,339 8,659 291,416 2,863 7,751 1,146 Mail order houses .. 16,191 435,687 6,103 4,665 3,944 42,229 59,782 8,005 400,899 4,731 4,144 2,516 Merchandising machine operators . 20,242 707,571 65,842 20,346 7,303 34,564 39,917 9,109 633,018 48,441 17,731 5,880 Direct selling organizations ... 599,008 3.625,387 78,793 29,990 30,948 73,789 107.180 278,922 2.493,467 39,976 17,359 14,988 Fuel and ice dealers, except fuel oil dealers and bottled gas
dealers .. 7,063 194,69t 9,871 4,919 3,615 9,722 14,154 3,583 178,476 5,445 4,351 1,741
Fuel oil dealers .. 3,294 843,962 8,897 8,725 3,482 34,294 41,999 2,698 742,837 7,548 7,853 2,655 liquified petroleum gas (bottled) dealers . 1,212 119,556 2,182 2,059 '" 6,584 10,713 1,173 100,147 1,194 1,639 298 Florists .. 33,344 1.464,117 40,923 45,820 17,724 201,684 65,978 18,902 1,200,009 22,504 37,555 9,266 Cigar stores and stands .. 4,270 470,991 10,574 13,825 7,324 25,014 2,090 2.816 292,920 5,271 9,296 '4,450 News dealers and nowstands .. 7,143 497,075 5,806 4,422 2,234 29,126 37,176 5,558 489,050 5,609 4,405 2,232 Other miscellaneous retail stores .. 62,372 2,749,891 57,338 34,455 22,660 185,973 196,337 38,090 2,468,676 34,506 27,821 16,090
Retail trade not allocable . 33,620 1,191,888 33,865 22,151 14,806 62,007 123,200 20,683 990,933 16,796 15,234 7,049 Wholesale and retail trade not allocable .. 154,238 5,753,327 131,523 65,994 52,840 3t5,366 637,816 99,408 4,643,648 81,100 66,224 35,985
Finance, Insurance, and real estate ...................................... 1,057,726 21,156,800 869,139 342,445 993,055 996,622 7,072,331 775,168 18,301,632 514,592 201,495 406,235
Finance .. 34,710 2,030,305 40,168 13,074 82,866 34,503 333,75t 24,441 1,422,764 21,887 9,836 29,831 Banking and miscellaneous finance. 2,823 t94,098 1,543 '" 6,198 2,651 32,741 2,546 191,089 1,056 '" 2,351 Credit agencies other than banks .. 4,356 131,493 3,057 1,269 17,728 7,138 34,082 2,937 98,576 1,325 570 12,003 Security and commodity brokers and services . 27,531 1,704,714 35,568 11,250 58,940 24,714 266.927 18,956 1,133,099 19,506 8,722 15,477
Security brokers and dealers, except undarwritlng syndicates. 15,155 774,510 14,083 7,749 27,655 8,508 169,430 10,859 572,563 9,756 6,897 11,668 Commodity contracts brokers, exchanges, and services .. t2,376 930,203 21,465 3,502 31,085 16,206 97,497 8,097 560,535 9,746 1,825 3,609
Insurance agents. brokers, and servico .. 217,533 5,800,652 134,440 60,352 66,283 548.141 2,416,684 177,381 5,557,220 110,350 55,355 57,143 Real estate ... 805,483 13,325,842 694,530 269,019 643,906 413,976 4,321,897 573,346 11,321,648 382.356 136,303 319,261
Operators and lessors ot buildings .. 25,032 1,065,566 200,425 79,372 290,208 62,724 -27,991 10,612 568,818 68,230 38,037 68,776 lessors, other than buildings .. 53,263 226,656 52,501 32,604 62,205 7,834 -23,290 21,339 142,223 11,662 10,841 8,128 Real estate agents, brokors, and managers .. 702,275 10,799,435 409,550 135,918 376,689 284,612 4,186,304 523,201 9,668,850 283,116 76,0S3 167,240 Title abstract companies .. 2,151 45,277 794 "678 '576 '2,570 25,760 2,151 45,277 794 "678 "576 Subdividers and developers, except cemeteries .. 10,068 864,377 21,193 15,558 98,330 33,913 37,716 6,684 594,805 9,874 6,760 42,114 cemetery subdNiders and developers .. "' 8,843 "458 "473 '514 ., -296 "412 "8,558 "75 ·ss "285 Combined real estate, insurance, loans, law offices .. 1?·9!~ 315,688 9,610 4,417 15,384 22,316 123,690 6,747 293,116 8,606 3,811 12,143
Footnotes at end o1 table.
Payroll
(13)
487,611 128,100
86,695 27,226 36,332 87,721 69,274 52,263
2,333,042 1,946,342
366,700 1,505,555
262,758 163,880 99,856
120,322 54,048
27,619 113,422
9,537 '4,080 85,143
'11,503 19,096 36,204 32,710 45,881
7,498
31,260 '4,553
162,621 '15,791 29,126
148,649
45,267 252,436
818,239
21,283 2,593 2,827
15,863 6,583 9,280
520,852 276,104
44,144 1,165
199,576 "2,570 6,061
-20,567
Net income
(14)
683,199 231,898 104,116 52,136 61,691 98,439 73,934 60,964
1,485,457 t,t5t,542
333,915 2,762,898
282,716 239,021 221,193 205,799
64,201
43,268 276,009
21,067 3,369
138,641
22,026 38,773 76,044 64,108
525,673
26,104
44,249 11,375
128,185 14,465 39,055
277,534
175,820 816,403
8,185,727
491,271 43,257 56,618
391,396 225,843 165,553
2,579,779 5,114,676
109,902 74,699
4,650,563 25,760
114,116 '3,321
t36,313
rn 0 m.., a ., ::!. s ~
"' ::T -s· :rJ ~ c: ~
" "' ..... ~
<D
"" "'
~

Table 1.-Sole Proprietorship Businesses: Business Receipts, Selected Deductions, and Net Income, by Industry-Continued [All ligures are estimates based on samples-money amounts are in thousands of dollars]
Businesses with and wilhout net income Bus111esses with net inC<Jme
Industry Number ol Busina~ Taxes pDkl Interest Net income
businesses receipts Depreciation deduction paid Payroll (less deficit)
'" '" '" ,,, (5) (5) '"
Services ••.••.•••••••••••..•••••••••••••.••••••••••••••.•••••••••.•••.••••••.•••••••••• 3,654,001 83,289,968 4,017,261 1,757,174 1,633,191 11,132,52 3 25,531,243
Hotels and other lodging places • 69,170 2,895,113 380,501 172,416 338,020 369,232 Hotels ................................................. 4,416 362,230 34,196 22,975 40,724 79,678 Motels, motor hotels, and tourist courts .. 34,259 1,843,359 250,102 114,811 234,172 255,621 Rooming and boarding houses .. 9,739 107,435 9,697 5,754 5,956 7,143 Sporting and recreational camps .. 6,169 191,655 24,385 6,718 13,807 7,310 Trailering parks and camp sites ......................................... 14,566 389,06 61,946 22,080 43,211 19,212 Organizational hotels and lodging housos, on a membership
basis ............... "21 '1,369 '175 "76 '150 '268
Personal smvices .... 718.527 10,000,981 520,089 262,745 165,771 1,872,708 Coin-opmated laundries and dry cleaning .. 28,522 698,348 95,839 18,417 25,383 63,745 01her laundry, cleaning, and garment service·s::--· 57,141 1,930,747 120,312 52,074 37,993 419,943 Photographic studios, portrait.. 56,590 937,673 59,537 17,842 11,446 103,510 Beauty shops ..... 237,833 3,475,334 112,391 104,867 32,29 940,799 Barber shops .. .. ............ 71,932 731,117 14,882 14,601 4,650 76,212 Shoe repair and hal cleaning shops .. 11,763 278,608 7,264 7,346 2,649 45,018 Funeral service and crematories .. .. ... 13,107 916,508 51,631 26,152 24.607 82,651 Miscellaneous persona! services .. 241,639 1,032,646 58,234 21,44 26,745 140,831
Business services ..... .. .... 817,002 14,158,263 801,168 225,930 309,580 1,506,460 Advertising ................. 33,545 1,292,366 28,102 13,984 9,512 87,496 Services lo buildings .. 137,741 1,688,596 65,851 34,265 18,693 325,908 Computer and data processing sarvices .. 22,451 417,626 35,749 3,308 8,123 31,166 Managemen1 and public reJalions .. 258,435 4,100,117 114,644 29,093 73,514 179,622 Equipment rental and leasing .. 36,368 1,517,459 369,926 46,518 129,401 174,074 Other business sorv'1ces. 326,46 5,142,0g 186,896 98,76 70,336 706,193
Automobile repair and services .. 205,092 8,813,203 378,711 224,305 174,411 1,201,477
Automotive rentals, without drivms •• 12,590 380,743 102,065 15,942 36,070 13,439 Automob~a parll'1ng .. 1,776 87,358 a7< 3,654 92> 13,535 Aulomotive top and body repair shops .. 44,047 1,881,398 53,452 49,355 21,233 344,532 General automotive repair shops .. 106,731 4,576,484 151,152 106,285 76,674 576,622 Othor automotive repair shops .... 18,262 1,197,217 23,630 29,035 9,711 175,441 Automotive smvices, except repair •. ......... 21,686 690,003 47.537 20,034 29.802 77,708
Miscellaneous repair services ... 257,404 4,977,842 221,231 95,998 76,708 597,462 Radio and TV repair shops .. 33,491 593,767 28,511 14,582 6,439 58,793 Electrical repair shops, except radio and TV ... 33,735 854,345 29,061 16,879 15,375 82,142 Reupholstery and furniture repair .. 37,992 539,030 21,262 9,119 6,770 69,9g1
Other miscellaneous repair shops .. 152,186 2,990,700 142,396 55,418 48,123 386,537
Motion pictures ......................................................... 10,321 477,817 33,309 9,986 6,617 29,887 Motion picture production, distribution, and services .. 7,394 287,067 26,411 3,519 2,g5o 18,223 Motion picture theaters • 2,927 190,750 6,899 6,467 3,667 11,665
Amusemant and recreation services, except motion pictures .. 282,311 3,612,276 375,003 61,119 82,359 382,360
Producers, orchestras, and enterta'1ners .. 127,760 1.287,923 73,194 20,246 8,953 95,871 Billiard and pool astablishments .. 4,024 71,309 5,001 1,955 '582 '1,846
Bowling alleys .... 2,113 135,142 19,339 6,908 14,894 20,772 Prolessiooa! sports clubs and promoters. 2,820 18,182 919 '116 "351 '539
Racing, includ"mg track operation .. 61,24 808,461 145,207 15,233 14,131 97,814
Other amusemen1 and recreation services . 84,346 1,491,258 131,344 36,6SO 43,449 165,517
Medical and health services ... .. .... 421,280 22,012,395 681,579 395,150 277,319 3,046,062
OUices of physicians . 156,153 10,058,465 267,179 148,679 70,815 1,131,401
Officas of dentists ..... 84,926 6,783,980 225,673 135,885 g7,089 1,129,655
Offices or osteopathic physicians ... 2,511 174,511 4,840 3.046 1,337 22,191
Olfices of chiropractors .. 19,721 934,728 45,809 15,796 33,987 79,525
Offlcos of· optometrists .. 13,709 1,037,457 32,253 16,603 16,718 101,036
Regislered and pracllcal nurses ............ 47,631 294,216 2,881 996 "6 '2,213 Nursing and personal caro facilities ..... 17,581 909,729 42,289 46,513 38,889 319,599 Hospitals .................. <00 127,904 4,650 5,479 '1,076 54,192 Med"1ca! laboralorias .. 1,734 33,599 2,64 49 '1,144 5,55 Oantal laboratories .. 9,697 360,732 15,015 6,436 4,348 76,368 Othm medical and health s~~~~~~·::·-- 87,217 1,277,074 38,349 15,225 11,470 124,328
Legal services .......... 172.224 6,297,713 175,790 105,110 59,533 794,169 Educational services ............................. 150,237 1,318,587 71,932 37,414 25,978 133,903 Engineering and architectural services ... 66,733 2,510,130 136.549 51,326 29,131 472,387 Accounting, auditing, and bookkeeping services .. 176,442 2,600,349 98,053 48,428 41,767 453,453
Certified public accountants ......................................... 34.080 1.210,377 42,230 24,888 21,751 239,041 Other accounting. auditing, and bookkeeping services ... 142,362 1,389,972 55,824 23,540 20,016 214,412
Other services .. 287,258 3,415,29g 143,345 47,246 45,997 272,963
Nature of business not allocable .......................................... 55,033 1,112,087 43,552 24,559 26,654 82,058
'This estimate should be used Wllh caution bocauso of the small numbm of sample returns on which i! was basad. "The astimato for this coli is not shown to avoid d•sclosum of inlormallon for specific taxpayers. However, tho data are included in the appropri~te totals. NOTE: Detail may not add to total because of rounding.
87,041 3,851
47,261 16,198
-17,542 37,g96
'-723
2,421,731 24,261
340,495 155,602 903,17C 401,514
78,164 207,837 310,68
4,204,731 173,252 559,915 184,250
1,870,746 -1,042
1,417,611
1,064,700 9,493
13,302 224,033 572,128 172,448 73,295
964,547 101,009 170,g28 102,056 590,553
20,777 4,77
15,999
161,801 340,706
11,411 1,516
-2,106 -292,789
103,063
10,334.944 5,567,680 2,841,575
89,857 381,581 330,599 231,010 100,982
11,295 tO,Q98
130.113 640,155
2,914,442 279,708 771,048
1,180,989 546.449 634,540
1,124,783
246,246
Number ol Business Taxes pa1d tnte~est businesses receipts Depreciation deduction paid
'" '"' {10) {lt) (12)
2,826,461 75,507,960 2,669,421 1,445,962 1,037,703
34,547 1,882,902 177,188 93,948 159,23 2,51 223,51 17,607 12,828 21,821
14,968 1,136,692 108,247 58,355 102,214 7,678 97,346 6,713 4,622 3,616 .. .. .. .. .. 7,611 316,493 38,677 17,221 28,406
.. .. .. .. .. 589,514 9,090,341 399,687 226,360 127,183
16,532 541,267 59,600 13,715 15,583 45,016 1,757,457 104,460 44,106 32,0g1 29,420 847,455 40,432 15,528 10,053
201,157 3,181,09 90,149 92,805 24,38 67,369 716,383 14,065 13,467 4,563
9,967 252,991 4,976 6,536 2,212 11,798 685,306 46,274 24,878 21,699
208,255 908,391 39,73 15,32 16,593
635,530 12,587,226 467,041 178,273 165,277 22,144 1,092,742 22,696 10,359 6,101
120,208 1,563,987 52,462 31,207 15,382 17,611! 396,867 12,574 2,868 3,804
202,245 3,786,077 76,973 21,412 36,018 18,331 1,105,925 168,201 2g,818 54,974
254,984 4,641,627 132,13 82,609 48,99
150,317 7,560,096 257,815 186,123 112,261 6,239 254,040 51,337 8,167 17,087 1,753 84,901 '19 3,452 "9
34,354 1,676,592 43,046 43,996 17,277 78,487 3,936,717 114,855 89,746 54,295 15,423 1,088,319 21,384 27,120 9,357 14,061 51g,529 26,774 13,643 14,237
185,459 4,387,020 157,136 81,007 59,822 22,646 546,424 20,564 12,287 5,767 25,679 786,781 22,676 15.033 12,048 27,728 420,720 14,2g3 6,897 5,372
109,406 2,633,095 99,603 46,790 36,815
6,330 435,563 10,113 6,738 2,631 4,481 266,856 6,485 3,287 1,19 1,849 168,708 3,628 5,452 '1,433
152,970 2,898,891 134,990 49,477 29,207 86,128 1,136,705 39,186 10,495 4,216
1,798 47,406 '1,261 '1,552 '205 1,330 102,079 12,401 3,819 8,600 1,109 11,160 "69 "48 "" 16,391 453,079 20,548 8,324 3,189
46,214 1,148,461 61,525 25.239 12,943
383,285 21,486,218 624,660 372,245 245,409 141,650 9,676,816 248,044 143,961 65,584
80,120 6,718,068 214,832 132,614 92,686 2,362 173,783 4,736 3,004 1,297
17,217 902.933 40,423 14,869 28,892 12,486 1,013,1g3 29,118 16,274 15,422
46,465 292,744 1,970 9<0 386 14,671 770,438 33,288 37,Q32 27,396
'395 '97,544 '3,969 '3,831 '591 1,225 32,47 524 '364 '312 8,992 377,324 14,609 6,380 4,348
57,702 1,230,897 33,146 12,977 8,495
147,424 6,044,282 154,852 90,629 41,449 120,356 1,162,840 46,684 32,468 19,615 67,389 2,359,136 60,872 43,818 19,148
158,709 2,551,276 86,172 45,534 35,289 31,163 1 ,203,258 40,436 24,746 20,477
127,546 1,348,018 45,737 20,789 14,812 194,631 3,062,169 92,210 37,341 21,174
42,216 999,462 32,rr53 21,579 12,644
Paytoll Nat inC<lma
(13) (14)
9,778,12 6 28,511,32 0
9 7
203,699 34,41
146.480 6,58
14,78 .. 1,636,201
48,702 360,873 101,140 824,29
71,647 35,797 78,203
115,543
1,289,651 66,984
285,107 30,733
138,898 127,678 640,251
1,013,903 8,830
13,374 2!.'14,687 470,195 167,621 59,195
512,949 57,428 75,309 42,274
337,938
27.487 17,04 10,447
265,977 79,435 '1,695
'12,922 '198
58,836 112,892
2,904,341 1,09g,256 1,107,500
21,967 75,732 97,541
'2,213 265,544 '38,836 '5,464 75,851
114,435
718,504 92,731
428,065 443,383 237,514 205,869 241,235
74,715
339,31 36,94
199,0€ ,7 23,8~ 1
6g,21 2
2,693,75 ,o 4 1
'4 2 5 5 5 4 ,, 6 6 '0 9 '7
77,5E 371,21 213,39 965,84 406,12 80,63
220,51 358,44
4,680,66 212,02 603,53 207,07
2,078,50 190,32
1,589,20
1,272,0C 48,70 15,80
271,4~ '5 '5
658,5~ a 180,7€ 96,78
'7 ,, 1,094,6~
125,8~ 187,63 118,41 662,7~
67,9~ 45,3e 22,5E
862,5€
,9 5 2 3 0
5 ,a ,7
478,64 15,1E 12,9~ 1,4~
102,19 252,0~
10,494,34 5,633,1€
4 ,o '0 5 'a '9
5 9
2,864,H 90,5<
391,0~ 336,5~
233,7( 119,7> '12,6~
15,27 131,0~ 666,2S
" '3 '6
,, ,, 6 a 'a 0
3,017,42 334,9~ 889,84
'7 7 6 '7 1,202,35
551,41 650,94
1,361,43
2 5
286,64 ..
"' C)
C/1 0 iS ..., Cl , ::!. !. 0 (il ::r '6'· JJ (I)
2" ~
::l .. .... -10 .... <0
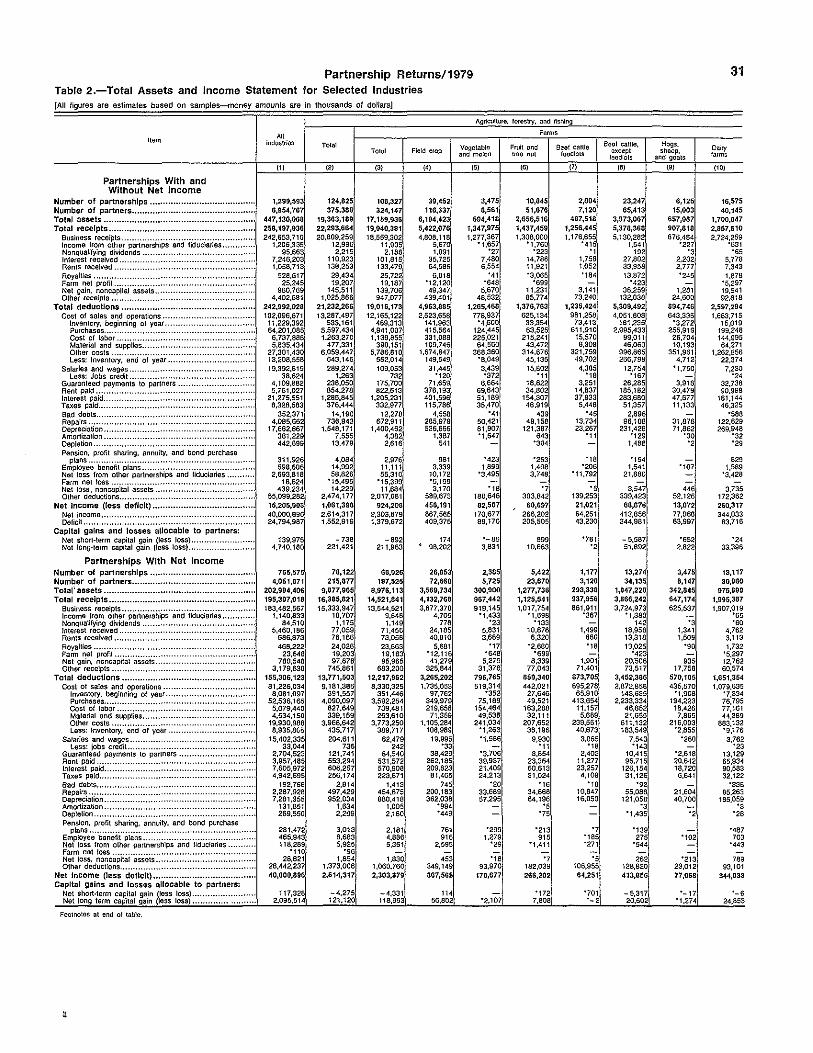
Partnership Returns/1979 Table 2.-Total Assets and Income Statement for Selected Industries [All figures are estimates based on samples-money amoun s are m thousands of dollars]
Agriculture, forestry, and fishing
Item
Partnerships With and Without Net Income
Number of partnerships ................•......•.•............... Number of partners ................•......•......•................. Total assets .......•..•................................................ Total receipts ........................................................ .
Business receipts ......................................... .. Income from other partnerships and fiduciaries .. Nonqualifying dividends ......... . Interest received ... Rents received ... Royalties. Farm net prom .................... .. Net gain, noncapital assets .. .. Other receipts •
Total deductions ................................................... . Cost of sales and operations ••
Inventory, beginning of year .. Purchases..... .. ...•..•.•.•.•..•••••••.••.• Cost of labor ................. . Material and supplies ...... .. Other costs ........................ .. Less: Inventory, end of year ..
Salaries and wages .. Less: Jobs credit ..................... .
Guaranteed payments to partners • Rent paid ....... Interest paid .. Taxes paid .. Bad debts .. Repairs .......... Depreciation .. Amortization.. • ......... .. Oepletion.. .. ..... .. Pension. profit sharing, annuity, and bond purchase
plans ...................... . Employee benefit plans ................................... . Net loss from other partnerships and fiduciaries . Farm net toss ....................................... .. Net toss, noncapital assets .. .. Other deductions ..
Net Income (less deficit) ...................................... .. Nat income .. Deficit..
Capital gains and losses allocable to partners: Net short-term capital gain (less loss) ... . Net long·term capital gain (less loss) .. .
Partnerships With Net Income Number of partnerships ........................................ . Number of partners ............................................... . Total' assets ......................................................... .. Total receipts ....................................................... ..
Business receipts ........................................... .. Income from other partnerships and fiduciaries .. Nonqualifying dividends . Interest received ................ . Rents received .. Royalties .. Farm net prof~ ........................................... . Net gain, noncapital assets .. .. Other receipts ................ ..
Total deductions .................................................. .. Cost of sates and operations.
Inventory, beginning of year .. Purchases ..... .. Cost of labor ............ .. Malarial and supplies.. . ... .. Other costs ......................... . Less: Inventory, end of year ..
Salaries and wages....... . ............................... .. Less: jobs credit.. ....
Guaranteed payments to partners .......... .. Rent paid....... .. ...... .. Interest paid .. Taxes pald .. Bad debts .. Repairs ........ .. Depreciation .. Amortization .. ~ptetion ......... . Pension. profit sharing. annuity, and bond purchase
plans ........................ . Employee benefit plans .................................. .. Net toss from other partnerships and fiduciaries . Farm net loss ................. .. Net loss. non capital assets ................ . Other deductions .....
Net Income (less deficit) ....................................... . Capital gains and losses allocable to partners:
Nat short-term capital gain (less loss) ....... . Nat tong term cap'1tal gain (loss loss), ............ .
Footnotes at end o! table .
•
"' industries
"' 1,299,593 6,954,767
447,130,060 250,197,936 242,653,710
1,206,335 95,663
7,246,203 1,058,713
526,617 25,245
960,769 4,402,661
242,992,020 102,096,671
11,229,392 64,201,065
6,737,866 5,635,434
27,301,430 13,206,556 19,392,619
38,624 4,109,882 5,761,027
21,275,551 8,326,563
352,371 4,065,662
17,662,667 361,229 442,699
311.926 598,606
2,693,818 16,624
439,234 55,099,282 15,205,906 40,000,896 24,794,987
139,975 4,740,180
765,57 4,051,671
202,994,406 195,307,010 163,462,567
1,140,833 64,510
5,460,166 666,873 466,222
23,646 760,546
3,179,630 155,306,123 81,226,034
8,061,097 52,536,165
5,079,440 4,534,150
19,930,966 8,935,6Ci5
15,402,335 33,044
2,704,523 3,957,485 7,605,972 4,942,695
192,766 2,287,926 7,281,355
131.651 269.550
281,472 465,943 1t8,289
'110 28,621
26,442,237 40,000,896
117,328 2,095,514
Total
'" 124,625 375,366
19,363,169 22,293,664 20,809,259
t2,996 2,215
110,923 t38,253 29,434 19,207
145,511 1,025,866
21,232,266 13,287,497
533,161 5,597,434 1,263,270
477,331 6,059.447
643,146 289,274
1,263 238,050 854,278
t,285,845 376,444
14,190 736,943
1,546,171 7,555
13,479
4,084 14,992 58,826
'15,495 14,229
2,474,177 1,061,390 2,614,317 1,552,919
-738 221,421
70,12 215,877
9,877,965 16,385,621 15,333,947
10,707 1,175
77,059 76,166 24,026 19,203 97,678
745,861 13,771,503
9.181.385 391,557
4,090,097 827,649 339,159
3.968,642 435,717 204,611
736 121,741 553,294 606,257 256,174
2.814 497,429 952,034
1,634 2,2U9
3,013 8,683 5,925
"96 t,854
1,373,006 2,614,317
-4,275 121,120
Tol<lt
'" 108,327 324,147
17,159,936 19,940,301 18,559,302
11,905 2.168
101,815 133,479 25,722 19,187
139,706 947,077
19,016,173 12,165,122
469,313 4,941,007 1,139,855
390,151 5,786,810
562,014 109,053
732 175,700 822,613
1,205,231 332,977
12,278 672,911
1,400,462 4,382 2,616
2,976 11,111 55,310
'15,399 11,684
2,017,081 924,208
2,303,879 1,379,672
-892 211,963
68,92 107,525
8,976,113 14,521,841 13,544,521
9,648 1,149
71,456 73,058 23,663 19,18 95,965
683.200 12,217,962 8,330,325
35t,446 3,592,254
7::l9,481 263,610
3,773,250 389,717
62,479 2'2
84,540 531,572 570,908 223,671
1,413 454,675 880,418
1.005 2,160
2,181 4,886 5,361
1,830 1,060.760 2,303,879
-4,331 118,993
Field crop
,,,
39,452 116,337
6,194,423 5,422,076 4.808,118
5,67 1,091
35,725 64,586
6,018 '12,t20 49,347
439.401 4,963,885 2,523,658
t41,963 415,564 331,088 109,746
1,674,847 149,549 31,445
'120 7t,659
378,193 401,596 115,766
4,558 285,979 536.665
t,387 541
'" 3,339 10,172 "5,199 3,170
589,673 450,191 867,565 409,375
'" • 98,202
26,85 72,660
3,569,734 4,132,768 3,677,370
4,705 776
24,185 40,810
5,681 '12,116 41,279
325,844 3,265,202 1,735,053
97,762 349,979 219,658
71,359 1,105,284
108,989 19,995 ., 36,429
262,185 209,823
81.465 745
200,183 362,038
'994 '449
761 916
2,595
453 349,149 867,565
114 56,802
V<llJO\abiO and melon
(5(
3,475 8,561
594,4111 1,347,975 1,277,367
'1,~~7 7,480 6,554 . ., '648
5,670 48,532
1,265,468 778,937
'4,600 124,445 225.021
64,560 368,360
'8,049 3,439 '372
6,664 69,643 51,189 35,470 . ., 50,421 81,907 '1,647
'423 1,899
'3,495
"16 180,646 02,507
t70,677 86,170
-as 3,831
2,38 5,725
300,900 967,442 919,145
'1,433 ., 5,831 3,689 ., "646
5,279 31,378
796,765 519,314
'352 75,189
154,464 49,538
241,034 '1,263 '1,586
'3.706 39,937 21,409 24.213
·2o 33,689 57.295
'299 1,279 .,
"16 93,970
170,677
'2,107
Farms
Fruit and Beef cattle lfOO nut feedlots
{6) (7)
10,045 51,676
2,656,516 1,437,459 1,308,000
'1,76 '223
14,786 1t,921 '3,065
'699 11,231 85,774
1,376,763 625,134
33,354 63,525
215,241 43,472
314,676 45,135 15.802 ., 18,622 34,602
154,307 46,919
439 49,158
121,387 643
'304
'253 1,408 3,748
"7 303,842
60,697 266,202 205,505
699 10,663
5,42 23,670
1,277,736 1,125,541 1,017,754
'1.698 '133
10,876 6,320
'2,680 '699
8,339 77,043
859,340 442,021
27,646 49,521
163,288 32,111
207,652 36,196
9,930 ., 8,854
23,364 60,613 31,024
"16 34,668 64,196
.5 "75
'213 915
'1,411
•7 182,039 266,202
'172 7,808
2,004 7,120
487,518 1,256,445 1,176,655 . ., .,
t,758 1,052 '184
3,141 73,240
1,235,424 981,258
73,413 611,910
15,570 8,308
321,759 49,702
4,355 "16
3,251 14,837 37,933
5,448 "45
13,734 23,267 .,
"16 '206
'11,792
"5 139,253
21,021 64,251 43,230
'781 "2
1,17 3,120
293,330 937,956 861,911
'367
1,499 660 "16
1,901 71,40t
073,705 695,278
65,910 413,654
11,157 5,669
239,561 40,673
3,065 .16
2,402 11,277 23,257 4,t08
"16 10,847 t6,050
"7 '185 '271
"5 106,955 64,251
'701 -2
Boor cattle, except feedlots
'" 23,247 65,413
3,973,067 5,370,368 5,130,282
1,541 192
27,802 33,958 13,872
'423 38,259
132,038 5,309,492 4,051,808
181,235 2,995,433
99,011 46,060
996,665 266,796
t2,754 '167
26,285 t85,182 283,680
51,357 2,896
96,108 231,428
'129 t,488
'154 t,541
21,880
3,547 339,423
68,876 413,856 344,981
-5,587 51,892
13,274 34,135
1,047,220 3,866,242 3,724,973
'1,380 142
18,958 13,316 1'3,025
'423 20,"506 73,517
3,452,386 2,872,856
143,635 2,233,334
46,652 21,655
611,132 183,549
7,543 '143
10,415 96,715
t26,t54 31,126
"92 55,088
121,058 ., '1.435
'139 275
'544
262 126,820 413,856
-5,317 20,602
Hogs. shoep,
and goats
'" 6,125
15,003 657,987 907,818 876,484
'227 ., 2.202 2,777 '245
1,281 24,600
094,746 643,336
'3,272 255,919
26,704 10,193
351,961 4,712
't,750
3,918 30.479 47,677 11,133
31,878 71.862
•so "2
'107
4<6 52,t26 13,072 77,068 63,997
'652 2,822
3,475 8,147
342,845 647,174 625.537 .,
1,341 1,509
•go
935 17,758
570,105 435,570
'1,908 194,223
18,426 7,865
216,003 '2,855
'280
'2,618 20.642 18,720
6,641
21,604 40,700
"2
'102
'213 23,012 77,060
-17 '1,274
Dairy larmo
(10)
31
16,575 40,145
1,700,047 2,857,610 2.724,259
'631 ·ss
5,778 7,343 t,878
'5,297 19,541 92.818
2,597,294 1,663,715
t5P19 199,248 144,995 64,271
1,262,556 22,374
7,230 .,. 32,738 90,998
161,144 46,325
'586 122,629 269,946 .,
"29
629 1,589
'3.428
3,735 172,362 260,317 344,033
83,716
"24 33,396
13,117 30,960
975,890 1,995,387 1,907,019
•ss ·so
4,762 3,113 1,732
'5,297 12,762 60,574
1,651,354 1,079,635
'7,334 76,795 77,161 44,389
683,132 '9,176 3,762 .,
13,129 65,934 90,583 32,122
'336 85,263
185,059 ., "26
'487 703
'443
769 93,101
344,033
-6 24,853
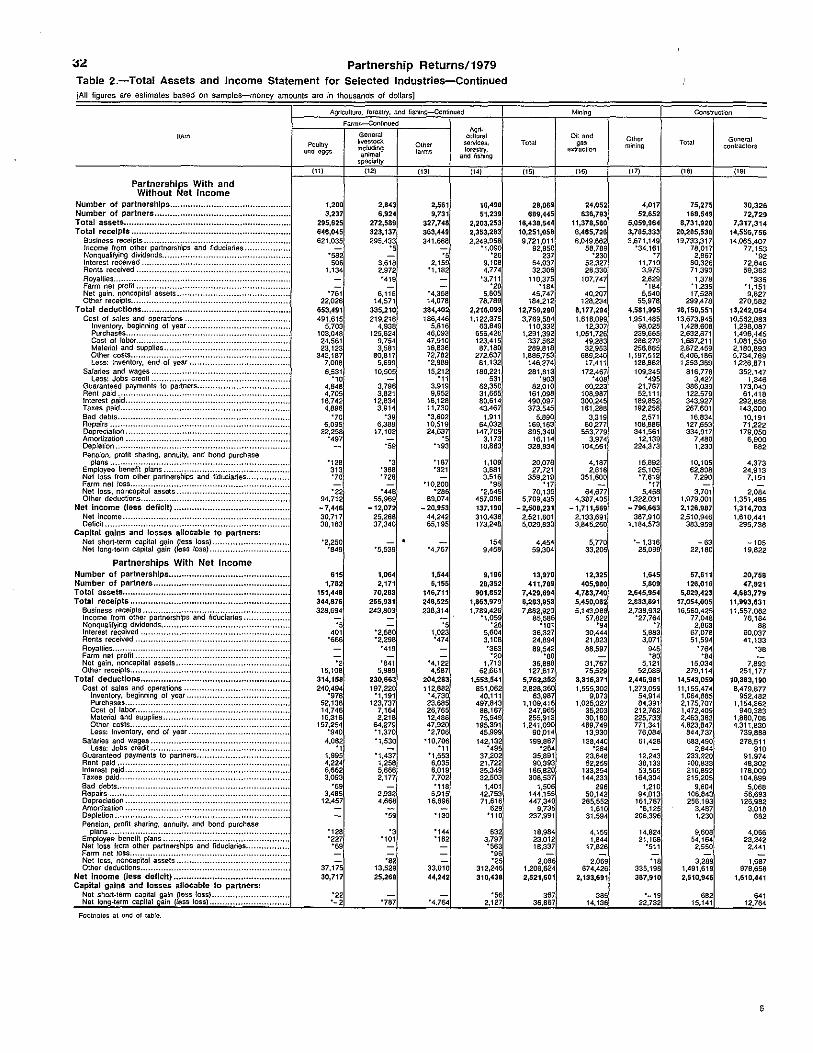
Partnership Returns/1979 Table 2.-Total Assets and Income Statement for Selected Industries-Continued [All ligures are estimates based on samples-money amounts are in thousands of dollars]
nom
Partnerships With and Without Net Income
Number of partnerships ......•.........•.•......•..................... Number of partners .................................................... . Total assets ................................................................ . Total receipts ............................................................. .
Business receipts .......................................... . Income from other partnerships and fiduciaries .. NonqualifyinQ dividends ... Interest rece1ved . Rents received . Royalties ......... . Farm net prolit .................... .. Net gain, noncapital assets .. .. Other rece1pts... .. ............. ..
Total deductions ........................................................ .. Cost of sales and operations ......
Inventory, beginning of year .. Purchases...... • ..................... . Cost of labor .............. .. Material and supplies ... Other costs .. Less: Inventory, end of year ..
Salaries and wages .. Less: Jobs credit .................... ..
Guaranteed payments to partners .. Rent paid ........ Interest paid .. Taxes paid .. Bad debts. Repairs ........ .. Depreciation .. Amortfzation . Depletion.... . ...................... . Pension, profit sharing, annuity, and bond purchase
plans...................... . ........................ . Employee benefit plans ............................... . Net loss from other partnerships and fiduciaries Farm net toss .................. .. Net loss, noncap·~al assets .. Other deductions ..
Net income (less deficit) ........................................... .. Nat income .. Deficit ..
Capital gains and losses allocable to partners: Net short-term capital gain (less loss) ... Net long-term capital gain (less loss) ..
Partnerships With Net Income Number of partnerships ............................................. .. Number of partners .................................................... . Total assets .............................................................. .. Total receipts ............................................................ .
Business receipts .......................................... . Income from other pannershlps and fiduciaries .. Nonqualifying dividends .. Interest received . Rents received . Royalties.......... .. .............. . Farm net profit .................... .. Net gain, noncapital assets .. .. Other receipts.. • ................... .
Total deductions .............................. , ......................... .. Cost of sates and operations ............... ..
Inventory. beginning or year .. Purchases ................... .. Cost of labor ......... .. Material and supplies Other costs ......................... .. Less: Inventory, end or year ..
Salaries and wages. Less: Jobs credit ................................. ..
Guaranteed payments to partners ................ . Rent paid....... .. ................. .. Interest paid .. Ti!XeS paid ................ .. Bad debts .. . Repairs ..... . Depredation Amortization . Depletion .. Pension, profit sharing, annuity, and bond purchase
plans ..................... . Employee benelit plans .................................. .. Net loss from other partnerships and fiduciaries .. Farm net Joss...... . ....... .. ............... . Net Joss, noncapital assets ........................... .. Other deductions ......
Net Income (less deficit) ........................................... .. Capital gains and losses allocable to partners:
Net short-term capital gain (tess loss). Net long-term capital gain (less loss)
Footnotos at <md of t11bla.
Agrfculluro, forestry, and lishing-Continum.l
Poultry and eggs
(11)
1,200 3,237
295,625 646,045 62t,035
'582 506
t,134
'761 22,026
653,491 491,615
5,703 103,048 24,561 23,123
342,187 7,008 6,531
"" 4,848 4,705
16,742 4,896
"70 6,095
22,258 '497
'128 313 "70 .,
94,712 -7,446 30,717 38,163
"2,250 "849
615 1,782
151,448 344,876 328,694 .,
"' '666
"2 15,108
314,158 240,4g4
'978 52,138 14,746 16,318
157,254 '940
4,062 ., 1,995 4,224 6,662 3,093
"69 3,465
12,457
'128 '227
"69
37,175 30,717
"22 -2
Farms-Continued
General hvestock includong animal
specialty
{12)
2,843 6,924
272,589 323,137 295,433 .,
3,6t8 2,972 '419
6,118 14,571
335,210 219,216
4,938 125,824
9,754 3,581
80,817 5,699
10,505
3,796 3,821
t2,834 3.914 ., 6,389
17,103
•sg
"3 '388 '726
'448 55,969
-12,072 25,268 37,340
"5,539
1,064 2,171
70,283 255,931 243.803
'2,580 '2.298
'419
'841 5,989
230,663 197,220
'1,191 123,737
7,164 2,218
64,279 '1,370 '1,530
'1,437 1,258 5,668 2,177
2,932 4,668
"59
"3 '101
"82 13,529 25,268
"787
Othar farms
(t3)
2,561 9,731
327,748 363,449 341,668
., 2,159
'1,t82
'4,358 14,078
384,402 186,446
5,616 46,093 47,910 16,836 72,782 '2,989 15,212 ., 3,919 9,952
18,128 11,730 '3,602 10,519 24,637 .,
'193
'187 '321
'10,200 '286
89,074 -20,953
44,242 65,195
'4.767
1,544 5,155
146,711 248,525 236,314
·s 1,023 '474
'4,122 4,587
204,283 112,882
'4,730 23.685 26,765 12,486 47,920 '2,706
'10,706 ., '1,553 6,035 6,019 7,702 "118
6,915 16,696
'130
'144 '182
33,010 44,242
'4,764
Agncultural
servrcas. forestry,
and fishing
{14)
16,490 51,239
2,203,253 2,353,283 2,249,958
'1,090 "26
9,108 4,774
'3,711 "20
5,805 78,789
2,216,093 1.122,375
63,849 656,426 123.415 87,180
272,637 81,132
180,221
"' 62,350 31,665 80,614 43,467
1,911 64,032
147,709 3.173
10,863
\,109 3,881 3,516
•gs '2,545
457,096 137,190 310.438 t73,248
'" 9,456
9,196 28,352
901,852 1,063,979 1,789,426
'1,059 "26
5,604 3,108 '363 "20
1,713 62,661
1,553,541 851,062
40.111 497,843
88,167 75,549
195,391 45,999
142,132 '4gs
37.202 21,722 35,349 32,503
1,401 42,753 71,616
629 't10
632 3,797 '563 •gs "25
312,246 310,430
"56 2,127
Total
(15)
28,069 689,445
16,438,544 10,251,058 9,721,011
92,950 237
64,037 32,306
110,375 '184
45,747 184,2t2
12,759,290 3,769,584
110,332 1,291,392
337,562 289,818
1,886,753 146,274 281,813
'903 82.010
161,096 490,097 373,545
5,890 169,163 895,340
t6,114 328,934
20,078 27,721
359,219 ., 70,135
5,709,435 -2,508,231
2.521,601 5,029,633
4,454 59.304
13,970 411,709
7,429,694 8,283,953 7,682,920
85,586 '101
36,327 24,8g4 89,542
·so 36,888
127,617 5,762,352 2,828,360
63,967 1,109,418
247,965 255,913
1,241,090 90,014
199,867 '264
35,891 90,393
166,820 308,537
1,506 144,155 447,340
9,735 237,991
18,984 23,012 18,337
2,086 1,209,624 2,521,601
367 36,867
Mining
Oil and
'" extraction
{16)
24,052 636,793
11,378,580 6,465,726 6,049,862
58,789 '230
52,327 28,330
107,747
40,207 128,234
8,177,294 1.818,099
12,307 1,051,726
49,283 32,953
689,240 17,411
172,467 '408
60.223 108,987 300,245 181,288
3,319 60,277
553,779 3,974
104,561
4,187 2,616
351,600
64,677 4,387,405
-1,711,569 2,133,691 3.845,260
5,770 33,20
12,325 405,900
4,783,740 5,450,062 5,143,98
57,822 .,. 30,444 21,823 88,597
31,767 75,529
3,316,371 1.555,302
9,073 1,025,027
35,203 30,180
469,749 13,930
138,440 '284
23,648 52,259
133,254 144,233
296 50,142
285,552 1,610
31,594
4.159 1,844
17,826
2,069 674,426
2,133,691
365 14,136
Othor mining
(17)
4,017 52,652
5,059,964 3,785,333 3,671,149
"34.161 "7
11,710 3,975 2,629 '184
5,540 55,978
4,581,995 1,95t.485
98,025 239,665 288,279 256,865
t,197,512 128,862 109,345
'495 21,767 52,111
189,852 192,258
2,571 108,886 341,561
12,139 224,373
15,892 25,105 '7,619 ., 5,458
1,322.031 -796,663
387,910 1,164,573
-1,316 26,099
1,645 5,809
2,645,954 2,833,891 2,738,932
'27,764 "7
5,883 3,071
946 ·eo
5,121 52,088
2,445,981 1,273,059
54,914 84,391
212,762 225,733 771,341
76,084 61,428
12,243 38,133 53,565
164,304 t,210
94,013 161,787
'8,125 206,396
t4,824 21.168
'511 .,. 335,198 387,910
_, 22,732
Construction
Total
(18)
75,275 168,549
8,731,920 20,285,538 19,733,317
78,017 2,867
80,326 71,390
1,378 '1,235 \7,528
299,476 18,158,551 13,673,945
1,428,608 2,632,871 1,687,211 2,872,459 6,406,186 1,353,389
816,776 3,427
386,039 t22,579 343,927 267,601
16,834 127,653 334,917
7,480 1,230
t0,105 62,808
7,290
3,701 t,979,001 2,126,987 2,510,946
383,959
-63 22,180
57,611 126,016
5,829,423 17,054,005 16,560,425
77,048 2,863
67,078 51,594
'764 "64
15,034 279,114
14,543,059 1t,155,474
1.064,885 2,175,707 1,472,409 2,463,363 4.823,847
844,737 683,490
2,844 233,220 100,833 216,892 215,205
9,804 106,843 256,193
3,467 t,230
9,608 54.164
2,550
3,289 1,491,619 2,510,946
662 15,141
General contractors
{19)
30,326 72,729
7,317,314 14,556,756 t4,065,407
77.153 "92
72,846 59,362
'336 "1,151 9,827
270,582 13,242,054 10,562,883
1,298,087 1,496,445 1,081,559 2,180,893 5,734,76g 1,228,871
352,147 1,346
173,043 61,418
292,858 143,000
10,191 71,222
179,050 6,900
662
4,373 24,913
7,151
2,064 1,351,485 1,314,703 1,610,441
295,738
-105 t9,822
20,758 47,921
4,683,779 11,993,631 11,557,082
76,184 66
60,037 41,133
"36
7.893 251,177
10,383,190 8,47g,s77
952.482 t,154,362
940,383 t,860,708 4,311,830
739,888 278,511
9>0 91.974 48,302
178,000 104,899
5,068 56,693
126,982 3,018
662
4,066 23,242
2,441
1,687 978,658
1,610,441
64> 12,784
•

Partnership Returns/1979 Table 2.-Total Assets and Income Statement for Selected Industries-Continued [All figures are estimates based on samples-money amounts are in thousands of dollars}
Construction--Continued
Special trade conuactors
Item Plumbing, Painting, Masonoy, Contractors. heati"'l, paper stonowork, Total and a~r hanging tile set- "'' condition- "' ling and elsowhero
'"9 decorating plastering classified
(20) (21) (22) (23) (24)
Partnerships With and Without Net Income
Number of partnerships .............•........................... 44,949 6,017 3,689 6,023 29,023 Number of partners ................................................ 95,820 13,092 8,538 12,663 61,527 Total assets ........................................................... 1,414,606 189,795 45,171 140,853 1,038,788 Total receipts ......................................................... 5,728,781 952,940 3~9,995 751,720 3,704,126
Business receipts ........................................... 5,667,910 946,541 316,154 736,956 3,668,259 Income from other partnerships and fiduciaries .. '864 - - - '664 Nonqua!ifyirlg divider1ds . '2,775 . ., - - '2,733 lrllerest received .... 7,480 1,481 '117 327 5,555 Rents received ... 12,028 '1,597 '2,886 '619 6,924 Royalties .......... '1,042 - '316 - '726 Farm net pro!it .................... .,. - - - "84 Net gain, nor1capitat assets .. 7,701 1,464 '303 "65 5,870 Other receipts. 28,896 1,815 '218 13,754 13,110
Total deductions .................................................... 4,916,497 841,427 258,100 625,011 3,191,960 Cost of sates and operations ...... 3,111,062 607,268 137,430 377,901 1,968,463
Inventory, begir1nir1g of year .. 130,521 37,906 '1,534 10,987 80,092 Pun:.:hases .•..•.• 1,136,426 281,243 33,215 81,819 740,150 Cost of labor ............... 605,652 62,157 56,629 119,414 367,453 Material and supplies ... 691,565 147,902 26,565 95,057 422,042 Other costs .......................... 671,416 108,291 20,972 80,325 461,828 Lass: lnver1tory, er1d of year .. 124,518 30,232 '1,485 9,700 83,101
Salaries and wages .. 464,631 53,294 38,350 93,167 279,820 Less: Jobs credit ...................... 2,081 "72 "98 - 1,911
Guaranteed payments to partners . 212,995 36,608 19,036 23,736 133,616 Rent paid ....... 61,161 5,676 2,693 7,041 45,551 Interest paid .. 51,069 8,270 2,568 2,973 37,257 Taxes paid .. 124,602 17,613 8,424 21,812 76,552 Sad debts .. 6,642 1,605 671 949 3,418 Repairs ........... 56,431 4,571 1,355 5,392 45,114 Depreciation .• 155,868 17,868 6,736 14,156 117,108 Amorti~ation .. 580 - '144 - 435 Depletion .. "548 - - '296 '252 Pension, profit sharing, anr1uity, and bond purchase
plans ....................... 5,732 1,603 '389 '677 3,062 Employee benefit plans ..................................... 37,985 4,623 5,225 7,692 20,445 Nat loss from other partnerships ar1d fiduciaries .. '139 "1 - - '138 Farm rlat loss ...................... - - - - -Net loss, noncapitat assets ... 1,617 "7 "1 - 1,609 Other deductions .. 627,517 82,092 35,175 69,219 441,031
Net Income (less deficit) ........................................ 812,284 111,513 61,896 126,709 512,166 Net income .. 900,505 119,712 65,527 143,444 571,623 Deficit.. 88,221 8,199 '3,631 '16,734 59,657
Capital gains and losses allocable to partners: Net short·term capital gain (less toss) .. "42 "13 - "33 -3 Net long-term capital gain (less loss) .. 2,358 '1,025 - - 1,334
Partnerships With Net Income Number of partnerships ......................................... 36,853 4,731 3,133 5,346 23,643 Number of partners ................................................ 78,095 10,287 6,653 11,083 50,072 Total assets ........................................................... 1,145,643 132,080 39,343 120,101 854,111 Total receipts .... ~ .................................................... 5,060,374 850,414 281,155 668,798 3,260,007
Business receipts ............................................ 5,003,343 845,252 277,956 654,460 3,225,675 Income from other partnerships ar1d fiduciari#ls .. '864 - - - '664 Nonqualifying dividends ................................ '2,775 "42 - - '2,733 Interest received .. 7,041 1,397 '117 311 5,215 Rents received . 10,461 '656 '2,837 '235 6,733 Royalties ... '726 - - - *726 Farm net profit ............................................. ..... "64 - - ·65 "84 Net gain, noncapital assets .. 7,142 1,464 "59 5,554 Other receipts. 27,937 1,604 '185 13,727 12,422
Total deductions .................................................... 4,159,069 730,703 215,628 525,354 2,688,184 Cost of sales and operations. 2,675,597 548,633 125,266 319,653 1,681,824
Inventory, beginning of year .. 112,403 30,072 '1,514 8,435 72,382 Purchases ... 1,021,345 245,307 30,476 76,561 669,001 Cost of labor .............. 532,026 55,776 55,897 104,069 316,264 Material and supplies .. 602,655 134,757 23,081 76,970 365,847 Other costs .......................... 512,017 105,896 15,805 57,374 332,939 Less: lr1ventory, end of year .. 104,849 22,978 '1,485 5,757 74,629
Salaries and wages .. 404,979 40,238 29.621 84,256 250,864 Less: Jobs credit.. 1,934 "72 .,. - 1,764
Guarar1teed payments to partners . 141,247 24,929 '8,755 13,422 94,140 Rent paid ........ 52,531 4,778 2,225 6,127 39,400 Interest paid ... 38,892 4,076 1,709 2,263 30,845 Taxes paid .. 110,306 14,830 7,377 18,591 69,509 Bad debts .. 4,736 1,177 '413 724 2,422 Repairs .......... 50,150 4,089 1,252 4,658 40,150 Depreciation .. 131,212 14,281 5,565 11,405 99,961 Amortilatiorl .. 470 - '144 - 3N Depletion .• '548 - - '296 *252 Pension, profit sharing, ;mnuity, and bond purchase
plarls ....................... 5,541 1,555 '389 '677 2,919 Employee benefit plans .................................... , 30,921 3,704 5,137 6,523 16,558 Net Joss from other partnerships and fiduciaries . "108 "1 - - '108 Farm net loss. - - - - -Net loss, noncapital assets .. 1,602 "7 "1 - 1,594 Other deductions .. ...... 512,962 68,275 27,851 56,758 360,079
Net Income (less deficit) ........................................ 900,505 119,712 65,527 143,444 571,623 Capital gains and losses allocable to partners:
Net short·term capital gain (less loss) .... "41 "13 - ' "33 -4 Net lorlg·term capital gain (less loss) ....... 2,357 '1,025 - - 1,332
Footnotes at ond of table.
33
Manufacturing
Lumber and wood Pn!lting, Mach•nery, Other
Total products, pubhshing, except manu-
oxcapt and allied aloctr•cat ractunng furniture ondustlies ondustnos
(25) (25) (27) (28) (29)
30,454 5,972 6,517 1,322 16,643 87,230 14,306 10,852 2,809 51,103
8,900,756 1,227,652 788,347 375,985 6,508,572 13,467,931 1,966,794 908,413 674,618 9,918,107 13,107,695 1,887,044 888,893 647,738 9,684,220
32,426 '121 - '271 '32,034 3,513 "1 "52 - 3,450
61,294 7,699 4,611 13,709 35,274 22.235 5,702 6,262 '309 9,963 15,434 '6,273 ·se '126 8,949
'804 '794 - "11 -23,586 3,599 5,178 649 14,161
200,744 55,561 3,321 11,807 130,055 12,983,368 1,897,656 821,611 634,716 9,629,385
9,248,281 1,251,089 356,942 453,444 7,166,806 1,009,634 120,182 27,118 126,921 735,413 6,050,279 675,108 188,451 256,454 4,930,267 1,297,032 167,890 72,247 85,044 971,851
615,050 164,522 32,945 16,414 401,169 1,459,757 251,576 75,533 68,229 1,064,418 1,183,471 128,190 39,351 99,617 916,312
708,303 127,513 93,803 47,367 439,619 2,289 628 '173 .,. 1,470
167,831 32,620 22,216 6,706 106,289 169,142 26,179 16,733 9,242 116,987 281,775 40,092 17,595 20,464 203,625 239,104 38,990 20,446 7,960 171,706 '27,646 1,011 4,430 539 21,665
151,249 41,059 18,270 4,764 87,156 453,956 86,506 58,134 14,437 294,878
5,745 1,081 2,356 - 2,309 66,176 64,563 "95 - 1,519
24,975 2,961 1,965 '1,006 19,042 60,836 8,258 5,250 4,997 42,331 22,893 '191 '5,884 "10 '16,808
"65 "65 - - -4,271 '3,331 "64 ... 832
1,353,209 172,776 197,600 63,752 919,081 484,564 69,130 86,002 39,902 288,721
1,357,723 146,144 165,542 72,263 973,774 873,159 77,006 78,739 '32,361 685,052
4,261 1,036 -116 - 3,342 39,216 21,828 '2,937 ·.s 14,436
19,076 4,472 3,416 1,092 10,096 51,150 10,376 9,993 2,411 28,370
4,530,556 460,722 282,274 202,408 3,505,152 10,009,171 1,317,685 685,744 365,479 7,700,263
9,883,012 1,303,388 669,841 375,789 7,533.994 *23,536 '119 - '271 '23,146
2,593 "1 "48 - 2,544 33,456 3,971 3,796 2,502 23,185 17,224 1,611 6,220 '309 9,065 8,881 '719 ·as '126 7,950 '776 '766 - "11 -
20,773 3,234 4,204 '" 13,211 98,919 3,878 1,547 6,348 87,146
8,731,448 1,171,541 520,202 313,216 6,726,489 6,589,730 753,405 251,3'/1 225,431 5,359,524
628,285 75,507 21,938 45,537 485,304 4,571,609 508,100 157,422 108,748 3,797,339
931,953 96,771 43,454 40,208 751,520 334,381 60,617 14,714 11,822 247,228 890,808 96,812 42,253 48,060 703,683 767,305 84,401 28,411 28,944 625,550 526,615 103,142 77,108 23,288 323,077
1,792 623 '114 "18 1,036 109,526 23,242 8,428 6,083 71,774
87,150 18,976 10,251 2,954 54,969 91,872 15,713 5,042 2,710 68,407
174,267 28,573 15,645 5,807 124,242 17,846 703 3,512 "' 13,350
114,491 36,805 17,446 3,070 57,171 237,629 46,770 12,680 8,476 169,703
3,996 '575 1,826 - 1,595 12,005 '10,504 - - '1,502
16,893 1,980 1,860 '625 12,429 38,397 6,386 4,448 4,147 23,416
1,193 "16 '421 "3 "754 - - - - -
957 '315 •so "44 538 710,673 125,060 110,220 30,314 445,078
1,357,723 146,144 165,542 72,263 973,774
3,491 '281 -116 - 3,326 16,508 9,566 '2,937 ·.s 3,991
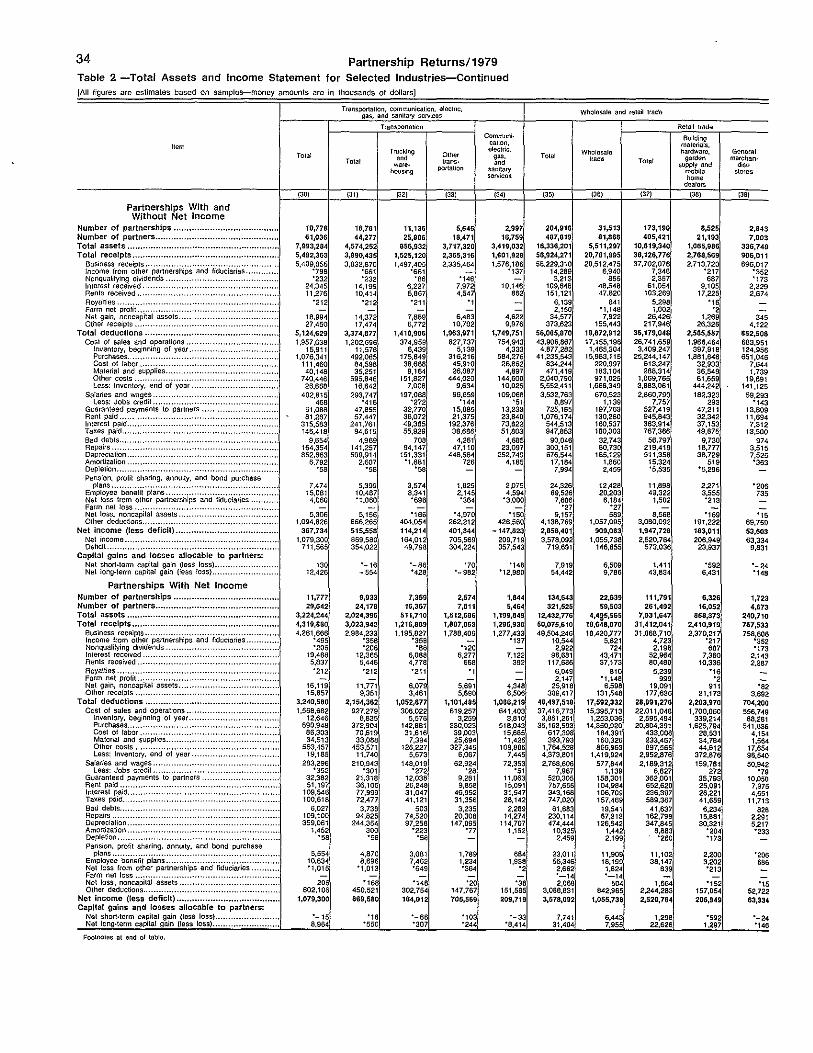
34 Partnership Returns/1979 Table 2 -Total Assets and Income Statement for Selected Industries-Continued (All figures are estimates based on samples-money amounts are in thousands of dollars]
Transportation, communication, olectnc, Wholesale and retail Wide gas. and sanitary services
Transportation Retarl tmde Communi·
~~~~~\~?s. Item cation,
Total Tnucking Other
electric, Wholesale hardware, General
'"' gas. Tol61 lrads garden mcrchan-Total ware- trans· ood Total supply and dose
housrng portaliOn samtary moMe stores services horne
doaloro
(30) {31) "" (33) (34) (35) (35) (37) (38) (39)
Partnerships With and Without Net Income
Number of partnerships .....................•.•.........•....... 19,778 16,761 11,136 5,645 2,997 204,916 31,513 173,190 8,525 2,843 Number of partners ................................................ 61,036 44,277 25,806 18,471 16,759 487,819 81,868 405,421 21,193 7,003 Total assets ........................................................... 7,993,284 4,574,252 856,932 3,717,320 3,419,032 16,336,201 5,511,297 10,819,340 1,065,986 336,749 Total receipts ......................................................... 5,492,363 3,890,435 1,525,120 2,365,316 1,601,928 58,924,271 20,781,995 38,126,776 2,769,569 906,011
Business receipts ........................................... 5,409,055 3,832,870 1,497,405 2,335.464 1,576,186 58,229,310 20,512,475 37,702,076 2,713,720 896,017 Income from other pannerships and fiduciaries .. '798 '661 '661 - '137 14,289 6,940 7,348 '217 '352 Nonqualifying dividends .. '232 '232 .86 '146 - 3,213 856 2,357 687 '173 Interest rece1ved. 24,345 14,199 6,227 7,972 10,146 109,848 48,548 61,054 9,105 2,329 Rents received .... 11,276 10.414 5,667 4,54 86 151,121 47,820 103,269 17,225 2.674 Royalties ............ '212 '212 '211 ., - 6,139 "' 5.298 .,. -Farm net profit. .................... - - - - - 2,150 '1,148 1,002 .2 -Net gain, noncapitat a5sets .. 18,994 14,372 7,889 6,483 4,622 34,577 7,922 26.426 1,269 '" Other receipt~ . 27,450 17,474 6,772 10,702 9,976 373,623 155,443 217,946 26,326 4,122
Total deductions ....................... ............................ 5,124,629 3,374,877 1,410,906 1,963,971 1,749,751 56,065,870 19,872,912 36,179,048 2,585,557 852,508 Cost of sates and operations ..•... 1,957,638 1,202,696 374,95 827,737 754,943 43,906,86 17,155,19 26,741,659 1,966,464 663,951
Inventory, beginning of year ... 15,911 11,576 6,439 5,139 4,333 4.677,262 1,465,304 3,409,247 397,916 124,956 Purchases ........ 1,076,341 492,065 175,649 316,216 564,276 41,235,543 15,983,115 25,244,147 1,681,646 651,046 Cost of labor ................ 111,460 84,596 36,688 45,910 26,862 834,244 220,997 613,247 32,933 7,644 Material and supplies ... 40,148 35,251 9,164 26,067 4,897 471,419 163,104 286,314 36,549 1,739 Other costs .......................... 740,446 595,646 151,827 444,020 144,600 2,040,790 971,025 1,069,765 61,659 19,691 Less: Inventory, end of year. 26,668 16,642 7,006 9,634 10,026 5,552,411 1,668,349 3,683,061 444,242 141,125
Salaries and wages ... 402,615 293,747 197,068 96,659 109,066 3,532,763 670,523 2,860,790 182,323 59,293 Less: Jobs credit .. 466 '416 '272 '144 ., 6,897 1,139 7,757 293 '143
Guaranteed payments to partners . 61,088 47,855 32,770 15,065 13,233 725,165 197,763 527,419 47,211 13,809 Rent paid ....... 81,287 57,447 36,072 21,375 23,840 1,076,174 130,280 945,843 32,342 11,694 Interest paid .. 315,583 241,761 49,385 192,376 73,622 544,513 160,537 363,914 37,153 7,312 Taxes paid .. 146,416 94,615 55,929 36,686 51,603 947,853 180,303 767,366 49,875 13,500 Sad debts .• 9,654 4,96 708 4,261 4,685 90,04 32,743 66,79 9,730 974 Repairs ........ 164,354 141,257 94,147 47,110 23,097 300,151 80,730 219,419 16,777 3,515 Deprec1ation ... 852,663 599,914 151,331 448,564 252,749 676,544 165,129 511,356 38,729 7,525 Amortization . 6,792 2,607 '1,681 726 4,185 17,184 1,660 15,324 519 '363 Depletion .. ·sa ·sa •sa - - 7,994 2,459 '5,535 '5,296 -Pension, profit sharing, annuity, and bond purchase
plans ....................... 7,474 5,399 3,574 1,625 2,075 24,326 12,428 11,696 2,271 '206 Employee benefit plans .................................... 15,061 10,487 6,341 2,145 4,594 69,526 20,203 49,322 3,555 735 Net loss from o111er partnerships and fiduciaries. 4,060 '1,060 '696 '364 '3,000 7,866 6,184 1,502 '213 -Farm net loss ...................... - - - - - ., ., - - -Net loss, noncapital assets .. 5,306 5,156 '186 '4,970 '150 9,157 589 8,566 '169 .15 Other deductions .. 1,094,826 666,265 404,054 262,212 428,560 4,136,769 1,057,095 3,060,092 191,222 89,759
Net income (less deficit} ........................................ 367,734 515,558 114,214 401,344 -147,623 2,656,401 909,083 1,947,726 183,011 53,503 Net income .. 1,079,30 869,58 164,01 705,56S 209,719 3,578,092 1,055,738 2,520,764 206,949 63,334 Deficit .. 711,565 354,022 49,798 304,224 357,543 719,691 146,655 573,036 23,937 9,631
Capital gains and losses allocable to partners: Net short-term capital gain (less loss) ... 130 -16 -86 .70 '146 7,919 6,509 1,411 '592 -24 Nel long-term capital gain (less lc~~) .. 12,426 -554 '428 -962 '12,960 54,442 9,766 43,834 6,431 '146
Partnerships With Net Income Number of partnerships ......................................... 11,777 9,933 7,359 2,574 1,844 134,643 22,639 111,791 6,326 1,723 Number of partners ................................................ 29,642 24,176 16,367 7,611 5,464 321,525 59,503 261,492 16,052 4,673 Total assets ........................................................... 3,224,244 2,024,396 511,710 1,512,666 1,199,649 12,432,776 4,425,565 7,931,647 666,373 240,710 Total receipts ......................................................... 4,319,660 3,023,942 1,216,069 1,607,053 1,295,938 50,075,610 16,648,070 31,412,041 2,410,919 767,533
Business receipts ........................................... 4,261,666 2,984,233 1,195,827 1,788,406 1,277,433 49,504,246 18,420.777 31,068,710 2,370,21 758,606 Income from other partnerships and fiduciaries .. '495 '356 '358 - '137 10,544 5,621 4,723 '217 '352 Nonqualifying dividends . '206 '206 .86 '120 - 2,922 724 2,198 687 "173 Interest rece1ved .. 19,468 12,365 6,066 6,277 7,122 96,681 43,471 52,964 7,360 2,143 Rents recefved .. 5,837 5,446 4,778 668 392 117,686 37,173 60,480 10,336 2,267 Royalties ............ '212 '212 '211 ., - 6,049 810 5,239 .,. -Farm net profit., .................... - - - - - 2,147 '1,146 999 .2 -Net gair~, noncapital assets .. 16,119 11,771 6,07 5,691 4,346 25,916 6,598 19,091 911 . ., Other receipts ... 15,657 9,351 3,461 5,890 6,506 309,417 131,546 177,636 21,173 3,692
Total deductions ..................... .............................. 3,240,500 2,154,362 1,052,677 1,101,485 1,086,219 46,497,518 17,592,332 26,891,276 2,203,970 704,200 Cost of sales and operations ...... 1,568,682 927,279 306,022 619,257 641,403 37,416,773 15,395,713 22,011,046 1,700,060 556,749
Inventory, beginning of year ... 12,646 8,835 5,576 3,259 3,810 3,651,261 1,253,036 2,595,494 339,214 88,281 Purchases .. , ...... 890,948 372,904 142,861 230,023 518,043 35,163,593 14,350,920 20,604,391 1,625,794 541,636 Cost of labor .............. 86,303 70,619 31,616 39,003 15,685 617,39 184,391 433,006 26,531 4,154 Material and supplies .. 34,513 33,0S6 7,394 25,694 '1,425 393,793 160,326 233,467 34,784 1,564 Other costs ......................... 563,457 453,571 126,227 327,345 109,665 1,764,528 666,963 897,565 44,612 17,654 Less: Inventory. end of year. 19,185 11,740 5,673 6,067 7,445 4,373,801 1,419,924 2,952,676 372,676 96,540
Salaries and wages .. 283,296 210,943 148,019 62,924 72,353 2,768,606 577,844 2,189,312 159,78~ 50,942 Less: Jobs credit ...................... '352 '301 '272 .,. ., 7,967 1,139 6,627 272 .,
Guaranteed payments to partners . 32,362 21,316 12,036 9,261 11,063 520,305 156,301 362,001 35,793 10,050 Rent paid ..... 51,19 36,106 26,248 9,856 15,091 757,656 104,984 652,620 25,091 7,975 Interest paid ...... 109,546 77,999 31,047 46,952 31,547 343,168 106,709 236,397 26,221 4,551 Taxes paid ... 100,618 72,477 41,121 31,356 28,142 747,020 157.469 589,367 41,659 11,713 Sad debts .. 6,027 3,736 503 3,235 2,289 61,683 19,541 41,637 6,234 828 Repairs ........ 109,100 94,825 74,520 20,306 14,274 230,114 67,313 162,799 15,661 2,291 Depreciation ...... 359,061 244,354 97,258 147,095 114,707 474,444 126,542 347,845 30,321 5,217 Amortization ... 1,452 300 '223 ·n 1,152 10,325 1,442 6,883 '204 '233 Depletion._ ·sa ·sa ·sa - - 2.459 2,199 '260 "173 -Pension, profit sharing, annuity, and bond purchase
plans ....................... ..................... 5,554 4,870 3,061 1,789 664 23,011 11,909 11,102 2,200 '206 Employee benefit plans ..................................... 10,634 8,696 7,462 1,234 1,936 56,346 18,199 36,147 3,202 666 Net loss from other partnerships and fiduciaries .. "1,015 '1,013 '649 .,., .2 !,662 ~.624 839 '213 -Farm net loss .................. - - - - - _,. _,. - - -Net loss, noncapital assets. ....... 206 .,. .,. .20 .38 2,068 504 1,664 '152 .15 Other deductions .. 602,106 450,521 302,754 147,767 151,585 3,068,631 842,965 2.244,263 157,054 62,722
Net Income (less deficit) ........................................ 1,079,300 869,680 164,012 705,569 Capital gains and losses allocable to partners:
209,719 3,578,092 1,055,730 2,520,764 206,949 63,334
Net short-term capital gain (less loss) .. ....... -15 .16 -86 '103 -33 7,741 6,443 1,298 '592 -24 Net tong-term capital gain (tess loss) .......... .............. 8,984 '550 '307 '244 '8,414 31,404 7,955 22,626 1,297 '146
Footnotes at Gnd of table.

Partnership Returns/1979 Table 2~-Total Assets and Income Statement for Selected Industries-Continued
are estimates based on
ltom
Partnerships With and Without Net Income
amount$ are ln thousands of
, ... '"""""' and homo lumishlngs
storos
Eating placos
35
29,295 78,421
1,948,173 5,005,394 5,855,760
•644 ., 5,839
16,542 .25
7,251 19,300
5,667,497 2,834,729
93,903 2,338,295
333,028 63,960
106,627 101,084 978,072
3,151 82,021
329,475 90,930
224,758 1,901
68,849 t54,7n
6,959
1,362 14,917 .,
639 860,986 237,897 429,735 191,837
"173 6,948
18,721 49,306
1,175,334 4,324,656
4,288~~~~ ., 4,481
11,817
4,911 14,391
3,894,921 2,021,494
64,226 1,682,295
211,995 44,121 87,180 68,332
670,200 2,659
52,592 214,101
44,442 153,873
'" 47,269 93,933
4,483
1,324 9,~~
,, 583,156 429,735

36 Partnership Returns/1979 Table 2.-Total Assets and Income Statement for Selected Industries-Continued [All figures are estimates based on samples-money amounts are in thousands of dollars]
llem
Partnerships With and Without Net Income
Number of partnerships ................................... , Number of partners .........................•......................... Total assets ............................................................... . Total receipts ........................................... ..
Business receipts .......................................... . Income from other partnerships and fiduciaries .. Nonqualifying dividends.,. Interest received . Rents received . Royalties .. Farm net profit ....................... . Net gain, noncapital ussets .. Other receipts ..
Total deductions ....................................................... .. Cost of sales and operations .
Inventory, beginning of year ... Purchasas .... .. Cost of labor ............. .. Material and supplies .. Other costs ............................. . Less: inventory, end of year .. ..
Salaries and wages .. . Less·. Jobs credit .................... ..
Guaranteed payments to partners .. Rent paid. Interest paid .. Taxes paid ... Bad debts .. Repairs .......... . Depreciation .. Amortization . Depletion •. Pens1on, profit sharing. annuity, and bond purchase
plans .......................................................... . Employee benefit plans ......................... ~ ......... . Net loss from other partnerships and fiduciaries .. Farm net loss .................... .. Net loss, noncapital assets .. Other deductior~s ..
Net income (less deficit) .......................... .. Net income ... Deficit ...
Capital gains and losses allocable to partners: Net short·term capital gain (le.:;s lo!.m) ... Net long·term capital gam (less loss) ..
Partnerships With Net Income Number of partnerships .............................................. . Number of partners ................................................... .. Total assets ............................................................... .. Total receipts ............................................................ ..
Business rec<Jipts ........................................... . Income from other partnerships and fiduciaries .. . Nor~qualifying dividends ................................ . Interest rece1ved . Rents received . Royalties ............ . Farm net profit . Net gain, noncapital assets .... . Other receipts .................... .
Total deductions ......................................................... . Cost of sales and operations ..... ..
Inventory, beginnir19 of year .. . Purchases ..... .. Cost of labor ......... .. Material and supplies Other costs .......................................... . Less: lnventol)', end c! year ..
Salaries and wages .. . Less·. Jobs credil .................. ..
Guaranteed payments to partners .. Rent paid ....... Interest paid .. Taxes paid .. Bad debts .. Repairs ........ Depreciation .. Amortization . Depletion .. Pensior'l, profit sharing, annuity. and bond purchase
plans ...................... . Employee benefit plans .................................. .. Net loss from other partnerships and fiduciaries .. Farm net loss .................... .. Net loss, noncapital assets .. Other deductions ..
Net income (less deficit) ........................................... . Capllal gains and losses allocable to partners:
Net short-term capital gain (less loss) ... Net long·term capital gain (less loss) ..
Footno1o5 a1 ond or 1able.
Wholesalo and retllil tradii-Conbnued
Ratai! Jrada-Conlinued
Dnnl<ing L1quor places stores
(SO)
9,040 21,050
365,503 770,914 752,692
1,403 4,802
5,204 6,812
711,597 379,042
21,014 346,289
14,196 8,550
13,950 24,956 70,964 ., 15,669 31,535 I 7,450 34,244
I ,460 11,257 28,272
'842
"436 '71 1 '624
"57 119,157
59,317 83,120 23.803
"51 '2,417
5,595 13,133
199,253 544,658 531,236
1,123 3,552
'3,360 5,387
461,538 268,023
13,667 248,919
11,937 3,224
'7,337 17,081 41,631
'122 7,495
17,952 7,371
23,393 299
7,254 14,455
'630
'436 '524
"22 72,174 83,120
.,
(51)
3,746 9,414
333,069 1,180,916 1,172,420
"2 "1 362
1,433 "3
"30
"' 6,184 1,124,630
940,184 102,312 947,461
2,996
"' '335 113,681 48,802
"32 10,489 23,071
9,976 21,635
t,t85 6.112
12,410 1,184
"65 <65
"75 50,Qt8 56,278 63,842
7,563
"20 '2,281
2,842 6,199
242,414 983,545 975,911
"2 ., 319
1,174 ., "30
'468 5,624
919,704 762,245
81,239 787,511
1,903 696
'335 89,439 37,764
"32 6,146
18,072 7,005
15,680 724
3,816 8,862
"' "65 455
"1 38,056 63,842
"20 '1,603
Other mtail
stores
(52)
47,749 105,91
1,916,353 5,347,085 5,292,184
'1,207 54
13.158 9,028
<60 "1
4,094 26,8g9
4,943,356 3,550,875
779,159 3,412,766
38,248 46,958
205,031 931,288 357,454
2,108 97.825
174,054 50,591 98,595
7,826 25,395 75,504
2,155 "95
2,202 5,368 '143
4,385 492,994 403,729 500,199
96,470
'322 13,201
28,130 63,107
1,444,215 4,456,022
4,411~~~~ 53
11,707 6,687 '460
"1 3,571
21,443 3,955,823 2,919,517
5g2,580 2,768,660
32,663 33,848
163,475 691,710 286,887
2,002 70,266
118,360 34,099 77,583
6,956 18,564 52,719
650 "85
2,154 4,561 '104
250 365,069 500,199
'322 9,344
Total
(531
577,336 4,271,344
331,625,052 76,258,032 65,911,001
916,636 78,136
6,472,164 392,849 322.023
1,660 566,368
1,597,196 76,770,961
8,618,895 2,843,637 3,041.597
146,844 480,937
5,877,243 3,771,563 2,945,373
2,095 817,772
1,155,811 16,119,115 4,485,561
105,173 1,937,138 9,537,785
194,367 22,417
46,313 73,996
2,169,694 '3,020
299,292 28,249,331
-520,929 12.647,300 13,168,229
110,148 4,114,307
293,167 2,361,752
140,498,503 45,429,762 37,565,741
877,794 69,977
4,856,330 220,580 304,323
"1,358 457,684
1,075,974 32,782,462
6,747,471 1,794,551 2.146,239
86,675 260,302
4,559,572 2,099,668 1,629,690
1,536 361,626 507,356
5,212,150 1,962,243
40,414 748,254
3,046,419 41,365 \1,613
34,956 41,546 62,541
11,261 12,302,695 12,647,300
103,424 1,751,326
Finance, insuranco, and real estate
Rnance
Total
(54)
139,453 2,020,003
94,703,747 21,185,327 !3,931,238
783,195 67,493
5,261,017 109,249 302,314
'765 173,111 556,946
20,721,809 96,221 55,504
153,061 3,244 2,346
62,147 180,081 833,116
618 362,526 140,653
2,385,828 233,361
27,509 37,455
468,712 23.599 16,176
32,174 22,190
1,757,045 '2,634
262.SS3 14,020,12
463,510 5,110,573 4,647,055
31,707 1,977,751
83,805 1,404,522
53,429,854 13,125,416 7,339,315
758,899 61,200
4.005,742 83,611
287,776 '763
149,658 436,450
0,014,843 87,469 10,361
106,305 '1,578 1,971
23,532 56,299
527,524 515
171,817 62,088
965,807 123,005
10,673 23,044 98,285
3,746 10,750
23,421 12,126 41,798
7,400 5,826.40 5,110,573
74,137 969,852
a~~~~~~~~it agencios
other than banks
(55)
3,365 28,318
2,473,969 400,752 167,727
'1,590 '1,574
198,471 4,473
·s • 1,908 5,004
246,793 '142
'142
40,240 "12
6,787 7,531
68,339 5,619 3,42 1,175 4,599 '324
"2,043 1,371 '393
"12 104,603 153,959 165,820
11,861
120 18,720
2,999 26,366
2,042,133 379,518 174,938
'1.590 '1,574
190,724 4,408
·s '1,905 4,373
213,697 "142
'142
37.221 "12
6,657 7,012
60,381 5,281 3,054 1,017 2,868
"82
'2,043 1,362 '310
"2 86,278
165,820
117 18,301
Security
'"' commOOity brokers and
SOIVICO
(56)
3,416 19,193
21,169,987 14,150,440 12.716,450
19,628 2.113
1,066,809 4,120
'1,367
10,13 329.821
13,942,861 61,687
'54,714
'6,973
705,369 531
t95.525 66,543
1,018,797 83,112
4,671 6,423
23,272 2,257
·s
27,231 11,337
114,221
41,195 I 1,579,749
207,579 744,533 536,953
-46,539 469,093
2,473 13,154
10,811,506 7,385,625 6,644,485
17,781 1,086
455,147 4,008
'1,037
4,404 257,676
6,641,092 '58,g79
'52.006
'5,g73
453,8go 434
127,667 46,935
478,256 57,267
1.922 5,452
17,105 1,235
·s 21,107
9,712 13,295
'2.386 5,346,309
744,533
14,040 35.72g
Holding
'"' nwestmont companies
(57)
132,652 1,973,292
71,059,792 6,634,135 \,027,061
761,977 63,806
3,995,738 100,655 300,941
'765 161,070 222,122
6,532,156 34,392 55,504 98,346
3,244 2,346
55,032 180,081 87.506
"75 160,214 64,579
1.296,592 144,450
19,411 29,855
440,841 21,016 16,172
2,goo 9,482
1,642,430 '2,834
221,676 2.335,776
101,979 4,200,220 4,098,240
78,126 1,46g,939
78,333 1,365,002
40,576,215 5,360,273
519,6g1 739,529
56,539 3,359,672
75,195 286,735
'763 143,349 175,401
1,160,053 28,346 10,381 54,300 '1,578 1,971
16,417 56,299 36,413
"68 37,493 28,140
427,166 60,458
5,696 16,576 78,313
2,428 10,745
271 1,052
28,193
5.o11 393,616
4,200,220
59,980 915,822
Insurance agents, brokers,
'"' 5crvice
(58)
6,912 22,397
3,068,319 3,235,738 2,953,512
'1,835 '1,827
116,073 7,662
"10
377 154,442
2,800,860 325,077
'302 71,412
1,442 "16,317 241,174
'5,569 273,664
'300 58,028 40,052 17,350 33,423
8,100 5,977
16,894 589 "38
6,479 9,617
'1,550
"24 2,004,299
434,878 522,g81
88.103
-626 -9,794
6,037 16,995
2,685,984 2,999,115 2,736,555
'1,795 '1,827
105,920 7,500
"10
"' 145,373 2,476,134
227,286 '302
65.466 '940
'16,073 144,852
'347 232,051
'132 41,537 36,301 14,995 28,926
6,756 5,900
14.463 "457
6,237 9,370
'1,442
.,. 1,850,519
522,981
-626 -12,911
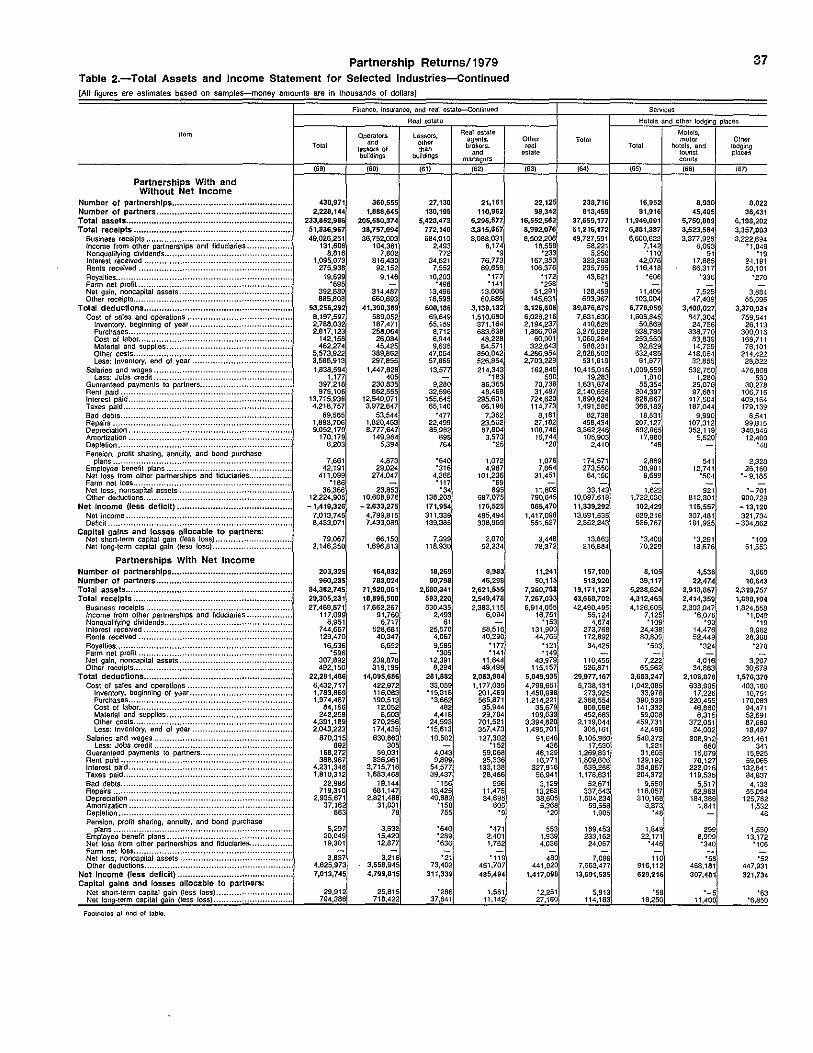
Partnership Returns/1979 Table 2.-Total Assets and Income Statement for Selected Industries-Continued [All figures are estimates based on samples-money amounts are in thousands of dollars]
nom
Partnerships With and Without Net Income
Number of partnerships ..•..•.•.........•.........•.•...•...•.•........ Number of partners ...•..•••.•..••.....•...••..•...•.•...•.....••.•..... Total assets ..............................................................•.. Total receipts ............................................................. .
Business receipts ............................................ . Income from other partnersh'1ps and fiduciaries ... . NonqualifyinQ dividends .. Interest receiVed . Rents received • Royalties ........ .. Farm net profit .................... . Net gain, noncapital assets .... . Other receipts .................... .
Total deductions ........................................................ .. Cost of sales and operations .
Inventory, beginning of year .. Purchases ...................... . Cost of labor ................ . Material and supplies .. Other costs ........................... . Less: Inventory, end of year ..
Salaries and wages .. Less: Jobs credit ....................... .
Guaranteed payments to partners .. . Rent paid ... Interest paid Taxes paid .. Bad debts ................. .. Repairs ............................ .. Depreciation .. Amortilation • Depletion .... Pension, profit sharing, annuity, and bond purchase
plans ........................ . Employee benefit plans .............................. .. Net loss from other partnerships and fiduciaries Farm net loss ....................... .. Net loss, noncapital assets ... . Other deductions ..
Net Income (less deficit) ........................................... .. Net income .................... . Deficit ..
Capital gains and losses allocable to partners: Net short-term capital gain (less loss) .................... . Net long-term capital gain (less loss) ..
Partnerships With Net Income Number of partnerships ............................................. .. Number of partners .................................................... , Total assets ............................................................... .. Total receipts ............................................................. .
Business receipts .......................................... . Income from other partnerships and f1duciar'1es .. Nonqualifying dividends .. Interest received .. Rents received . Royalties .•.• Farm net profit ............... .. Net gain, noncapital assets. Olher receipls ..
Total deductions ......................................................... . Cost of sales and op0rations .
lnvenlory, beginning of year .. Purchases ...... . Cost of labor .............. . Material and supplies .. . Other costs ..................... . Less: lnvenlory, end of year.
Salaries and wages ....................... . Less: Jobs credit.................. .. ................. .
Guaranteed payments to partners Rent paid ................................................ . Interest paid ....................... . Taxes paid ... Bad debts .. .. Repairs ................................................. . Deprec'ialion .. Amortization Depletion .... Pension, profit sharing, annuity, and bond purchase
plans .......................................................... . Employee benefit plans ................................... . Net loss from other partnerships and fiduciaries .. Farm net loss.. • .......... . Net loss, noncapital assets . Other deductions.. .. .............. .
Net income (Jess deficit) ............................................ . Capital gains and losses allocable to partners:
Net short-term capital gain (less loss).. .. .............. . Net long-term capital gain (less loss) ....
Footnotos at end of tabla.
Total
(59)
430,971 2,228,144
233,852,986 51,836,967 49,026,251
131,606 8,816
1,095,073 275,938
19,699 '895
392,880 885,808
53,256,29 8,197,597 2,788,032 2,817,123
142,158 462,274
5,573,922 3,585,913 1,838,594
1,177 397,218 975,106
13,715,938 4,218,757
69,565 1,893,706 9,052,179
170,179 6,203
7,661 42,191
411,099 "186
36,386 12,224,905
-1,419,326 7,013,745 8,433,071
79,067 2,146,350
203,325 960,235
84,362,745 29,305,231 27,489,871
117,099 6,951
744,667 129,470
16,536 "596
307,892 492,150
22,291,486 6,432,717 1,783,869 1,974,467
84,156 242,258
4,391,189 2,043,223
870,315
'" 168,272 388,967
4,231,348 1,810,312
22,985 719,310
2,935,671 37,162
863
5,297 20,049 19,301
3,637 4,625,973 7,013,745
29,912 794,386
Finance. insurance, and real oslate-Conunued
Operators
'"' lossom of buildings
(60)
360,555 1,888,645
205,580,374 38,757,094 36,752,003
104,381 7,602
816,430 92,152
9,146
314.467 660,693
41,390,369 569,052 167,471 258,064
26,064 45,425
389,862 297,855
1,447,828 405
230,835 862,555
12,540,071 3,972,647
53,544 1,820,463 6,777,647
149,964 5,394
4,873 29,024
274,047
23,853 10,606,976
-2,633,275 4,799,815 7,433,089
66,150 1,896,813
164,832 783,024
71,920,061 18,895,500 17,662,267
91,760 6,717
528,681 40,347
6,652
239,878 319,199
14,095,686 422,972 116,063 190,513
12,052 8,503
270,256 174,435 630,863
305 59,031
336,961 3,715,716 1,683.468
19,144 681,147
2,821,488 31,031
79
3,632 15,420 12,877
3,218 3,658,945 4,799,815
25,815 718,422
Real ostatu
Lessors, other tMn
building~
(61)
27,130 130,195
5,423,473 772,140 684,010
2,493 772
34,521 7,552
10,203 '496
13,496 18,596
600,186 69,649 55,159
8,712 6,944 9,635
47,064 57,865 13,577
9,280 32,596
155,645 65,140
'477 22,499 85,982
898 764
'640 '316
4,365 '117 .,.
138,208 171,954 311,339 139,385
7,399 118,930
18,269 80,798
2,580,341 593,220 530,435
2,493 81
25,570 4,067 9,585 '305
12,391 8.294
281,882 33,059
'15,318 '3,862
482 4,418
24,593 "15,613
10,502
4,043 9,899
54,577 39.437
'156 13.425 40,68
"156 755
'640 '289 '636
., 73,402
311,339
'286 37,641
Real ostate agents. brokers.
'"' managers (62)
21,161 110,962
6,296,577 3,315,657 3,088,031
6,174 ., 76,773 69,858
'177 '141
13.606 60,886
3,139,132 1,510,680
371,164 683.638
48,228 64,571
850,042 526.964 214,343
'183 86,365 46,468
295.601 66.196
7,362 23,562 87,804
3,573 "25
1,072 4,987
10!,236 "69 895
687,075 176,525 465,494 308,969
2,070 52,234
8,983 46,296
2,621,555 2,549,478 2,383,115
6,094
58,516 40,290
'177 '141
11,644 49,499
2,063,984 1,177,035
201,469 565,871
35,944 29.704
701,521 357,473 137,302
"152 59,068 25,336
133,138 28,466
556 11,475 34,695
605 ., '471
2.401 1,752
'119 451,707 485,494
1,561 11,142
Other real
oMate
(63)
22,125 98,342
16,552,562 8,992,076 8,502,206
16,556 '233
167,350 106,376
"172 '258
51,291 145,631
8,126,606 6,028,216 2,194,237 1,866,709
60,901 322,643
4,286,954 2,703,229
162,846 590
70,738 31,487
724,620 114,773
8,181 27,182
100,746 15,744
"20
1,076 7,864
31.451
11,603 790,645 865,470
1,417,098 551,627
3,448 78,372
11,241 50,115
7,260,788 7,267,033 6,914,055
16,751 "!53
131,900 44,766
'121 "149
43,979 115,157
5,849,935 4,799,651 1,450,998 1,214,221
35,679 199,633
3,394,820 1.495,701
91,648 436
46,129 16,771
327,916 58,941
3,129 13,263 38,605
5,368 "20
553 1,939 4,036
480 441,920
1,417,098
'2,251 27,180
Total
, .. , 238,716 813,459
37,659,177 51,216,172 49,727,591
58,221 5,250
323.263 235,795
43,621 "5
128,459 693,967
39,876,679 7,631,630
410,625 3,275,628 1,060,264
588,231 2,828,502
531,619 10,415,018
19,283 1,631,674 2,140,658 1,890,824 1,491,595
82,738 498,434
3,362,246 105,903
2,410
174,571 273,550
64,150
33,143 10,097,618 11,339,292 13,691,535 2,352,243
13,863 216,884
157,109 513,920
19,171,137 43,668,702 42,490.495
55,124 4,674
273,766 172,892 34,425
110,455 526,871
29,977,167 5,738,131
273,925 2,368,554
809,068 452,663
2,119,044 305,161
9,105,960 17,530
1,269,831 1,609,606
639,268 1,178,631
52,671 337,543
1,504,234 59,658
1,905
169,453 233,162
24,067
7,099 7,663,477
13,691,535
5,913 114,183
37
Services
Hotels and other lodging places
Total
(65)
16,952 81,916
11,949,091 6,881,387 6,600,623
7,142 '110
42,076 t16,418
'606
11,409 103,004
6,778,958 1,606,645
50,869 638,786 253,550
92,829 632,486
61,677 1,009,559
1,810 55,354
204,397 626,667 366,183
18,531 207,127 692,965
17,980 "48
2,869 38,901
9,689
1,622 1,722,030
102,429 629,216 526,787
'3,400 70,229
8,105 39,117
5,238,624 4,312,463 4,126,605
7,125 '109
24,438 80,809
'593
7,222 65,562
3,083,247 1,042,085
33,976 390,539 141,332
59,006 459,731
42,499 540,372
1,221 31,605
129,192 354,857 204,372
9,650 118,057 310,168
3,373 "48
1,849 22,171
'446
110 916,112 629,216
·ss 18,250
Motels, motor
hotels, and tounst courts
(66)
8,930 45,485
5,750,869 3,523,584 3,377,928
6,0S3 91
17,885 66,317
"336
7,525 47,409
3,408,027 847,304
24,756 338,770
83,83S 14,729
418,064 32,855
532,750 1,280
25,076 97,681
417,504 187,044
9,990 107,312 352,119
5,520
541 12,741
'504
921 812,301 115,557 307.481 191,925
'3,291 18,676
4,536 22,474
2,913,867 2,414,359 2,302,Q47
'6,076 ·so
14,476 52,449
'324
4,016 34,863
2,106,878 638,905
17,225 220,455
46,860 6,315
372,051 24,002
308,912 880
15,679 70,127
222,016 119,535
5,517 62.963
184,366 1.841
299 8,999 '340
·ss 468,181 307,481
-5 11,400
Other toc!ging places
(67)
8,022 36,431
6,198,202 3,357,803 3,222,694
"1,049 ., 2-1,191 50,101
'270
3,884 55,595
3,370,931 759,541
26,113 300,016 169,711 76,101
214,422 28,822
476,809 530
30,278 106,716 409,164 179,139
8,541 99.815
340,846 12,460
"48
2,320 26,160 -9,185
-701 909,729 -13,12fl 321,734
-334,862
'109 51,553
3,569 16,643
2,319,757 1,090,104 1,824,558
'1,049 ., 9,962
28,360 '270
3,207 30,679
1,576,370 403,180
16,751 170,083 94,471 52,691 87,680 18,497
231,461 341
15,925 59,065
132,641 84,837
4,133 55,094
125,782 1,532
48
1,550 13,172
'106
"52 447,931 321,734
·ss '6,850

38 Partnership Returns/1979 Table 2.-Total Assets and Income Statement for Selected Industries-continued [All figures are estimates based on samples-money amounts are in thousands of dollars]
SONI~s-Con~nue<l
Personal r;orvices
uem Laundries, dry clean. amber Other BusJncss
Total ing and Beauty Parsonal seiVices garment shops shops sorvices services
(68) (69) (70) (71) (n) (73)
Partnerships With and Without Net Income
Number of partnerships .•................•.•. 24,266 6,807 7,970 2,628 6,861 42,274 Number of partners .•.........•.....•........... 54,324 15,11 16,604 5,350 17,253 155,306 Total assets ........•.....•................•......•. 640,011 238,382 61,57!1 10,120 329,930 8,925,612 Total receipts •....•.......•..•....•.•.............. 1,405,332 498,291 319,349 112,530 555,162 4,243,698
Business receipts ........................... 1,467,21>5 490,490 318.183 112,519 546,103 4,009,392 Income frOm other partnerships and
fiduciaries ............. , .... , "15 - - - "15 2,384 Nonqualifying dividends .. "6 ., - - "5 1,043 Interest received ...... 3,256 621 ., - 2,555 44,359 Rents received .... 6,617 4,365 '713 - 1,538 22,347 Royalties .......... '624 - - - '624 '102 Farm nat protit ..................... - - - - - -Net gain, noncapital assets .. 3,858 1,636 '349 - '1,671 45,560 Other receipts .. 3,662 1,175 "25 "12 2.450 116,491
Total deductions ................................. 1,290,724 441,470 264,331 86,969 477,94 4,056,920 Cost of sales and operations ..... 402,182 117,683 72,838 9,238 202,424 742,806
Inventory, beginning of year .. 28,115 2,189 3.158 '575 22,192 18,838 Purchases .. 159,321 21,554 12,577 '2,657 122,533 287,588 Cost of labor .............. 96,183 41,464 34,396 '4,369 15,955 109,298 Material and supplies .. 59,720 22,945 18,933 '1,890 15,952 67,825 Other costs .......................... 86,923 32,370 6,226 '393 49,934 315,041 Less: Inventory, end of year .. 30,080 2,839 2.453 '646 24,142 55,785
Salaries and wages .. 231,808 82,494 63,295 25,430 60,586 379,598 Lass: Jobs credit ....................... '197 '167 - - ., 530
Guaranteed payments to partners .. 107,117 19,175 35.786 25.426 26,731 113,525 Rent paid ....... 90,730 28,488 30,160 8,728 23,354 98,664 Interest paid .. 25,387 10,159 2,868 S43 11,717 429,176 Taxes paid. 44,141 15,949 10,837 3,478 13,878 77,307 Bad debts. 7,779 1,880 "" "2S 5,826 14,018 Repairs ........ 21,998 12,667 2,718 59S 6,018 46,965 Depreciution .... 66,335 32,608 8,849 2,179 22,699 1,408,190 Amortization .. 1,578 560 . ., - 973 8.489 Depletion ... - - - - - -Pension, prof1t sharing, annuity, and
bond purchase plans .. 859 '520 - - '336 5,221 Employee benefit plans ...................... 3,271 1,716 '389 ., 1,067 11,888 Nat Loss from other partnerships and
fiduciaries ..... '104 ., ., - - 14,94 Farm net loss ........................ - - - - - -Net loss, noncapital assets, ... '237 '174 "57 - "6 21,079 Other deductions . 287,394 117,491 56.416 11,128 102,359 665,581
Net Income (less deficit) ..................... 194,608 56,813 35,018 25,561 17,216 186,777 Net income .. 233,671 67,538 41,287 26,348 98,498 938,017 Deficit.. ........ 39,063 10,725 6,269 '787 21,282 751,240
Capital gains and tosses allocable to partners; Net short-term capital gain (less loss) ..... '176 - - - "" 8,607 Net long-term capital gain (less loss) .. "<6 - "" - "-2 48,677
Partnerships With Net Income Number of partnerships ...................... 16,840 4,683 5,305 1,906 4,946 24,225 Number of partners ............................. 37,745 10,295 10,897 3,906 12,647 82,490 Total assets ........................................ 465,956 160,492 42,964 8,384 244,115 2,963,303 Total receipts ...................................... 1,243,678 427,227 229,064 87,861 499,526 2,983,432
Business receipts ........................... 1,228,221 421,607 227.932 87,649 490,632 2,794,72 Income frOm other partnershipS and
fiduciaries ............... ................ "15 - - - "iS 1,617 Nonqualifying dividends .... ...... "5 - - - "5 '" Interest recefved .. 3,033 573 "73 - 2,387 28,075 Rents received .. ..... .... 5,272 3,070 ·sa - 1,516 16,379 Royalties ......... ... ................ ............. '624 - - - '624 '102 Farm net profit .................... .... - - - - - -Not gain, noncapilal assets .. 3,062 '894 '349 - '1,819 40,509 Other receipts .. 3,446 1,063 "25 "12 2,327 100,981
Total deductions ................................. 1,010,007 359,688 187,777 61,513 401,020 2,045,415 Cost of sa los and operations ....... 346,273 108,616 45,841 9,094 184,722 561,945
Inventory, beginning of year .... 25,139 1,915 2,143 '467 20,614 15,288 Purchases ........ ................ 143,222 17,945 2~:{~~ '2,480 113,574 198,975 Cost of labor .............. 86.992 40,515 '4,366 14,702 94,172 Material and supplies .. .......... 43,085 19,083 7,679 "1,890 14,432 55,032 Other costs .......................... 76,168 31,726 '1,060 '393 42,989 219,838 Less: Inventory, and of year .. 26,333 2,567 1,674 '502 21,589 21,360
Salaries and wages ...... .......... 187,505 71,648 45,089 '16,966 51,601 305,867 Less: Jobs credit ....................... '197 '167 - - "31 530
Guaranteed payments to partners .. 68,764 9,403 22,670 '18,789 17,901 66,295 Rent paid ....... 64,837 22,025 20,020 5,305 17,488 63,897 Interest paid .. 14,405 5,800 2,008 '262 6,315 124,797 Taxes paid. 34,875 13,234 7,956 1,935 11,750 58,178 Bad debts ............. 6,117 577 .,. "15 5,500 2,642 Repairs ........ ......... 17,763 10,254 1,919 283 5,308 29,391 Depreciation .. 47,484 24,178 5,768 931 16,607 401,993 Amortization .. .................. 1,210 '451 .., - '713 2.141 Depletion ... ............ - - - - - -Pension, profit sharing, annuity, and
bond purchase plans ........................ 859 '520 - - '338 5,015 Employee benefit ptans .................... 2,574 1.436 '161 - 978 8,950 Net loss from other partnerships and
fiduciaries .......... ............ ................ . "" . ., ., - - 1,459 Farm nat loss ................. - - - - - -Net loss, noncapital assets ....... "67 "3 "57 - "6 2,524 Other deductions . .............. 215,369 91,626 36,196 5,914 81,631 410,861
Net Income (less deficit) ..................... 233,671 67,538 41,287 26,348 90,49 938,01 capital gains and losses allocable to
partners: Net short-term capital gain (less loss) ..... '176 - - - '176 5,422 Net tong-term capital gain (lass loss) .. "36 "4S '-12 26,895
Footnotes at end of tabla.
Automobile repair and services
Automobdo repair shops Automobile T•ru General parking
Othor '"' Total automotive automobile olher mpair shops repair services
(74) (75) (76) "' (76)
22,070 15,509 7,923 7,506 6,561 54,242 35,908 16,234 19,674 18,334
1,289,482 419,201 195,455 223,746 870,281 2,203,487 1,551,016 762,246 780,770 652,470 2,165,301 1,540,309 757,285 783,024 624.992
'967 . ., - . ., '922 .,. "12 "12 - ., 1,922 '" 573 228 1,121
11,945 3,653 2,706 949 8,292
"" - - - "<S "5 - - - "5
10,166 794 '702 ., 9,372 13,122 5.401 968 4,434 7,721
1,946,569 1,318,229 652,052 666,177 628,340 1,010,386 809,056 418,435 390,623 201,328
77,890 66,999 35,367 31,632 10,891 713,648 589,510 326,321 263,190 124,138
97,227 73,440 32,405 41,035 23.787 105,472 80,718 22,212 58,506 24,753 97,607 68,904 37,643 31,261 28,703 81,458 70,513 35,513 35,000 10,945
180,742 132,379 50,700 81,679 48,363 '136 "15 ., - '123
73,089 60,g38 22,272 38,667 12,151 79,073 41,445 22,182 19,263 37,628 74,047 16,096 7,512 8,585 57,951 58,787 38,424 17,496 20,929 20,364
4,358 2,623 1,678 1,145 1,535 26,476 10,368 6,572 3,797 16,108
176,502 32.835 16,062 14,773 143,667 1,013 '315 - '315 S97
"3 "3 - "3 -
312 '130 "70 ·so '182 2,935 2,219 '" 1,256 716
'1,524 "59 "59 - '1,465 - - - - -
'170 . ., ., "16 '126 257,290 171,106 86,043 85,063 86,184 256,917 232,787 110,194 122,593 24,130 326,632 247,669 118,801 128,868 78,962
69,714 14,882 8,607 6,275 54,832
"" '-12 - -12 "5s 2,002 '303 - '303 '1,699
16,515 12,331 6,384 5,94 4,104 41,061 29,217 13,120 16,097 11,044
778,105 338,579 147,258 191,321 439,526 1,871,323 1,398,236 675,555 722,681 473,087 1,844,735 1,388,008 670.809 717,199 456,727
'967 .., - . ., '922 "12 "12 "12 - -
1,516 S7S "' "' '" 9,652 3,653 2,706 "' 5,998 "<S - - - "<S - - - - -
7,230 '751 '680 "70 6,479 7,164 5,091 696 4,195 2,074
1,544,691 1,150,567 556,754 593,813 394,125 853,627 716,753 360,756 355,997 136,874
62,586 55,795 26,358 29,438 6,791 612,247 517,722 276,761 240,961 94,525
75,559 66,3Sg 27,685 38,673 9,200 93,103 74,505 22,164 52,341 18,598 78,104 61,647 34,285 27,362 16,457 67,972 59,275 26,497 32,778 8,697
155,548 120,620 43,591 77,030 34,928 "92 "15 "15 - .,.
50,293 40,645 15,085 25,760 9,448 67,161 34,604 19,264 15,340 32,556 42,245 12.506 5,656 6,846 29,739 49,653 35,170 15,48 19,681 14,483
2,897 1,971 '" 1,069 927 18,793 8,967 5,570 3,397 9,826 93,862 28.178 14,511 13,668 65,704
548 '315 - '315 '233 - - - - -
'233 "S3 "3 ·so '171 2,697 2,161 '" 1,215 536
'1,191 "59 "59 - '1,132 - - - - -"98 "" .,. "16 "55
205,917 148.325 74,909 73,416 57,592 326,63 247,669 118,801 128,868 78,962
-19 -12 - '-12 -6 '1 ,162 .,. "78 '1,084

Partnership Returns/1979 Table 2.-Total Assets and Income Statement for Selected Industries-Continued jAil fi9ures are estimates based on sameles monel amounts are in thousands of dollars)
Services--Can Mum:!
Amusement Medical and health services
Mi:;cel- '"' Item laneous recraatron Other Legal services. rep3ir O!lrces medical services services including Total " '"' motion phy~icians hoallh pictures setvices
Partnerships With and " " " " " " Without Net Income Number of partnerships ..•.•..•.......•..•... 9,094 19,031 20,910 8,929 11,981 28,836 Number of partners ••••••••••••••••••••••••••••. 19,238 85,124 79,301 35,471 .;3,830 105,273 Total assets ........................................ 187,422 3,525,684 2,236,399 499,810 1,736,589 2,569,590 Total receipts ...................................... 647,996 3,488,189 7,602,926 3,869,212 3,733,714 12,586,300
Business receipts ........................... 643.016 3,195.270 7,473,690 3,815,379 3,658,511 12,424,203 Income from other partnerships and
3,628 fiduciaries .................. - 7,711 13,031 '1,347 '11,684 Nonqualifying dividends. - '116 '159 '157 ., 675 Interest received ... 1,044 23,358 16,301 6,254 10,047 34,566 Rents received ... '815 23,120 15,591 5,032 10,556 16,719 Royalties ..... - 36,930 ., ., ., 901 Farm net profit. ................... - - - - - -Net gain, noncapital assets .. 2,036 27,467 2,699 1,068 1,631 6,041 Other receipts .. 1,064 174,219 61,242 39,963 41,279 99,566
Total deductions ................................. 547,942 3,507,933 5,233,822 2,089,862 3,143,961 6,744,360 Cost of sales and operations ..... 316,616 928,647 502,938 59,678 443,260 176,557
Inventory, beginning of year .. 33,958 44,116 15,688 "' 14,741 -Purchases ...... 230,252 215,298 87,001 10,569 76,432 '15,813 Cost of labor ............... 31,924 68,757 134,611 7,709 126,902 '6,802 Material and supplies .. 38,060 29,786 62,621 5,855 56,766 3,535 Other costs ........................... 24,092 616,166 216,114 35,765 180,349 146,4~ Less: Inventory, end of year .. 41.669 45,479 13,097 1,168 11,929
Salaries and wages ... 60,938 537,587 1,717,260 715,447 1,001,814 2,951,554 Less: Jobs credit ........................ '366 504 1,580 783 797 6,044
Guaranteed payments to partners ... 28,500 54,984 235,377 127,706 107,671 302,095 Rent paid ....... 16,382 150,192 368,338 181,507 186,831 684,491 Interest paid .. 5,964 173,724 126,963 15,760 111,203 53,755 Taxes paid. ....... 14,166 98,850 198,294 58.140 140,154 308,042 Bad debts. 694 3,756 13,653 2,241 11,413 8,864 Repairs ......... 4,345 53,959 39,373 13,336 26,036 40,001 Depreciation .• 13,511 424,841 144,088 38,488 105,600 181,952 Amortization .. '585 45,889 1,716 250 1,467 3,640 Depletion .. - '423 ·so ·so - ·so Pension, profit sharing, annuity, and
.,4 22.531 66,782 bond purchase plans .. 6,313 30,123 7,593 Employee benefit plans .................... '479 13,019 64,657 30.490 34,168 66.164 Net loss from other partnerships and
fiduciaries ................. - 6,288 '157 '150 .7 13,434 Farm net loss ....................... - - - - - -Net loss, noncapitat assets ... '118 4,539 1,421 '1,320 '101 2,165 Othur deductions. 85,645 1,006,418 1,790,991 823,550 967,441 1,890,857
Net Income (less deficit) ..................... 100,154 -19,744 2,369,104 1,779,351 589,753 5,841,940 Net income .. 107,062 526.843 2,471,647 1,785,504 686,143 5,866,064 Deficit .. ....... ........ 6,906 546,587 102,543 6,154 96,390 24,124
Capital gains and losses allocable to partners: Net short-term capita! gain (less loss) ... - 601 .44 - .44 711 Net long-term capital gain (less loss) .. '248 22,139 9,949 ·ss '9,894 12,123
Partnerships With Net Income Number of partnerships ...................... 6,778 6,975 16,436 7,992 8,444 25,702 Number of partners ............................. 14,207 31,050 62,196 31,656 30,540 97,907 Total assets ........................................ 153,362 1,331,133 1,621,160 462,042 1,159,119 2,490,815 Total receipts ...................................... 574,150 2,352,907 6,832,401 3,752,309 3,080,092 12,406,413
Business receipts ............................ 569,250 2,155,022 6,730,318 3,700,369 3,029,949 12,253,571 Income from other partnerships and
fiduciaries ..................... - '7,025 '12,071 '1,347 '10,724 3,628 Nonqualifying dividends .... - ., '159 '157 ., 675 Interest received ........... 973 14,676 13,622 6,232 7,590 33,576 Rents received .. '815 13,924 12,160 5,009 7,151 15,951
~~~~~~:t ·;;rotii::: .................. - 28,111 ., ., ., 90> - - - - - -Net gain, noncapltal assets .. 2,036 23,968 2,055 1,068 987 6,019 Other receipts .. 1,076 110,228 61,803 38,115 23,668 92,091
Total deductions ................................. 467,088 1,026,144 4,360,754 1,966,004 2,393,949 6,540,349 Cost of sales and operations ....... 274,315 558,882 434,029 59,678 374,351 144,027
Inventory, beginning of year .. 27,097 20,130 12,407 948 11,459 -Purchases .. 196,056 126,492 77,199 10,569 66,629 -Cost of tabor .............. 30,114 31,381 109,684 7,709 101,975 '8,802 Materia! and supplies .. 33,376 20,097 55,921 5,855 50,067 3,432 Other costs ........................... 23,332 368,584 187,975 35,765 152,210 131,793 Less: Inventory, end of year .. 35,662 27,802 9,158 1,168 7,969 -
Salarios and wages .. 55,129 287,482 1,465.146 690,887 774,259 2,904,781 Less: Jobs credit .. '290 '494 1,540 783 757 6,044
Guaranteed payments to partners. 15,454 28,250 177,605 108,113 69,492 259,437 Rent paid .... 14,687 83,136 309,390 176,516 132,874 664,637 Interest paid .. 4,823 61,044 84,277 14,755 69,522 51,433 Taxes paid. 12,572 56,417 161,929 55,985 105,943 303,670 Bad debts. 663 1,173 11,175 2,241 8,934 8,805 Repairs ........ 3,930 29,338 33,677 13,130 20,546 39,731 Depreciation .. 11,126 184,465 106,215 32,217 73,998 178,143 Amortlzation ...... '535 26,505 1,076 249 629 3,615 Depletion ... ....... - ., ·so ·so - .53 Pension, profit sharing, annuity, and
.,4 4,565 28,905 22,029 bond purchase plans ... 6,876 66,510 Employee benefit plans .................... '443 5,723 56,853 29,993 26,861 65,714 Net loss from other partnerships and
'157 '150 liduciarios •. - 1.419 .7 12,670 Farm net loss ........................... - - - - - -Nat loss, noncapita! assets .. ., '1,415 '130 ., ., 2,165 Other deductions . 73,435 494,798 1,491,676 761,553 730,123 1,841,002
Net Income (less deficit) ..................... 107,062 526,843 2,471,647 1,785,504 686,143 5,866,064 Capital gains and losses allocable to
partners: Net short·term capital gain (less loss) .. - -782 .44 - .44 711 Net long-term capital gain (less loss) ...... '246 5,872 9,949 ·ss '9,894 10,494
'This estimate should bo used wllh caution becau~e of the smalt number of samp!D returns on whoch 11 was basad.
39
Accounting._ auditinf!. and bookkeapong sarvrees
Engrneering
'"' Other Othar arch•· Certrfied accountong,
SOI'YlCCS tectural Total public audilmg, services llCCOUil· and book·
Umts kl!eping SCIVECCS
" '" '" " '" 7,370 12,657 8,430 4,227 35,256
20,624 43,670 34,123 9,547 114,441 521,293 1,432,661 1,341,925 90,756 4,382,922
2,594,081 6,356,661 5,996,066 358,593 3,126,114 2,527,651 6,305,001 5,953,069 351,932 2,915.948
10,554 10,858 10,223 '635 '1,931 '697 804 '" - 1,626
9,111 15,906 14,919 966 131,367 2,915 4,035 2,167 '1,868 15,273
'2,389 ·so ·so - '1,957 - - - - -11,147 3,107 272 '2,836 4,949 29,617 16,897 16,561 337 53,063
2,197,894 4,889,589 4,635,765 253,624 2,682,267 629,722 82,471 75,656 '6,815 1,232,460
'7,145 '3,097 '2,925 '172 130,909 '42,328 '851 - '851 884,741 143,718 44,745 39,158 '5,587 71,447 32,124 1,482 '787 '695 94,776
412,272 36,366 35,801 '565 241,027 '7,865 '4,070 '3,014 '1,055 190,439
602,404 2,413,361 2,311,424 101,937 330,206 736 6,995 6,774 '220 '382
111,492 467,781 436,703 31,078 82,361 78,577 297,618 283,325 14,293 72,197 11,643 50,994 46,206 4,787 112,501 59,500 187,630 179,095 8,535 78,694
2,872 4,052 3,797 '255 3,962 6,410 18,009 16,247 1,762 33,760
28,299 93,378 85,231 8,147 132,184
'" 19,541 18,953 588 5,141 - '1,000 '1,000 - '831
16,690 42,434 43,428 '993 1,911 15,320 49,404 47.765 1,640 7,511
10,783 -920 920 - 7,312 - - - - -'108 '249 '242 .7 1,435
624,479 1,166,747 1,093,540 73,207 580,185 396,186 1,467,073 1,362,303 104,770 4~3,847 451,612 1,486,527 1,381,113 105,414 654,245
55,424 19,454 18,810 '644 210,398
., -261 ., -312 467 921 1,974 1,645 '329 48,576
5,969 10,995 7,350 3,645 16,569 17,222 39,509 31,250 0,259 51,416
473,758 1,3(11,440 1,299,143 02,297 2,283,478 2,376,667 6,210,424 5,871,449 330,976 2,504,765 2,311,536 6,159,?.39 5,827,307 332.432 2,316.773
10,489 10,841 10,206 '635 '1,146 '697 804 804 - '1,335
8,894 15,526 14,658 '" 129,240 2,124 3,590 1,722 '1,868 12,215
'2,389 ·so ., - '1,593 - - - - -
11,147 3,101 265 '2,836 4,105 29,391 16,770 16,434 337 36,357
1,925,055 4,723,898 4,490,336 233,662 1,650,520 539,816 80,968 74,153 '6,815 900,165
'7,145 '3,097 '2,925 '172 67,060 37,006 '851 - '851 605,965
129,036 44,097 38,510 '5,587 57,919 32,120 1,435 '740 '695 56,075
342,309 35,558 34,992 '565 175,654 '7,799 '4,070 '3,014 '1,055 62,506
572,149 2,347,566 2,261,120 86,465 264,396 736 6,061 5,840 '220 '323
93,866 433,802 403,236 30,566 44,459 69,487 287,106 273,271 13,835 56,077 10,635 46,441 42,271 4,170 44,310 55,868 183,004 174,524 6,480 58,092
2.414 4,052 3,797 '255 2,863 5,906 17,548 15,800 1,748 23,410
24,840 88,546 80,567 7,980 57,350 240 18,064 17,704 '360 330 - '1.000 '1,000 - '745
16,605 43,428 42,434 '993 1,421 14,636 48,738 47,099 1,640 4,662
4,596 "9 469 - '1,556 - - - - -'103 '249 '242 •7 '235
514,629 1,128,937 1,058,490 70,447 370,751 451,612 1,486,527 1,381,113 105,414 654,245
., '-261 ., -312 '469 921 1,974 1,645 '329 38,380
Note; "Contoactors not a!IOCII.bte," "Who!asate and retail trade not allocable," and "Natura ol bu~inDss not altocablo" aro not shown separately because ol the small number of sample returns on which they WQre basod. Howovor. tho data lifO included In tho appropriate totals.
40
DATA SOURCES AND LIMITATIONS
Sole proprietorship statistics are based on a probability sample of unaudited· individual income tax returns, Forms 1040, processing during 1980. The sample was stratified based on presence or absence of a Schedule C (Profit (or Loss) from Business or Profession), State in which the return was filed, adjusted gross income or deficit, or largest source of income or loss, and size of business plus farm receipts. The 1979 returns were selected at rates ranging from 0.05 percent to 100 percent. There were 92,293 returns (accounting for 108,335 businesses) in the 1979 sample, estimating a total population of 11,502,906 returns (and 12,329,982 businesses).
The partnership statistics are based on a stratified probability sample of unaudited partnership returns, Form 1065, procesSed during 1980. The sample was stratified based on industry, gross receipts, net income or deficit, and total assets, and selected at rates which ranged from o .5 percent to 100 percent. There were 50,105 returns in the sample drawn from a population of 1,375,919.
Because the estimates are based on samples, they are subject to sampling error. The return data are also subject to nonsampling error due to taxpayer reporting variations and to discrepancies introduced during statistical pro~essing.
Coefficient of Variation
The upper limits of the coefficient of variation shown below for 1979 (for frequency estimates only) are intended as a general indication of the reliability of the data.
Coefficient of Variation Number of Sole Proprietorships
1% 2 3 5
lO 20 30 35 50
Agriculture, forestry and fishing
2,179,100 784,500 196,100 49,000 21,000 16,000 7,800
All other industries
11,359,600 2,839,900 1,262,200
454,400 113,600 28,400 12,600 9,300 4,500
Coefficient of Variation Number of Partnerships
940,000 2% 5
lO 20 30 50
150,000 37,000
9,400 3,100 1,500
Additional measures of the coefficient of variation for speci fie industries and for various data items will be presented separately in the forthcoming Statistics of Income reports for 1979. The computed coefficients of variation of estimates already published in the 1978 Statistics of Income reports can be used to approximate the reliability of similar 1979 estimates. However, for sole proprietorships, the 1979 coefficients of variation, when computed, are expected to be less than the corresponding 1978 values because of the increased sample size.
Nonsampling Error
Nonsampling error was controlled during statistical processing by a variety of methods. Among these was a systematic verification at field processing locations of the manual data editing and industry coding. As a further check on the quality of the editing and industry coding, subsamples selected after field verification were reprocessed in the National Office. Key entry of the data at the processing locations was also subjected to 100 percent verification.
Prior to tabulation, numerous computer tests were applied to each return record to check for inconsistencies. Lastly, prior to publication all statistics and tables were reviewed for accuracy and reasonableness in light of provisions of the tax law, business reporting variations and limitations, and economic conditions.
Definitions and Law Changes
There were comparability years.
Definitions tables in
no major law changes affecting the of the data with statistics for prior
Classification, issued by the Office of Management and Budget.
Receipts are defined differently for sole proprietorships and partnerships. For sole proprietorships, the total receipts of the business, mainly the gross receipts from sales and operations, are reflected in the statistics for "business receiPts 11 in Table 1. Miscellaneous business receipts, such as from sales of scrap, are also included, but incidental investment income received through the business (such as interest, dividends, income or loss from rents or royalties, and capital and ordinary gains and losses from the sale of investment property and other assets) is excluded. Incidental investment incon1e :-: not considered to be income from the business and i" reported on the proprietor's individual income tax return in combination with nonbusiness investment income.
For partnerships, total receipts are more allinclusive than they are for sole proprietorships and take into account not only 11 business receipts 11 , i.e., gross receipts from sales and operations, but also other types of income received through the business, mostly from investments. These latter types of income are shown in Table 2 as dividends not qualified for the exclusion allowed individuals, interest, rents, royalties, ordinary gain or loss from sales of property not meeting the tax definition of capital assets, income or loss from other partnerships or from fiduciaries, as well as certain profits from farming operations. Also included in the total receipts shown in Table 2 are miscellaneous business receipts which, in contrast to sole proprietorships, are not considered to be part of business receipts.
For most industries, partnership investment income is incidental to the principal business activity, but for partnerships classified in the industrial division, finance, insurance and real estate, it often comprises a large part of the total operating income of the business and is the major source of receipts . There f. ore, in order to overcome the limitations· of the presentation in Table 2 and to obtain a rrore meaningful measure of the total operating income of partnerships, both in total and for businesses in the finance division, "total receipts" may be used for analysis in lieu of "business receipts."
Partly as a result of the differing definitions of receipts between sole proprietorships and partnerships, the net income for each is also defined differently. Therefore, profits data for the two forms of business organization are not additive. Conceptual differences in net income are as follows:
(a) Sole proprietorships -- Excludes investment income (as described above) and deductions for salaries paid to owners and for charitable contributions made through the business, neither of which is recognized as a sole proprietorship business expense. Investment income and salaries of owners are reported as personal income and, as such, are part of the owner's taxable income; charitable contributions are deducted as a personal (nonbusiness) expense. Net income also reflects deductions for 11 addi tional first-year depreciation' 11 depletion on oil and gas wells and for any foreign taxes paid (unless the owner elects to claim these taxes as a credit against U.S. income tax, instead of deducting them as a business expense). These two deductions were not allowed partnerships, as mentioned below.
41
(b) Partnerships -- Includes most types of investment income, as explained above. Excluded are taxexempt interest on State and local Government obligations, capital gains and losses and, under Internal Revenue Code section 1231, gains and losses on sales of assets associated with the business and on certain 11 involuntary conversions. 11 (Although excluded from net income, partnership capital gains and losses are shown as information items in Table 2). Unlike sole proprietorships, net income takes into account the Deduction for salaries and certain other payments to owners (partners). However, it excludes any deductions for charitable contributions made through the business, foreign taxes paid, "additional first year depreciation, 11 and depletion on oil and gas wells. The later two deductions are allowed sole proprietorships, however. For vaTious tax-related reasons, these excluded items (except for tax-exempt interest) are allocated directly to the partners for use in computing their total income tax liability.

Windfall Profit Tax, 1980-81
By Phil Clark•
Windfall profit tax liability after adjustments for the first quarter of 1981 amounted to approximately $7.1 billion, according to preliminary data. This represents almost 42 percent of the total liability reported since the tax went into effect in 1980. This large increase in quarterly tax liability is due in part to the decontrol of crude oil prices as of January 1981.
The table below provides a summary of tax liability by quarter since the inception of the windfall profit tax. First quarter 1981 figures continue a trend in which the liability before adjustments has increased in each quarter since the enactment of the tax. The statistics show that adjustments had a net positive effect on tax liability in the first quarter of 1981 for the first time. First quarter 1981 adjustments represent, in large part, a 1980 year-end account balancing by withholding agents.
____ tiilliq_ns _q!_Dollars -----
Tax Before Tax AFter Quartet EndiQ.9. Ad just'!ents Ad just.rn.ents Ad iu~t_ment~
Total. .... l7 ,852 -786 l7 ,066
March 1980 lf . .. 788 788 June 1980 ..••.•. 2,842 -21 2,821 September 1980 .. 3,413 -88 3,325 December 1980 .•. 3,918 -927 2,991 March 1981. ..... 6,891 +250 7,141
y One month only.
THE TAX
The Crude Oil Windfall Profit Tax Act of 1980 imposed a Federal excise tax on domestic crude oil extracted on or after March 1, 1980. The windfall profit per barrel is the removal price of a barrel of oil less the sum of the adjusted base price and the State severance tax adjustment applicable to that barrel. The base price for this computation is determined by a method set forth in the Act (see Definitions). The adjusted base price is the base price multiplied by a quarterly inflation adjustment factor [1], which is computed by the Internal Revenue Service (IRS). The windfall profit tax is the windfall profit times the appropriate tax rate.
The tax rate varies with the classification of the taxable crude oil into one of three tiers. In addition, for independent producers (generally a producer not .involved in the refining or retailing of oil) lower rates are allowed on the first 1,000 barrels per day of tier one and tier two oil attributable to working interests. Following are the tax rates applicable for each category of oil:
Type of Oil
Tier 1--All nonexempt domestic oil except Tier 2 and Tier 3 oil ............... .
Tier 2--Stripper oil and oil produced from a National Petroleum Reserve .................. .
Tier 3--Newly discovered oil, heavy oil and incre-mental tertiary oil ...... .
General Rates
70%
60%
30%
Independent Producer
_13_ates
50%*
30%*
30% ·-····· ·-··---------
* First 1,000 barrels per day.
The tax is .imposed on the holders of the economic interest, the producers; however, for taxpayers other than integrated oil companies the tax is withheld and paid by the first entity buying the crude oil, known as the first purchaser or by a qualified intermediary. This process of ~ithholding a~d paying the tax is similar to the way an employer Withholds income and social security tax from an employee. Integrated oil companies deposit the tax on their own production. The total number of withholding entities for 1980 was between 800 and 900, although the number for any one quarter never reached that total, due to shifts in the filing population from quarter to quarter.
Should under- or over-withholding occur, the depositing or withholding agent is· responsible for correcting that error to the extent possible by adjusting the amounts withheld in succeeding quarters. In addition, the net income limitation provision of the Act limits the windfall profit to 90 percent of the net income per barrel of oil. Overpayment due to the application of the net income limitation may be accounted for currently on a quarter-by-quarter basis.
Additional information about the windfall profit tax provisions may be found in the Fall 1981 SO! Bulletin. [2]
EXEMPT OIL
The Act allows five specific types of oil production to be exempt from the windfall profit tax. Because filers were not required to supply information on exempt oil in 1980, this is the first report
*Special Studies Section. Prepared under the direction of Michael Coleman, Windfall Profit Tax Team Leader, and Paul Grayson, Chief, Special Studies Section. 43
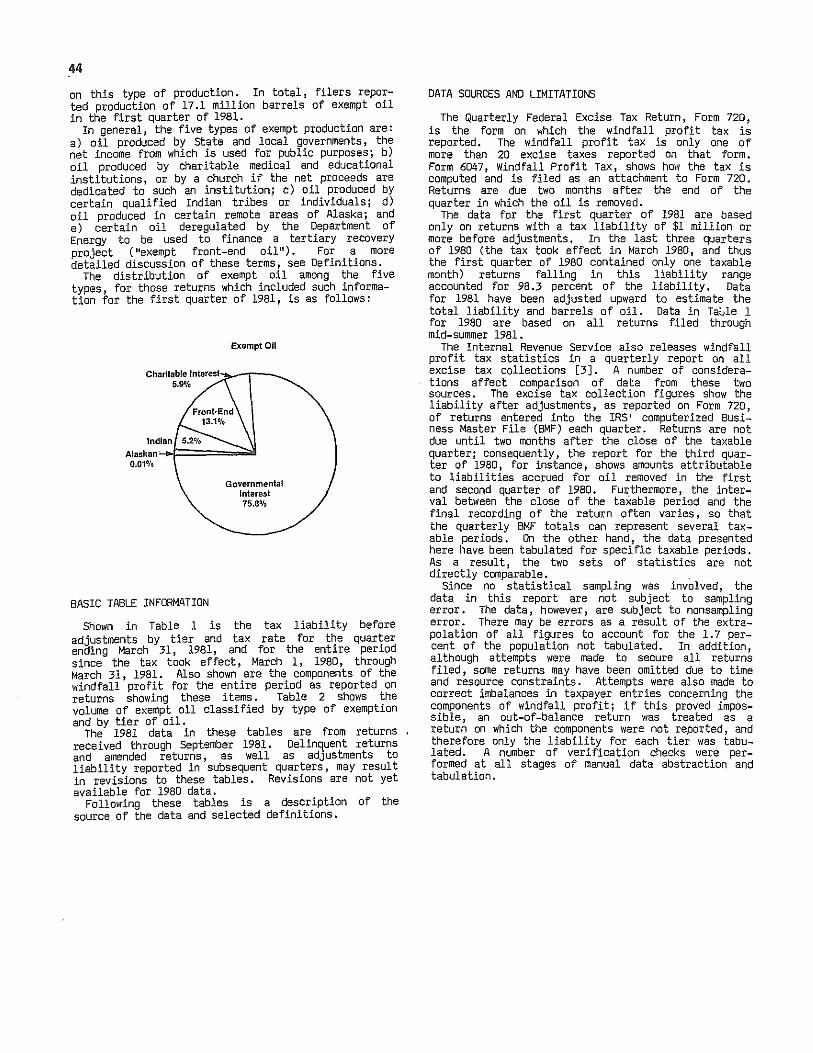
44
an this type of production. In total, filers reported production of 17.1 million barrels of exempt oil in the first quarter of 1981.
In general, the five types of exempt production are: a) oil produced by State and local governments, the net income from which is used for public purposes; b) oil produced by charitable medical and educational institutions, or by a church if the net proceeds are dedicated to such an institution; c) oil produced by certain qualified Indian tribes or individuals; d) oil produced in certain remote areas of Alaska; and e) certain oil deregulated by the Department of Energy to be used to finance a tertiary recovery project ( 11exempt front-end oil 11
). For a more detailed discussion of these terms, see Definitions.
The distribution of exempt oil among the five types, for those returns which included such information for the first quarter of 1981, is as follows:
BASIC TABLE INFORMATION
Exempt Oil
Governmental Interest 75.8%
Shown in Table 1 is the tax liability before adjustments by tier and tax rate for the quarter ending March 31, 1981, and for the entire period since the tax took effect, March 1, 1980, through March 31, 1981. Also shown are the components of the windfall profit for the entire period as reported on returns showing these items. Table 2 shows the volume of exempt oil classi fled by type of exemption and by tier of oil.
The 1981 data in these tables are from returns received through September 1981. Delinquent returns and amended returns, as well as adjustments to liability reported in subsequent quarters, may result in revisions to these tables. Revisions are not yet available for 1980 data.
Following these tables is a description of the source of the data and selected definitions.
DATA SOURCES AND LIMITATIONS
The Quarterly Federal Excise Tax Return, Form 720, is the form on which the windfall profit tax is reported. The windfall profit tax is only one of more than 20 excise taxes reported on that form. Form 6047, Windfall Profit Tax, shows how the tax is computed and is filed as an attachment to Form 720. Returns are due two months after the end of the quarter in which the oil is removed.
The data for the first quarter of 1981 are based only on returns with a tax liability of $1 million or more before adjustments. In the last three quarters of 1980 (the tax took effect in March 1980, and thus the first quarter of 1980 contained only one taxable month) returns falling in this liability range accounted for 98.3 percent of the liability. Data for 1981 have been adjusted upward to estimate the total liability and barrels of oil. Data in Tai.Jle 1 for 1980 are based on all returns filed through mid-summer 1981.
The Internal Revenue Service also releases windfall profit tax statistics in a quarterly report on all excise tax collections [3]. A number of considerations affect comparison of data from these two sources. The excise tax collection figures show the liability after adjustments, as reported on Form 720, of returns entered into the IRS• computerized Business Master File (BMF) each quarter. Returns are not due until two months after the close of the taxable quarter; consequently, the report for the third quarter of 1980, for instance, shows amounts attributable to liabilities accrued for oil removed in the first and second quarter of 1980. Furthermore, the interval between the close of the taXable period and the final recording of the return often varies, so that the quarterly BMF totals can represent several taxable periods. On the other hand, the data presented here have been tabulated for specific taxable periods. As a result, the two sets of statistics are not directly comparable.
Since no statistical sampling was involved, the data in this report are not subject to sampling error. The data, however, are subject to nonsampling error. There may be errors as a result of the extrapolation of all figures to account for the 1. 7 percent of the population not tabulated. In addition, although attempts were made to secure all returns filed, some returns may have been omitted due to time and resource constraints. Attempts were also made to correct imbalances in taxpayer entries concerning the components of windfall profit; if this proved impossible, an out-of-balance return was treated as a return on which the components were not reported, and therefore only the liability for each tier was tabulated. A number of verification checks were performed at all stages of manual data abstraction and tabulation.
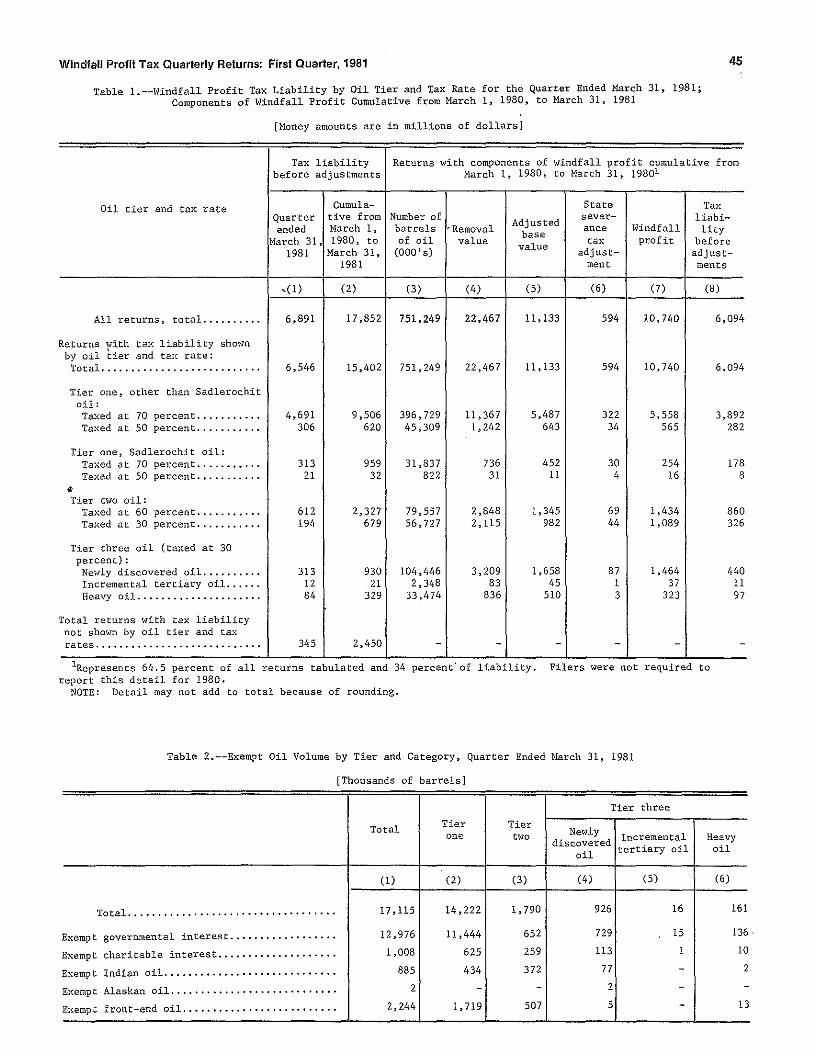
Windfall Profit Tax Quarterly Returns: First Quarter, 1981 45
Table !.--Windfall Profit Tax Liability by Oil Tier and Tax Rate for the Quarter Ended March 31, 1981; Components of \~indfall Profit Cumulative from March 1, 1980, to f.-larch 31, 1981
[Money amounts are in millions of dollars]
Tax liability Returns with components of windfall profit cumulative from before adjustments March 1, 1980, to March 31, 19801
Oil tier and tax rate Cumula- State Tax Quarter tive from Number of
Adjusted sever- liabi-
ended March 1, barrels 'Removal a nee Windfall lity Harch 31, 1980, to of oil value
base tax profit before
1981 March 31, (OOO's) value adjust- adjust-1981 ment ments
.(1) (2) (3) (4) (5) (6) (7) (8)
All returns, total .......... 6,891 17,852 751,249 22,467 11,133 594 10,740 6,094
Returns with tax liability shmvn by oil her and tax rate:
Total •.......................... 6,546 15,402 751,249 22,467 11,133 594 10,740 6,094
Tier one, other than Sadlerochit oil: Taxed at 70 percent .......•... 4,691 9,506 396,729 11,367 5,487 322 5,558 3,892 Taxed at 50 percent ..•........ 306 620 45,309 1,242 643 34 565 282
Tier one, Sadlerochit oil: Taxed at 70 percent .....•••... 313 959 31,83 7 736 452 30 254 178 Taxed at 50 percent .•......... 21 32 822 31 11 4 16 8
• Tier tHO oil: Taxed at 60 percent ...•.••.... 612 2,327 79,557 2,848 1,345 69 1,434 860 Taxed at 30 percent .........•. 194 679 56,727 2,115 982 44 1,089 326
Tier three oil (taxed at 30 percent):
Newly discovered oil .......... 313 930 104,446 3,209 1,658 87 1,464 440 Incremental tertiary oil ..•... 12 21 2,348 83 45 l 37 11 Heavy oil ..................... 84 329 33,474 836 510 3 323 97
Total returns Hith tax liability not shom1 by oil tier and tax rates ..........•.........•.... •·· 345 2,450 - - - - - -
1Represents 64.5 percent of all returns tabulated and 34 percent of liability. Filers Here not required to report this detail for 1980.
NOTE: Detail may not add to total because of rounding.
Table 2.--Exempt Oil Volume by Tier and Category, Quarter Ended March 31, 1981
[Thousands of barrels]
Tier three
Total Tier Tier one two Newly Incremental Heavy discovered
oil tertiary oil oil
(1) (2) (3) (4) (5) (6)
Total ...•....•...•.......•. •. • .• · • · • · · · • 17,115 14,222 1,790 926 16 161
Exempt governmental interest., ••...•.•...••..• 12,976 11,444 652 729 15 136
Exempt charitable interest ........•........... 1,008 625 259 113 1 10
Exempt Indian oil .••....•.•...•.••• , .•...•••.• 885 434 372 77 - 2
Exempt Alaskan oil .............•........•.•••. 2 - - 2 - -
Exempt front-end oil ..•..•.•...•......•.•..•.. 2,244 1,719 507 5 - 13
46
Definitions
Brief definitions of many of the terms used in this article are given below. For a more detailed treatment see Reference [4], below.
Adjusted Base_ Price.--The base price multiplied by the inflation adjustment, which is determined from the "implicit price deflator11 derived by the oepartment of Commerce [1].
Adjustments to Liability.--Corrections applied to the current quarter 1 s liability in order to correct aver- and under-withholding in previous quarters.
Base Price.--For tier one oil, the upper tier ceiling price, as defined by Department of Energy price control regulations [5], which would have applied to the oil had it been produced and sold in May 1979, reduced by 21 cents. This is expected to average about $12.81 a barrel. For tier two and three oil, the base prices were approximately $15.20 and $16.55, respectively, adjusted for grade and quality.
Crude Oil.--The term applies only to natural crude petroleum and does not include synthetic petroleum, such as oil from shale or tar sands. It does, however include natural gas liquids treated as crude oil 'under the June 1979 energy pricing regulations issued by the Department of Energy.
other been the the the
Exempt Alaskan Oil.--Oil from a reservoir than the Sadlerochit reservoir that has commercially exploited by any well north of Arctic Circle; and oil produced north of Alaska-Aleutian Range, and at least 75 miles from nearest point of the Trans-Alaska Pipeline System.
Exempt Charitable Oil. --Oil produced from economic interests held by charitable medical facilities and educational institutions (as defined in Internal Revenue Code section 170), .i.f such interest was held on January 21, 1980, and at all times thereafter; and oil produced from interests held by a church on January 21, 1980, if, prior to January 22, 1980, the net proceeds of such oil were dedicated to the support of a medical facility or educational institution.
Exempt Front-End Oil. --Certain oil that the Department of Energy deregulates to be used to finance a tertiary recovery project (see Tier Three Oil, Incremental Tertiary Oil). For a discussion of the many limitations and exceptions to this exemption, see Reference [4] below. This catsgory of oil no longer existed after January 28, 1981, due to the deregulation of all domestic oil.
Exempt Governmental Oil. --Oil produc~d. from an ~c?nomic interest held by a state or pol1t1cal subdlvlsion (including agencies and instrumentalities) the net income from which is used for public purposes.
Exempt Indian Oil. --Oil produced from mineral interests held by or on behalf of Indian tribes or individuals an January 21, 1980, which is one of the following three types: (a) production received by Indian tribes and individuals from Tribal Trust Lands (the title of such land is held by the United States in trust far the tribes), (b) production from land or mineral interests held by an Indian tribe eligible far services provided to Indians by the Secretary of the Interior, or (c) oil from which the proceeds are paid into the U.S. Treasury to the credit of tribal or native trust funds pursuant to law. This exemption also applies to production of any Alaska Native Corporation prior to 1991.
First Purchaser.--First entity buying domestic crude oi1.
Integrated Oil Compan~.--Entity th?t both produces o.il and is either a reta1ler or a ref1ner.
National Petroleum Resesve.--Located at Paint 5arrow, Alaska.
Net Revenue.--This equals the gross, or excise, tax (excluding that amount attributable to U.S. Government interests) less the reduction of income tax resulting from taxpayers cl.aiming deductions. for. windfall profit tax paid. F1gures presented 1n th1s report are grass liabilities.
Producer. --Holder of an economic interest with respect to-eTude oil in place. The producer may either have a working interest and share the cost of development and production or have a royalty or other nonworking interest.
Qualified Disburser.--A disburser is an entity which receives payments from the sale of crude oil and is responsible far distributing same or all of these payments to the producers. In general, a qualified disburser must distribute 10 percent or more of the total proceeds, or be an integrated oil company or a Federally-registered partnership.
Removal Price. --Generally, the price for which a barrel of oil is sold. In same instances, a constructive sales price is used. !$
Sadlerochit Oil.--Crude oil production from the Sadlerochit reservoir in the Prudhoe Bay ail field in Alaska.
State Severance Tax Adiustment.--A State severance tax is a tax imposed by a State with respect to the extraction of oil. The windfall profit is reduced by the amount by which the severance tax exceeds that which would have been imposed had the oil been valued at .its adjusted base price.
Stripper Oil. --In general, oil from a property from which the average daily production per well has been 10 barrels or less for any consecutive 12-month period after 1972.
Tier One Oil.--All domestically-produced crude oil other than any oil classi fled in tiers two or three, or explicitly exempted from the tax by the Act. This includes the bulk of domestic ail from reservoirs proven to be productive before 1979.
Tier Two Oil. --Any ail, other than oil classified in tier three, which is from a stripper well property within the meaning of the June 1979 Department of Energy pricing regulations and oil from a U.S. economic interest in a National Petroleum Reserve.
Tier Three Oil, HeavY Oil. --All crude oil which is (1) produced from property which had a weighted average gravity of 16.0 degrees API [6] or less, corrected to 60 degrees Fahrenheit, for the last month of production prior to July 1979 or (2) oil from a property with a weighted average gravity of 16.0 degrees API or less, corrected to 60 degrees Fahrenheit, far the taxable period.
~¥J1,1--"c,~~~~~!f; --Produc-;- on which a qualified tertiary recovery utilizes one of several speci fie gaseous recovery methods to
which fluid or oil not
recoverable using standard techniques) has been undertaken. The non-incremental oil (i.e., the amount of production up to the base level) remains in the otherwise applicable tier.
Tier ThreLQ.~ Newly Discovered Oil.--Crude oil that is sold after May 31, 1979, and that is produced from (1) an outer continental shelf area for which the lease was entered into on or after January 1, 1979, and from which there was no production in Calendar Year 1978 or (2) an on-shore property developed after Calendar Year 1978.
References
[1] The inflation adjustment, calculated by the Statistics Division, is published quarterly in the Internal Revenue Bulletin. (See for example IRS Bulletin 1981-24, dated June 15, 1981.)
[2] U.S. Department of Treasury, Internal Revenue Service, SOI Bulletin, Volume I, Number 2, Publication 1136, U.S. Government Printing Office, 1981.
[3]
[4]
[5]
[6]
11 Internal Revenue Collections Taxes,n released quarterly by Revenue Service.
of the
47
Excise Internal
Joint Committee on Explanation of the
Taxation (Staff), General Crude Oil Windfall Profit
Tax Act of 1980, Othce, 1981
U.S. Government Printing
The pricing regulations were most recently published in 46 Federal Register 20512, April 3, 1981.
A discussion of the API (American Petroleum Institute) degree gravity scale, used to indicate the density of crude oil, can be found in API Technical Data Handbook-Petroleum Refinl!Jg_, Volume I, Chapter 6. The higher the API gravity, the lighter the oil. The normal range is 27 degrees to 40 degrees.
*U,S, GOVERNMENT PRINTING OFFICE: 1982-0-361-544/5460
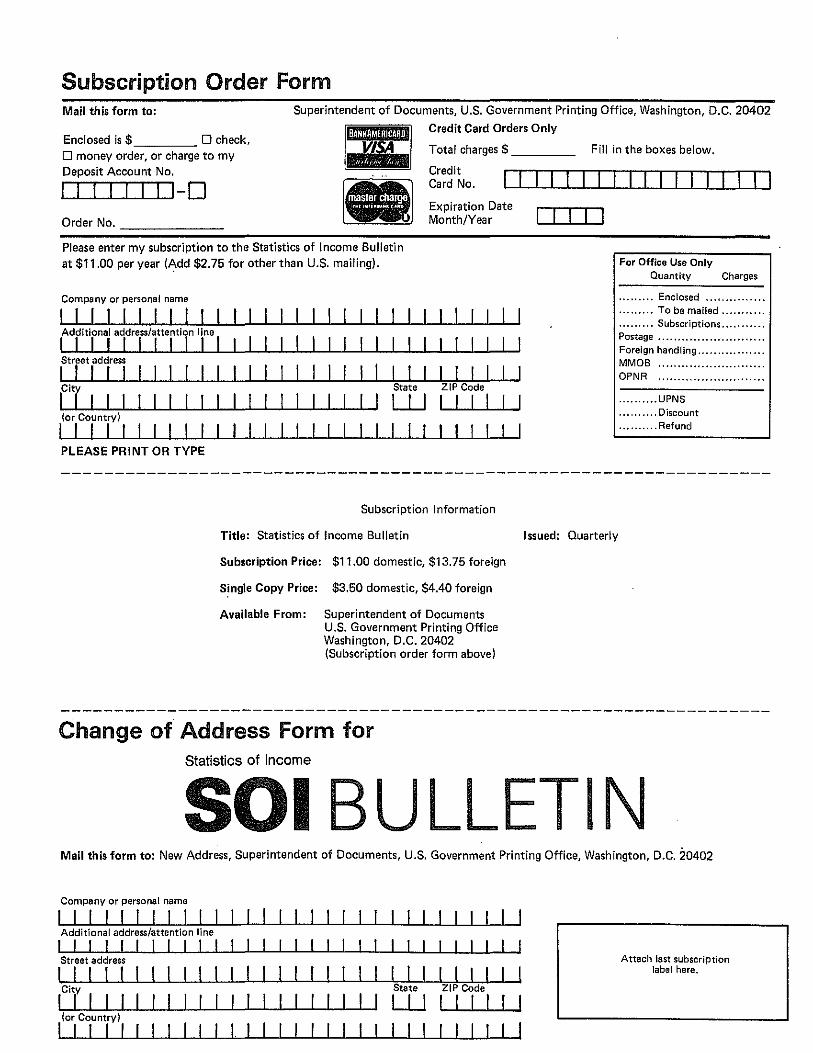
Subscription Order Form Mail this form to: Superintendent of Documents, U.S. Government Printing Office, Washington, D.C. 20402
Credit Card Orders Only
Total charges$ ___ _ Fill in the boxes below. Enclosed is$--.,..---- 0 check, 0 money order, or charge to my Deposit Account No.
II I I I 111-0 Credit Card No. I I 111111111111 I I
Order No. Expiration Date I I I Month/Year . . .
Please enter my subscription to the Statistics of Income Bulletin at $11.00 per year (Add $2.75 for other than U.S. mailing).
Company or personal name
I I I I I I I I I I I Additional address/attention line
I I I I II II I I I Street address
I I I I I I I I I I I Ciy I I I I I I I I I (or Country)
I I I I I I I I I I PLEASE PRINT OR TYPE
I I I I I I I I I
I I I I I I I I
I I I I I I I I I I I I I State ZIP Code
I I I I I w I I I I I I I I I I I I I I I I
Subscription Information
Title: Statistics of Income Bulletin
Subscription Price: $11.00 domestic, $13.75 foreign
Single Copy Price: $3.50 domestic, $4.40 foreign
Available From: Superintendent of Documents U.S. Government Printing Office Washington, D.C. 20402 (Subscription order form above)
Change of Address Form for Statistics of Income
Issued: Quarterly
For Office Use Only Quantity Charges
......... Enclosed .............. .
......... To be mailed .......... .
......... Subscriptions .......... . Postage .......................... . Foreign handling ...•..........•.. MMOB ......................... .. OPNR ......................... ..
.......... UPNS
.......... Discount
.......... Refund
SOl BULLETIN Mail this form to: New Address, Superintendent of Documents, U.S. Government Printing Office, Washington, D.C. :20402
Company or personal name
I I I I I I I I I I I I Additional address/attention line
I I I I I I I I I I I Street address
I I I I I I I I I I I I I I City
I I I I I I I I I I I I I (or Country)
I I I II I I I I I I I I
I I
I I
I I I I I I State
I I I I I I I w I I I I I I I I I I
I I I I ZIP Code
I I I I I
I I I
I I I I
Attach last subscription label here.

Statistics of Income
SOl Bulletin
(quarterly publication; $11.00 annual subscription, $3.50 single issue)
Contents, Vol. 1, No.1, Summer 1981:
Preliminary Individual Income Tax Return Data, 1979 Preliminary Sole Proprietorship Return Data, 1978 Preliminary Partnership Return Data, 1978
Contents, Vol. 1, No.2, Fall 1981:
Early Individual Income Tax Return Data, 1980 Data on Tax.exempt Organizations, 1975, 1977-78 Selected Corporate, Proprietorship, and Partnership Data, 1978 Windfall Profit Tax Liability Data, 1980
Other Publications And Related Information
Published Regular Reports
Individual Income Tax Returns, 1978 (283 pp., $7.00)
Sole Proprietorship Returns, 1977 (247 pp., $6.50)
Partnership Returns, 1978 Corporation Income Tax Returns, 1977
Published Supplemental Reports
International Income and Taxes: Foreign Income and Taxes
Reported on Individual Income Tax Returns, 1972-1978 (73 pp., $4.25)
Domestic International Sales Corporation Returns, 1972, 1973 and 1974 (192 pp., $6.00)
Foreign Tax Credit Claimed on Corporation Returns, 1974 (158 pp., $5.50)
U.S. Corporations and their Controlled Foreign Corporations, 197 4-1978 (165 pp., $6.00)
Other:
Sales of Capital Assets Reported on Individual Income Tax Returns, 1973 (263 pp., $7.00)
Individual Retirement Arrangements, 1976 (37 pp., $2.50)
Individual Income Tax Returns, Contents of Reports for 1967-1976 (15 pp., $1.50)
Estate Tax Returns, 1976 (60 pp., $3:25)
Private Foundations, 1974-1978 (113 pp., $4.75)
Selected Reports in Preparation
Corporation Income Tax Returns, 1978-1979
Partnership Returns, 1979 Sole Proprietorship Returns, 1979 Individual Income Tax Returns, 1979 International Income and Taxes,
Foreign Income and Taxes Reported on U.S. Tax Returns, 1976-1979
SOl Bulletin, Spring 1982
Tape Files Available
Individual Tax Model File, 1966-1978 State Tax Model File, 1977-1978 Corporation Source Book, 1965-1976 Other tape files include:
Estate Tax File, 1972, 1976 Private Foundations File, 1974 Employee Plans File, 1977 Exempt Organizations File, 1975
Ordering Information
Public-use magnetic tape files are available on a reimbursable basis from Machine Readable Archives Division (NNR), National Archives and Records Service, Washington, DC 20408
A subscription order form for the SOl Bulletin is provided inside. Other Statistics of Income reports are also for sale by the Superintendent of Documents, U.S. Government Printing Office, Washington, D.C. 20402.