Page 1 of 28 IOVS · Dry eye and tear dysfunction are among the most common ocular diseases,...
28
0 Non invasive assessment of the tear film stability in patients with tear dysfunction using the Tear Film Stability Analysis System (TSAS) 1 Koray Gumus, MD, FEBO*, 1 Charlene Hong Crockett, MD*, 1 Kavita Rao, MD, 1 Elizabeth Yeu Lin, MD, 1 Mitchell P. Weikert, MD, 1 Mariko Shirayama, MD, 2 Shigeki Hada, 1 Stephen C. Pflugfelder, MD * Dr. Gumus and Dr. Crockett should be considered as equal first authors 1 Ocular Surface Center, Cullen Eye Institute, Department of Ophthalmology, Baylor College of Medicine, Houston, TX, US and 2 Tomey Corporation, Nagoya, Japan Word Counts: Abstract 242 / Text 3279 Funding / Support: NIH Grant EY11915 (SCP), an unrestricted grant from Research to Prevent Blindness, the Oshman Foundation, the William Stamps Farish Fund, Hamill Foundation and the Scientific and Technological Research Council of Turkey (KG). Disclosure: The authors except Shigeki Hada have no proprietary interest in any of the findings reported in this manuscript? Shigeki Hada is an employee of Tomey. Competing interests: None The authors have had full access to all the data in the study and take responsibility for the integrity of the data and the accuracy of the data analysis. Correspondence and request for reprints: Stephen C. Pflugfelder, MD Ocular Surface Center, Cullen Eye Institute Baylor College of Medicine 6565 Fannin, NC205, Houston, Texas 77030, USA Telephone: 713-798-4732 Fax: 713-798-1457 E-mail: [email protected] Page 1 of 28 IOVS IOVS Papers in Press. Published on July 14, 2010 as Manuscript iovs.10-5292 Copyright 2010 by The Association for Research in Vision and Ophthalmology, Inc.
Transcript of Page 1 of 28 IOVS · Dry eye and tear dysfunction are among the most common ocular diseases,...

0
Non invasive assessment of the tear film stability in patients with tear dysfunction using
the Tear Film Stability Analysis System (TSAS)
1Koray Gumus, MD, FEBO*, 1Charlene Hong Crockett, MD*, 1Kavita Rao, MD, 1Elizabeth Yeu
Lin, MD, 1Mitchell P. Weikert, MD, 1Mariko Shirayama, MD, 2Shigeki Hada, 1Stephen C.
Pflugfelder, MD
* Dr. Gumus and Dr. Crockett should be considered as equal first authors
1 Ocular Surface Center, Cullen Eye Institute, Department of Ophthalmology, Baylor College of Medicine, Houston,
TX, US and 2
Tomey Corporation, Nagoya, Japan
Word Counts: Abstract 242 / Text 3279
Funding / Support: NIH Grant EY11915 (SCP), an unrestricted grant from Research to Prevent Blindness, the Oshman Foundation, the William Stamps Farish Fund, Hamill Foundation and
the Scientific and Technological Research Council of Turkey (KG).
Disclosure: The authors except Shigeki Hada have no proprietary interest in any of the findings reported in this manuscript? Shigeki Hada is an employee of Tomey.
Competing interests: None
The authors have had full access to all the data in the study and take responsibility for the integrity of the data and the accuracy of the data analysis.
Correspondence and request for reprints:
Stephen C. Pflugfelder, MD
Ocular Surface Center, Cullen Eye Institute
Baylor College of Medicine
6565 Fannin, NC205, Houston, Texas 77030, USA
Telephone: 713-798-4732
Fax: 713-798-1457
E-mail: [email protected]
Page 1 of 28 IOVS IOVS Papers in Press. Published on July 14, 2010 as Manuscript iovs.10-5292
Copyright 2010 by The Association for Research in Vision and Ophthalmology, Inc.

1
Purpose: To evaluate the tear film stability in patients with tear dysfunction and an
asymptomatic control group using the new non-invasive Tear Stability Analysis System
(TSAS).
Methods: In this prospective case control study, 45 patients with dysfunctional tear
syndrome (DTS) were stratified into 3 groups (1, 2, and 3/4), based on clinical severity,
with higher scores indicating more severe symptoms and 25 asymptomatic control
subjects were evaluated. TSAS measurements were performed using the RT-7000 Auto
Refractor-Keratometer (Tomey Corporation, Nagoya, Japan). Images of ring mires
projected on to the cornea every second for 6 seconds were captured and analyzed.
Focal changes in brightness were calculated as numerical Ring Break-Up (RBU) values
and the elapsed time when the cumulative values (RBU Sum) exceeded a threshold
was defined as the Ring Break-Up Time (RBUT).
Results: RBUT in DTS groups were all significantly lower than those of control
subjects, with the lowest values found in DTS 3/4. RBUT was significantly shorter in
DTS 3/4 than DTS 1 (P< 0.001). The change of RBU Sum over a 6-second period in
DTS groups combined or among the individual groups was found to be statistically
significant (p<0.001) as was the difference between the 1 and 6 second values. For
distinguishing between asymptomatic controls and DTS, the sensitivity and specificity of
a 5.0 second RBUT cut-off were 82.0% and 60.0%, respectively.
Conclusions: The TSAS may be a useful non invasive instrument for evaluating tear
stability and for classifying DTS severity.
Page 2 of 28IOVS

2
INTRODUCTION
Dry eye and tear dysfunction are among the most common ocular diseases,
estimated to affect 14% to 33% of adults and having increased with age. 1-5 The air/tear
film interface is the primary refractive surface of the eye, and thus its integrity and
stability is crucial for maintaining high quality vision and ocular comfort. 1-5 Traditionally,
the precorneal tear film was considered to consist of separate mucin, aqueous, and lipid
layers. Soluble mucins are important structural components of the precorneal tear film
and the hydrated mucus layer occupies most of the film thickness.6, 7, 8 Instability of tear
film may be due to qualitative or quantitative abnormalities of any of these components.
Other factors that can also affect tear film stability include concentrations of stabilizing
factors (e.g. mucins), integrity of the surface epithelia, and overlying lipid layer, activity
of proteolytic enzymes in tears and reflex blink mechanisms.8
Tear break-up test with fluorescein is one of the most commonly used measures
of tear stability.10, 11 However, it has numerous limitations including the need to instill
fluorescein, lack of standardization of fluorescein concentration, induction of reflex
tearing, subjective assessment, and difficulty in simultaneous assessment of tear break-
up across the entire cornea.11 It is possible to assess tear break-up with noninvasive
methods which include tear film lipid layer interferometry,12, 13 xeroscope and
Tearscope.14 A limitation of these methods is they do not provide standardized objective
measurement of tear stability.
Topographical regularity indices of the Tomey TMS-2N corneal topography
instrument (Tomey Corporation, Nagoya, Japan) have also been used as objective
Page 3 of 28 IOVS

3
diagnostic parameters of tear stability and corneal surface regularity in patients with tear
dysfunction, 15, 16, 17 but these topographic examinations provide data at only one time
point. For kinetic noninvasive assessment of tear stability, Tear Stability Analysis
System (TSAS) software was developed for the TMS-2N and its utility for measuring
tear stability in dry eye was studied.18 This particular software is not commercially
available; however, a modified version has been developed for the RT-7000 Auto
Refractor-Keratometer (Tomey Corporation, Nagoya, Japan). Basically, this system
works on the principle of capturing images of mire rings projected onto the cornea every
second for up to 10 seconds. Points along a radial line are converted into a wave
pattern based on the light intensity of the reflected points at that second. The
instrument’s software uses these waves to calculate tear stability parameters.
The purpose of this study was to evaluate tear film stability in patients with
dysfunctional tear syndrome (DTS) using this new non-invasive TSAS in the RT-7000
instrument and compare the results with those of normal control subjects.
PATIENTS and METHODS
This study was approved by the Baylor College of Medicine, Institutional Review
Board (IRB). It also adhered to the tenets of the Declaration of Helsinki for clinical
research, and written informed consent was obtained from all the participants after
explanation of the purpose and possible consequences of the study.
Forty five consecutive patients with newly diagnosed DTS meeting the inclusion
and exclusion criteria were enrolled for the study at the Ocular Surface Center at Baylor
College of Medicine, Houston, Texas. Patients were excluded if they were using any
Page 4 of 28IOVS

4
topical medications other than preservative-free artificial tears, wearing a contact lens,
had ocular surgery in the past year, or had evidence of any other ocular surface
diseases, systemic disease and medications that would alter the ocular surface.
Twenty-five subjects were recruited as asymptomatic controls. Inclusion criteria for the
control subjects were absence of corneal and conjunctival dye staining and a symptom
severity score ≤ 20. Diagnosis of DTS was based on complaints of eye discomfort
(symptom severity score > 20 and tear break-up time ≤ 7 seconds).
DTS patients recruited for this study were referred by three members of the
cornea service in our department. Asymptomatic control subjects and DTS patients all
underwent the same ocular surface and tear evaluations. Patients completed a dry eye
symptom severity questionnaire, followed by a complete ocular surface examination of
both eyes in the following sequence: TSAS of the right eye by the RT-7000 Auto
Refractor-Keratometer (Tomey Corporation, Nagoya, Japan), topographic measurement
of surface regularity index (SRI) in both eyes (right eye followed by the left eye),
biomicroscopic examination of the lid margins and meibomian glands, fluorescein tear
break-up time (TBUT), corneal fluorescein staining, conjunctival lissamine green
staining, and Schirmer 1 test. With the exception of the TSAS, these tests were
performed by a single investigator (S.C.P) as previously described.19 Symptom severity
score was measured by the ocular surface disease index (OSDI) questionnaire that
contains 12 questions evaluating the character and severity of dry eye symptoms.
Briefly, the questionnaire inquired about the frequency of occurrence of each symptom,
rating it from “none” to “all the time.” The questionnaire scores ranged from 12 (no
symptoms) to a maximum of 59. Criteria for grading DTS severity were modified from
Page 5 of 28 IOVS

5
the Dry Eye Workshop (DEWS) based on the symptom severity scores, TBUT values
and corneal and conjunctival staining scores (Table 1). 20 If all criteria of a severity
group were not met, assignment to a severity grading was based on the worst
parameter. Meibomian gland disease (MGD) was diagnosed by evidence of dysfunction
(lack of expressible meibum from ≥ 75 % of glands on the central lower lid margin) and
the presence of one or more morphological changes of the meibomian glands, including
acinar atrophy, vascular dilation on or scalloping of the posterior lid margin.5, 21 The
United States European Study Group consensus criteria were used for diagnosis of
Sjögren’s syndrome (SS).22
Principle of Tear Film Stability Analysis System of the RT-7000
TSAS software had previously been designed for the Tomey Topographic
Modeling System (TMS-2N; Tomey Corporation, Nagoya, Japan), but it was never
released commercially. We explored a newer version of the TSAS that was developed
for the Tomey RT-7000 Auto Refractor-Keratometer. In this version, 15 mire rings from
a lighted cone are projected onto the corneal surface. To minimize the interference of
lids and lashes, only the 11 central rings are analyzed. The software captures images of
the reflected rings each second for up to 10 consecutive seconds. This study examined
the right eye for 6 seconds. Data points for analysis consist of the intersections of 256
lines radiating from the center with the 11 reflected rings, yielding a total of 2816 points.
Each line of points is converted into a wave pattern based on the light intensity of the
reflected points at that second. Waves at time 0 are set as the standard. The
instrument’s software uses these waves to calculate parameters which include Ring
Break-Up Sum (RBU Sum), Ring Break-Up Time (RBUT), and Ring Break-Up value
Page 6 of 28IOVS

6
(RBU value). Detailed explanations of these parameters are provided in Figures 1 and
2.
Ring Break-Up (RBU) value and Ring Break-Up Sum (RBU Sum)
A Ring Break-Up (RBU) value is the change of ring brightness level of the data
points compared to the previous second. The sum of the RBU value at any given
second and those of the previous seconds is defined as the RBU Sum at that second.
RBU Sum corresponds to the area of tear film breakup. An eye with an RBU Sum of
700, for example, has ten times the area of tear film breakup as one with 70.
Ring Break-Up Time (RBUT)
The time in seconds after the last blink when the RBU sum exceeds a specified
threshold value (20) is considered the Ring Break-Up Time. Based on preclinical testing
the manufacturer found a RBUT less than or equal to 5 seconds to be suggestive of dry
eye.
Statistical Analysis
SPSS 15.0 for Windows evaluation version (LEAD Technologies Inc., Chicago,
IL) was used for statistical analysis. The Pearson Chi-square test was applied to
analyze sex differences among the groups. A Shapiro-Wilk test was carried out to
determine whether data were normally distributed. If a distribution could not be
normalized by logarithmic transformation, the Kruskal-Wallis test was used. Normally
distributed continuous parameters were analyzed among the groups (control and three
DTS groups) by one-way ANOVA and Welch ANOVA tests. Tukey and Tamhane
multiple comparison tests were also applied for the homogenous and nonhomogenous
Page 7 of 28 IOVS

7
parameters, respectively. Spearman’s correlation test was carried out to analyze the
association among the study parameters. The change over time among the groups was
analyzed using repeated measures of ANOVA. The right eye values were used for
statistical comparison of clinical parameters and the Ring Break-Up parameters. A p
value ≤ 0.05 was considered statistically significant.
RESULTS
The demographic data and clinical parameters for control subjects and DTS
patients are presented in Table 2. Etiological subclassification of DTS patients is also
provided in Table 3. For statistical analysis, data from patients meeting DTS 3 and DTS
4 severity criteria were combined to form one group, DTS 3/4. Thus, a total of four
groups were compared: control, DTS 1, DTS 2, and DTS 3/4. Even though the mean
age of control subjects was slightly younger than that of DTS patients, the difference did
not reach statistical significance. There was also no significant difference in gender
distribution among the control and three DTS subgroups.
Clinical parameters
Compared with the control group, the symptom severity scores were significantly
greater in all DTS groups combined (p≤0.001); however, there were no significant
differences in symptom severity scores among the three DTS groups (p= 0.897 for DTS
1 vs DTS 2, p= 1.00 for DTS 1 vs DTS 3/4, p= 0.870 for DTS 2 vs DTS 3/4). The
Schirmer 1 values were lower in each DTS group compared to those of control subjects,
though the difference reached statistical significance only in the DTS 3/4 (p= 0.002).
There was a statistically significant difference in the SRI among the four groups (p<
Page 8 of 28IOVS
8
0.001). In post hoc analysis, the control (p< 0.001), DTS 1 (p= 0.016), and DTS 2 (p=
0.030) groups were all significantly lower than DTS 3/4. The fluorescein TBUT values
were statistically significant among the groups, except for DTS 2 versus DTS ¾ (p>
0.05). Corneal fluorescein staining scores were significantly greater in the DTS groups
compared to the control group (all p values< 0.05). Conjunctival staining scores were
significantly greater in DTS 2 and DTS 3/4 groups compared to the control subjects and
DTS 1 group. Detailed statistical comparisons between groups are provided in the Table
2 legend.
TSAS Analysis
The RBUT results are presented in Table 2. RBUT values in DTS groups were all
significantly lower than the values in control subjects, with the lowest values found in
DTS 3/4. RBUT was significantly shorter in DTS 3/4 than DTS 1.
The RBU Sum over time in the asymptomatic control group and three DTS
groups is presented in Figure 3. The change of RBU Sum over a 6-second period in
DTS groups combined or among the individual groups was found to be statistically
significant (p<0.001). This difference was found to be significant from second 1 to
second 6.
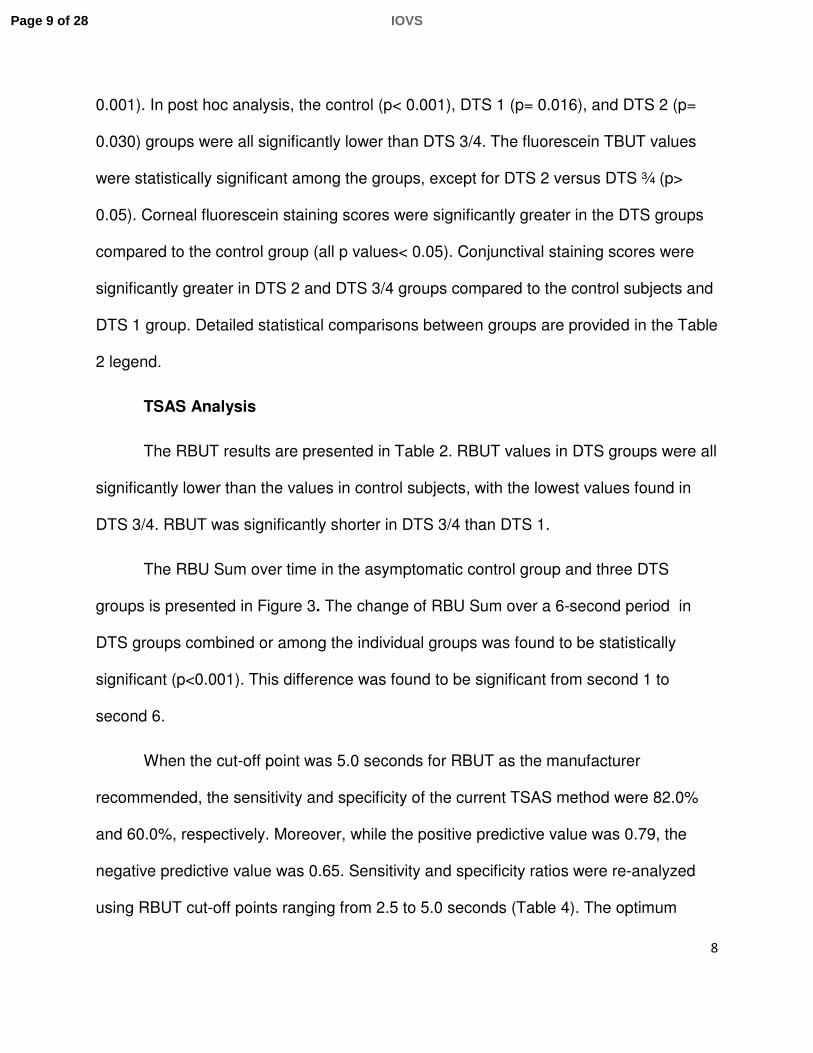
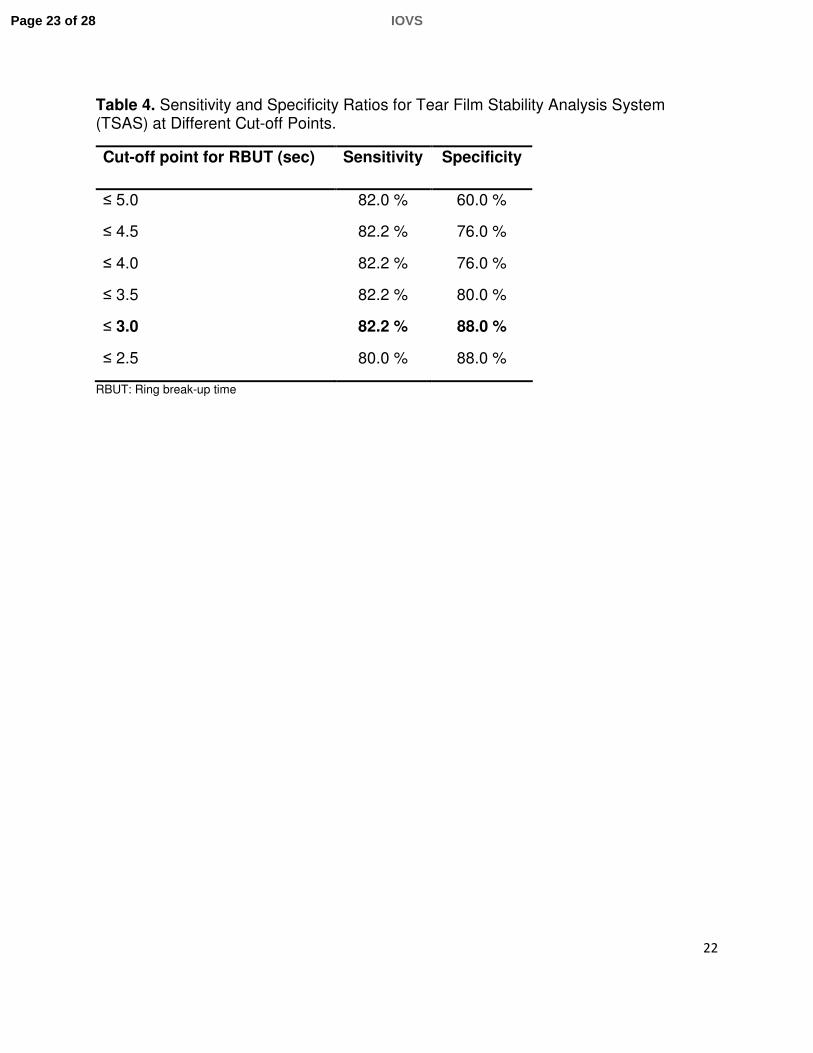
When the cut-off point was 5.0 seconds for RBUT as the manufacturer
recommended, the sensitivity and specificity of the current TSAS method were 82.0%
and 60.0%, respectively. Moreover, while the positive predictive value was 0.79, the
negative predictive value was 0.65. Sensitivity and specificity ratios were re-analyzed
using RBUT cut-off points ranging from 2.5 to 5.0 seconds (Table 4). The optimum
Page 9 of 28 IOVS

9
sensitivity (82.2%) and specificity (88.0%) were obtained when the cut-off point was
lowered to 3.0 seconds.
DISCUSSION
This study evaluated a recently released non-invasive tear stability analysis
system in patients with dysfunctional tear syndrome (DTS). We found that similar to
conventional fluorescein tear break-up time, RBUT measured with the TSAS became
progressively shorter with worsening severity. Furthermore, the RBU Sum values
showed greater increase over the 6 second evaluation time in DTS patients than in the
control group, and the rate of increase was greater with worsening disease severity. A
cut-off point for RBUT of 3.0 seconds was found to have the optimum sensitivity and
specificity of 82.2% and 88.0%, respectively.
In response to the increasing prevalence of dry eye and increasing recognition of
its impact on quality of life, numerous technological advancements have been made in
studying disease pathogenesis, diagnosis and treatment. Development of a non-
invasive diagnostic method to measure tear stability and to identify eyes with tear
dysfunction with high specificity and sensitivity has been a major goal.
In both research studies and in clinical practice, the use of corneal topographic
systems for identifying tear dysfunction has gradually increased. For example, a number
of studies 15, 17, 23, 24 have documented corneal surface irregularity detected by
computerized videokeratoscopy (CVK) indices in patients with DTS. These studies
established that indices such as surface regularity index (SRI), surface asymmetry
index (SAI), potential visual acuity index (PVA) and irregular astigmatism index (IAI) of
Page 10 of 28IOVS

10
the Tomey TMS-2N had good sensitivity and specificity for predicting the presence of
tear dysfunction identified by corneal fluorescein staining. 15 Other studies have
reported that increases in SRI were correlated with decreased functional visual acuity
and contrast sensitivity. 25, 26, 27
A number of non-invasive techniques for assessing precorneal tear film break-up
time without use of fluorescein have been reported. Indeed, instruments such as the
grid xeroscope and Tearscope (Keeler, Windsor, UK) are capable of non-invasive
measurement of tear break-up time. However, identifying tear break-up is still a
subjective assessment with these instruments. 11
Over the last 5 years, several studies have reported the use of CVK systems to
assess tear film stability. 11, 18, 28, 29 Kojima and associates described the Tear Stability
Analysis System (TSAS) software for the TMS – 2N which was programmed to capture
Placido ring images sequentially for 10 seconds. 11 In this system, disruption of tear film
stability was identified as a change in corneal power. Change of corneal power more
than 0.5 diopter (D) was designated an area of break-up. Two parameters were
established to evaluate the tear film stability: 1) tear break-up time (TMS-BUT) and 2)
tear break-up area (TMS-BUA). The system provided a summary of the individual
breakup points in a single display. 18
Kojima et al evaluated the effectiveness of the TSAS for the TMS-2N before and
after the insertion of punctual plugs in patients with tear dysfunction and control
subjects. 11 In eyes with DTS, both tear stability regularity and asymmetry indices (TSRI,
TSAI) derived from SRI and SAI were found to be greater than in control subjects. The
Page 11 of 28 IOVS

11
authors concluded that TSAS was effective in objectively assessing the tear stability in
patients with DTS.
Two studies by Goto and colleagues documented that TMS-BUT and TMS-BUA
had similar specificity to conventional fluorescein TBUT, but videokeratoskopic indices
had significantly higher sensitivity in identifying tear film in stability.18, 29 They reported
TMS break-up time to be shorter than break-up identified by biomicroscopy. 29
Moreover, they suggested that TSAS for the TMS-2N may be used as a new sensitive
method for diagnosing tear dysfunction before and after LASIK. 18, 29
In the present study, a newer version of the TSAS developed for the Tomey RT-
7000 Auto Refractor-Keratometer was evaluated. This system projects mire rings onto
the cornea and captures images of the mires every second for up to 10 seconds. Our
study examined the right eye for 6 seconds. The instrument’s software evaluates ring
brightness to generate parameters which include Ring Break-Up value (RBU value),
Ring Break-Up Sum (RBU Sum) and Ring Break-Up Time (RBUT). A detailed
explanation of the methods used to calculate these indices is provided in the Materials
and Methods section and in Figures 1 and 2. The manufacturer suggests that an RBUT
less than or equal to 5 seconds is suggestive of dry eye.
Several key differences in the two versions of TSAS software deserve to be
highlighted. The TSAS for TMS-2N calculates breakup by changes in corneal power as
measured by corneal topography, while the TSAS for the RT-7000 calculates tear
break-up based on the brightness difference of data points on mire rings. Additionally,
the TSAS for the RT-7000 includes an auto-alignment feature to correct for unstable
Page 12 of 28IOVS

12
fixation of the patient’s eye over the duration of the test. According to the manufacturer
that designed both versions, results of the TSAS of the RT-7000 have been found to be
more stable.
Using the new system we found that the RBUT was significantly lower in all DTS
severity groups combined (p< 0.001) and in each of the subgroups compared to the
asymptomatic control group (p= 0.001, p= 0.003 and p< 0.001, respectively). The RBU
Sum was significantly higher in the entire DTS group at each time interval from 1 to 6
seconds compared to the control group (p= 0.001 at 1 sec and other p values < 0.001)
A distinct difference in the pattern of RBU Sum was noted between the control
subjects and the DTS groups. While the RBU Sum remained relatively constant in the
control group, the RBU Sum in each of the DTS group progressively increased over the
6-second evaluation period. Among the DTS groups, the DTS 3/4 group had the highest
RBU Sum over time, followed by the DTS 2 and DTS 1 groups. These differences in
RBU Sum noted between DTS and control subjects and between the DTS severity
groups indicate the TSAS is objective method to detect tear film instability and it may
prove to be a useful method to monitor efficacy of therapies for DTS.
When we evaluated the sensitivity and specificity of the TSAS model currently
used in this study, sensitivity was found to be as high as 82.0%, but specificity was
60.0% using the cut-off RBUT of 5.0 seconds suggested by the manufacturer. While this
test is useful for identifying DTS patients, it is not as strong at discriminating between
normal individuals from DTS patients. We therefore investigated other cut-off values for
RBUT to eliminate this deficiency. Based on these data, the cut-off point of 3.0 seconds
Page 13 of 28 IOVS

13
for RBUT seems to have greater sensitivity (82.2 %) and specificity (88.0 %) ratios
compared to the cut-off point of 5.0 seconds. Therefore, an RBUT of less than 3.0
seconds appears to be appropriate for identifying an unstable tear film.
One of the most important disadvantages of this new method is the high
variability of RBU Sum. Based on the present data, this variability significantly increased
with the level of clinical severity of DTS and increased in all groups over time. This was
consistent with our observation of minimal variability of the results in repeated exams of
normal eyes. Fortunately, the change in RBU Sum over time between the control group
and DTS groups became statistically significant at the first second, revealing that the
instrument is efficient and reliable method for identifying tear instability in patients
complaining of eye irritation. Squinting, flinching, lid movement and looking away from
the target were actions observed to increase the RBU readings and thus decrease the
RBUT. To minimize the impact of these factors, subjects were encouraged to keep their
eyes wide open and focused on the target for the duration of the test. It should be
noted, however, that doing so for 6 seconds can be a challenge especially for patients
experiencing irritation and photophobia, hence these movements may contribute to the
variability of the measurement.
For some subjects, facial anatomy, notably the brow and nose, necessitated
repositioning of the head to allow for proper alignment of the lighted cone. Even with
repositioning, a few subjects still could not be tested due to prominent facial features.
This is a limitation that the manufacturer may want to address in future devices.
Page 14 of 28IOVS
14
In conclusion, the TSAS system for the RT-7000 provides valuable information
regarding tear film stability in patients with tear dysfunction. It appears to be a useful
non-invasive tool for diagnosing and stratifying DTS. It may also help as an objective
indicator for monitoring therapies for tear dysfunction.
Page 15 of 28 IOVS

15
REFERENCES
1. Schein OD, Munoz B, Tielsch JM, Bandeen-Roche K, West S. Prevalence of dry
eye among the elderly. Am J Ophthalmol. 1997; 124: 723–728.
2. Moss SE, Klein R, Klein BE. Prevalence of and risk factors for dry eye syndrome.
Arch Ophthalmol. 2000; 118: 1264–1268.
3. McCarty CA, Bansal AK, Livingston PM, Stanislavsky YL, Taylor HR. The
epidemiology of dry eye in Melbourne, Australia. Ophthalmology. 1998; 105:
1114–1119.
4. Behrens A, Doyle JJ, MPH, Stern L, et al. Dysfunctional tear syndrome. A Delphi
approach to treatment recommendations. Cornea. 2006; 25: 900–907.
5. Lam H, Bleiden L, de Paiva CS, Farley W, Stern ME, Pflugfelder SC. Tear
cytokine profiles in dysfunctional tear syndrome. Am J Ophthalmol. 2009; 147:
198-205.
6. Pflugfelder SC, Solomon A, Stern ME. The diagnosis and management of Dry
Eye. Cornea. 2000; 19: 644-649.
7. Chen HB. Yamabayashi S, Ou B, Ohno S, Tsukahara S. Structure and
composition of rat precorneal tear film. A study by an in vivo cryofixation. Invest
Ophthalmol Vis Sci. l997; 38: 381-87.
Page 16 of 28IOVS
16
8. Prydal JL, Campbell FW. Study of precorneal tear film thickness and structure by
interferometry and confocal microscopy. Invest Ophthalmol Vis Sci. 1992; 33:
1996-2005.
9. Stern ME, Beuerman R, Pflugelder SC. The Normal Tear Film and Ocular
Surface in Dry Eye and Ocular Surface Disorders. Marcel Dekker, New York City,
NY: Pflugfelder, ME Stern, R Beuerman; 2004: 41-62.
10. De Paiva CS, Pflugfelder SC. Tear clearance implications for ocular surface
health. Exp Eye Res. 2004; 78: 395-397.
11. Kojima T, Ishida R, Dogru M, Goto E, Takano Y, Matsumoto Y, Kaido M, Ohashi
Y, Tsubota K. A new noninvasive tear stability analysis system for the
assessment of dry eyes. Invest Ophthalmol Vis Sci. 2004; 45: 1369-1374.
12. Goto E, Tseng SC. Kinetic analysis of tear interference images in aqueous tear
deficiency dry eye before and after punctual occlusion. Invest Ophthalmol Vis
Sci. 2003; 44: 1897-1905.
13. Goto E, Tseng SC. Differentiation of lipid tear deficiency dry eye by kinetic
analysis of tear interference images. Arch Ophthalmol. 2003; 121: 173-180.
14. Mengher LS, Bron AJ, Tonge SR, Gilbert DJ. A non-invasive instrument for
clinical assessment of the pre-corneal tear film stability. Curr Eye Res. 1985; 4:
1-7.
Page 17 of 28 IOVS

17
15. De Paiva CS, Lindsey J, Pflugfelder SC. Assessing the severity of keratitis sicca
with videokeratoscopic indices. Ophthalmology. 2003; 110: 1102-9.
16. Liu Z, Pflugfelder SC. Corneal surface regularity and the effect of artificial tears in
aqueous tear deficiency. Ophthalmology. 1999; 106: 939-943.
17. Wilson SE, Klyce SD. Advances in the analysis of corneal topography. Surv
Ophthalmol. 1991; 35: 269-277.
18. Goto T, Zheng Z, Okamoto S, Ohashi Y. Tear film stability analysis system:
introducing a new application for videokeratography. Cornea. 2004; 23: 65-70.
19. De Paiva CS, Chen Z, Koch DD, et al. The incidence and risk factors for
developing dry eye after myopic LASIK. Am J Ophthalmol. 2006; 141: 438–445.
20. Pflugfelder SC, Geerling G, Kinoshita S, et al. Management and Therapy of Dry
Eye Disease: Report of the Management and Therapy Subcommittee of the
International Dry Eye Workshop (2007). Ocul Surf. 2007; 5: 163–178.
21. Methodologies to diagnose and monitor dry eye disease: report of the Diagnostic
Methodology Subcommittee of the International Dry Eye Work Shop (2007). Ocul
Surf 2007; 5: 108-52.
22. Vitali C, Bombardieri S, Moutsopoulos HM, et al. Assessment of the European
classification criteria for Sjögren syndrome in a series of clinically defined cases:
results of a prospective multicentre study. The European Study Group on
Diagnostic Criteria for Sjögren Syndrome. Ann Rheum Dis. 1996; 55: 116 –121.
Page 18 of 28IOVS

18
23. Liu Z, Pflugfelder SC. Corneal surface regularity and the effect of artificial tears in
aqueous tear deficiency. Ophthalmology. 1999; 106: 939-43.
24. Ozkan Y, Bozkurt B, Gedik, et al. Corneal topographical study of the effect of
lacrimal punctum occlusion on corneal surface regularity in dry eye patients. Eur
J Ophthalmol. 2001; 11: 116-9.
25. Shiotani Y, Maeda N, Inoue T, et al. Comparison of topographic indices that
correlate with visual acuity in videokeratography. Ophthalmology. 2000; 107:
559-63.
26. Maeda N, Sato S, Watanabe H, et al. Prediction of letter contrast sensitivity using
videokeratographic indices. Am J Ophthalmol. 2000; 129: 759-63.
27. Goto E, Yagi Y, Matsumoto Y, Tsubota K. Impaired functional visual acuity of
patients with dry eye. Am J Ophthalmol. 2002; 133: 181-6.
28. Montes-Mico R. Role of the tear film in the optical quality of the human eye. J
Cataract Refract Surg. 2007; 33: 1631-1635.
29. Goto T, Zheng X, Klyce SD, et al. Evaluation of the tear film stability after laser in
situ keratomileusis using the tear film stability analysis system. Am J Ophthalmol.
2004; 137: 116-20.
Page 19 of 28 IOVS

19
Table 1. Severity Grading Criteria for Dysfunctional Tear Syndrome (DTS).
Parameters Control DTS1 DTS2 DTS3 DTS4
Symptom severity score *
≤ 20 > 20 > 20 > 20 > 20
Tear break-up time (seconds)
>7 ≤ 7 ≤ 7 ≤ 7 ≤ 7
Conjunctival staining score
0 ≤ 3 ≥ 3 ≥ 3 ≥ 3
Corneal staining score
0 ≤ 2 ≤ 8 > 8, including
central cornea or filaments
≥ 12
*Symptom severity score was measured by ocular surface disease index (OSDI) questionnaire
DTS: Dysfunctional tear syndrome DTS 1-4: Dysfunctional tear syndrome severity levels from 1 to 4.
Page 20 of 28IOVS

20
Table 2. Demographic and Clinical Features of Dysfunctional Tear Syndrome (DTS) Patients and Control Subjects
Parameters Control
(n:25)
A
DTS 1
(n:23)
B
DTS 2
(n:11)
C
DTS 3/4
(n:11)
D
P*
Age 48.20 ± 16.55 52.48 ± 16.14 59.36 ± 19.54 55.36 ± 14.14 0.282
Sex (m/f) (%) 56 / 44 21.7 / 78.3 36.4 / 63.6 36.4 / 63.6 0.112
OSDI scores 10.40 ± 4.65 35.65 ± 11.95 31.27 ± 11.45 35.73 ± 7.11 <0.001
TBUT 9.12 ± 0.97 5.91 ± 3.10 3.10 ± 1.52 2.91 ± 1.22 <0.001
Conjunctival SS. 0 ± 0 0.09 ± 0.29 1.73 ± 2.19 2.36 ± 3.32 0.001
Corneal SS. 0 ± 0 0.77 ± 0.97 3.73 ± 1.35 9.36 ± 4.00 <0.001
Schirmer 1 22.63 ± 9.66 14.68 ± 10.72 12.67 ± 8.17 8.50 ± 8.76 0.002
SRI
RBUT
0.13 ± 0.14
4.91 ± 1.62
0.42 ± 0.38
2.40 ± 2.47
0.37 ±0.34
1.24 ± 1.75
1.04 ± 0.66
0.36 ± 0.45
<0.001
<0.001
TBUT: Tear Break up time (seconds), Conjunctival SS: Conjunctival Staining Score, Corneal SS: Corneal Staining Score, SRI: Surface Regulatory Index, RBUT: Ring Break-up Time, DTS: Dysfunctional Tear Syndrome *P values, among A, B, C, and D groups Age: One-way ANOVA, Sex: Chi-square, OSDI scores: Welch ANOVA, TBUT: Kruskal-Wallis H, Corneal and Conjunctival SS: Kruskal-Wallis H, Schirmer 1: One-way ANOVA (after logarithmic transformation), SRI: One-way ANOVA (after logarithmic transformation), RBUT: Welch ANOVA (after logarithmic transformation) Post Hoc p values: OSDI: p< 0.001 (A-B), p= 0.001 (A-C), p< 0.001 (A-D), p= 0.897 (B-C), p= 1.00 (B-D), p= 0.870 (C-D) TBUT: p< 0.05 (A-B), p< 0.05 (A-C), p< 0.05 (A-D), p< 0.05 (B-C), p< 0.05 (B-D), p> 0.05 (C-D) Conjunctival SS: p> 0.05 (A-B), p< 0.05 (A-C), p< 0.05 (A-D), p> 0.05 (B-C), p> 0.05 (B-D), p> 0.05 (C-D) Corneal SS: p< 0.05 (A-B), p< 0.05 (A-C), p< 0.05 (A-D), p< 0.05 (B-C), p< 0.05 (B-D), p< 0.05 (C-D) Schirmer 1: p= 0.076 (A-B), p= 0.078 (A-C), p= 0.002 (A-D), p= 0.967 (B-C), p= 0.217 (B-D), p= 0.576 (C-D) SRI: p= 0.082 (A-B), p= 0.229 (A-C), p< 0.001 (A-D), p= 0.997 (B-C), p= 0.016 (B-D), p= 0.030 (C-D) RBUT: p= 0.001 (A-B), p= 0.003 (A-C), p< 0.001 (A-D), p= 0.700 (B-C), p= 0.004 (B-D), p= 0.522 (C-D)
Page 21 of 28 IOVS

21
Table 3. Etiological Subclassification of Dysfunctional Tear Syndrome (DTS) Patients.
Etiology All DTS
(n:45)
DTS 1
(n:23)
DTS 2
(n:11)
DTS 3 / 4
(n:11)
MGD 27 (60.0) 15 (65.2) 7 (63.6) 5 (45.5)
SS 5 (11.1) - 1 (9.1) 4 (36.4)
Non-SS ATD 13 (28.9) 8 (34.8) 3 (27.3) 2 (18.2)
MGD: Meibomian gland disease; SS: Sjögren’s Syndrome; Non-SS ATD: Non Sjögren’s Syndrome Aqueous Tear Deficiency
Page 22 of 28IOVS
22
Table 4. Sensitivity and Specificity Ratios for Tear Film Stability Analysis System (TSAS) at Different Cut-off Points.
Cut-off point for RBUT (sec) Sensitivity Specificity
≤ 5.0 82.0 % 60.0 %
≤ 4.5 82.2 % 76.0 %
≤ 4.0 82.2 % 76.0 %
≤ 3.5 82.2 % 80.0 %
≤ 3.0 82.2 % 88.0 %
≤ 2.5 80.0 % 88.0 %
RBUT: Ring break-up time
Page 23 of 28 IOVS
23
FIGURE LEGENDS
Figure 1. There are 256 points evenly distributed on each of the 11 central mire
rings. These points are radially connected by lines to make 256 lines.
Each line of points is converted into a wave based on the light intensity of
the reflected points at that second. The waves are also regularized, or
normalized, to account for peripheral rings not reflecting as brightly as
central ones due to a greater distance from the light source.
The difference of the area under the curves of each point at n seconds
and 0 seconds is calculated (example: the shaded area between the solid
and dashed lines of “Ring 4” above). When the difference reaches a
designated threshold, the point is considered to be a “break-up point”.
Peripheral break-up points are weighted more heavily to compensate for a
lower density of points. The total break-up points in the 11 central rings,
after being weighted, is the Ring Break-Up Sum (RBU Sum) for n
seconds. The time at which RBU Sum exceeds 20.0 is the Ring Break-Up
Time (RBUT). A RBUT of less than 5.0 seconds is suggestive of dry eye.
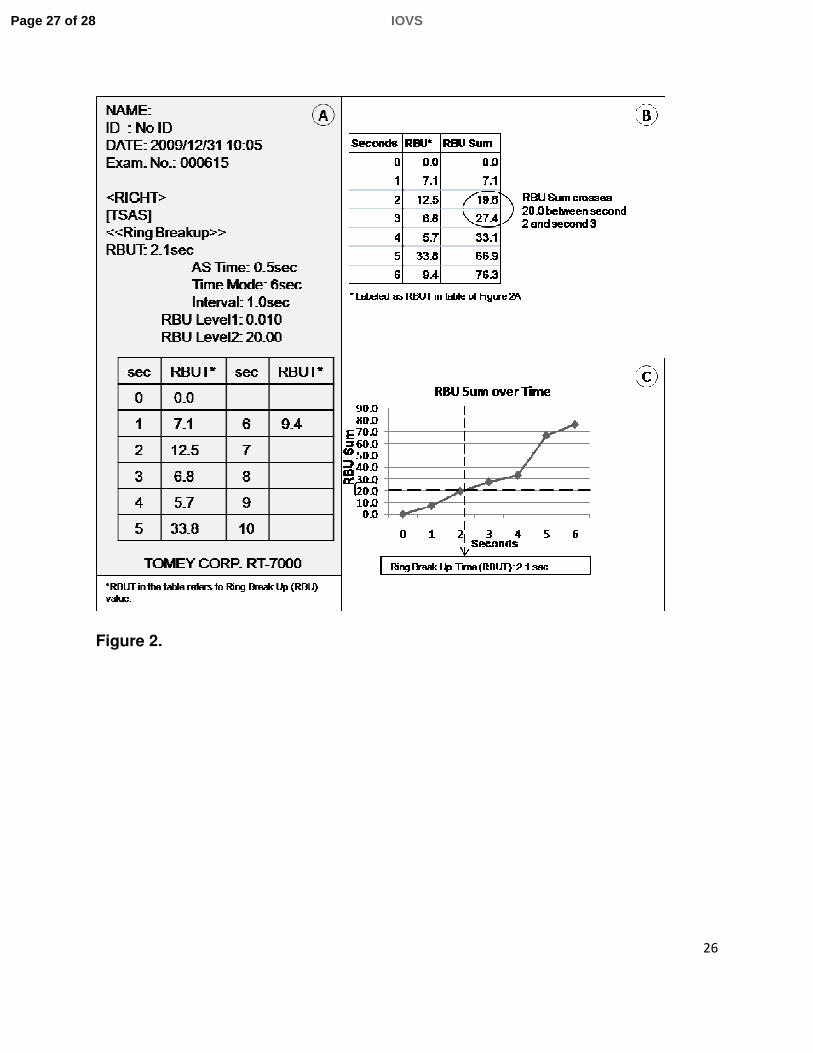
Figure 2. Ring Break-Up (RBU) values represent the changes of RBU Sum between
consecutive seconds. For example, at second 2, the value 12.5 on the
printout (Figure 2A) indicates an increase of 12.5 RBU from second 1,
thus the RBU Sum at second 2 is 7.1+12.5=19.6. At second 3, the value
6.8 means an increase of 6.8 RBU, so the RBU Sum at second 3 is
7.1+12.5+6.8=27.4 (Figure 2B).
Page 24 of 28IOVS

24
The time at which RBU Sum crosses the threshold of 20.0 is the Ring
Break-Up Time (RBUT), at 2.1 seconds in this example (Figure 2C). An
RBUT less than 5.0 seconds, as in this case, suggests dry eye.
Figure 3. The graph is revealing RBU Sum over time. Control group values had the
lowest RBU Sum throughout the 6 seconds. RBU Sum increased each
second with increasing severity of DTS. Variability increased with
increasing severity of DTS and also increased over time in each DTS
group. Bars indicate 95% confidence intervals.
Page 25 of 28 IOVS

25
Figure 1.
Page 26 of 28IOVS
26
Figure 2.
Page 27 of 28 IOVS

27
Figure 3.
Page 28 of 28IOVS