
Page 1 of 227 - Elsenburg
227
Page 1 of 227
Transcript of Page 1 of 227 - Elsenburg

Page 1 of 227

Page 2 of 227
Department of
Agriculture
Annual Performance Plan
2015 - 2016
Western Cape
Date of tabling: 5 March 2015
Page 3 of 227
ISBN Number: 978-0-9922409-6-7
To obtain additional copies of this document, please contact: Mrs TC Smith
Address: Muldersvlei Road, Elsenburg
Tel: (021) 808 5020
Fax: (021) 808 5000
E-mail: [email protected]
Om nog afskrifte van hierdie dokument te bekom, tree in verbinding met: Mev
TC Smith
Adres: Muldersvleiweg, Elsenburg
Tel: (021) 808 5020
Faks: (021) 808 5000
e-Pos: [email protected]
Ukuba ufuna iikopi ezongezelelweyo zolu xwebhu, qhagamshelana: Mrs TC Smith
Idilesi: Muldersvlei Road, Elsenburg
Umnxeba: (021) 808 5020
Ifekisi: (021) 808 5000
I-E-Mail: [email protected]

Page 4 of 227
FOREWORD
The Western Cape Government has taken a new, focussed approach to grow
our economy and create jobs.
We are currently engaging with the private sector to develop action plans for
high-potential sectors where we have a clear competitive advantage.
Driven by our number one Provincial Strategic Goal - to create opportunities for
growth and jobs – we will place special attention on practical projects in these
sectors.
This process is called Project Khulisa. Khulisa means “to grow” in isiXhosa.
Project Khulisa identified Tourism, Agri Processing and Oil and Gas as sectors
which are growing the fastest and have the highest job creation potential.
Our research shows us that Agri Processing is one of the areas with the ability to
dramatically ramp up economic opportunities, particularly in rural areas.
That is why we will share our energy between what happens on farms and
beyond production around adding value to our commodities.
Along with agri processing, land reform will also be a key priority during this term
of government.
Although we already have the best land reform success rate in the country, we
must do more.
Accelerating the pace of land reform will transform our agricultural sector,
ensuring that it is inclusive and provides opportunities for more residents.
We can only do this through partnerships between spheres of government, the
private sector and the residents of the Western Cape.
It is my goal that over the next five years we will work, better together, to deliver
meaningful growth and real jobs.
ALAN WINDE
MINISTER OF ECONOMIC OPPORTUNITIES

Page 5 of 227
OFFICIAL SIGN-OFF
It is hereby certified that this Annual Performance Plan:
Was developed by the management of the Department of Agriculture: Western Cape
under the guidance of Minister A Winde
Was prepared in line with the current Strategic Plan of the Department of Agriculture:
Western Cape
Accurately reflects the performance targets which the Department of Agriculture:
Western Cape will endeavour to achieve given the resources made available in the
budget for 2015/16.
FJJ HUYSAMER Signature: ___________________________
Chief Financial Officer
(Ms) JS ISAACS Signature: ___________________________
Accounting Officer
Approved by:
A WINDE Signature: ___________________________
Executive Authority

Page 6 of 227

Page 7 of 227
CONTENTS PAGE
ABBREVIATIONS 10
PART A: STRATEGIC OVERVIEW 13
1 Vision 13
2 Mission 13
3 Values 13
4 Legislative and other mandates 13
4.1 Constitutional mandates 13
4.2 Legislative mandates 14
4.3 Policy mandates 16
4.4 Relevant court rulings 17
4.5 Planned policy initiatives 17
5 Update of situational analysis 18
5.1 Performance environment 18
5.2 Organisational environment 36
5.3 Description of the strategic planning process 40
6 Strategic outcome oriented goals 42
PART B: PROGRAMME AND SUB-PROGRAMME PLANS 52
7 Programme 1 – Administration 52
7.1 Strategic Objectives 2015/16 52
7.2 Sub-Programmes 1.2: Senior Management 53
7.3 Sub-Programmes 1.3: Corporate Services 54
7.4 Sub-Programmes 1.4: Financial Management 58
7.5 Sub-Programmes 1.5: Communication Services 61
7.6 Reconciling performance targets with the Budget and MTEF 62
7.7 Performance and expenditure trends 63
8 Programme 2 – Sustainable Resource Management 63
8.1 Strategic objective annual targets for 2015/16 63
8.2 Sub-Programmes 2.1: Engineering Services 63
8.3 Sub-Programmes 2.2: LandCare 67
8.4 Sub-Programmes 2.3: Land Use Management 71
8.5 Sub-Programmes 2.4: Disaster Risk Management 74
8.6 Reconciling performance targets with the Budget and MTEF 76
8.7 Performance and expenditure trends 77
Page 8 of 227
9 Programme 3 – Farmer Support and Development 77
9.1 Strategic objective annual targets for 2015/16 77
9.2 Sub-Programmes 3.1: Farmer Settlement and Development 77
9.3 Sub-Programmes 3.2: Extension and Advisory Services 80
9.4 Sub-Programmes 3.3: Food Security 84
9.5 Sub-Programmes 3.4: Casidra SOC Ltd 87
9.6 Reconciling performance targets with the Budget and MTEF 89
9.7 Performance and expenditure trends 90
10 Programme 4 – Veterinary Services 90
10.1 Strategic objective annual targets for 2015/16 90
10.2 Sub-Programmes 4.1: Animal Health 91
10.3 Sub-Programmes 4.2: Export Control 93
10.4 Sub-Programmes 4.3: Veterinary Public Health 96
10.5 Sub-Programmes 4.4: Veterinary Laboratory Services 98
10.6 Reconciling performance targets with the Budget and MTEF 102
10.7 Performance and expenditure trends 102
11 Programme 5 – Research and Technology Development Services 103
11.1 Strategic objective annual targets for 2015/16 103
11.2 Sub-Programmes 5.1: Research 103
11.3 Sub-Programmes 5.2: Technology Transfer Services 108
11.4 Sub-Programmes 5.3: Infrastructure Support Service 111
11.5 Reconciling performance targets with the Budget and MTEF 112
11.6 Performance and expenditure trends 113
12 Programme 6 – Agricultural Economics Services 113
12.1 Strategic objective annual targets for 2015/16 113
12.2 Sub-Programmes 6.1: Agri-Business Support and Development 114
12.3 Sub-Programmes 6.2: Macroeconomics Support 119
12.4 Reconciling performance targets with the Budget and MTEF 122
12.5 Performance and expenditure trends 122
13 Programme 7 – Structured Agricultural Education and Training 123
13.1 Strategic objective annual targets for 2015/16 123
13.2 Sub-Programmes 7.1: Higher Education and Training 123
13.3 Sub-Programmes 7.2: Further Education and Training 127
13.4 Reconciling performance targets with the Budget and MTEF 130
13.5 Performance and expenditure trends 131
14 Programme 8 – Rural Development 131
14.1 Strategic objective annual targets for 2015/16 131
14.2 Sub-Programmes 8.1: Rural Development Coordination 131
14.3 Sub-Programmes 8.2: Social Facilitation 133
14.4 Sub-Programmes 8.3: Farm Worker Development 135
14.5 Reconciling performance targets with the Budget and MTEF 139
14.6 Performance and expenditure trends 139
Page 9 of 227
PART C: LINKS TO OTHER PLANS 140
15 Links to the long-term infrastructure and other capital plans 140
16 Conditional grants 140
17 Public entities 147
18 Public-private partnerships 147
Annexure A: Technical indicator descriptions 148

Page 10 of 227
ABBREVIATIONS
ACF Alternative Crops Fund
AET Agricultural Education and Training
AES Agricultural Economics Services
AFS Annual Financial Statements
AIDS Acquired Immune Deficiency Syndrome
AIMS Agricultural Information Management System
AIU Agribusiness Investment Unit
APAP Agricultural Action Policy Plan
APFRYD Agricultural Partnership for Rural Youth Development
APP Annual Perform Plan
ARC Agricultural Research Council
BAS Basic Accounting System
BBBEE Broad-Based Black Economic Empowerment
BFAP Bureau for Food and Agricultural Policy Research
BRICS Brazil, Russia, India, China and South Africa
BSE Bovine Spongiform Encephalosis
CAADP Comprehensive Africa Agricultural Development Programme
CADIS Cape Animal Disease Information System
CASP Comprehensive Agricultural Support Programme
CCS Compulsory Community Service
CFO Chief Financial Officer
Constitution Constitution of the Republic of South Africa (Act 108 of 1996)
CoE Compensation of Employees
COS Council of Stakeholders
CPAC Commodity Project Allocation Committee
CRDP Comprehensive Rural Development Programme
DAFF Department of Agriculture, Forestry and Fisheries
DEADP Western Cape Department of Environmental Affairs and
Development Planning
DLC District Land Committee
DoH Department of Health
DPAC Departmental Project Allocation Committee
DPME Department of Performance Monitoring and Evaluation
DRDLR Department of Rural Development and Land Reform
DSD Department of Social Development
DSG Departmental Strategic Goals
DTPW Western Cape Department of Transport and Public Works
DWAS Department of Water Affairs and Sanitation
ECSA Engineering Council of South Africa
EPA Economic Partnership Agreement
EPWP Extended Public Works Programme
ERMCO Enterprise Risk Management Committee
ERP Extension Revitalisation Programme
EU European Union

Page 11 of 227
FAO Food and Agricultural Organisation of the United Nations
FARE Future of Agriculture and Rural Economy
FET Further Education and Training
FSD Farmer Support and Development
GI Geographic Indicators
GPS Global Positioning System
ha Hectare
HAS Hygiene Assessment System
HCD Human Capital Development
HCDS Human Capital Development Strategy
HET Higher Education and Training
HIV Human Immunodeficiency Virus
HOD Head of Department
IAMP Immovable Asset Management Plan
IDP Integrated Development Plan
IFSS-SA Integrated Food Security Strategy of South Africa
IGDP Integrated Growth and Development Plan
IPAP Industrial Policy Action Plan
ISC Intergovernmental Steering Committee
ISO International Organisation for Standardisation
JPI Joint Planning Initiative
LOGIS Government Procurement System
LREAD Land Reform Advisory Desk
Ltd Limited
LUPA Land Use Planning Act
MDG Millennium Development Goals
MEC Member of the Executive Council
MOA Memorandum of Agreement
MOU Memorandum of Understanding
MTEF Medium Term Expenditure Framework
MTSF Medium Term Strategic Framework
NARS National Abattoir Rating Scheme
NDP National Development Plan Vision 2030
NEPAD New Partnership for Africa’s Development
NGP New Growth Path
NIP National Infrastructure Plan
NMMU Nelson Mandela Metropolitan University
NO National Outcomes
NPC National Planning Commission
NQF National Qualifications Framework
OHS Occupational Health and Safety
OIE World Organisation for Animal Health
OQF Occupation Qualifications Framework
OSD Occupational Specific Dispensation
PAY Premier’s Advancement of Youth Project
PDA Provincial Department of Agriculture
PDI Previously Disadvantaged Individual

Page 12 of 227
PDMC Provincial Disaster Management Centres
PDP Provincial Delivery Plan
PERO Provincial Economic Review and Outlook
PFMA Public Finance Management Act (Act 1 of 1999)
PPECB Perishable Products Export Control Board
PSDF Provincial Spatial Development Framework
PSG Provincial Strategic Goal
PSP Provincial Strategic Plan
QMS Quality Management System
RD Rural Development
RDC Rural Development Coordination
RPL Recognition of Prior Learning
RTDS Research and Technology Development Services
SAET Structured Agricultural Education and Training
SALA Subdivision of Agricultural Land Act (Act 70 of 1970)
SANAS South African National Accreditation System
SAQA South African Qualifications Authority
SASSA South African Social Security Agency
SCM Supply Chain Management
SCOA Standard Chart of Accounts
SDF Spatial Development Framework
SDG Sustainable Development Goals
SIP Strategic Infrastructure Plan
SIZA Sustainable Initiative of South Africa
SOC State Owned Company
SOP Standard Operating Procedures
SPLUMA Spatial Planning and Land Use Management Act
SPS Sanitary and Phytosanitary standards
SRM Sustainable Resource Management
TAD Trans-boundary animal diseases
TNA Training Needs Analysis
UAMP User Asset Management Plan
UTA Unit for Technical Assistance
VPH Veterinary Public Health
VS Veterinary Services
WCARF Western Cape Agricultural Research Forum
WCDOA Western Cape Department of Agriculture
WCG Western Cape Government
WCPVL Western Cape Provincial Veterinary Laboratory
WIETA Wines Initiative for Ethical Trade Association
YPP Young Professionals Programme
Page 13 of 227
PART A: STRATEGIC OVERVIEW
1 Vision
A united, responsive and prosperous agricultural sector in balance with nature
2 Mission
Unlocking the full potential of agriculture to enhance the economic, ecological
and social wealth of all the people of the Western Cape through:
Encouraging sound stakeholder engagements;
Promoting the production of affordable, nutritious, safe and accessible food,
fibre and agricultural products;
Ensuring sustainable management of natural resources;
Executing cutting edge and relevant research and technology
development;
Developing, retaining and attracting skills and human capital;
Providing a competent and professional extension support service;
Enhancing market access for the entire agricultural sector;
Contributing towards alleviation of poverty and hunger, and
Ensuring transparent and effective governance.
3 Values
Caring
Competence
Accountability
Integrity
Responsiveness
Respect
Innovation
4 Legislative and other mandates
4.1 Constitutional mandates
The Western Cape Department of Agriculture (WCDOA) derives its Constitutional
mandate largely from Section 104 (1) (b) of the South African Constitution (Act
108 of 1996) which conveys the power to provinces to pass legislation on any
functionality listed in schedules 4A (concurrent) and 5A (exclusive provincial).
Concurrent functions include agriculture, animal and disease control, disaster
management, environment, regional planning, soil conservation, trade, tourism
as well as urban and rural development. Exclusive provincial mandates include
provincial planning, abattoirs and veterinary services.

Page 14 of 227
The Constitution also provides the framework within which this concurrency must
be executed. Section 40 of the Constitution constitutes government at national,
provincial and local spheres. It also indicates that government at these spheres
should be distinctive, interdependent and interrelated. Section 41 (2) of the
Constitution rules that an Act of Parliament must regulate the relationship
between the three spheres of Government, which resulted in the
Intergovernmental Relations Framework Act (Act 13 of 2005). This Act makes
provision for a number of platforms where functional and coordination issues can
be discussed between the various spheres of Government.
Finally, no overview of the Constitutional mandate of the Department can be
complete without referring to the Bill of Rights (Chapter 2) and the responsibility it
conveys onto officials. Of most relevance to the Department is rights such as fair
labour relations (employers and employees) (Article 23), protected environment
(Article 24), property ownership (Article 25), food and water (Article 27) and just
administrative action (Article 33).
The Constitution of the Western Cape, Act 1 of 1998.
4.2 Legislative mandates
Adult Basic Education and Training Act (Act 52 of 2000)
Agri-BEE Transformation Charter (Under Act 53 of 2003)
Agricultural Products Standards Act (Act 119 of 1990)
Agricultural Produce Agents Act (Act 12 of 1992)
Animal Diseases Act (Act 35 of 1984)
Animal Identification Act (Act 6 of 2002)
Aquatic Animal Health Code of the World Organisation for Animal Health
(OIE – Office International des Epizooties)
Basic Conditions of Employment Act (Act 75 of 1997)
Broad Based Black Economic Empowerment Act (Act 53 of 2003)
Codex Alimentarius of the World Health Organisation (International Code of
Food Safety)
Companies Act (Act 71 of 2008)
Compensation for Occupational Injuries and Diseases Act (Act 130 of 1993)
Conservation of Agricultural Resources Act (Act 43 of 1983)
Consumer Protection Act (Act 68 of 2008)
Cooperatives Act (Act 14 of 2005)
Division of Revenue Act (Annually)
Employment Equity Act (Act 55 of 1998)
Employment of Education and Training Act (Act 76 of 1998)
Extension of Security of Tenure Act (Act 62 of 1997)
Fertilisers, Farm Feeds, Agricultural Remedies and Stock Remedies Act (Act 36
of 1947)
Further Education and Training Act (Act 98 of 1998)

Page 15 of 227
General and Further Education and Training Quality Assurance Act (Act 58 of
2001)
Government Employees Pension Law (1996)
Government Immovable Asset Management Act (Act 19 of 2007)
Higher Education Act (Act 101 of 1997)
Income Tax Act (1962 – 4th standard)
International Code for Laboratory Diagnostic Procedures for Animal Diseases
of the World Organisation for Animal Health
International Sanitary and Phyto-Sanitary Code of the World Trade
Organisation
Labour Relations Act (Act 66 of 1995)
Land Reform Act (Act 3 of 1997)
Land Use Planning Ordinance (Ordinance 15 of 1985)
Liquor Products Act (Act 60 of 1989)
Marketing of Agricultural Products Act (Act 47 of 1996)
Meat Safety Act (Act 40 of 2000)
Medicines Control Act (Act 101 of 1965)
Merchandise Marks Act (Act, 17 of 1941)
National Archives Act (Act 43 of 1996)
National Disaster Management Act (Act 57 of 2002)
National Education Policy Act (Act 27 of 1996)
National Environment Management Act (NEMA) (Act 107 of 1998)
National Qualifications Framework Act (Act 67 of 2008)
Natural Scientific Professions Act (Act 20(3) of 2003)
National Water Act (Act 36 of 1998)
Occupational Health and Safety Act (Act 85 of 1993)
Preferential Procurement Policy Framework Act (Act 5 of 2000)
Prevention of Illegal Evictions from and Unlawful Occupation of Land Act,
(Act 19 of 1998)
Promotion of Access to Information Act (Act 2 of 2000)
Promotion of Administrative Justice Act (Act 3 of 2000)
Protection of Personal Information Act (Act 4 of 2013)
Public Finance Management Act (Act 1 of 1999 as amended by Act 29 of
1999)
Public Holidays Act (Act 6 of 1994)
Public Service Act (Act 103 of 1994)
Rules relating to the practising of veterinary professions (GNR.2086 of 1
October 1982).
Rules relating to the practising of the para-veterinary profession of veterinary
technologist (GNR.1065 of 17 May 1991).
Rules relating to the practising of the para-veterinary profession of animal
health technician (GNR.770 of 24 August 2007).
Sanitary and Phyto-Sanitary Agreement of the World Trade Organization
Skills Development Act (Act 97 of 1998)
Skills Development Levies Act (Act 9 of 1999)
South African Qualifications Act (Act 58 of 1995)
Spatial Planning and Land Use Management Act (Act 16 of 2013)

Page 16 of 227
Subdivision of Agricultural Land Act (Act 70 of 1970)
Terrestrial Animal Health Code of the World Organisation for Animal Health
(OIE – Office International des Epizooties)
Veterinary and Para-Veterinary Professions Act (Act 19 of 1982)
4.3 Policy mandates
International
Millennium Development Goals (MDG)
The Comprehensive Africa Agricultural Development Programme (CAADP)
Sustainable Development Goals (SDG)
National
National Development Plan 2030 (NDP)
National Programme of Action with its 14 NOs (NO)
Strategic Infrastructure Projects (SIP) flowing from the NDP
The Strategic Plan for South African Agriculture (to be replaced by IGDP)
Integrated Growth and Development Plan (IGDP)
Agricultural Policy Action Plan (APAP)
Comprehensive Agricultural Support Programme (CASP)
Comprehensive Rural Development Programme (CRDP)
DRDLR: Rural Development Framework (2013)
Extension Revitalisation Programme (ERP)
Extended Public Works Programme (EPWP)
Food and Nutrition Security policy of South Africa
Fetsa Tlala Programme
Further Education and Training Framework
Game Scheme
Higher Education Policy Framework
Ilima/Letsema Programme
Independent Meat Inspection
Integrated Food Security Strategy of South Africa
Integrated Food Security and Nutrition Programme
Industrial Policy Action Plan (IPAP)
Medium Term Strategic Framework
National Abattoir Rating Scheme
National Agricultural Research and Development Strategy
National Articulation Framework for Agricultural training programmes
National Education and Training Strategy for Agriculture and Rural
Development in South Africa (2005)
National Infrastructure Plan (NIP)
National Research and Development Policy for Agriculture, Forestry and
Fisheries (Draft version 6.2)
National Mentorship Framework for the Agricultural Sector
National Qualifications Framework (NQF)
National Strategic Plan for HIV and AIDS
Norms and Standards of Agricultural Extension
Page 17 of 227
Norms and Standards for Agricultural Training Institutes
Occupations Qualifications Framework (OQF)
Primary Animal Health Care Policy of DAFF
Settlement Implementation Strategy
South African Qualifications Authority (SAQA)
Strategic Infrastructure Plan (SIP).
Provincial
OneCape 2040 Provincial Spatial Development Strategy
Provincial Delivery Plan (PDP)
Provincial Strategic Plan (PSP)
Integrated Development Plans of Local Government
Provincial Spatial Development Strategy
Western Cape Green Economy Strategy Framework
Western Cape Climate Change Response Strategy (2014)
4.4 Relevant court rulings
Subdivision of Agricultural Land Act (Act 70 of 1970): Stalwo v/s Wary: The owner
sold portions of undivided agricultural land to be rezoned for industrial purposes.
The legality of the contract was contested in court. The High Court ruled that
since Sub-division of Agricultural Land Act (Act 70 of 1970) was applicable and
the contract was not binding. The Appeal Court thereafter set that ruling aside,
which raised the question on whether the Sub-division of Agricultural Land Act
(Act 70 of 1970) has any status anymore. The Constitutional Court, however, set
the Appeal Court ruling aside. Agriculture is a concurrent function and involves
all three spheres of government.
The latest court decisions Lagoon Bay Lifestyle Estates vs The Minister of
Environmental Affairs and Development Planning and others as well as the
Habitat Council vs the Minister of Environmental Affairs and Development
Planning and others have particular implications. These rulings, combined with
the implementation of SPLUMA (Spatial Planning and Land Use Management
Act), means that decision making powers are transferred from the Department
of Environmental Affairs and Development Planning {DEADP} (as custodian of
spatial planning) to the Local Authorities (Municipalities).
This has a huge impact on the way that the WCDOA assess applications. DEADP
is custodian of spatial planning whilst the Municipal Systems Act guides the way
local governments view an application. The implication is that good working
relations must be built and processes aligned to apply spatial planning and
decision-making uniformly in the province.
4.5 Planned policy initiatives
It is the intention to pass a Provincial Act on the Register of Farmers and Farm
Workers during the next 5 years.

Page 18 of 227
The mandate and services provided by the Programme 7: Structured Agricultural
Education and Training (SAET) will be aligned with the accepted national Norms
and Standards for Agricultural Training Institutes which will be encapsulated in
the envisaged Bill and subsequent Act on Agricultural Training Institutes. This
initiative will be driven from national level. Academic and institutional policies will
be aligned to the nationally developed guidelines for Agricultural Training
Institutes.
5 Update of situational analysis
5.1 Performance environment
In May 2010, the National Planning Commission (NPC) was appointed by the
President of South Africa (President Zuma) and the 26 members were tasked to
develop a vision for South Africa and to translate this vision into a National
Development Plan (NDP). The first step of the NPC was to conduct a diagnostic
analysis of South Africa’s achievements and shortcomings since 1994 and the
resulting Diagnostic Report was released in June 2011. In this report the main
reasons for slow progress was identified as a failure to implement policies and an
absence of broad partnerships. The Diagnostic Report also set out nine primary
challenges:
a) Too few people work;
b) The quality of school education for black people is poor;
c) Infrastructure is poorly located, inadequate and under-maintained;
d) Spatial divides hobble inclusive development;
e) The economy is unsustainably resource intensive;
f) The public health system cannot meet demand or sustain quality;
g) Public services are uneven and often of poor quality;
h) Corruption levels are high, and
i) South Africa remains a divided society.
In order to combat these challenges, the NPC developed a Draft National
Development Plan which was released during November 2011. Following a wide
consultative process, the final NDP was handed to the President on 15 August
2012 and welcomed by all political parties. The NDP consists of 15 Chapters of
which the following are of particular interest to the Western Cape Department of
Agriculture:
a) Chapter 3: Economy and employment;
b) Chapter 4: Economy infrastructure – The foundation of social and economic
development;
c) Chapter 5: Environmental sustainability – An equitable transition to a low-
carbon society;
d) Chapter 6: An integrated and inclusive rural economy;
e) Chapter 7: Positioning South Africa in the world;
f) Chapter 13: Building a capable and developmental state;
g) Chapter 14: Fighting corruption, and

Page 19 of 227
h) Chapter 15: Transforming society and uniting the country.
At a national level, the NDP has been translated into fourteen NOs (NO) which
must be implemented by the various organs of state. As the NDP creates a vision
up to 2030, the Cabinet has approved particular indicators and targets to be
reached over the period 2014/15 to 2018/19. This forms the Medium Term
Strategic Framework (MTSF) towards which the national, provincial and local
spheres of government have to react. The fourteen NOs are:
NO TITLE
1 Quality basic education
2 A long and healthy life for all South Africans
3 All people in South Africa are and feel safe
4 Decent employment through inclusive growth
5 A skilled and capable workforce to support an inclusive growth path
6 An efficient, competitive and responsive economic infrastructure
network
7 Vibrant, equitable, sustainable rural communities contributing
towards food security for all
8 Sustainable human settlements and improved quality of household
life
9 Responsive, accountable, effective & efficient local government
10 Protect and enhance our environmental assets and natural resources
11 Create a better South Africa and contribute to a better Africa and
World
12 An efficient and development-oriented public service
13 A comprehensive and sustainable social protection system
14 A diverse, socially cohesive society with a common national identity
The Western Cape Government (WCG) broadly endorses the NDP and has
committed itself to implement the NOs. It is evident that NOs 4, 7 and 10 are of
particular interest to the WCDOA.
At a provincial level, a number of challenges have been identified, and
endorsed by Cabinet, as the central challenges facing the Province. These are:
a) Poor growth and unemployment;
b) Population pressures and shifts;
c) Climate change and strain on resources;
d) Failing infrastructure;
e) Social ills;
f) Housing and basic service backlogs, and
g) Inadequately skilled workforce.
In order to combat these challenges and to achieve its 2040 vision of “A highly
skilled, innovation-driven, resource-efficient, connected, high opportunity society
for all”, the Provincial Cabinet has approved five Provincial Strategic Goals (PSG)
to be achieved during the next five years. These PSGs are:

Page 20 of 227
PSG TITLE
1 Create opportunities for growth and jobs
2 Improve education outcomes and opportunities for youth
development
3 Increase wellness, safety and tackle social ills
4 Enable a resilient, sustainable, quality and inclusive living environment
5 Embed good governance and integrated service delivery through
partnerships and spatial alignment
As it is important to transform the PSGs into implementable projects, the WCG
engaged McKinsey consultants to identify those parts of the Western Cape
economy with the greatest potential for accelerated, sustained growth and job
creation. During this project, called Project Khulisa1, it became clear that,
although the provincial unemployment rate was only 23% compared to the
national average of 34%, this was still unacceptably high. Furthermore, although
the provincial economy grew at an average of 2.8% over the period 2005 to
2013, employment grew by only 0.5% over the same period. Even worse,
combined with rapid population growth of 1.98% per year, the severest impact
of this “jobless” growth was amongst the youth where unemployment is currently
at 36%.
The underlying principle behind the Project Khulisa approach was the so-called
“game changer” approach. This means that government interventions should
not be spread across the board, but that a small number of high-potential
opportunities, which could deliver meaningful jobs and growth within a three to
five year timeframe, need to be identified. The team analysed the various
sectors of the Western Cape economy in terms of their contribution to the
provincial economy, formal employment, past and future growth prospects,
productivity, attractiveness and the feasibility of intervening in it and identified six
sectors which was worthy of further investigation. During the final round three
sectors with game changing potential were identified:
a) Agri processing;
b) Tourism, and
c) Oil and gas (rig repair).
To support these game changers three enablers were identified:
a) Energy security;
b) Water for growth, and
c) An appropriately skilled workforce
During the process of delving deeper into the Agri processing, six challenges
were identified after widespread consultation with stakeholders. During the
same process the following five priority leavers were identified to address the
1 “Khulisa” means “to grow” in isiXhosa

Page 21 of 227
challenges and to achieve the PSG 1 objectives of economic growth and
employment creation:
a) Water management (new infrastructure and water use efficiency);
b) Specialised agri processing parks (strongly linked to the outcomes from the
Joint Planning Initiative with Municipalities);
c) Creating a consolidating platform for exports;
d) Strong support from government (facilitates negotiations between spheres of
government, provide supporting services such as research and
development, residue testing, etc.), and
e) Promotion of Western Cape products in existing international markets,
develop new markets (Africa, BRICS) and promote local products in the
domestic market.
The Department’s Service delivery environment cannot be described without
giving attention to the interface between the provincial and local spheres of
government. Whilst “Agriculture” is the concurrent responsibility between the
national and provincial spheres of government (see Section 4.1), farming is a key
economic activity in rural areas with the result that local economic development
cannot take place without effective support to the agricultural sector at local
level. For this reason the WCDOA actively took place in the Joint Planning
Initiative (JPI) between all provincial departments and all local governments in
the Province. During these events the municipalities had the opportunity to
voice their needs and after discussion, priorities were identified. The result was
that the WCDOA was mentioned as an implementing agent in 64 strategic
interventions of which it is to take the lead 18 times, provide support in 27
instances and was included in the “All” category a further 19 times. The 18
interventions where the Department is to take the lead can be clustered into the
following six themes:
a) Land reform;
b) Agri processing;
c) Support alternative industries;
d) Share specific information;
e) Existing support programmes, and
f) Skills development
As the WCDOA needs to be responsive towards national, provincial and local
priorities, the process described in Section 5.3 has resulted in seven Departmental
Strategic Goals (DSG) which articulate with the NOs, the PSGs and the priorities
voiced by local governments. These DSGs are:
DSG TITLE
1
Support the provincial agricultural sector to at least maintain its export
position for the next 5 years by growing its value added from R16.349
billion in 2013.
2 Ensure that at least 70% of all agricultural land reform projects in the
Province are successful over the next 5 years.
3 Support the sector (farmers and industries) to increase sustainable

Page 22 of 227
agricultural production (primary provincial commodities) by at least
10% over the next 10 years.
4 Optimise the sustainable utilisation of water and land resources to
increase climate smart agricultural production.
5
Increase agricultural and related economic opportunities in selected
rural areas based on socio-economic needs over a 10 year period and
strengthen interface with local authorities.
6 Enhance the agri processing capacity at both primary and secondary
level to increase with 10% over baseline by 2019.
7 Facilitate an increase of 20% in relevant skills development at different
levels in the organisation and the sector over the next 10 years.
The content of the various DSGs are described in more detail in section 6. During
the rest of this section the Department’s intention for each of these will be
discussed.
Maintain the agricultural export position
International economic realities changed irrevocably in the past few years.
These include the shift of power from developed to developing economies, even
though the growth rates have been dampened in key emerging economies
such as India and China. Another major trend includes projected population
growth especially in Africa. This growth is mainly in the young and middle age
categories. However, the reverse is true in the developed countries which are
characterised by an aging population. These trends will influence consumption
patterns and have serious implications for the agricultural sector especially in the
Province with its large exposure to the export market. At the same time this offers
numerous opportunities including increased demand for food which in most
cases can only be met through imports i.e. of both primary and processed
goods. In other markets, especially in developed economies, demand for niche
products will be on the rise e.g. products with special qualities i.e. linked to
Geographical Indications, organic products, etc.
The Provincial Economic Review and Outlook (PERO) 2013 revealed that the
agriculture and agri processing sectors in the Province is leading the pack of
sectors that have a national and international comparative advantage. The
sector is also the leader with comparative advantage on agriculture and agri
processing in all five non-metro districts of the Province emphasising the
importance of the sector in the rural economy. The international comparative
advantage could be observed on the significance of agricultural products in
Province’s exports. These exports are mainly in the horticultural sector. Most of
the industries in this category have been identified to have potential to create
jobs in the NDP and also NO 4. On the latter, sub-outcome two acknowledges
that “The productive sectors account for a growing share of production and
employment”. Research has also revealed that while primary sectors have the
potential to create jobs, however, most opportunities are in the agri processing
sub-sector. Hence the sector is one of the priority sectors under PSG 1. It is also

Page 23 of 227
acknowledged that agri processing is very dependent on various segments of
the value chain especially primary production. It is therefore under these
circumstances that a value chain approach will be taken into consideration.
Therefore supporting this sector is of critical importance not only for job creation,
but also to respond to existing opportunities especially in the African market.
Hence one of the perceived plans under NO 4 will be to support more diversified
exports including processed and value-added products.
Furthermore, in NO 4, sub-outcome 2, trade development is seen to be one of
the areas of greater potential for growth of sustainable enterprises and industries
to achieve rural job creation. From a provincial perspective, opening markets for
Western Cape firms and key sectors wanting to export or trade is of key
importance to achieve the objectives of PSG 1. This is also consistent with
OneCape Vision 2040 which argues that trade and diplomatic ties with targeted
regions should be used to open new markets such as China. From this, it is clear
that a new approach is required and hence, the Department has market access
as one of its priorities. As a result, it will focus its support towards development of
new markets especially in Africa, China and India.
However, it should be noted that market access is very complex with a number
of the regulatory competencies within the mandate of the national government.
Among the list of challenges to be able to improve market access is the lack of
trade agreements with most of the BRICS countries as well as a large number of
countries in Africa. Within the BRICS group, South Africa, including the Western
Cape, is facing fierce competition from developed countries such as the United
States of America, Europe and Australia. In some of these countries free trade
agreements and subsidies give exporters an unfair advantage compared to their
South African counterparts. Noting that the traditional markets are still
responsible for a larger share of South Africa’s exports i.e. over 40%, including the
Western Cape, it is also important to maintain those markets. It should be noted
that as pressure mounts in the developed economies like the EU, more non-tariff
trade barriers including sanitary, zoo- and phyto-sanitary measures, consumer
driven requirements like environmental friendly, e.g. carbon miles, and social
responsibility among the list are becoming more stringent and affecting farmers
across all categories.
As a result, compliance has become a significant cost driver across the value
chain. This requires improved institutional and analytical capacity across the
entire spectrum of the public and private sectors. It is on this basis that the
Department supports private sector initiatives like ethical trade programmes in
the fruit and wine industries as noncompliance will threaten market access in the
established export markets like the EU. Indirectly such compliance will also
further improve the conditions for farm employees as ‘whole enterprise’
compliance is the aim. Indeed, compliance to public and private standards
may open new opportunities in various markets, but requires that the
appropriate capacity be established at various levels, but particularly at the
national sphere of government. The Market Access Work Group is one vehicle

Page 24 of 227
through which this objective can be achieved. Economic development
opportunities that are related to products with special characters and strong
links to the region need to be exploited. As this will be targeted for developed
countries, it is also vital for the domestic market. Hence the Department will focus
its resources on Geographical Indications (GI) to assist the sector to respond to
the commitments on the Economic Partnership Agreement (EPA).
The availability of resources (people and money) to provide veterinary export
certificates will have to be monitored closely over the strategic period to ensure
that the Province can continue to supply in service demands as policies and
investment to increase market access begin to take positive effect in the
Province. An inability to fund and support the successful access to markets may
over time negatively impact on the strategic goals of the Province and
Department. Adequate funding is also essential to allow for changes in
international certification demands that tend to become stricter every year and
necessitate more official controls.
Ensure a 70% land reform success rate
One of the NDP imperatives is that of the creation of partnerships within the
agricultural fraternity to strengthen land reform and thus enable the sector to
create the important one million new jobs by 2030, contributing significantly to
reducing overall unemployment. The Department will thus continue to
implement the “commodity approach” towards farmer support. Key to this
approach is the creation of partnerships between government and private
sector at the institutional level to draw on the commodity experts who contribute
to improved planning and delivery of selected agricultural enterprises.
Furthermore, this partnership seeks to ensure that smallholder farmers gain access
to mentorship support from the commercial farmers and also access to existing
marketing networks. As a response to the NDP directive regarding job creation,
the Department of Agriculture, Forestry and Fisheries (DAFF) developed an
Agriculture Policy Action Plan (APAP) and this will be the focus in the next 5 years
in line with the MTSF.
Land reform and food security has been identified as priorities for the MTSF as we
move towards Vision 2030. Therefore, successful land reform remains an
important development imperative to secure the nation’s democratic stability.
Although this is complex given the myriad of voices on what works, the
Department will champion the process that would lead to the identification of a
workable land reform model that will be piloted within the NDP context, in
support of PSG 1, Create opportunities for growth and jobs. The basis of the road
ahead will be the results of an external evaluation of support to agricultural land
reform projects. This evaluation, conducted by the Department during the
2013/14 financial year, revealed a 62% success rate of all the agricultural land
reform projects where the Department was involved. Consequently, the study
also reflected areas that require improvement. Therefore targeted interventions
like the Market Access programme, financial record keeping project,

Page 25 of 227
cooperative development support, and facilitation of access to finance are part
of the improvement plan. Furthermore, the Western Cape Land Reform Summit,
held on the 22 September 2014, resolved on 6 themes that the Department will
be addressing going forward. These themes are: financial support solution,
market access, land audit, improvement of extension services, implementing of
land reform projects and establishment of the District Land Committees (DLCs).
Accordingly, the Department of Rural Development and Land Reform (DRDLR)
established DLC in all districts. The purpose of these committees is to identify and
allocate a minimum of 20% farming land (strategically located agricultural land)
in areas that is easily acquirable and which does not cause distortions in the land
market. To further support the process, the Department has created a Desk,
namely; Land Reform Advisory Desk, or LREAD, within the Unit for Technical
Assistance (UTA). This desk will provide planning support to farmers, businesses,
municipalities and land owners to structure land reform deals for agricultural
transformation within the context of the NDP.
A deliberate focus on rebranding Agriculture will be prioritised in the next 5 years,
given the unfortunate farmworker strikes during the late 2012 and early 2013,
mainly in the Cape Winelands and Overberg, which affected the image of the
sector. A deliberate programme of action must be developed together with
stakeholders to refocus the sector through sharing success stories and
emphasising the contribution the sector makes to the economy.
A report published in 2013 by the Food and Agriculture Organisation (FAO) of the
United Nations assessing the state of food insecurity in the world established that
South Africa is one of only three African countries that are food secure at a
national level. Despite this achievement, Statistics South Africa’s general
household survey indicates that between 10 – 15% of households were still
vulnerable to hunger in 2011. The underlying causes of these challenges include
a declining trend in subsistence food production, cost of food relative to
incomes of the poor and poor dietary habits leading to malnutrition. The
Department will strengthen its links with civil society structures and local
governments targeting food insecure households for support as a contribution to
the NO 7: Vibrant, equitable, sustainable rural communities with food security for
all, NO 4: Decent employment through inclusive growth and PSG 3, Increase
wellness, safety and tackle social ills. The NDP also directs that 1.6 million
vulnerable households should benefit from food security interventions by March
2019.
The success of land reform projects is based on a plethora of factors, of which
one of the most important is the fine balance between available natural
resources, especially soil and water, and choice of farming operation. In this
regard the research effort and spatial intelligence tools have and will assist in
identifying resource limitations or opportunities, whilst the spatial analysis support
(maps and other tools) have proven to be invaluable to extension officers and
farmers, to name but a few. Furthermore, the sustainability of land reform

Page 26 of 227
projects is also based on production technologies, and in this regard research
efforts are focussing on yield-increasing and/or cost-decreasing climate-smart
technologies in plant and animal production. The analytical services will
continue to provide pivotal information on water, soil and plant analyses which
assist in judicial fertiliser usage and optimising production methods.
The Rural Development Programme’s Farm Worker Development sub-
programme works in collaboration with the Farmer Support and Development
(FSD) and (SAET) programmes to ensure that farm workers on land reform farms
have access to training and development opportunities and support services.
In addition, the human element has a significant role to play in the success of
land reform, hence the focus on ensuring that farm workers on land reform farms
have access to training and development opportunities and support services.
This is imperative to ensure a coordinated comprehensive government response
in selected rural development nodes.
Increase agricultural production by at least 10% over the next 10 years
The performance environment of the Department will change as clients seek
business advice across the value chain and not production advice alone. After
all, agriculture is transforming from a “farming operation” to a “business
operation” within a global environment. This transformation, including the
uncertain global economic environment due to unstable exchange rates,
fluctuating commodity prices and unpredictable weather conditions, requires
proper risk management tools resulting in research requirements to assist the
agricultural businesses and industries with strategic and decision-making
information. To be able to conduct this type of research, availability of data is of
importance to ensure proper and/or improved baseline information to be able
to make informed decisions. Therefore partnerships with institutions like the
Bureau for Food and Agricultural Policy (BFAP) will be strengthened. Hence, our
business will be a matrix of service delivery excellence against the 14 NOs, 5 new
PSGs and the strategic goals of the Department.
Agriculture is one of the most important and one of the largest knowledge-
based sectors in South Africa, and science and technology with research as key
cornerstone is important to underpin agrarian economic growth and to
ultimately address food security and rural development. Comprehensive and
client-focussed research programmes and projects in animal and plant sciences
will be executed by the Programme: Research and Technology Development
Services (RTDS) with due consideration of the needs and challenges of
commodities and other stakeholders. Technical advice and rendering of
diagnostic services to a range of internal and external clients will be expanded in
a drive to lower input cost and increase production levels with the ultimate aim
to increase agricultural production with 10% over the next ten years.

Page 27 of 227
In order to grow climate change resilient smallholder and commercial farmers,
the climate smart agri-production drive will increase and will be largely based on
the development of a Climate Change Framework and Implementation Plan
(called the SmartAgri project) for the agricultural sector which started during
August 2014 and will be completed in March 2016. This plan will be the roadmap
for the agricultural sector in adapting to, and mitigating, the challenges of
climate change. As part of climate smart technologies, the conservation
agriculture programmes (small grain, rooibos and potatoes) and sustainable
farming practises, also on the research farms, will be expanded. New and
adapted technology generated from cutting-edge research efforts has and will
ensure that producers are sustainable and competitive with limited natural
resources (especially water) and the changing environment (with relation to
water availability, disasters, and other effects of climate change). Furthermore,
the Department will assist in creating an enabling environment for green
economy initiatives to be launched and embraced within the sector.
Climate change will also bring new opportunities to explore innovative ideas.
Furthermore, the role of alternative crops will grow as these new and novel crops
will undoubtedly fill a specific space in the Western Cape agricultural sector with
the challenges of climate change. Alternative crops could also secure specific
markets nationally and internationally and add to the export figures and
subsequent economic wealth and job creation in the Western Cape. Research
funding for alternative crops have been fragmented, with the larger crops (like
rooibos) being able to set up their own research funds. The smaller crops, like figs,
fynbos, berries, honey bush and pomegranates, for example, are not in the
fortunate position to tap into levy funds and therefore have to rely on smaller
contributions within their own industry or funds from government (provincial and
national) to address important research needs. A new fund called the
Alternative Crops Fund (ACF), launched in 2014, will give impetus to the drive to
counter climate change with innovation. The growth of the alternative crops
portfolio will also open up new agri processing and value-adding opportunities
for entrepreneurs. In rolling out this initiative, cost sharing with industry will be
promoted and multi-stakeholder funding will emphasise the Better Together
approach and will optimise funds to support alternative industries.
The completion of the aerial survey of agricultural resources in the Western Cape
in 2013 has provided the Department with a detailed snapshot of agriculture’s
footprint. The resulting data has proved to be a catalyst and a stimulus for a wide
variety of projects across many disciplines and stakeholders. The data will be a
key component in planning to revitalise and develop local agri processing
facilities to boost job creation in the sector.
Through the Development Planning sub-programme’s co-ordination role,
engagement with commodity formations, participating in the Department’s
commodity approach, promotes prioritisation of production support delivery to
farms in the selected rural development nodes

Page 28 of 227
The Programme: SAET will review the curricula of its structured training
programmes to support this new “business approach” to agriculture in training
new and prospective farmers, farm managers and agricultural advisors.
Optimisation of water and land resource use and increase climate smart
agricultural production
The key strategic challenge highlighted in the NDP will be to promote the more
efficient use of water by both commercial and smallholder farmers and hence
the continuation of the water wise and biodiversity awareness campaigns and
the FruitLook project. Through this project, information on actual crop water use
and 8 other growth parameters are provided on a weekly basis to farmers via
the FruitLook web portal. Climate change will lead to additional demands on the
limited water resources in the Province and special attention will be required
over the next five years to assist farmers to utilise their agricultural water as
efficient as possible. Water quality and not just availability will require a refocus
as this is linked to the focus on market access.
The efforts to assist farmers to utilise their irrigation water more efficiently will not
only contribute towards sustainable utilisation of the resource, but also assist
them to increase the area irrigated, whilst using the same volume of water, thus
creating more jobs, increase production and improve the financial viability of
the farming enterprises.
Similarly, the area wide planning initiatives will enable farmers to increase the
area under production on their farms whilst conserving the areas that require
critical biodiversity management and conservation initiatives.
The Programme: Sustainable Resource Management (SRM) is supporting the
Green Economy by creating work opportunities through a labour intensive
approach in the alien clearing, fencing and river erosion protection projects.
These projects contribute towards Extended Public Works Programme (EPWP)
initiatives as well. The removal of alien vegetation creates job opportunities in the
rural areas and at the same time make more water available for environmental
requirements and reduces the risk of damages to infrastructure during periods of
high river flows and floods.
Should funding be available, the fencing project will continue to produce
threefold benefits, i.e. create job opportunities in the rural areas, assist in the
management of predator animals creating stock losses in the sheep farming
enterprises and keep stray animals from the roads, thus creating a safer
environment for all road users.
The Province has experienced a drastic increase in natural disasters during the
past seven years and the indications are that this trend will continue as the
impacts of climate change take effect. Technical assistance to land owners
during these disasters is included in the strategic objectives of the Department.

Page 29 of 227
Apart from being involved with post disaster mitigation and recovery, it is also
necessary to have a pro-active approach towards natural disasters. This will
require risk prevention and reduction measures that have to be incorporated in
the Agricultural Disaster Management Strategy. The evaluation of the impact
and success of disaster mitigation aid will be done to strengthen future
implementation.
The effect of climate change on agriculture in the Western Cape will be one of
the major determinants of the sustainability of this sector and the
competitiveness of its farmers. The Department will actively focus and pursue
agricultural practices that will lead to adaptation of specific strategies and
mitigation of this phenomenon. The service delivery agenda of the Department
will include decision-making support with relation to the choice of farming
activity, the optimal use of natural resources (water and land), the promotion of
conservation agricultural practises and the generation of appropriate and
sustainable technologies and information in this regard.
In order to reach out even more to our clients, the research of our resource
economics will focus on tools like the Green Agri portal which aims to promote
knowledge sharing and communication on green initiatives. Furthermore, a
concerted effort will also be placed on investigating tools that are aimed at
assisting smallholder farmers to embark on climate smart agriculture. These
include the mixed carbon calculator which will eventually benefit the entire
agricultural sector as most agricultural businesses are diversified.
Increase agricultural economic opportunities in selected rural areas and
strengthen the interface with local authorities
The NDP Vision for 2030 calls for better opportunities for rural communities to
participate fully in the socio-economic context with the agricultural sector
contributing to the creation of 1million jobs. In parallel to this NO 7: Vibrant,
equitable, sustainable rural communities with food security for all, NO 4: Decent
employment through inclusive growth and PSG 1 emphasises the focus on
creating opportunities for growth and jobs. While the urgency mounts to achieve
this, the reality of differentiation between marginalised and favourable rural
areas which might be well endowed with the desired agri-ecological profile for
development, begs for alternative solutions that will speak to the unique
locations. It is with this in mind that the implementation of the Comprehensive
Rural Development Programme (CRDP) continues in the selected rural
development nodes. This is a ward-based programme, responding to the
specific issues and opportunities in a specific territory. This focused approach
targets 16 rural development nodes across the Province. Improved inter-
governmental relations, with a view to improve governance in rural areas, is one
of the NDP imperatives and requires that efforts of the three spheres of
government are coordinated. Development coordination of the 13
Intergovernmental Steering Committees and work with the relevant stakeholders,
public and private, is aimed at deepening the impact of the programme in

Page 30 of 227
ensuring a more focussed approach to infrastructural and economic
development.
While social development seems to be improving in certain rural areas,
economic participation by rural communities in the private sector remains a
challenge. Urban migration appears to be the escape for such communities in
the quest for employment opportunities. In order to address the infrastructural
and economic challenges, institutional support and human capital
development is of key importance. Social facilitation will become instrumental in
building capacity amongst stakeholders. Thirty six (36) Councils of Stakeholders
(COS) are currently supported in the rural development nodes. These structures
are representative of the selected community with the aim of ensuring that the
respective community is informed and actively participate in identification,
planning and implementation of development initiatives with the ultimate goal
being local job creation. Collaboration across programmes and departments will
result in more sustainable development plans which will feed into municipal and
broader regional economic development plans. Data now available as a result
of the Spatial Intelligence Project will become instrumental in identifying key
priorities and areas of potential enterprise development across rural areas.
Agriculture is critical to socio-economic development in rural areas. Support to
smallholder farmers to explore high value production, at scale, for delivery to
markets, hence linkages to the commodity partners will be strengthened. Agri
processing will be a turnkey element to be explored in agricultural development
planning in rural areas in order to kick-start the job creation that the NDP
beckons. It is with this in mind that close collaboration between Rural
Development Coordination (RDC), the Farmer FSD and Agricultural Economics
Services (AES) programmes is envisaged to emphasise agricultural development
planning in specific territories. These processes will feed into broader economic
development plans which align to Integrated Development Planning (IDP)
priorities identified across the spheres of government with communities. To
achieve this, internal and external investment is vital. Therefore, the services of
the Agribusiness Investment Unit (AIU) will be largely directed to promote and
support investment in rural areas. In addition, the Department plans to be the
catalyst for projects that are envisaged to have high impact across the spectrum
of the agricultural sector e.g. those that are identified under the Strategic
Integrated Project 11 (SIP11) and agri processing in PSG 1.
The unfortunate farm strikes in the 2012/13 financial year require that we
reimagine the brand and future of agriculture. Acknowledgement of the
contribution of agriculture to the South African economy and communication
around the success stories is the start. Towards achieving PSG 3, Increase
wellness, safety and tackle social ills, the farm worker development focus
enables platforms to do this via publications (e.g. Abundant Harvest), forums for
farm employees, regional and provincial competitions and dialogues to engage
on these successes. Roll-out of the Smart Pen Technology within the farm worker
Page 31 of 227
development programmes will ensure a coordinated approach to data
collection on farms, enabling a more complete profile of the sector.
Farm employment is under pressure and transitioning to be more specialised with
the signs of mechanisation showing itself. Non-agricultural job opportunities
along the value chain could create pathways away from poverty. Human
capital development is therefore critical to the transformation of the skills base in
rural areas. The provincial-wide farm worker household survey seeks to provide
information that will assist government in providing opportunities, especially for
rural youths to benefit from education and training initiatives. Furthermore, the
survey will enable much needed intelligence on the socio- economic status of
farm employees and their families in the Province overall. Collaboration with
municipalities and national and provincial departments on the findings within the
district and local municipal areas is critical to creating awareness of basic
service delivery needs of farm workers and the employment and education
status of rural youth. This initiative aims to complete two district municipal areas
per financial year and is planned to be rolled out on an ongoing three-year
cycle.
As part of the Department’s commitment to integrated planning with local
governments, it participated fully in the JPI of October 2014. During this event
the Department was implicated in 64 strategic interventions of which it was
nominated to lead in 18 instances. The latter can be clustered into 6 themes:
a) Land reform;
b) Agri processing;
c) Support of alternative industries (including aquaculture);
d) Information sharing;
e) Supporting programmes, and
f) Skills development.
It is interesting that these themes can be linked to international (CAADP),
national, provincial and departmental priorities.
Agri processing
The NDP calls for better opportunities for rural communities to participate fully in
the socio-economic context with the creation of one million new jobs by the
agricultural sector. The NDP also argues that a strong agri processing sector will
play an important part in creating a vibrant rural community and create the
envisaged 1 million rural jobs. This was one of the reasons why agri processing
was identified as a provincial game changer with five priority levers (see
page 21). Each of these priority levers will be developed into implementable
interventions over the next year. At the same time, and due to the importance
of agri processing at national, provincial and local government level (see the
description of DSG 6), the appropriate organisational infrastructure will be
created in the Department. Over the short term this infrastructure and
interventions will be resourced through the reprioritisation of funds and agri

Page 32 of 227
processing projects will be implemented through the partial earmarking of
additional CASP funding.
In the meantime each of the programmes of the Department is already
providing support to the agri processing sector. The Department’s research
portfolio in animal and plant sciences support the product base for agri
processing, ranging from wheat and canola production to increase in milk
production and better skin quality of ostriches for leather production. The
challenges of climate change will also bring new opportunities to the sector. For
example, second and third grade fruit damaged due to hail could offer new
and innovative product opportunities. Furthermore, agri-waste could be
transformed to agri-wealth with novel processing ideas. Upscaling of current agri
processing plants could further enhance job creation and economic
development in this regard. Small scale agri processing facilities in rural areas will
also open up new opportunities for economic enhancement in these areas and
could also bolster our agri-tourism initiatives. New and novel agri processing
facilities will also bring about a need for skills development in this field which is
directly linked to our human capital development drive in the Western Cape
and Department in particular.
Veterinary Services are tasked with a function of ensuring that livestock being
supplied to abattoirs is free of any diseases, heavy metals or chemical residues.
Through testing and monitoring programmes and diseases control schemes only
products that conform to internationally ratified standards are allowed to enter
the value chain for consumer consumption. Safe, wholesome and
uncontaminated resources must be available and accessible to ensure that
these primary ingredients are processed into high value add goods. These
guarantees must be auditable and conform to international partners which
South Africa is a signatory.
The AES Programme will provide baseline information. Interventions will further
include market development support at both international and local markets,
market access compliance support and other business support services.
The Department will be conducting a detailed audit of the agri processing sector
with a view to determine priority commodities and skills required to strengthen
the sector. This process would lead to the Department positioning itself with
regards to service delivery to address the identified needs. Furthermore, a
concerted effort would need to be made to strengthen the capacity of
extension and advisory support staff to be able to respond to challenges facing
those involved in agri processing.
The Programme: SAET will review the curricula of its structured training
programmes to ensure exposure of students to various value adding and agri
processing processes, More emphasis will be placed on training of students in
entrepreneurial development, agri processing and value addition to primary

Page 33 of 227
products such as milk, small grains, grapes, vegetables (including mushrooms)
and fruit (olives, peaches, plums, etc.)
Human Capital Development
The NDP provides a long-term vision through to 2030 towards dealing with the
challenges of unemployment, inequality and creating a more inclusive society.
Central to meeting this vision, stands the development of human capital in
general and at all levels, but more so targeting historically disadvantaged
individuals and communities in especially the rural areas of the country and
Province.
The development of human capital remains a priority and one of the strategic
objectives of the Department in its endeavour to create opportunities for growth
and employment in the sector. Nationally, about 1 million young people exit the
schooling system annually, many of whom exit without achieving a Grade 12
certificate. Approximately 50% of those exiting the schooling system do so after
Grade 11, either because they do not enrol in Grade 12 or they fail Grade 11.
However, only a small number of those who leave the schooling system enrol in
Further Education and Training or other colleges or have access to any post-
school training. In addition, the few that access post-school education and
training opportunities are not sufficiently prepared for the work place due to sub-
standard education and training provided.
A great concern is the inadequately prepared students by the education system
for higher education in agriculture, especially with regards to their proficiency in
Mathematics and Science. The absence of these key subjects, particularly in
rural schools, impacts on the ability of rural youth to pursue a career in
Agriculture. Therefore, in addition to own initiatives by the Department (i.e.
bursaries, internships, Young Professionals Programme (YPP), bridging
programmes, technical training, etc.), partnerships with leading training
institutions (basic, further and higher education spheres) in the Western Cape
and beyond will be forged to address the skills gap in the sector. Furthermore,
the number of students enrolling for agricultural training (all levels) is under
immense pressure. This makes it extremely difficult for the Department and sector
to recruit, attract and retain well-trained, skilled and experienced staff. Human
Capital Development (HCD) therefore remains a key priority for the next 5 years,
as this is a key determinant for economic growth in the Province and national.
More emphasis will be placed on training of students in entrepreneurial
development, agri processing and value addition to primary products, as this will
further enhance economic development and increase job opportunities, also in
the rural agricultural areas of the Province. The practical training of winemakers
will be used as benchmark to improve practical training of students in pomology,
animal production, vegetable and crop production and viticulture. The
involvement of industry in skills development will be further enhanced through
work-integrated learning, where students will be placed in a real work

Page 34 of 227
environment for practical training. The farm worker household survey which is
being rolled out across the Province will provide valuable data to inform training
and development programmes on the skill gaps that exist amongst farm workers
and their family members. It is envisaged that youth, especially in the selected
16 rural development nodes, will access such programmes.
Great success has been achieved with the internship programme and especially
with the Premier’s Advancement of Youth Programme with a placement rate
into further studies of more than 70% in the first year, followed by over 50% in the
second year of the programme. An extensive workplace experience
programme is offered to interns that truly market agriculture as career of choice.
The Young Professional Programme (YPP), a post-graduate programme
specifically for previously disadvantaged groups has been very successful thus
far. Except for two beneficiaries, all of them have completed their studies and
are in employment. Doctoral studies are a strategic pillar of a country’s
knowledge production and innovation platform. Therefore the YPP programme
has been expanded to include PhD level. The Agricultural Partnership for Rural
Youth Development has been implemented focussing on farmworker children
especially in the identified areas of Eden, Drakenstein, Overstrand and
Witzenberg. The poor results in Mathematics and Science, or absence of these
subjects, remain challenging and hence re-writing these subjects with tuition
have been introduced for the interns. Partnerships with farmers as external host
employers have been concluded and placement in terms of this specific project
has commenced and will continue for the next 5 years.
Development of the new Human Capital Development Strategy (HCDS) has
been delayed, but now allows for the inclusion of the new strategic direction of
agri processing, value-addition and the relevant skills required. A concerted
effort will also be placed on forging new partnerships with academic and
research initiatives while also strengthening existing partnerships. The focus of
these partnerships will be initiatives, targeting both internal and external needs,
aimed at addressing scarce and critical skills such as agricultural economics.
Due emphasis will also be on investigating training opportunities in agri
processing to capacitate officials that are involved in the whole spectrum of
extension services of the Department to be able to respond to the needs of the
agri processing sector
A new Memorandum of Understanding (MOU) with the University of Stellenbosch
will be signed early in 2015, whilst the renewal and expansion of the existing MOU
with the Nelson Mandela Metropolitan University (NMMU) will be finalised during
the same period. These agreements will further support our focus on post-
graduate studies and research collaboration on all levels.
Good Governance
The Diagnostic Review of South Africa (June 2011) conducted by the NPC
identified two reasons why South Africa has made slow progress since 1994 in
Page 35 of 227
achieving its objectives. These reasons were a failure to implement policies and
an absence of good partnerships. The NPC has subsequently identified nine
primary challenges (see page 18) of which one is that public serves are uneven
and often of poor quality. For this reason the focus of Chapter 13 of the NDP (15
August 2012) is “Building a capable and developmental state.” The result is that
the purpose of NO 12 is to establish an efficient and development-orientated
Public Service. At a Provincial level PSG 5 of the Provincial Strategic Plan (2014-
19) (PSP) aims to strengthen good governance in the Province.
As responsive and responsible use of public resources is such an important
golden threat which runs through the strategic intent at all levels of government
in South Africa, the WCDOA has adopted a multi-year rolling departmental
evaluation plan. The implementation of this plan is driven by the Head of
Department and it is expected of programme managers to report on progress at
monthly management meetings.
One of the key challenges during evaluations is the natural tendency of officials
to experience an evaluation as a threat. After all, an evaluation can very easily
be experienced as an attempt by “them” to nullify the career-long toil of an
official. Hence, although the evaluation is done by an external service provider
procured from the Department of Performance Monitoring and Evaluation
(DPME) list of evaluators, the management of the evaluation, the determination
of its parameters and the finalisation of the research questions are placed in the
hands of the official responsible for the intervention to be evaluated. As these
officials are also capacitated beforehand, evaluations are turned from a threat
into a source of management information. Indeed, it is interesting to note how
officials implement recommended changes and find new meaning in their jobs.
In addition to the process of evaluations, comments are provided on
applications for the rezoning and/or subdivision of agricultural land in terms of
the Subdivision of Agricultural Land (Act 70 of 1970; SALA) in order to preserve
the medium and high potential agricultural land for agricultural production in
accordance with the municipal and provincial spatial development plans.
With the implementation of SPLUMA, decision-making powers are transferred
from the DEADP (as custodian of spatial planning) to the local authorities
(municipalities). This has a huge impact on the way that the WCDOA assesses
applications. With this new era, every local authority may make decisions
according to their own legislative frameworks (Spatial Development Frameworks,
by-laws, etc.) which now differ from municipality to municipality. This has the
potential that municipalities can override concerns and objections by other
government departments, without the other government departments having
any remedy. The challenge lies in how to align processes and goals of the other
departments with that of the municipalities and for them to incorporate the
goals, restrictions and spatial view of the other departments into their legislative
frameworks.

Page 36 of 227
During the 2012/13 financial year, various transgressions in the meat supply chain
reached the media, relating to misleading and fraudulent labelling of products.
Coupled to this, three major developments towards improved meat safety were
published in the Government Gazette during 2012/13 financial year, namely:
a) Regulating game meat supply;
b) Implementation of Independent Meat Inspection at abattoirs, and
c) National Abattoir Rating Scheme (NARS).
Implementation of the above additional regulatory functions will require
strengthening of the human resource capacity of the Veterinary Public Health
sub-programme.
The Western Cape Provincial Veterinary Laboratory (WCPVL), Stellenbosch is a
DAFF approved veterinary laboratory and the approval certificate is valid until
30th September 2015. In future DAFF will no longer audit veterinary laboratories;
instead veterinary laboratories will be audited according to internationally
accepted standards (ISO 17025) by the South African National Accreditation
System (SANAS). The WCPVL, Stellenbosch will need to be assessed by SANAS
before September 2015. SANAS accreditation will mean that the WCPVL will
maintain its national status and will also gain international recognition as a
diagnostic veterinary laboratory. The improved quality assurance of the WCPVL’s
diagnostic capabilities will enhance international acceptance and market
access of animals and animal products tested.
As the Department strives to improve on its audit readiness, the Smart Pen
Technology will be rolled out across all development service delivery
programmes. This will ensure an audit trail to support output and a reliable data
set to inform future decision-making and reporting.
Through its work in the implementation of the CRDP, the Department will
formalise its relationship with key departments such as the DRDLR in order to
ensure a common approach to rural development.
5.2 Organisational environment
As a result of the Department’s continuous drive to enhance its efficacy and the
ability to respond to NOs and provincial priorities, an investigation by
Organisational Development into the Macro Structure of the Department was
conducted. In the subsequent report it was inter alia recommended that the
span of control of the HOD should decrease from 1:12 to 1:6 with the implication
that the Branches Agricultural Development and Support Services as well as
Agricultural Research and Regulatory Services should be created. The
recommended organisational structure of the Department was signed off on
November 2012 (See the Macro Structure in Annexure A). The process of filling
the newly created positions at Senior Management level has commenced.
However, we must accept that the organisational structures will never be static
and the structures of certain Programmes are already being reviewed to address
required service delivery demands.

Page 37 of 227
One of the reasons why it is necessary to revisit the current organisational
structure, is the increase in the demand for services. For instance,
a) 1 028 applications for sub-division and/or rezoning of land were received
during 2013/14 and it is expected that there will be a change in the number of
applications received depending on the way SPLUMA is implemented.
b) The recent increase in natural disasters experienced in the Province lead to
the establishment of an Agricultural Disaster Management Unit within the
Department, but the staff complement need to be increased to deal with
both pro-active and recovery aspects relating to the management of natural
disasters.
c) The number of regions supported by the FSD Programme of the Department
was increased from six to eight. The reason for this increase is to ensure that
extension and advisory services are brought closer to the clients with the result
that service delivery will be strengthened in future.
d) There is a need to cater for the ever-increasing demand for services in the
fields of export control and certification as well as primary animal health care.
The shortage of private veterinarians in the deep rural parts of the Province
places an ethical responsibility on State Veterinary Services to provide basic
animal health care and disease prevention services in these areas, especially
focussed on communities that cannot afford private veterinary health care.
This burden will be slightly eased as one year’s Compulsory Community Service
for new veterinary science graduates will be introduced in 2016.
e) There is an increasing need to fulfil compulsory legislative regulatory
mandates. For instance, the Veterinary Public Health sub-programme is
required by law to conduct certain actions in order to ensure safe meat to
local consumers, as well as lay a firm and trustworthy foundation for export of
meat and meat related products, with reliable and credible export
certification.
f) Increased demand of services resulted in the need for capacity in specific
areas of animal sciences, plant sciences and research support services
(including spatial analysis).
g) There is a dire need to decentralise the services of the Programme: AES to a
district level. This decentralisation is necessitated in order to respond to areas
that require attention as prioritised in the NDP; for instance, to create jobs
through agri processing. It is also to respond to demand for services and for
improved service delivery to clients as well as to improve regional integration
of activities with those of other Programmes. Long-term solutions to create
career paths in government for agricultural economists require serious
consideration to be able to attract and retain specialised skills.
h) The pending transfer of agricultural colleges from the WCDOA to DAFF, the
implementation of the Revitalisation of Agricultural Colleges programme and
increased emphasis on skills development in the agricultural sector, will impact
on the governance of agricultural colleges.
i) It also becomes increasingly difficult to maintain sufficient agricultural
resources required for training and research. This is due to budgetary

Page 38 of 227
constraints caused by inflation, increases in operational costs and the
increase of cost of employees (salaries).
j) The RD Programme was established in 2010 and with the current 16 rural
development nodes requiring a deeper level of intervention across the focus
areas: social upliftment, infrastructure development and economic
development, the lack of human capacity within the Development Co-
ordination and Social Facilitation sub-programmes will require attention over
the medium term.
It is envisaged that the loss of critical professional skills and senior management
over the next 5 years could occur through natural attrition. At the same time the
delivery of services to the clients of the Department depends on the availability,
retention and training/expertise of our technical staff. This may be hampered by
the following factors:
a) Unavailability of suitably qualified technical staff;
b) Although staff may be available, they may not be affordable in the
framework within which civil servants must operate;
c) Agriculture may be perceived as an unattractive career;
d) Working for government may be considered in a negative light;
e) Young people may not be willing to work in rural areas;
f) Key staff members reaching retirement age and are unwilling and unable to
continue beyond said age;
g) Students matriculate without mathematics and science as subject. The result
is that they cannot follow certain careers in agriculture, and
h) Limitations on physical infrastructure to ensure a productive working
environment and to respond to increased demand on available services.
In order to combat these problems, each Programme will annually have to revise
their human resource plans so that aspects of transformation, development and
succession planning are timeously addressed. At the same time the Human
Capital Development of the Department’s own internal capacity is as crucial as
the external initiatives mentioned, hence 119 bursaries have been awarded to
employees of whom 2 were at PhD level, 14 at Master’s Degree level and the
rest for undergraduate studies mostly in the scarce and critical occupational
categories. Over the next five years the departmental HCD Committee will play
a monitoring role in the allocation of bursaries to ensure that it is allocated in
accordance with the needs of the Department.
An example is the Human Resources Plan developed by the Programme: RTDS.
This plan addresses both its’ scarce and critical skills, succession planning and
transformation needs. New models of capacity development, especially on the
researcher and technician level, with partners (both commodity and tertiary
institutions) are being investigated and aim to grow agricultural youth and
undergraduates in a “better together” way with the ultimate aim to establish
agriculture as the career of choice. The in-service training initiatives, as well as
post-graduate student programmes, are building the new generation of
Page 39 of 227
technicians and researchers with the guidance and mentorship by senior and
specialist researchers.
However, the Department does not intend to approach matters in the same old
way, but it is also putting systems in place to work smarter:
a) One of the main focuses in the next 5 years will be the rollout of the Agri Touch
platform across the Province to enhance access to information by farmers
and agricultural stakeholders. In addition, this platform will allow farmers
access to the agri-suite of information to strengthen their technical know-how.
The delivery of household gardens has to be outsourced going forward to
‘free’ agricultural advisors from project management responsibilities and thus
allow them to focus more on delivering extension to farmers.
b) At the same time the GIS experts have embraced the challenges of the
“online” age through the development of a number of web-based tools to
make data available to a wide range of stakeholders, including other
provincial departments and local government. This has gone beyond the
scope of our own agricultural datasets, and provides programming and
infrastructure support for WCG initiatives, such as the Capital Expenditure
Portal and the WCG’s Spatial Observatory. It is envisaged that these services
and tools will expand in the next five years and capacity and excellence in
this field will have to be build.
c) Efficiency gains will be sought with a closer collaboration and integration
between the Programmes: RTDS, FSD and SAET. Lecturers should ensure that
the latest information, emanating from research, is included in their training
curricula, whilst extension officers should be “tooled and schooled” in the
latest technology and information to convey to clients. In a similar way, the
extension officers should refer research needs of farmers to the research
colleagues to address in a focussed way.
d) Our closer working relationship with other spheres of government, particularly
local government, has been discussed in more detail in Section 5.3)
e) Programme: SRM need to do the design of river protection works to protect
agricultural land after flood damages. This is a much specialised engineering
field with only one of our engineers trained to do the designs. To increase our
capacity, the universities of Stellenbosch and Pretoria are appointed to assist
with these designs in terms of the flood relief projects.
In certain instances the Department depends on other organs of state to
complete and complement its responsibilities and to this end the development
of relationships with other organs of state is of the utmost importance. Some of
the areas of cooperation include:
a) In some cases the Department can only provide advice whilst the final
decision is located elsewhere. For instance, in SRM the sub-programme: Land
Use Management provides comments on applications for sub-division and /or
rezoning of agricultural land in view of the need to prevent the fragmentation
of agricultural land and to protect valuable agricultural land and natural
resources for productive purposes (agriculture and ultimately food security),
taking into account conservation imperatives.
Page 40 of 227
b) The Department will seek to strengthen links with the DRDLR in the coming
years to ensure alignment between land delivery and agricultural support.
c) Funding to control outbreaks of trade sensitive animal diseases and diseases
with an impact on food security is budgeted for by DAFF. The ability of the
Province to curb outbreaks of such diseases is therefore largely reliant on the
ability of DAFF to respond timely and amply to the demands of disease control
in terms of providing the necessary financial resources.
d) Export certification of animals and animal products from the Western Cape
Province entirely depends on sound inter-governmental negotiations
(between South Africa and its trading partners) to ensure both maintenance
of, as well as, access to new markets. These negotiations are, however,
outside the control of the Province, since it is a national mandate. Any
circumstances that influence this service delivery by DAFF negatively will have
a corresponding negative effect on market access in the Province.
e) The existing MOU with NMMU (Saasveld campus) is being expanded to not
only include capacity building for Programme: RTDS, but also for the entire
Department, whilst a new MOU between the Department and the University of
Stellenbosch, will be pursued.
f) The Western Cape Agricultural Research Forum (WCARF) will serve as a pivotal
conduit to optimise research resources and identify training needs and
opportunities for our youth in agriculture. The participation in departmental
human capital development programmes will furthermore strengthen the
human resource base.
g) New models of collaboration with our commodity partners should also include
opportunities for vocational experience for the “young power” in agriculture.
As clearly mentioned in the NDP 2030, cooperation between public science
and technology institutions and the private sector should be enhanced. This
multi-level research collaboration will undoubtedly link to the goals “Leading
Cape” and “Educating Cape” of OneCape Vision 2040.
5.3 Description of the strategic planning process
The process to develop strategic plans for the Western Cape Department of
Agriculture can be traced back to provincialisation in 1996. During the Summit in
1996 the vision “Western Cape Agriculture: global success, competitive, inclusive
and in balance with nature” was coined and it still forms the foundation for the
Department’s current vision. The second phase of strategic plans started with
the Provincial Growth and Development Summit of 2003 after which the Western
Cape Agricultural and Agribusiness Strategy was developed. During the third
phase, the Provincial Strategic Objective 11: Creating opportunities for growth
and development in rural areas, formed the foundation for the Department’s
interventions.
The process to develop this Strategic Plan of the Department started with the
Western Cape Triennial Agricultural Summit which took place from 22 to 23
October 2012 at the Protea Hotel in Stellenbosch. Two hundred and thirty eight
individuals were invited to participate in the Summit and in the end the 172
Page 41 of 227
people who attended the summit represented national government (DAFF,
DRDLR, DWAS, ARC, Land Bank, Treasury, PPECB), various provincial departments,
as well as 15 local governments. All four farmers associations as well as 15
industry organisations participated. Furthermore, the three biggest commercial
banks and five universities were all represented and six representatives from
labour unions were also present. The purpose of this event was to evaluate the
success of the previous three phases of strategy, to consider trends in the
external environment which influences agriculture in the Province and to
recommend new directions.
This summit was followed by the Western Cape CAADP Consultation which was
held on 18 June 2013 at the River Club. The Comprehensive Africa Agriculture
Development Programme (CAADP) is the New Partnership for Africa's
Development (NEPAD) framework for developing the agricultural sector in Africa.
It was endorsed by Heads of State and government, in June 2003, Maputo,
Mozambique. These Heads of State agreed to allocate at least 10% of their
national budget to agricultural sector development; achieve at least 6% annual
growth in the agricultural sector and develop an implementation compact. The
purpose of this workshop was to deliberate how the Western Cape Province
could contribute to South Africa’s CAADP implementation compact. It was
decided that agricultural research and development, food security, market
access, competitive supply chains and capacity development should receive
particular attention.
As part of the process to develop the Department’s Strategic Plan, the farmers of
the Province were also approached to determine their needs. An evaluation of
the service needs of the various categories (ranging from survivalist subsistence
to large commercial) of farmers in the Province was conducted. Two hundred
farmers, representative of all farmer categories as well as the dominant farming
systems, were approached and fourteen focus group sessions were held. The
purpose of this evaluation was to determine the core purpose of Western Cape
farmers, what their desired outcomes are and what services are to be delivered
by the WCDOA. This particular evaluation was in addition to a number of other
evaluations such as:
a) Determining the success rate of support to land reform beneficiaries;
b) The impact of market access support;
c) Further Education and Training learnerships, and
d) The impact of the CRDP in Dysselsdorp.
All this information (the results from previous phases, Triennial Agricultural Summit,
CAADP Consultation and the various evaluations), were brought together during
the Departmental Strategic Planning Workshop from 5 to 7 August 2014 at the
Ocean Breeze Hotel in the Strand. During this workshop the first draft of this
Strategic Plan was developed and circulated to certain interested parties.
After the first draft of the Strategic Plan the WCDOA also actively participated in
Project Khulisa; a project with the purpose of identifying a small number of high
Page 42 of 227
potential opportunities which could deliver meaningful jobs and growth within a
relative short period. As a result of this process agri processing was identified as
one of the “game changers” to achieve the objectives of the PSP (see page 8).
Following further work five priority leavers were developed to take this game
changer to the next level. It is important to note that there is no end date to a
strategic process and to this end the various policy levers will receive momentum
of various levels in the future.
Finally, in addition to national (e.g. CAADP) and provincial processes the
Department has also engaged with municipalities to determine their needs.
During this JPI six themes were identified (see page 21) and will receive attention
during the lifespan of this Strategic Plan.
All the processes described above eventually contributed to the contents of the
WCDOA’s Strategic Plan for the period 2015/16 to 2020/21.
6 Strategic outcome oriented goals
Departmental
Strategic Goal 1
Support the Provincial Agricultural Sector to at least maintain its
export position for the next 5 years by growing its value added from
R16.349 billion in 2013.
Goal statement
The contribution Agriculture makes to the economy of the Province is
reliant on the ability of the sector to export and earn foreign income.
Based on the realisation of income, jobs get created or maintained.
It is therefore important for the Department to ensure that the sector
is supported to maintain at least the same level of performance. The
implication is that specific actions and services to the farmers of the
Province need to be provided. Below are some of the key services
that must be delivered:
a) Through ensuring the application of Animal Disease Act, 1984
(Act 35 of 1984) and Meat Safety Act, 2000 (Act 40 of 2000), the
Department will ensure healthy animals, healthy food of animal
origin and healthy consumers and through implementation of
zoo-sanitary and phyto-sanitary standards and export
certification, the facilitation of export of animals and animal
products will be ensured. Without any of these measures no
export of products of animal origin can take place.
b) Render a comprehensive research and technology development
service in animal and plant sciences as well as resource utilisation
(including spatial analysis and risk and potential assessment). This
service reflects the needs of farmers and addresses the impact of
climate change on the agricultural sector in the Province.
c) Develop quantitative and qualitative agricultural economic
benchmarks at micro and macro level which can be used to
provide financial advice to all role players. Informed decisions
ensure that farming remains a profitable business which, in turn is
paramount in achieving this strategic goal.
d) Improve and revitalised extension services by using the latest
technology and strengthening links and partnerships with
commodity organisations.
Page 43 of 227
e) Facilitate access to a comprehensive set of databases, models
and relevant statistics.
f) Attract direct investment in the agricultural sector of the Province
and support export initiatives by both commercial and emerging
farmers.
g) Provide marketing and agribusiness support services and
intelligence to enhance competiveness of the agricultural and
agribusiness sector including agri processing
h) Ensuring structured agricultural education and training to all
participants in the agricultural sector in order to establish a
knowledgeable and competitive sector and to implement the
Human Capital Development Strategy.
Justification
The impact of this export role of the agricultural sector was recently
research by the Department. It was found that if only a five per cent
growth in exports of certain selected agricultural products is
simulated, the output of the Western Cape economy increased by
R432 million. This amount represents three times the value of the
initial assumed increase in exports of R136 million, indicating the
great extent of the linkages in the Western Cape economy.
Furthermore, and in line with the employment creation goal of the
both the provincial and national governments, it was found that
22 951 employment years could be created within the economy of
which only 9 505 are in the agricultural sector and the balance
(13 446) in the non-agricultural sector. As important as the growth
and employment effects is the redistribution effects of such a
simulated increase in agricultural exports. It was found that the
spendable household incomes of the total rural population would
increase by 0.83 per cent and that of the urban population by 0.24
per cent. More significantly, there appears to be a very significant
redistribution of wealth from white and Asian rural households (whose
household income increased by 0.43%) to coloured and black rural
households (1.54% increase in household income). It is evident that
the opposite is also true. A decline in agricultural exports would
have the inverse impact. For this reason it is important to maintain
the Province’s agricultural export status through the interventions
mentioned above.
Links
PSG 1: (Create opportunities for growth and jobs). Strategic
Intervention 6 of this PSG specifically aims to open markets or
Western Cape firms and key sectors wanting to export.
NDP: In Chapter 6 of the NDP the target of 1 million agricultural jobs is
stated to be obtained through labour intensive, export orientated
irrigation farming.
NO 4: (Decent employment through inclusive growth). Specific
emphasis is placed on the export market as an opportunity for
economic growth.
NO 11: Create a better South Africa, contribute to a better and safer
Africa in a better world. Sub-outcome 1 specially refers to SA’s
national priorities advanced in bilateral engagements while Sub-
outcome 5 focuses on a sustainable developed and economically

Page 44 of 227
integrated Africa.
Acceleration of growth and broadening economic participation in
the agricultural sector which the strategic goal seeks to achieve is
based on the priorities of various policies including BBBEE (Act No. 53
of 2003).
Departmental
Strategic Goal 2
Ensure that at least 70% of all agricultural land reform projects in the
Province are successful over the next 5 years.
Goal statement
Without a successful land reform intervention in South Africa the
social, political and economic sustainability of the country will be
under severe threat. The successful models of those tested and tried
over the last 15 years must now be implemented to ensure the
establishment of successful smallholder and black commercial
farmers. The Department must therefore respond by rendering:
a) A full service of technical, economic and scientific information
dissemination to farmers and agricultural stakeholders.
b) Support to farmers through different agricultural development
programmes, quality aftercare services (which include extension
and advice, training) and using the various tools including
financial record keeping systems, typical farm models, enterprise
budgets, etc. to enhance the agricultural business development
of land reform beneficiaries and projects.
New and commercial farmers must actively contribute to the
agricultural economy by strengthening food security, the value of
both agricultural production as well as agricultural exports and they
should benefit from and contribute to rural development initiatives.
It follows that this goal is closely linked to PSG 1 and these two goals
should in no way be considered to be at cross purposes: Agriculture
remains a business.
It is important to ensure economic participation of the emerging and
commercial sectors at all levels of the value chain. This is achieved
through integration of subsistence and smallholder farmers into the
mainstream agriculture, identifying market and business
opportunities, ensuring access to market information and facilitating
contractual agreements with various markets. Also, ensuring
effective governance and institutional strengthening of existing
businesses while facilitating the establishment of new ones through
provision of support for the development of agricultural
cooperatives. The latter is mainly to encourage collective bargaining
and for increased volumes for successful uptake of market
opportunities.
Justification
It is a fact that the agricultural sector is responsible for food security
of South Africans (and in particular in the Province) and this must be
achieved within the constraint of finite resources such as land and
water. Other constraints on new farmers include: difficulties in
accessing markets, access to land, the acquisition of skills and
managerial expertise, access to appropriate technology, the poor
quality of the business infrastructure in poverty stricken areas, and in
some cases the quality of extension services. These challenges can
Page 45 of 227
only be overcome through effective support services with specific
reference to the development of appropriate technology, the
transfer of such technology (formal and informal training as well as
extension) as well regulatory and financial support.
Links
Agricultural support services cannot be delivered in isolation and
without partners and hence the linkages to internal departmental
programmes, other provincial and national departments,
stakeholder groups and commodity bodies. The purpose is to create
an environment, including the availability of capital and the
presence of a plethora of quality supply firms and services that
encourages new farmers and minimises the costs associated with
getting from idea to product as well as a culture that appreciates
entrepreneurial risk taking, forgives failure, and celebrates success.
PSG 1: (Create opportunities for growth and jobs). Strategic
intervention 2 of this PSG targets the support to entrepreneurs and
small businesses. Strategic intervention 7 aims to ensure our
economic, social and environmental sustainability. Neither of these
two interventions is possible without successful agricultural land
reform.
NDP: A large part of Chapter 6 of the NDP is dedicated to successful
land reform.
NO 7: (Vibrant, equitable, sustainable rural communities contributing
towards food security for all). Sub-Outcome 2 of this NO aims to
ensure sustainable land reform to ensure agrarian transformation.
Acceleration of growth and broadening economic participation in
the agricultural sector which the strategic goal seeks to achieve is
based on the priorities of various policies including BBBEE.
Departmental
Strategic Goal 3
Support the sector (farmers and industries) to increase sustainable
agricultural production (primary provincial commodities) by at least
10% over the next 10 years.
Goal statement
Without the production of food there can be no food security at
either macro or household level. As the global and national
populations are both still in a growth phase and questions can be
raised on the global availability of food, special emphasis must be
placed on the production of sufficient food. Furthermore, it must be
kept in mind that the price movement from export to import parity
have a price implication of up to 50%. It is clearly that this will have a
negative impact on the affordability of food at household level and
subsequently the achievement of the MDG goals. The food crisis in
2007 to 2008 and again in 2010 highlighted the vulnerability of the
country as well as households. The challenge is to ensure that land
reform beneficiaries contribute towards this strategic goal so that the
land redistribution not only addresses redress but also agricultural
production.
Population growth combined with the concomitant reduction in the
available water as well as the expected change in the world’s
Page 46 of 227
climate, the need to be innovative and creative in food production
becomes imperative. Research and development form the basic
foundation towards realising food production, but also employment
opportunities for lower skilled persons.
Justification
The agricultural sector of the Western Cape is one of the drivers of
the economy, especially in the rural areas of the Province.
Increased production (and therefore lower production cost of food)
of the agricultural sector of a developing nation may lead to the
ready availability of food and foreign exchange earnings. This will
not only lead to a better nurtured (and thus a more productive) rural
population, but also the resulting higher levels of rural income will
lead to both public and private capital formation and will result in
the development of a rural market for the industrial sector. The
expansion of the industrial sector will lead to new job opportunities
for which the agricultural sector is supposed to release labour. Due
to the unique income elasticity of demand in developing countries,
this in turn will again lead to increased demand for agricultural
products, and therefore the start of a new cycle or, in other words,
an upwards spiral of economic growth. It is therefore clear that
production increases in the agricultural sector can play an important
catalytic role.
Links
PSG 1: (Create opportunities for growth and jobs). Strategic
Intervention 8 of this PSG aims to demonstrate leadership which
promotes an improved regional economic system and embraces
innovation.
NDP: In Chapter 6 of the NDP the target of 1 million agricultural jobs
and economic growth is to be done through the selection and
support of internationally competitive agricultural industries.
NO 4: (Decent employment through inclusive growth). Specific
emphasis is placed in Sub-outcome 9 on investment in research,
development and innovation to support inclusive growth by
enhancing productivity of existing and emerging enterprises and
improving the living conditions of the poor.
Departmental
Strategic Goal 4
Optimise the sustainable utilisation of water and land resources to
increase climate smart agricultural production.
Goal statement
Agriculture (and ultimately food security) is dependent on the
utilisation of the three major natural phenomena (land, water and
climate). If any of these three phenomena are threatened, the
negative impact reverberates throughout the Province causing food
insecurity, in-migration to towns, unemployment and reduced
foreign earnings. The effect of climate change on agriculture in the
Western Cape will be one of the major determinants of the
sustainability of this sector and the competitiveness of its farmers. The
service delivery agenda of the Department will include decision-
making support with relation to the choice of farming activity, the
optimal use of natural resources (water and land), the promotion of
conservation agricultural practises and the generation of
appropriate and sustainable technologies and information in this
regard.
Page 47 of 227
The Province has experienced a drastic increase in natural disasters
during the past three years and the indications are that this trend will
continue as the impacts of climate change take effect. Apart from
being involved with post disaster mitigation and recovery, it is also
necessary to have a pro-active approach towards natural disasters.
Justification
Sustainable utilisation of our scarce natural resources is required to
ensure competitiveness of the sector and the optimisation of the
natural resource base, which is finite.
Sustainable resource management is the core for a productive
agricultural sector, which can ensure food security for the Province.
Links
PSG 1: (Create opportunities for growth and jobs). Strategic
Intervention 7 aims to ensure our economic, social and
environmental sustainability.
PSG 4: (Enable a resilient, sustainable, quality and inclusive living
environment). Outcome 1 aims to sustain the ecological and
agricultural resource base.
NDP: Chapter 5 of this plan focuses on environmental sustainability.
NO 10: (Protect and enhance our environmental assets and natural
resources). Sub-outcome 1 of this NO aims to ensure that Ecosystems
are sustained and natural resources are used efficiently.
LandCare South Africa is guided by international conventions to
which the South African Government is party and signatory. These
include the Convention on Wetlands of International Importance
(RAMSAR), the Convention to Combat Desertification, and the
Convention on Biological Diversity and the Framework Convention
on Climate Change. Links with international programmes such as
NEPAD (forum of the African LandCare Network), Man and the
Biosphere, World Convention to Combat Desertification and
Biodiversity Protection are relevant.
The mandate is provided through the Sub-Division of Agricultural
Land Act (Act 70 of 1970), the Land Use Planning Ordinance
(Ordinance 15 of 1985) and the National Environment Management
Act (Act 107 of 1998).
Departmental
Strategic Goal 5
Increase agricultural and related economic opportunities in selected
rural areas based on socio-economic needs over a 10 year period
and strengthen interface with local authorities.
Goal statement
The Government of the Western Cape envisions a Province where, in
the rural areas:
a) Poverty and food shortages will be halved in selected areas by
2020;
b) Women, children, the aged and people with disabilities are
empowered and come into their own;
c) Rural areas are developed sustainably;
d) Unemployment can be systematically addressed;

Page 48 of 227
e) Environmental stability is assured; and
f) HIV/Aids infection and TB levels have been reduced
considerably.
It is evident that the vision for rural areas cannot be achieved at
once, but that a systematic approach needs to be followed.
Justification
It is true that, of the close to 6 million people of the Western Cape
Province, approximately 68% lives in the City of Cape Town.
Nevertheless, the corollary of this argument is that roughly 32% of the
Province’s people live outside the City. For this reason rural
development is an extremely important objective of the Provincial
Cabinet for the next 5 years. According to Joseph Stiglitz, well-
known development economist and winner of the Nobel Prize,
development is not about helping a few people to get rich, but it is
about transforming societies, improving the lives of the poor,
enabling everyone to have a chance at success and access to
health care and education. It follows that rural development can
never be mono-dimensional, but that it must be multi-dimensional
(broad based, human centred, economic focussed). This, in turn,
implies that rural development can never be the sole domain of a
single organ of state (or even a specific sphere of government), but
that it must be a truly intergovernmental effort.
Links
As this DSG aims to improve the conditions of selected rural
communities, it links to all five PSGs and, more specifically
PSG 1: Create opportunities for growth and jobs;
PSG 2: Improve education outcomes and opportunities for youth
development;
PSG 3: Increase wellness, safety and tackle social ills;
PSG 4: Enable a resilient, sustainable quality and inclusive living
environment, and
PSG 5: Embed good governance and integrated service delivery
through partnerships and spatial alignment.
NDP: Chapter 6 of the NDP specifically focus on an integrated and
inclusive rural economy. To this end non-agricultural activities,
human capital, social security, food security, basic services, towns,
governance in rural areas are all receiving attention.
NO 7: (Vibrant, equitable, sustainable rural communities contributing
towards food security for all). Sub-outcome 5 of this NO aims to
ensure increased access to quality infrastructure and functional
services, particularly in education, healthcare and public transport in
rural areas. Sub-outcome 6 aims to ensure growth of sustainable
rural enterprises and industries- resulting in rural job creation.
Departmental
Strategic Goal 6
Enhance the agri processing capacity at both primary and
secondary level to increase with 10% over baseline by 2019.
Goal statement
Farming products are very seldom consumed in its pure form. For
instance, wheat need to be turned into flour and then bread, barley
into beer, grapes into wine and livestock into meat. Even fruit need
to be sorted and packed before it finds its way into a consumer’s
shopping basket. It follows that a healthy Agricultural Sector cannot

Page 49 of 227
by created by focussing on primary production alone, but the
capacity of the whole value chain, from inputs, production and,
finally, to consumption, needs to be enhanced. As various actions
and processes need to take place, this capacity needs to be both
on-farm and off-farm.
In the same vein it is clear that a whole range of support services
need to be in place for this agri processing capacity to be
expanded. More specifically:
a) Research and development of new products, processes and
markets;
b) Analysis of the economics of various processes, the
competitiveness of value chains and the enhancement of scope
of agri processing by adding dimensions (e.g. quality, tourism,
etc.);
c) Creating engineering solutions to particular process and
processing problems;
d) Direct support to individual enterprises (e.g. through CASP
funding);
e) Development of the necessary skills and human capacity to
enhance the competitiveness of agri processing chains;
f) Veterinary support to ensure compliance and health standards
for meat processing, and
g) Food processing regulations to ensure safe food for consumers.
Justification
One of the key findings of the 2013 PERO was that the development
of agriculture and the associated agri processing industries in the
non-metro districts should be one of the key areas to explore in terms
of objective and inclusive growth. Indeed, the PERO went so far as
to indicate that in all five rural districts of the Western Cape the
Agriculture and Processing Sector held the highest revealed
comparative advantage of all sectors. It was also one of the few
sectors of the Provincial economy which has shown a national and
international revealed comparative advantage.
For this reason it was no surprise when the McKinsey team, during the
Project Khulisa process, found that agri processing in the Western
Cape had shown a 7.7% employment growth rate over the period
2009 to 2013. Although this is the second to the 7,8% employment
growth rate of tourism over the same period, it came of a relatively
low economic growth rate of 1,8%. In other words, it is one of the
very few sectors where the curse of jobless growth can be turned
around and the increase in the number of jobs can be faster than
economic growth.
Links
Agri processing is one of the instances where a clear and direct link
can be found between the priorities at all three levels of
Government. The NDP specifically mentions that “…areas with
greater economic potential, such as agri processing, tourism,…”
should form key elements in the rural development strategy. For this
reason Sub-outcome 6 of NO 7 includes indicators which refer
specifically to employment created and number of industries
supported in rural areas. Agri processing was identified as a sector
with high growth potential in the New Growth Path (NGP);

Page 50 of 227
specifically with a reference to job creation. The NDP and NGP are
also translated into the agri processing priorities of IPAP and the
value chain approach of APAP.
At a Provincial level, Agri processing is one of the Game Changers of
the Provincial Strategic Plan (see Section 5.3 for more information).
At the local government level, Agri processing is one of the themes
which have emerged during the JPI between the Departments of
the Western Cape Province and all municipalities.
Departmental
Strategic Goal 7
Facilitate an increase of 20% in relevant skills development at
different levels in the organisation and the sector over the next 10
years.
Goal statement
Human Capital development is vital to the realisation of the vision of
the National Development Plan (NDP) in dealing with the challenges
of unemployment, inequality and creating a more inclusive society.
Skills development is therefore critical especially if a next skilled
generation is to be created.
The Department is committed to transform and increase the
potential of its employee pool and the agricultural sector through
various programmes:
a) Internships;
b) Bursaries and scholarship;
c) Young Professionals Persons Programme;
d) Learnerships;
e) Bridging Programmes, and
f) Higher education and Further education courses and
programmes.
These programmes aim to address the skills gaps, new skills demands,
critical and scarce agricultural skills, attract especially the youth to
agriculture as career through experience, exposure, and enhancing
their basic educational level, thus developing them as agricultural
professionals and leaders
Justification
Transformation of the sector is slow and enhancing equity in the
scarce and critical skills deems challenging, specifically amongst the
rural youth of the Province. Increasing the number of previously
disadvantaged registered professionals has been arduous and
discouraging.
Agriculture as a career is often perceived by the youth as menial
and unskilled. Educationally youth are ill-prepared to follow a career
in Agriculture, particularly lacking in science and mathematics,
which are requirements for most fields of academic studies in
agriculture. Extensive advocacy and the promotion of career
opportunities in Agriculture becomes priority.
Low quality of education, the absence of science and mathematics
in the curriculum, and the lack of finances has deterred our rural
youth from pursuing careers in Agriculture.

Page 51 of 227
Although the agriculture sector is an important player for economic
growth and jobs it still has to overcome many challenges.
Links
The long-term vison of the NDP is to address challenges of
unemployment, inequality and creating a more inclusive society.
Human capital development is essential for meeting this vision as
well as promoting transformation.
Although human capital development cuts across all 14 NOs,
strategically it links well with the following NO:
NO4: Decent employment through inclusive growth;
NO5: A Skilled and capable workforce to support an inclusive growth
path, and
NO7: Vibrant, equitable, sustainable rural communities contributing
towards food security for all.
On a provincial level, PSG 1: Create opportunities for growth and
jobs, and PSG 2: Improve education outcomes and opportunities for
youth development, link with human capital development and
hence it remains one of the key priorities of the Department.

Page 52 of 227
PART B: PROGRAMME AND SUB-PROGRAMME PLANS
Programme Sub-programme
1. Administration 1.1. Office of the MEC
1.2. Senior Management
1.3. Corporate Services
1.4. Financial Management
1.5. Communication Services
2. Sustainable Resource Management 2.1. Engineering Services
2.2. LandCare
2.3. Land Use Management
2.4. Disaster Risk Management
3. Farmer Support and Development 3.1. Farmer Settlement and Development
3.2. Extension and Advisory Services
3.3. Food Security
3.4. Casidra SOC Ltd
4. Veterinary Services 4.1. Animal Health
4.2. Export Control
4.3. Veterinary Public Health
4.4. Veterinary Laboratory Services
5. Research and Technology
Development Services
5.1. Research
5.2. Technology Transfer Services
5.3. Infrastructure Support Service
6. Agricultural Economics Services 6.1. Agri-Business Support and Development
6.2. Macroeconomics Support
7. Structured Agricultural Education and
Training
7.1. Higher Education and Training
7.2. Further Education and Training
8. Rural Development 8.1. Rural Development Coordination
8.2. Social Facilitation
8.3. Farm Worker Development
Note: Sub-programme 3.4: Casidra SOC Ltd is additional to the National Treasury standardised
budget and programme structure.
Sub-programme 8.3: Farm Worker Development is additional to the National Treasury
standardised budget and programme structure.
7 Programme 1 – Administration
7.1 Strategic Objectives 2015/16
The purpose of Programme 1: Administration is to manage and formulate policy
directives and priorities and, to ensure there is appropriate support service to all
other Programmes with regard to finance, personnel, information,
communication and procurement.
The purpose per sub-programme is as follows:
Office of the MEC: To set priorities and political directives in order to meet the
needs of clients. (For the efficient running of the MEC’s office).
Senior Management: To translate policies and priorities into strategies for
effective service delivery and, to manage, monitor and control performance.
Page 53 of 227
Corporate Services: To provide support services to the other programmes with
regard to human resources management and development, Information
Technology, Facility Support Maintenance and Communication service.
Financial Management: To provide effective support service (including
monitoring and control) with regard to Budgeting, Financial Accounting,
Moveable Assets, Motor Fleet service, Provisioning and Procurement.
Communication Services: To focus on internal and external communications of
the department through written, verbal, visual and electronic media as well as
marketing and advertising of the departmental services.
Strategic objectives are documented per sub-programme.
7.2 Sub-Programmes 1.2: Senior Management
Strategic objective Strengthen the alignment between the three spheres of government.
Objective statement
The constitution of South Africa introduces three spheres of government
and the PFMA requires accountability from accounting officers. The
subsequent institutionalised silos can only be overcome through
alignment of objectives.
Baseline 2014/15 Interface map and Departmental Evaluation Plan.
Justification
The Department is a civil service institution funded by money from the
taxpayer. For this reason it is important that strategic leadership is
provided and that alignment is created with other organs of state at
national, provincial and local government levels to ensure maximum
impact for the resources invested in the Department’s activities.
Links NO 12: An efficient, effective and development-oriented public service.
PSG 5: Embed good governance and integrated service delivery
through partnerships and spatial alignment.
Strategic
Objective
performance
indicator
Audited/Actual performance Estimated
performance
2014/15
Medium-term targets
2011/12 2012/13 2013/14 2015/16 2016/17 2017/18
1.1 National,
provincial
and local
government
objectives
mapped
Not
reported
on
during
this
period
Not
reported
on
during
this
period
Not
reporte
d on
during
this
period
Not
reported on
during this
period
Yes Yes Yes
1.2 Departmenta
l Evaluation
Plan
developed
and signed
off by the
HOD
Not
reported
on
during
this
period
Not
reported
on
during
this
period
Not
reporte
d on
during
this
period
Not
reported on
during this
period Yes Yes Yes
7.2.1 Risk Management
The following risks have been identified that requires specific actions from the
sub-programme:

Page 54 of 227
Risk 1: Alignment with other spheres of government does not take place
correctly.
Response 1: Continuous interaction with other spheres of government takes
place at appropriate platforms.
Risk 2: Other components of the Department are not properly responsive to
national, provincial and local government goals and objectives.
Response 2: Leadership and direction is provided during regular management
meetings.
Provincial specific indicators and annual targets for 2015/16 Programme
performance
indicator
Audited/Actual performance Estimated
performance
2014/15
Medium-term targets
2011/12 2012/13 2013/14 2015/16 2016/17 2017/18
1.1 Number of
local
government
indabas in
which the
Department
participated
Not
reported
on
during
this
period
Not
reported
on
during
this
period
Not
reported
on
during
this
period
Not reported
on during this
period
2 2 2
1.2 Number of
evaluations
completed
Not
reported
on
during
this
period
Not
reported
on
during
this
period
Not
reported
on
during
this
period
Not reported
on during this
period 7 7 7
Provincial specific indicators for 2015/16 Performance
indicator
Reporting
period
Annual target
2015/16
Quarterly targets
1st 2nd 3rd 4th
1.1 Number of local
government
indabas in
which the
Department
participated
Quarterly 2 0 0 1 1
1.2 Number of
evaluations
completed
Annually 7 7
7.3 Sub-Programmes 1.3: Corporate Services
Strategic objective
1. Well-maintained infrastructure and accommodation to support
effective service delivery.
2. Effecting the human capital development strategy to address the
skills needs in the Department and sector.
3. Ensure business continuity in the event of disasters or major
interruptions.
Objective statement 1. To ensure the availability of infrastructure timely as required, by
conducting and submitting an annual needs assessment through

Page 55 of 227
the Departmental User Asset Management Plan (UAMP).
2. To transform Agriculture through internal and external skills
development programmes and projects.
3. To ensure continued commitment to achieving the stated
objectives of the Department by maintaining critical business
functions in order to minimise the negative impact of any major
interruption and disaster.
Baseline
1. All departmental government-owned infrastructure and property
needs are determined and consolidated into the departmental
UAMP.
2. In 2014/15, 86 bursaries were awarded which includes Young
Professional Persons (YPP) and beneficiaries of the Agricultural
Partnership for Rural Youth Development (APFRYD). One hundred
and five (105) Internships were appointed which includes APFRYD
and Premiers Advancement of Youth Project (PAY), student and
graduate interns.
3. Business Continuity Plan developed and annually reviewed.
Justification
It is absolutely vital that the necessary infrastructure is well-maintained
and that suitable accommodation is available for the provision of high
quality service delivery. Hence it is important that a plan of action
which is periodically revised be in place to ensure that service delivery
will continue even at the time of disaster.
Agriculture is viewed as one of the main sectors for economic growth
and jobs. It is thus essential that a high level of skills both in the
Department and sector be maintained.
Links
NO 12: An efficient, effective and development-oriented public service.
PSG 5: Embed good governance and integrated service delivery
through partnerships and spatial alignment.
Strategic
Objective
performance
indicator
Audited/Actual performance Estimated
performance
2014/15
Medium-term targets
2011/12 2012/13 2013/14 2015/16 2016/17 2017/18
1.1 Coordination,
consolidation
and
submission of
the User Asset
Management
Plan (UAMP)
Yes Yes Yes Yes Yes Yes Yes
1.2 Number of
bursaries, and
internships
awarded
Not
reported
on
during
this
period
Not
reported
on
during
this
period
Not
reported
on during
this
period
75 75 75 75
1.3 Business
continuity
Plan
developed
and annually
revised
Not
reported
on
during
this
period
Not
reported
on
during
this
period
Not
reported
on during
this
period
Yes Yes Yes Yes
7.3.1 Risk Management
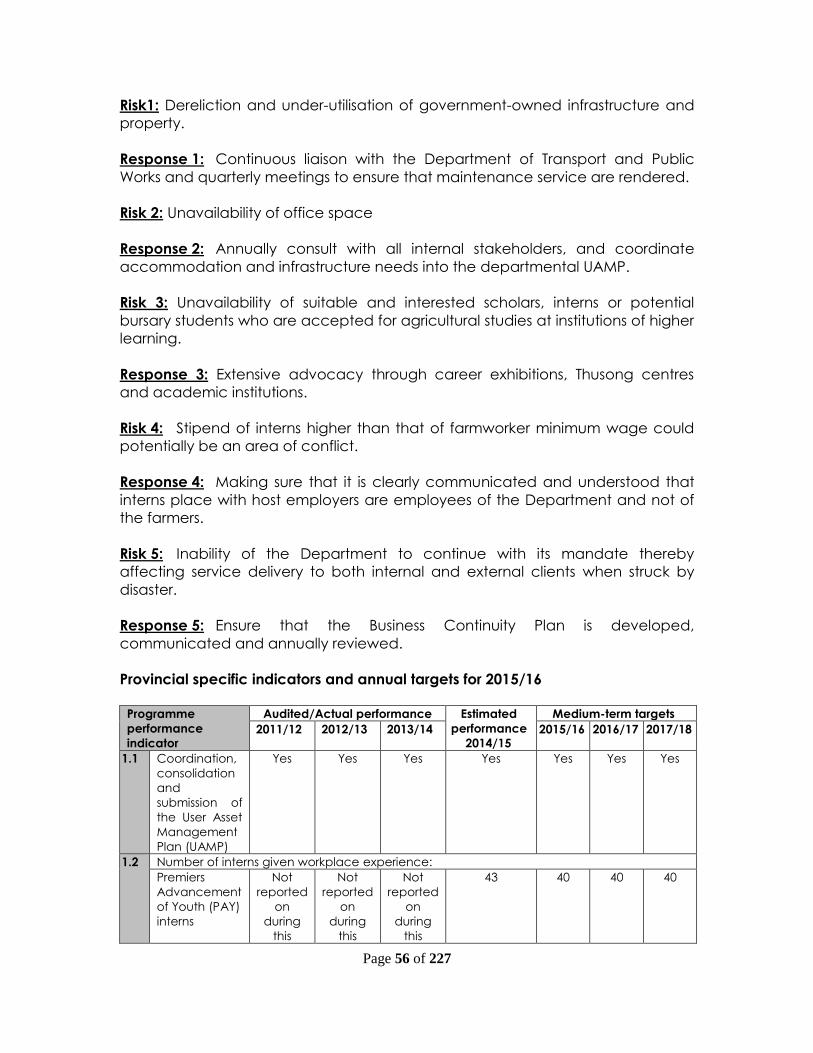
Page 56 of 227
Risk1: Dereliction and under-utilisation of government-owned infrastructure and
property.
Response 1: Continuous liaison with the Department of Transport and Public
Works and quarterly meetings to ensure that maintenance service are rendered.
Risk 2: Unavailability of office space
Response 2: Annually consult with all internal stakeholders, and coordinate
accommodation and infrastructure needs into the departmental UAMP.
Risk 3: Unavailability of suitable and interested scholars, interns or potential
bursary students who are accepted for agricultural studies at institutions of higher
learning.
Response 3: Extensive advocacy through career exhibitions, Thusong centres
and academic institutions.
Risk 4: Stipend of interns higher than that of farmworker minimum wage could
potentially be an area of conflict.
Response 4: Making sure that it is clearly communicated and understood that
interns place with host employers are employees of the Department and not of
the farmers.
Risk 5: Inability of the Department to continue with its mandate thereby
affecting service delivery to both internal and external clients when struck by
disaster.
Response 5: Ensure that the Business Continuity Plan is developed,
communicated and annually reviewed.
Provincial specific indicators and annual targets for 2015/16
Programme
performance
indicator
Audited/Actual performance Estimated
performance
2014/15
Medium-term targets
2011/12 2012/13 2013/14 2015/16 2016/17 2017/18
1.1 Coordination,
consolidation
and
submission of
the User Asset
Management
Plan (UAMP)
Yes Yes Yes Yes Yes Yes Yes
1.2 Number of interns given workplace experience:
Premiers
Advancement
of Youth (PAY)
interns
Not
reported
on
during
this
Not
reported
on
during
this
Not
reported
on
during
this
43 40 40 40

Page 57 of 227
Programme
performance
indicator
Audited/Actual performance Estimated
performance
2014/15
Medium-term targets
2011/12 2012/13 2013/14 2015/16 2016/17 2017/18
period period period
Graduate/
Student Interns
Not
reported
on
during
this
period
Not
reported
on
during
this
period
Not
reported
on
during
this
period
34 20 20 20
APFRYD
interns
Not
reported
on
during
this
period
Not
reported
on
during
this
period
Not
reported
on
during
this
period
28 30 30 30
1.3 Number of bursaries awarded:
Internal
(employees)
Not
reported
on
during
this
period
Not
reported
on
during
this
period
Not
reported
on
during
this
period
54 58 50 50
External
Not
reported
on
during
this
period
Not
reported
on
during
this
period
Not
reported
on
during
this
period
77 55 55 55
Young
Professional
Programme
Not
reported
on
during
this
period
Not
reported
on
during
this
period
Not
reported
on
during
this
period
4 6 6 6
Scholarships Not
reported
on
during
this
period
Not
reported
on
during
this
period
Not
reported
on
during
this
period
5 5 5 5
1.4 Departmental
Business
Continuity
Plan annually
reviewed and
adjusted as
necessary
Not
reported
on
during
this
period
Not
reported
on
during
this
period
Not
reported
on
during
this
period
Yes Yes Yes Yes
Provincial specific indicators for 2015/16 Performance
indicator
Reporting
period
Annual target
2015/16
Quarterly targets
1st 2nd 3rd 4th
1.1 Coordination,
consolidation
and submission
of the User Asset
Annually Yes Yes
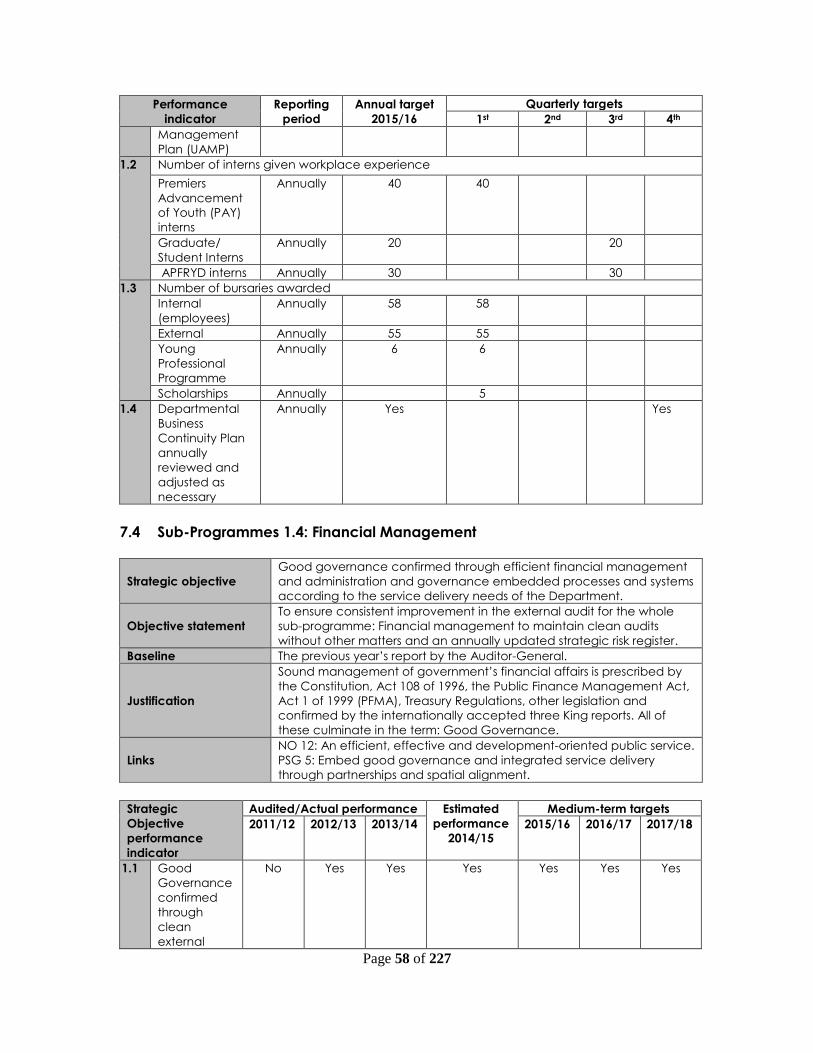
Page 58 of 227
Performance
indicator
Reporting
period
Annual target
2015/16
Quarterly targets
1st 2nd 3rd 4th
Management
Plan (UAMP)
1.2 Number of interns given workplace experience
Premiers
Advancement
of Youth (PAY)
interns
Annually 40 40
Graduate/
Student Interns
Annually 20 20
APFRYD interns Annually 30 30
1.3 Number of bursaries awarded
Internal
(employees)
Annually 58 58
External Annually 55 55
Young
Professional
Programme
Annually 6 6
Scholarships Annually 5
1.4 Departmental
Business
Continuity Plan
annually
reviewed and
adjusted as
necessary
Annually Yes Yes
7.4 Sub-Programmes 1.4: Financial Management
Strategic objective
Good governance confirmed through efficient financial management
and administration and governance embedded processes and systems
according to the service delivery needs of the Department.
Objective statement
To ensure consistent improvement in the external audit for the whole
sub-programme: Financial management to maintain clean audits
without other matters and an annually updated strategic risk register.
Baseline The previous year’s report by the Auditor-General.
Justification
Sound management of government’s financial affairs is prescribed by
the Constitution, Act 108 of 1996, the Public Finance Management Act,
Act 1 of 1999 (PFMA), Treasury Regulations, other legislation and
confirmed by the internationally accepted three King reports. All of
these culminate in the term: Good Governance.
Links
NO 12: An efficient, effective and development-oriented public service.
PSG 5: Embed good governance and integrated service delivery
through partnerships and spatial alignment.
Strategic
Objective
performance
indicator
Audited/Actual performance Estimated
performance
2014/15
Medium-term targets
2011/12 2012/13 2013/14 2015/16 2016/17 2017/18
1.1 Good
Governance
confirmed
through
clean
external
No Yes Yes Yes Yes Yes Yes
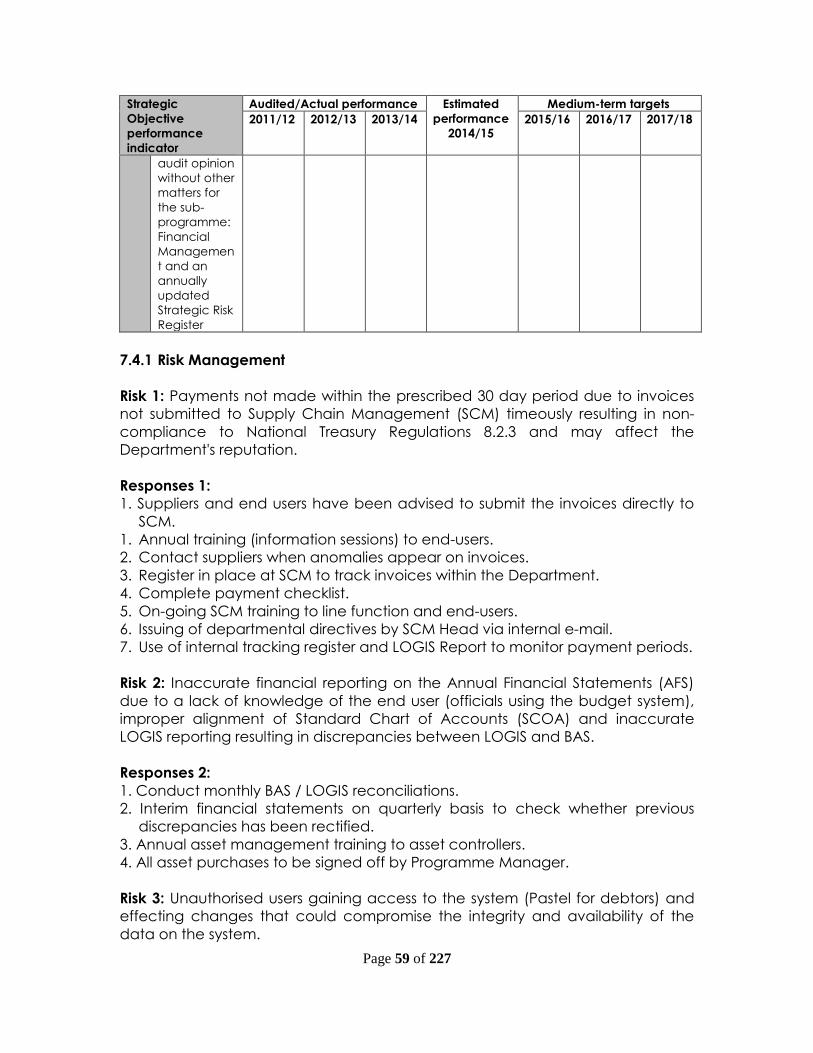
Page 59 of 227
Strategic
Objective
performance
indicator
Audited/Actual performance Estimated
performance
2014/15
Medium-term targets
2011/12 2012/13 2013/14 2015/16 2016/17 2017/18
audit opinion
without other
matters for
the sub-
programme:
Financial
Managemen
t and an
annually
updated
Strategic Risk
Register
7.4.1 Risk Management
Risk 1: Payments not made within the prescribed 30 day period due to invoices
not submitted to Supply Chain Management (SCM) timeously resulting in non-
compliance to National Treasury Regulations 8.2.3 and may affect the
Department's reputation.
Responses 1:
1. Suppliers and end users have been advised to submit the invoices directly to
SCM.
1. Annual training (information sessions) to end-users.
2. Contact suppliers when anomalies appear on invoices.
3. Register in place at SCM to track invoices within the Department.
4. Complete payment checklist.
5. On-going SCM training to line function and end-users.
6. Issuing of departmental directives by SCM Head via internal e-mail.
7. Use of internal tracking register and LOGIS Report to monitor payment periods.
Risk 2: Inaccurate financial reporting on the Annual Financial Statements (AFS)
due to a lack of knowledge of the end user (officials using the budget system),
improper alignment of Standard Chart of Accounts (SCOA) and inaccurate
LOGIS reporting resulting in discrepancies between LOGIS and BAS.
Responses 2:
1. Conduct monthly BAS / LOGIS reconciliations.
2. Interim financial statements on quarterly basis to check whether previous
discrepancies has been rectified.
3. Annual asset management training to asset controllers.
4. All asset purchases to be signed off by Programme Manager.
Risk 3: Unauthorised users gaining access to the system (Pastel for debtors) and
effecting changes that could compromise the integrity and availability of the
data on the system.
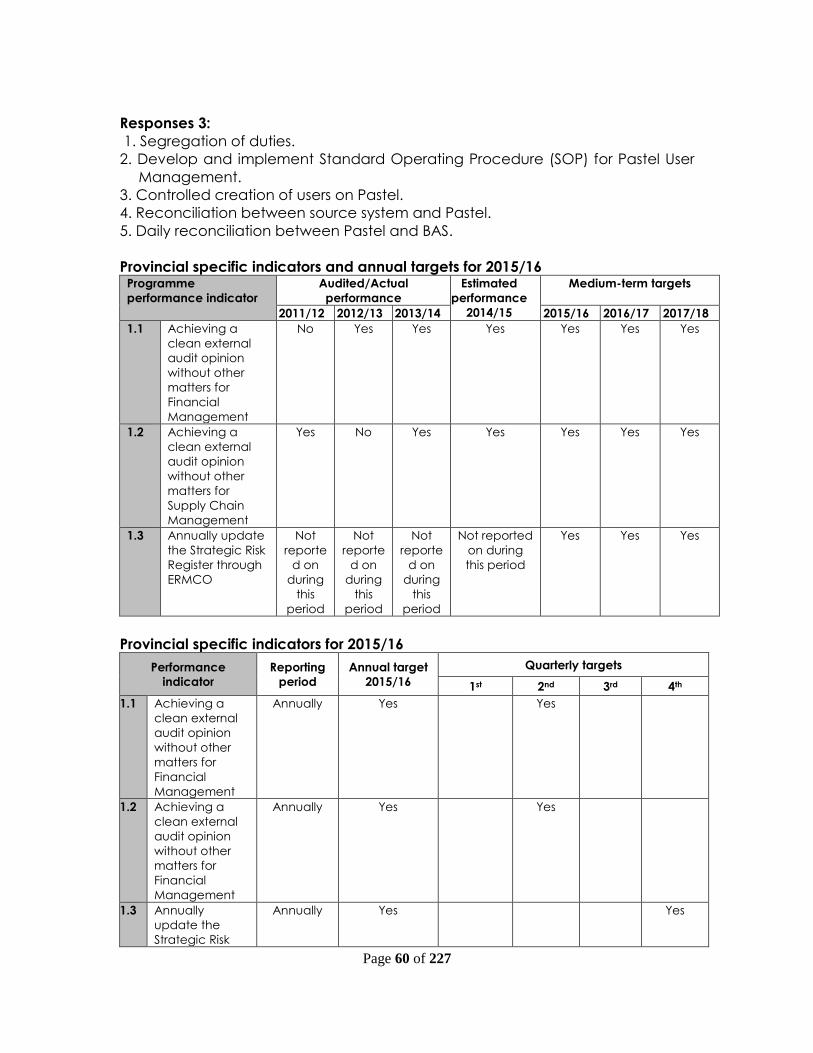
Page 60 of 227
Responses 3:
1. Segregation of duties.
2. Develop and implement Standard Operating Procedure (SOP) for Pastel User
Management.
3. Controlled creation of users on Pastel.
4. Reconciliation between source system and Pastel.
5. Daily reconciliation between Pastel and BAS.
Provincial specific indicators and annual targets for 2015/16 Programme
performance indicator
Audited/Actual
performance
Estimated
performance
2014/15
Medium-term targets
2011/12 2012/13 2013/14 2015/16 2016/17 2017/18
1.1 Achieving a
clean external
audit opinion
without other
matters for
Financial
Management
No Yes Yes Yes Yes Yes Yes
1.2 Achieving a
clean external
audit opinion
without other
matters for
Supply Chain
Management
Yes No Yes Yes Yes Yes Yes
1.3 Annually update
the Strategic Risk
Register through
ERMCO
Not
reporte
d on
during
this
period
Not
reporte
d on
during
this
period
Not
reporte
d on
during
this
period
Not reported
on during
this period
Yes Yes Yes
Provincial specific indicators for 2015/16
Performance
indicator
Reporting
period
Annual target
2015/16
Quarterly targets
1st 2nd 3rd 4th
1.1 Achieving a
clean external
audit opinion
without other
matters for
Financial
Management
Annually Yes Yes
1.2 Achieving a
clean external
audit opinion
without other
matters for
Financial
Management
Annually Yes Yes
1.3 Annually
update the
Strategic Risk
Annually Yes Yes

Page 61 of 227
Performance
indicator
Reporting
period
Annual target
2015/16
Quarterly targets
1st 2nd 3rd 4th
Register through
ERMCO
7.5 Sub-Programmes 1.5: Communication Services
Strategic objective Departmental activities effectively communicated.
Objective statement
To manage, coordinate and provide support to communication activities
in the Department to ensure effective and brand-consistent message
transmission.
Baseline The 2014/15 level of communication outputs.
Justification
As the Department is resourced by public funding, it is the right of citizens
to be informed of the services rendered by the Department as well as its
activities and the outcomes emanating from the activities.
Links
NO 12: An efficient, effective and development-oriented public service.
PSG 5: Embed good governance and integrated service delivery through
partnerships and spatial alignment.
Strategic
Objective
performance
indicator
Audited/Actual performance Estimated
performance
2014/15
Medium-term targets
2011/12 2012/13 2013/14 2015/16 2016/17 2017/18
1.1 Number of
communic
ation
interventio
ns
Not
reporte
d on
during
this
period
Not
reporte
d on
during
this
period
Not
reporte
d on
during
this
period
23 23 23 23
7.5.1 Risk Management
Risk 1: Ineffective communication due to the departmental Communication
capacity being incongruent with service demands resulting in delayed and no
steady flow of information and/or misinformation.
Response 1: An annual departmental events calendar and communication plan
in line with capacity and priorities is prepared.
Risk 2: Non-adherence to corporate branding emanating from insufficient
funding and/or resistance to change affects the professional image and
credibility of the Department.
Response 2: A Provincial corporate identity manual is in place and the
Department can make use of a transversal contract for creative work.
Recommendations received from the Department of the Premier on quarterly
brand assessment reports are implemented.
Provincial specific indicators and annual targets for 2015/16 Programme Audited/Actual performance Estimated Medium-term targets

Page 62 of 227
performance
indicator
2011/12 2012/13 2013/14 performance
2014/15
2015/16 2016/17 2017/18
1.1 Number of
publications
coordinated
Not
reported
on
during
this
period
Not
reported
on
during
this
period
Not
reported
on
during
this
period
11 11 11 11
1.2 Number of
events
coordinated
Not
reported
on
during
this
period
Not
reported
on
during
this
period
Not
reported
on
during
this
period
12 12 12 12
Provincial specific indicators for 2015/16 Performance
indicator
Reporting
period
Annual target
2015/16
Quarterly targets
1st 2nd 3rd 4th
1.1 Number of
publications
coordinated
Quarterly 11 2 3 3 3
1.2 Number of
events
coordinated
Quarterly 12 3 3 3 3
7.6 Reconciling performance targets with the Budget and MTEF
Expenditure estimates
Table 3: Programme: Administration Sub-programme Expenditure outcome Adjusted
appropriation
Medium-term expenditure
estimate
R thousand 2011/12 2012/13 2013/14 2014/15 2015/16 2016/17 2017/18
Minister 1 5 780 5 917 6 134 8 375 7 696 8 215 8 753
Senior Management 4 126 5 361 5 747 12 085 20 880 21 110 22 270
Corporate Services 31 237 38 646 43 802 50 938 50 081 53 104 54 761
Financial Management 25 777 26 992 29 252 34 791 39 400 41 245 43 729
Communication Services 3 270 4 430 6 531 6 695 6 106 6 478 6 845
Total 70 190 81 346 91 466 112 884 124 163 130 152 136 358
Change to 2010 budget estimate 1.1% 17.2% 31.8% 62.6% 78.9% 87.5% 97.8%
1 Payable as from 1 April 2014. Remuneration: R1 734 835
Economic classification
Current payments 66 360 77 370 83 713 99 798 116 109 121 656 127 435
Compensation of employees 36 006 40 589 43 941 48 405 54 168 57 961 61 901
Goods and services 30 344 36 775 39 772 51 393 61 941 63 695 65 534
of which:
Audit cost (external) 3 310 3 525 3 287 3 700 3 500 3 693 3 878
Communication 2 517 2 716 3 938 2 986 3 002 3 167 3 324
Computer services 1 613 887 1 679 3 845 4 774 4 385 4 604
Consultants, contractors and special services 1 232 1 329 2 797 3 203 4 203 4 435 4 658
Agency and Support 255 424 448 3 176 5 604 4 912 5 158
Consumables 1 579 2 060 1 966 2 431 2 294 2 420 2 542
Fleet Services 785 1 021 993 1 605 2 053 2 166 2 274
Operating leases 700 782 716 1 064 1 664 1 755 1 843
Property payments 14 943 19 105 17 365 20 683 25 535 26 939 26 941
Travel and subsistence 1 804 2 177 2 595 3 761 4 958 5 231 5 493

Page 63 of 227
Other 1 606 2 749 3 988 4 939 4 354 2 940 4 819
Interest and rent on land 10 6 0 0 0 0 0
Transfers and subsidies to: 1 368 1 379 2 781 6 031 5 363 5 658 5 941
Provinces and municipalities 86 120 131 142 1 1 1
Departmental agencies and accounts 0 1 7 1 0 0 0
Higher education institutions 0 0 0 0 0 0 0
Public corporations and private enterprises 27 0 0 0 0 0 0
Non-profit institutions 228 195 172 150 150 158 166
Households 1 027 1 063 2 471 5 738 5 212 5 499 5 774
Payments for capital assets 2 443 2 565 4 918 7 033 2 691 2 838 2 982
Transport equipment 0 2004 2 327 1 268 1 081 1 139 1 197
Machinery and equipment 2 443 561 2 591 5 724 1 610 1 699 1 765
Software and other intangible assets 0 0 0 41 0 0 0
Payments for financial assets 19 32 54 22 0 0 0
Total 70 190 81 346 91 466 112 884 124 163 130 152 136 358
7.7 Performance and expenditure trends
The budget of Programme 1 increases by 11.7% despite pressures of cost drivers
like municipal services that annually exceed 10% in increased cost and
remuneration increases that exceed the planned for percentage year-on-year.
This includes additional funds received since 2014/15 for funding the new
corporate structure and providing for a total security plan which is currently in a
process of being implemented.
8 Programme 2 – Sustainable Resource Management
8.1 Strategic objective annual targets for 2015/16
The purpose of the Programme is to provide agricultural support service to
farmers in order to ensure sustainable development and management of
agricultural resources.
The purpose of the sub-programmes is as follows:
Engineering Services: To provide engineering support (planning, development,
monitoring and evaluation) with regard to irrigation technology, on-farm
mechanization, value adding, farm structures, resource conservation
management, operation and maintenance of farm equipment, machinery, tools
and implements solutions.
LandCare: To promote the sustainable use and management of natural
agricultural resources.
Land Use Management: To promote the implementation of sustainable use and
management of natural agricultural resources through regulated land use (Act
43 of 1983 and Act 70 of 1970).
Disaster Risk Management: To provide support service to clients with regards to
agricultural disaster risk management.
Strategic objectives are documented per sub-programme
8.2 Sub-Programmes 2.1: Engineering Services

Page 64 of 227
Strategic objective 1 To promote the optimal and sustainable utilisation of the Western
Cape’s land and water resources.
Objective statement Water and land resources are a scarce resource in the Province and
are one of the limiting factors to agricultural development.
Baseline Number of agricultural engineering initiatives and consultations (160)
Justification
The increased demand from all sectors (non-agricultural users
included) for the limited available water will decrease the water
allocation of agriculture in future.
The effect of climate change on agriculture in the Western Cape will
be one of the major determinants of the sustainability of the natural
resource base, the agricultural sector and the competitiveness of its
farmers
Links
The National Water Act (Act 36 of 1998) and the Water Conservation
and Water Demand Management Strategy.
Irrigation industry standards on irrigation water quality and quantity
requirements.
Strategic objective 2 To render an engineering service to increase production and
farming feasibility.
Objective statement
Engineering services provided with regards to mechanisation
planning, on-farm value adding, animal housing, animal handling
and animal waste management and specialist planning and
engineering design service for river bank erosion protection
structures, agriculture can lead to reduced input costs, more
sustainable farming and the conservation of our natural resources.
Baseline 127 projects per year
Justification
The services provided through engineering solutions provided can
reduce input costs, reduce pollution of rivers and streams, increase
sustainability increase the financial viability of the farming
enterprises. It also contributes towards less CO2 emissions both from
tractors and the soil and will contribute towards reducing the
carbon footprint of agriculture.
Links
Water and soil conservation
Sustainable resource utilisation
Reducing carbon footprint
Contribute towards limiting global warming and thus climate
change
Increased economic viability of farming enterprises
Increase in agricultural production and sustainability
Strategic
Objective
performance
indicator
Audited/Actual
performance
Estimated
performance
2014/15
Medium-term targets
2011/12 2012/13 2013/14 2015/16 2016/17 2017/18
1.1 Number of
engineering
services
provided to
support
and
increase
agricultural
production
and
optimise
623 542 681 481 575 575 575

Page 65 of 227
Strategic
Objective
performance
indicator
Audited/Actual
performance
Estimated
performance
2014/15
Medium-term targets
2011/12 2012/13 2013/14 2015/16 2016/17 2017/18
sustainable
natural
resource
use
8.2.1 Risk Management
The following risks have been identified that requires specific actions from the
sub-programme:
Risk 1: There is growing and increased pressure on the finite and limited available
water resources both in terms of the quantity and quality of water for agricultural
use and production.
Response 1: Initiatives to promote the efficient and optimal use of agricultural
water will be expanded in collaboration with water sector partners and
stakeholders by means of infrastructure development, technology development
and information dissemination and liaison efforts to find integrated and
balanced solutions.
Risk 2: Inability to recruit and retain adequately trained technical personnel for
the Department in fields identified as scarce and critical skills. Service delivery
may be negatively impacted as a result of the lack of succession planning due
to skills shortages and limited equitable share funding.
Response 2: Alleviate perception that Agriculture is restricted to and about
farming (primary agriculture) only and thus does not offer other career
opportunities. Increase the number of bursaries offered to engineering students.
Engage all avenues to attract and appoint suitably qualified personnel.
Risk 3: Environmental resource degradation due to increased demands by all
sectors on our natural resources.
Response 3: Apply and advocate LandCare principles in collaboration with
relevant working groups and stakeholders including awareness training of youth
through the Junior LandCare programme.
Sector specific indicators and annual targets for 2015/16 Programme
performance
indicator
Audited/Actual performance Estimated
performance
2014/15
Medium-term targets
2011/12 2012/13 2013/14 2015/16 2016/17 2017/18
1.1 Number of
agricultural
infrastructur
e
established
92 56 87 50 80 80 80
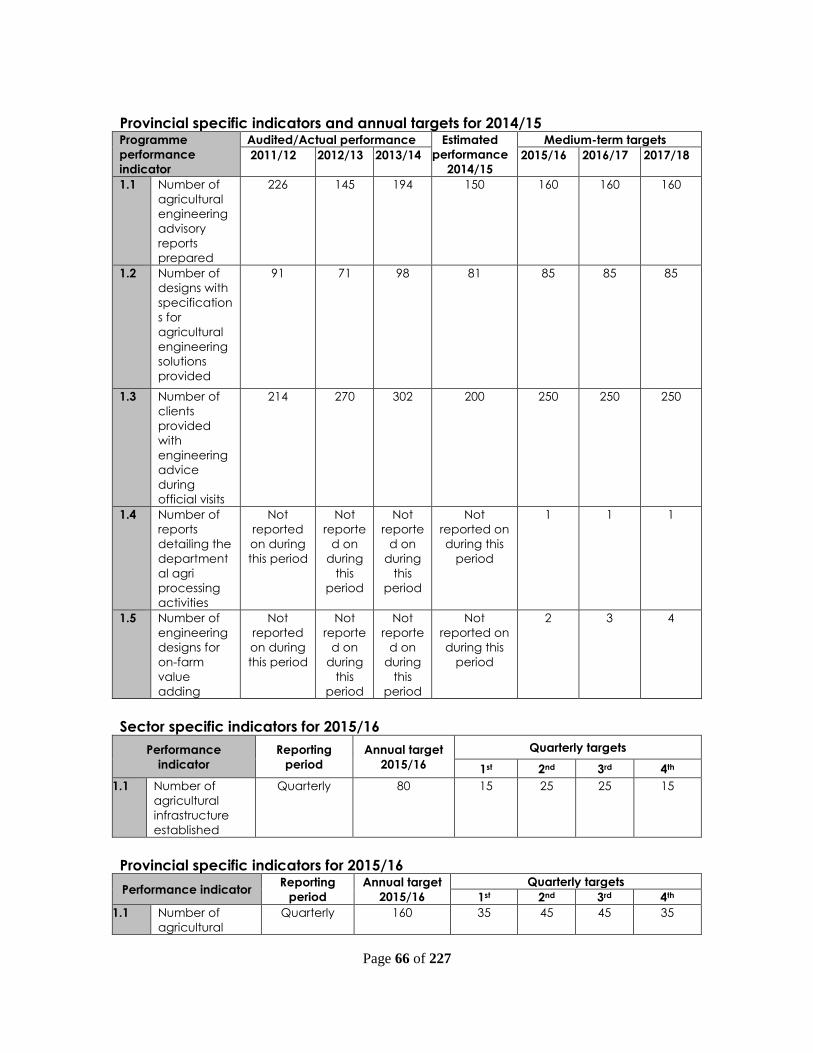
Page 66 of 227
Provincial specific indicators and annual targets for 2014/15 Programme
performance
indicator
Audited/Actual performance Estimated
performance
2014/15
Medium-term targets
2011/12 2012/13 2013/14 2015/16 2016/17 2017/18
1.1 Number of
agricultural
engineering
advisory
reports
prepared
226 145 194 150 160 160 160
1.2 Number of
designs with
specification
s for
agricultural
engineering
solutions
provided
91 71 98 81 85 85 85
1.3 Number of
clients
provided
with
engineering
advice
during
official visits
214 270 302 200 250 250 250
1.4 Number of
reports
detailing the
department
al agri
processing
activities
Not
reported
on during
this period
Not
reporte
d on
during
this
period
Not
reporte
d on
during
this
period
Not
reported on
during this
period
1 1 1
1.5 Number of
engineering
designs for
on-farm
value
adding
Not
reported
on during
this period
Not
reporte
d on
during
this
period
Not
reporte
d on
during
this
period
Not
reported on
during this
period
2 3 4
Sector specific indicators for 2015/16
Performance
indicator
Reporting
period
Annual target
2015/16
Quarterly targets
1st 2nd 3rd 4th
1.1 Number of
agricultural
infrastructure
established
Quarterly 80 15 25 25 15
Provincial specific indicators for 2015/16
Performance indicator Reporting
period
Annual target
2015/16
Quarterly targets
1st 2nd 3rd 4th
1.1 Number of
agricultural
Quarterly 160 35 45 45 35

Page 67 of 227
Performance indicator Reporting
period
Annual target
2015/16
Quarterly targets
1st 2nd 3rd 4th
engineering
advisory reports
prepared
1.2 Number of
designs with
specifications
for agricultural
engineering
solutions
provided
Quarterly 85 15 26 28 16
1.3 Number of
clients provided
with
engineering
advice during
official visits
Quarterly 250 50 75 70 55
1.4 Number of
reports detailing
the
departmental
agri processing
activities
Annually 1 0 0 0 1
1.5 Number of
engineering
designs for on-
farm value
adding
Quarterly 2 0 1 0 1
8.3 Sub-Programmes 2.2: LandCare
Strategic objective Promote the conservation of the natural agricultural resources
Objective statement
The sustainable management and utilisation of our natural resources
requires full time attention and expertise and are promote through the
implementation of LandCare projects. Awareness creation amongst all
land users is required.
Baseline Farmers in the Province but within the specific conditional framework.
Justification
LandCare is a national programme aimed at restoring sustainability to
land and water management in both rural and urban areas. It
encompasses Integrated Sustainable Natural Resource Management
where the primary causes of natural resource decline are recognised
and addressed. LandCare is also aimed at improving biodiversity
planning, management and conservation.
Resource conservation projects are carried out according to the
regulations of the Conservation of Agricultural Resources Act, 43 of
1983. This includes the planning, survey, design and control of works
(including disaster relief works) to prevent the degradation of
agricultural resources and proposing sustainable utilisation of the
resources.
LandCare Area Wide planning is required to ensure holistic planning
greater than farm level in conjunction with other natural resource
service providers

Page 68 of 227
Links
Sustainable natural resource management and utilisation
Conservation of Agricultural Resources Act (Act 43 of 1983), LandCare
Grant Framework connects to the Division of Revenue Act (Annually),
National Environment Management Act (Act 107 of 1998).
Strategic Objective
performance
indicator
Audited/Actual performance Estimated
performance
2014/15
Medium-term targets
2011/12 2012/13 2013/14 2015/16 2016/17 2017/18
1.1 Number of
actions to
promote the
sustainable
use and
management
of natural
agricultural
resources
639 498 322* 322* 522* 522* 522*
*Farm plans previously reported on with LandCare. For 2013/14 and 2014/15 moved from LandCare
to Land Use Management to comply with national indicator prescripts. Back under LandCare from
2015/16 onwards.
8.3.1 Risk Management
The following risks have been identified that requires specific actions from the
sub-programme:
Risk 1: Inability to perform normal day-to-day operations as a result of the
Department having to respond to man-made and natural disasters
Response 1: Unplanned events are dealt with through effective programme
management in order to re-prioritise activities and reallocate highly motivated
officials
Risk 2: Service delivery may be negatively impacted as a result of the
inability to implement succession planning due to skills shortages and limited
equitable share funding.
Response 2: A dedicated official allocated to train and mentor interns and
bursary students at a newly purpose developed training facility at Worcester.
Place emphasis on succession planning.
Risk 3: Environmental resource degradation due to increased demands by all
sectors on our natural resources
Response 3: Apply and advocate LandCare principles in collaboration with
relevant working groups and stakeholders including awareness training of youth
through the Junior LandCare programme.
Sector specific indicators and annual targets for 2015/16 Programme Audited/Actual performance Estimated Medium-term targets

Page 69 of 227
performance
indicator
2011/12 2012/13 2013/14 performance
2014/15
2015/16 2016/17 2017/18
1.1 Number of
hectares
protected /
rehabilitate
d to
improve
agricultural
production
2 110 27 359 29 076 1 000 5 000 5 000 5 000
1.2 Number of
green jobs
created
Not
reported
on
during
this
period
242 145 90 100 100 100
Provincial specific indicators and annual targets for 2015/16 Programme
performance
indicator
Audited/Actual
performance
Estimated
performance
2014/15
Medium-term targets
2011/12 2012/13 2013/14 2015/16 2016/17 2017/18
1.1 Number of
awareness
campaigns
conducted
on LandCare
6 6 6 6 6 6 6
1.2 Number of
capacity
building
exercises
conducted
within
approved
LandCare
projects
6 6 6 6 6 6 6
1.3 Number of
area wide
planning
10 10 10 10 10 10 10
1.4 Number of
protection
works
43 52 47 150 50 50 50
1.5 Number of
drainage
works
30 50 66 50 50 50 50
1.6 Number of
veld
utilisation
works
256 139 248 100 150 150 150
1.7 Number of
EPWP person
days
25 040 55 732 34 287 25 000 25 000 25 000 25 000
1.8 Number of
youth
attending
Junior
LandCare
initiatives
6 338 9 707 8 862 7 000 7 000 7 000 7 000
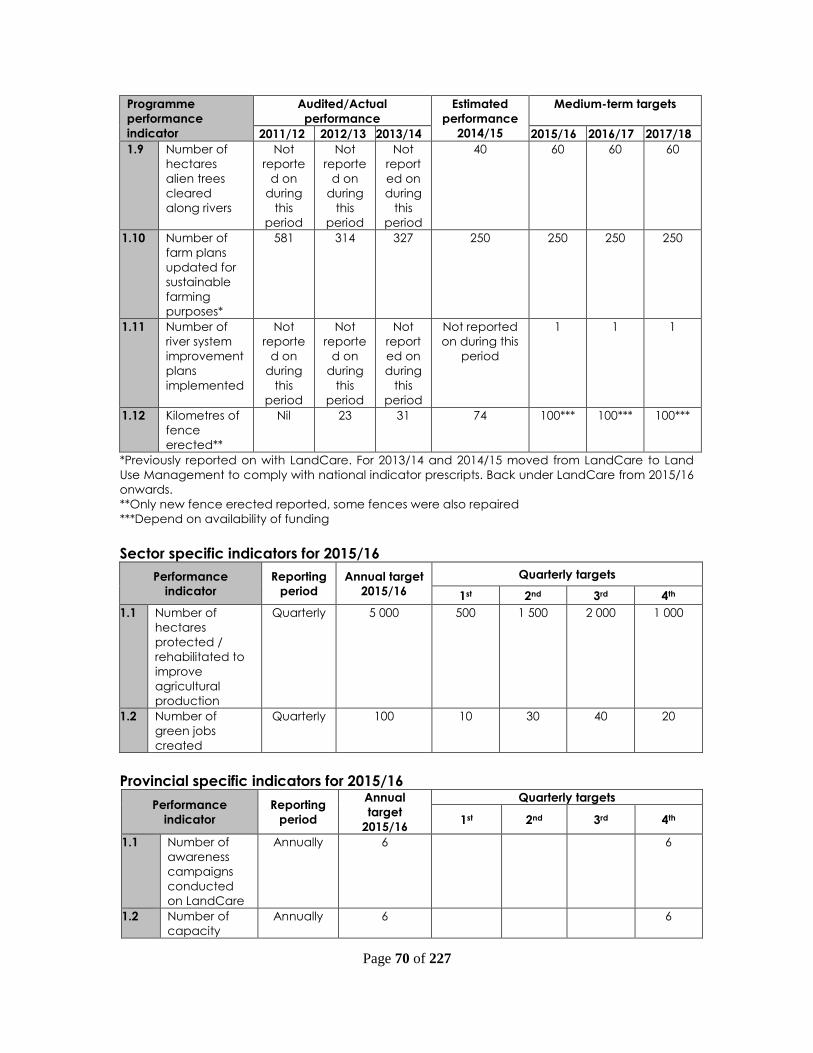
Page 70 of 227
Programme
performance
indicator
Audited/Actual
performance
Estimated
performance
2014/15
Medium-term targets
2011/12 2012/13 2013/14 2015/16 2016/17 2017/18
1.9 Number of
hectares
alien trees
cleared
along rivers
Not
reporte
d on
during
this
period
Not
reporte
d on
during
this
period
Not
report
ed on
during
this
period
40 60 60 60
1.10 Number of
farm plans
updated for
sustainable
farming
purposes*
581 314 327 250 250 250 250
1.11 Number of
river system
improvement
plans
implemented
Not
reporte
d on
during
this
period
Not
reporte
d on
during
this
period
Not
report
ed on
during
this
period
Not reported
on during this
period
1 1 1
1.12 Kilometres of
fence
erected**
Nil 23 31 74 100*** 100*** 100***
*Previously reported on with LandCare. For 2013/14 and 2014/15 moved from LandCare to Land
Use Management to comply with national indicator prescripts. Back under LandCare from 2015/16
onwards.
**Only new fence erected reported, some fences were also repaired
***Depend on availability of funding
Sector specific indicators for 2015/16
Performance
indicator
Reporting
period
Annual target
2015/16
Quarterly targets
1st 2nd 3rd 4th
1.1 Number of
hectares
protected /
rehabilitated to
improve
agricultural
production
Quarterly 5 000 500 1 500 2 000 1 000
1.2 Number of
green jobs
created
Quarterly 100 10 30 40 20
Provincial specific indicators for 2015/16
Performance
indicator
Reporting
period
Annual
target
2015/16
Quarterly targets
1st 2nd 3rd 4th
1.1 Number of
awareness
campaigns
conducted
on LandCare
Annually 6 6
1.2 Number of
capacity
Annually 6 6
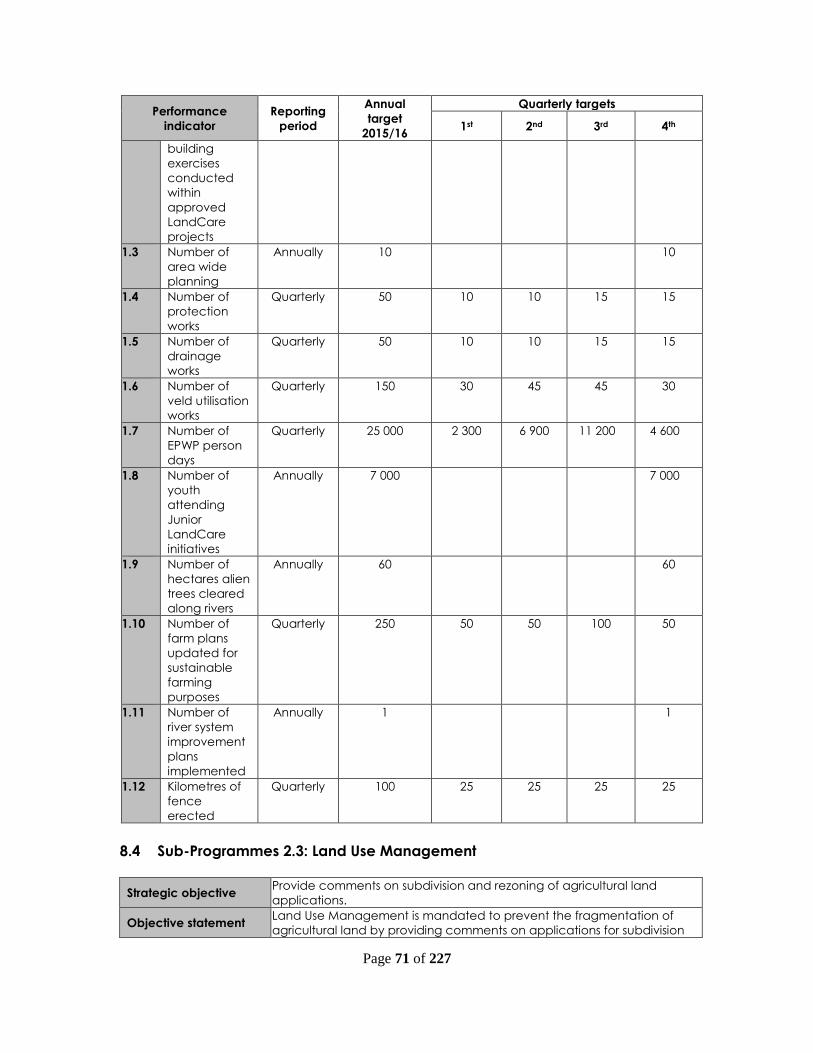
Page 71 of 227
Performance
indicator
Reporting
period
Annual
target
2015/16
Quarterly targets
1st 2nd 3rd 4th
building
exercises
conducted
within
approved
LandCare
projects
1.3 Number of
area wide
planning
Annually 10 10
1.4 Number of
protection
works
Quarterly 50 10 10 15 15
1.5 Number of
drainage
works
Quarterly 50 10 10 15 15
1.6 Number of
veld utilisation
works
Quarterly 150 30 45 45 30
1.7 Number of
EPWP person
days
Quarterly 25 000 2 300 6 900 11 200 4 600
1.8 Number of
youth
attending
Junior
LandCare
initiatives
Annually 7 000 7 000
1.9 Number of
hectares alien
trees cleared
along rivers
Annually 60 60
1.10 Number of
farm plans
updated for
sustainable
farming
purposes
Quarterly 250 50 50 100 50
1.11 Number of
river system
improvement
plans
implemented
Annually 1 1
1.12 Kilometres of
fence
erected
Quarterly 100 25 25 25 25
8.4 Sub-Programmes 2.3: Land Use Management
Strategic objective Provide comments on subdivision and rezoning of agricultural land
applications.
Objective statement Land Use Management is mandated to prevent the fragmentation of
agricultural land by providing comments on applications for subdivision

Page 72 of 227
and rezoning of agricultural land to the relevant authorities such as the
DAFF, DEADP and municipalities on the recommended land use.
Baseline 900 applications per year
Justification The protection of agricultural land and natural resources for productive
purposes, taking into account conservation imperatives.
Links
The mandate is provided through the Sub-Division of Agricultural Land
Act (Act 70 of 1970), the Land Use Planning Ordinance (Ordinance 15
of 1985) and the National Environment Management Act (Act 107 of
1998).
Strategic Objective
performance
indicator
Audited/Actual performance Estimated
performance
2014/15
Medium-term targets
2011/12 2012/13 2013/14 2015/16 2016/17 2017/18
1.1 Number of
regulated land
use actions to
promote the
implementation
of sustainable
use and
management of
natural
agricultural
resources
932 1 070 1 028 900 1 000 1 000 1 000
8.4.1 Risk Management
The following risk has been identified that requires specific actions from the sub-
programme:
Risk 1: Pressure to retain land for agricultural produce versus land for other uses
Response 1: The Programme will continue to lobby against unsustainable land
use practices and to retain high potential agricultural land for agricultural
production.
Risk 2: Service delivery may be negatively impacted as a result of the lack of
succession planning due to skills shortages and limited equitable share funding.
An increased number of applications have to be dealt with annually that require
more staff and funding.
Response 2: A work study will be undertaken to determine the number of posts
and organisational structure required to deal with the increase number of
applications. An official was transferred to this sub-programme to be trained in
order to ensure succession planning.
Risk 3: Lack of suitably trained and experienced candidates to appoint to assist
with the evaluation of applications and Environmental Impact Assessments
Response 3: Experienced person appointed on contract to assist with the
evaluations of applications and EIAs.
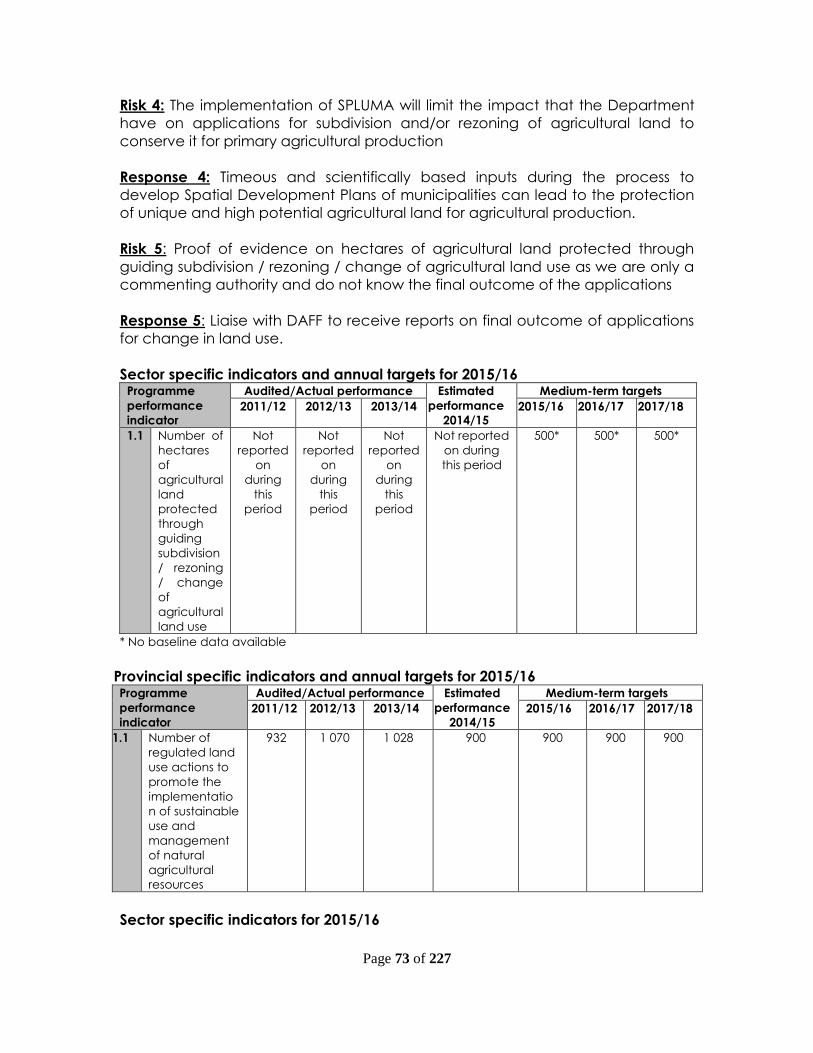
Page 73 of 227
Risk 4: The implementation of SPLUMA will limit the impact that the Department
have on applications for subdivision and/or rezoning of agricultural land to
conserve it for primary agricultural production
Response 4: Timeous and scientifically based inputs during the process to
develop Spatial Development Plans of municipalities can lead to the protection
of unique and high potential agricultural land for agricultural production.
Risk 5: Proof of evidence on hectares of agricultural land protected through
guiding subdivision / rezoning / change of agricultural land use as we are only a
commenting authority and do not know the final outcome of the applications
Response 5: Liaise with DAFF to receive reports on final outcome of applications
for change in land use.
Sector specific indicators and annual targets for 2015/16 Programme
performance
indicator
Audited/Actual performance Estimated
performance
2014/15
Medium-term targets
2011/12 2012/13 2013/14 2015/16 2016/17 2017/18
1.1 Number of
hectares
of
agricultural
land
protected
through
guiding
subdivision
/ rezoning
/ change
of
agricultural
land use
Not
reported
on
during
this
period
Not
reported
on
during
this
period
Not
reported
on
during
this
period
Not reported
on during
this period
500* 500* 500*
* No baseline data available
Provincial specific indicators and annual targets for 2015/16 Programme
performance
indicator
Audited/Actual performance Estimated
performance
2014/15
Medium-term targets
2011/12 2012/13 2013/14 2015/16 2016/17 2017/18
1.1 Number of
regulated land
use actions to
promote the
implementatio
n of sustainable
use and
management
of natural
agricultural
resources
932 1 070 1 028
900 900 900 900
Sector specific indicators for 2015/16
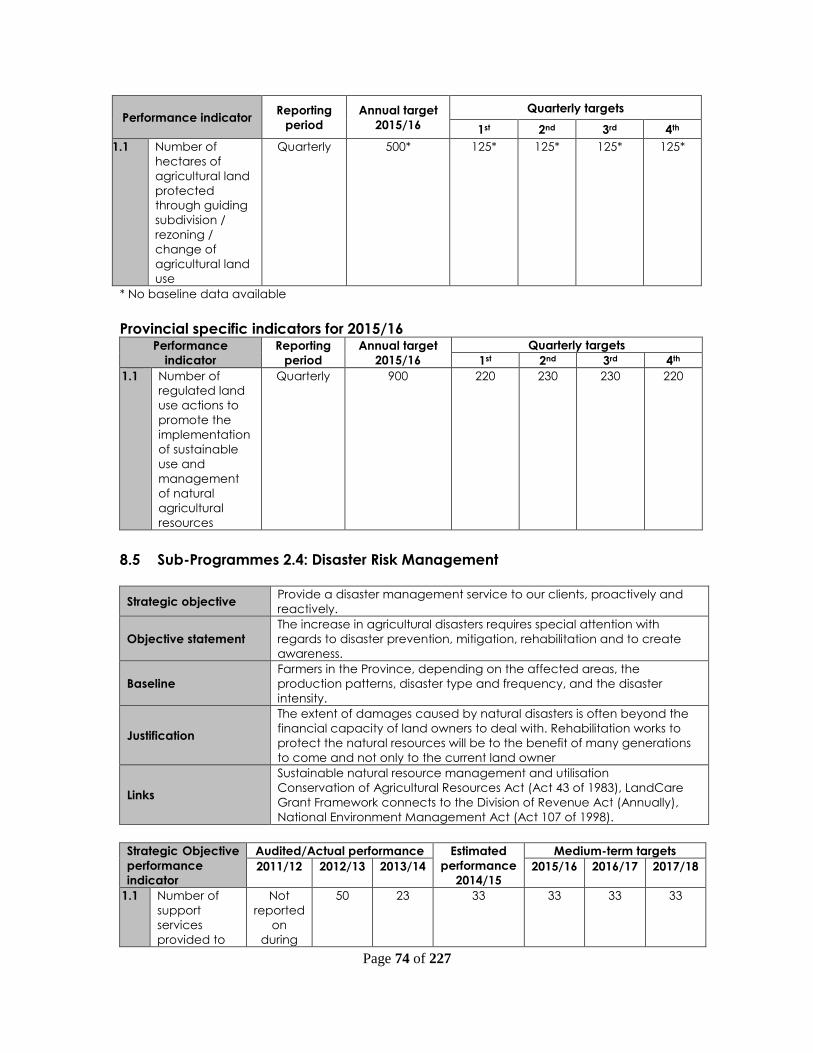
Page 74 of 227
Performance indicator Reporting
period
Annual target
2015/16
Quarterly targets
1st 2nd 3rd 4th
1.1 Number of
hectares of
agricultural land
protected
through guiding
subdivision /
rezoning /
change of
agricultural land
use
Quarterly 500* 125* 125* 125* 125*
* No baseline data available
Provincial specific indicators for 2015/16 Performance
indicator
Reporting
period
Annual target
2015/16
Quarterly targets
1st 2nd 3rd 4th
1.1 Number of
regulated land
use actions to
promote the
implementation
of sustainable
use and
management
of natural
agricultural
resources
Quarterly 900 220 230 230 220
8.5 Sub-Programmes 2.4: Disaster Risk Management
Strategic objective Provide a disaster management service to our clients, proactively and
reactively.
Objective statement
The increase in agricultural disasters requires special attention with
regards to disaster prevention, mitigation, rehabilitation and to create
awareness.
Baseline
Farmers in the Province, depending on the affected areas, the
production patterns, disaster type and frequency, and the disaster
intensity.
Justification
The extent of damages caused by natural disasters is often beyond the
financial capacity of land owners to deal with. Rehabilitation works to
protect the natural resources will be to the benefit of many generations
to come and not only to the current land owner
Links
Sustainable natural resource management and utilisation
Conservation of Agricultural Resources Act (Act 43 of 1983), LandCare
Grant Framework connects to the Division of Revenue Act (Annually),
National Environment Management Act (Act 107 of 1998).
Strategic Objective
performance
indicator
Audited/Actual performance Estimated
performance
2014/15
Medium-term targets
2011/12 2012/13 2013/14 2015/16 2016/17 2017/18
1.1 Number of
support
services
provided to
Not
reported
on
during
50 23 33 33 33 33

Page 75 of 227
Strategic Objective
performance
indicator
Audited/Actual performance Estimated
performance
2014/15
Medium-term targets
2011/12 2012/13 2013/14 2015/16 2016/17 2017/18
clients with
regards to
agricultural
disaster risk
management
this
period
8.5.1 Risk Management
The following risks have been identified that requires specific actions from the
sub-programme:
Risk 1: Lack of suitably trained and experienced candidates to appoint to assist
with the implementation of disaster recovery work and financial assistance after
natural disasters
Response1: Providing support from the sub-programmes: Engineering Services
and LandCare.
Sector specific indicators and annual targets for 2015/16 Programme
performance
indicator
Audited/Actual performance Estimated
performance
2014/15
Medium-term targets
2011/12 2012/13 2013/14 2015/16 2016/17 2017/18
1.1 Number of
disaster
relief
schemes
managed
3 3 3 2 3 3 3
1.2 *Number of
disaster risk
reduction
programmes
managed
Not
reported
on
during
this
period
Not
reported
on
during
this
period
Not
reported
on
during
this
period
Not reported
on during this
period
1 1 1
*Depend on funding made available from DAFF
Provincial specific indicators and annual targets for 2015/16 Programme
performance
indicator
Audited/Actual performance Estimated
performance
2014/15
Medium-term targets
2011/12 2012/13 2013/14 2015/16 2016/17 2017/18
1.1 Number of
early
warning
advisory
reports
issued
Not
reported
on
during
this
period
48 58 40 40 40 40
Sector specific indicators for 2015/16
Performance
indicator
Reporting
period
Annual target
2015/16
Quarterly targets
1st 2nd 3rd 4th

Page 76 of 227
Performance
indicator
Reporting
period
Annual target
2015/16
Quarterly targets
1st 2nd 3rd 4th
1.1 Number of
disaster relief
schemes
managed
Annually 3 3
1.2 Number of
disaster risk
reduction
programmes
managed
Quarterly 1 1
Provincial specific indicators for 2015/16 Performance
indicator
Reporting
period
Annual target
2015/16
Quarterly targets
1st 2nd 3rd 4th
1.1 Number of early
warning
advisory reports
issued
Quarterly 40 7 13 13 7
8.6 Reconciling performance targets with the Budget and MTEF
Expenditure estimates Table 4: Programme: Sustainable Resource Management Sub-programme Expenditure outcome Adjusted
appropriation
Medium-term
expenditure estimate
R thousand 2011/12 2012/13 2013/14 2014/15 2015/16 2016/17 2017/18
Engineering Services 13 450 16 629 16 083 16 220 15 811 16 840 17 185
Land Care 22 519 31 840 27 694 32 240 31 903 30 886 32 845
Land Use Management
Disaster Risk Management
595 760
20
853
2441
1 012
185 393
1 248
26 250
1 332
42 398
1 419
41 647
Total 36 564 49 249 47 071 234 865 75 212 91 456 93 096
Change to 2010 budget estimate (57.7%) (43.1%) (45.6%) 169.0% (13.1%) 5.7% 7.6%
Economic classification
Current payments 35 348 47 600 33 357 37 362 37 773 39 014 40 927
Compensation of employees 19 408 21 728 23 417 25 620 27 743 29 684 31 702
Goods and services 15 940 25 872 9 940 11 742 10 030 9 330 9 225
of which:
Communication 370 2 526 3 281 2 036 1 197 1 264 1 328
Computer services 252 236 284 274 132 139 146
Consultants, contractors and special services 3 747 3 284 1 095 2 847 2 854 2 511 1 387
Consumables 1 915 6 544 265 510 370 390 409
Fleet services 652 724 773 888 830 875 1 597
Operating leases 91 112 133 168 187 197 207
Operating payments 4 132 6 816 283 541 235 248 261
Travel and subsistence 2 615 3 252 2 870 3 380 3 352 2 786 2 925
Venues and facilities 705 899 364 70 95 100 105
Other 1 461 1 479 592 1 028 778 820 860
Interest and rent on land 0 0 0 0 0 0 0
Transfers and subsidies to: 2 459 12 298 195 910 35 988 50 908 50 558
Provinces and municipalities 1 1 79 0 1 1 1
Departmental agencies and accounts 0 0 11 0 0 0 0
Public corporations and private enterprises 0 450 12 050 195 910 35 987 50 907 50 557
Households 1 8 158 0 0 0 0

Page 77 of 227
Payments for capital assets 1 205 1 081 1 328 1 593 1 451 1 534 1 611
Buildings and fixed structures 0 0 0 0 125 132 139
Machinery and equipment 1 151 919 1 328 1 593 1 326 1 402 1 472
Software and other intangible assets 54 162 0 0 0 0 0
Payments for financial assets 9 109 88 0 0 0 0
Total 36 564 49 249 47 071 234 865 75 212 91 456 93 096
8.7 Performance and expenditure trends
The changes in the figures of the Department, and in particular this Programme,
are warped by regular payments for disasters of which the last amounted to R55
million in 2010/11 for drought and again R183 million in 2014/15 and R4 million in
2015/16. This specifically is the reason why the annual figures of Programme 2:
SRM does not show any logical trend since all disaster funds are disbursed
through this Programme.
This Programme is the one most affected by the problem of scarce skills and only
four professional engineers are currently in employment.
9 Programme 3 – Farmer Support and Development
9.1 Strategic objective annual targets for 2015/16
The purpose of the Programme is to provide support to farmers through
agricultural development programmes.
The purpose of the sub-programmes is as follows:
Farmer Settlement and Development: To facilitate, coordinate and provide
support to smallholder and commercial farmers through sustainable agricultural
development within agrarian reform initiatives.
Extension and Advisory Services: To provide extension and advisory services to
farmers.
Food Security: To support, advise and coordinate the implementation of pillar
one of the Integrated Food Security Strategy of South Africa (IFSS).
Casidra SOC Ltd: To support the Department with project implementation and
state farm management.
Strategic objectives are documented per sub-programme.
9.2 Sub-Programmes 3.1: Farmer Settlement and Development
Strategic objective Land reform facilitated with agricultural support.
Objective statement To provide support to smallholder and commercial producers for
sustainable agricultural development
Baseline
The Department completed a performance evaluation of the
agricultural land reform projects supported between 1 April 2009 and
31 March 2013. The evaluation was based on the following critical
success factors: financial record keeping; re-investment opportunities;

Page 78 of 227
tax and labour law compliance; quality of business plan and
availability of secure markets for produce. The study revealed a 62%
success rate from the population size of 246 projects with a sample size
of 153 projects.
Justification
Misalignment between land delivery and agricultural support due to
mandate issues remains a challenge for the land reform programme
and the Department would need to be proactive in dealing with this
challenge. Furthermore, the Western Cape Land Reform Summit, held
on the 22nd September 2014, resolved on 6 themes that the
Department will be addressing going forward. These themes are:
financial support solution, market access, land audit, improvement of
extension services, implementation of land reform projects and
establishment of the DLCs. Accordingly, the DRDLR established DLCs in
all districts, to identify and allocate a minimum of 20% farming land
(strategically located agricultural land) in areas that is easily
acquirable and which does not cause distortions in the land market.
The Department will thus, play an active role within the DLCs across the
Province.
Links
Provision of post settlement support will ultimately increase production
and sustainability of land reform projects and therefore, contribute to
rural development and job creation thus, contributing to the creation
of one million jobs as outlined within the NDP, i.e. 205 000 jobs for the
Western Cape.
Strategic
Objective
performance
indicator
Audited/Actual performance Estimated
performance
2014/15
Medium-term targets
2011/12 2012/13 2013/14 2015/16 2016/17 2017/18
1.1 Number of
farm
assessments
and farm
plans
completed
for
smallholder
and
commercial
farmers
within the
agrarian
reform
initiatives.
Not
reported
on
during
this
period
Not
reported
on
during
this
period
Not
reported
on
during
this
period
105 229 235 248
9.2.1 Risk Management
Risk 1: Misalignment between land delivery and agricultural support remains a
challenge.
Response 1: The Department will seek to strengthen links with DRDLR through the
establishment of coordination structures.
Risk 2: Agricultural expert advice on land acquisition is not always acted upon by
the DRDLR, thus resulting in unworkable land delivered.

Page 79 of 227
Response 2: The Department will participate in all the DLCs in the Province and
provide farm assessments reports when required to do so. This will be
championed by the Director, responsible for land reform.
Risk 3: Limited access to private funding by land reform beneficiaries
Response 3: The Department will engage commercial banks with a view to
encourage a mix between grants and loans for farmers, as way of building their
capacity to handle credit.
Sector specific indicators and annual targets for 2015/16 Programme
performance
indicator
Audited/Actual performance Estimated
performance
2014/15
Medium-term targets
2011/12 2012/13 2013/14 2015/16 2016/17 2017/18
1.1 Number of
smallholder
producers
receiving
support
Not
reported
on
during
this
period
Not
reported
on
during
this
period
55 73 80 80 84
Provincial specific indicators and annual targets for 2015/16 Programme
performance
indicator
Audited/Actual performance Estimated
performance
2014/15
Medium-term targets
2011/12 2012/13 2013/14 2015/16 2016/17 2017/18
1.1 Number of
farm plans
completed
Not
reported
on
during
this
period
Not
reported
on
during
this
period
96 105 115 121 127
1.2 Number of
commercial
farmers
supported
Not
reported
on
during
this
period
Not
reported
on
during
this
period
29 32 32 32 34
1.3 Number of
farm
assessments
completed
Not
reported
on
during
this
period
Not
reported
on
during
this
period
117 126 114 114 121
1.4 Number of
district land
reform
summit
facilitated
Not
reported
on
during
this
period
Not
reported
on
during
this
period
Not
reported
on
during
this
period
0 1 1 1
1.5 Number of
District Land
Committee
meetings
Not
reported
on
during
Not
reported
on
during
Not
reported
on
during
0 12 12 12

Page 80 of 227
Programme
performance
indicator
Audited/Actual performance Estimated
performance
2014/15
Medium-term targets
2011/12 2012/13 2013/14 2015/16 2016/17 2017/18
attended this
period
this
period
this
period
Sector specific indicators for 2015/16
Performance
indicator
Reporting
period
Annual target
2015/16
Quarterly targets
1st 2nd 3rd 4th
1.1 Number of
smallholder
producers
receiving
support
Quarterly 80 8 32 32 8
Provincial specific indicators for 2015/16 Performance
indicator
Reporting
period
Annual target
2015/16
Quarterly targets
1st 2nd 3rd 4th
1.1 Number of farm
plans
completed
Quarterly 115 17 40 40 18
1.2 Number of
commercial
farmers
supported
Quarterly 32 3 13 13 3
1.3 Number of farm
assessments
completed
Quarterly 114 17 40 40 17
1.4. Number of
district land
reform summit
facilitated
Annually 1 0 0 0 1
1.5 Number of
District Land
Committee
meetings
attended.
Annually 12 0 0 0 12
9.3 Sub-Programmes 3.2: Extension and Advisory Services
Strategic objective
To ensure farms become successful business enterprises by increasing
the production of agricultural produce for the domestic and
international markets.
Objective statement
To provide extension and advisory services to farmers.
This is mainly delivered by ensuring the following:
a) The training and up-skilling of extension staff; and
b) To provide extension staff with all the tools to enable them to
deliver the best possible advice and services to clients.
Secondly, to ensure sound interaction with commodity groups to
ensure the implementation of a successful mentorship system that

Page 81 of 227
interlinks with the Department’s extension.
Baseline
The sub-programme: Extension and Advisory Services delivered during
the 2013/14 financial year: 86 demonstrations, 31 farmer’s days and 4
648 farmers were supported with advice to build capacity. The
Programme has 81 extension personnel across the Department’s 8
districts. The use of the smart pen helps with the monitoring of quality of
services delivered to farmers.
The Programme will re-introduce the BIG 5 (extension capacity
building programme) in the coming year, in response to the
challenges raised by the land reform evaluation report
Justification
The success of land reform farmers is tightly linked to the quality of
extension services; therefore, regular extension block periods remain a
critical platform to strengthen extension personnel. The Department
will continue with its commodity approach to facilitate access to
mentorship support and markets by smallholder farmers, thus,
contribute to job creation as outlined in the NDP.
Links Extension and advisory services is delivered in partnership with
commodity formations through the commodity approach.
Strategic
Objective
performance
indicator
Audited/Actual performance Estimated
performance
2014/15
Medium-term targets
2011/12 2012/13 2013/14 2015/16 2016/17 2017/18
1.1 Number of
site visits to
subsistence,
smallholder
and
commercial
farmers to
deliver
extension
and
advisory
services
Not
reported
on
during
this
period
Not
reported
on
during
this
period
4 648 4 200 4 600 4 600 4 600
9.3.1 Risk Management
Risk 1: Threat of repossession of land reform farms.
Response 1: The Department will seek the involvement of commercial banks
within the delivery structures, i.e. CPACs and DPAC to mitigate this risk.
Risk 2: Lack of business skills among land reform beneficiaries
Response 2: Skills audit process will be strengthened to ensure a more accurate
determination of skills gap for effective training intervention.
Risk 3: The lack of business network and markets
Response 3: Liaise with the Programme: AES to link projects to markets, through
the Market Access Programme.

Page 82 of 227
Risk 4: Over-reliance on conditional grants for farmer support – this is problematic
given that conditional grants may not be sustainable in the future.
Response 4: The Department will raise this challenge with Provincial Treasury to
start building ‘agriculture money’ for farmer support.
Sector specific indicators and annual targets for 2015/16 Programme
performance
indicator
Audited/Actual performance Estimated
performance
2014/15
Medium-term targets
2011/12 2012/13 2013/14 2015/16 2016/17 2017/18
1.1 Number of
smallholder
producers
supported
with
agricultural
advice
Not
reported
on
during
this
period
Not
reported
on
during
this
period
1 866 1 400 1 800
1 800 1 800
Provincial specific indicators and annual targets for 2014/15 Programme
performance
indicator
Audited/Actual
performance
Estimated
performance
2014/15
Medium-term targets
2011/12 2012/13 2013/14 2015/16 2016/17 2017/18
1.1 Number of
projects
supported
through
mentorship
Not
reporte
d on
during
this
period
Not
reporte
d on
during
this
period
44 30 30 30 34
1.2 Number of
agricultural
businesses
skills audited
Not
reporte
d on
during
this
period
Not
reporte
d on
during
this
period
60 60 112
112
118
1.3 Number of
farmers
supported
with advice
Not
reporte
d on
during
this
period
Not
reporte
d on
during
this
period
4 648 4 200 4 600 4 600 4 600
1.4 Number of
agricultural
demonstratio
ns facilitated
Not
reporte
d on
during
this
period
Not
reporte
d on
during
this
period
86 66 66 70 70
1.5 Number of
farmers’ days
held
Not
reporte
d on
during
this
period
Not
reporte
d on
during
this
period
31 27 27 30 30
1.6 Number of
commodity
Not
reporte
Not
reporte
10 10 10 10 10
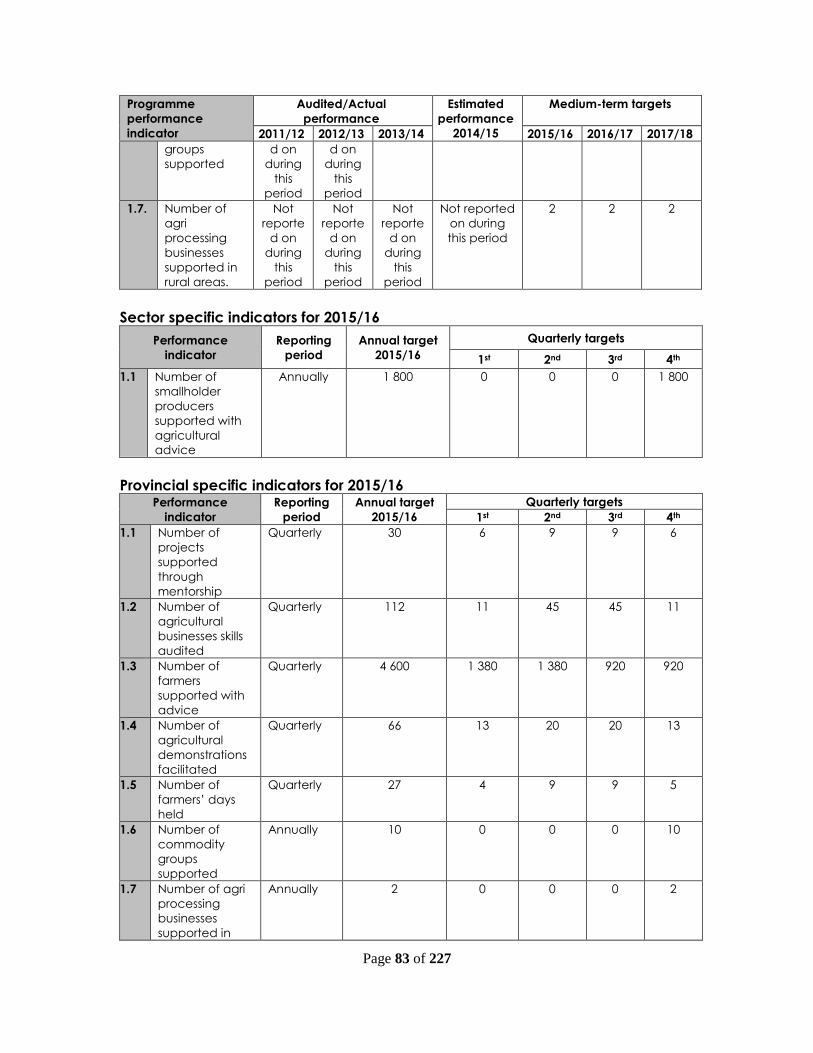
Page 83 of 227
Programme
performance
indicator
Audited/Actual
performance
Estimated
performance
2014/15
Medium-term targets
2011/12 2012/13 2013/14 2015/16 2016/17 2017/18
groups
supported
d on
during
this
period
d on
during
this
period
1.7. Number of
agri
processing
businesses
supported in
rural areas.
Not
reporte
d on
during
this
period
Not
reporte
d on
during
this
period
Not
reporte
d on
during
this
period
Not reported
on during
this period
2 2 2
Sector specific indicators for 2015/16
Performance
indicator
Reporting
period
Annual target
2015/16
Quarterly targets
1st 2nd 3rd 4th
1.1 Number of
smallholder
producers
supported with
agricultural
advice
Annually 1 800 0 0 0 1 800
Provincial specific indicators for 2015/16 Performance
indicator
Reporting
period
Annual target
2015/16
Quarterly targets
1st 2nd 3rd 4th
1.1 Number of
projects
supported
through
mentorship
Quarterly 30 6 9 9 6
1.2 Number of
agricultural
businesses skills
audited
Quarterly 112
11 45 45 11
1.3 Number of
farmers
supported with
advice
Quarterly 4 600 1 380 1 380 920 920
1.4 Number of
agricultural
demonstrations
facilitated
Quarterly 66 13 20 20 13
1.5 Number of
farmers’ days
held
Quarterly 27 4 9 9 5
1.6 Number of
commodity
groups
supported
Annually 10 0 0 0 10
1.7 Number of agri
processing
businesses
supported in
Annually 2 0 0 0 2
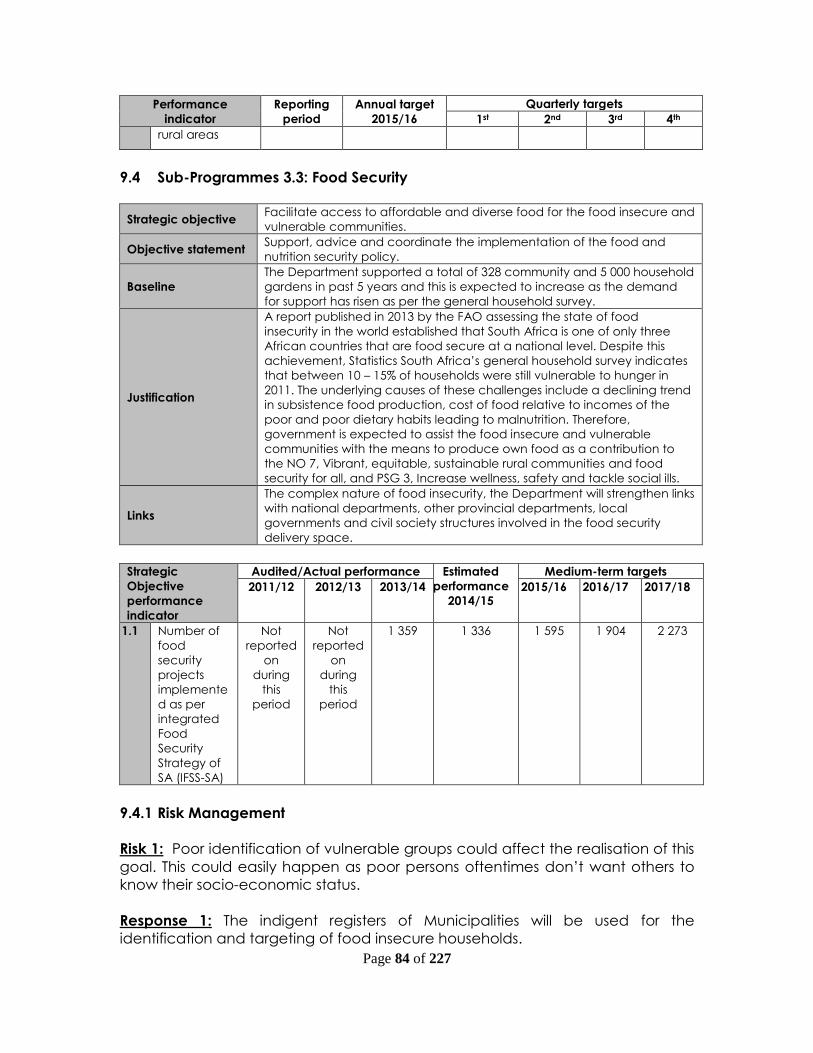
Page 84 of 227
Performance
indicator
Reporting
period
Annual target
2015/16
Quarterly targets
1st 2nd 3rd 4th
rural areas
9.4 Sub-Programmes 3.3: Food Security
Strategic objective Facilitate access to affordable and diverse food for the food insecure and
vulnerable communities.
Objective statement Support, advice and coordinate the implementation of the food and
nutrition security policy.
Baseline
The Department supported a total of 328 community and 5 000 household
gardens in past 5 years and this is expected to increase as the demand
for support has risen as per the general household survey.
Justification
A report published in 2013 by the FAO assessing the state of food
insecurity in the world established that South Africa is one of only three
African countries that are food secure at a national level. Despite this
achievement, Statistics South Africa’s general household survey indicates
that between 10 – 15% of households were still vulnerable to hunger in
2011. The underlying causes of these challenges include a declining trend
in subsistence food production, cost of food relative to incomes of the
poor and poor dietary habits leading to malnutrition. Therefore,
government is expected to assist the food insecure and vulnerable
communities with the means to produce own food as a contribution to
the NO 7, Vibrant, equitable, sustainable rural communities and food
security for all, and PSG 3, Increase wellness, safety and tackle social ills.
Links
The complex nature of food insecurity, the Department will strengthen links
with national departments, other provincial departments, local
governments and civil society structures involved in the food security
delivery space.
Strategic
Objective
performance
indicator
Audited/Actual performance Estimated
performance
2014/15
Medium-term targets
2011/12 2012/13 2013/14 2015/16 2016/17 2017/18
1.1 Number of
food
security
projects
implemente
d as per
integrated
Food
Security
Strategy of
SA (IFSS-SA)
Not
reported
on
during
this
period
Not
reported
on
during
this
period
1 359 1 336 1 595 1 904 2 273
9.4.1 Risk Management
Risk 1: Poor identification of vulnerable groups could affect the realisation of this
goal. This could easily happen as poor persons oftentimes don’t want others to
know their socio-economic status.
Response 1: The indigent registers of Municipalities will be used for the
identification and targeting of food insecure households.

Page 85 of 227
Risk 2: Access to land is a major problem, mainly in urban settings.
Response 2: Municipalities will be engaged through the departmental structures
including IDP process to make land available for the establishment of food
gardens.
Risk 3: Abandonment of projects - there is a tendency of abandoning projects
by beneficiaries as they seek to diversity their livelihood activities.
Response 3: The Department will strengthen collaboration with municipalities
through accessing indigent registers and ensuring that ‘correct’ candidates are
reached.
Develop self-contained, self-managed and more sustainable production systems
to lessen the rate of abandonment, whilst minimising the risk associated with
agriculture.
Risk 4: Cost of water, reliance on municipal water could affect the sustainability
of the food security initiatives.
Response 4: The Department will investigate the possibility of using grey water
and black water for irrigation purposes.
Sector specific indicators and annual targets for 2015/16 Programme
performance
indicator
Audited/Actual performance Estimated
performance
2014/15
Medium-term targets
2011/12 2012/13 2013/14 2015/16 2016/17 2017/18
1.1 Number of
households
benefiting
from
agricultural
food
security
initiatives
Not
reported
on
during
this
period
Not
reported
on
during
this
period
1 359 1 243 1 492 1 790 2 147
1.2 Number of
hectares
cultivated
for food
production
in
communal
areas and
land
reform
projects
Not
reported
on
during
this
period
Not
reported
on
during
this
period
Not
reported
on
during
this
period
Not reported
on during this
period
400 440 440
Provincial specific indicators and annual targets for 2015/16 Programme
performance
indicator
Audited/Actual performance Estimated
performance
2014/15
Medium-term targets
2011/12 2012/13 2013/14 2015/16 2016/17 2017/18

Page 86 of 227
Programme
performance
indicator
Audited/Actual performance Estimated
performance
2014/15
Medium-term targets
2011/12 2012/13 2013/14 2015/16 2016/17 2017/18
1.1 Number of
community
food security
projects
supported
Not
reported
on
during
this
period
Not
reported
on
during
this
period
93 77 85 94 104
1.2 Number of
participants
in
community
food security
projects
Not
reported
on
during
this
period
Not
reported
on
during
this
period
1 213 770 510
564
624
1.3 Number of
school food
gardens
supported
Not
reported
on
during
this
period
Not
reported
on
during
this
period
35 16 18 20 22
1.4 Number of
*participants
in school
food
gardens
Not
reported
on
during
this
period
Not
reported
on
during
this
period
189 160 108
120
132
1.5 Number of
food security
awareness
campaigns
held
Not
reported
on
during
this
period
Not
reported
on
during
this
period
1 1 1 1 1
*Participants refer to those working in the project and not the learners.
Sector specific indicators for 2015/16
Performance
indicator
Reporting
period
Annual target
2015/16
Quarterly targets
1st 2nd 3rd 4th
1.1 Number of
households
benefiting from
agricultural
food security
initiatives
Quarterly 1 492 0 746 448 298
1.2 Number of
hectares
cultivated for
food
production in
communal
areas and land
reform projects
Quarterly 400 60 200 120 20
Provincial specific indicators for 2015/16 Performance Reporting Annual target Quarterly targets

Page 87 of 227
indicator period 2015/16 1st 2nd 3rd 4th
1.1 Number of
community
food security
projects
supported
Quarterly 85 0 43 26 16
1.2 Number of
participants in
community
food security
projects
Quarterly 510 0 258 156 96
1.3 Number of
school food
gardens
supported
Quarterly 18 0 9 5 4
1.4 Number of
*participants in
school food
gardens
Quarterly 108 0 54 30 24
1.5 Number of food
security
awareness
campaigns held
Annually 1 0 0 0 1
*Participants refer to those working in the project and not the learners.
9.5 Sub-Programmes 3.4: Casidra SOC Ltd
Strategic objective To support the Department with project management and state farm
management
Objective statement
Provide infrastructure to farmers to improve production, support
smallholder farmers and poor households to improve their livelihoods and
manage state owned farms.
Baseline
During the 2013/14 financial year, Casidra was tasked by the
Department with the implementation of 126 infrastructure, production
inputs and professional agricultural services and a further 88 community
food gardens and 851 household gardens. Within the grant framework it
is foreseen that Casidra will continue to assist the Department with
implementation of projects of this nature. Disaster management funding
will also be managed by Casidra, but the extent of that is not
predictable.
Justification
It has been proven that through this assistance by Casidra in
procurement and project management, the Departmental officials can
focus on extension, monitoring and evaluation and contribute to faster
and more efficient delivery systems thus creating an enabling
environment.
Links
Links exist with other provincial and national departments to coordinate
efforts and contributions towards agrarian development. Structures for
coordinated assistance are created and managed that involve the
agricultural commodity partners.
Strategic
Objective
performance
indicator
Audited/Actual performance Estimated
performance
2014/15
Medium-term targets
2011/12 2012/13 2013/14 2015/16 2016/17 2017/18
1.1 Number of
agricultural
Not
reported
Not
reported
Not
reported
48 48 50 50
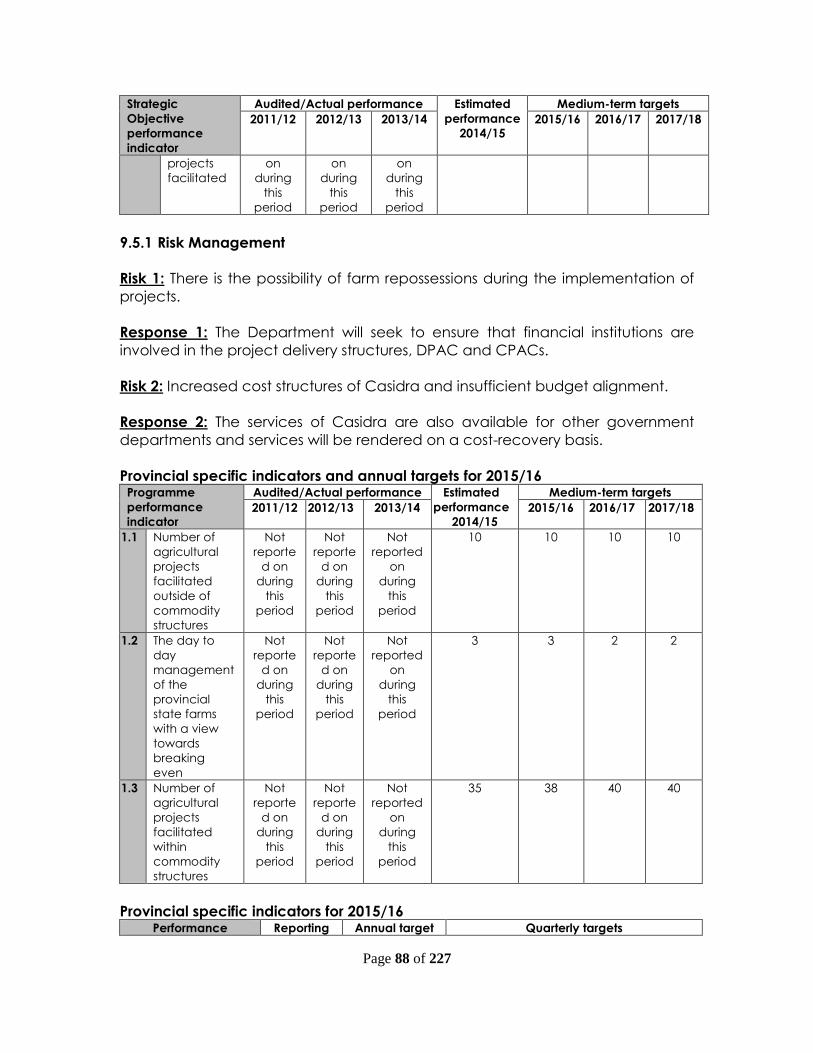
Page 88 of 227
Strategic
Objective
performance
indicator
Audited/Actual performance Estimated
performance
2014/15
Medium-term targets
2011/12 2012/13 2013/14 2015/16 2016/17 2017/18
projects
facilitated
on
during
this
period
on
during
this
period
on
during
this
period
9.5.1 Risk Management
Risk 1: There is the possibility of farm repossessions during the implementation of
projects.
Response 1: The Department will seek to ensure that financial institutions are
involved in the project delivery structures, DPAC and CPACs.
Risk 2: Increased cost structures of Casidra and insufficient budget alignment.
Response 2: The services of Casidra are also available for other government
departments and services will be rendered on a cost-recovery basis.
Provincial specific indicators and annual targets for 2015/16 Programme
performance
indicator
Audited/Actual performance Estimated
performance
2014/15
Medium-term targets
2011/12 2012/13 2013/14 2015/16 2016/17 2017/18
1.1 Number of
agricultural
projects
facilitated
outside of
commodity
structures
Not
reporte
d on
during
this
period
Not
reporte
d on
during
this
period
Not
reported
on
during
this
period
10 10 10 10
1.2 The day to
day
management
of the
provincial
state farms
with a view
towards
breaking
even
Not
reporte
d on
during
this
period
Not
reporte
d on
during
this
period
Not
reported
on
during
this
period
3 3 2 2
1.3 Number of
agricultural
projects
facilitated
within
commodity
structures
Not
reporte
d on
during
this
period
Not
reporte
d on
during
this
period
Not
reported
on
during
this
period
35 38 40 40
Provincial specific indicators for 2015/16 Performance Reporting Annual target Quarterly targets
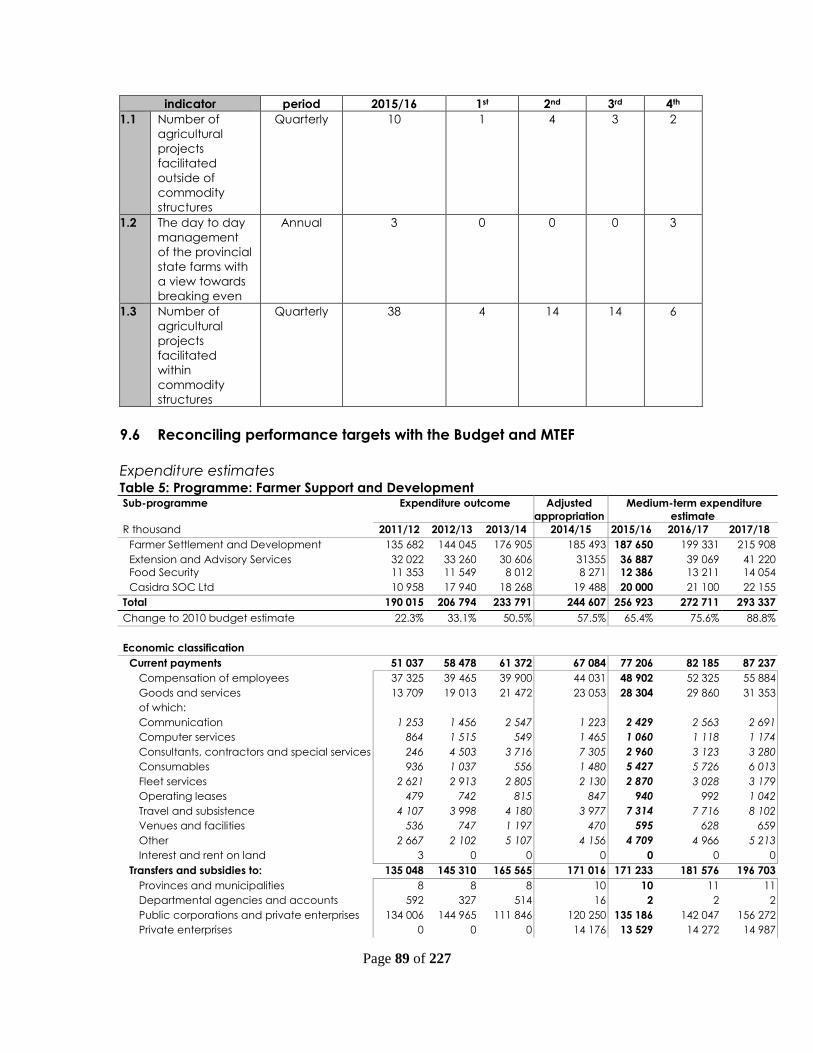
Page 89 of 227
indicator period 2015/16 1st 2nd 3rd 4th
1.1 Number of
agricultural
projects
facilitated
outside of
commodity
structures
Quarterly 10 1 4 3 2
1.2 The day to day
management
of the provincial
state farms with
a view towards
breaking even
Annual 3 0 0 0 3
1.3 Number of
agricultural
projects
facilitated
within
commodity
structures
Quarterly 38 4 14 14 6
9.6 Reconciling performance targets with the Budget and MTEF
Expenditure estimates Table 5: Programme: Farmer Support and Development Sub-programme Expenditure outcome Adjusted
appropriation
Medium-term expenditure
estimate
R thousand 2011/12 2012/13 2013/14 2014/15 2015/16 2016/17 2017/18
Farmer Settlement and Development 135 682 144 045 176 905 185 493 187 650 199 331 215 908
Extension and Advisory Services 32 022 33 260 30 606 31355 36 887 39 069 41 220
Food Security 11 353 11 549 8 012 8 271 12 386 13 211 14 054
Casidra SOC Ltd 10 958 17 940 18 268 19 488 20 000 21 100 22 155
Total 190 015 206 794 233 791 244 607 256 923 272 711 293 337
Change to 2010 budget estimate 22.3% 33.1% 50.5% 57.5% 65.4% 75.6% 88.8%
Economic classification
Current payments 51 037 58 478 61 372 67 084 77 206 82 185 87 237
Compensation of employees 37 325 39 465 39 900 44 031 48 902 52 325 55 884
Goods and services 13 709 19 013 21 472 23 053 28 304 29 860 31 353
of which:
Communication 1 253 1 456 2 547 1 223 2 429 2 563 2 691
Computer services 864 1 515 549 1 465 1 060 1 118 1 174
Consultants, contractors and special services 246 4 503 3 716 7 305 2 960 3 123 3 280
Consumables 936 1 037 556 1 480 5 427 5 726 6 013
Fleet services 2 621 2 913 2 805 2 130 2 870 3 028 3 179
Operating leases 479 742 815 847 940 992 1 042
Travel and subsistence 4 107 3 998 4 180 3 977 7 314 7 716 8 102
Venues and facilities 536 747 1 197 470 595 628 659
Other 2 667 2 102 5 107 4 156 4 709 4 966 5 213
Interest and rent on land 3 0 0 0 0 0 0
Transfers and subsidies to: 135 048 145 310 165 565 171 016 171 233 181 576 196 703
Provinces and municipalities 8 8 8 10 10 11 11
Departmental agencies and accounts 592 327 514 16 2 2 2
Public corporations and private enterprises 134 006 144 965 111 846 120 250 135 186 142 047 156 272
Private enterprises 0 0 0 14 176 13 529 14 272 14 987

Page 90 of 227
Non-profit institutions 260 10 33 409 36 442 22 506 25 244 25 431
Households 182 0 401 122 0 0 0
Payments for capital assets 3 921 2 967 6 805 6 483 8 484 8 950 9 397
Buildings and other fixed structures 0 0 190 30 1 000 1 055 1 108
Machinery and equipment 3 921 2 943 6 615 6 453 7 484 7 896 8 289
Cultivated assets 0 24 0 0 0 0 0
Payment for financial assets 9 39 49 24 0 0 0
Total 190 015 206 794 233 791 244 607 256 923 272 711 293 337
9.7 Performance and expenditure trends
This Programme has been growing the fastest of all, because the support of all
farmers, especially PDI land beneficiaries, is done through and coordinated from
this Programme. However, it must be noted that the budget is declining in real
terms in the outer years due to the decrease of CASP and Ilima/Letsema funds.
This poses a risk regarding land reform in general and the Department’s ability to
support new farmers in particular.
This Programme has grown in budget from R190.015 million to R227.887 million or
8.2% per annum from 2011/12 to 2015/16. The growth trend of this Programme is
declining rapidly due to the peaking and declining of the grants which
contribute 57.9% to the budget of this Programme in 2015/16.
This Programme’s budget is thus still under pressure with regard to equitable
share allocation and will be increasingly so in the outer two years.
10 Programme 4 – Veterinary Services
10.1 Strategic objective annual targets for 2015/16
The purpose of the Programme is to provide veterinary services to clients in order
to ensure healthy animals, safe animal products and welfare of people of South
Africa.
The purpose of the sub-programmes is as follows:
Animal Health: To facilitate and provide animal disease control services in order
to protect the animal and human population against identified infectious,
zoonotic and/or economic diseases, through the implementation of the Animal
Diseases Act (Act 35 of 1984), and primary animal health programme/projects.
Export Control: To provide control measures including risk assessment and health
certification in order to facilitate the exportation of animals and animal products.
Veterinary Public Health: To ensure the safety of meat and meat products
through the implementation of the Meat Safety Act (Act 40 of 2000), the Animal
Diseases Act (Act 35 of 1984), and other relevant legislation.

Page 91 of 227
Veterinary Laboratory Services: To render veterinary diagnostic, laboratory and
investigative services that will back the control of animal diseases for adherence
to hygienic standards and to generate data.
Strategic objectives are documented per sub-programme
10.2 Sub-Programmes 4.1: Animal Health
Strategic objective Detection, prevention and control or eradication of significant animal
diseases.
Objective statement
Provision of quality primary animal health care services and effective
detection and control of animal diseases to improve animal health
and production, facilitate the export of animals and their products
and to safeguard human health by minimising the transmission of
animal diseases and parasites from animals to humans.
Baseline
Manageable levels of animal disease occurrence and negligible
occurrence of zoonotic diseases and parasites. The absence of any
serious trade or sensitive animal disease in the Western Cape.
Justification
The shortage of private veterinarians in deep rural areas and the
economic circumstances of smallholder and subsistence farmers
require inputs by Programme: VS to ensure healthy animals and
effective animal production. To maintain export markets, trading
partners require zoo-sanitary guarantees which are based on disease
surveillance and control and export certification by Pro according to
international norms and standards. Programme: VS also have a
regulatory mandate to control various animal diseases listed in the
Animal Diseases Act, 1984 (Act 35 of 1984) and the Animal Disease
Regulations
Links
The following PSGs are all supported by this objective:
PSG1: Create opportunities for growth and jobs by increasing the level
of health of livestock and preventing losses due to animal diseases
PSG3: Increase wellness of our population by protecting them from
animal borne diseases and parasites
PSG4: Enable a quality living environment by veterinary interventions
such as euthanasia of unwanted or terminally sick animals and mass
sterilisation and vaccination of dogs and cats thus decreasing the
negative impacts of large numbers of vagrant and roaming animals
PSG5: Forming partnerships with the various animal industries and the
establishment of a fully representative Provincial Animal Health Forum
which can discuss and advise on animal health matters pertinent to
the Province
Strategic
Objective
performance
indicator
Audited/Actual performance Estimated
performance
2014/15
Medium-term targets
2011/12 2012/13 2013/14 2015/16 2016/17 2017/18
1.1 Number of
animals
surveyed
for diseases
Not
reporte
d on
during
this
period
Not
reporte
d on
during
this
period
400 600 900 000 1 000 000 1 000 000
Note: Methodology of counting for 2014/15 changed from individual count to grid counting. The
methodology of counting, as from 2015/16 onwards will again change to individual counting.

Page 92 of 227
10.2.1 Risk Management
Risk 1: Difficulty in attracting suitable applicants for vacant technical and
professional veterinary and para-veterinary posts.
Response 1: Bursaries have been awarded to students who are contractually
bound to work for the Department for a specified period on completion of their
studies. However, the lack of a career path often leads to resignations after their
contracts have expired. Mentorship, internship and school holiday work
experience is offered to students to expose them to public service thus enticing
them to opt for public service as an employer of choice.
Risk 2: Disease outbreaks and emergence of trade sensitive, trans-boundary
animal diseases [TAD] affecting export and trade of animals and animal
products
Response 2: Continuous and frequent surveillance programmes ensure that
disease occurrences are identified early and appropriate control measures
implemented to arrest disease spread and ultimately eradicate them.
Sector specific indicators and annual targets for 2015/16 Programme
performance
indicator
Audited/Actual performance Estimated
performance
2014/15
Medium-term targets
2011/12 2012/13 2013/14 2015/16 2016/17 2017/18
1.1 Number of
epidemiologic
al units visited
for veterinary
interventions
Not
reporte
d on
during
this
period
Not
reporte
d on
during
this
period
Not
reporte
d on
during
this
period
Not
reported on
during this
period
20 000 25 000 30 000
Provincial specific indicators and annual targets for 2015/16 Programme
performance
indicator
Audited/Actual performance Estimated
performance
2014/15
Medium-term targets
2011/12 2012/13 2013/14 2015/16 2016/17 2017/18
1.1 Number
of cats
and dogs
vaccinat
ed
against
Rabies
Not
reported
on during
this
period
Not
reported
on
during
this
period
Not
reported
on
during
this
period
Not reported
on during this
period
70 000 75 000 80 000
1.2 Number
of cattle
tested by
the intra-
dermal
test for
Bovine
Tuberculo
sis
Not
reported
on during
this
period
Not
reported
on
during
this
period
Not
reported
on
during
this
period
Not reported
on during this
period
75 000 80 000 85 000
1.3 Number Not Not Not Not reported 75 000 80 000 85 000

Page 93 of 227
Programme
performance
indicator
Audited/Actual performance Estimated
performance
2014/15
Medium-term targets
2011/12 2012/13 2013/14 2015/16 2016/17 2017/18
of cattle
serum
sampled
and
serologic
ally
tested for
Brucellosis
reported
on during
this
period
reported
on
during
this
period
reported
on
during
this
period
on during this
period
Sector specific indicators for 2015/16
Performance indicator Reporting
period
Annual
target
2015/16
Quarterly targets
1st 2nd 3rd 4th
1.1 Number of
epidemiological
units visited for
veterinary
interventions
Quarterly 20 000 5 000 5 000 5 000 5 000
Provincial specific indicators for 2015/16
Performance indicator Reporting
period
Annual
target
2015/16
Quarterly targets
1st 2nd 3rd 4th
1.1 Number of cats
and dogs
vaccinated
against Rabies
Quarterly 70 000 25 000 20 000 10 000 15 000
1.2 Number of cattle
tested by the
intra-dermal test
for Bovine
Tuberculosis
Quarterly 75 000 25 000 25 000 10 000 15 000
1.3 Number of cattle
serum sampled
and serologically
tested for
Brucellosis
Quarterly 75 000 25 000 25 000
10 000 15 000
10.3 Sub-Programmes 4.2: Export Control
Strategic objective Provide an enabling environment for export certification for animals
and animal products from the Western Cape Province.
Objective statement
Export certification of animals and animal products from the Province
is only possible if the provincial herd is guarded against outbreaks of
trade sensitive diseases (Sub-programme 4.1), if the establishments
from which exports take place are approved according to the
requirements of importing countries and if correct and ethical
certification is issued by certifying veterinarians.
Baseline
All applications for approval of export establishments and export
certification for each export consignment are handled by sub-
programme: Export Control. Since this is demand driven the levels of
service delivery may vary at times.

Page 94 of 227
Justification
An export enabled environment in the Province links directly to the
potential to access markets which in turn indirectly exerts a positive
influence on the country’s trade balance, create employment
opportunities in the Province and causes an influx of foreign
exchange.
Links
PSG 1: Create opportunities for growth and jobs by improved market
access for both products from primary animal production as well as
products from further agri processing and value adding.
PSG 5: Embed good governance and integrated service delivery.
Strategic
Objective
performance
indicator
Audited/Actual performance Estimated
performance
2014/15
Medium-term targets
2011/12 2012/13 2013/14 2015/16 2016/17 2017/18
1.1 Number
of clients
serviced
for
animal
and
animal
products
export
control
Not
reported
on
during
this
period
Not
reported
on
during
this
period
Not
reported
on
during
this
period
Not reported
on during this
period
1 200 1 250 1 300
10.3.1 Risk Management
Risk 1: Inadequate resourcing of the sub-programme: Export Control will result in
an inability to render required export certification services to clients and will
erode good governance.
Response 1: Continued vigilance by the Department to ensure adequate
funding to achieve this provincial goal.
Risk 2: Failure of DAFF to deliver an adequate national supporting service to the
provinces to enable continued market access and export certification, most
notably in the fields of national chemical residue control programmes and
dynamic negotiation with trading partners to obtain the correct export
requirements in order to gain sustainable access to markets in other countries.
Response 1: Continued efforts by the WCDOA to participate in national policy
making bodies e.g. Ministerial Technical Veterinary Work Group Meetings,
Ministerial Technical Veterinary Public Health Advisory Committee and Ministerial
Veterinary Export Control Advisory Committee.
Response 2: The Province must approach the national Department and request
access to meetings and negotiations with trading partners in order to obtain first-
hand information make practical inputs from the Province’s perspective and to
assist DAFF when required.
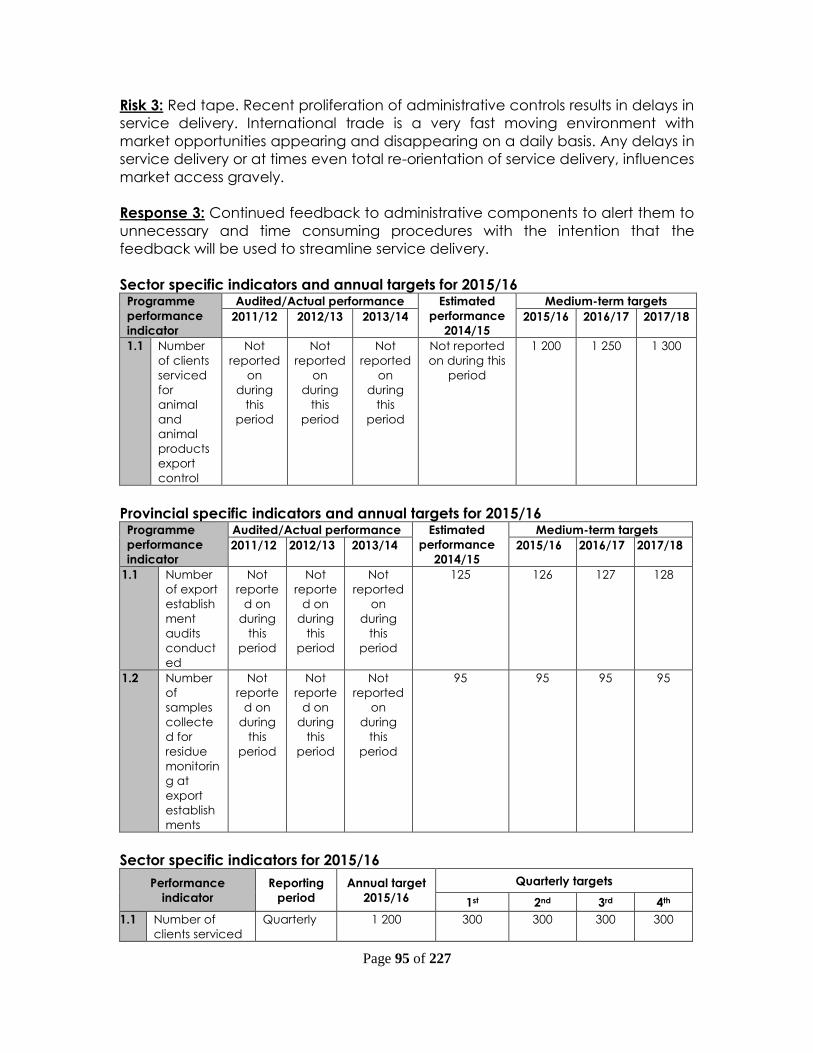
Page 95 of 227
Risk 3: Red tape. Recent proliferation of administrative controls results in delays in
service delivery. International trade is a very fast moving environment with
market opportunities appearing and disappearing on a daily basis. Any delays in
service delivery or at times even total re-orientation of service delivery, influences
market access gravely.
Response 3: Continued feedback to administrative components to alert them to
unnecessary and time consuming procedures with the intention that the
feedback will be used to streamline service delivery.
Sector specific indicators and annual targets for 2015/16 Programme
performance
indicator
Audited/Actual performance Estimated
performance
2014/15
Medium-term targets
2011/12 2012/13 2013/14 2015/16 2016/17 2017/18
1.1 Number
of clients
serviced
for
animal
and
animal
products
export
control
Not
reported
on
during
this
period
Not
reported
on
during
this
period
Not
reported
on
during
this
period
Not reported
on during this
period
1 200 1 250 1 300
Provincial specific indicators and annual targets for 2015/16 Programme
performance
indicator
Audited/Actual performance Estimated
performance
2014/15
Medium-term targets
2011/12 2012/13 2013/14 2015/16 2016/17 2017/18
1.1 Number
of export
establish
ment
audits
conduct
ed
Not
reporte
d on
during
this
period
Not
reporte
d on
during
this
period
Not
reported
on
during
this
period
125 126 127 128
1.2 Number
of
samples
collecte
d for
residue
monitorin
g at
export
establish
ments
Not
reporte
d on
during
this
period
Not
reporte
d on
during
this
period
Not
reported
on
during
this
period
95 95 95 95
Sector specific indicators for 2015/16
Performance
indicator
Reporting
period
Annual target
2015/16
Quarterly targets
1st 2nd 3rd 4th
1.1 Number of
clients serviced
Quarterly 1 200 300 300 300 300

Page 96 of 227
Performance
indicator
Reporting
period
Annual target
2015/16
Quarterly targets
1st 2nd 3rd 4th
for animal and
animal products
export control
Provincial specific indicators for 2015/16 Performance
indicator
Reporting
period
Annual target
2015/16
Quarterly targets
1st 2nd 3rd 4th
1.1 Number of
export
establishment
audits
conducted
Quarterly 126 31 35 25 35
1.2 Number of
samples
collected for
residue
monitoring at
export
establishments
Quarterly 95 20 30 30 15
10.4 Sub-Programmes 4.3: Veterinary Public Health
Strategic objective
Fulfil a mandatory legislative role through implementation of the Meat
Safety Act (Act 40 of 2000), the Animal Diseases Act (Act 35 of 1984)
and other relevant legislation.
Objective statement
The provision of safe meat to the local consumer through the
monitoring of veterinary public health risks and to lay a firm foundation
for credible and trustworthy export certification of meat and related
products.
Baseline Minimises the possibilities of zoonotic disease transmission to humans
via meat.
Justification
Rife illegal slaughter activities as well as a lack of independent meat
inspection at abattoirs, significantly undermines an effective regulatory
framework towards meat safety and consumer confidence. Under
such circumstances, maintaining and expanding export opportunities,
remains problematic.
Links
The following PSGs are all supported by this objective:
SG1: Create opportunities for growth and jobs by increasing the
numbers of animals slaughtered at abattoirs, as well as increasing the
numbers of abattoirs slaughtering game species.
SG3: Increase wellness of our population by protecting them from
zoonotic disease transmission through meat and related products.
SG4: Enable a quality living environment by ensuring responsible
handling of waste products by abattoirs.
SG 5: Embed good governance and integrated service delivery.
Strategic
Objective
performance
indicator
Audited/Actual performance Estimated
performance
2014/15
Medium-term targets
2011/12 2012/13 2013/14 2015/16 2016/17 2017/18
1.1 % level
of
abattoir
Not
reported
on
Not
reported
on
Not
reported
on
Not reported
on during this
period
60 60 60

Page 97 of 227
Strategic
Objective
performance
indicator
Audited/Actual performance Estimated
performance
2014/15
Medium-term targets
2011/12 2012/13 2013/14 2015/16 2016/17 2017/18
complia
nce to
meat
safety
legislatio
n
during
this
period
during
this
period
during
this
period
10.4.1 Risk Management
Risk 1: Inadequate funding of the sub-programme: Veterinary Public Health will
result in an inability of the unit to provide its mandatory regulatory function
towards ensuring safe meat supply to the consumer. Full compliance to local
regulations also forms the basis of any export certification of related products.
Response 1: Adequate funding to enable the unit to expand on a regional basis
to operate within closer reach of abattoirs, distributed over the whole Province.
Risk 2: Independent meat inspection is not done at all abattoirs.
Response 2: Continued efforts by the WCDOA to participate in national policy
making bodies’ e.g. the Ministerial Technical Veterinary Work Group Meetings
and the National Advisory Committee on Veterinary Public Health.
Risk 3: Curbing extensive and widespread illegal slaughter activities that threaten
human health as well as the integrity of the safe meat supply chain.
Response 3: Capacitating the VPH unit with sufficient veterinary as well as
environmental health officials on a regional basis to ensure ability to act swiftly
and regularly on complaints received.
Sector specific indicators and annual targets for 2015/16 Programme
performance
indicator
Audited/Actual performance Estimated
performance
2014/15
Medium-term targets
2011/12 2012/13 2013/14 2015/16 2016/17 2017/18
1.1 % level of
abattoir
compliance
to meat
safety
legislation
Not
reported
on
during
this
period
Not
reported
on
during
this
period
Not
reported
on
during
this
period
Not reported
on during
this period
60 60 60
Provincial specific indicators and annual targets for 2015/16 Programme
performance
indicator
Audited/Actual
performance
Estimated
performance
2014/15
Medium-term targets
2011/12 2012/13 2013/14 2015/16 2016/17 2017/18
1.1 Number of
public
3 19 20 22 25 25 25
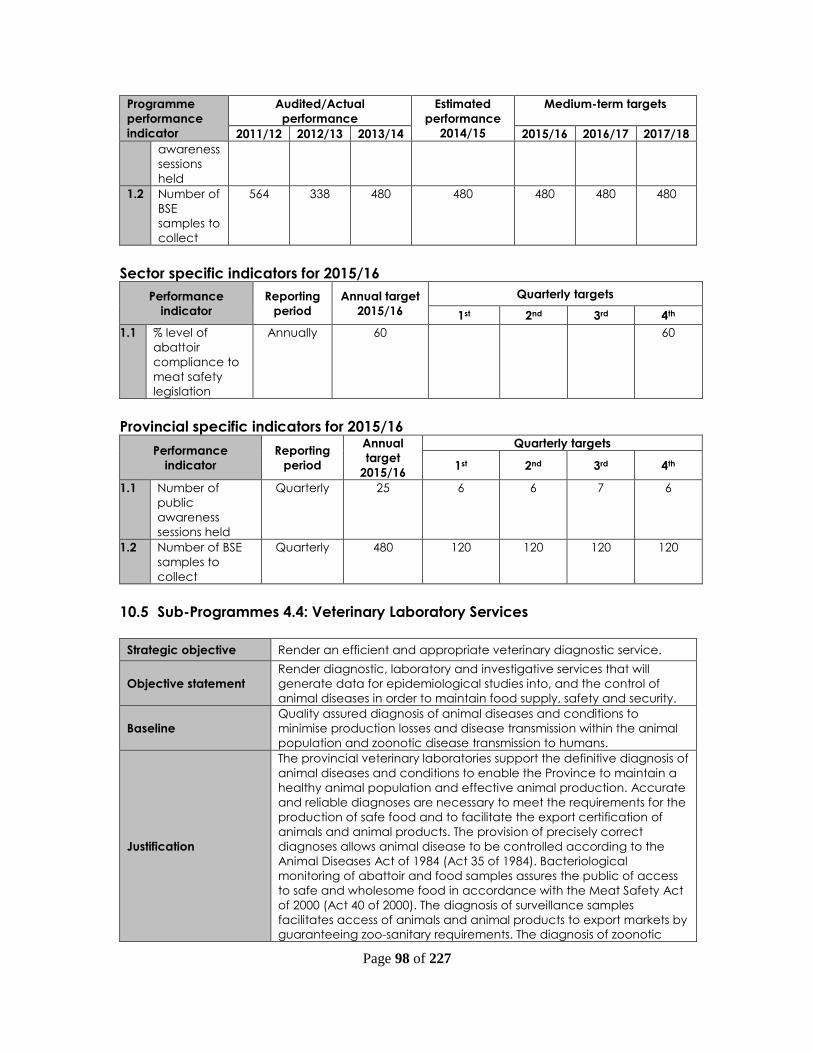
Page 98 of 227
Programme
performance
indicator
Audited/Actual
performance
Estimated
performance
2014/15
Medium-term targets
2011/12 2012/13 2013/14 2015/16 2016/17 2017/18
awareness
sessions
held
1.2 Number of
BSE
samples to
collect
564 338 480 480 480 480 480
Sector specific indicators for 2015/16
Performance
indicator
Reporting
period
Annual target
2015/16
Quarterly targets
1st 2nd 3rd 4th
1.1 % level of
abattoir
compliance to
meat safety
legislation
Annually 60 60
Provincial specific indicators for 2015/16
Performance
indicator
Reporting
period
Annual
target
2015/16
Quarterly targets
1st 2nd 3rd 4th
1.1 Number of
public
awareness
sessions held
Quarterly 25 6 6 7 6
1.2 Number of BSE
samples to
collect
Quarterly 480 120 120 120 120
10.5 Sub-Programmes 4.4: Veterinary Laboratory Services
Strategic objective Render an efficient and appropriate veterinary diagnostic service.
Objective statement
Render diagnostic, laboratory and investigative services that will
generate data for epidemiological studies into, and the control of
animal diseases in order to maintain food supply, safety and security.
Baseline
Quality assured diagnosis of animal diseases and conditions to
minimise production losses and disease transmission within the animal
population and zoonotic disease transmission to humans.
Justification
The provincial veterinary laboratories support the definitive diagnosis of
animal diseases and conditions to enable the Province to maintain a
healthy animal population and effective animal production. Accurate
and reliable diagnoses are necessary to meet the requirements for the
production of safe food and to facilitate the export certification of
animals and animal products. The provision of precisely correct
diagnoses allows animal disease to be controlled according to the
Animal Diseases Act of 1984 (Act 35 of 1984). Bacteriological
monitoring of abattoir and food samples assures the public of access
to safe and wholesome food in accordance with the Meat Safety Act
of 2000 (Act 40 of 2000). The diagnosis of surveillance samples
facilitates access of animals and animal products to export markets by
guaranteeing zoo-sanitary requirements. The diagnosis of zoonotic

Page 99 of 227
diseases plays an important role in the maintenance of public health.
Links
The following PSGs are all supported by this objective:
PSG1: Create opportunities for growth and jobs by increasing the
numbers of animals produced and facilitating market access.
PSG3: Increase wellness of our population by the production of
sufficient good quality food and by protecting the population from
zoonotic disease transmission.
PSG 5: Embed good governance and integrated service delivery.
Strategic
Objective
performance
indicator
Audited/Actual performance Estimated
performance
2014/15
Medium-term targets
2011/12 2012/13 2013/14 2015/16 2016/17 2017/18
1.1 Number
of
specimens
tested
Not
reported
on
during
this
period
138 944 130 000 140 000 125 000 125 000 130 000
10.5.1 Risk Management
Risk 1: It proves to be difficult to attracting suitable applicants for technical and
professional vacant veterinary and para-veterinary posts.
Response 1: Mentorship, internship and school holiday work experience is offered
to students to expose them to the public service and thus entice them to opt for
the public service as an employer of choice. Continual training and professional
development of technical and professional staff is encouraged. Liaison with the
South African Veterinary Council is maintained with regard to the training,
competency and registration of Veterinary Technologists.
Risk 2: The maintenance, servicing and calibration of analytical equipment not
adequately performed resulting in integrity problems with diagnostic testing and
Occupational Health and Safety (OHS) issues.
Response 2: Quality Assurance Manager implements and maintains Quality
Management System (QMS) in accordance with ISO 17025 standard.
Risk 3: Pathogens that are responsible for serious animal disease outbreaks
escaping the confines of facilities of Veterinary Laboratory Services.
Response 3: Implementation and monitoring compliance of Standard Operating
Procedures (SOP) as part of the Quality Management System (QMS) in
accordance with DAFF prescripts. Plans are in place to obtain a Biosecurity Level
3 (BSL3) mobile laboratory where dangerous pathogens can be contained.
Risk 4: The use of test procedures which have not been validated and verified
may lead to incorrect results.

Page 100 of 227
Response 4: Implementation of Quality Management System (QMS) will ensure
that tests and test results are validated and verified. DAFF Certificate of Approval
is valid until 30th September 2015. The WCPVL, Stellenbosch, will need to be
assessed by SANAS before September 2015.
Sector specific indicators and annual targets for 2015/16 Programme
performance
indicator
Audited/Actual performance Estimated
performance
2014/15
Medium-term targets
2011/12 2012/13 2013/14 2015/16 2016/17 2017/18
1.1 Number of
tests
performed
the quality
of which
meets the
ISO 17025
standard
and OIE
requireme
nts
Not
reported
on
during
this
period
Not
reported
on
during
this
period
Not
reported
on
during
this
period
Not reported
on during this
period
100 000 120 000 120 000
Provincial specific indicators and annual targets for 2015/16 Programme
performance
indicator
Audited/Actual performance Estimated
performance
2014/15
Medium-term targets
2011/12 2012/13 2013/14 2015/16 2016/17 2017/18
1.1 Total
number of
specimens
tested for
Controlled/
Notifiable
diseases
tested
Not
reported
on
during
this
period
115 387 103 761 100 000 100 000 110 000 120 000
1.2 Total
number of
Veterinary
Public
Health
samples
tested
Not
reported
on
during
this
period
4 195 4 406 3 000 2400 4000 6 000
1.3 Number of
samples
tested for
small holder
farmers
Not
reported
on
during
this
period
Not
reported
on
during
this
period
Not
reported
on
during
this
period
3 500 1600 2500 5 000
1.4 Number of
specimens
tested
Not
reported
on
during
this
period
138 944 130 906 140 000 125 000 125 000 130 000
1.5 Readiness
of
laboratory
Not
reported
on
Not
reported
on
Not
reported
on
Not reported
on during
this period
Yes Yes Yes

Page 101 of 227
Programme
performance
indicator
Audited/Actual performance Estimated
performance
2014/15
Medium-term targets
2011/12 2012/13 2013/14 2015/16 2016/17 2017/18
facility for
cheese
residue
testing
during
this
period
during
this
period
during
this
period
1.6 Number of
cheese/
dairy
samples for
residues
Not
reported
on
during
this
period
Not
reported
on
during
this
period
Not
reported
on
during
this
period
Not reported
on during
this period
100 500 600
Sector specific indicators for 2015/16
Performance
indicator
Reporting
period
Annual
target
2015/16
Quarterly targets
1st 2nd 3rd 4th
1.1 Number of tests
performed the
quality of which
meets the ISO
17025 standard
and OIE
requirements
Quarterly 100 000 20 000 30 000 30 000 20 000
Provincial specific indicators for 2015/16 Performance
indicator
Reporting
period
Annual target
2015/16
Quarterly targets
1st 2nd 3rd 4th
1.1 Total
number of
Controlled/
Notifiable
Disease
samples
tested
Quarterly 100 000 20 000 30 000 30 000 20 000
1.2 Total
number of
Veterinary
Public
Health
samples
tested
Quarterly 2 400 600 600 700 500
1.3 Number of
samples
tested for
small holder
farmers
Quarterly 1 600 400 400 400 400
1.4 Number of
Specimen
tested
Quarterly 125 000 30 000 25 000 35 000 35 000
1.5 Readiness
of
laboratory
facility for
cheese
Annually Yes Yes

Page 102 of 227
Performance
indicator
Reporting
period
Annual target
2015/16
Quarterly targets
1st 2nd 3rd 4th
residue
testing
1.6 Number of
cheese/
dairy
samples for
residues
Quarterly 100 100
10.6 Reconciling performance targets with the Budget and MTEF
Expenditure estimates Table 6: Programme: Veterinary Services Sub-programme Expenditure outcome Adjusted
appropriation
Medium-term expenditure
estimate
R thousand 2011/12 2012/13 2013/14 2014/15 2015/16 2016/17 2017/18
Animal Health 47 605 33 572 35 470 38 767 40 344 41 378 43 709
Export Control 4 785 3 647 6 049 10 198 12 485 13 341 14 225
Veterinary Public Health 4 510 4 583 5 284 5 752 7 087 7 557 8 036
Veterinary Laboratory Services 12 498 11 695 14 175 14 292 16 307 17 379 18 475
Total 69 398 53 497 60 978 69 009 76 233 79 655 83 445
Change to 2010 budget estimate 55.2% 19.7% 36.4% 57.7% 70.5 % 78.2% 86.7%
Economic classification
Current payments 51 946 51 095 56 960 64 798 74 036 77 350 81 028
Compensation of employees 38 945 40 427 44 252 48 990 58 301 62 382 66 624
Goods and services 12 999 10 668 12 708 15 808 15 735 14 968 14 404
of which:
Communication 715 787 791 693 736 642 674
Computer services 28 5 103 2 205 216 227
Consultants, contractors and special services 465 278 428 246 252 266 280
Agency and support 2 017 52 265 410 1 359 1 434 1 506
Consumables 3 029 3 101 3 983 2 766 3 433 3 623 2 805
Fleet services 1 143 1 022 913 1 716 1 702 1 296 1 362
Operating leases 171 284 307 852 864 911 957
Travel and subsistence 3 841 3 505 4 220 5 582 5 134 4 417 4 322
Operating payments 406 556 556 1 309 545 576 605
Other 1 184 1 078 1 142 2 232 1 505 1 587 1 666
Interest and rent on land 2 0 0 0 0 0 0
Transfers and subsidies to: 15 992 855 319 667 650 686 720
Provinces and municipalities 1 1 1 20 0 0 0
Departmental agencies and accounts 0 22 82 4 0 0 0
Public corporations and private enterprises 0 0 100 0 0 0 0
Non-profit institutions 500 500 0 650 650 686 720
Households 15 491 332 136 11 0 0 0
Payments for capital assets 1 437 1 522 3 670 3537 1 537 1 619 1 697
Machinery and equipment 1 437 1 522 3 670 3 537 1 537 1 619 1 697
Software and other intangible assets 0 0 0 0 0 0 0
Payments for financial assets 23 25 29 7 0 0 0
Total 69 398 53 497 60 978 69 009 76 223 79 655 83 445
10.7 Performance and expenditure trends

Page 103 of 227
A once-off increase in the funding in 2011/12 of R17.078 million for the culling of
ostriches due to the outbreak of Avian Influenza distorts the trend for this
Programme.
However, the increases in the CoE of expensive personnel (highest departmental
ratio of CoE compared to total budget), internationally set prices on capital
items and medicinal inventory has left the Department with no option other than
to apply for a cost pressure policy option which was subsequently partially
funded in the 2013/14 year and beyond.
The above relief is under pressure again with market access issues that were not
addressed and the increased funding barely negotiates the establishment
pressures.
11 Programme 5 – Research and Technology Development Services
11.1 Strategic objective annual targets for 2015/16
The purpose of the Programme is to render expert and needs based research,
development and technology transfer services impacting on development
objectives.
The purpose of the sub-programmes is as follows:
Research: To conduct, facilitate and co-ordinate research and to participate in
multi-disciplinary development projects.
Technology Transfer Services: To disseminate information on research and
technology developed to clients.
Infrastructure Support Service: To provide and maintain infrastructure facilities for
the line function to perform their research and other functions, i.e. experiment
farms.
Strategic objectives are documented per sub-programme.
11.2 Sub-Programmes 5.1: Research
Strategic objective Conduct agricultural research and technology development.
Objective statement To conduct cutting-edge research and technology development in the
fields of animal sciences, plant sciences and research support services
Baseline
Number of research projects executed and needs identified through
stakeholder engagements with commodity organisations and other
industry partners
Justification
This objective will contribute to increase agricultural production and
sustained competitiveness of all farmers, and
To support Comprehensive Agricultural Support Programme (CASP) and
land reform beneficiaries’ projects through the CASP and Ilima/Letsema
conditional grants
Links
This objective will contribute to new cutting-edge technology and
increased profitability and sustainability of farmers in terms of:
NDP;
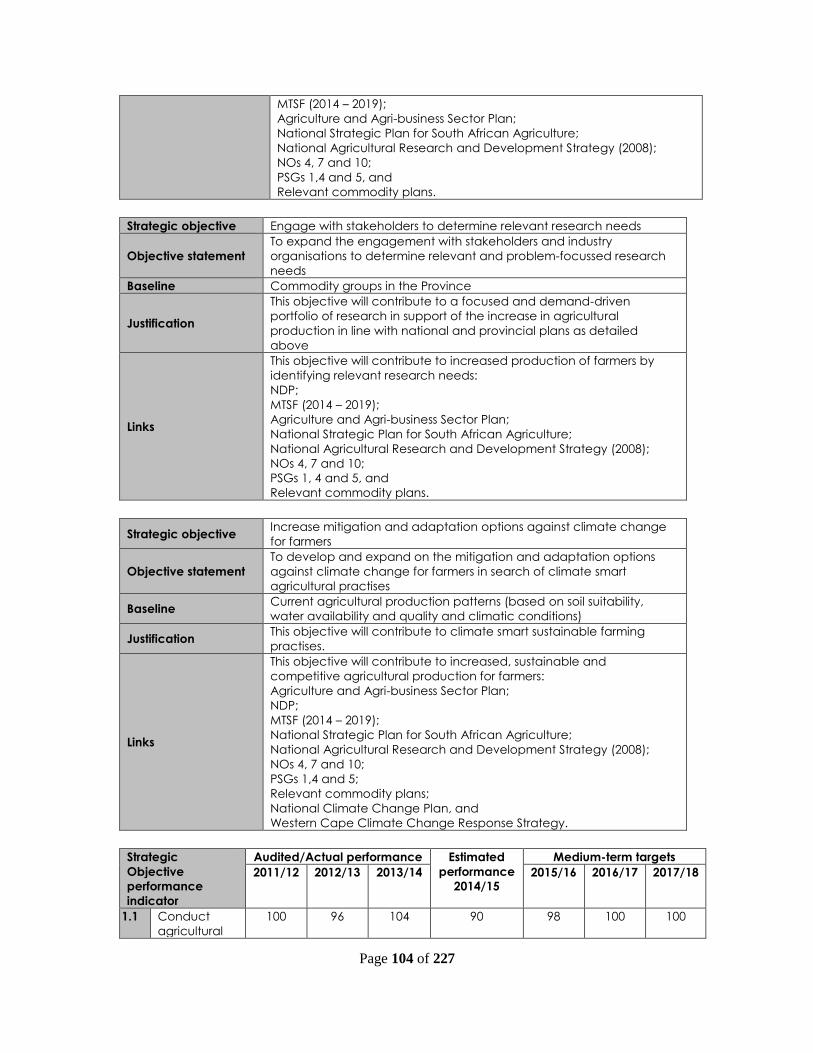
Page 104 of 227
MTSF (2014 – 2019);
Agriculture and Agri-business Sector Plan;
National Strategic Plan for South African Agriculture;
National Agricultural Research and Development Strategy (2008);
NOs 4, 7 and 10;
PSGs 1,4 and 5, and
Relevant commodity plans.
Strategic objective Engage with stakeholders to determine relevant research needs
Objective statement
To expand the engagement with stakeholders and industry
organisations to determine relevant and problem-focussed research
needs
Baseline Commodity groups in the Province
Justification
This objective will contribute to a focused and demand-driven
portfolio of research in support of the increase in agricultural
production in line with national and provincial plans as detailed
above
Links
This objective will contribute to increased production of farmers by
identifying relevant research needs:
NDP;
MTSF (2014 – 2019);
Agriculture and Agri-business Sector Plan;
National Strategic Plan for South African Agriculture;
National Agricultural Research and Development Strategy (2008);
NOs 4, 7 and 10;
PSGs 1, 4 and 5, and
Relevant commodity plans.
Strategic objective Increase mitigation and adaptation options against climate change
for farmers
Objective statement
To develop and expand on the mitigation and adaptation options
against climate change for farmers in search of climate smart
agricultural practises
Baseline Current agricultural production patterns (based on soil suitability,
water availability and quality and climatic conditions)
Justification This objective will contribute to climate smart sustainable farming
practises.
Links
This objective will contribute to increased, sustainable and
competitive agricultural production for farmers:
Agriculture and Agri-business Sector Plan;
NDP;
MTSF (2014 – 2019);
National Strategic Plan for South African Agriculture;
National Agricultural Research and Development Strategy (2008);
NOs 4, 7 and 10;
PSGs 1,4 and 5;
Relevant commodity plans;
National Climate Change Plan, and
Western Cape Climate Change Response Strategy.
Strategic
Objective
performance
indicator
Audited/Actual performance Estimated
performance
2014/15
Medium-term targets
2011/12 2012/13 2013/14 2015/16 2016/17 2017/18
1.1 Conduct
agricultural
100 96 104 90 98 100 100

Page 105 of 227
Strategic
Objective
performance
indicator
Audited/Actual performance Estimated
performance
2014/15
Medium-term targets
2011/12 2012/13 2013/14 2015/16 2016/17 2017/18
research and
technology
development
11.2.1 Risk Management
Risk 1: The current research resources could be wiped out or delayed due to
external phenomena, impacting directly on the research outputs and may
indirectly affect the clients.
Response 1: Preventative measures, biosecurity plans, standard operating
procedures, resource conservation methodologies, and water maintenance
plans will be developed and implemented to secure the resource base.
Risk 2: Reprioritising and re-alignment of key focus areas due to changes in
national and provincial strategic directions for research and development could
negatively impact on the budget, resources, outputs, outcomes and the loss of
relevance to clients.
Response 2: Continuous alignment with NOs and PSGs as well as active
participation in national forums and working groups will ensure the relevance
and direction of the research portfolio.
Risk 3: The research portfolio could be misaligned to commodity needs due to
the rapid change and response in commodity needs versus current research
outputs, resulting in a change of research priorities. This could have a negative
impact on external research funding, demands on current budget, resources
and capacity, information suitability and the loss of expertise status.
Response 3: The research portfolio is continuously tested against commodity
needs, active participation in commodity working groups, collaboration with
extension officers and formal extension and study groups, and active and
focussed engagements with key industry players.
Risk 4: The inability to maintain and/ or expand on the research portfolio due to
limited research support resources and human capacity (qualifications and
inherent requirements of professional registration) could impact negatively on
service delivery and addressing current and future client needs.
Response 4: Continuously lobbying for additional funding and new and novel
ways of seeking external support will address this risk. Furthermore, capacity
building programmes at the Department is utilised to its fullest, whilst the Human
Capacity Development Plan for the Programme is the roadmap to recruitment
and selection, transformation and succession planning for the next 5 years.
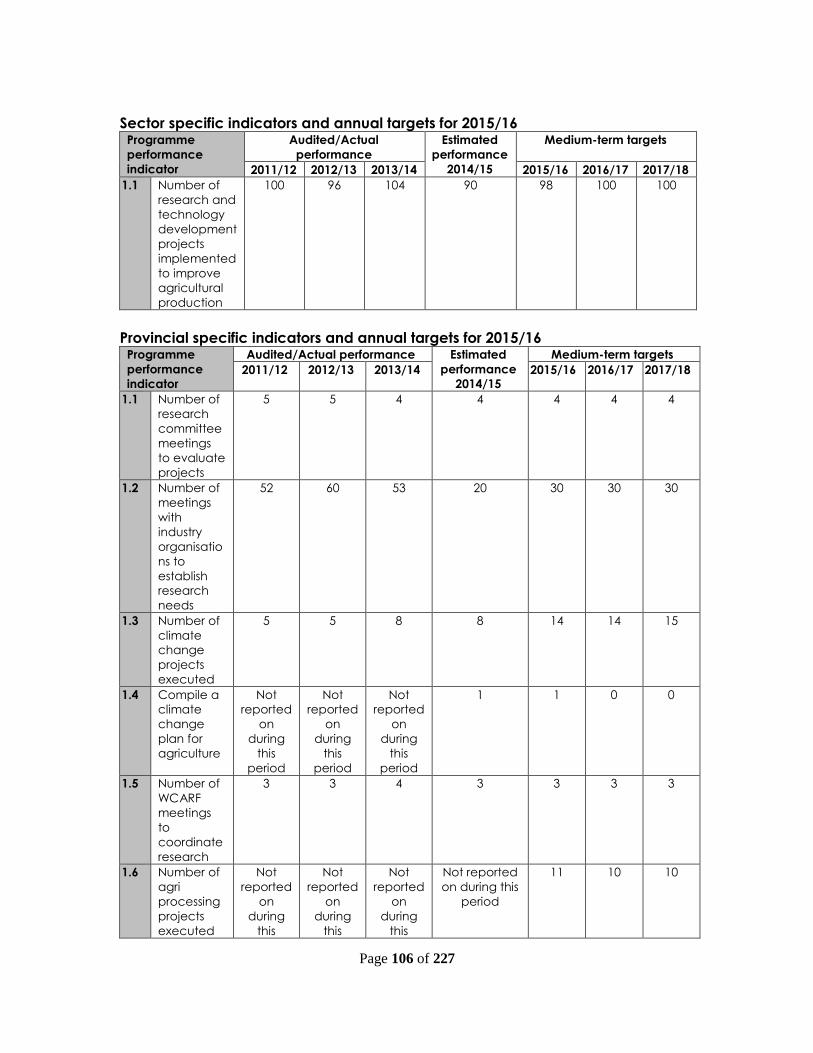
Page 106 of 227
Sector specific indicators and annual targets for 2015/16 Programme
performance
indicator
Audited/Actual
performance
Estimated
performance
2014/15
Medium-term targets
2011/12 2012/13 2013/14 2015/16 2016/17 2017/18
1.1 Number of
research and
technology
development
projects
implemented
to improve
agricultural
production
100 96 104 90 98 100 100
Provincial specific indicators and annual targets for 2015/16 Programme
performance
indicator
Audited/Actual performance Estimated
performance
2014/15
Medium-term targets
2011/12 2012/13 2013/14 2015/16 2016/17 2017/18
1.1 Number of
research
committee
meetings
to evaluate
projects
5 5 4 4 4 4 4
1.2 Number of
meetings
with
industry
organisatio
ns to
establish
research
needs
52 60 53 20 30 30 30
1.3 Number of
climate
change
projects
executed
5 5 8 8 14 14 15
1.4 Compile a
climate
change
plan for
agriculture
Not
reported
on
during
this
period
Not
reported
on
during
this
period
Not
reported
on
during
this
period
1 1 0 0
1.5 Number of
WCARF
meetings
to
coordinate
research
3 3 4 3 3 3 3
1.6 Number of
agri
processing
projects
executed
Not
reported
on
during
this
Not
reported
on
during
this
Not
reported
on
during
this
Not reported
on during this
period
11 10 10

Page 107 of 227
Programme
performance
indicator
Audited/Actual performance Estimated
performance
2014/15
Medium-term targets
2011/12 2012/13 2013/14 2015/16 2016/17 2017/18
period period period
Sector specific indicators for 2015/16
Performance
indicator
Reporting
period
Annual target
2015/16
Quarterly targets
1st 2nd 3rd 4th
1.1 Number of
research and
technology
development
projects
implemented
to improve
agricultural
production
Annually 98 98
Provincial specific indicators for 2015/16 Performance
indicator
Reporting
period
Annual target
2015/16
Quarterly targets
1st 2nd 3rd 4th
1.1 Number of
research
committee
meetings to
evaluate
projects
Quarterly 4 1 1 1 1
1.2 Number of
meetings with
industry
organisations
to establish
research
needs
Quarterly 30 5 10 10 5
1.3 Number of
climate
change
projects
executed
Annually 14 14
1.4 Compile a
climate
change plan
for agriculture
Annually 1 1
1.5 Number of
WCARF
meetings to
coordinate
research
Quarterly 3 1 1 1
1.6 Number of
agri
processing
projects
executed
Annually 11 11

Page 108 of 227
11.3 Sub-Programmes 5.2: Technology Transfer Services
Strategic objective Increase access to scientific and technical information on agricultural
production practises to farmers and clients.
Objective statement
To expand access to appropriately packaged information emanating
from research to farmers and clients and to improve on the technical
communication effort of the Department.
Baseline Commodity organisations, farmers (commercial and small holder)
database, CADIS.
Justification This objective will contribute to the continuous adoption of new cutting
edge technology by farmers
Links
This objective will contribute to the improvement of production
practises and decision making of farmers:
NDP;
MTSF (2014 – 2019);
Agriculture and Agri-business Sector Plan;
National Strategic Plan for South African Agriculture;
National Agricultural Research and Development Strategy (2008);
NOs 4, 7 and 10;
PSGs 1, 4 and 5, and
Relevant commodity plans.
Strategic
Objective
performance
indicator
Audited/Actual performance Estimated
performance
2014/15
Medium-term targets
2011/12 2012/13 2013/14 2015/16 2016/17 2017/18
1.1 Provide
scientific
and
technical
information
466 257 367 382 424 425 425
11.3.1 Risk Management
Risk 1: Poor information dissemination between researchers and extension
officers, farmers and other stakeholders, could result in research information not
reaching the end-user. The will make research efforts null and void and extension
officers will be using out-dated information.
Response 1: Active participation in information dissemination actions, from
extension officer block sessions to industry specific meetings and study groups, as
well as a portfolio of information dissemination vehicles, such as walk and talks,
farmers’ days, short courses, popular articles, radio talks, information packs, etc.
is applied to ensure an effective dissemination model.
Risk 2: The presentation of information could be of such a nature that the end
user is unable to interpret and implement the research results, making the
information obsolete.

Page 109 of 227
Response 2: The technology transfer agenda is determined with the assistance of
stakeholder groups and the ergonomics of the information is designed to
address the needs of the end-user.
Risk 3: Electronic failure, other disasters and lack of handover from staff exiting
may cause a loss of research data and possible duplication of research that has
been done due to information not being backed-up, archived and filed.
Response 3: Data management training and a standard operating procedure
on data capturing and backing up is part of the mitigating measures.
Furthermore, hand-over of data by retiring or exiting staff will be compulsory and
will also be part of performance agreements.
Sector specific indicators and annual targets for 2015/16 Programme
performance
indicator
Audited/Actual performance Estimated
performance
2014/15
Medium-term targets
2011/12 2012/13 2013/14 2015/16 2016/17 2017/18
1.1 Number of
scientific
papers
published
nationally or
international
ly
43 32 36 40 25 25 25
1.2 Number of
research
presentation
s made
nationally or
international
ly
90 86 91 60 70 70 70
Provincial specific indicators and annual targets for 2015/16 Programme
performance
indicator
Audited/Actual performance Estimated
performance
2014/15
Medium-term targets
2011/12 2012/13 2013/14 2015/16 2016/17 2017/18
1.1 Number of
presentatio
ns made at
technology
transfer
events
205 203 149 200 150 150 150
1.2 Number of
articles in
popular
media
167 180 168 140 140 140 140
1.3 Number of
information
packs
developed
17 21 18 12 12 12 12
1.4 Number of
technology
transfer
events
14 15 10 10 7 8 8
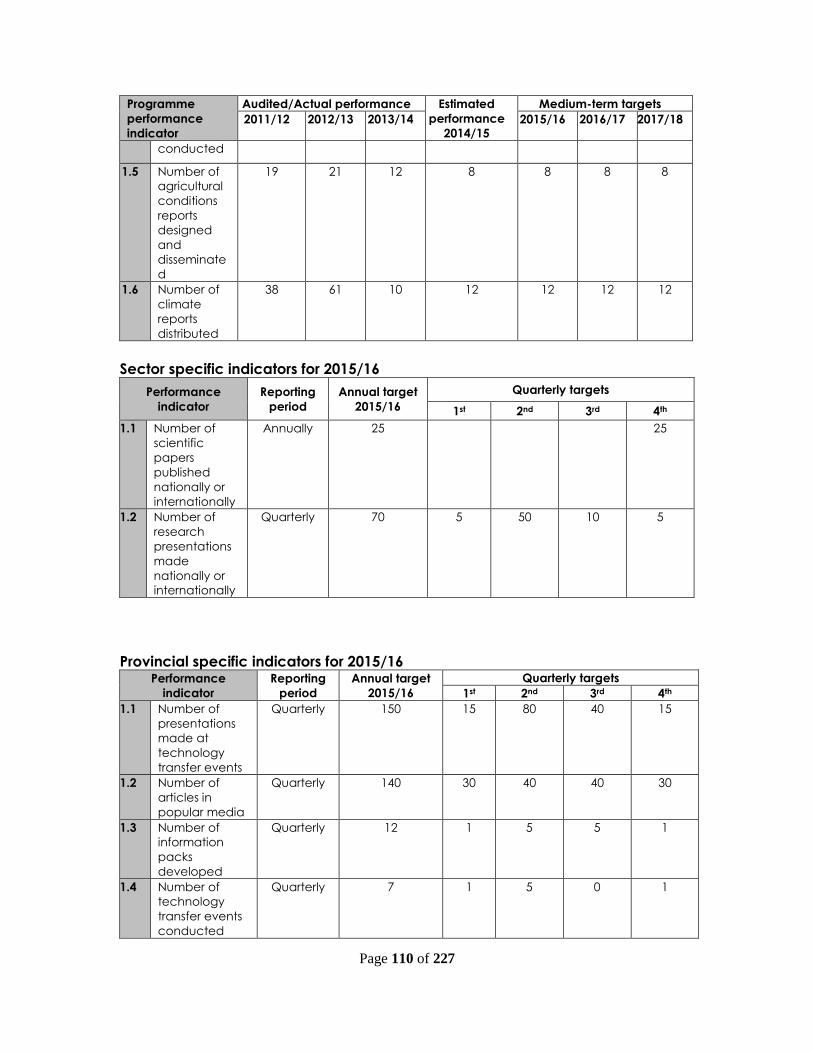
Page 110 of 227
Programme
performance
indicator
Audited/Actual performance Estimated
performance
2014/15
Medium-term targets
2011/12 2012/13 2013/14 2015/16 2016/17 2017/18
conducted
1.5 Number of
agricultural
conditions
reports
designed
and
disseminate
d
19 21 12 8 8 8 8
1.6 Number of
climate
reports
distributed
38 61 10 12 12 12 12
Sector specific indicators for 2015/16
Performance
indicator
Reporting
period
Annual target
2015/16
Quarterly targets
1st 2nd 3rd 4th
1.1 Number of
scientific
papers
published
nationally or
internationally
Annually 25 25
1.2 Number of
research
presentations
made
nationally or
internationally
Quarterly 70 5 50 10 5
Provincial specific indicators for 2015/16 Performance
indicator
Reporting
period
Annual target
2015/16
Quarterly targets
1st 2nd 3rd 4th
1.1 Number of
presentations
made at
technology
transfer events
Quarterly 150 15 80 40 15
1.2 Number of
articles in
popular media
Quarterly 140 30 40 40 30
1.3 Number of
information
packs
developed
Quarterly 12 1 5 5 1
1.4 Number of
technology
transfer events
conducted
Quarterly 7 1 5 0 1
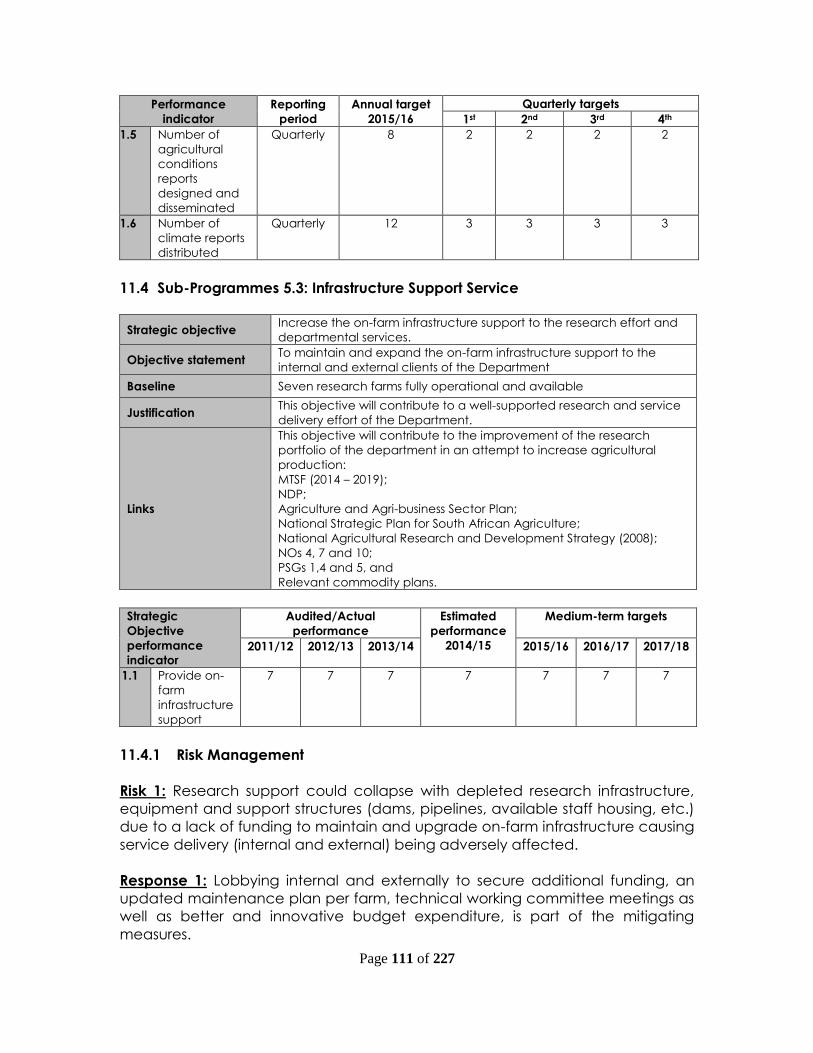
Page 111 of 227
Performance
indicator
Reporting
period
Annual target
2015/16
Quarterly targets
1st 2nd 3rd 4th
1.5 Number of
agricultural
conditions
reports
designed and
disseminated
Quarterly 8 2 2 2 2
1.6 Number of
climate reports
distributed
Quarterly 12 3 3 3 3
11.4 Sub-Programmes 5.3: Infrastructure Support Service
Strategic objective Increase the on-farm infrastructure support to the research effort and
departmental services.
Objective statement To maintain and expand the on-farm infrastructure support to the
internal and external clients of the Department
Baseline Seven research farms fully operational and available
Justification This objective will contribute to a well-supported research and service
delivery effort of the Department.
Links
This objective will contribute to the improvement of the research
portfolio of the department in an attempt to increase agricultural
production:
MTSF (2014 – 2019);
NDP;
Agriculture and Agri-business Sector Plan;
National Strategic Plan for South African Agriculture;
National Agricultural Research and Development Strategy (2008);
NOs 4, 7 and 10;
PSGs 1,4 and 5, and
Relevant commodity plans.
Strategic
Objective
performance
indicator
Audited/Actual
performance
Estimated
performance
2014/15
Medium-term targets
2011/12 2012/13 2013/14 2015/16 2016/17 2017/18
1.1 Provide on-
farm
infrastructure
support
7 7 7 7 7 7 7
11.4.1 Risk Management
Risk 1: Research support could collapse with depleted research infrastructure,
equipment and support structures (dams, pipelines, available staff housing, etc.)
due to a lack of funding to maintain and upgrade on-farm infrastructure causing
service delivery (internal and external) being adversely affected.
Response 1: Lobbying internal and externally to secure additional funding, an
updated maintenance plan per farm, technical working committee meetings as
well as better and innovative budget expenditure, is part of the mitigating
measures.
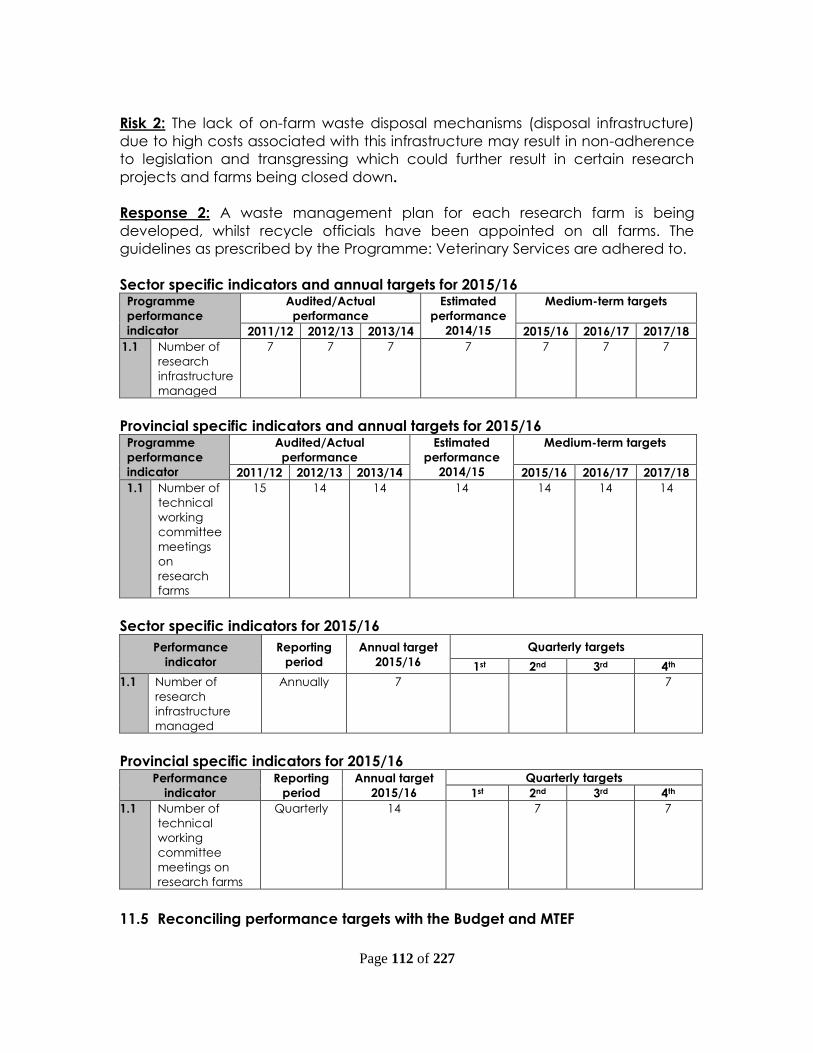
Page 112 of 227
Risk 2: The lack of on-farm waste disposal mechanisms (disposal infrastructure)
due to high costs associated with this infrastructure may result in non-adherence
to legislation and transgressing which could further result in certain research
projects and farms being closed down.
Response 2: A waste management plan for each research farm is being
developed, whilst recycle officials have been appointed on all farms. The
guidelines as prescribed by the Programme: Veterinary Services are adhered to.
Sector specific indicators and annual targets for 2015/16 Programme
performance
indicator
Audited/Actual
performance
Estimated
performance
2014/15
Medium-term targets
2011/12 2012/13 2013/14 2015/16 2016/17 2017/18
1.1 Number of
research
infrastructure
managed
7 7 7 7 7 7 7
Provincial specific indicators and annual targets for 2015/16 Programme
performance
indicator
Audited/Actual
performance
Estimated
performance
2014/15
Medium-term targets
2011/12 2012/13 2013/14 2015/16 2016/17 2017/18
1.1 Number of
technical
working
committee
meetings
on
research
farms
15 14 14 14 14 14 14
Sector specific indicators for 2015/16
Performance
indicator
Reporting
period
Annual target
2015/16
Quarterly targets
1st 2nd 3rd 4th
1.1 Number of
research
infrastructure
managed
Annually 7 7
Provincial specific indicators for 2015/16 Performance
indicator
Reporting
period
Annual target
2015/16
Quarterly targets
1st 2nd 3rd 4th
1.1 Number of
technical
working
committee
meetings on
research farms
Quarterly 14 7 7
11.5 Reconciling performance targets with the Budget and MTEF

Page 113 of 227
Expenditure estimates Table 7: Programme: Research and Technology Development Services Sub-programme Expenditure outcome Adjusted
appropriation
Medium-term expenditure
estimate
R thousand 2011/12 2012/13 2013/14 2014/15 2015/16 2016/17 2017/18
Research 48 055 54 645 60 341 64 925 68 654 71 131 75 223
Technology Transfer Services 83 287 703 1 619 1 713 1 808
Infrastructure Support Service 29 478 32 711 34 902 39 331 38 552 39 140 41 615
Total 77 616 87 356 95 530 104 959 108 825 111 984 118 646
Change to 2010 budget estimate 5.8% 19.0% 30.2% 41.1% 48.3% 52.6% 61.7%
Economic classification
Current payments 72 743 80 116 86 332 98 396 103 150 105 996 112 360
Compensation of employees 54 388 57 923 61 148 66 822 74 000 79 179 84 563
Goods and services 18 554 22 193 25 284 31 574 29 150 26 817 27 797
of which:
Communication 515 600 617 518 516 545 572
Computer services 9 92 311 689 659 695 730
Consultants, contractors and special services 2 432 3 214 3 568 4 171 1 406 1 483 1 558
Consumables 9 943 10 559 12 230 18 400 20 341 17 523 18 037
Fleet services 1 467 1 777 1 534 1 816 1 702 1 796 1 886
Property payments 875 1 330 1 521 598 464 489 514
Operating leases 172 269 318 363 219 231 243
Travel and subsistence 1 906 2 658 2 947 2 535 2 166 2 285 2 399
Other 1 235 1 694 2 238 2 484 1 677 1 770 1 858
Interest and rent on land 1 0 0 0 0 0 0
Transfers and subsidies to: 353 519 878 224 1 038 1 095 1 150
Provinces and municipalities 41 40 43 36 38 40 42
Departmental agencies and accounts 250 1 127 1 0 0 0
Higher education institutions 0 0 0 100 0 0 0
Public Corporations and Private Enterprises 0 0 0 0 1 000 1 055 1 108
Non-profit institutions 62 0 200 40 0 0 0
Households 0 478 508 47 0 0 0
Payments for capital assets 4 289 6 713 8 254 6 316 4 637 4 893 5 136
Buildings and other fixed structures 244 387 181 0 0 0 0
Machinery and equipment 4 035 6 326 8 073 6 284 4 637 4 893 5 136
Software and other intangible assets 10 0 0 32 0 0 0
Payments for financial assets 31 8 66 23 0 0 0
Total 77 616 87 356 95 530 104 959 108 825 111 984 118 646
11.6 Performance and expenditure trends
A policy option for cost pressure was granted in 2011/12 and implemented in
2012/13 which is the total reason for the higher than average budget increase
between 2011/12 and 2012/13. This has made it possible for this Programme to
make vital and necessary appointments which continued into 2013/14. However,
this Programme, perhaps more than any other, is vulnerable to higher than
inflationary increases and will be under pressure in the not too distant future.
12 Programme 6 – Agricultural Economics Services
12.1 Strategic objective annual targets for 2015/16

Page 114 of 227
The purpose of the Programme is to provide timely and relevant agricultural
economic services to the sector in support of sustainable agricultural and agri-
business development to increase economic growth.
The purpose of the sub-programmes is as follows:
Agri-Business Support and Development: To provide Agri-Business support
through entrepreneurial development, marketing services, value adding,
production and resource economics.
Macroeconomics Support: To provide macroeconomic and statistical
information on the performance of the agricultural sector in order to inform
planning and decision making.
Strategic objectives are documented per sub-programme.
12.2 Sub-Programmes 6.1: Agri-Business Support and Development
Strategic objective Provide agricultural stakeholders with agricultural economic advice
Objective statement
To provide agricultural stakeholders with economic advice in support
of sustainable agricultural and agri-business development to increase
economic growth
Baseline About 1 155 clients have been supported with agricultural economic
services
Justification
Improving competiveness in the agricultural sector by providing agri-
business support and development to entrepreneurs and raising their
capacities to meet the increasingly complex business environment is of
great importance as it has the potential to generate broad-based
income growth and create wealth in rural areas and the rest of the
economy
Links
Support entrepreneurs and small businesses to thrive; open markets for
Western Cape firms and key sectors wanting to export and/or trade;
and rebrand the region to increase internal and external are the key
priorities of PSG 1. The services provided by this sub-programme aim to
achieve these priorities. These services are provided across the
spectrum with major focus on those industries with potential to create
jobs as specified in the NDP. There is also a strong focus on market
development to be able to increase exports which also aligns with
NO4, No7 and One Cape 2040.
Strategic
Objective
performance
indicator
Audited/Actual performance Estimated
performance
2014/15
Medium-term targets
2011/12 2012/13 2013/14 2015/16 2016/17 2017/18
1.1 Number of
stakeholders
provided
with
agricultural
economic
services
1 331 2 175 1 456 1 155 1 555 1 605 1 705
12.2.1 Risk Management
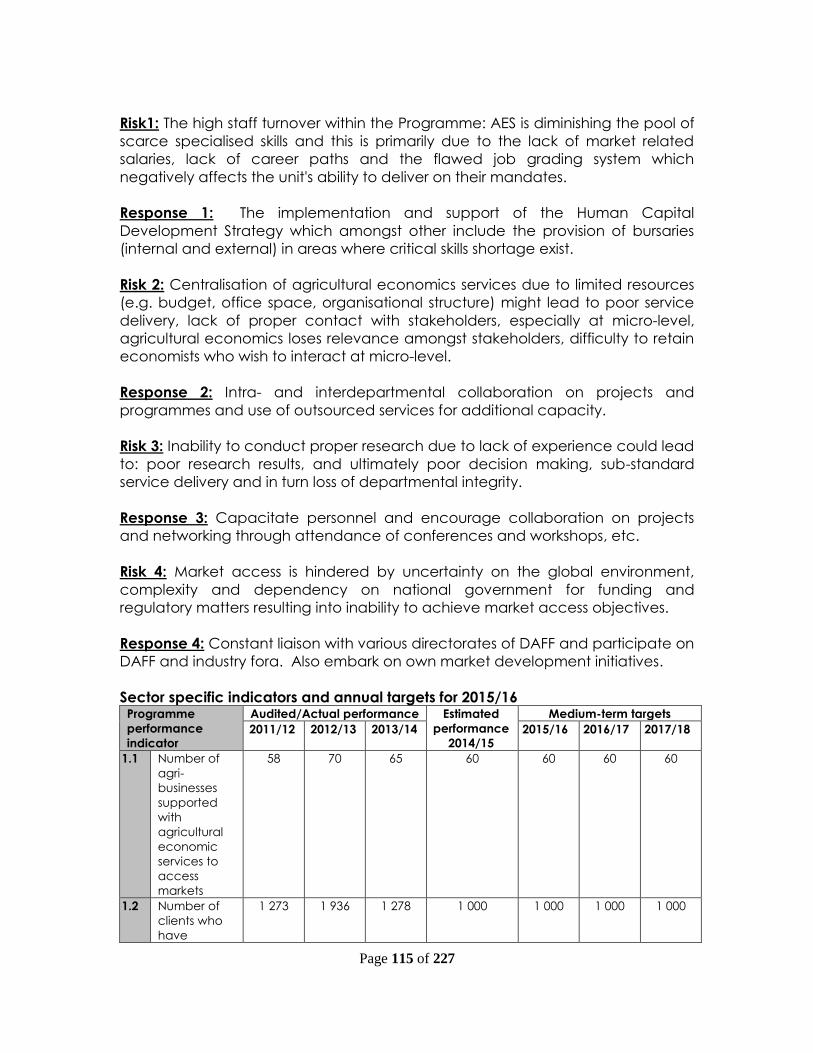
Page 115 of 227
Risk1: The high staff turnover within the Programme: AES is diminishing the pool of
scarce specialised skills and this is primarily due to the lack of market related
salaries, lack of career paths and the flawed job grading system which
negatively affects the unit's ability to deliver on their mandates.
Response 1: The implementation and support of the Human Capital
Development Strategy which amongst other include the provision of bursaries
(internal and external) in areas where critical skills shortage exist.
Risk 2: Centralisation of agricultural economics services due to limited resources
(e.g. budget, office space, organisational structure) might lead to poor service
delivery, lack of proper contact with stakeholders, especially at micro-level,
agricultural economics loses relevance amongst stakeholders, difficulty to retain
economists who wish to interact at micro-level.
Response 2: Intra- and interdepartmental collaboration on projects and
programmes and use of outsourced services for additional capacity.
Risk 3: Inability to conduct proper research due to lack of experience could lead
to: poor research results, and ultimately poor decision making, sub-standard
service delivery and in turn loss of departmental integrity.
Response 3: Capacitate personnel and encourage collaboration on projects
and networking through attendance of conferences and workshops, etc.
Risk 4: Market access is hindered by uncertainty on the global environment,
complexity and dependency on national government for funding and
regulatory matters resulting into inability to achieve market access objectives.
Response 4: Constant liaison with various directorates of DAFF and participate on
DAFF and industry fora. Also embark on own market development initiatives.
Sector specific indicators and annual targets for 2015/16 Programme
performance
indicator
Audited/Actual performance Estimated
performance
2014/15
Medium-term targets
2011/12 2012/13 2013/14 2015/16 2016/17 2017/18
1.1 Number of
agri-
businesses
supported
with
agricultural
economic
services to
access
markets
58 70 65 60 60 60 60
1.2 Number of
clients who
have
1 273 1 936 1 278 1 000 1 000 1 000 1 000

Page 116 of 227
Programme
performance
indicator
Audited/Actual performance Estimated
performance
2014/15
Medium-term targets
2011/12 2012/13 2013/14 2015/16 2016/17 2017/18
benefitted
from
agricultural
economic
advice
provided
Provincial specific indicators and annual targets for 2015/16 Programme
performance
indicator
Audited/Actual performance Estimated
performance
2014/15
Medium-term targets
2011/12 2012/13 2013/14 2015/16 2016/17 2017/18
1.1 Number of
marketing
information
outputs
disseminated
61 54 54
34 55 55 55
1.2 Value of
committed
investment
for green
fields and
expansion
agricultural
and
agribusiness
projects
R82
million
R172.2
million
R105
million
R60 million R80
million
R80
million
R80
million
1.3 Number of
budgets
developed
35 11 34
25 25 25 20
1.4 Number of
budgets
updated
14 24 25
15 15 15 30
1.5 Number of
existing
agricultural
cooperatives
supported
Not
reported
on
during
this
period
10 44
15 15 15 15
1.6 Number of
agricultural
cooperatives
developed
Not
reported
on
during
this
period
40 16 15 15 15 15
1.7 Number of
stakeholders
engaged on
agricultural
economic
activities
Not
reported
on
during
this
period
119 53
65 65 65 65
1.8 Numbers of
participants
attended
the Ethical
Not
reported
on
during
Not
reported
on
during
Not
reported
on
during
240 1 200 1 220 600

Page 117 of 227
Programme
performance
indicator
Audited/Actual performance Estimated
performance
2014/15
Medium-term targets
2011/12 2012/13 2013/14 2015/16 2016/17 2017/18
Trade
training
this
period
this
period
this
period
1.9 Number of
growers
registered as
members of
ethical trade
Not
reported
on
during
this
period
Not
reported
on
during
this
period
Not
reported
on
during
this
period
Not
reported on
during this
period
1 500 1 550 1 600
1.10 Number of
agricultural
economic
studies
conducted
43 16 9 12 12 12 12
1.11 Number of
activities
supported to
promote
Western
Cape
products
Not
reported
on
during
this
period
Not
reported
on
during
this
period
Not
reported
on
during
this
period
Not
reported on
during this
period
4 4 4
1.12 Number of
meat
processing
businesses
supported
for
compliance
Not
reported
on
during
this
period
Not
reported
on
during
this
period
Not
reported
on
during
this
period
Not
reported on
during this
period
10 15 20
Sector specific indicators for 2015/16
Performance
indicator
Reporting
period
Annual target
2015/16
Quarterly targets
1st 2nd 3rd 4th
1.1 Number of agri-
businesses
supported with
agricultural
economic
services to
access markets
Quarterly 60 13 12 25 10
1.2 Number of
clients who have
benefitted from
agricultural
economic
advice provided
Quarterly 1 000 250 250 250 250
Provincial specific indicators for 2015/16 Performance
indicator
Reporting
period
Annual target
2015/16
Quarterly targets
1st 2nd 3rd 4th
1.1 Number of
marketing
information
outputs
Quarterly 55 15 15 10 15
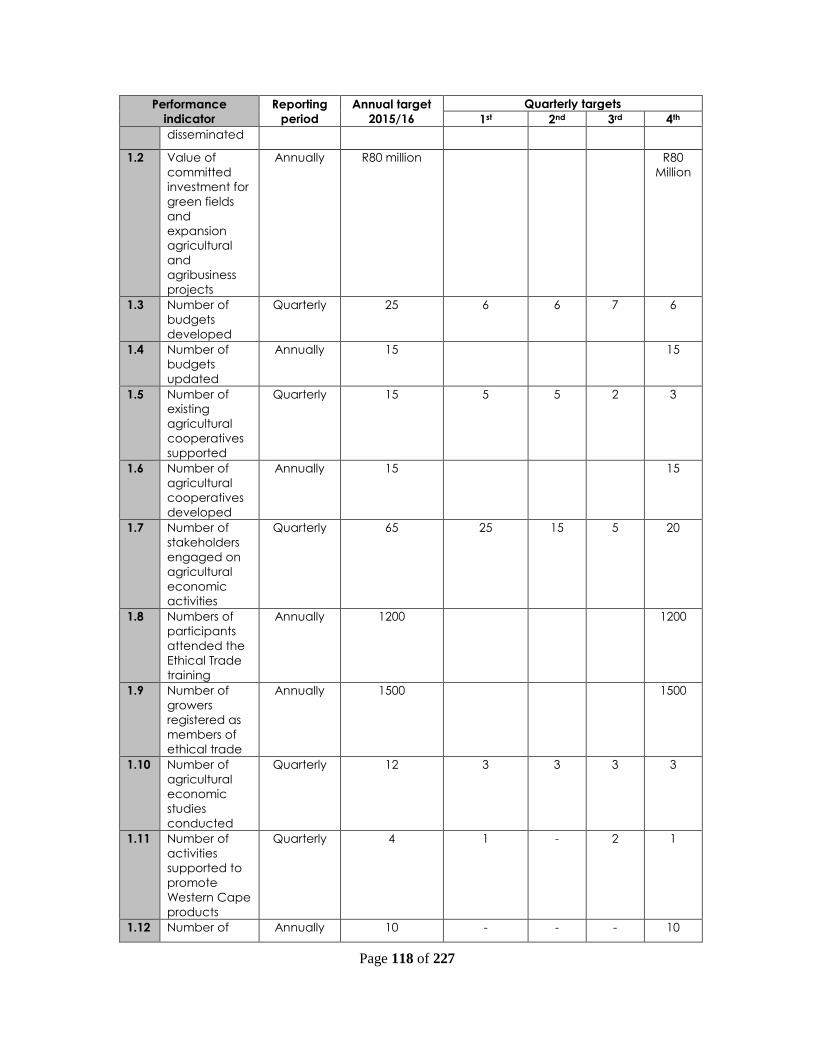
Page 118 of 227
Performance
indicator
Reporting
period
Annual target
2015/16
Quarterly targets
1st 2nd 3rd 4th
disseminated
1.2 Value of
committed
investment for
green fields
and
expansion
agricultural
and
agribusiness
projects
Annually R80 million R80
Million
1.3 Number of
budgets
developed
Quarterly 25
6 6 7 6
1.4 Number of
budgets
updated
Annually 15 15
1.5 Number of
existing
agricultural
cooperatives
supported
Quarterly 15 5 5 2 3
1.6 Number of
agricultural
cooperatives
developed
Annually 15 15
1.7 Number of
stakeholders
engaged on
agricultural
economic
activities
Quarterly 65 25 15 5 20
1.8 Numbers of
participants
attended the
Ethical Trade
training
Annually 1200 1200
1.9 Number of
growers
registered as
members of
ethical trade
Annually 1500 1500
1.10 Number of
agricultural
economic
studies
conducted
Quarterly 12 3 3 3 3
1.11 Number of
activities
supported to
promote
Western Cape
products
Quarterly 4 1 - 2 1
1.12 Number of Annually 10 - - - 10

Page 119 of 227
Performance
indicator
Reporting
period
Annual target
2015/16
Quarterly targets
1st 2nd 3rd 4th
meat
processing
businesses
supported for
compliance
12.3 Sub-Programmes 6.2: Macroeconomics Support
Provide macroeconomic and statistical information on the performance of the
agricultural sector in order to inform planning and decision making.
Strategic objective Information activities performed to support sound decision-making
Objective statement
The uncertain global economic environment due to unstable
exchange rates, commodity prices, unpredictable weather conditions
require proper risk management tools and research to assist the
agricultural firms and industries with strategic and decision-making
information. To conduct this type of research availability of data is of
importance to ensure proper and improved baseline information to be
able to make informed decisions.
Baseline Performed 211 information activities to support sound decision making.
Justification
The databases and analysis conducted provides baseline data that
enables decision makers to identify trends and react timely and
implement strategies and actions where necessary. The agricultural
industries that are of strategic importance to the Western Cape
Province e.g. grain, fruit industry, notably table grape, wine, apple and
pear industries, are supported with strategic decision-making through
results generated with economic projection models and scenario
planning. Economy-wide modelling is applied to determine the
impact of policy changes on economic growth, employment,
redistribution and general household welfare.
Links
The baseline is critical to evaluate progress and impact on all the
objectives as specified in the strategic documents i.e. NDP, NOs and
PSG 1 and departmental strategic plan.
Strategic
Objective
performance
indicator
Audited/Actual performance Estimated
performance
2014/15
Medium-term targets
2011/12 2012/13 2013/14 2015/16 2016/17 2017/18
1.1 Number of
information
activities
performed
to support
sound
decision
making
253 302 414 245 244 254 280
12.3.1 Risk Management
Risk 1: Unreliable agricultural data may lead to poor policy and decision making
and improper/skewed results on analysis conducted.

Page 120 of 227
Response 1: Invested into data management systems e.g. Programme’s
Databases, and collaborate on transversal systems e.g. Agriculture Integrated
Management System (AIMS).
Risk 2: Non-prioritised /irrelevant research efforts due to misaligned research
agenda in various institutions and improper communication on research priorities
leading to the following:
- Poor policy and management decision making
- Reputational risk/adverse publicity and relations.
- Strategic objectives of the Programme and the Department may not be
achieved, and
- Fruitless and wasteful expenditure.
Response 2: Working relationship with some tertiary institutions (funding
university/institutions to perform relevant research linked to strategic objectives).
Priorities could also be picked up from an enquiry database that is updated on a
regular basis. Existing collaboration internally and externally (other departments,
industry). Encourage dissemination of research results in popular, scientific
publications and other media.
Risk 3: Inability to update selected databases (e.g. Black Farmer and Food
Garden Surveys) due to lack of funding and cooperation may lead to improper
understanding of structural changes and subsequently substandard decisions
and interventions.
Response 3: Cooperated with Programmes that are decentralised.
Sector specific indicators and annual targets for 2015/16 Programme
performance
indicator
Audited/Actual
performance
Estimated
performance
2014/15
Medium-term targets
2011/12 2012/13 2013/14 2015/16 2016/17 2017/18
1.1 Number of
agricultural
economic
information
responses
provided
176 142 166
140 140 140 140
1.2 Number of
economic
reports
compiled
43 37 36
30 30 30 30
Provincial specific indicators and annual targets for 2015/16 Programme
performance
indicator
Audited/Actual performance Estimated
performance
2014/15
Medium-term targets
2011/12 2012/13 2013/14 2015/16 2016/17 2017/18
1.1 Number of
databases
34 44 43
44 44 44 50
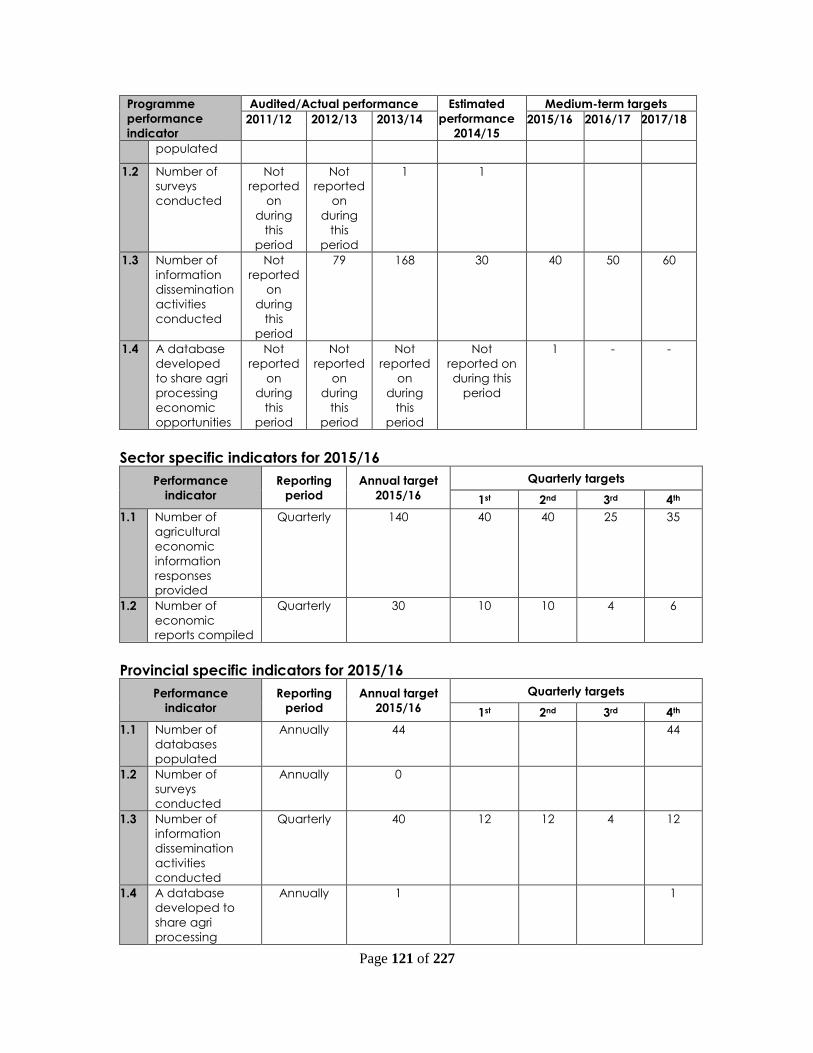
Page 121 of 227
Programme
performance
indicator
Audited/Actual performance Estimated
performance
2014/15
Medium-term targets
2011/12 2012/13 2013/14 2015/16 2016/17 2017/18
populated
1.2 Number of
surveys
conducted
Not
reported
on
during
this
period
Not
reported
on
during
this
period
1
1
1.3 Number of
information
dissemination
activities
conducted
Not
reported
on
during
this
period
79 168 30 40 50 60
1.4 A database
developed
to share agri
processing
economic
opportunities
Not
reported
on
during
this
period
Not
reported
on
during
this
period
Not
reported
on
during
this
period
Not
reported on
during this
period
1 - -
Sector specific indicators for 2015/16
Performance
indicator
Reporting
period
Annual target
2015/16
Quarterly targets
1st 2nd 3rd 4th
1.1 Number of
agricultural
economic
information
responses
provided
Quarterly 140 40 40 25 35
1.2 Number of
economic
reports compiled
Quarterly 30 10 10 4 6
Provincial specific indicators for 2015/16
Performance
indicator
Reporting
period
Annual target
2015/16
Quarterly targets
1st 2nd 3rd 4th
1.1 Number of
databases
populated
Annually 44 44
1.2 Number of
surveys
conducted
Annually 0
1.3 Number of
information
dissemination
activities
conducted
Quarterly 40 12 12 4 12
1.4 A database
developed to
share agri
processing
Annually 1 1
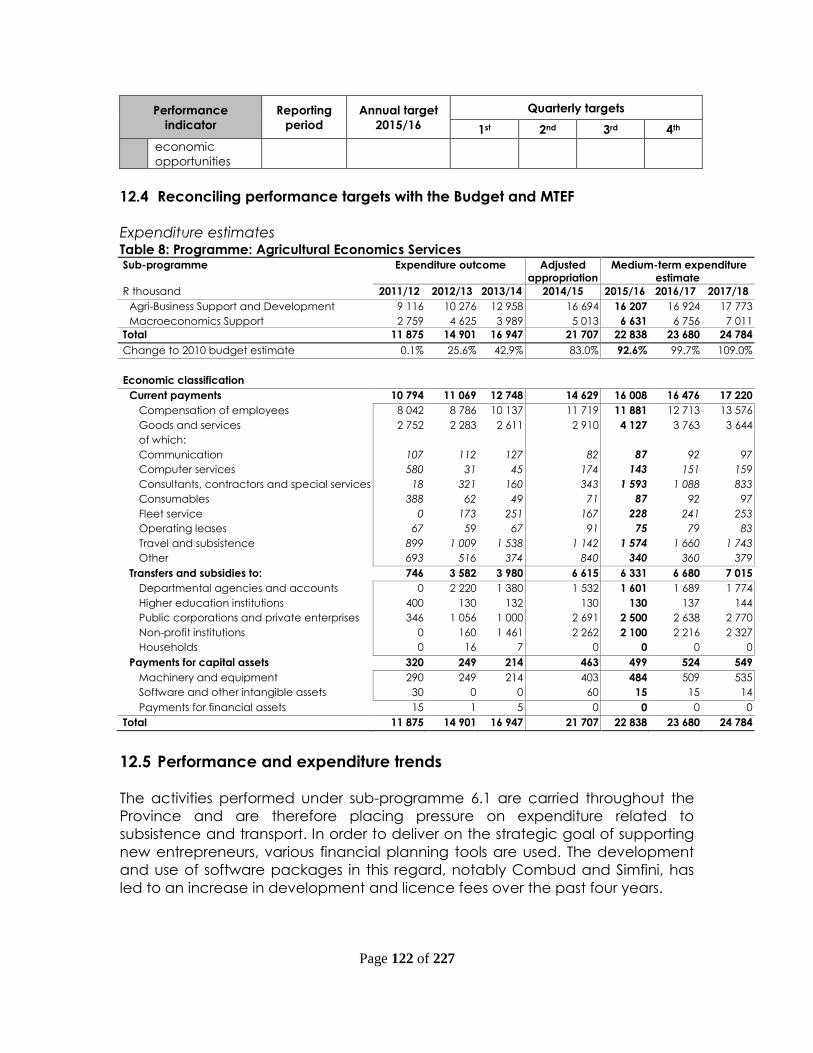
Page 122 of 227
Performance
indicator
Reporting
period
Annual target
2015/16
Quarterly targets
1st 2nd 3rd 4th
economic
opportunities
12.4 Reconciling performance targets with the Budget and MTEF
Expenditure estimates Table 8: Programme: Agricultural Economics Services Sub-programme Expenditure outcome Adjusted
appropriation
Medium-term expenditure
estimate
R thousand 2011/12 2012/13 2013/14 2014/15 2015/16 2016/17 2017/18
Agri-Business Support and Development 9 116 10 276 12 958 16 694 16 207 16 924 17 773
Macroeconomics Support 2 759 4 625 3 989 5 013 6 631 6 756 7 011
Total 11 875 14 901 16 947 21 707 22 838 23 680 24 784
Change to 2010 budget estimate 0.1% 25.6% 42.9% 83.0% 92.6% 99.7% 109.0%
Economic classification
Current payments 10 794 11 069 12 748 14 629 16 008 16 476 17 220
Compensation of employees 8 042 8 786 10 137 11 719 11 881 12 713 13 576
Goods and services 2 752 2 283 2 611 2 910 4 127 3 763 3 644
of which:
Communication 107 112 127 82 87 92 97
Computer services 580 31 45 174 143 151 159
Consultants, contractors and special services 18 321 160 343 1 593 1 088 833
Consumables 388 62 49 71 87 92 97
Fleet service 0 173 251 167 228 241 253
Operating leases 67 59 67 91 75 79 83
Travel and subsistence 899 1 009 1 538 1 142 1 574 1 660 1 743
Other 693 516 374 840 340 360 379
Transfers and subsidies to: 746 3 582 3 980 6 615 6 331 6 680 7 015
Departmental agencies and accounts 0 2 220 1 380 1 532 1 601 1 689 1 774
Higher education institutions 400 130 132 130 130 137 144
Public corporations and private enterprises 346 1 056 1 000 2 691 2 500 2 638 2 770
Non-profit institutions 0 160 1 461 2 262 2 100 2 216 2 327
Households 0 16 7 0 0 0 0
Payments for capital assets 320 249 214 463 499 524 549
Machinery and equipment 290 249 214 403 484 509 535
Software and other intangible assets 30 0 0 60 15 15 14
Payments for financial assets 15 1 5 0 0 0 0
Total 11 875 14 901 16 947 21 707 22 838 23 680 24 784
12.5 Performance and expenditure trends
The activities performed under sub-programme 6.1 are carried throughout the
Province and are therefore placing pressure on expenditure related to
subsistence and transport. In order to deliver on the strategic goal of supporting
new entrepreneurs, various financial planning tools are used. The development
and use of software packages in this regard, notably Combud and Simfini, has
led to an increase in development and licence fees over the past four years.

Page 123 of 227
Standardised programmes are, however, crucial for quality assurance and the
capturing of financial data for research and advice. In order to track progress on
strategic goals for the Department it is necessary to measure certain indicators
over time. To this end various databases have been developed and these are
maintained to allow for comparison of future information to a baseline in order to
track progress.
Bearing the above in mind the increase between 2011/12 and 2014/15 is R5.935
million (16.7% per annum). However, if it is taken into account that the 2011/12
and beyond amount includes R2 million per annum for an agri-investment unit at
Wesgro and increasing the access to the China market by another R2 million in
2012/13. In 2013/14 another R2 million per annum was received for ethical trade.
Given that 66.1% of this budget is compensation of employees (CoE), it can be
understood that any increase in CoE above the prescribed budgeted increase is
rather detrimental.
13 Programme 7 – Structured Agricultural Education and Training
13.1 Strategic objective annual targets for 2015/16
The purpose of the Programme is to facilitate and provide structured agricultural
education and training in line with the Agricultural Education and Training
Strategy to all participants in the agricultural sector in order to establish a
knowledgeable, prosperous and competitive sector.
The purpose of the sub-programmes is as follows:
Higher Education and Training (HET): To provide accredited higher education
and training from NQF levels 5 and above to anybody who desires to study in
agriculture and related fields.
Further Education and Training: To provide formal and non-formal training on NQF
levels 1 to 4 through FET structured education and training programmes to all
interested agricultural role players.
Strategic objectives are documented per sub-programme.
13.2 Sub-Programmes 7.1: Higher Education and Training
Strategic objective
Provide tertiary agricultural education and training from NQF levels 5
to anybody who meets the minimum requirements to study in
agriculture and related fields.
Objective statement
To ensure that accredited training programmes and modules are
offered to all the registered students of the various agricultural higher
education streams.
Baseline
At least 410 students annually registered in the following programme
offerings: B. Agric, Diploma in Agriculture and Cellar Technology,
Higher Certificate and Certificate in Horse Mastership and Preliminary
Riding Instruction.
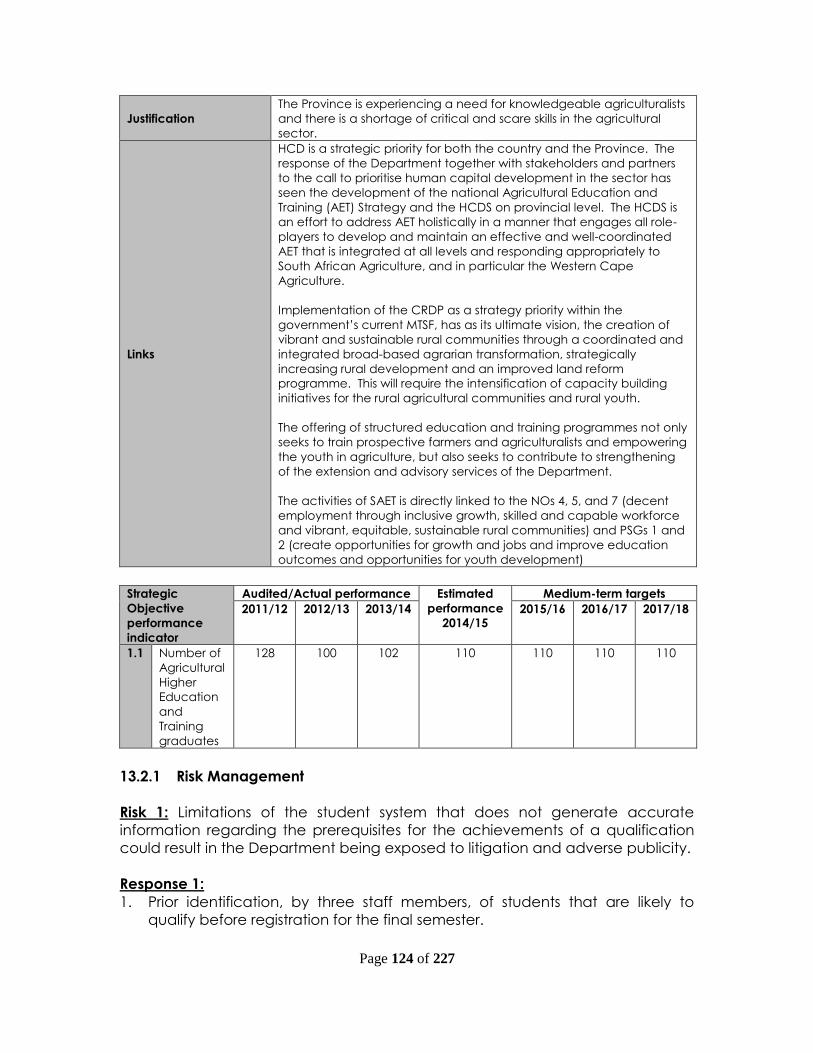
Page 124 of 227
Justification
The Province is experiencing a need for knowledgeable agriculturalists
and there is a shortage of critical and scare skills in the agricultural
sector.
Links
HCD is a strategic priority for both the country and the Province. The
response of the Department together with stakeholders and partners
to the call to prioritise human capital development in the sector has
seen the development of the national Agricultural Education and
Training (AET) Strategy and the HCDS on provincial level. The HCDS is
an effort to address AET holistically in a manner that engages all role-
players to develop and maintain an effective and well-coordinated
AET that is integrated at all levels and responding appropriately to
South African Agriculture, and in particular the Western Cape
Agriculture.
Implementation of the CRDP as a strategy priority within the
government’s current MTSF, has as its ultimate vision, the creation of
vibrant and sustainable rural communities through a coordinated and
integrated broad-based agrarian transformation, strategically
increasing rural development and an improved land reform
programme. This will require the intensification of capacity building
initiatives for the rural agricultural communities and rural youth.
The offering of structured education and training programmes not only
seeks to train prospective farmers and agriculturalists and empowering
the youth in agriculture, but also seeks to contribute to strengthening
of the extension and advisory services of the Department.
The activities of SAET is directly linked to the NOs 4, 5, and 7 (decent
employment through inclusive growth, skilled and capable workforce
and vibrant, equitable, sustainable rural communities) and PSGs 1 and
2 (create opportunities for growth and jobs and improve education
outcomes and opportunities for youth development)
Strategic
Objective
performance
indicator
Audited/Actual performance Estimated
performance
2014/15
Medium-term targets
2011/12 2012/13 2013/14 2015/16 2016/17 2017/18
1.1 Number of
Agricultural
Higher
Education
and
Training
graduates
128 100 102 110 110 110 110
13.2.1 Risk Management
Risk 1: Limitations of the student system that does not generate accurate
information regarding the prerequisites for the achievements of a qualification
could result in the Department being exposed to litigation and adverse publicity.
Response 1:
1. Prior identification, by three staff members, of students that are likely to
qualify before registration for the final semester.
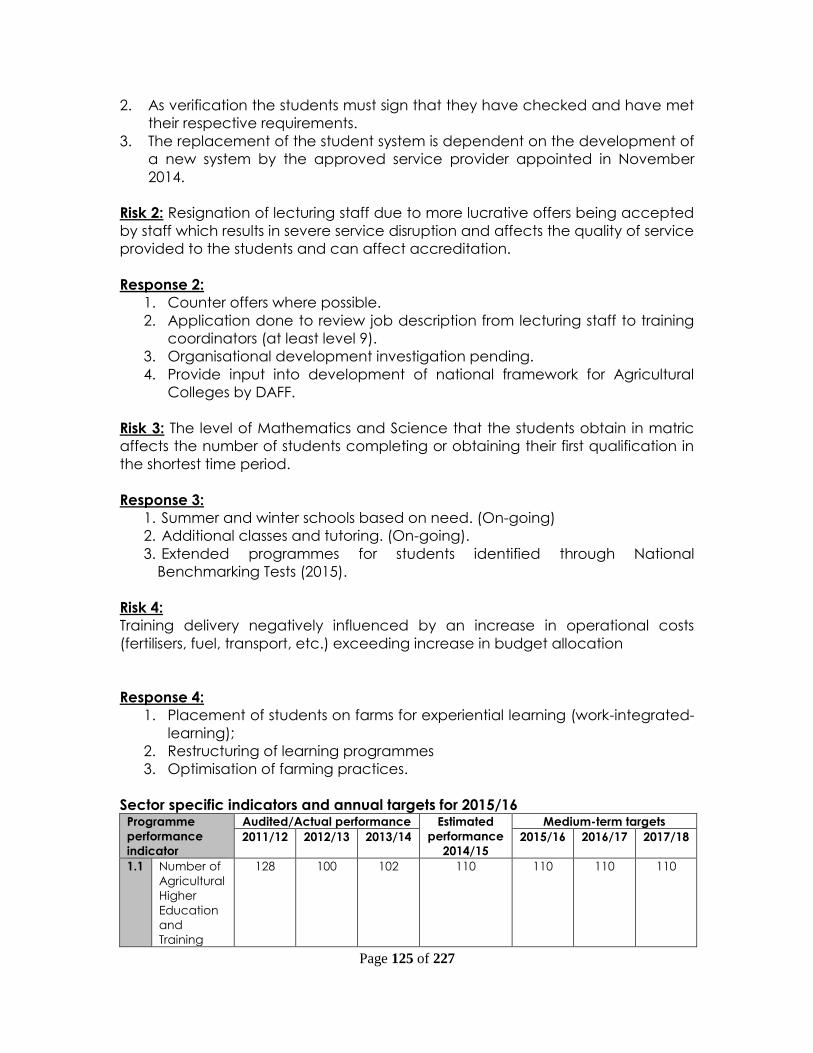
Page 125 of 227
2. As verification the students must sign that they have checked and have met
their respective requirements.
3. The replacement of the student system is dependent on the development of
a new system by the approved service provider appointed in November
2014.
Risk 2: Resignation of lecturing staff due to more lucrative offers being accepted
by staff which results in severe service disruption and affects the quality of service
provided to the students and can affect accreditation.
Response 2:
1. Counter offers where possible.
2. Application done to review job description from lecturing staff to training
coordinators (at least level 9).
3. Organisational development investigation pending.
4. Provide input into development of national framework for Agricultural
Colleges by DAFF.
Risk 3: The level of Mathematics and Science that the students obtain in matric
affects the number of students completing or obtaining their first qualification in
the shortest time period.
Response 3:
1. Summer and winter schools based on need. (On-going)
2. Additional classes and tutoring. (On-going).
3. Extended programmes for students identified through National
Benchmarking Tests (2015).
Risk 4:
Training delivery negatively influenced by an increase in operational costs
(fertilisers, fuel, transport, etc.) exceeding increase in budget allocation
Response 4:
1. Placement of students on farms for experiential learning (work-integrated-
learning);
2. Restructuring of learning programmes
3. Optimisation of farming practices.
Sector specific indicators and annual targets for 2015/16 Programme
performance
indicator
Audited/Actual performance Estimated
performance
2014/15
Medium-term targets
2011/12 2012/13 2013/14 2015/16 2016/17 2017/18
1.1 Number of
Agricultural
Higher
Education
and
Training
128 100 102 110 110 110 110

Page 126 of 227
Programme
performance
indicator
Audited/Actual performance Estimated
performance
2014/15
Medium-term targets
2011/12 2012/13 2013/14 2015/16 2016/17 2017/18
graduates
Provincial specific indicators and annual targets for 2015/16 Programme
performance
indicator
Audited/Actual performance Estimated
performance
2014/15
Medium-term targets
2011/12 2012/13 2013/14 2015/16 2016/17 2017/18
1.1 Number of
students
registering
into
accredited
Higher
Education*
454 401 442 439 410 410 410
1.2 Number of
internal
bursaries
awarded**
90 23 new
37
existing
50 40 20 20 20
1.3 Implementa
tion of
student
equity
targets*
118 100 100 90 90 90
1.4 Number of
short
courses
offered*
7 7 7 5 5 5 5
1.5 Number of
students
completing
short
courses*
167 150 170 150 168 170 170
1.6 Number of
agri
processing
short
courses
offered
and/or
supported
Not
reporte
d on
during
this
period
Not
reporte
d on
during
this
period
Not
reported
on
during
this
period
Not
reported on
during this
period
3 3 3
Sector specific indicators for 2015/16
Performance
indicator
Reporting
period
Annual target
2015/16
Quarterly targets
1st 2nd 3rd 4th
1.1 Number of
Agricultural
Higher
Education and
Training
graduates
Annually 110 110
Provincial specific indicators for 2015/16

Page 127 of 227
Performance
indicator
Reporting
period
Annual target
2015/16 Quarterly targets
1st 2nd 3rd 4th
1.1 Number of
students
entering into
accredited
Higher
Education*
Annually 410 410
1.2 Number of
internal
bursaries
awarded**
Annually 20 20
1.3 Implementation
of student
equity targets*
Annually 90 90
1.4 Number of
short courses
offered*
Quarterly 5 1 2 1 1
1.5 Number of
students
completing
short courses*
Quarterly 168 50 45 8 65
1.6 Number of agri
processing short
courses offered
and/or
supported
Quarterly 3 1 1 1
*Demand driven
** Depending on demand and available funding 1 Including 10 beneficiaries of the APFRYD-programme
13.3 Sub-Programmes 7.2: Further Education and Training
1.1 Strategic objective
Provide formal and non-formal training on NQF levels 1 to 4 through FET
structured education and training programmes to all interested
agricultural role-players.
Objective statement
Ensure that skills training modules and accredited learnership
programmes at NQF levels 1 to 4 are provided to the intended target
group within the FET band.
Baseline Approximately 55 learners on learnership programmes and1 800
beneficiaries of skills training.
Justification
Communities (previously disadvantaged) must be integrated into the
agricultural sector. Accessibility to training to all sections of the
community is the only way in which the PSGs 1 and 2 will be achieved,
i.e. create opportunities for growth and jobs and improve education
outcomes and opportunities for youth development. To also ensure
contribution to the broad goals of the country, including poverty
alleviation, food security for all, wealth creation and accelerated
growth, skills development of the farm worker and expanding
smallholder farmers, in line with the need of the sector, is of utmost
importance. The specialisation in skills transfer at the decentralised
centres plays an important role in achieving all of these objectives.
Links
Human Capital Development is a strategic priority for both country,
Province and Department. The response of the Department together
with stakeholders and partners to the call to prioritise human capital
development in the sector has seen the development of the national

Page 128 of 227
AET strategy and the HCDS on provincial level. The HCDS is an effort to
address AET holistically in a manner that engages all role players to
develop and maintain an effective and well-coordinated AET that is
integrated at all levels and responding appropriately to South African
Agriculture, and in particular the Western Cape Agriculture.
Previously disadvantaged communities (including farm workers and in
particular women and the disabled), continue to have poor access to
quality AET. This is a result of various barriers, including affordability,
admission requirements, physical distance from training centres, literacy
and numeracy and language of instruction. The offering of quality
needs-driven training and skills transfer of FET level on a decentralised
basis seeks to address these challenges and to support Agricultural
BBBEE. Strengthening of industry partnerships, as well as
interdepartmental collaboration with relevant units will contribute to the
achievement of this objective.
Implementation of the CRDP as a strategic priority within the
government’s current MTSF has as its ultimate vision the creation of
vibrant and sustainable rural communities through a coordinated and
integrated broad-based agrarian transformation, strategically increasing
rural development and an improve land reform programme. This will
require the intensification of capacity building initiatives for the rural
agricultural communities and rural youth, especially with regards to the
skills transfer programmes offered at the decentralised training centres.
Strategic
Objective
performance
indicator
Audited/Actual performance Estimated
performance
2014/15
Medium-term targets
2011/12 2012/13 2013/14 2015/16 2016/17 2017/18
1.1 Number of
participants
trained in
Further
Education
and Training
programmes
1 940 2 482 2 700 1 800 1 800 1 800 1 900
13.3.1 Risk Management
Risk 1: Resignation of lecturing staff due to more lucrative offers being accepted
by staff which results in severe service disruption and affects the quality of service
provided to the students and can affect accreditation.
Response 1:
1. Counter offers where possible.
2. Application done to review job description from lecturing staff to training
coordinators (at least level 9).
3. Organisational development investigation pending.
4. Provide input into development of national framework for Agricultural
Colleges by DAFF.
5. Exploring partnerships with accredited institutions.

Page 129 of 227
Risk 2: Training delivery negatively influenced by an increase in operational costs
(fertilisers, fuel, transport, etc.) exceeding increase in budget allocation.
Response 2:
1. Placement of students on farms for experiential learning (work-integrated-
learning);
2. Restructuring of learning programmes
3. Optimisation of farming practices.
Sector specific indicators and annual targets for 2015/16 Programme
performance
indicator
Audited/Actual performance Estimated
performance
2014/15
Medium-term targets
2011/12 2012/13 2013/14 2015/16 2016/17 2017/18
1.1 Number of
participants
trained in
Further
Education
and Training
programmes
1 940 2 482 2 700 2 300 1 800 1 800 1 900
Provincial specific indicators and annual targets for 2015/16 Programme
performance
indicator
Audited/Actual performance Estimated
performance
2014/15
Medium-term targets
2011/12 2012/13 2013/14 2015/16 2016/17 2017/18
1.1 Number of
learners
enrolled in
learnership
programmes
102 91 55 55 55 55 55
1.2 Number of
learners
completing
learnership
programmes
79 79 80 44 45 45 45
1.3 Articulation/
RPL of FET
learners to
HET
7 8 15 13 15 15 15
Sector specific indicators for 2015/16
Performance
indicator
Reporting
period
Annual target
2015/16
Quarterly targets
1st 2nd 3rd 4th
1.1 Number of
participants
trained in Further
Education and
Training
programmes
Quarterly 1 800 400 500 500 400
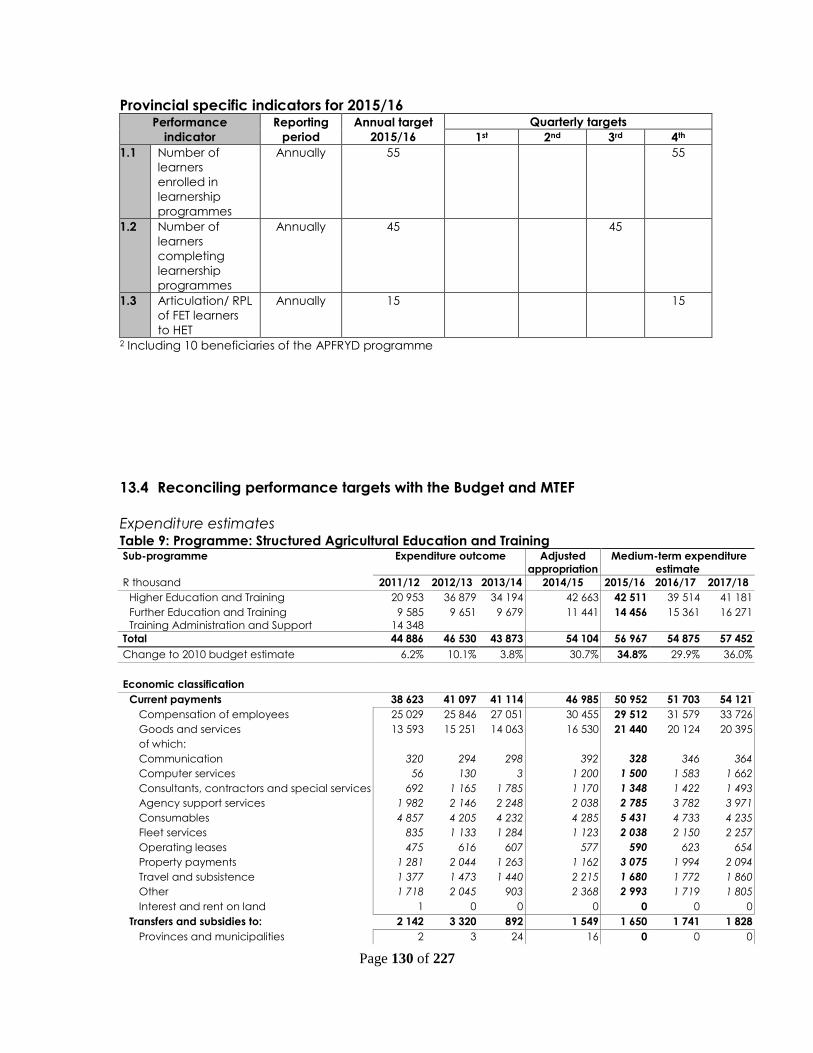
Page 130 of 227
Provincial specific indicators for 2015/16 Performance
indicator
Reporting
period
Annual target
2015/16
Quarterly targets
1st 2nd 3rd 4th
1.1 Number of
learners
enrolled in
learnership
programmes
Annually 55 55
1.2 Number of
learners
completing
learnership
programmes
Annually 45 45
1.3 Articulation/ RPL
of FET learners
to HET
Annually 15 15
2 Including 10 beneficiaries of the APFRYD programme
13.4 Reconciling performance targets with the Budget and MTEF
Expenditure estimates Table 9: Programme: Structured Agricultural Education and Training Sub-programme Expenditure outcome Adjusted
appropriation
Medium-term expenditure
estimate
R thousand 2011/12 2012/13 2013/14 2014/15 2015/16 2016/17 2017/18
Higher Education and Training 20 953 36 879 34 194 42 663 42 511 39 514 41 181
Further Education and Training
Training Administration and Support
9 585
14 348
9 651 9 679 11 441 14 456 15 361 16 271
Total 44 886 46 530 43 873 54 104 56 967 54 875 57 452
Change to 2010 budget estimate 6.2% 10.1% 3.8% 30.7% 34.8% 29.9% 36.0%
Economic classification
Current payments 38 623 41 097 41 114 46 985 50 952 51 703 54 121
Compensation of employees 25 029 25 846 27 051 30 455 29 512 31 579 33 726
Goods and services 13 593 15 251 14 063 16 530 21 440 20 124 20 395
of which:
Communication 320 294 298 392 328 346 364
Computer services 56 130 3 1 200 1 500 1 583 1 662
Consultants, contractors and special services 692 1 165 1 785 1 170 1 348 1 422 1 493
Agency support services 1 982 2 146 2 248 2 038 2 785 3 782 3 971
Consumables 4 857 4 205 4 232 4 285 5 431 4 733 4 235
Fleet services 835 1 133 1 284 1 123 2 038 2 150 2 257
Operating leases 475 616 607 577 590 623 654
Property payments 1 281 2 044 1 263 1 162 3 075 1 994 2 094
Travel and subsistence 1 377 1 473 1 440 2 215 1 680 1 772 1 860
Other 1 718 2 045 903 2 368 2 993 1 719 1 805
Interest and rent on land 1 0 0 0 0 0 0
Transfers and subsidies to: 2 142 3 320 892 1 549 1 650 1 741 1 828
Provinces and municipalities 2 3 24 16 0 0 0
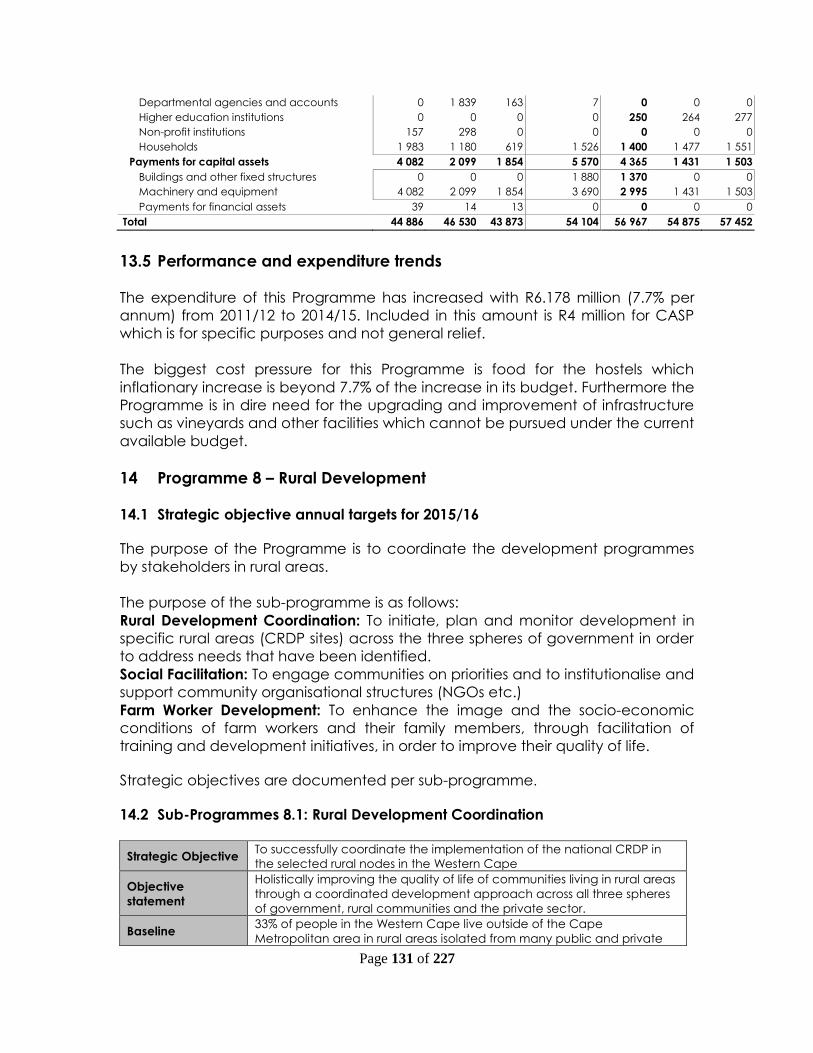
Page 131 of 227
Departmental agencies and accounts 0 1 839 163 7 0 0 0
Higher education institutions 0 0 0 0 250 264 277
Non-profit institutions 157 298 0 0 0 0 0
Households 1 983 1 180 619 1 526 1 400 1 477 1 551
Payments for capital assets 4 082 2 099 1 854 5 570 4 365 1 431 1 503
Buildings and other fixed structures 0 0 0 1 880 1 370 0 0
Machinery and equipment 4 082 2 099 1 854 3 690 2 995 1 431 1 503
Payments for financial assets 39 14 13 0 0 0 0
Total 44 886 46 530 43 873 54 104 56 967 54 875 57 452
13.5 Performance and expenditure trends
The expenditure of this Programme has increased with R6.178 million (7.7% per
annum) from 2011/12 to 2014/15. Included in this amount is R4 million for CASP
which is for specific purposes and not general relief.
The biggest cost pressure for this Programme is food for the hostels which
inflationary increase is beyond 7.7% of the increase in its budget. Furthermore the
Programme is in dire need for the upgrading and improvement of infrastructure
such as vineyards and other facilities which cannot be pursued under the current
available budget.
14 Programme 8 – Rural Development
14.1 Strategic objective annual targets for 2015/16
The purpose of the Programme is to coordinate the development programmes
by stakeholders in rural areas.
The purpose of the sub-programme is as follows:
Rural Development Coordination: To initiate, plan and monitor development in
specific rural areas (CRDP sites) across the three spheres of government in order
to address needs that have been identified.
Social Facilitation: To engage communities on priorities and to institutionalise and
support community organisational structures (NGOs etc.)
Farm Worker Development: To enhance the image and the socio-economic
conditions of farm workers and their family members, through facilitation of
training and development initiatives, in order to improve their quality of life.
Strategic objectives are documented per sub-programme.
14.2 Sub-Programmes 8.1: Rural Development Coordination
Strategic Objective To successfully coordinate the implementation of the national CRDP in
the selected rural nodes in the Western Cape
Objective
statement
Holistically improving the quality of life of communities living in rural areas
through a coordinated development approach across all three spheres
of government, rural communities and the private sector.
Baseline 33% of people in the Western Cape live outside of the Cape
Metropolitan area in rural areas isolated from many public and private
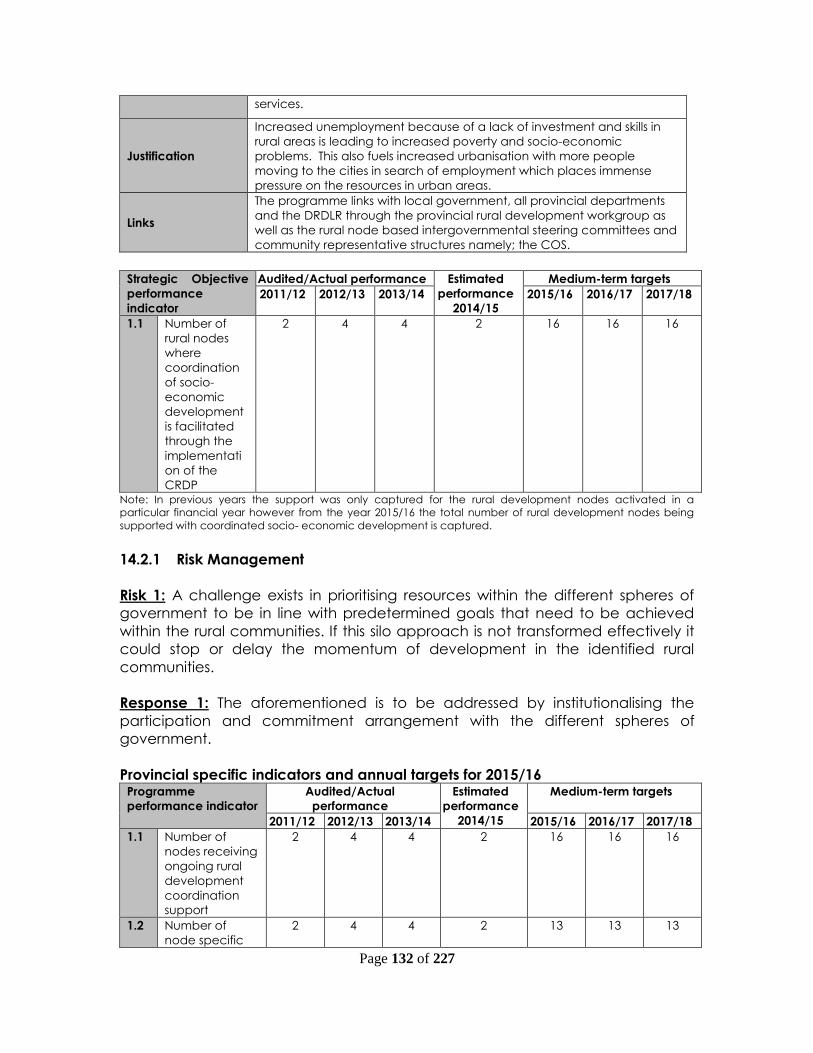
Page 132 of 227
services.
Justification
Increased unemployment because of a lack of investment and skills in
rural areas is leading to increased poverty and socio-economic
problems. This also fuels increased urbanisation with more people
moving to the cities in search of employment which places immense
pressure on the resources in urban areas.
Links
The programme links with local government, all provincial departments
and the DRDLR through the provincial rural development workgroup as
well as the rural node based intergovernmental steering committees and
community representative structures namely; the COS.
Strategic Objective
performance
indicator
Audited/Actual performance Estimated
performance
2014/15
Medium-term targets
2011/12 2012/13 2013/14 2015/16 2016/17 2017/18
1.1 Number of
rural nodes
where
coordination
of socio-
economic
development
is facilitated
through the
implementati
on of the
CRDP
2 4 4 2 16 16 16
Note: In previous years the support was only captured for the rural development nodes activated in a
particular financial year however from the year 2015/16 the total number of rural development nodes being
supported with coordinated socio- economic development is captured.
14.2.1 Risk Management
Risk 1: A challenge exists in prioritising resources within the different spheres of
government to be in line with predetermined goals that need to be achieved
within the rural communities. If this silo approach is not transformed effectively it
could stop or delay the momentum of development in the identified rural
communities.
Response 1: The aforementioned is to be addressed by institutionalising the
participation and commitment arrangement with the different spheres of
government.
Provincial specific indicators and annual targets for 2015/16 Programme
performance indicator
Audited/Actual
performance
Estimated
performance
2014/15
Medium-term targets
2011/12 2012/13 2013/14 2015/16 2016/17 2017/18
1.1 Number of
nodes receiving
ongoing rural
development
coordination
support
2 4 4 2 16 16 16
1.2 Number of
node specific
2 4 4 2 13 13 13

Page 133 of 227
Programme
performance indicator
Audited/Actual
performance
Estimated
performance
2014/15
Medium-term targets
2011/12 2012/13 2013/14 2015/16 2016/17 2017/18
interdepartmen
tal steering
committees
coordinated
1.3 Number of rural
development
provincial work
group
engagements
coordinated
4 4 4 4 4 4 4
1.4 Number of
interdepartmen
tal steering
committee
engagements
coordinated
Not
reporte
d on
during
this
period
Not
reporte
d on
during
this
period
40 44 50 50 50
Notes:
1.1) In previous years only the nodes activated to receive coordination support were captured whereas in the
2015/16 financial year the total number of nodes supported is captured, hence the dramatic increase in
the target.
1.2) In previous years only the interdepartmental steering committees newly established were captured
whereas in the 2015/16 financial year the total number of interdepartmental steering committees
coordinated are captured, hence the dramatic increase in target.
Provincial specific indicators for 2015/16 Performance
indicator
Reporting
period
Annual target
2015/16
Quarterly targets
1st 2nd 3rd 4th
1.1 Number of
nodes receiving
ongoing rural
development
coordination
support
Annually 16 16
1.2 Number of
node specific
interdepartment
al steering
committees
coordinated
Annually 13 13
1.3 Number of rural
development
provincial work
group
engagements
coordinated for
the Province
Quarterly 4 1 1 1 1
1.4 Number of
interdepartment
al steering
committee
engagements
coordinated
Quarterly 50 16 16 8 10
14.3 Sub-Programmes 8.2: Social Facilitation
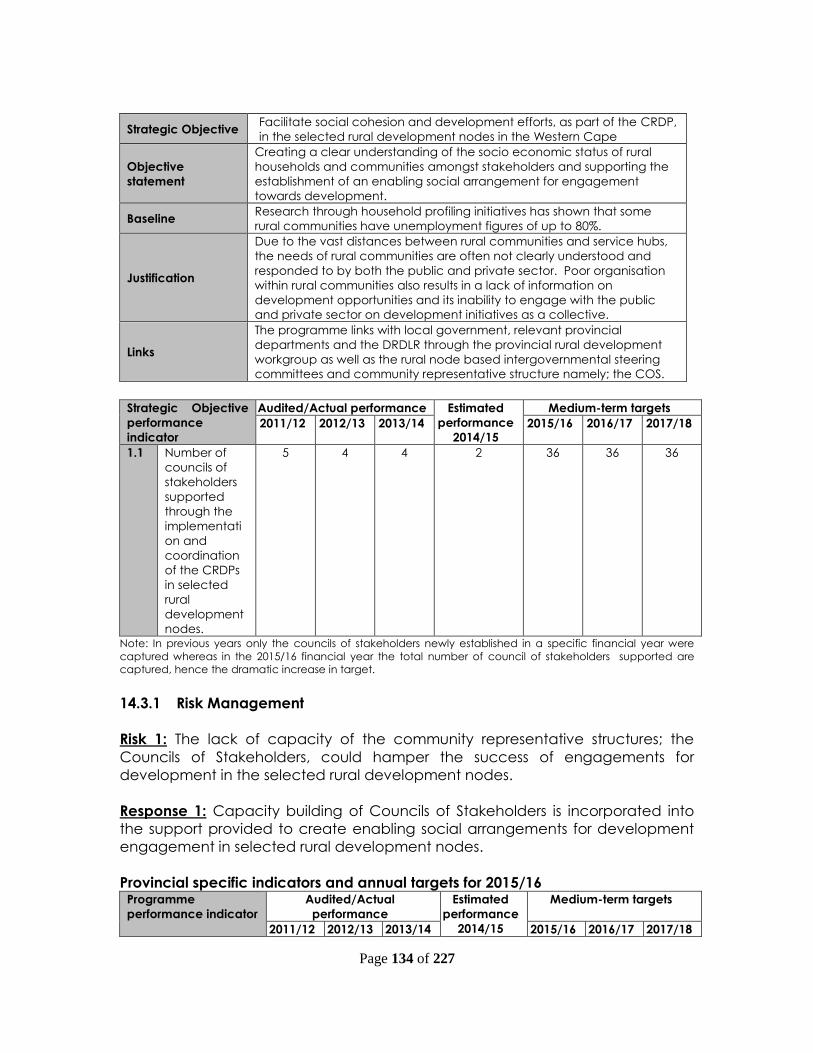
Page 134 of 227
Strategic Objective Facilitate social cohesion and development efforts, as part of the CRDP,
in the selected rural development nodes in the Western Cape
Objective
statement
Creating a clear understanding of the socio economic status of rural
households and communities amongst stakeholders and supporting the
establishment of an enabling social arrangement for engagement
towards development.
Baseline Research through household profiling initiatives has shown that some
rural communities have unemployment figures of up to 80%.
Justification
Due to the vast distances between rural communities and service hubs,
the needs of rural communities are often not clearly understood and
responded to by both the public and private sector. Poor organisation
within rural communities also results in a lack of information on
development opportunities and its inability to engage with the public
and private sector on development initiatives as a collective.
Links
The programme links with local government, relevant provincial
departments and the DRDLR through the provincial rural development
workgroup as well as the rural node based intergovernmental steering
committees and community representative structure namely; the COS.
Strategic Objective
performance
indicator
Audited/Actual performance Estimated
performance
2014/15
Medium-term targets
2011/12 2012/13 2013/14 2015/16 2016/17 2017/18
1.1 Number of
councils of
stakeholders
supported
through the
implementati
on and
coordination
of the CRDPs
in selected
rural
development
nodes.
5 4 4 2 36 36 36
Note: In previous years only the councils of stakeholders newly established in a specific financial year were
captured whereas in the 2015/16 financial year the total number of council of stakeholders supported are
captured, hence the dramatic increase in target.
14.3.1 Risk Management
Risk 1: The lack of capacity of the community representative structures; the
Councils of Stakeholders, could hamper the success of engagements for
development in the selected rural development nodes.
Response 1: Capacity building of Councils of Stakeholders is incorporated into
the support provided to create enabling social arrangements for development
engagement in selected rural development nodes.
Provincial specific indicators and annual targets for 2015/16 Programme
performance indicator
Audited/Actual
performance
Estimated
performance
2014/15
Medium-term targets
2011/12 2012/13 2013/14 2015/16 2016/17 2017/18

Page 135 of 227
Programme
performance indicator
Audited/Actual
performance
Estimated
performance
2014/15
Medium-term targets
2011/12 2012/13 2013/14 2015/16 2016/17 2017/18
1.1 Number of
councils of
stakeholders
supported
5 4 4 2 36 36 36
1.2 Number of
CRDP- IDP
linked nodal
implementation
plans
completed
2 4 4 2 5 5 5
1.3 Number of
projects
implemented in
rural
development
nodes logged
at ISCs
Not
reporte
d on
during
this
period
Not
reporte
d on
during
this
period
55 50 40 45 50
1.4 Number of
people trained
in rural
development
nodes
798 1 000 1 400 1 000 800 900 1000
Note: In previous years only the councils of stakeholders newly established in a specific financial year were
captured whereas in the 2015/16 financial year the total number of council of stakeholders supported are
captured, hence the dramatic increase in target.
Provincial specific indicators for 2015/16 Performance
indicator
Reporting
period
Annual target
2015/16
Quarterly targets
1st 2nd 3rd 4th
1.1 Number of
councils of
stakeholders
supported
Annually 36 - - - 36
1.2 Number of
CRDP- IDP
linked nodal
implementation
plans
completed
Quarterly 5 - - 2 3
1.3 Number of
projects
implemented in
rural
development
nodes logged
at ISCs
Annually 40 - - - 40
1.4 Number of
people trained
in rural
development
nodes
Quarterly 800 100 300 300 100
14.4 Sub-Programmes 8.3: Farm Worker Development

Page 136 of 227
Strategic Objective
Enhance the image and socio-economic conditions of farm workers and
their family members, through facilitation of training and development
initiatives to improve their quality of life.
Objective
statement
Facilitating training and development initiatives to benefit farm workers
and their family members to enhance their image and socio–economic
conditions.
Baseline
The Western Cape has approximately 142 000 farm workers and is home
to almost a quarter of the farm workers in the country. This is an
indication that farming in the Province is relatively more labour intensive
than in the rest of the country. Geographically the Western Cape
Province farm activities are very large and diverse and therefore it is
important to uplift and assist farm workers on all levels.
Justification
In general farm workers and their family members are isolated from the
main stream social interaction and do not have regular access to life
skills training. Furthermore, in most cases they lack the awareness of the
dangers of substance abuse and the effects it may have on the
breakdown of the social fabric in their communities. It is therefore
essential to build pride amongst farm workers and their family members
as they contribute towards the success of the sector.
Links
Engagement with municipalities and other Departments is critical to
addressing the identified farm worker needs. Also the alignment of efforts
to across government programmes to better service farm workers with a
more holistic approach within the CRDP selected nodes and on farms
supported by FSD initiatives are priority linkages. Note: The estimated number of farm workers is obtained from the Quarterly Labour Force Review Survey.
Strategic
Objective
performance
indicator
Audited/Actual
performance
Estimated
performance
2014/15
Medium-term targets
2011/12 2012/13 2013/14 2015/16 2016/17 2017/18
1.1 Number of
farm workers
and their
family
members
benefitting
from training
and
development
initiatives in
the Province
2 357 3 012 2 530 2 330 6 619 7 045 7 197
14.4.1 Risk Management
Risk 1: The absence of baseline farm worker data affects the ability to measure
the effectiveness of services rendered within the farm worker and rural
communities which could lead to a misallocation of resources.
Response 1: The sub-programme has embarked on a provincial-wide Farm
Worker Household Survey over a three-year cycle in order to compile a
database of the farm workers in Province and to determine their particular
needs per region to better inform all role players for appropriate alignment of
resources.
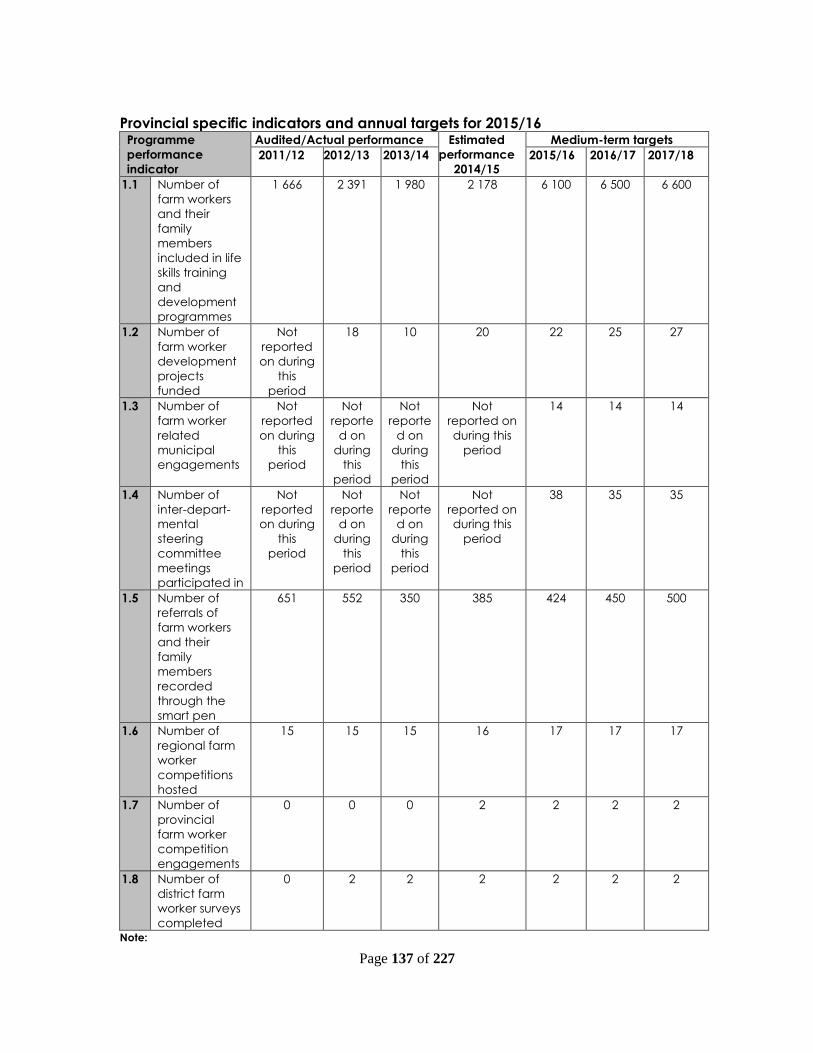
Page 137 of 227
Provincial specific indicators and annual targets for 2015/16 Programme
performance
indicator
Audited/Actual performance Estimated
performance
2014/15
Medium-term targets
2011/12 2012/13 2013/14 2015/16 2016/17 2017/18
1.1 Number of
farm workers
and their
family
members
included in life
skills training
and
development
programmes
1 666 2 391 1 980 2 178 6 100 6 500 6 600
1.2 Number of
farm worker
development
projects
funded
Not
reported
on during
this
period
18 10 20 22 25 27
1.3 Number of
farm worker
related
municipal
engagements
Not
reported
on during
this
period
Not
reporte
d on
during
this
period
Not
reporte
d on
during
this
period
Not
reported on
during this
period
14 14 14
1.4 Number of
inter-depart-
mental
steering
committee
meetings
participated in
Not
reported
on during
this
period
Not
reporte
d on
during
this
period
Not
reporte
d on
during
this
period
Not
reported on
during this
period
38 35 35
1.5 Number of
referrals of
farm workers
and their
family
members
recorded
through the
smart pen
651 552 350 385 424 450 500
1.6 Number of
regional farm
worker
competitions
hosted
15 15 15 16 17 17 17
1.7 Number of
provincial
farm worker
competition
engagements
0 0 0 2 2 2 2
1.8 Number of
district farm
worker surveys
completed
0 2 2 2 2 2 2
Note:
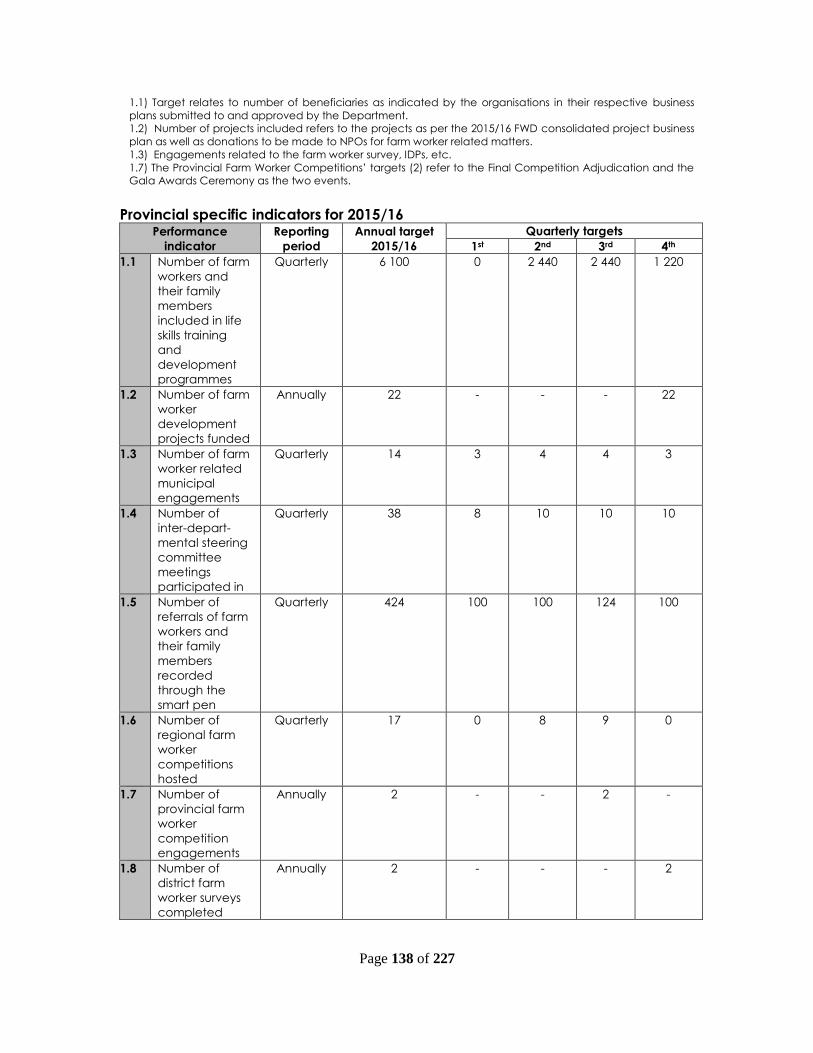
Page 138 of 227
1.1) Target relates to number of beneficiaries as indicated by the organisations in their respective business
plans submitted to and approved by the Department.
1.2) Number of projects included refers to the projects as per the 2015/16 FWD consolidated project business
plan as well as donations to be made to NPOs for farm worker related matters.
1.3) Engagements related to the farm worker survey, IDPs, etc.
1.7) The Provincial Farm Worker Competitions’ targets (2) refer to the Final Competition Adjudication and the
Gala Awards Ceremony as the two events.
Provincial specific indicators for 2015/16 Performance
indicator
Reporting
period
Annual target
2015/16
Quarterly targets
1st 2nd 3rd 4th
1.1 Number of farm
workers and
their family
members
included in life
skills training
and
development
programmes
Quarterly 6 100 0 2 440 2 440 1 220
1.2 Number of farm
worker
development
projects funded
Annually 22 - - - 22
1.3 Number of farm
worker related
municipal
engagements
Quarterly 14 3 4 4 3
1.4 Number of
inter-depart-
mental steering
committee
meetings
participated in
Quarterly 38 8 10 10 10
1.5 Number of
referrals of farm
workers and
their family
members
recorded
through the
smart pen
Quarterly 424 100 100 124 100
1.6 Number of
regional farm
worker
competitions
hosted
Quarterly 17 0 8 9 0
1.7 Number of
provincial farm
worker
competition
engagements
Annually 2 - - 2 -
1.8 Number of
district farm
worker surveys
completed
Annually 2 - - - 2

Page 139 of 227
14.5 Reconciling performance targets with the Budget and MTEF
Expenditure estimates Table 10: Programme: Rural Development Sub-programme Expenditure outcome Adjusted
appropriation
Medium-term expenditure
estimate
R thousand 2011/12 2012/13 2013/14 2014/15 2015/16 2016/17 2017/18
Rural Development Coordination 2 952 5 200 3 039 5 172 4 415 4 477 4 580
Social Facilitation 1 029 1 176 1 261
Farm Worker Development 11 063 10 760 16 167 15 383 15 666 16 424 17 282
Total 14 015 15 960 19 206 20 555 21 110 22 077 23 123
Change to 2011 budget estimate 13.9% 37.0% 46.7% 50.6% 57.5% 65.0%
Economic classification
Current payments 10 221 11 442 10 014 13 491 13 325 14 074 14 619
Compensation of employees 7 424 8 317 8 327 10 193 10 380 11 106 11 862
Goods and services 2 797 3 125 1 687 3 298 2 945 2 968 2 757
of which:
Communication 89 87 89 125 176 185 196
Consultants, contractors and special services 1 079 877 13 538 20 21 22
Consumables 169 167 113 217 262 582 610
Fleet services 193 162 143 327 255 269 282
Travel and subsistence 736 1 145 1 076 1 549 1 866 1 524 1 244
Venues and facilities 85 47 62 80 56 59 62
Other 446 640 191 462 310 328 341
Transfers and subsidies to: 3 477 4 312 8 976 6 739 7 360 7 555 8 031
Provinces and municipalities 20 0 50 0 0 0 0
Departmental agencies and accounts 150 4 0 0 0 0 0
Public corporations and private enterprises 1 321 2 883 3 612 5 839 6 260 6 383 6 834
Non-profit institutions 1 641 987 4 768 200 200 222 200
Households 345 438 546 700 900 950 997
Payments for capital assets 315 205 216 325 425 448 473
Buildings and other fixed structures 80 84 89
Machinery and equipment 315 205 216 325 345 364 384
Payment for financial assets 2 1 0 0 0 0 0
Total 14 015 15 960 19 206 20 555 2 1 110 22 077 23 123
14.6 Performance and expenditure trends
This Programme was established in 2011/12 and not much of a trend has been
established. As sub-programme 8.1 is mostly an unfunded mandate, the
Department has decided to limit its activities to the affordable (coordinating)
and not the total mandate.
The only deviation of note is the outlier of R5 million in 2013/14 which was a once-
off allocation to the budget to fund the Future of Agriculture and Rural Economy
(FARE) process for a transfer to the provincial Economic Development Agency
(EDA). This funding has now been retained in this Programme on a permanent
basis and will be used for surveys (farm workers and their families as well as the
rural development initiatives.

Page 140 of 227
PART C: LINKS TO OTHER PLANS
15 Links to the long-term infrastructure and other capital plans
The Department’s need in terms of infrastructure is taken up in the Immovable
Asset Management Plan (IAMP) as submitted to the Department of Transport
and Public Works. A copy is available on request at the Department.
There are four long-term infrastructure plans which will be included in more detail
in the User Asset Management Plan (UAMP):
1. A complete campus plan of the current Higher and Tertiary Education
institutions at Elsenburg.
2. Planning and construction of a complete research facility away from the
main office block at Elsenburg.
3. A complete redesign of the main building once current research facilities
relocate to new building (see 2).
4. Relocation of the components Veterinary Services and State Veterinarian:
Boland to the revamped facilities at the old jail near Koelenhof train station.
16 Conditional grants
Name of grant Comprehensive Agricultural Support Programme (CASP)
Department
who transferred
the grant
Department of Agriculture, Forestry and Fisheries
Purpose of the
grant
To expand the provision of agricultural support services, and promote and
facilitate agricultural development by targeting subsistence, small holder and
commercial farmers.
Expected
output of the
grant
Number of subsistence, smallholder and commercial farmers supported
through CASP
Number of youth and women farmers supported through the grant
Number of On-off infrastructure provided
Number of beneficiaries of CASP trained on farming methods
Number of beneficiaries of CASP with markets identified
Number of jobs created
Number of extension personnel recruited and maintained in the system
Number of extension officers upgrading qualifications in various institutions
Successful partnerships created to support farmers
Monitoring
mechanism by
the receiving
department
Quarterly reports submitted by Commodity Project Allocation Committees
(CPACs) on the projects approved as well as monthly visits by extension officers
recording progress of projects with the Smart Pen

Page 141 of 227
Sub-Programme 3.1: Farmer Settlement
Sector specific indicators and annual targets for 2015/16 Programme
performance
indicator
Audited/Actual performance Estimated
performance
2014/15
Medium-term targets
2011/12 2012/13 2013/14 2015/16 2016/17 2017/18
1.1 Number of
smallholder
producers
receiving
support
Not
reported
on
during
this
period
Not
reported
on
during
this
period
55 73 80 80 84
Provincial specific indicators and annual targets for 2015/16 Programme
performance
indicator
Audited/Actual performance Estimated
performance
2014/15
Medium-term targets
2011/12 2012/13 2013/14 2015/16 2016/17 2017/18
1.1 Number of
commerci
al farmers
supported
Not
reported
on
during
this
period
Not
reported
on
during
this
period
29 32 32 32 34
Sub-Programme 3.2: Extension and Advisory Services
Sector specific indicators and annual targets for 2015/16 Programme
performance
indicator
Audited/Actual
performance
Estimated
performance
2014/15
Medium-term targets
2011/12 2012/13 2013/14 2015/16 2016/17 2017/18
1.1 Number of
smallholder
producers
supported
with
agricultural
advice
Not
report
ed on
during
this
period
Not
report
ed on
during
this
period
1 866 1 400 1 800 1 800
1 800
Notes:
1. 8 districts x 11 demonstrations/district/year = 66 x (10% increase)
2. 5 farmer days/districts/year x 8 districts = 30/year x 10% for outer years
3. 10 commodities supported
Provincial specific indicators and annual targets for 2015/16 Programme
performance
indicator
Audited/Actual
performance
Estimated
performance
2014/15
Medium-term targets
2011/12 2012/13 2013/14 2015/16 2016/17 2017/18
1.1 Number of
projects
supported
through
mentorship
Not
report
ed on
during
this
period
Not
report
ed on
during
this
period
44 30 30 30 34
1.2 Number of
agricultural
businesses
Not
report
ed on
Not
report
ed on
60 60 112 112 118

Page 142 of 227
Programme
performance
indicator
Audited/Actual
performance
Estimated
performance
2014/15
Medium-term targets
2011/12 2012/13 2013/14 2015/16 2016/17 2017/18
skills audited during
this
period
during
this
period
1.3 Number of
farmers
supported
with advice
Not
report
ed on
during
this
period
Not
report
ed on
during
this
period
4 648 4 200 4 600 4 600 4 600
1.4 Number of
agricultural
demonstratio
ns facilitated
Not
report
ed on
during
this
period
Not
report
ed on
during
this
period
86 66 66 70 70
1.5 Number of
farmers’
days held
Not
report
ed on
during
this
period
Not
report
ed on
during
this
period
31 27 27 30 30
1.6 Number of
commodity
groups
supported
Not
report
ed on
during
this
period
Not
report
ed on
during
this
period
10 10 10 10 10
1.7. Number of
agri
processing
businesses
supported in
rural areas.
Not
report
ed on
during
this
period
Not
report
ed on
during
this
period
Not
reported
on during
this
period
Not reported on
during this period 2 2 2
Sub-programme 3.4: Casidra SOC Ltd
Provincial specific indicators and annual targets for 2015/16 Programme
performance
indicator
Audited/Actual performance Estimated
performance
2014/15
Medium-term targets
2011/12 2012/13 2013/14 2015/16 2016/17 2017/18
1.1 Number of
agricultural
projects
facilitated
outside of
commodity
structures
Not
reported
on
during
this
period
Not
reported
on
during
this
period
Not
reported
on
during
this
period
10 10 10 10
1.2 Number of
agricultural
projects
facilitated
within
commodity
Not
reported
on
during
this
period
Not
reported
on
during
this
period
Not
reported
on
during
this
period
35 38 40 40

Page 143 of 227
Programme
performance
indicator
Audited/Actual performance Estimated
performance
2014/15
Medium-term targets
2011/12 2012/13 2013/14 2015/16 2016/17 2017/18
structures
Name of grant Ilima/Letsema
Department
who transferred
the grant
Department of Agriculture, Forestry and Fisheries
Purpose of the
grant
To assist vulnerable South African farming communities to achieve an
increase in agricultural production for food security.
Expected
outputs of the
grant
Number of hectares (ha) planted
Number of tons produced within agricultural development corridors
Number of beneficiaries/entrepreneurs supported by the grant
Number of newly established infrastructures/plants through the grant
Number of hectares (ha) of rehabilitated and expanded irrigation
schemes
Monitoring
mechanism by
the receiving
department
Quarterly reports submitted by Commodity Project Allocation Committees
(CPACs) on the projects approved as well as monthly visits by Extension
officers recording progress of projects with the Smart Pen
Sub-Programme 3.3: Food Security
Sector specific indicators and annual targets for 2015/16 Programme
performance
indicator
Audited/Actual performance Estimated
performance
2014/15
Medium-term targets
2011/12 2012/13 2013/14 2015/16 2016/17 2017/18
1.1 Number of
households
benefiting
from
agricultural
food
security
initiatives
Not
reported
on
during
this
period
Not
reported
on
during
this
period
1 359 1 243 1 492 1 790 2 147
1.2 Number of
hectares
cultivated
for food
production
in
communal
areas and
land
reform
projects
Not
reported
on
during
this
period
Not
reported
on
during
this
period
Not
reported
on
during
this
period
Not reported
on during this
period
400 440 440
Provincial specific indicators and annual targets for 2015/16 Programme
performance
indicator
Audited/Actual performance Estimated
performance
2014/15
Medium-term targets
2011/12 2012/13 2013/14 2015/16 2016/17 2017/18
1.1 Number of
community
food
Not
reported
on
Not
reported
on
93 77 85 94 104

Page 144 of 227
Programme
performance
indicator
Audited/Actual performance Estimated
performance
2014/15
Medium-term targets
2011/12 2012/13 2013/14 2015/16 2016/17 2017/18
security
projects
supported
during
this
period
during
this
period
1.2 Number of
participants
in
community
food
security
projects
Not
reported
on
during
this
period
Not
reported
on
during
this
period
1 213 770 510 564 624
1.3 Number of
school food
gardens
supported
Not
reported
on
during
this
period
Not
reported
on
during
this
period
35 16 18 20 22
1.4 Number of
*participants
in school
food
gardens
Not
reported
on
during
this
period
Not
reported
on
during
this
period
189 160 108 120 132
1.5 Number of
food
security
awareness
campaigns
held
Not
reported
on
during
this
period
Not
reported
on
during
this
period
1 1 1 1 1
*Participants refer to those working in the project and not the learners.
Name of grant LandCare
Department
who transferred
the grant
Department of Agriculture, Forestry and Fisheries
Purpose of the
grant
To enhance a sustainable conservation of natural resources through a
community-based, participatory approach
To create job opportunities through the Expanded Public Works
Programme (EPWP)
To improve food security within the previously disadvantaged
communities
Expected
outputs of the
grant
To support the conservation of natural resources through the clearing of
alien vegetation, planning, design and construction of soil conservation
works, capacity building and awareness creation exercises, focussing on the
youth.
Monitoring
mechanism by
the receiving
department
Monthly reporting on progress and expenditure and proof of evidence
recorded.
Annual LandCare evaluation report in collaboration with DAFF.

Page 145 of 227
Sub-Programmes 2.2: LandCare
Sector specific indicators and annual targets for 2015/16
Programme
performance
indicator
Audited/Actual performance Estimated
performance
2014/15
Medium-term targets
2011/12 2012/13 2013/14 2015/16 2016/17 2017/18
1.1 Number of
hectares
protected /
rehabilitated
to improve
agricultural
production
2 110 27 359 29 076 1 000 5 000 5 000 5 000
1.2 Number of
green jobs
created
Not
reported
on
during
this
period
242 145 90 100 100 100
1.3 Number of
awareness
campaigns
conducted
on LandCare
6 6 6 6 6 6 6
1.4 Number of
capacity
building
exercises
conducted
within
approved
Land Care
projects
6 6 6 6 6 6 6
1.5 Number of
area wide
planning
10 10 10 10 10 10 10
1.6 Number of
youth
attending
Junior
LandCare
initiatives
6 338 9 707 8 862 7 000 7 000 7 000 7 000
1.7 Number of
hectares
alien trees
cleared
along rivers
Not
reported
on
during
this
period
Not
reported
on
during
this
period
Not
reported
on
during
this
period
40 60 60 60
Name of grant Extended Public Works Programme
Department
who transferred
the grant
Department of Public Works (National)
Purpose of the
grant
To create job opportunities through the Expanded Public Works Programme
(EPWP)

Page 146 of 227
Expected
outputs of the
grant
Construction of new fences and rehabilitation of existing fences to improve
the sustainability of stock farming through the control of predator animals
and creating job opportunities in the rural areas
Monitoring
mechanism by
the receiving
department
Monthly reporting on progress and expenditure and proof of evidence
recorded.
Sub-Programmes 2.2: LandCare
Sector specific indicators and annual targets for 2015/16 Programme
performance
indicator
Audited/Actual performance Estimated
performance
2014/15
Medium-term targets
2011/12 2012/13 2013/14 2015/16 2016/17 2017/18
1.1 Kilometres of
fence
erected*
Nil 23 31 74 100** 100** 100**
*Only new fence erected reported, some fences were also repaired
**Depend on availability of funding
Name of grant Disaster Aid Grant (included in the CASP grant)
Department
who transferred
the grant
Department of Agriculture, Forestry and Fisheries
Purpose of the
grant
To provide disaster relief to the agricultural sector after natural disasters
Expected
outputs of the
grant
To protect the natural agricultural resources
Monitoring
mechanism by
the receiving
department
Reporting on expenditure on approved disaster relief projects
Sector specific indicators and annual targets for 2015/16 Programme
performance
indicator
Audited/Actual performance Estimated
performance
2014/15
Medium-term targets
2011/12 2012/13 2013/14 2015/16 2016/17 2017/18
1.1 Number of
disaster relief
schemes
managed
3 3 3 2 3 3 3
1.2 Number of
disaster risk
reduction
programmes
managed
Not
reported
on
during
this
period
Not
reported
on
during
this
period
Not
reported
on
during
this
period
Not
reported on
during this
period
1* 1* 1*
*Depend on funding made available from DAFF
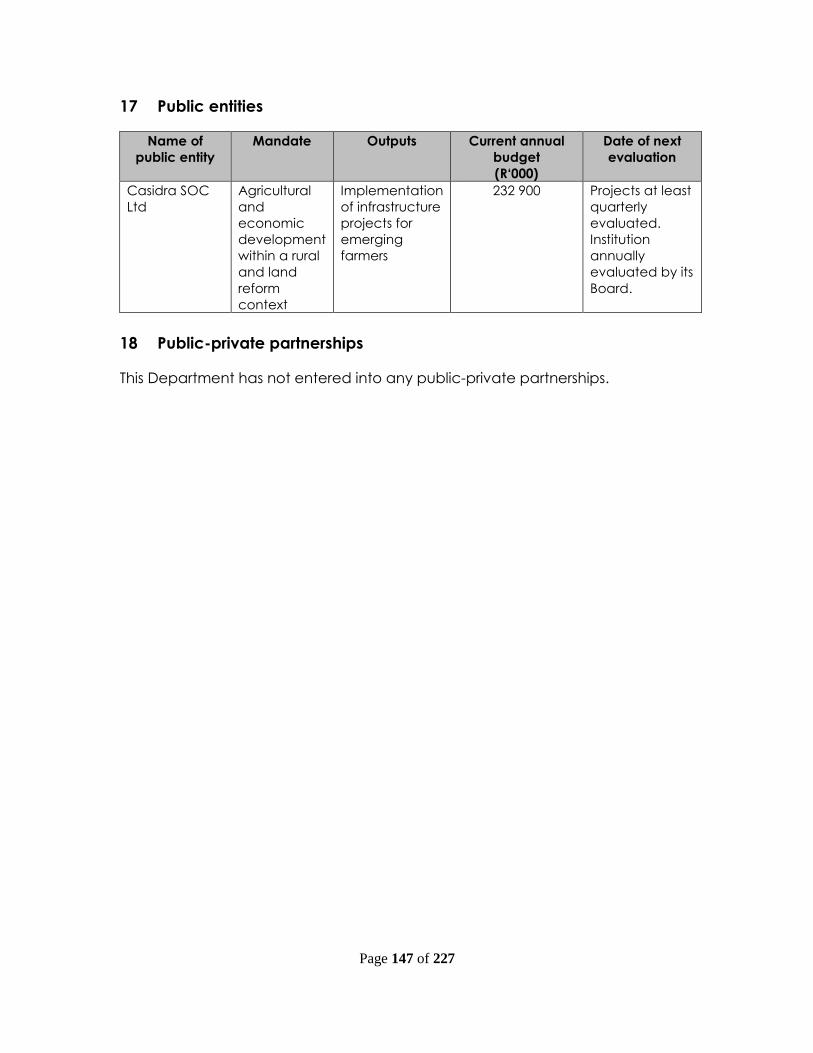
Page 147 of 227
17 Public entities
Name of
public entity
Mandate Outputs Current annual
budget
(R‘000)
Date of next
evaluation
Casidra SOC
Ltd
Agricultural
and
economic
development
within a rural
and land
reform
context
Implementation
of infrastructure
projects for
emerging
farmers
232 900 Projects at least
quarterly
evaluated.
Institution
annually
evaluated by its
Board.
18 Public-private partnerships
This Department has not entered into any public-private partnerships.
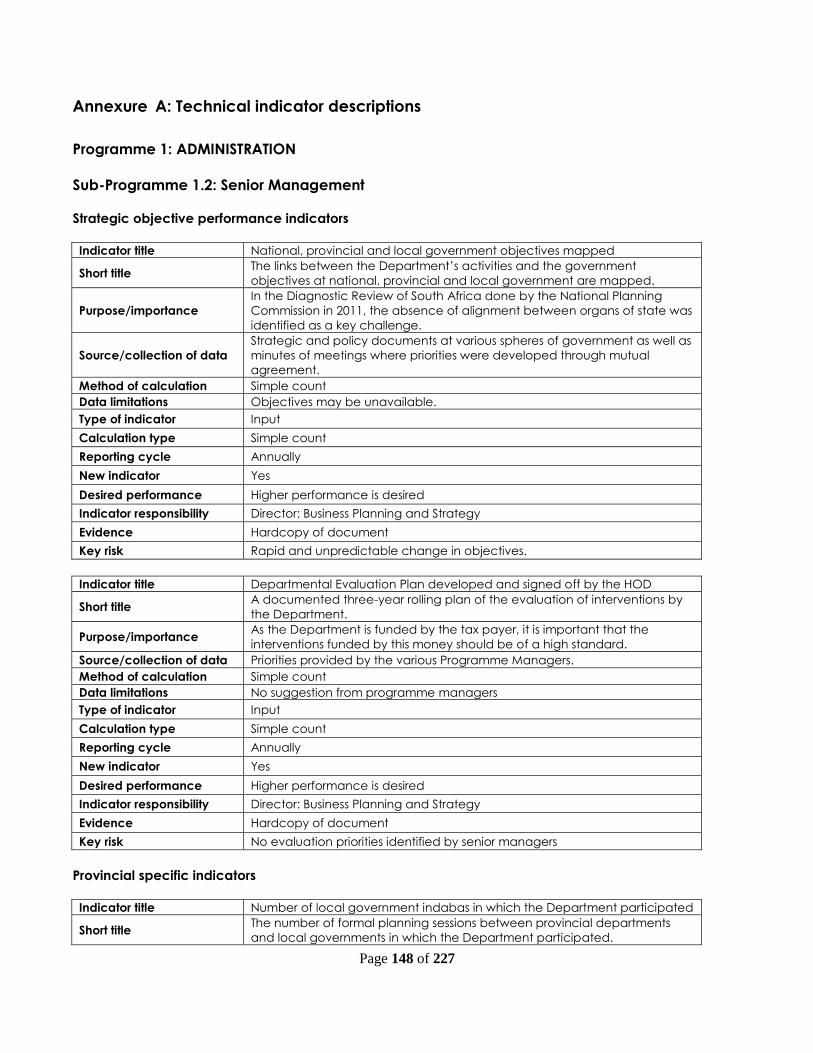
Page 148 of 227
Annexure A: Technical indicator descriptions
Programme 1: ADMINISTRATION
Sub-Programme 1.2: Senior Management
Strategic objective performance indicators
Indicator title National, provincial and local government objectives mapped
Short title The links between the Department’s activities and the government
objectives at national, provincial and local government are mapped.
Purpose/importance
In the Diagnostic Review of South Africa done by the National Planning
Commission in 2011, the absence of alignment between organs of state was
identified as a key challenge.
Source/collection of data
Strategic and policy documents at various spheres of government as well as
minutes of meetings where priorities were developed through mutual
agreement.
Method of calculation Simple count
Data limitations Objectives may be unavailable.
Type of indicator Input
Calculation type Simple count
Reporting cycle Annually
New indicator Yes
Desired performance Higher performance is desired
Indicator responsibility Director: Business Planning and Strategy
Evidence Hardcopy of document
Key risk Rapid and unpredictable change in objectives.
Indicator title Departmental Evaluation Plan developed and signed off by the HOD
Short title A documented three-year rolling plan of the evaluation of interventions by
the Department.
Purpose/importance As the Department is funded by the tax payer, it is important that the
interventions funded by this money should be of a high standard.
Source/collection of data Priorities provided by the various Programme Managers.
Method of calculation Simple count
Data limitations No suggestion from programme managers
Type of indicator Input
Calculation type Simple count
Reporting cycle Annually
New indicator Yes
Desired performance Higher performance is desired
Indicator responsibility Director: Business Planning and Strategy
Evidence Hardcopy of document
Key risk No evaluation priorities identified by senior managers
Provincial specific indicators
Indicator title Number of local government indabas in which the Department participated
Short title The number of formal planning sessions between provincial departments
and local governments in which the Department participated.

Page 149 of 227
Purpose/importance Through joint planning and interaction between spheres of government
service delivery to the people of the Western Cape can be improved.
Source/collection of data Reports indicating agreed-upon priorities
Method of calculation Simple count
Data limitations No common priorities may be found.
Type of indicator Input
Calculation type Cumulative for indaba
Reporting cycle Quarterly
New indicator Yes
Desired performance Higher performance is desired
Indicator responsibility Deputy Director: Integrated Development Planning.
Evidence Hardcopy of document
Key risk Indabas may not be organised by the Department of Local Government.
Indicator title Number of evaluations completed
Short title The number of departmental interventions which has been submitted to a
formal evaluation process.
Purpose/importance Improvement of the effectiveness of the use of scarce resources.
Source/collection of data Evaluation reports
Method of calculation Simple count
Data limitations Reports not released
Type of indicator Input, output or outcome
Calculation type Simple count
Reporting cycle Annually
New indicator Yes
Desired performance Higher performance is desired
Indicator responsibility Director: Business Planning and Strategy
Evidence Hardcopy of document
Key risk Insufficient resources to conduct formal evaluations.
Sub-Programme 1.3: Corporate Services
Strategic objective performance indicator
Indicator title Coordination, consolidation, and submission of the User Asset Management
Plan (UAMP)
Short definition Annual asset (infrastructure and property) management plan documenting
the maintenance needs, accommodation needs, capital projects required,
and budget analysis in relation to fixed government-owned, or leased assets.
Purpose/importance To ensure the optimal use and maintenance of all government-owned
infrastructure and property
Source/collection of data Infrastructure and property occupied and planned by the Department
Method of calculation Simple interpretation of report.
Data limitations Department’s inability to give factual costing of projects.
Type of indicator Output indicator
Calculation type None
Reporting cycle Annually
New indicator No
Desired performance The optimal use and occupation of infrastructure and property

Page 150 of 227
Indicator responsibility Director: Operational Support Services
Evidence User Asset Management Plan signed off and dated by the Head of
Department and submitted to the Department of Transport and Public Works
Key risk Underutilisation and dereliction of assets (government-owned infrastructure
and property)
Indicator title Number of bursaries and internships Awarded
Short definition Number of internships provided to unemployed youth to gain workplace
experience
Purpose/importance To promote skills development for youth, through offering of bursaries and
internships to provide workplace experience and simultaneously marketing
Agriculture as career option
Source/collection of data Contractual agreements
Method of calculation Simple count of the number of internships and bursaries awarded
Data limitations None
Type of indicator Output indicator
Calculation type None
Reporting cycle Annually
New indicator No
Desired performance Beneficiaries successfully completed internships and academic studies
Indicator responsibility Director: Operational Support Services
Evidence Signed contracts of beneficiaries and academic results
Key risk Unavailability of suitable and interested persons for internships, or persons not
meeting the qualifying criteria for academic studies.
Indicator title Business Continuity Plan Developed and annually revised
Short definition The Business Continuity Plan outlines the steps the Department will take to
recover systems and access processes that is required to continue with
critical business functions during and after a major interruption or disaster.
Purpose/importance To ensure that the Department continues with its mandate and service
delivery obligations and to minimise the negative impact of a major
interruption or disaster.
Source/collection of data The Business Impact Assessment and subsequent Plan.
Method of calculation Simple interpretation of plan
Data limitations Department’s inability to identify required resources
Type of indicator Output indicator
Calculation type None
Reporting cycle Annually
New indicator Yes
Desired performance Effective and efficient implementation of the Plan.
Indicator responsibility Director: Operational Support Services
Evidence Business Continuity Plan signed off and dated by the Head of Department
Key risk Inability of the Department to continue with its mandate thereby affecting
service delivery to both internal and external clients when struck by disaster
Provincial specific indicators
Indicator title Coordination, consolidation, and submission of the User Asset Management
Plan (UAMP)
Short definition Annual asset (infrastructure and property) management plan documenting
the maintenance needs, accommodation needs, capital projects required,
and budget analysis in relation to fixed government-owned, or leased
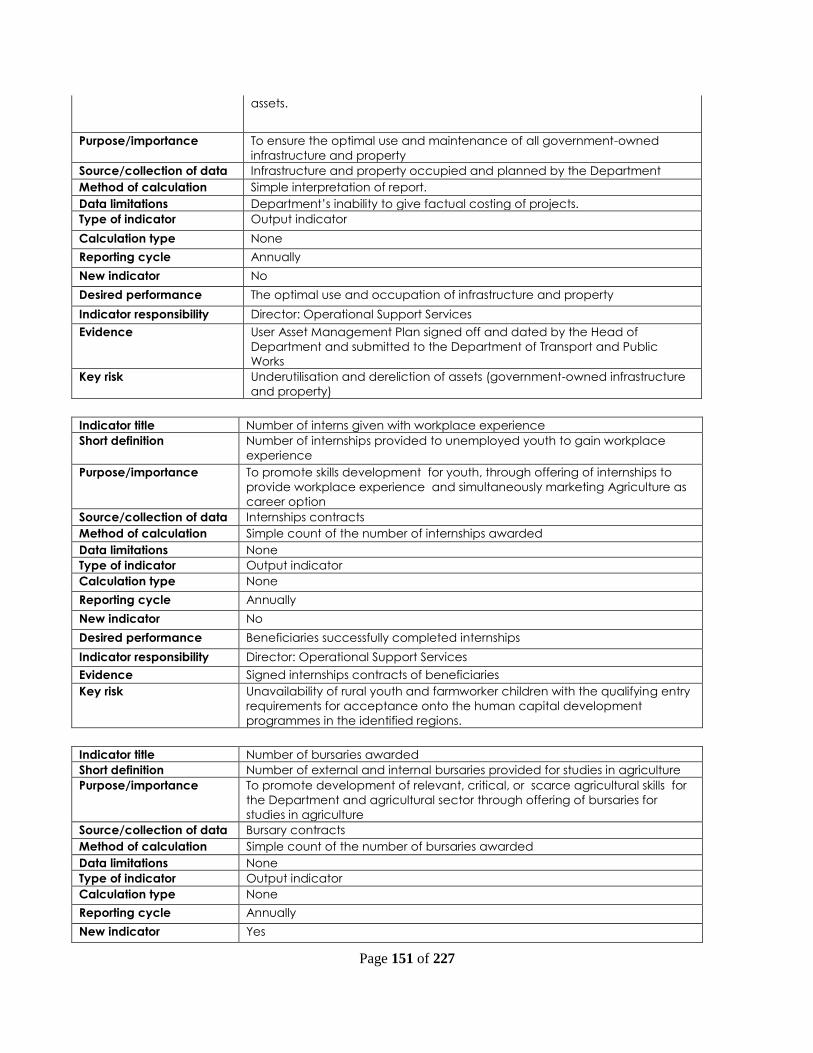
Page 151 of 227
assets.
Purpose/importance To ensure the optimal use and maintenance of all government-owned
infrastructure and property
Source/collection of data Infrastructure and property occupied and planned by the Department
Method of calculation Simple interpretation of report.
Data limitations Department’s inability to give factual costing of projects.
Type of indicator Output indicator
Calculation type None
Reporting cycle Annually
New indicator No
Desired performance The optimal use and occupation of infrastructure and property
Indicator responsibility Director: Operational Support Services
Evidence User Asset Management Plan signed off and dated by the Head of
Department and submitted to the Department of Transport and Public
Works
Key risk Underutilisation and dereliction of assets (government-owned infrastructure
and property)
Indicator title Number of interns given with workplace experience
Short definition Number of internships provided to unemployed youth to gain workplace
experience
Purpose/importance To promote skills development for youth, through offering of internships to
provide workplace experience and simultaneously marketing Agriculture as
career option
Source/collection of data Internships contracts
Method of calculation Simple count of the number of internships awarded
Data limitations None
Type of indicator Output indicator
Calculation type None
Reporting cycle Annually
New indicator No
Desired performance Beneficiaries successfully completed internships
Indicator responsibility Director: Operational Support Services
Evidence Signed internships contracts of beneficiaries
Key risk Unavailability of rural youth and farmworker children with the qualifying entry
requirements for acceptance onto the human capital development
programmes in the identified regions.
Indicator title Number of bursaries awarded
Short definition Number of external and internal bursaries provided for studies in agriculture
Purpose/importance To promote development of relevant, critical, or scarce agricultural skills for
the Department and agricultural sector through offering of bursaries for
studies in agriculture
Source/collection of data Bursary contracts
Method of calculation Simple count of the number of bursaries awarded
Data limitations None
Type of indicator Output indicator
Calculation type None
Reporting cycle Annually
New indicator Yes

Page 152 of 227
Desired performance Beneficiaries successfully completed the academic programme for which
the bursary was awarded
Indicator responsibility Director: Operational Support Services
Evidence Signed bursary contracts of beneficiaries
Key risk Unavailability of youth with the qualifying entry requirements for acceptance
onto the human capital development programmes
Failure or inability to successfully complete academic studies resulting in
drop-out.
Indicator title Development, Communication and Review of the Business Continuity Plan
Short definition The Business Continuity Plan outlines the steps the Department will take to
recover systems and access processes that is required to continue with
critical business functions during and after a major interruption or disaster.
Purpose/importance To ensure that the Department continues with its mandate and service
delivery obligations and to minimise the negative impact of a major
interruption or disaster.
Source/collection of data The Business Impact Assessment and subsequent Plan.
Method of calculation Simple interpretation of plan
Data limitations Department’s inability to identify required resources
Type of indicator Output indicator
Calculation type None
Reporting cycle Annually
New indicator Yes
Desired performance Effective and efficient implementation of the Plan.
Indicator responsibility Director: Operational Support Services
Evidence Business Continuity Plan signed off and dated by the Head of Department
Key risk Inability to implement the Plan due to lack/unavailability of resources
Sub-Programme 1.4: Financial Management
Strategic objective performance indicator
Indicator title Good Governance confirmed through clean external audit opinion without
other matters for the sub-programme: Financial Management and an
annually updated Strategic Risk Register
Short definition An annual report by the Auditor-General whereby they express an opinion
regarding the health of the department’s processes and systems for public
information and an annually updated Strategic Risk Register.
Purpose/importance To inform the citizens of the country on the state of health of the
department’s overall performance within its risk environment.
Source/collection of data Annual audit report and Strategic Risk Register.
Method of calculation Simple interpretation of report. Confirm update of Strategic Risk Register in
ERMCO Minutes.
Data limitations Department’s inability to provide correct information timely for audit
purposes. Non-updated Strategic Risk Register.
Type of indicator Output indicator
Calculation type None
Reporting cycle Annually
New indicator Yes
Desired performance The aim is to ensure that the set target is met.
Indicator responsibility Chief Financial Officer

Page 153 of 227
Evidence Auditor-General Report (Signed and dated)
Key risk Not achieving a clean audit without other matters.
Provincial specific indicators
Indicator title Achieving a clean external audit opinion without other matters for Financial
Management
Short definition An annual report by the Auditor-General whereby they express an opinion
regarding the health of the department’s processes and systems for public
information.
Purpose/importance To inform the citizens of the country on the state of health of the
department’s overall performance.
Source/collection of data Annual audit report.
Method of calculation Simple interpretation of report.
Data limitations Department’s inability to provide correct information timely for audit
purposes.
Type of indicator Output indicator
Calculation type None
Reporting cycle Annually
New indicator No
Desired performance The aim is to ensure that the set target is met.
Indicator responsibility Chief Financial Officer
Evidence Auditor-General Report (Signed and dated)
Key risk Not achieving a clean audit without other matters.
Indicator title
Achieving a clean external audit opinion without other matters for Supply
Chain Management
Short definition An annual report by the Auditor-General whereby they express an opinion
regarding the health of the department’s processes and systems for public
information.
Purpose/importance To inform the citizens of the country on the state of health of the
department’s overall performance.
Source/collection of data Annual audit report.
Method of calculation Simple interpretation of report.
Data limitations Department’s inability to provide correct information timely for audit
purposes.
Type of indicator Output indicator
Calculation type None
Reporting cycle Annually
New indicator No
Desired performance The aim is to ensure that the set target is met.
Indicator responsibility Chief Financial Officer
Evidence Auditor-General Report (Signed and dated)
Key risk Not achieving a clean audit without other matters.
Indicator title Annually update the Strategic Risk Register through ERMCO
Short definition A register containing all the strategic risks of the Department, their possible
impact and treatments for mitigation.
Purpose/importance To inform stakeholders of the risk environment the Department operates in.
Source/collection of data Departmental Strategic Risk Register and ERMCO minutes.

Page 154 of 227
Method of calculation Confirm dates of update.
Data limitations Department’s inability to update the Strategic Risk Register.
Type of indicator Output indicator
Calculation type None
Reporting cycle Annually
New indicator Yes
Desired performance The aim is to ensure that the set target is met.
Indicator responsibility Chair of ERMCO/ Chief Financial Officer
Evidence Register signed and dated.
Key risk Not updating the Strategic Risk Register and therefore uncertainty of what
the Department’s risks might be.
Sub-Programme 1.5: Communication Services
Strategic objective performance indicator
Indicator title Number of communication interventions
Short definition Interventions in the form of publications and events to transfer knowledge
and information as well as to inform citizens and other stakeholders of the
Department’s activities and outputs.
Purpose/importance To inform citizens and stakeholders of the Department’s outputs and to build
the Better Together philosophy of the Western Cape Government.
Source/collection of data Various Programmes, staff members and committees within the Department.
Method of calculation Simple count
Data limitations Time defaults, lack of contributions, lack of stakeholder participation and
locational specific challenges.
Type of indicator Output indicator
Calculation type Cumulative
Reporting cycle Quarterly
New indicator Yes
Desired performance Increase in the number of interventions.
Indicator responsibility Manager: Communication Services
Evidence Hard copy of publications and completed attendance registers.
Key risk Interventions not timely or poor response to interventions.
Provincial specific indicators
Indicator title Number of publications coordinated
Short definition The dissemination of five departmental publications to inform citizens and
stakeholders on plans and performance (results) of the Department
Purpose/importance To inform citizens and stakeholders of the Department’s outputs and to build
the Better Together philosophy of the Western Cape Government.
Source/collection of data Various Programmes, staff members and committees within the Department.
Method of calculation Simple count of various publications.
Data limitations Time defaults and lack of required contributions by various contributors.
Type of indicator Output indicator
Calculation type Cumulative
Reporting cycle Quarterly
New indicator Yes
Desired performance Timely release of publications

Page 155 of 227
Indicator responsibility Manager: Communications Services
Evidence Hard copy of publication
Key risk Publications not released timely
Indicator title Number of events coordinated
Short definition The successful coordination and management of various departmental
events in various locations across the Province for the transfer of information
and other purposes.
Purpose/importance To inform citizens and stakeholders of the Department’s outputs and
achievements and to build the Better Together philosophy of the Western
Cape Government.
Source/collection of data Various Programmes, staff members and committees within the Department.
Method of calculation Simple count of various events
Data limitations Stakeholder participation, contributors unavailability and locational specific
challenges
Type of indicator Output indicator
Calculation type Cumulative
Reporting cycle Quarterly
New indicator Yes
Desired
Successfully coordinated events where the goal of the event was achieved.
Indicator responsibility Manager: Communications Services
Evidence Completed attendance registers
Key risk Poor attendance or absence of targeted audience
Programme 2: SUSTAINABLE RESOURCE MANAGEMENT
Sub-Programme 2.1: Engineering Services
Strategic objective performance indicator
Indicator title Number of engineering services provided to support and increase
agricultural production and optimise sustainable natural resource use
Short definition Engineering support services provided to clients to assist them with
infrastructure development and sustainable farming practises to Sub-
programme manager
Purpose/importance To provide information to clients for informed decision making.
Source/collection of data Management data from engineering staff.
Method of calculation Simple count
Data limitations Engineering is a support function and therefore the number of requests may
affect the target. (Demand Driven
Type of indicator Output indicator
Calculation type Cumulative
Reporting cycle Quarterly
New indicator No
Desired performance The aim is to ensure that the set target is met
Indicator responsibility Sub-programme manager
Evidence Contact sheet OR Site Inspections Report OR Job Cards OR Attendance
Register OR Formal Communication (email) OR Formal Reports
Key risk This indicator is demand driven and the request for services cannot be
controlled or mitigated. Estimated number based on historic demand

Page 156 of 227
Sector specific indicators
Indicator title Number of agricultural infrastructure established
Short definition A final certificate /report/signed documents/acceptance letters issued after
construction / installation has been completed according to specifications
Purpose/importance To certify that a construction / installation has been completed according
to specifications
Source/collection of data Management data from engineering staff.
Method of calculation Simple count
Data limitations Factors influencing progress of projects (e.g. contractors with a lack of
capacity, availability of funding, inclement weather, community/client
dynamics)
Type of indicator Output indicator
Calculation type Cumulative
Reporting cycle Quarterly
New indicator No
Desired performance The aim is to ensure that the set target is met.
Indicator responsibility Sub-programme manager
Evidence Final certificate/Final payment/report/acceptance letters
Key risk This indicator is demand driven and the request for services cannot be
controlled or mitigated. Estimated number based on historic demand
Provincial specific indicators
Indicator title Number of agricultural engineering advisory reports prepared
Short definition Advisory reports based on recommendations to clients on what
infrastructure, mechanisation and technology development options will be
best suited for production. This can include pre-feasibility and cost estimate
reports.
Purpose/importance To provide information to clients for informed decision making.
Source/collection of data Management data from engineering staff.
Method of calculation Simple count
Data limitations Engineering is a support function and therefore the number of requests may
affect the target. (Demand Driven)
Type of indicator Output indicator
Calculation type Cumulative
Reporting cycle Quarterly
New indicator No
Desired performance The aim is to ensure that the set target is met.
Indicator responsibility Sub-programme manager
Evidence Reports (Signed and dated)
Key risk This indicator is demand driven and the request for services cannot be
controlled or mitigated. Estimated number based on historic demand
Indicator title
Number of designs with specifications for agricultural engineering solutions
provided
Short definition Designs with specifications for construction of agricultural infrastructure,
mechanisation and appropriate technology applications
Purpose/importance To provide information to clients for informed decision making.
Source/collection of data Management data from engineering staff.

Page 157 of 227
Method of calculation Simple count
Data limitations Engineering is a support function and therefore the number of requests may
affect the target (Demand Driven)
Type of indicator Output indicator
Calculation type Cumulative
Reporting cycle Quarterly
New indicator No
Desired performance The aim is to ensure that the set target is met.
Indicator responsibility Sub-programme manager
Evidence Design Reports (Signed with dates) OR Terms of Reference OR Specifications
OR Plans OR Bill of Quantities OR Schedules OR Summary Forms OR
Procurement Documents
Key risk This indicator is demand driven and the request for services cannot be
controlled or mitigated. Estimated number based on historic demand
Indicator title Number of clients provided with engineering advice during official visits
Short definition Engineering advice provided to clients
Purpose/importance To provide engineering support services to clients in order to ensure
sustainable development and management of resources
Source/collection of data Management data from engineering staff.
Method of calculation Simple count
Data limitations Ad hoc engineering services provided
Type of indicator Output Indicator
Calculation type Cumulative
Reporting cycle Quarterly
New indicator No
Desired performance Higher performance is desirable
Indicator responsibility Sub-programme manager
Evidence Contact sheet OR Site Inspections Report OR Job Cards OR Attendance
Register OR Formal Communication (email) OR Formal Reports
Key risk This indicator is demand driven and the request for services cannot be
controlled or mitigated. Estimated number based on historic demand
Indicator title Number of reports detailing the departmental agri processing activities
Short definition A report that will provide detail on the agri processing activities of the
Department
Purpose/importance To provide an overview of the agri processing activities provided to clients
to add value to the agricultural value chain
Source/collection of data All Programme Managers will report on their activities to the D: SRM on an
annual basis.
Method of calculation Simple count
Data limitations None
Type of indicator Output Indicator
Calculation type Cumulative
Reporting cycle Annually
New indicator Yes
Desired performance Higher performance is desirable
Indicator responsibility Programme Manager
Evidence Report compiled from annual reports submitted by other Programme
Managers

Page 158 of 227
Key risk The output is budget related and a reduction in budget will result in the
reduced number of activities but a report will be compiled
Indicator title Number of engineering designs for on-farm value adding
Short definition Engineering designs provided to clients
Purpose/importance To provide engineering design services to clients in order to increase on-farm
value adding and increase the economic viability of farming enterprises
Source/collection of data Management data from engineering staff.
Method of calculation Simple count
Data limitations Ad hoc engineering services provided
Type of indicator Output Indicator
Calculation type Cumulative
Reporting cycle Quarterly
New indicator Yes
Desired performance Higher performance is desirable
Indicator responsibility Sub-programme manager
Evidence Contact sheet OR Site Inspections Report OR Job Cards OR Attendance
Register OR Formal Communication (email) OR Formal Reports
Key risk This indicator is demand driven and the request for services cannot be
controlled or mitigated. Estimated number of based on historic demand
Sub-Programme 2.2: LandCare
Strategic objective performance indicator
Indicator title Number of actions to promote the sustainable use and management of
natural agricultural resources
Short definition Actions taken (events, study tours, LandCare days, conferences, farmers’
days, information days and resource conservation activities) targeting
community groups, farmers, youth, decision makers and the general public
in promoting Land Care principles and sustainable utilisation and
conservation of our natural resources.
Purpose/importance To promote sound LandCare practices for sustainable natural resource
management, create awareness and prevent the degradation of
agricultural land.
Source/collection of data Record of activities undertaken and extent of actions
Method of calculation Simple count
Data limitations None
Type of indicator Activity/impact
Calculation type Cumulative
Reporting cycle Quarterly
New indicator No
Desired performance Higher performance is desirable (The more land users adopting sustainable
practices and technologies the more effective the land is used and
improved awareness and capacity building will increase conservation)
Indicator responsibility Sub-programme manager
Evidence Reports and attendance registers
Key risk The output is budget related and a reduction in budget will result in the
reduced training, capacity building, awareness events and lower number of
projects.

Page 159 of 227
Sector specific indicator
Indicator title Number of hectares protected / rehabilitated to improve agricultural
production
Short definition Area of farm land under departmental (provincial) recommendations which
is guided by the norms and standards of Act 43 of 1983
Purpose/importance Reclamation of degraded land to put it back to productive use. Prevention
and protection of land from degradation for sustainable resource
management.
Source/collection of data Project lists, Requests from clients
Method of calculation Simple count
Data limitations Climate conditions
Type of indicator Impact
Calculation type Cumulative
Reporting cycle Quarterly
New indicator No
Desired performance Higher performance is desirable (With more hectares improved there will be
higher productivity)
Indicator responsibility Sub-programme manager
Evidence Maps OR Report
Key risk Due to the cut in budget less hectare of land can be improved through
conservation measures due to costs associated per hectare
Indicator title Number of green jobs created
Short definition Creation of work opportunities through a labour intensive approach and in
accordance with EPWP Guidelines and Code of Good Practice
Purpose/importance To ensure LandCare contributes to EPWP and the green economy initiatives.
Source/collection of data Registered LandCare projects
Method of calculation Simple Count
Data limitations None
Type of indicator Outcome
Calculation type Cumulative
Reporting cycle Quarterly
New indicator New
Desired performance Higher performance is desirable (More people employed)
Indicator responsibility Sub-programme manager
Evidence Registers OR Monthly Reports OR EPWP System
Key risk Fewer jobs will be created due to fewer funds available for employment
Provincial specific indicators
Indicator title Number of awareness campaigns conducted on LandCare
Short definition Events (e.g. study tour, LandCare days, conferences, farmers’ days,
information days and activities) targeting community groups, farmers, youth,
decision makers and the general public in promoting the Land Care
principles
Purpose/importance To promote sound LandCare practices for sustainable natural resource
management
Source/collection of data Departmental planning register or source for embarking on a campaign or
activity plan
Method of calculation Simple count
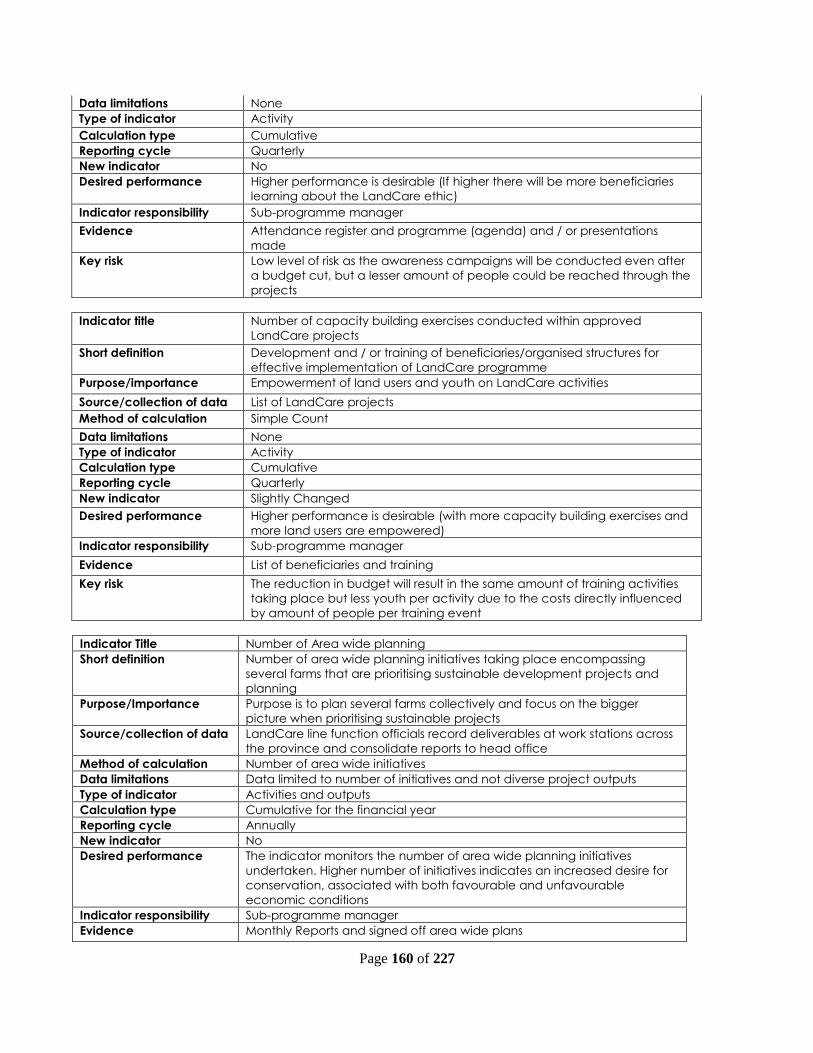
Page 160 of 227
Data limitations None
Type of indicator Activity
Calculation type Cumulative
Reporting cycle Quarterly
New indicator No
Desired performance Higher performance is desirable (If higher there will be more beneficiaries
learning about the LandCare ethic)
Indicator responsibility Sub-programme manager
Evidence Attendance register and programme (agenda) and / or presentations
made
Key risk Low level of risk as the awareness campaigns will be conducted even after
a budget cut, but a lesser amount of people could be reached through the
projects
Indicator title
Number of capacity building exercises conducted within approved
LandCare projects
Short definition Development and / or training of beneficiaries/organised structures for
effective implementation of LandCare programme
Purpose/importance Empowerment of land users and youth on LandCare activities
Source/collection of data List of LandCare projects
Method of calculation Simple Count
Data limitations None
Type of indicator Activity
Calculation type Cumulative
Reporting cycle Quarterly
New indicator Slightly Changed
Desired performance Higher performance is desirable (with more capacity building exercises and
more land users are empowered)
Indicator responsibility Sub-programme manager
Evidence List of beneficiaries and training
Key risk The reduction in budget will result in the same amount of training activities
taking place but less youth per activity due to the costs directly influenced
by amount of people per training event
Indicator Title Number of Area wide planning
Short definition Number of area wide planning initiatives taking place encompassing
several farms that are prioritising sustainable development projects and
planning
Purpose/Importance Purpose is to plan several farms collectively and focus on the bigger
picture when prioritising sustainable projects
Source/collection of data LandCare line function officials record deliverables at work stations across
the province and consolidate reports to head office
Method of calculation Number of area wide initiatives
Data limitations Data limited to number of initiatives and not diverse project outputs
Type of indicator Activities and outputs
Calculation type Cumulative for the financial year
Reporting cycle Annually
New indicator No
Desired performance The indicator monitors the number of area wide planning initiatives
undertaken. Higher number of initiatives indicates an increased desire for
conservation, associated with both favourable and unfavourable
economic conditions
Indicator responsibility Sub-programme manager
Evidence Monthly Reports and signed off area wide plans
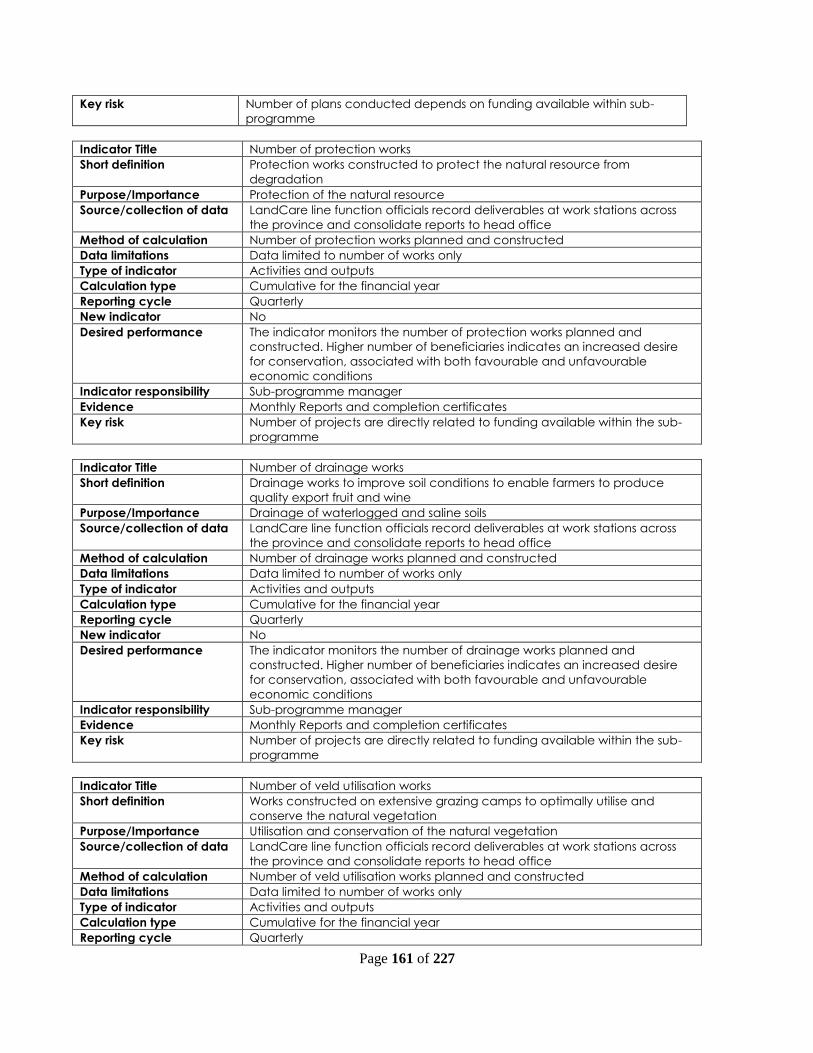
Page 161 of 227
Key risk Number of plans conducted depends on funding available within sub-
programme
Indicator Title Number of protection works
Short definition Protection works constructed to protect the natural resource from
degradation
Purpose/Importance Protection of the natural resource
Source/collection of data LandCare line function officials record deliverables at work stations across
the province and consolidate reports to head office
Method of calculation Number of protection works planned and constructed
Data limitations Data limited to number of works only
Type of indicator Activities and outputs
Calculation type Cumulative for the financial year
Reporting cycle Quarterly
New indicator No
Desired performance The indicator monitors the number of protection works planned and
constructed. Higher number of beneficiaries indicates an increased desire
for conservation, associated with both favourable and unfavourable
economic conditions
Indicator responsibility Sub-programme manager
Evidence Monthly Reports and completion certificates
Key risk Number of projects are directly related to funding available within the sub-
programme
Indicator Title Number of drainage works
Short definition Drainage works to improve soil conditions to enable farmers to produce
quality export fruit and wine
Purpose/Importance Drainage of waterlogged and saline soils
Source/collection of data LandCare line function officials record deliverables at work stations across
the province and consolidate reports to head office
Method of calculation Number of drainage works planned and constructed
Data limitations Data limited to number of works only
Type of indicator Activities and outputs
Calculation type Cumulative for the financial year
Reporting cycle Quarterly
New indicator No
Desired performance The indicator monitors the number of drainage works planned and
constructed. Higher number of beneficiaries indicates an increased desire
for conservation, associated with both favourable and unfavourable
economic conditions
Indicator responsibility Sub-programme manager
Evidence Monthly Reports and completion certificates
Key risk Number of projects are directly related to funding available within the sub-
programme
Indicator Title Number of veld utilisation works
Short definition Works constructed on extensive grazing camps to optimally utilise and
conserve the natural vegetation
Purpose/Importance Utilisation and conservation of the natural vegetation
Source/collection of data LandCare line function officials record deliverables at work stations across
the province and consolidate reports to head office
Method of calculation Number of veld utilisation works planned and constructed
Data limitations Data limited to number of works only
Type of indicator Activities and outputs
Calculation type Cumulative for the financial year
Reporting cycle Quarterly

Page 162 of 227
New indicator No
Desired performance The indicator monitors the number of veld utilisation works planned and
constructed. Higher number of beneficiaries indicates an increased desire
for conservation, associated with both favourable and unfavourable
economic conditions
Indicator responsibility Sub-programme manager
Evidence Monthly Reports and completion certificates
Key risk Number of projects are directly related to funding available within the sub-
programme
Indicator Title Number of EPWP person days
Short definition Measure the amount of employment created
Purpose/Importance Measure the persons days of employment created
Source/collection of data LandCare line function officials record deliverables at work stations across
the province and consolidate reports to head office
Method of calculation Number of person days of employment created
Data limitations Number of person days and all relevant information collected, no known
limitations
Type of indicator Activities and outputs
Calculation type Cumulative for the financial year
Reporting cycle Quarterly
New indicator No
Desired performance The indicator monitors the number of EPWP person days of jobs created
through LandCare projects. Higher number of green jobs indicates an
increased number of projects that could be funded from the LandCare
grant received or funded from own budget
Indicator responsibility Sub-programme manager
Evidence Registers OR Monthly Reports OR EPWP System
Key risk Fewer jobs will be created due to fewer funds available for employment
Indicator Title Number of youth attending Junior LandCare initiatives
Short definition Capacity building of youth in natural resource management
Purpose/Importance To educate the future generations in the importance of sustainable resource
management
Source/collection of data LandCare line function officials record deliverables at work stations across
the province and consolidate reports to head office
Method of calculation Number of youth attending LandCare initiative
Data limitations Limited to number of youth attending and school.
Type of indicator Activities and outputs
Calculation type Cumulative for the financial year
Reporting cycle Quarterly
New indicator No
Desired performance The indicator monitors the number of youth attending Junior LandCare
initiatives. Higher number of youth indicates an increased number of
initiatives that could be funded from the LandCare grant received or
funded from own budget
Indicator responsibility Sub-programme manager
Evidence Monthly Reports
Key risk Number of youth that can be accommodated on camps and puppet
shows are directly related to funding available within the sub-programme
Indicator Title Number of hectares alien trees cleared along rivers
Short definition Alien trees removed to reinstate the environmental integrity of the riparian
zone and to mitigate flood damage to infrastructure during flood events
Purpose/Importance Water conservation and the rehabilitation of riparian zone

Page 163 of 227
Source/collection of data LandCare line function officials record deliverables at work stations in the
Cape Winelands and West Coast districts
Method of calculation Number of hectares cleared form alien trees
Data limitations Data limited to number of hectares cleared
Type of indicator Activities and outputs
Calculation type Cumulative for the financial year
Reporting cycle Quarterly
New indicator Yes
Desired performance The indicator monitors the number of hectares cleared. Higher number of
hectares indicates an increased productivity and an increased buy-in
from land owners, who will be responsible for the maintenance after the
initial clearing
Indicator responsibility Sub-programme manager
Evidence Monthly Reports
Key risk Number of hectares cleared are directly related to funding available from
the Green Economy
Indicator Title Number of farm plans updated for sustainable farming purposes
Short definition Number of farms worked on during the year in the implementation of
resource management works and disaster aid assistance
Purpose/Importance Measure the amount of farms work on during the year with resource
management works and disaster works
Source/collection of data LandCare line function officials record deliverables at work stations across
the province and consolidate reports to head office
Method of calculation Number of farms worked on
Data limitations Limited to total number of farms worked on and data can be very
unpredictable due to disaster management works
Type of indicator Activities and outputs
Calculation type Cumulative for the financial year
Reporting cycle Annual
New indicator No
Desired performance The indicator monitors the number of farm plans updated. Higher number of
farm plans indicates an increased desire for conservation, associated with
both favourable and unfavourable economic conditions
Indicator responsibility Sub-programme manager
Evidence Reports
Key risk Number of farm plans completed are directly related to funding available
within the sub-programme
Indicator Title Number of river system improvement plans implemented
Short definition Number of river system improvement plans being implemented during the
year in collaboration with other departments and organisations
Purpose/Importance Measure the number of river improvement plans being implemented
through resource management works and clearing of alien vegetation
Source/collection of data LandCare line function officials record deliverables at work stations across
the province and consolidate reports to head office
Method of calculation Number of river improvement plans worked on
Data limitations Limited to total number of river improvement plans being implemented and
data can be very unpredictable due to disaster management works taking
priority
Type of indicator Activities and outputs
Calculation type Cumulative for the financial year
Reporting cycle Annually
New indicator Yes
Desired performance The indicator monitors the number of river improvement plans being

Page 164 of 227
implemented. As this activity will continue for a number of years per river
system, a higher number of improvement plans implemented indicates an
increased desire for conservation, associated with both favourable and
unfavourable economic conditions
Indicator responsibility Sub-programme manager
Evidence Reports
Key risk Number of river improvement plans implemented completed are directly
related to funding available within the sub-programme
Indicator Title Kilometres of fence erected
Short definition Kilometres of new fence erected to optimise sustainable natural resource
utilisation.
Purpose/Importance Fences along roads and farm boundaries prevent the movement of
predator animals, assist to sustain the economic viability of farming
enterprises and assist with the recovery of biodiversity. Jobs created for rural
unemployed people during the erection of fences, contribute towards
poverty alleviation.
Source/collection of data LandCare line function officials record deliverables at work stations across
the province and consolidate reports to head office
Method of calculation Kilometres of actual fence erected
Data limitations Limited to funding made availability through the EPWP programme
Type of indicator Activities and outputs
Calculation type Cumulative for the financial year
Reporting cycle Quarterly
New indicator Yes
Desired performance The indicator monitors the kilometres of fencing erected. A higher number of
kilometres indicates an increased area protected from predator animals
and thus and increase in area where the recovery of biodiversity can occur.
Indicator responsibility Sub-programme manager
Evidence Reports
Key risk Kilometers of new fence erected are directly related to funding available
from the EPWP programme
Sub-Programme 2.3: Land Use Management
Strategic objective performance indicator
Indicator title Number of regulated land use actions to promote the implementation of
sustainable use and management of natural agricultural resources
Short definition Providing advice and comments on applications for subdivision and /or
rezoning of agricultural land and number of farms worked on during the
year in the implementation of resource management works and disaster aid
assistance.
Purpose/importance To prevent and monitor fragmentation of and to protect our agricultural
from development and other non-agricultural uses
Source/collection of data Applications and final recommendation report
Method of calculation Simple count
Data limitations Demand driven (depending on the number of applications received and
disaster aid provided)
Type of indicator Output
Calculation type Cumulative
Reporting cycle Quarterly
New indicator No
Desired performance Lower performance is desirable. (Less applications/ recommendations
implies less sub-divisions and change of land use)

Page 165 of 227
Indicator responsibility Sub-programme manager
Evidence Reports (Signed and dated
Key risk This indicator is demand driven and the request for services cannot be
controlled or mitigated. Estimated number based on historic demand
Sector specific indicator
Indicator title
Number of hectares of agricultural land protected through guiding
subdivision / rezoning / change of agricultural land use
Short definition Recommendations made to DAFF , DEADP and municipalities on
applications for subdivision/rezoning/change of agricultural land use in
accordance with Act 70 of 1970
Purpose/importance To prevent and monitor fragmentation and loss of unique and high potential
agricultural land
Source/collection of data Applications and final recommendation report
Method of calculation Simple count
Data limitations Demand driven (depending on the number of applications received)
Type of indicator Output
Calculation type Cumulative
Reporting cycle Quarterly
New indicator No
Desired performance Lower performance is desirable. (Less applications/ recommendations
implies less sub-divisions and change of land use)
Indicator responsibility Sub-programme manager
Evidence Reports (Signed and dated)
Key risk This indicator is demand driven and the request for services cannot be
controlled or mitigated. We have no control, whether our
recommendations are adhered to by DAFF, DEADP and local authorities
and we do not get any confirmation on the outcome of the applications.
New indicator with no historic record
Provincial performance indicator Indicator title
Number of regulated land use actions to promote the implementation of
sustainable use and management of natural agricultural resources
Short definition Recommendations to DAFF made on subdivision/rezoning/change of
agricultural land use in accordance with Act 70 of 1970
Purpose/importance To prevent and monitor fragmentation and loss of high potential agricultural
land
Source/collection of data Applications and final recommendation report
Method of calculation Simple count
Data limitations Demand driven (depending on the number of applications received)
Type of indicator Output
Calculation type Cumulative
Reporting cycle Quarterly
New indicator No
Desired performance Lower performance is desirable. (Less applications/ recommendations
implies less sub-divisions and change of land use)
Indicator responsibility Sub-programme manager
Evidence Reports (Signed and dated)
Key risk This indicator is demand driven and the request for services cannot be
controlled or mitigated. Estimated number based on historic demand

Page 166 of 227
Sub-Programme 2.4: Disaster Risk Management
Strategic objective performance indicator
Indicator title Number of support services provided to clients with regards to agricultural
disaster risk management
Short definition Dissemination of early warning advisory reports to relevant stakeholders and
number of disaster relief schemes coordinated and implemented
Purpose/importance To prevent, reduce and mitigate disaster risks and to provide relief and
recovery to affected farmers
Source/collection of data Climatic data from the SA Weather Services and other sources as well as the
frameworks for disaster relief schemes
Method of calculation Simple count
Data limitations Availability of data from sources and the time lapse between disaster events
and funding made available
Type of indicator Output
Calculation type Cumulative
Reporting cycle Quarterly
New indicator No
Desired performance Lower performance is desirable ( less severe weather events that can cause
damages that will necessitate relief support)
Indicator responsibility Sub-programme manager
Evidence Reports, Distribution Lists, Expenditure Reports and List of Beneficiaries
Key risk This indicator is dependent on climatic conditions and cannot be controlled
or mitigated. Estimated number based on historic numbers
Sector specific indicators
Indicator title Number of disaster relief schemes managed
Short definition Manage and coordinate funded disaster relief schemes
Purpose/importance To provide relief and recovery to affected farmers
Source/collection of data Frameworks from DAFF, Provincial, Local Municipalities and Provincial
Disaster Management Centres (PDMC)
Method of calculation Simple count
Data limitations Relevance of data (Time lapse between occurrence of incident(s) and
availability of funds)
Type of indicator Output
Calculation type Non-Cumulative
Reporting cycle Annually
New indicator New
Desired performance The aim is to ensure that the set target is met.
Indicator responsibility Sub-programme manager
Evidence Expenditure Reports and List of Beneficiaries
Key risk This indicator is dependent on climatic conditions and cannot be controlled
or mitigated. Estimated number based on historic numbers.
Indicator title Number of disaster risk reduction programmes managed
Short definition Manage programmes relevant stakeholders to reduce the risk associated
with natural disasters
Purpose/importance To prevent, reduce and mitigate disaster risks
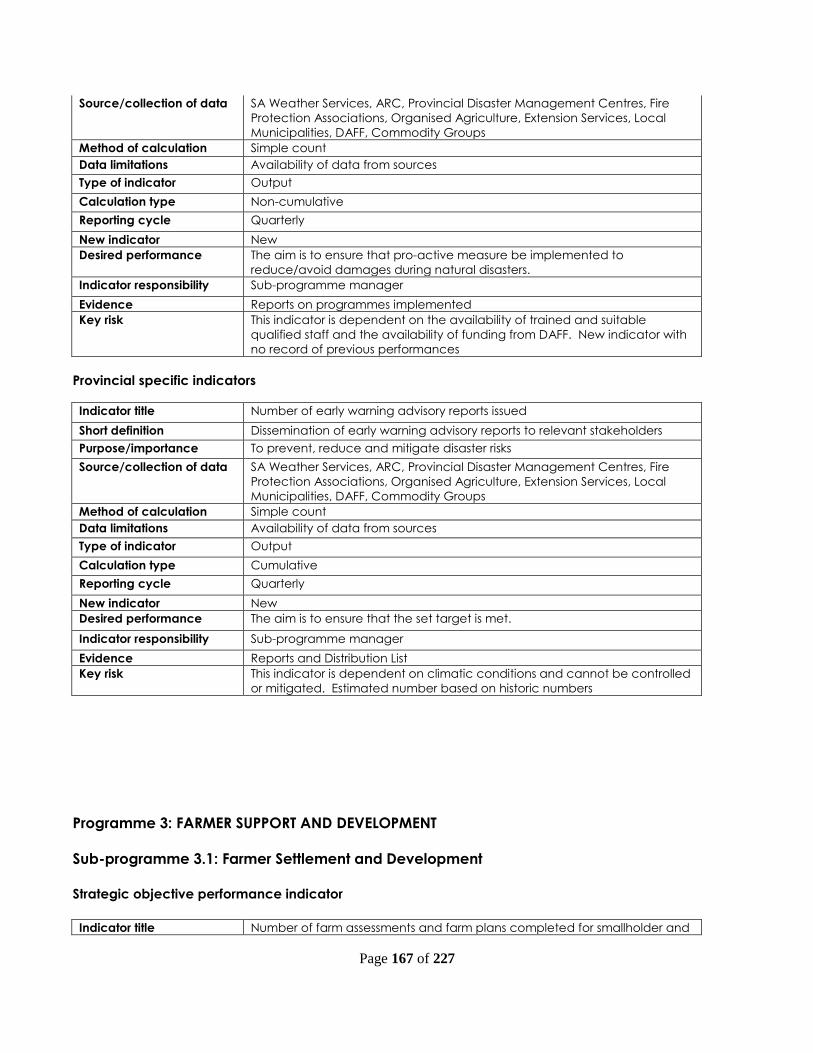
Page 167 of 227
Source/collection of data SA Weather Services, ARC, Provincial Disaster Management Centres, Fire
Protection Associations, Organised Agriculture, Extension Services, Local
Municipalities, DAFF, Commodity Groups
Method of calculation Simple count
Data limitations Availability of data from sources
Type of indicator Output
Calculation type Non-cumulative
Reporting cycle Quarterly
New indicator New
Desired performance The aim is to ensure that pro-active measure be implemented to
reduce/avoid damages during natural disasters.
Indicator responsibility Sub-programme manager
Evidence Reports on programmes implemented
Key risk This indicator is dependent on the availability of trained and suitable
qualified staff and the availability of funding from DAFF. New indicator with
no record of previous performances
Provincial specific indicators
Indicator title Number of early warning advisory reports issued
Short definition Dissemination of early warning advisory reports to relevant stakeholders
Purpose/importance To prevent, reduce and mitigate disaster risks
Source/collection of data SA Weather Services, ARC, Provincial Disaster Management Centres, Fire
Protection Associations, Organised Agriculture, Extension Services, Local
Municipalities, DAFF, Commodity Groups
Method of calculation Simple count
Data limitations Availability of data from sources
Type of indicator Output
Calculation type Cumulative
Reporting cycle Quarterly
New indicator New
Desired performance The aim is to ensure that the set target is met.
Indicator responsibility Sub-programme manager
Evidence Reports and Distribution List
Key risk This indicator is dependent on climatic conditions and cannot be controlled
or mitigated. Estimated number based on historic numbers
Programme 3: FARMER SUPPORT AND DEVELOPMENT
Sub-programme 3.1: Farmer Settlement and Development
Strategic objective performance indicator
Indicator title Number of farm assessments and farm plans completed for smallholder and

Page 168 of 227
commercial farmers within the agrarian reform initiatives
Short definition Document outlining farm production potential, infrastructure and land use
plan
Purpose/importance To ensure sustainable use and management of natural resources and
economic viability
Source/collection of data Project list, requests and approvals
Method of calculation Simple count
Data limitations None
Type of indicator Output
Calculation type Cumulative
Reporting cycle Quarterly
New indicator No
Desired performance Higher performance is desirable (higher performance would mean more
farms are planned for environmental and economic sustainability)
Indicator responsibility Sub-programme manager
Evidence Farm plans placed on file
Key risk Completion of farm plans could be delayed due to the lack of experts to
make input. In addition, there could be delays from other Departments, i.e.
EIA, water rights, municipal approvals etc.
Sector specific indicators
Indicator title Number of smallholder producers receiving support
Short definition Support refers to tangible support i.e. infrastructure and/or production inputs.
Infrastructure includes on and off farm infrastructure. Production inputs
include mechanisation, crop and livestock production inputs. A supported
smallholder producer is only counted once and not the number of times the
smallholder producer has been supported. Smallholder producers are
defined as those producers who produce food for home consumption, as
well as sell surplus produce to the market.
Purpose/importance
To develop and support smallholder farmers and increase sustainable
production
Source/collection of data Requests received or project lists
Method of calculation Simple count
Data limitations None
Type of indicator Input
Calculation type Cumulative
Reporting cycle Quarterly
New indicator Changed slightly
Desired performance Higher performance is desirable (Potential for increased production)
Indicator responsibility Sub-programme manager
Evidence Letter of approval for support and request form
Key risk The number smallholder farmers supported is directly associated to the
number of requests received. Fewer requests received will result in fewer
farms supported. To mitigate the Programme will ensure that its request
process and available programmes is distributed in the media.
Provincial specific indicators
Indicator title Number of farm plans completed
Short definition A document that outlines farm production potential, infrastructure and land
use plan
Purpose/importance
To ensure sustainable use and management of natural resources and
economic viability

Page 169 of 227
Source/collection of data Project list, requests and approvals
Method of calculation Simple count
Data limitations Additional requests that need urgent attention
Type of indicator Output
Calculation type Cumulative
Reporting cycle Quarterly
New indicator No
Desired performance Higher performance is desirable (higher performance would mean more
farms are planned for environmental and economic sustainability)
Indicator responsibility Sub-programme manager
Evidence Farm plans placed on file
Key risk Completion of farm plans could be delayed due to the lack of experts to
make input. The Programme will ensure that the UTA is marketed within the
Programme to ensure that its services are accessible.
Indicator title Number of commercial farmers supported
Short definition Assistance provided to farmers through infrastructure and production inputs.
(Production inputs include mechanisation, crop and livestock production
inputs). Definition of a commercial farmer (Refer to NO7).
Purpose/importance
To develop and support commercial farmers and increase sustainable
production
Source/collection of data Requests received or project lists
Method of calculation Simple count
Data limitations None
Type of indicator Input
Calculation type Cumulative
Reporting cycle Quarterly
New indicator Existing
Desired performance Higher performance is desirable (Potential for increased production)
Indicator responsibility Sub-programme manager
Evidence Letter of approval for support and request form
Key risk
The number commercial farmers supported is directly associated to the
number of requests received. Fewer requests received will result in fewer
farms supported. To mitigate the Programme will ensure that its request
process and available programmes is distributed in the media.
Indicator title Number of farm assessments completed
Short definition Signed off reports on farm assessments outlining farming activities and
resources (e.g. natural, infrastructure, finances, and management) as a tool
for development. Farm assessments will be based on the available
frameworks at the provincial level.
Purpose/importance To determine the suitability of the production area
Source/collection of data Requests received or project lists
Method of calculation Simple count
Data limitations
Demand driven (The delivery of farm assessments is directly dependant on
the number of requests received)
Type of indicator Output
Calculation type Cumulative
Reporting cycle Quarterly
New indicator Significantly changed
Desired performance Higher performance is desirable (May indicate an increased contribution to
the pace of land utilisation and support to the farming community).
Indicator responsibility Sub-programme manager
Evidence Signed off assessment reports placed on file
Key risk Completion of farm assessments could be delayed due to the lack of experts
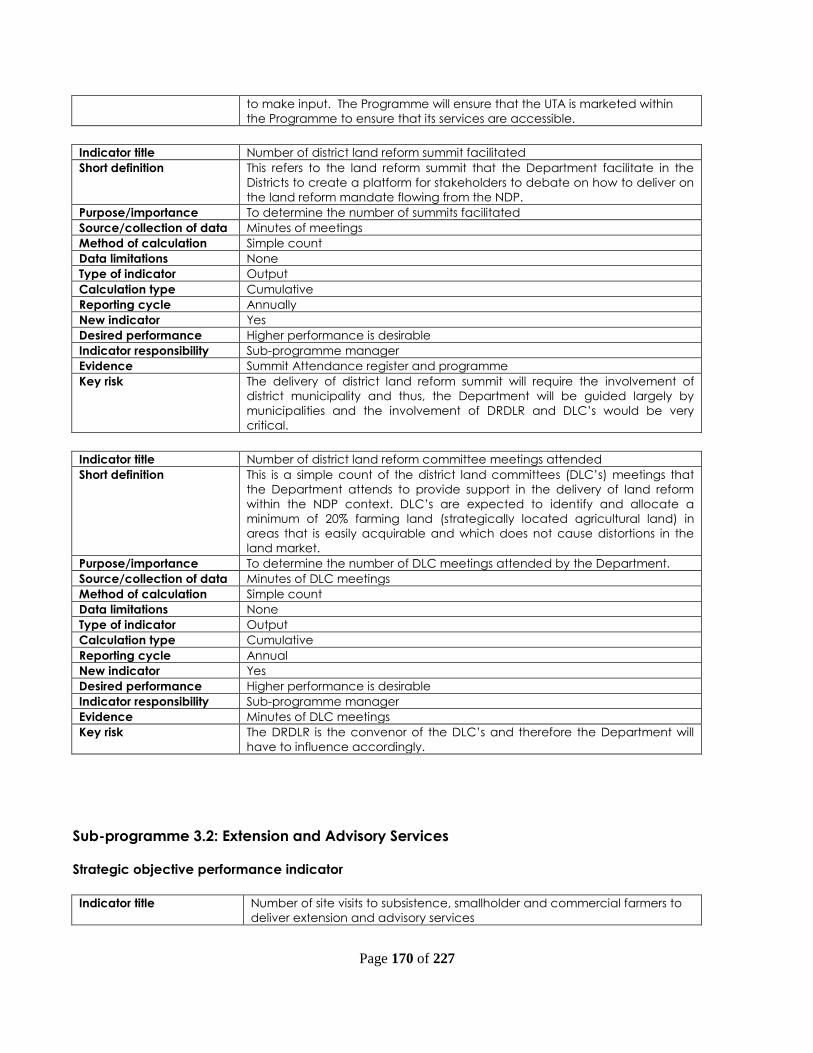
Page 170 of 227
to make input. The Programme will ensure that the UTA is marketed within
the Programme to ensure that its services are accessible.
Indicator title Number of district land reform summit facilitated
Short definition This refers to the land reform summit that the Department facilitate in the
Districts to create a platform for stakeholders to debate on how to deliver on
the land reform mandate flowing from the NDP.
Purpose/importance To determine the number of summits facilitated
Source/collection of data Minutes of meetings
Method of calculation Simple count
Data limitations None
Type of indicator Output
Calculation type Cumulative
Reporting cycle Annually
New indicator Yes
Desired performance Higher performance is desirable
Indicator responsibility Sub-programme manager
Evidence Summit Attendance register and programme
Key risk
The delivery of district land reform summit will require the involvement of
district municipality and thus, the Department will be guided largely by
municipalities and the involvement of DRDLR and DLC’s would be very
critical.
Indicator title Number of district land reform committee meetings attended
Short definition This is a simple count of the district land committees (DLC’s) meetings that
the Department attends to provide support in the delivery of land reform
within the NDP context. DLC’s are expected to identify and allocate a
minimum of 20% farming land (strategically located agricultural land) in
areas that is easily acquirable and which does not cause distortions in the
land market.
Purpose/importance To determine the number of DLC meetings attended by the Department.
Source/collection of data Minutes of DLC meetings
Method of calculation Simple count
Data limitations None
Type of indicator Output
Calculation type Cumulative
Reporting cycle Annual
New indicator Yes
Desired performance Higher performance is desirable
Indicator responsibility Sub-programme manager
Evidence Minutes of DLC meetings
Key risk
The DRDLR is the convenor of the DLC’s and therefore the Department will
have to influence accordingly.
Sub-programme 3.2: Extension and Advisory Services
Strategic objective performance indicator
Indicator title Number of site visits to subsistence, smallholder and commercial farmers to
deliver extension and advisory services

Page 171 of 227
Short definition Situation specific call-outs by farmers successfully addressed to solve a
problem or provide alternatives and new ideas to improve the current
situation.
Purpose/importance To ensure that farmers are successful with their farming activities and to
create and share new knowledge. To insure successful farming practices
and land reform.
Source/collection of data Validated project visit reports
Method of calculation Each validated site visit report is counted.
Data limitations Faulty equipment and site visit reports not submitted on time.
Type of indicator Output
Calculation type Cumulative.
Reporting cycle Quarterly.
New indicator No.
Desired performance The number of farmers supported with advice is monitored to ensure that
farmers are supported by extension officers on a regular basis. Advice given
by extension officers must be specific and measurable which will lead to
successful farming practices and land reform.
Indicator responsibility District manager and sub-programme manager.
Evidence Validated project site visit reports.
Key risk The lack of experience and high turnover rate of extension officers
influences the quality and quantity of advice provided to farmers.
Mitigation:
Extension Revitalisation Programme (ERP) to improve knowledge of
extension staff by
Promoting further studies,
Technical up skilling of staff during block sessions by providing
guest speakers in different fields of expertise
Extension officers to present case studies at our annual Extension
Symposium,
Access to Extension Suite Online system (information tool),
Implementing Smart Pen technology for record keeping and
advice monitoring tool.
Sector specific indicators
Indicator Title Number of smallholder producers supported with agricultural advice
Short definition Specific technical agricultural information provided to a producers (site
visits) or group of producers.
Purpose/Importance To ensure that farmers are successful with their farming activities and to
create and share new knowledge. To insure successful farming practices
and land reform.
Source/collection of data Validated project visit reports.
Method of calculation Each validated site visit report is counted.
Data limitations Faulty equipment and site visit reports not submitted on time.
Type of indicator Outputs
Calculation type Cumulative.
Reporting cycle Annual
New indicator Slightly Changed
Desired performance The number of farm visits is monitored to ensure that farmers are supported
by extension officers on a regular basis. Advice given by extension officers
must be specific and measurable, which will lead to successful farming
practices and land reform.
Indicator responsibility Sub-programme manager.
Evidence Validated project site visit reports.
Key Risk The lack of experience and high turnover rate of extension officers
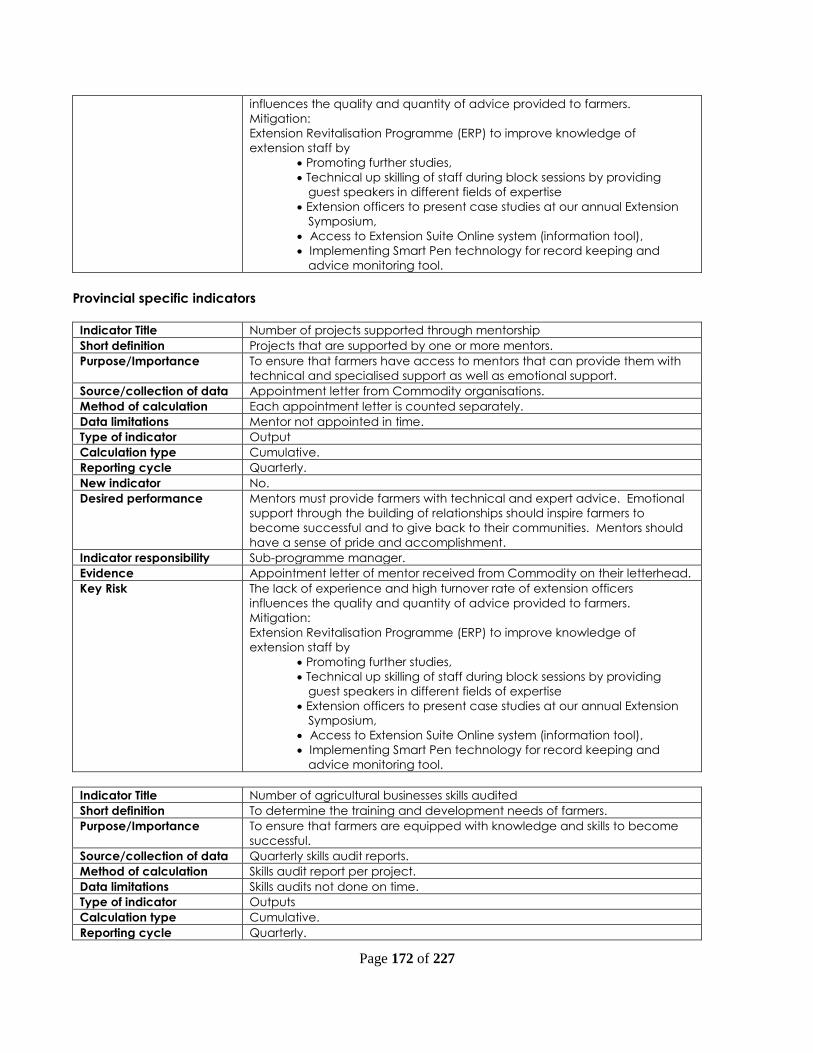
Page 172 of 227
influences the quality and quantity of advice provided to farmers.
Mitigation:
Extension Revitalisation Programme (ERP) to improve knowledge of
extension staff by
Promoting further studies,
Technical up skilling of staff during block sessions by providing
guest speakers in different fields of expertise
Extension officers to present case studies at our annual Extension
Symposium,
Access to Extension Suite Online system (information tool),
Implementing Smart Pen technology for record keeping and
advice monitoring tool.
Provincial specific indicators
Indicator Title Number of projects supported through mentorship
Short definition Projects that are supported by one or more mentors.
Purpose/Importance To ensure that farmers have access to mentors that can provide them with
technical and specialised support as well as emotional support.
Source/collection of data Appointment letter from Commodity organisations.
Method of calculation Each appointment letter is counted separately.
Data limitations Mentor not appointed in time.
Type of indicator Output
Calculation type Cumulative.
Reporting cycle Quarterly.
New indicator No.
Desired performance Mentors must provide farmers with technical and expert advice. Emotional
support through the building of relationships should inspire farmers to
become successful and to give back to their communities. Mentors should
have a sense of pride and accomplishment.
Indicator responsibility Sub-programme manager.
Evidence Appointment letter of mentor received from Commodity on their letterhead.
Key Risk The lack of experience and high turnover rate of extension officers
influences the quality and quantity of advice provided to farmers.
Mitigation:
Extension Revitalisation Programme (ERP) to improve knowledge of
extension staff by
Promoting further studies,
Technical up skilling of staff during block sessions by providing
guest speakers in different fields of expertise
Extension officers to present case studies at our annual Extension
Symposium,
Access to Extension Suite Online system (information tool),
Implementing Smart Pen technology for record keeping and
advice monitoring tool.
Indicator Title Number of agricultural businesses skills audited
Short definition To determine the training and development needs of farmers.
Purpose/Importance To ensure that farmers are equipped with knowledge and skills to become
successful.
Source/collection of data Quarterly skills audit reports.
Method of calculation Skills audit report per project.
Data limitations Skills audits not done on time.
Type of indicator Outputs
Calculation type Cumulative.
Reporting cycle Quarterly.

Page 173 of 227
New indicator No.
Desired performance Training must be provided to farmers who have been identified through the
businesses skills audit. Positive learning will lead to better skilled and
educated farmers which in turn will lead to more profitable and sustainable
farming enterprises within the Western Cape.
Indicator responsibility Sub-programme manager.
Evidence Quarterly skills audit reports. (One skills audit per project.)
Key Risk The lack of experience and high turnover rate of extension officers
influences the quality and quantity of advice provided to farmers.
Mitigation:
Extension Revitalisation Programme (ERP) to improve knowledge of
extension staff by
Promoting further studies,
Technical up skilling of staff during block sessions by providing guest
speakers in different fields of expertise
Extension officers to present case studies at our annual Extension
Symposium,
Access to Extension Suite Online system (information tool),
Implementing Smart Pen technology for record keeping and advice
monitoring tool.
Indicator Title Number of farmers supported with advice
Short definition Situation specific call-outs by farmers successfully addressed to solve a
problem or provide alternatives and new ideas to improve the current
situation.
Purpose/Importance To ensure that farmers are successful with their farming activities and to
create and share new knowledge. To insure successful farming practices
and land reform.
Source/collection of data Validated project visit reports.
Method of calculation Each validated site visit report is counted.
Data limitations Faulty equipment and site visit reports not submitted on time.
Type of indicator Output
Calculation type Cumulative.
Reporting cycle Quarterly
New indicator No.
Desired performance The number of farmers supported with advice is monitored to ensure that
farmers are supported by extension officers on a regular basis. Advice given
by extension officers must be specific and measurable which will lead to
successful farming practices and land reform.
Indicator responsibility Sub-programme manager.
Evidence Validated project site visit reports.
Key Risk The lack of experience and high turnover rate of extension officers
influences the quality and quantity of advice provided to farmers.
Mitigation:
Extension Revitalisation Programme (ERP) to improve knowledge of
extension staff by
Promoting further studies,
Technical up skilling of staff during block sessions by providing
guest speakers in different fields of expertise
Extension officers to present case studies at our annual Extension
Symposium,
Access to Extension Suite Online system (information tool),
Implementing Smart Pen technology for record keeping and
advice monitoring tool.
Indicator title Number of agricultural demonstrations facilitated

Page 174 of 227
Short definition Facilitation and practical illustration of agricultural activities which include
on site presentation of practices, technologies and products to enhance
production. (E.g. livestock dehorning, castration, branding, dipping, irrigation
scheduling, soil sampling, chemicals handling and application).
Purpose/importance To practically educate farmers on sustainable agricultural production
methods.
Source/collection of data Extension officer’s reports and records.
Method of calculation Simple count
Data limitations None
Type of indicator Output
Calculation type Cumulative
Reporting cycle Quarterly
New indicator No
Desired performance Higher performance is desired
Indicator responsibility Sub-programme manager
Evidence Photographs, programme with a signed attendance register.
Key Risk The lack of experience and high turnover rate of extension officers
influences the quality and quantity of advice provided to farmers.
Mitigation:
Extension Revitalisation Programme (ERP) to improve knowledge of
extension staff by
Promoting further studies,
Technical up skilling of staff during block sessions by providing
guest speakers in different fields of expertise
Extension officers to present case studies at our annual Extension
Symposium,
Access to Extension Suite Online system (information tool),
Implementing Smart Pen technology for record keeping and
advice monitoring tool.
Indicator title Number of farmers' days held
Short definition Farmers’ days refers to organised gatherings by extension officers, farmers
and other role players for the dissemination/exchange of information on
agricultural practices, technology and products.
Purpose/importance To create a platform for the dissemination/exchange of information on
agricultural practices, technology and products
Source/collection of data Extension officer’s reports and records.
Method of calculation Simple count
Data limitations None
Type of indicator Output
Calculation type Cumulative
Reporting cycle Quarterly
New indicator No
Desired performance Higher performance is desired
Indicator responsibility Sub-programme manager
Evidence Programme and signed attendance register and photos

Page 175 of 227
Key Risk The lack of experience and high turnover rate of extension officers
influences the quality and quantity of advice provided to farmers.
Mitigation:
Extension Revitalisation Programme (ERP) to improve knowledge of
extension staff by
Promoting further studies,
Technical up skilling of staff during block sessions by providing
guest speakers in different fields of expertise
Extension officers to present case studies at our annual Extension
Symposium,
Access to Extension Suite Online system (information tool),
Implementing Smart Pen technology for record keeping and
advice monitoring tool.
Indicator title Number of commodity groups supported
Short definition Farmers (who have been organised into commodity groups) provided with
technical advice. Define Commodity Groups (D: Small Holder Development)
Purpose/importance To provide technical support and advice to commodity groups
Source/collection of data Extension officer’s reports and records.
Method of calculation Simple count
Data limitations None
Type of indicator Output
Calculation type Cumulative
Reporting cycle Annually
New indicator No
Desired performance Higher performance is desired
Indicator responsibility Sub-programme manager
Evidence Signed Memorandum of Agreement with commodity.
Key Risk The lack of experience and high turnover rate of extension officers
influences the quality and quantity of advice provided to farmers.
Mitigation:
Extension Revitalisation Programme (ERP) to improve knowledge of
extension staff by
Promoting further studies,
Technical up skilling of staff during block sessions by providing
guest speakers in different fields of expertise
Extension officers to present case studies at our annual Extension
Symposium,
Access to Extension Suite Online system (information tool),
Implementing Smart Pen technology for record keeping and
advice monitoring tool.
Indicator title Number of agri processing businesses supported in rural areas
Short definition This refers to agri processing projects supported in rural areas, thus,
contribution to value addition from the smallholder farmers, and thus,
enhancing access to formal markets.
Purpose/importance To determine the number of agri processing projects supported
Source/collection of data Request Form and approval letter or Business Plan
Method of calculation Simple count
Data limitations
None
Type of indicator Output
Calculation type Cumulative

Page 176 of 227
Reporting cycle Annual
New indicator Yes
Desired performance Higher performance is desirable
Indicator responsibility Sub-programme manager
Evidence Request form and approval letter
Key risk
Support to agri processing project will require the involvement of the private
sector to ensure success. Skills development is critical for the success of such
projects, and thus private sector including institutions of higher learning
would be lobbied.
Sub-programme 3.3: Food Security
Strategic objective performance indicator
Indicator title Number of food security projects implemented as per Integrated Food
Security Strategy of SA (IFSS-SA)
Short definition This refers to the number of community and households projects supported
for food production.
Purpose/importance Indicate the role of Agriculture in alleviating food insecurity
Source/collection of data Minutes of the Approval Committee for Food Security
Method of calculation Simple count
Data limitations None
Type of indicator Output
Calculation type Cumulative
Reporting cycle Quarterly
New indicator No
Desired performance Higher performance is desired
Indicator responsibility Sub programme manager
Evidence Request Form
Key risk The sub-programme may not realise its strategic objective due to the
abandonment of household and communal food security projects which
could result in reputational damage and increased food insecurity.
Risk mitigation:
Improve liaison with municipality to ensure longevity, beneficiary
identification is informed by the municipal indigent lists.
Refine the selection criteria to ensure that correct candidates are
targeted.
Training and capacity building of beneficiaries
Sector specific indicators
Indicator title Number of households benefiting from agricultural food security initiatives
Short definition Number of households / subsistence producers benefitting from different
agricultural food security initiatives. A household refers to 3.2 persons
Purpose/importance
To promote the fight against food insecurities amongst identified and verified
beneficiaries
Source/collection of data Indigent registers, SASSA, DSD, DoH,
Method of calculation Simple count
Data limitations Inaccurate profiling data
Type of indicator Output
Calculation type Cumulative
Reporting cycle Quarterly
New indicator Significantly Changed

Page 177 of 227
Desired performance Higher performance is desired
Indicator responsibility Sub-programme manager
Evidence Household Profiles and/or assessment report and list of identified
beneficiaries
Key risk
The sub-programme may not realise its strategic objective due to the
abandonment of household and communal food security projects which
could result in reputational damage and increased food insecurity.
Risk mitigation:
Improve liaison with municipality to ensure longevity, beneficiary
identification is informed by the municipal indigent lists.
Refine the selection criteria to ensure that correct candidates are
targeted.
Training and capacity building of beneficiaries
Indicator title Number of hectares cultivated for food production in communal areas and
land reform projects.
Short definition Number of hectares cultivated refers to the area of communal, land reform
and / or leased land under production
Purpose/importance To indicate the number of hectares planted as a contribution to the Fetsa
Tlala Programme, for food production
Source/collection of data Request Form
Method of calculation Simple count
Data limitations None
Type of indicator Output
Calculation type Cumulative
Reporting cycle Quarterly
New indicator New
Desired performance The aim is to ensure that the set target is met.
Indicator responsibility Sub-programme manager
Evidence Final Report which may include Name of Project Leader, Contact Details, ID
Numbers, Land Size, Crop/Commodity Type, GPS Coordinates, Province and
District Name
Key risk
The sub-programme may not realise its strategic objective due to the
abandonment of household and communal food security projects which
could result in reputational damage and increased food insecurity.
Risk mitigation:
Improve liaison with municipality to ensure longevity, beneficiary
identification is informed by the municipal indigent lists.
Refine the selection criteria to ensure that correct candidates are
targeted.
Training and capacity building of beneficiaries
Provincial specific indicators
Indicator title Number of community food security projects supported
Short definition This refers to the number of community projects support for food production.
Purpose/importance Indicate the role of Agriculture in alleviating food insecurity
Source/collection of data Minutes of the Approval Committee for Food Security
Method of calculation Simple count
Data limitations None
Type of indicator Output
Calculation type Cumulative
Reporting cycle Quarterly
New indicator No
Desired performance Higher performance is desired
Indicator responsibility Sub programme manager

Page 178 of 227
Evidence Request Form and project approval letter
Key risk The sub-programme may not realise its strategic objective due to the
abandonment of household and communal food security projects which
could result in reputational damage and increased food insecurity.
Risk mitigation:
Improve liaison with municipality to ensure longevity, beneficiary
identification is informed by the municipal indigent lists.
Refine the selection criteria to ensure that correct candidates are
targeted.
Training and capacity building of beneficiaries
Indicator title Number of participants in community food security projects
Short definition Refers to the number of participants in the community food security projects
Purpose/importance Indicate the number of persons reached through the programme
Source/collection of data Request Forms
Method of calculation Simple count
Data limitations None
Type of indicator Output
Calculation type Cumulative
Reporting cycle Quarterly
New indicator No
Desired performance On target
Indicator responsibility Sub-programme manager
Evidence Request Forms
Key risk
The sub-programme may not realise its strategic objective due to the
abandonment of household and communal food security projects which
could result in reputational damage and increased food insecurity.
Risk mitigation:
Improve liaison with municipality to ensure longevity, beneficiary
identification is informed by the municipal indigent lists.
Refine the selection criteria to ensure that correct candidates are
targeted.
Training and capacity building of beneficiaries
Indicator title Number of school food gardens supported
Short definition Refers to school projects supported
Purpose/importance To show the link with National School Nutrition Programme
Source/collection of data Minutes of the Approval Committee for Food Security
Method of calculation Simple count
Data limitations None
Type of indicator Output
Calculation type Cumulative
Reporting cycle Quarterly
New indicator None
Desired performance Higher performance is desired
Indicator responsibility Sub programme manager
Evidence Request form and project approval letter.
Key risk
The sub programme may not realise its strategic objective due to the
abandonment of household and communal food security projects which
could result in reputational damage and increased food insecurity.
Risk mitigation
Improve liaison with municipality to ensure longevity, beneficiary
identification is informed by the municipal indigent lists.
Refine the selection criteria to ensure that correct candidates are
targeted.
Training and capacity building of beneficiaries

Page 179 of 227
Indicator title Number of participants in school food gardens
Short definition Indicate the number of participants linked to school food gardens
Purpose/importance To show the number of persons reached through the programme
Source/collection of data Request Forms
Method of calculation Simple count
Data limitations None
Type of indicator Output
Calculation type Cumulative
Reporting cycle Quarterly
New indicator No
Desired performance On target
Indicator responsibility Sub-programme manager
Evidence Request Forms
Key risk
The sub-programme may not realise its strategic objective due to the
abandonment of household and communal food security projects which
could result in reputational damage and increased food insecurity.
Risk mitigation:
Improve liaison with municipality to ensure longevity, beneficiary
identification is informed by the municipal indigent lists.
Refine the selection criteria to ensure that correct candidates are
targeted.
Training and capacity building of beneficiaries
Indicator title Number of food security awareness campaigns held
Short definition Sessions held to heighten awareness regarding food problem facing society.
Purpose/importance To educate communities on food security, including food nutrition security.
Source/collection of data Minutes of the approval structure
Method of calculation Simple count
Data limitations None
Type of indicator Output
Calculation type Cumulative
Reporting cycle Annually
New indicator No
Desired performance Higher performance is desired
Indicator responsibility Sub-programme manager
Evidence Event Programme and attendance register
Key risk
The sub-programme may not realise its strategic objective due to the
abandonment of household and communal food security projects which
could result in reputational damage and increased food insecurity.
Risk mitigation:
Improve liaison with municipality to ensure longevity, beneficiary
identification is informed by the municipal indigent lists.
Refine the selection criteria to ensure that correct candidates are
targeted.
Training and capacity building of beneficiaries
Sub-programme 3.4 Casidra SOC Ltd
Strategic objective performance indicator
Indicator title Number of agricultural projects facilitated
Short definition Total number of projects facilitated by Casidra
Purpose/importance To support projects with infrastructure implementation and manage farms to
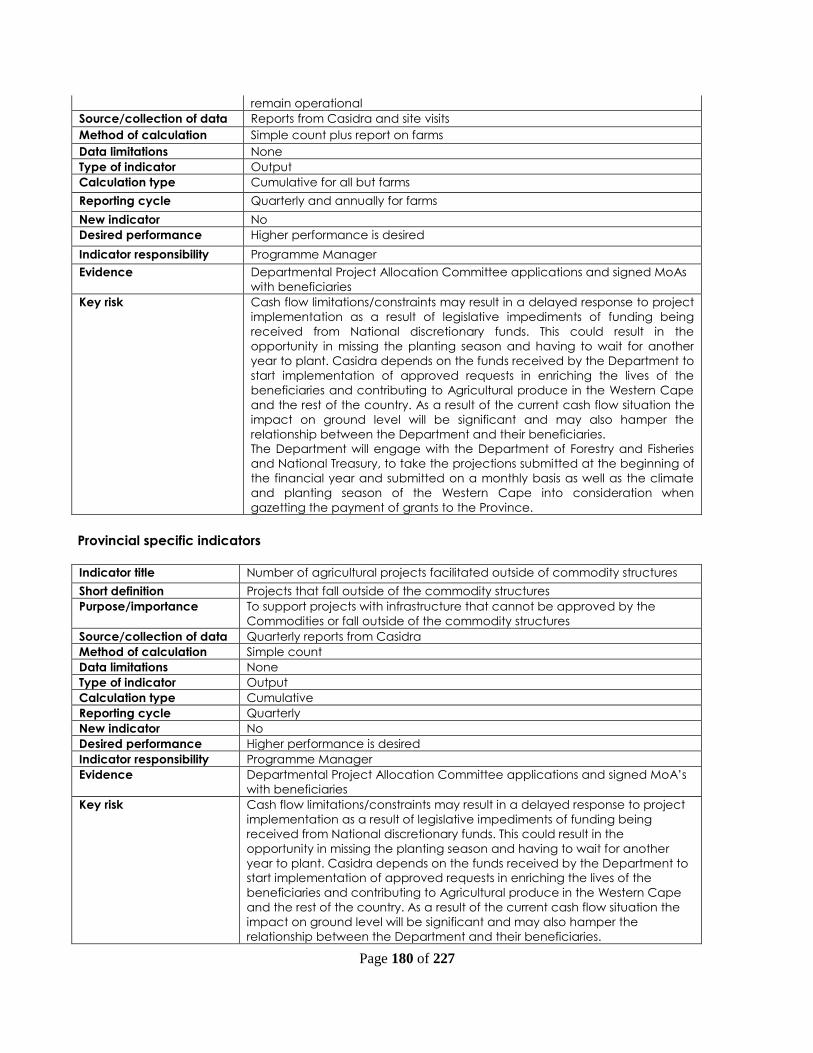
Page 180 of 227
remain operational
Source/collection of data Reports from Casidra and site visits
Method of calculation Simple count plus report on farms
Data limitations None
Type of indicator Output
Calculation type Cumulative for all but farms
Reporting cycle Quarterly and annually for farms
New indicator No
Desired performance Higher performance is desired
Indicator responsibility Programme Manager
Evidence Departmental Project Allocation Committee applications and signed MoAs
with beneficiaries
Key risk Cash flow limitations/constraints may result in a delayed response to project
implementation as a result of legislative impediments of funding being
received from National discretionary funds. This could result in the
opportunity in missing the planting season and having to wait for another
year to plant. Casidra depends on the funds received by the Department to
start implementation of approved requests in enriching the lives of the
beneficiaries and contributing to Agricultural produce in the Western Cape
and the rest of the country. As a result of the current cash flow situation the
impact on ground level will be significant and may also hamper the
relationship between the Department and their beneficiaries.
The Department will engage with the Department of Forestry and Fisheries
and National Treasury, to take the projections submitted at the beginning of
the financial year and submitted on a monthly basis as well as the climate
and planting season of the Western Cape into consideration when
gazetting the payment of grants to the Province.
Provincial specific indicators
Indicator title Number of agricultural projects facilitated outside of commodity structures
Short definition Projects that fall outside of the commodity structures
Purpose/importance
To support projects with infrastructure that cannot be approved by the
Commodities or fall outside of the commodity structures
Source/collection of data Quarterly reports from Casidra
Method of calculation Simple count
Data limitations None
Type of indicator Output
Calculation type Cumulative
Reporting cycle Quarterly
New indicator No
Desired performance Higher performance is desired
Indicator responsibility Programme Manager
Evidence
Departmental Project Allocation Committee applications and signed MoA’s
with beneficiaries
Key risk
Cash flow limitations/constraints may result in a delayed response to project
implementation as a result of legislative impediments of funding being
received from National discretionary funds. This could result in the
opportunity in missing the planting season and having to wait for another
year to plant. Casidra depends on the funds received by the Department to
start implementation of approved requests in enriching the lives of the
beneficiaries and contributing to Agricultural produce in the Western Cape
and the rest of the country. As a result of the current cash flow situation the
impact on ground level will be significant and may also hamper the
relationship between the Department and their beneficiaries.

Page 181 of 227
The Department will have to engage with the Department of Forestry and
Fisheries and National Treasury, to take the projections submitted at the
beginning of the financial year and submitted on a monthly basis as well as
the climate and planting season of the Western Cape into consideration
when gazetting the payment of grants to the Province.
Indicator title
The day-day management of provincial state farms with a view towards
breaking even
Short definition Management of provincial state farms
Purpose/importance
To continue to explore ways to keep the farms operational and if possible,
profitable
Source/collection of data Reports from Casidra
Method of calculation One report is submitted
Data limitations None
Type of indicator Output
Calculation type One report is submitted
Reporting cycle Annual
New indicator No
Desired performance Higher performance is desired
Indicator responsibility Programme manager
Evidence Reports from Casidra
Key risk
Cash flow limitations/constraints may result in a delayed response to project
implementation as a result of legislative impediments of funding being
received from National discretionary funds. This could result in the
opportunity in missing the planting season and having to wait for another
year to plant. Casidra depends on the funds received by the Department to
start implementation of approved requests in enriching the lives of the
beneficiaries and contributing to Agricultural produce in the Western Cape
and the rest of the country. As a result of the current cash flow situation the
impact on ground level will be significant and may also hamper the
relationship between the Department and their beneficiaries.
The Department will seek to engage with the Department of Forestry and
Fisheries and National Treasury, to take the projections submitted at the
beginning of the financial year and submitted on a monthly basis as well as
the climate and planting season of the Western Cape into consideration
when gazetting the payment of grants to the Province.
Indicator title Number of agricultural projects facilitated within commodity structures
Short definition Supporting projects that are approved within the commodity structures
Purpose/importance
To support projects with infrastructure that are approved by the
Commodities or fall inside of the commodity structures
Source/collection of data Quarterly reports from Casidra
Method of calculation Simple count
Data limitations None
Type of indicator Output
Calculation type Cumulative
Reporting cycle Quarterly
New indicator No
Desired performance Higher performance is desired
Indicator responsibility Programme manager
Evidence Requests form and signed MoA’s with beneficiaries
Key risk
(New)
Cash flow limitations/constraints may result in a delayed response to project
implementation as a result of legislative impediments of funding being
received from National discretionary funds. This could result in the
opportunity in missing the planting season and having to wait for another
year to plant. Casidra depends on the funds received by the Department to
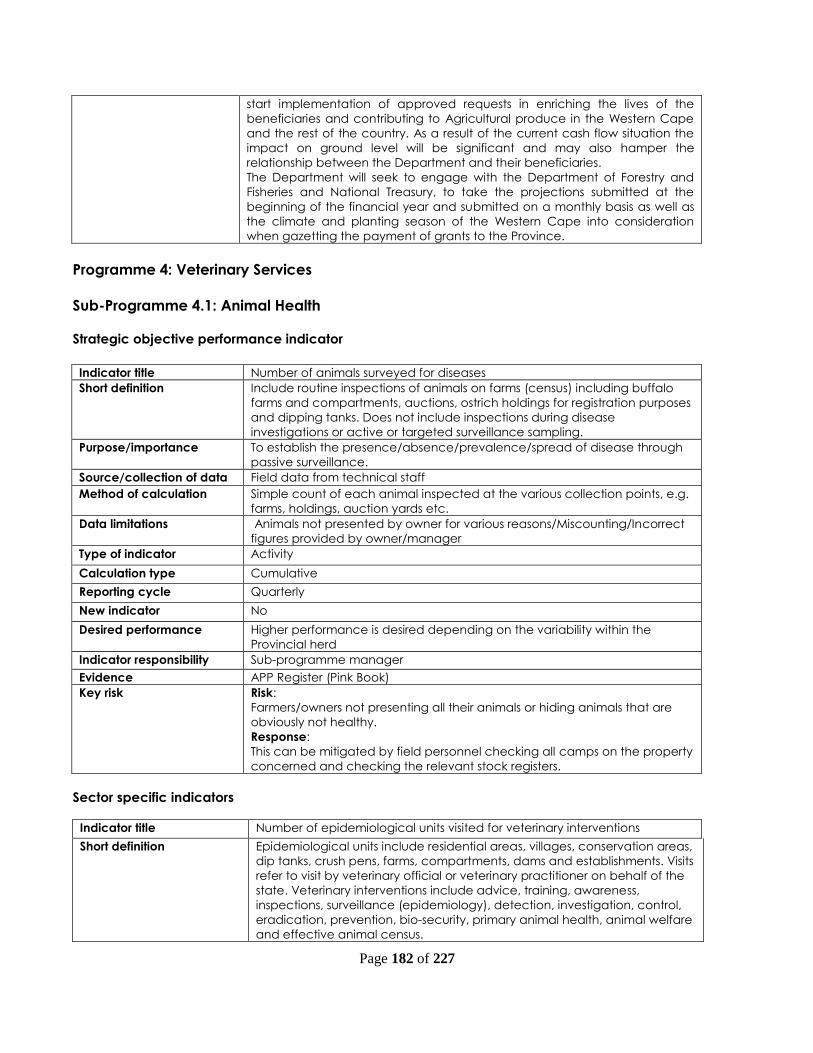
Page 182 of 227
start implementation of approved requests in enriching the lives of the
beneficiaries and contributing to Agricultural produce in the Western Cape
and the rest of the country. As a result of the current cash flow situation the
impact on ground level will be significant and may also hamper the
relationship between the Department and their beneficiaries.
The Department will seek to engage with the Department of Forestry and
Fisheries and National Treasury, to take the projections submitted at the
beginning of the financial year and submitted on a monthly basis as well as
the climate and planting season of the Western Cape into consideration
when gazetting the payment of grants to the Province.
Programme 4: Veterinary Services
Sub-Programme 4.1: Animal Health
Strategic objective performance indicator
Indicator title Number of animals surveyed for diseases
Short definition Include routine inspections of animals on farms (census) including buffalo
farms and compartments, auctions, ostrich holdings for registration purposes
and dipping tanks. Does not include inspections during disease
investigations or active or targeted surveillance sampling.
Purpose/importance To establish the presence/absence/prevalence/spread of disease through
passive surveillance.
Source/collection of data Field data from technical staff
Method of calculation Simple count of each animal inspected at the various collection points, e.g.
farms, holdings, auction yards etc.
Data limitations Animals not presented by owner for various reasons/Miscounting/Incorrect
figures provided by owner/manager
Type of indicator Activity
Calculation type Cumulative
Reporting cycle Quarterly
New indicator No
Desired performance Higher performance is desired depending on the variability within the
Provincial herd
Indicator responsibility Sub-programme manager
Evidence APP Register (Pink Book)
Key risk Risk:
Farmers/owners not presenting all their animals or hiding animals that are
obviously not healthy.
Response:
This can be mitigated by field personnel checking all camps on the property
concerned and checking the relevant stock registers.
Sector specific indicators
Indicator title Number of epidemiological units visited for veterinary interventions
Short definition Epidemiological units include residential areas, villages, conservation areas,
dip tanks, crush pens, farms, compartments, dams and establishments. Visits
refer to visit by veterinary official or veterinary practitioner on behalf of the
state. Veterinary interventions include advice, training, awareness,
inspections, surveillance (epidemiology), detection, investigation, control,
eradication, prevention, bio-security, primary animal health, animal welfare
and effective animal census.

Page 183 of 227
Purpose/importance Improve animal production and health to contribute to rural development,
public health, food security, animal production, economic development
and export facilitation.
Source/collection of data Report on the intervention carried out in the defined epidemiological
unit
Report format will be prescribed by DAFF and agreed to by PDAs
Method of calculation Simple count of defined epidemiological units visited
Data limitations Incomplete, inaccurate and fragmented data sources
Type of indicator Output
Calculation type Cumulative
Reporting cycle Quarterly
New indicator Yes
Desired performance Increased geographical area coverage of epidemiological units
Indicator responsibility Sub-Programme Manager
Evidence Report on the intervention carried out in the defined epidemiological unit
(Report format will be prescribed by DAFF and agreed to by PDAs)
Key risk Risk:
Farmers/owners not presenting all their animals or hiding animals that are
obviously not healthy.
Response:
This can be mitigated by field personnel checking all camps on the
property concerned and checking the relevant stock registers.
Provincial specific indicators
Indicator title Number of dogs and cats vaccinations against Rabies.
Short definition Vaccination conducted by and under the supervision of the state against
Rabies. Animal definition according to Animal Diseases Act (Act 35 of 1984).
Purpose/ importance To prevent / control Rabies as an infectious and zoonotic diseases.
Source/collection of data Field data obtained from technical staff at State Veterinary (SV) offices.
Method of calculation Simple count
Data limitations None
Type of indicator Activity
Calculation type Cumulative
Reporting cycle Quarterly
New indicator Yes. In past diseases were listed separately and included Anthrax, Rabies,
Brucellosis and Newcastle disease vaccinations.
Desired performance Higher performance desirable
Indicator responsibility Sub-programme manager
Evidence Vaccination Register OR Stock Registers OR APP Register (Pink Book) OR
Daily Activity Report Vaccination Certificates signed by recipients of service.
Key risk
Risk :
Non-maintenance of the cold chain can result in many vaccines becoming
ineffective. Buying from reputable suppliers utilizing effective (cold chain
compliant) courier services and training of field staff to strictly follow
standard operating procedures can minimize this risk.
Response:
Training of personnel handling vaccines and supplying suitable transporting
containers
Evidence Daily Activity Reports
Key risk Risk:
Dog / cat owners not presenting all their animals or hiding animals that are
obviously not healthy.
Response:
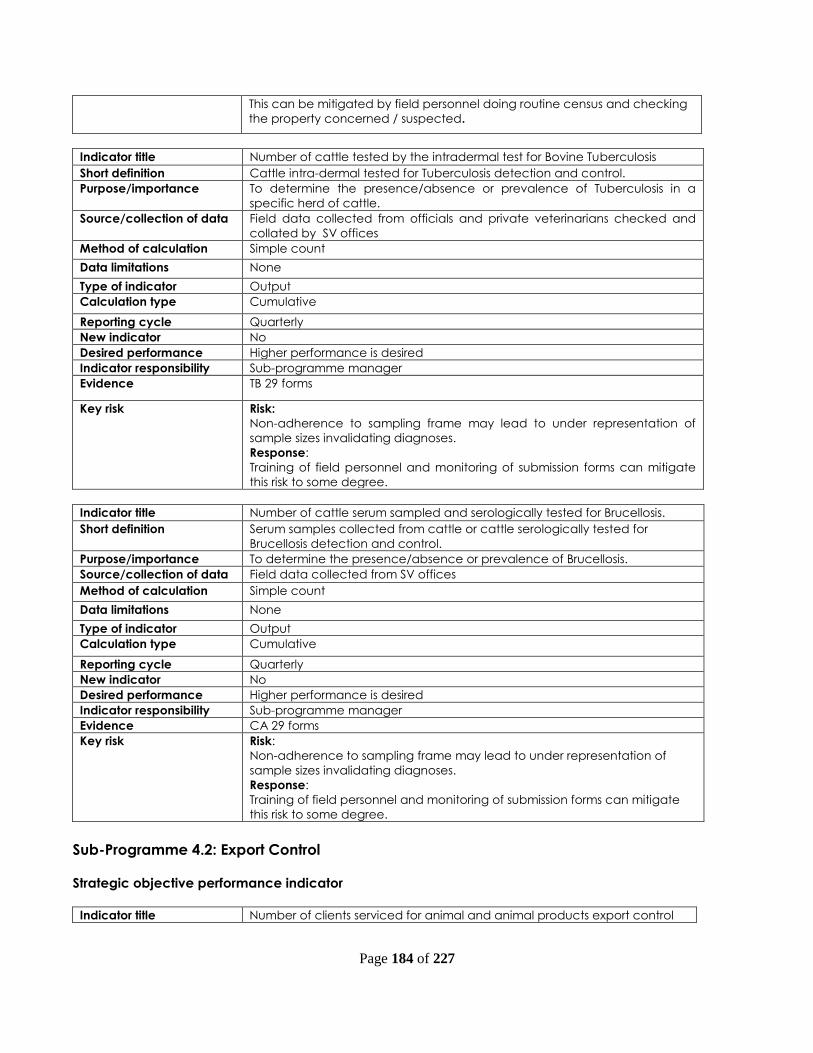
Page 184 of 227
This can be mitigated by field personnel doing routine census and checking
the property concerned / suspected.
Indicator title Number of cattle tested by the intradermal test for Bovine Tuberculosis
Short definition Cattle intra-dermal tested for Tuberculosis detection and control.
Purpose/importance To determine the presence/absence or prevalence of Tuberculosis in a
specific herd of cattle.
Source/collection of data Field data collected from officials and private veterinarians checked and
collated by SV offices
Method of calculation Simple count
Data limitations None
Type of indicator Output
Calculation type Cumulative
Reporting cycle Quarterly
New indicator No
Desired performance Higher performance is desired
Indicator responsibility Sub-programme manager
Evidence TB 29 forms
Key risk
Risk:
Non-adherence to sampling frame may lead to under representation of
sample sizes invalidating diagnoses.
Response:
Training of field personnel and monitoring of submission forms can mitigate
this risk to some degree.
Indicator title Number of cattle serum sampled and serologically tested for Brucellosis.
Short definition Serum samples collected from cattle or cattle serologically tested for
Brucellosis detection and control.
Purpose/importance To determine the presence/absence or prevalence of Brucellosis.
Source/collection of data Field data collected from SV offices
Method of calculation Simple count
Data limitations None
Type of indicator Output
Calculation type Cumulative
Reporting cycle Quarterly
New indicator No
Desired performance Higher performance is desired
Indicator responsibility Sub-programme manager
Evidence CA 29 forms
Key risk
Risk:
Non-adherence to sampling frame may lead to under representation of
sample sizes invalidating diagnoses.
Response:
Training of field personnel and monitoring of submission forms can mitigate
this risk to some degree.
Sub-Programme 4.2: Export Control
Strategic objective performance indicator
Indicator title Number of clients serviced for animal and animal products export control

Page 185 of 227
Short definition Clients include any person or institution applying to export animals and
animal related products. Services include advice, processing of export
applications issuing of export certificates, issuing of movement permits, and
the inspection, registration and auditing of export facilities.
Purpose/importance To enable access to export markets thereby stimulating economic growth
and rural development
Source/collection of data Report on export facilitations
Report format will be prescribed by DAFF and agreed to by PDAs
Method of calculation Simple count based on separate applicants except in the case of
individual animal owners
Data limitations Based on available applications and inspection reports
Type of indicator Output
Calculation type Cumulative
Reporting cycle Quarterly
New indicator Yes
Desired performance Improve access to export markets
Indicator responsibility Sub-programme manager
Evidence Certificates issued
Key risk
Risk:
Fraudulent certificates issued.
Response:
Training of field personnel and issuing serialised certificates printed on
watermarked paper.
Sector specific indicators
Indicator title Number of clients serviced for animal and animal products export control
Short definition Clients include any person or institution applying to export animals and
animal related products. Services include advice, processing of export
applications issuing of export certificates, issuing of movement permits, and
the inspection, registration and auditing of export facilities.
Purpose/importance To enable access to export markets thereby stimulating economic growth
and rural development
Source/collection of data Report on export facilitations
Report format will be prescribed by DAFF and agreed to by PDAs
Method of calculation Simple count based on separate applicants except in the case of
individual animal owners
Data limitations Based on available applications and inspection reports
Type of indicator Output
Calculation type Cumulative
Reporting cycle Quarterly
New indicator Yes
Desired performance Improve access to export markets
Indicator responsibility Sub-programme manager
Evidence Report on export facilitations (Report format will be prescribed by DAFF and
agreed to by PDAs)
Key risk
Risk:
Fraudulent certificates issued.
Response:
Training of field personnel and issuing serialised certificates printed on
watermarked paper.
Provincial Specific Indicators
Indicator title Number of establishment audits conducted

Page 186 of 227
Short definition Establishments that are registered and approved for exports are visited
annually, inspected and audited
Purpose/importance To maintain and monitor standards agreed with trading partners. To ensure
that they maintain minimum standards
Source/collection of data All establishment on the approved register
Method of calculation Simple count
Data limitations Demand driven (Dependent on the economic and national disease status
and the number of applications)
Accuracy of the register
Measures only legal exports
Type of indicator Output
Calculation type Cumulative
Reporting cycle Quarterly
New indicator Significantly changed
Desired performance All registered establishments visited and audited
Indicator responsibility Sub-programme manager
Evidence Audit reports
Key risk Establishments deregistering and/ or exports suspended
Indicator title Number of samples collected for residue monitoring at export
establishments
Short definition Samples taken from animal products for the purpose of monitoring
residue to ensure compliance with the requirements of the importing
countries.
Purpose/importance To meet import country requirements.
Source/collection of data Sample register
Method of calculation Simple count
Data limitations Accuracy of the register.
Suspension of facilities may limit the collection of samples.
Type of indicator Output
Calculation type Cumulative
Reporting cycle Quarterly
New indicator No
Desired performance The aim is to ensure that the set target is met.
Indicator responsibility Sub-programme manager
Key risk
This indicator is demand driven depending on the economic and national
disease status and the number of applications
Sub-Programme 4.3: Veterinary Public Health
Strategic objective performance indicator
Indicator title % level of abattoir compliance to meat safety legislation.
Short definition All abattoir assessments in line with the Meat Safety Act (Act 40 of 2000),
using the Hygiene Assessment System (HAS) and / or Meat Safety checklists.
The annual HAS average is at least 60%. 60% is the minimum percentage of
abattoirs to be rated.
Purpose/importance To measure the level of compliance to the Meat Safety Act (Act 40 of 2000)
by all abattoirs to promote meat safety and the safety of animal products.
Source/collection of data Register of abattoirs and HAS audit report, Rural inspection checklist.
Method of calculation Calculate the average HAS score.
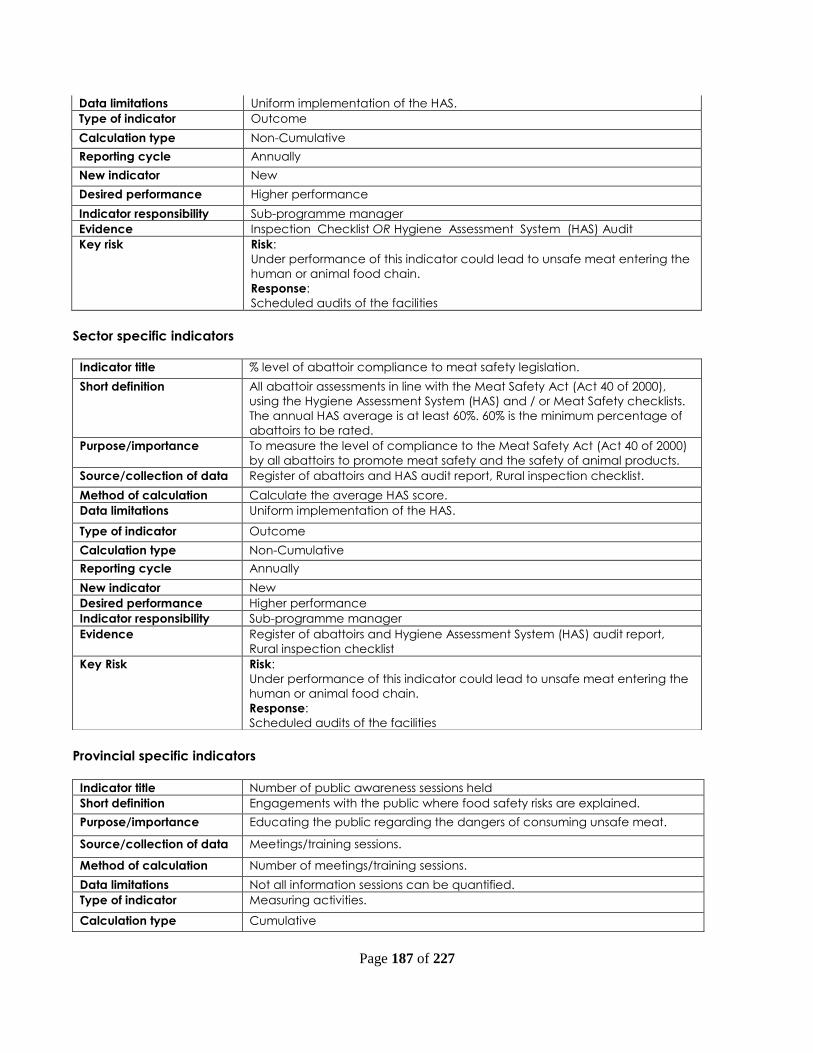
Page 187 of 227
Data limitations Uniform implementation of the HAS.
Type of indicator Outcome
Calculation type Non-Cumulative
Reporting cycle Annually
New indicator New
Desired performance Higher performance
Indicator responsibility Sub-programme manager
Evidence Inspection Checklist OR Hygiene Assessment System (HAS) Audit
Key risk Risk:
Under performance of this indicator could lead to unsafe meat entering the
human or animal food chain.
Response:
Scheduled audits of the facilities
Sector specific indicators
Provincial specific indicators
Indicator title Number of public awareness sessions held
Short definition Engagements with the public where food safety risks are explained.
Purpose/importance Educating the public regarding the dangers of consuming unsafe meat.
Source/collection of data Meetings/training sessions.
Method of calculation Number of meetings/training sessions.
Data limitations Not all information sessions can be quantified.
Type of indicator Measuring activities.
Calculation type Cumulative
Indicator title % level of abattoir compliance to meat safety legislation.
Short definition All abattoir assessments in line with the Meat Safety Act (Act 40 of 2000),
using the Hygiene Assessment System (HAS) and / or Meat Safety checklists.
The annual HAS average is at least 60%. 60% is the minimum percentage of
abattoirs to be rated.
Purpose/importance To measure the level of compliance to the Meat Safety Act (Act 40 of 2000)
by all abattoirs to promote meat safety and the safety of animal products.
Source/collection of data Register of abattoirs and HAS audit report, Rural inspection checklist.
Method of calculation Calculate the average HAS score.
Data limitations Uniform implementation of the HAS.
Type of indicator Outcome
Calculation type Non-Cumulative
Reporting cycle Annually
New indicator New
Desired performance Higher performance
Indicator responsibility Sub-programme manager
Evidence Register of abattoirs and Hygiene Assessment System (HAS) audit report,
Rural inspection checklist
Key Risk Risk:
Under performance of this indicator could lead to unsafe meat entering the
human or animal food chain.
Response:
Scheduled audits of the facilities

Page 188 of 227
Reporting cycle Quarterly
New indicator Continuous
Desired performance Higher
Indicator responsibility Programme manager
Evidence Attendance Register, Office Note/Memorandum
Key risk
Risk:
Lack of food safety awareness could put the human population at risk of
eating unsafe meat resulting in food poisoning.
Response:
In consultation and cooperation with Communications section produce
adequate publicity material
Indicator title Number of BSE samples to collect
Short definition Brainstem samples collected of cattle older than 30 months, at abattoirs.
Purpose/importance Surveillance for BSE.
Source/collection of data Brainstem samples collected.
Method of calculation Number of brainstem samples collected.
Data limitations Difficulty of finding enough qualifying specimens.
Type of indicator Measuring outputs.
Calculation type Cumulative
Reporting cycle Quarterly
New indicator Continuous
Desired performance Higher
Indicator responsibility Sub-programme manager
Evidence Copy of completed waybills of samples sent to OVI laboratory.
Key risk
Risk:
Underperformance could result in the inability of South Africa to proof our
freedom of Bovine Spongiform Encephalopathy (BSE) to importing countries.
Response:
Receiving sample grid from DAFF in time
Sub-Programme 4.4: Veterinary Laboratory Services
Strategic objective performance indicator
Indicator title Number of specimens tested
Short definition All samples derived from specimen tested by the laboratory for disease
diagnosis and food safety monitoring
Purpose/importance To facilitate disease control and contribute to public health
Source/collection of data Specimen register, specimen submission forms
Method of calculation Simple count
Data limitations None
Type of indicator Output
Calculation type Cumulative
Reporting cycle Quarterly
New indicator Significantly changed
Desired performance All suitable specimen submitted are tested
Indicator responsibility Veterinary technologists must populate statistical report.
Technical manager collates data and populate transversal report

Page 189 of 227
sheet.
Laboratory manager signs off on report and submits to Programme
manager
Evidence Sample Registration Form and Diagnostic Report
Key risk Risk: Figures incorrectly transferred to statistical report
Mitigating measure: Figures checked by second official
Sector specific indicators
Indicator title Number of tests performed the quality of which meets the ISO 17 025
standard and OIE requirements
Short definition Tests refer to any laboratory procedures performed on samples for diagnostic
purposes. Tests will be counted only if the method was approved according
to the ISO 17025 standard and OIE requirements.
Purpose/importance To provide veterinary laboratory services of a national and international
compliance
Source/collection of data Test report
Method of calculation Simple count
Data limitations No proficiency testing scheme available for tests for certain diseases /
conditions
Type of indicator Output
Calculation type Cumulative
Reporting cycle Quarterly
New indicator Modified
Desired performance National and / or international recognition
Indicator responsibility Sub-Programme manager
Evidence Sample Registration Form and Diagnostic Report
Key risk Risk: Figures incorrectly transferred to statistical report
Mitigating measure: Figures checked by second official
Provincial specific Indicators
Indicator title Total number of specimens tested for Controlled/ Notifiable Diseases
Short definition Number of suitable specimens tested for Controlled/Notifiable diseases
Purpose/importance Tracks the number of samples received for Controlled Disease testing
Source/collection of data Statistical reports from Serology, Virology, PCR and Parasitology sections
respectively as populated onto the statistical spread sheet.
Method of calculation Data on controlled disease tests performed is obtained from statistical
reports submitted by each section and this is then collated to report a
final figure for the laboratory as a whole
Data limitations
The accuracy of the data is determined by the accuracy used by the
technologists when populating the statistical spread sheet.
Type of indicator Outputs
Calculation type Non-cumulative (final annual figure is based on total of 4 quarterly
reports)
Reporting cycle Quarterly
New indicator
New. As far as provincial the indicators is concerned because this
indicator was previously reported with national indictors.
Desired performance Since the number of tests performed is linked to the number of specimens
received that, in turn is requested from external clients over whom the
laboratory has no control; both higher and lower performance will be
accepted.
Indicator responsibility Veterinary technologists must populate statistical report.
Technical manager collates data and populate transversal report

Page 190 of 227
sheet.
Laboratory manager signs off on report and submits to
Programme manager
Evidence Sample Registration Form and Diagnostic Report
Key risk
Risk: Figures incorrectly transferred to statistical report
Mitigating measure: Figures checked by second official
Indicator title Total number of Veterinary Public Health samples tested
Short definition Inclusive number of all samples tested by the Food Safety Section.
Purpose/importance Tracks the number of samples received for Veterinary Public Health testing
Source/collection of data Sample register of the Food Safety section.
Method of calculation Total number of samples for the report period as recorded in the sample
register of the Food Safety section.
Data limitations Sample register is compiled from submission register in LIMS.
Accuracy is determined by accuracy of the Technologist when indicating
the numbers of samples tested for Food Safety
Type of indicator Inputs (measure the number of specimens submitted by external clients)
Calculation type Non-cumulative (final annual figure is based on total of 4 quarterly reports)
Reporting cycle Quarterly
New indicator New indicator. Combines various indicators previously reported under
national and provincial indicators.
Desired performance Since the number of tests performed is linked to the number of specimens
received that, in turn is requested from external clients over whom the
laboratory has no control; both higher and lower performance will be
accepted.
Indicator responsibility Technologists in Food Safety must prepare sample register and
populate statistical spread sheet.
Technical manager populate transversal report sheet.
Laboratory manager signs off on report and submits to Programme
manager
Evidence Sample Registration Form and Diagnostic Report
Key risk Risk: Figures incorrectly transferred to statistical report
Mitigating measure: Figures checked by second official
Indicator title Number of samples tested for small holder farmers
Short definition All samples submitted that originates from owners classified as “emerging
farmer”.
Purpose/importance To give an indication as of the service rendered by the laboratory to this
group of owners
Source/collection of data LIMS submission register
Method of calculation Samples received from this group of owners are totalled in the LIMS
submission register.
Data limitations Data accuracy is determined whether samples received from this group of
owners are indicated as such on the sample submission form and also by
sample reception.
Type of indicator Inputs (measure the number of specimens submitted by external clients)
Calculation type Non-cumulative (final annual figure is based on total of 4 quarterly reports)
Reporting cycle Quarterly
New indicator New indicator
Desired performance Since the number of tests performed is linked to the number of specimens
received that, in turn is requested from external clients over whom the
laboratory has no control; both higher and lower performance will be
accepted.

Page 191 of 227
Indicator title Number of specimens tested
Short definition All samples derived from specimen tested by the laboratory for disease
diagnosis and food safety monitoring
Purpose/importance To facilitate disease control and contribute to public health
Source/collection of data Specimen register, specimen submission forms
Method of calculation Simple count
Data limitations None
Type of indicator Output
Calculation type Cumulative
Reporting cycle Quarterly
New indicator Significantly changed
Desired performance All suitable specimen submitted are tested
Indicator responsibility Veterinary technologists must populate statistical report.
Technical manager collates data and populate transversal report
sheet.
Laboratory manager signs off on report and submits to Programme
manager
Evidence Sample Registration Form and Diagnostic Report
Key risk
Risk: Figures incorrectly transferred to statistical report
Mitigating measure: Figures checked by second official
Indicator title Readiness of laboratory facility for cheese residue testing
Short definition Readiness refers to capability and capacity of the laboratory to execute
cheese residue testing
Purpose/importance To be able to tests specimens for chemical residue especially cheese for
export
Source/collection of data Quality Control Reports
Method of calculation Qualitative
Data limitations Yes
Type of indicator Output
Calculation type Observational evaluation
Reporting cycle Annual
New indicator Yes
Desired performance Facility to be able to conduct accredited tests
Indicator responsibility Sub-programme Manager
Evidence Quality Assurance Report
Key risk Risk: Test results or facility not accredited
Indicator title Number of cheese/ dairy samples tested for residues
Indicator responsibility Sample reception should log these samples as originating from this
group of owners.
Technical manager extracts submission report from LIMS, calculates
the total numbers of samples received from this group of owners and
populates the transversal report sheet.
Laboratory Manager signs off on report and submits to the
Programme Manager.
Evidence Sample Registration Form
Key risk
Risk: The field indicating that samples are received from “emerging farmer”
not marked when logged at Sample Reception
Mitigation measure: Checked by second official when correctness of invoice
details is checked.

Page 192 of 227
Short definition All samples derived from specimen tested by the laboratory for food safety
monitoring
Purpose/importance The provision of safe cheese/ dairy product through chemical residue
monitoring to facilitate the export of cheese
Source/collection of data Specimen register, specimen submission forms
Method of calculation Simple count
Data limitations None
Type of indicator Output
Calculation type Cumulative
Reporting cycle Quarterly
New indicator Yes
Desired performance All suitable specimen submitted are tested
Indicator responsibility Veterinary technologists must populate statistical report.
Technical manager collates data and populate transversal report
sheet.
Laboratory manager signs off on report and submits to Programme
manager
Evidence Sample registration form and diagnostic report
Key risk
Risk: Figures incorrectly transferred to statistical report
Mitigating measure: Figures checked by second official
Programme 5: Research and Technology Development Services
Sub Programme 5.1 Research
Strategic objective performance indicator
Indicator title Conduct agricultural research and technology development
Short definition Number of all research projects implemented within the financial year
Purpose/importance To conduct research to provide solutions to identified production constraints
by farmers and research clients through implementation of specific research
projects.
Source/collection of data Approved project proposal by research committees or progress report or
final reports or approval documentation
Method of calculation Simple count
Data limitations Number of research proposals submitted and final reports concluded
Multi-year nature of research
Human capacity and budget constraints
Natural disasters
Type of indicator Output
Calculation type Non-Cumulative
Reporting cycle Annually
New indicator No
Desired performance Actual performance should not deviate from the target (new projects could
be higher than set target if budget and capacity available)
Indicator responsibility Sub-programme manager
Evidence Approved project proposal by research committees OR progress report OR
final report OR Approval documentation
Key risk Limited research projects to address commodity needs and declining
support of 10% growth in agricultural production.
Mitigation: A constant flow of new projects will be ensured to stay abreast of
the latest technology developments in support of production and
sustainability.

Page 193 of 227
Sector specific indicators
Indicator title Number of research and technology development projects implemented to
improve agricultural production
Short definition Number of all research projects implemented within the financial year
Purpose/importance To conduct research to provide solutions to identified production constraints
by farmers and research clients through implementation of specific research
projects.
Source/collection of data Approved project proposal by research committees or progress report or
final reports
Method of calculation Simple count
Data limitations Number of research proposals submitted and final reports concluded
Multi-year nature of research
Human capacity and budget constraints
Natural disasters
Type of indicator Output
Calculation type Non-Cumulative
Reporting cycle Annually
New indicator No
Desired performance Actual performance should not deviate from the target (new projects could
be higher than set target if budget and capacity available)
Indicator responsibility Sub-programme manager
Evidence Approved project proposal by research committees OR progress report OR
final report
Key risk Limited research projects to address commodity needs and declining
support of 10% growth in agricultural production.
Mitigation: A constant flow of new projects will be ensured to stay abreast of
the latest technology developments in support of production and
sustainability.
Provincial specific indicators
Indicator Title Number of research committee meetings to evaluate projects
Short definition Number of meetings held by research project committee to evaluate
research projects
Purpose/Importance A quarterly meeting to discuss and approve research projects in a
coordinated way
Source/collection of data Agendas and minutes of scheduled research project meetings, collected by
Secretariat
Method of calculation Simple count
Data limitations Accuracy determined by research committee and Programme manager
Type of indicator Output
Calculation type Cumulative
Reporting cycle Quarterly
New indicator No
Desired performance On target desirable
Indicator responsibility Programme manager
Evidence Agenda of meetings
Minutes of research project meetings (signed off)
Key risk Not regular meetings could result in backlog of projects to be evaluated
and approved.
Mitigation: Quarterly scheduled meetings with ad hoc meetings when need
arise.

Page 194 of 227
Indicator Title Number of meetings with industry organisations to establish research needs
Short definition Number of meetings with industry organisations and technical committees to
discuss and establish research needs
Purpose/Importance Indicate the engagement with industry and its organisations to align the
research focus and address new research needs
Source/collection of data Agendas and supporting meeting documents from researchers, collected
by Institute Heads and Programme manager
Method of calculation Simple count
Data limitations Accuracy determined by Institute Head and Programme manager
Type of indicator Output
Calculation type Cumulative
Reporting cycle Quarterly
New indicator No
Desired performance Higher performance is desirable as it would indicate the need for research
and acknowledges the expertise and research input from the Department
Indicator responsibility Programme manager
Evidence Details from meetings
Agenda of meeting (when available)
Minutes (when available)
Attendance list indicating presence (when available) or minutes reflecting
attendance
Key risk Research portfolio not aligned with commodity needs.
Mitigation: Active participation in forums and working groups to determine
research needs.
Indicator Title Number of climate change projects executed
Short definition Number of projects on climate change executed
Purpose/Importance Indicate specific climate change focussed research projects being
executed
Source/collection of data Hard copies of projects of researchers, collected by Institute Heads
Method of calculation Simple count
Data limitations Accuracy determined by Institute Heads and research project committee
Type of indicator Output
Calculation type Non-cumulative
Reporting cycle Annually
New indicator No
Desired performance On target desirable
Indicator responsibility Programme manager
Evidence Hard copies of research reports
Key risk Adaptation and mitigation to climate change not addressed.
Mitigation: Ensuring that the research portfolio includes specific projects to
address the challenges.
Indicator Title Compile a climate change plan for agriculture
Short definition Compile a climate change plan for the agricultural sector in the Western
Cape
Purpose/Importance Consolidate mitigation and adaptation strategies against the challenges of
climate change
Source/collection of data Documents collected by Programme manager per event/process executed
Method of calculation Simple count
Data limitations Accuracy determined by Programme manager
Type of indicator Output, impact
Calculation type Non-cumulative
Reporting cycle Annually
New indicator No
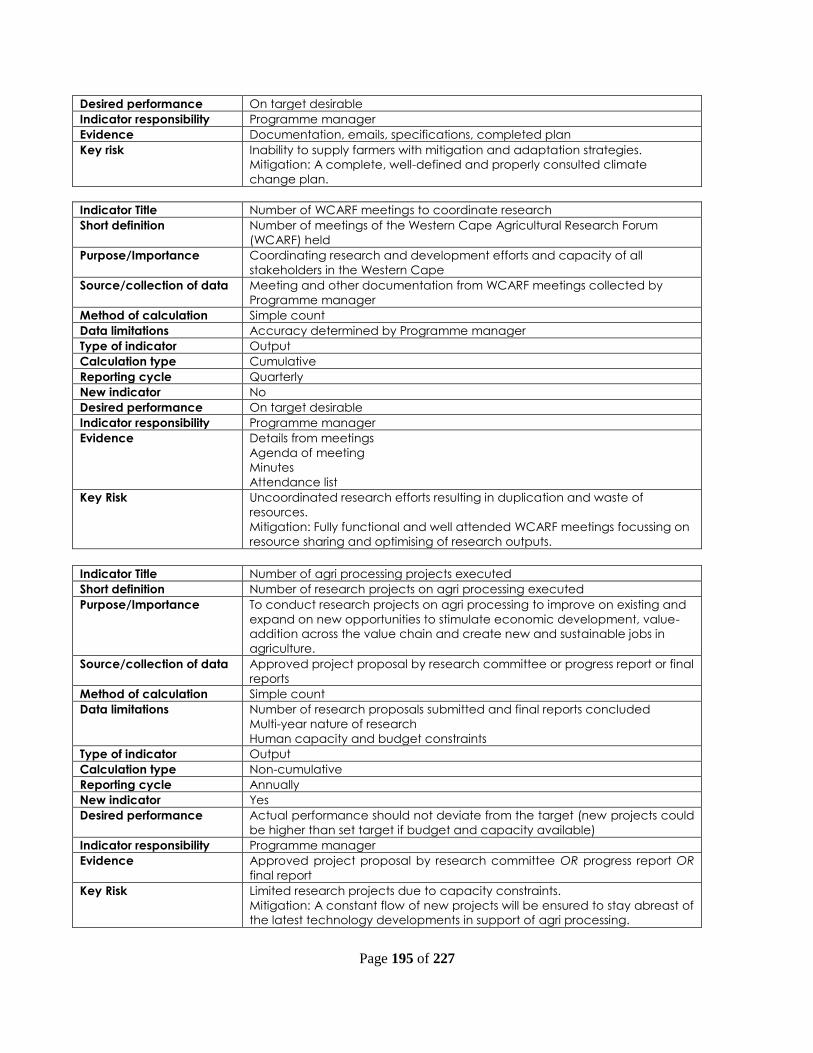
Page 195 of 227
Desired performance On target desirable
Indicator responsibility Programme manager
Evidence Documentation, emails, specifications, completed plan
Key risk Inability to supply farmers with mitigation and adaptation strategies.
Mitigation: A complete, well-defined and properly consulted climate
change plan.
Indicator Title Number of WCARF meetings to coordinate research
Short definition Number of meetings of the Western Cape Agricultural Research Forum
(WCARF) held
Purpose/Importance Coordinating research and development efforts and capacity of all
stakeholders in the Western Cape
Source/collection of data Meeting and other documentation from WCARF meetings collected by
Programme manager
Method of calculation Simple count
Data limitations Accuracy determined by Programme manager
Type of indicator Output
Calculation type Cumulative
Reporting cycle Quarterly
New indicator No
Desired performance On target desirable
Indicator responsibility Programme manager
Evidence Details from meetings
Agenda of meeting
Minutes
Attendance list
Key Risk Uncoordinated research efforts resulting in duplication and waste of
resources.
Mitigation: Fully functional and well attended WCARF meetings focussing on
resource sharing and optimising of research outputs.
Indicator Title Number of agri processing projects executed
Short definition Number of research projects on agri processing executed
Purpose/Importance To conduct research projects on agri processing to improve on existing and
expand on new opportunities to stimulate economic development, value-
addition across the value chain and create new and sustainable jobs in
agriculture.
Source/collection of data Approved project proposal by research committee or progress report or final
reports
Method of calculation Simple count
Data limitations Number of research proposals submitted and final reports concluded
Multi-year nature of research
Human capacity and budget constraints
Type of indicator Output
Calculation type Non-cumulative
Reporting cycle Annually
New indicator Yes
Desired performance Actual performance should not deviate from the target (new projects could
be higher than set target if budget and capacity available)
Indicator responsibility Programme manager
Evidence Approved project proposal by research committee OR progress report OR
final report
Key Risk Limited research projects due to capacity constraints.
Mitigation: A constant flow of new projects will be ensured to stay abreast of
the latest technology developments in support of agri processing.
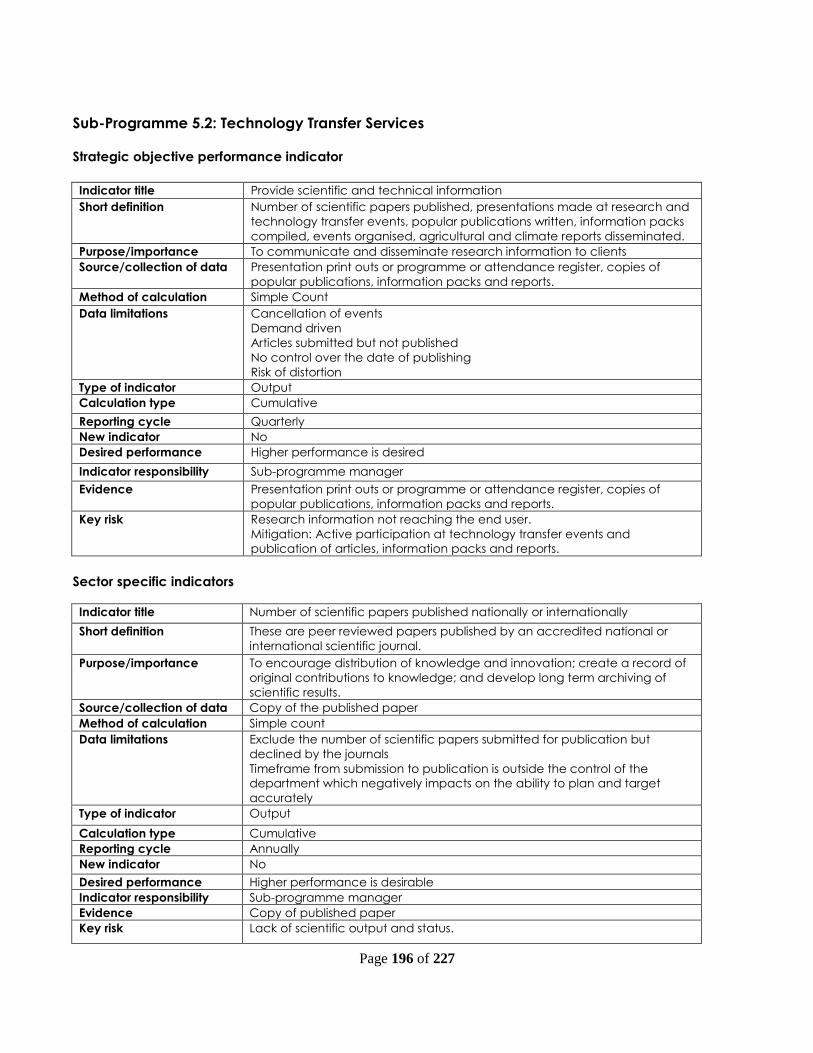
Page 196 of 227
Sub-Programme 5.2: Technology Transfer Services
Strategic objective performance indicator
Indicator title Provide scientific and technical information
Short definition Number of scientific papers published, presentations made at research and
technology transfer events, popular publications written, information packs
compiled, events organised, agricultural and climate reports disseminated.
Purpose/importance To communicate and disseminate research information to clients
Source/collection of data Presentation print outs or programme or attendance register, copies of
popular publications, information packs and reports.
Method of calculation Simple Count
Data limitations Cancellation of events
Demand driven
Articles submitted but not published
No control over the date of publishing
Risk of distortion
Type of indicator Output
Calculation type Cumulative
Reporting cycle Quarterly
New indicator No
Desired performance Higher performance is desired
Indicator responsibility Sub-programme manager
Evidence Presentation print outs or programme or attendance register, copies of
popular publications, information packs and reports.
Key risk Research information not reaching the end user.
Mitigation: Active participation at technology transfer events and
publication of articles, information packs and reports.
Sector specific indicators
Indicator title Number of scientific papers published nationally or internationally
Short definition These are peer reviewed papers published by an accredited national or
international scientific journal.
Purpose/importance To encourage distribution of knowledge and innovation; create a record of
original contributions to knowledge; and develop long term archiving of
scientific results.
Source/collection of data Copy of the published paper
Method of calculation Simple count
Data limitations Exclude the number of scientific papers submitted for publication but
declined by the journals
Timeframe from submission to publication is outside the control of the
department which negatively impacts on the ability to plan and target
accurately
Type of indicator Output
Calculation type Cumulative
Reporting cycle Annually
New indicator No
Desired performance Higher performance is desirable
Indicator responsibility Sub-programme manager
Evidence Copy of published paper
Key risk Lack of scientific output and status.

Page 197 of 227
Mitigation: Scientific output will be included in project output targets.
Indicator title Number of research presentations made nationally or internationally
Short definition A scientific event in this context includes scientific presentations (papers, key
note addresses and posters) made at scientific conferences / congresses,
seminars, symposium and workshops.
Purpose/importance To communicate and disseminate research information to peers
Source/collection of data Presentation print outs or programme indicating the name of the presenter
and event or abstract from proceedings
Method of calculation Simple Count
Data limitations Cancellation of events
Paper or presentation not accepted
Type of indicator Output
Calculation type Cumulative
Reporting cycle Quarterly
New indicator No
Desired performance Higher performance is desired
Indicator responsibility Sub-programme manager
Evidence Presentation print outs OR Programme indicating the name of the presenter
and event OR Abstract from the proceedings
Key risk Lack of scientific output and status.
Mitigation: Scientific output will be included in project output targets.
Provincial specific indicators
Indicator title Number of presentations made at technology transfer events
Short definition Presentations made at technology transfers events (farmers days,
information days, walk about, industry events, study groups, seminars etc.)
Purpose/importance To communicate and disseminate research information to clients
Source/collection of data Presentation print outs or programme or attendance register
Method of calculation Simple Count
Data limitations Cancellation of events
Demand driven
Type of indicator Output
Calculation type Cumulative
Reporting cycle Quarterly
New indicator No
Desired performance Higher performance is desired
Indicator responsibility Sub-programme manager
Evidence Presentation print outs OR Programme OR attendance register
Key risk Research information not reaching the end user.
Mitigation: Active participation at technology transfer events.
Indicator title Number of articles in popular media
Short definition Articles resulting from research and technologies published or broadcasted
in the popular media. (E.g. magazines, newspapers and newsletters etc.)
Purpose/importance To disseminate research and technology information
Source/collection of data Copy of the published articles or broadcasting details
Method of calculation Simple count
Data limitations Articles submitted but not published
No control over the date of publishing
Risk of distortion
Type of indicator Output
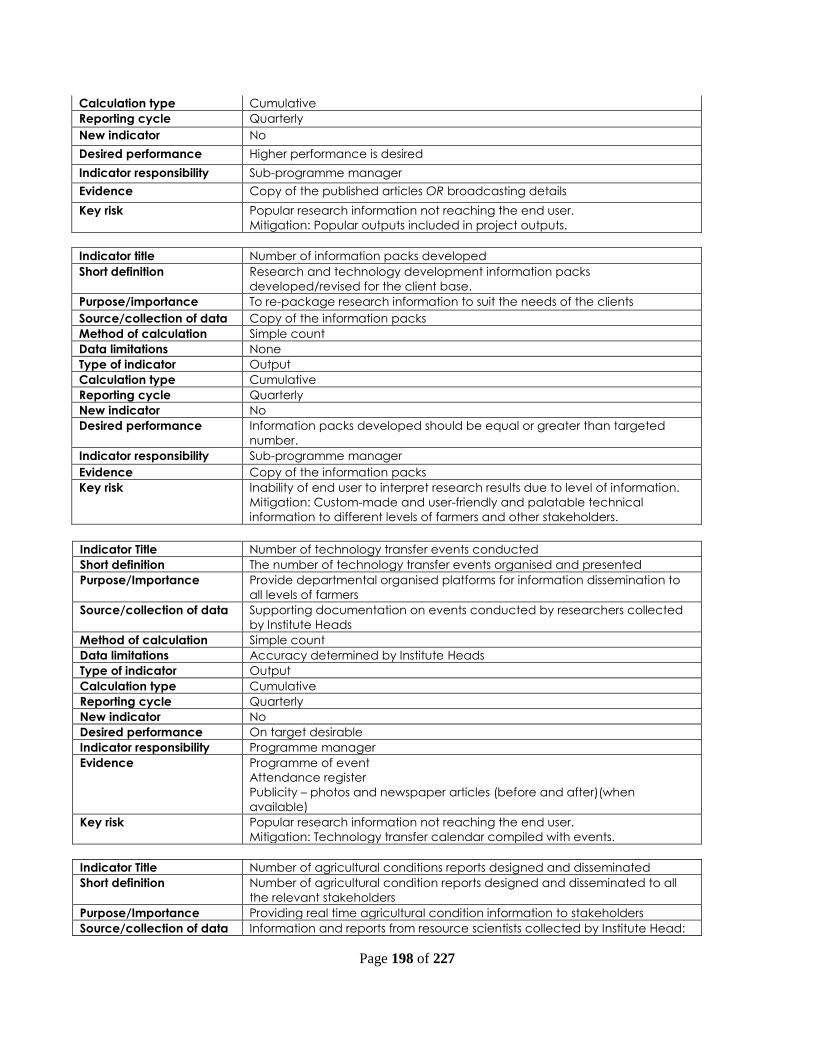
Page 198 of 227
Calculation type Cumulative
Reporting cycle Quarterly
New indicator No
Desired performance Higher performance is desired
Indicator responsibility Sub-programme manager
Evidence Copy of the published articles OR broadcasting details
Key risk Popular research information not reaching the end user.
Mitigation: Popular outputs included in project outputs.
Indicator title Number of information packs developed
Short definition Research and technology development information packs
developed/revised for the client base.
Purpose/importance To re-package research information to suit the needs of the clients
Source/collection of data Copy of the information packs
Method of calculation Simple count
Data limitations None
Type of indicator Output
Calculation type Cumulative
Reporting cycle Quarterly
New indicator No
Desired performance Information packs developed should be equal or greater than targeted
number.
Indicator responsibility Sub-programme manager
Evidence Copy of the information packs
Key risk Inability of end user to interpret research results due to level of information.
Mitigation: Custom-made and user-friendly and palatable technical
information to different levels of farmers and other stakeholders.
Indicator Title Number of technology transfer events conducted
Short definition The number of technology transfer events organised and presented
Purpose/Importance Provide departmental organised platforms for information dissemination to
all levels of farmers
Source/collection of data Supporting documentation on events conducted by researchers collected
by Institute Heads
Method of calculation Simple count
Data limitations Accuracy determined by Institute Heads
Type of indicator Output
Calculation type Cumulative
Reporting cycle Quarterly
New indicator No
Desired performance On target desirable
Indicator responsibility Programme manager
Evidence Programme of event
Attendance register
Publicity – photos and newspaper articles (before and after)(when
available)
Key risk Popular research information not reaching the end user.
Mitigation: Technology transfer calendar compiled with events.
Indicator Title Number of agricultural conditions reports designed and disseminated
Short definition Number of agricultural condition reports designed and disseminated to all
the relevant stakeholders
Purpose/Importance Providing real time agricultural condition information to stakeholders
Source/collection of data Information and reports from resource scientists collected by Institute Head:

Page 199 of 227
Resource Utilisation
Method of calculation Simple count
Data limitations Accuracy determined by Institute Head: Resource Utilisation
Type of indicator Output
Calculation type Cumulative
Reporting cycle Quarterly
New indicator No
Desired performance On target desirable, but changing climatic conditions could increase the
output number.
Indicator responsibility Programme manager
Evidence Hard copies of reports designed internally
Hard copies of reports received and disseminated with email distribution lists
Key risk End users not informed on agricultural conditions affecting their farming
operations.
Mitigation: Reports designed and disseminated in-time.
Indicator Title Number of climate reports distributed
Short definition Number of climate reports distributed to all stakeholders
Purpose/Importance Providing real time climate information to stakeholders
Source/collection of data Information and reports from resource scientists collected by Institute Head:
Resource Utilisation
Method of calculation Number of reports distributed is counted
Data limitations Accuracy determined by Institute Head: Resource Utilisation
Type of indicator Output
Calculation type Cumulative
Reporting cycle Quarterly
New indicator No
Desired performance On target desirable, but changing climatic conditions could increase the
output number.
Indicator responsibility Programme manager
Evidence Hard copies of reports or advisories with email distribution lists
Key risk End users not informed on agricultural conditions affecting their farming
operations.
Mitigation: Reports designed and disseminated in-time.
Sub-Programme 5.3: Infrastructure Support Service
Strategic objective performance indicator
Indicator title Provide on-farm infrastructure support
Short definition Number of research farms made available and maintained for research and
technology development.
Purpose/importance To provide and maintain research infrastructure for researchers to enhance
the provision of innovative solutions.
Source/collection of data Expenditure report or farm registers or facility registers or title deed or
maintenance plans
Method of calculation Simple count
Data limitations None
Type of indicator Input
Calculation type Non - cumulative
Reporting cycle Annually
New indicator No
Desired performance As targeted
Indicator responsibility Sub-programme manager

Page 200 of 227
Evidence Expenditure report OR farm registers OR facility registers OR title deed OR
maintenance plan
Key risk Sub-standard research farm support could hamper the research effort.
Mitigation: Optimally functioning and well maintained research farms.
Sector specific indicators
Indicator title Number of research infrastructure managed
Short definition Number of research infrastructure made available for research and
technology development. Research infrastructure refers to research farms
and facilities.
Purpose/importance To provide research infrastructure to researchers to enhance the provision of
innovative solutions.
Source/collection of data Expenditure report or farm registers or facility registers or title deed or
maintenance plan
Method of calculation Simple count
Data limitations None
Type of indicator Input
Calculation type Non - cumulative
Reporting cycle Annually
New indicator No
Desired performance As targeted
Indicator responsibility Sub-programme manager
Evidence Expenditure report OR farm registers OR facility registers OR title deed
Key risk Sub-standard research farm support could hamper the research effort.
Mitigation: Optimally functioning research farms.
Provincial specific indicators
Indicator Title Number of technical working committee meetings on research farms
Short definition Number of technical working committee meetings held per research farm
Purpose/Importance Meetings on research farm to discuss research related challenges and
solutions
Source/collection of data Supporting documentation from each research farm manager collected by
Programme manager
Method of calculation Number of meetings with supporting documentation is counted
Data limitations Accuracy determined by chief farm managers
Type of indicator Output
Calculation type Cumulative
Reporting cycle Quarterly
New indicator No
Desired performance On target desirable
Indicator responsibility Programme manager
Evidence Agenda of meetings
Draft minutes of meetings (to be signed off at next meeting)
Attendance register
Key risk Needs of internal research farm users not addressed in a coordinated way.
Mitigation: Regular meetings with affected parties to streamline effort and
optimise the resource usage.
Programme 6: Agricultural Economics Services
Sub-Programme 6.1: Agri-Business Support and Development

Page 201 of 227
Strategic objective performance indicator
Indicator title Number of stakeholders provided with agricultural economic services
Short definition A stakeholder refers to any person or organisation that is provided with
agricultural economic services which include among others market access
facilitation, agricultural cooperative development and maintenance
support, market information, and financial support and management
advice.
Purpose/importance To enhance the competitiveness of the agriculture and agribusiness sector
Source/collection of data Records of: attendance register, booklet with list of participating
companies/businesses, feedback report, site visit form, logged enquiry on
the database, a copy of the e-mail request and response.
Method of calculation Simple count
Data limitations None
Type of indicator Output
Calculation type Cumulative for the year
Reporting cycle Quarterly
New indicator No
Desired performance Enhanced efficiency and competiveness
Indicator responsibility Sub-programme managers
Evidence Records of one of the following: attendance register, booklet with list of
participating companies/businesses, feedback report, site visit form, logged
enquiry on the database, a copy of the e-mail request and response.
Key risk The high staff turnover might affect the services to be provided to
stakeholders
Mitigation: collaborate with various stakeholders and or use outsourced
services
Sector specific indicators
Indicator title
Number of Agri-Business supported with agricultural economic services to
access markets
Short definition Agri-businesses refer to agri processing projects, farm businesses and
cooperatives. Agricultural economic services refer to the development of
functional marketing institutions and infrastructure, compliance training,
general market training and facilitation of market agreements.
Purpose/importance
To enhance the capacity of entrepreneurs within the agricultural sector in
facilitating access to market.
To encourage successful entrepreneurship within the agricultural sector.
Source/collection of data Dated Invoices OR Receipts OR Contract OR Affidavit OR Compliance
Certificate e.g. Global Gap OR Letter of Intent. This also includes record of
one of the following: attendance register for training or report by
beneficiary, booklet with list of participating companies/businesses from
event facilitators or organisers or feedback report from clients that
received support through exposure or promotional activities, signed site
visit form for coordination of activities.
Method of calculation Simple count
Data limitations Confidentiality of information
Type of indicator Input (Outcome)
Calculation type Cumulative for the year
Reporting cycle Quarterly
New indicator No
Desired performance Higher performance is desired
Indicator responsibility Sub-programme manager

Page 202 of 227
Evidence Dated Invoices OR Contract OR Affidavit OR Global Gap OR Letter of
Intent. This also includes record of one of the following: attendance
register for training or report by beneficiary, booklet with list of
participating companies/businesses from event facilitators or organisers or
feedback report from clients that received support through exposure or
promotional activities, signed site visit form for coordination of activities.
Key risk
(New)
Lack of capacity on market access, lack of cooperation or resources to
implement recommended intervention
Mitigation: Capacitate producers through various means and align with
FSD on other kinds of support especially funding
Indicator title Number of clients who have benefitted from agricultural economic advice
provided
Short definition Clients refer to farmers, agribusinesses and other stakeholders and interested
parties. Agricultural economic advice includes but not limited to market
information and financial support. Advice also includes transfer of
information to inform farmer decisions.
Purpose/importance
To enable clients to make informed decisions in agri-business support and
development
Source/collection of data Records based on the following: Attendance register (if presentation was
given), a signed site visit form for on farm given advice, logged enquiry on
the database with the nature of advice given and the name and contact
information of the client if it’s a telephonic enquiry and response; a copy of
the e-mail request and response if enquiry was received through the e-mail;
copy of actual filled application form e.g. for access to finance
Method of calculation Simple count
Data limitations One client may be advised on several issues within the financial year
Type of indicator Input
Calculation type Cumulative for the year
Reporting cycle Quarterly
New indicator No
Desired performance Higher performance is desired
Indicator responsibility Sub-programme manager
Evidence Client Contact Form OR Register (Farmers Day) OR Database of Client
Enquiries OR Trip Itinerary OR Attendance register OR Market Information
Key risk
(New)
The high staff turnover (specialised and scarce skills) within AES is diminishing
the pool of scarce specialised skills and this is primarily due to the lack of
market related salaries, lack of career paths which negatively affects the
unit's ability to deliver on their mandates.
Mitigation: collaborate with various stakeholders and or use outsourced
services. Play an advocacy role and lobby for agricultural economists in
other platforms
Provincial specific indicators
Indicator Title Number of marketing information outputs disseminated
Short definition Market information outputs refer to reports resulting from objective collection
and analysis of data about a particular target market, competition,
opportunities, and/or environment etc. for a particular industry or product.
The reports are normally in the form of a pamphlet (mini version) or a
comprehensive market analysis and or price information or commodity
report
Purpose/Importance For informed decision making, planning and increased market access
Source/collection of data Records of the following: Copies of the pamphlets, market analysis and or
price information reports
Method of calculation Simple count

Page 203 of 227
Data limitations The accuracy of records kept
Type of indicator Output
Calculation type Cumulative for the year
Reporting cycle Quarterly
New indicator No
Desired performance Increased requests and uptake of market opportunities
Indicator responsibility Sub-programme manager
Evidence Copies of the pamphlets OR market analysis and or price information reports
Key risk
(New)
Unreliable agricultural data leads to poor policy skewed results on analysis
conducted. This is mainly due to the lack of resources (human, budget, skills
and systems) to source, analyse and verify data. Also lack of cooperation,
cohesion from clients and respondents is problematic at times (info supplied
can be questionable and/or unreliable).
Mitigation: Collaborate and forge relationships with various stakeholders.
Also subscribe to various platforms to obtain data
Indicator Title Value of committed investment for green fields and expansion agricultural
and agribusiness projects
Short definition Committed project refers to projects where the investment deal is approved
for implementation. In other words when all requirements (e.g. finances,
getting a partner, site allocation or approval, EIA application approval etc.)
are in place and nothing can stop the project from implementation
Purpose/Importance Investment is critical in support of sustainable agricultural and agri-business
development to increase economic growth and hence employment
creation
Source/collection of data Records of signed declaration between the facilitating
company/organisation and the client or investor
Method of calculation Simple count
Data limitations Underreporting and accuracy resulting from lack of cooperation from clients
supported
Type of indicator Outcome
Calculation type Cumulative for the year
Reporting cycle Annually
New indicator No
Desired performance Increased investment
Indicator responsibility Sub-programme manager
Evidence Records of signed declaration between the facilitating
company/organisation and the client or investor
Key risk
(New)
Unstable economic environment, competition between provinces, scarce
resources e.g. water and finances
Mitigation: Established relationship with international agencies for targeted
promotion and business proposition
Indicator Title Number of budgets developed
Short definition New budgets developed due to new enterprises and changes in
technologies and production practices
Purpose/Importance For informed decision making, to facilitate planning and investment, and for
benchmarking
Source/collection of data Records of actual budgets developed
Method of calculation Simple count
Data limitations Accuracy of records kept
Type of indicator Output
Calculation type Cumulative for the year
Reporting cycle Quarterly
New indicator No
Desired performance Increased number of budgets
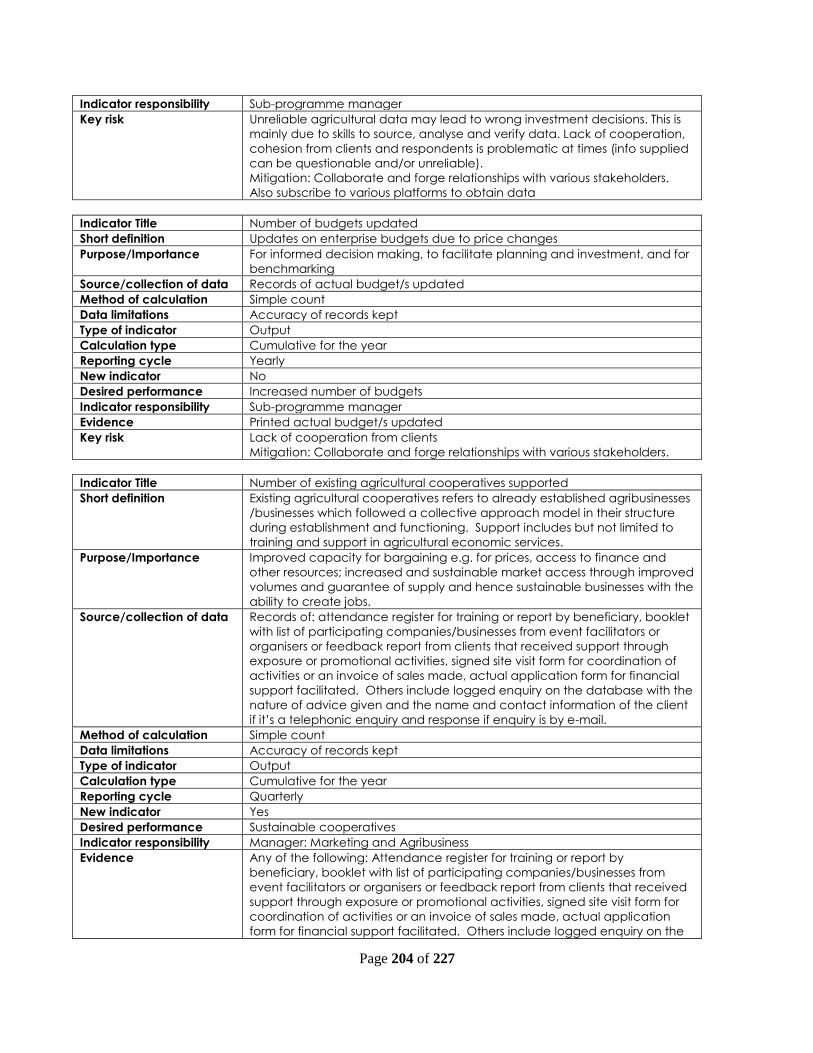
Page 204 of 227
Indicator responsibility Sub-programme manager
Key risk Unreliable agricultural data may lead to wrong investment decisions. This is
mainly due to skills to source, analyse and verify data. Lack of cooperation,
cohesion from clients and respondents is problematic at times (info supplied
can be questionable and/or unreliable).
Mitigation: Collaborate and forge relationships with various stakeholders.
Also subscribe to various platforms to obtain data
Indicator Title Number of budgets updated
Short definition Updates on enterprise budgets due to price changes
Purpose/Importance For informed decision making, to facilitate planning and investment, and for
benchmarking
Source/collection of data Records of actual budget/s updated
Method of calculation Simple count
Data limitations Accuracy of records kept
Type of indicator Output
Calculation type Cumulative for the year
Reporting cycle Yearly
New indicator No
Desired performance Increased number of budgets
Indicator responsibility Sub-programme manager
Evidence Printed actual budget/s updated
Key risk Lack of cooperation from clients
Mitigation: Collaborate and forge relationships with various stakeholders.
Indicator Title Number of existing agricultural cooperatives supported
Short definition Existing agricultural cooperatives refers to already established agribusinesses
/businesses which followed a collective approach model in their structure
during establishment and functioning. Support includes but not limited to
training and support in agricultural economic services.
Purpose/Importance Improved capacity for bargaining e.g. for prices, access to finance and
other resources; increased and sustainable market access through improved
volumes and guarantee of supply and hence sustainable businesses with the
ability to create jobs.
Source/collection of data Records of: attendance register for training or report by beneficiary, booklet
with list of participating companies/businesses from event facilitators or
organisers or feedback report from clients that received support through
exposure or promotional activities, signed site visit form for coordination of
activities or an invoice of sales made, actual application form for financial
support facilitated. Others include logged enquiry on the database with the
nature of advice given and the name and contact information of the client
if it’s a telephonic enquiry and response if enquiry is by e-mail.
Method of calculation Simple count
Data limitations Accuracy of records kept
Type of indicator Output
Calculation type Cumulative for the year
Reporting cycle Quarterly
New indicator Yes
Desired performance Sustainable cooperatives
Indicator responsibility Manager: Marketing and Agribusiness
Evidence Any of the following: Attendance register for training or report by
beneficiary, booklet with list of participating companies/businesses from
event facilitators or organisers or feedback report from clients that received
support through exposure or promotional activities, signed site visit form for
coordination of activities or an invoice of sales made, actual application
form for financial support facilitated. Others include logged enquiry on the

Page 205 of 227
database with the nature of advice given and the name and contact
information of the client if it’s a telephonic enquiry and response if enquiry is
by e-mail.
Key risk Lack of willingness to cooperate due to social conflicts and also lack of
resources.
Mitigation: Proper selection of businesses and collaboration with other
programmes and departments for improved access to other state resources.
Indicator Title Number of agricultural cooperatives developed
Short definition Cooperatives refer to new established agribusinesses/businesses which
follow a collective approach model in their structure and functioning during
establishment. Support includes but not limited to training on principles of
cooperative model and constitution, and facilitation of the registration
process
Purpose/Importance Improved capacity for bargaining e.g. for prices, access to finance and
other resources; increased and sustainable market access through improved
volumes and guarantee of supply and hence sustainable businesses with the
ability to create jobs
Source/collection of data Records of attendance register if workshops or presentation were made,
copy of certificate if a company was assisted with registration, client
contact/site visit form for other advice provided
Method of calculation Simple count
Data limitations Accuracy of records kept
Type of indicator Output
Calculation type Cumulative for the year
Reporting cycle Quarterly
New indicator Yes
Desired performance Sustainable cooperatives
Indicator responsibility Manager: Marketing and Agribusiness
Evidence Any of the following: Attendance register if workshops or presentation were
made, copy of certificate if a company was assisted with registration, client
contact/site visit form for other advice provided
Key risk Lack of willingness to cooperate due to social conflicts and also lack of
resources.
Mitigation: Proper facilitation through inception workshops.
Indicator Title Number of stakeholders engaged on agricultural economic activities
Short definition Agricultural stakeholders refer to external clients in industry organisations,
other departments, parastatals, institutions and organisations. Engagement
refers to formal meetings and attendance of workshops or conferences /or
other engagements on agricultural economic activities.
Purpose/Importance Capacity building, increased quality of services, broadened access of
services, budget savings and efficiency.
Source/collection of data Attendance register or stakeholder/site visit form
Method of calculation Simple count
Data limitations Accuracy of record kept
Type of indicator Output
Calculation type Cumulative for the year
Reporting cycle Quarterly
New indicator Yes
Desired performance Capacitated personnel, increased access to information and access of
services.
Indicator responsibility Sub-programme manager
Evidence Signed client/stakeholder engagement form, or back to office
report/minutes with agenda or invite/ attendance register.
Key risk Lack of cooperation and commitment from stakeholders.
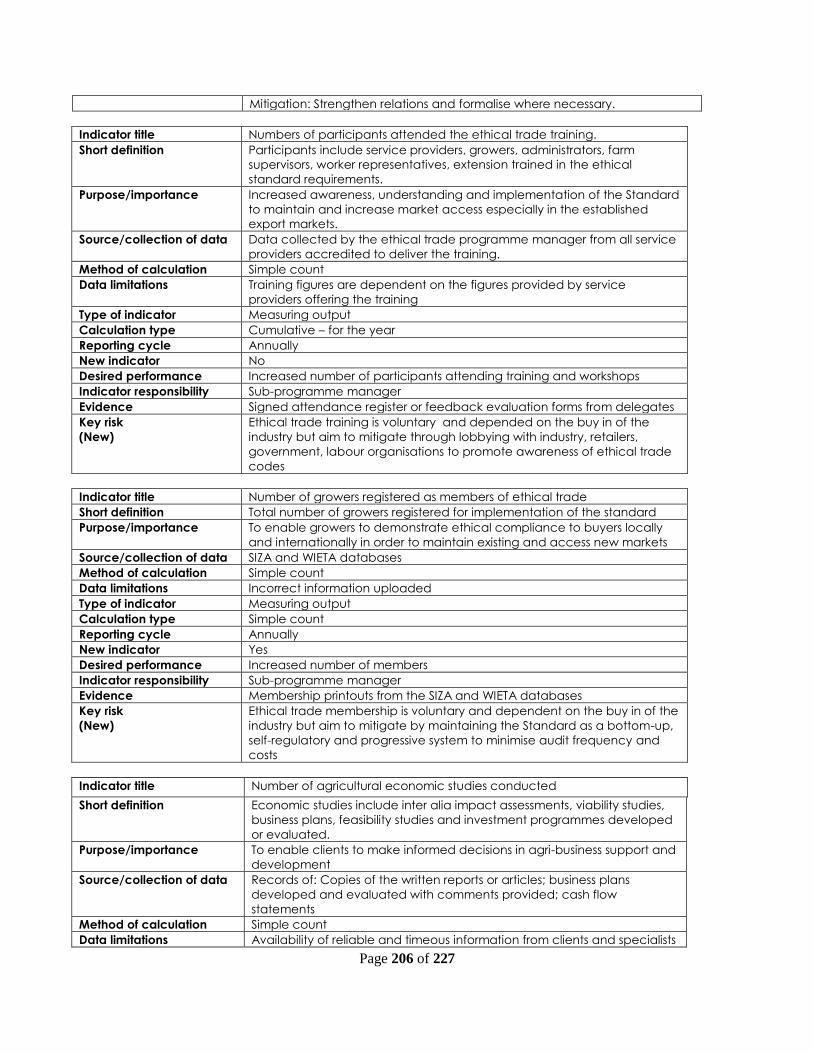
Page 206 of 227
Mitigation: Strengthen relations and formalise where necessary.
Indicator title Numbers of participants attended the ethical trade training.
Short definition Participants include service providers, growers, administrators, farm
supervisors, worker representatives, extension trained in the ethical
standard requirements.
Purpose/importance
Increased awareness, understanding and implementation of the Standard
to maintain and increase market access especially in the established
export markets.
Source/collection of data Data collected by the ethical trade programme manager from all service
providers accredited to deliver the training.
Method of calculation Simple count
Data limitations Training figures are dependent on the figures provided by service
providers offering the training
Type of indicator Measuring output
Calculation type Cumulative – for the year
Reporting cycle Annually
New indicator No
Desired performance Increased number of participants attending training and workshops
Indicator responsibility Sub-programme manager
Evidence Signed attendance register or feedback evaluation forms from delegates
Key risk
(New)
Ethical trade training is voluntary and depended on the buy in of the
industry but aim to mitigate through lobbying with industry, retailers,
government, labour organisations to promote awareness of ethical trade
codes
Indicator title Number of growers registered as members of ethical trade
Short definition Total number of growers registered for implementation of the standard
Purpose/importance
To enable growers to demonstrate ethical compliance to buyers locally
and internationally in order to maintain existing and access new markets
Source/collection of data SIZA and WIETA databases
Method of calculation Simple count
Data limitations Incorrect information uploaded
Type of indicator Measuring output
Calculation type Simple count
Reporting cycle Annually
New indicator Yes
Desired performance Increased number of members
Indicator responsibility Sub-programme manager
Evidence Membership printouts from the SIZA and WIETA databases
Key risk
(New)
Ethical trade membership is voluntary and dependent on the buy in of the
industry but aim to mitigate by maintaining the Standard as a bottom-up,
self-regulatory and progressive system to minimise audit frequency and
costs
Indicator title Number of agricultural economic studies conducted
Short definition Economic studies include inter alia impact assessments, viability studies,
business plans, feasibility studies and investment programmes developed
or evaluated.
Purpose/importance
To enable clients to make informed decisions in agri-business support and
development
Source/collection of data Records of: Copies of the written reports or articles; business plans
developed and evaluated with comments provided; cash flow
statements
Method of calculation Simple count
Data limitations Availability of reliable and timeous information from clients and specialists

Page 207 of 227
Type of indicator Input
Calculation type Cumulative for the year
Reporting cycle Quarterly
New indicator Continues without change from the previous year
Desired performance Higher performance is desired
Indicator responsibility Sub-programme manager
Evidence Reports
Key risk
(New)
The high staff turnover (specialised and scarce skills) within AES is
diminishing the pool of scarce specialised skills and this is primarily due to
the lack of market related salaries, lack of career paths which negatively
affects the Programme's ability to deliver on their mandates.
Mitigation: Collaborate with various stakeholders and or use outsourced
services. Play an advocacy role and lobby for agricultural economists in
other platforms
Indicator title Number of activities supported to promote Western Cape products
Short definition Refers to events and or platforms in the international and domestic
markets which are coordinated (logistical arrangements) and or
supported financially for utilisation and access by Western Cape clients in
the agricultural and agri processing sector
Purpose/importance
Increased awareness to sustain existing and access new markets. The
expected outcome is increased exports, foreign exchange and jobs.
Source/collection of data Record of activities/platforms/events coordinated e.g. signed
attendance register or exhibition booklet or request for funding with proof
of payment
Method of calculation Simple count
Data limitations External and internal limitations
Type of indicator Output
Calculation type Cumulative
Reporting cycle Quarterly
New indicator Yes
Desired performance As targeted or higher performance
Indicator responsibility Sub-programme Manager
Evidence Record of activities/platforms/events coordinated e.g. signed
attendance register or exhibition booklet or request for funding with proof
of payment
Key risk
(New)
The events are highly depended on external factors e.g. event organisers,
environmental, political economic factors. The latter refers to availability
of funding and human resources.
Indicator title Number of meat processing businesses supported for compliance
Short definition Refer to agri processing and or value addition businesses or entities with
specific emphasis to abattoirs. Compliance support will include but not
limited to assessments, training, auditing, facilitation of financial support
etc.
Purpose/importance
To meet public and private status on various aspects as required by law
and market and consumers
Source/collection of data Compliance certificates, Status quo or progress reports, or feedback
reports for training or signed attendance register, or site visit forms
Method of calculation Simple count
Data limitations Confidentiality of information
Type of indicator Input (Outcome)
Calculation type Cumulative for the year
Reporting cycle Annually
New indicator New
Desired performance As targeted or Higher performance is desired

Page 208 of 227
Indicator responsibility Sub-programme manager
Evidence Compliance certificates, Status quo or progress reports, or feedback
reports for training or signed attendance register, or site visit forms
Key risk
(New)
Lack of capacity on market access, lack of cooperation or resources to
implement recommended intervention
Mitigation: Capacitate producers through various means and mobilise
involvement of other stakeholders for additional support
Sub-programme 6.2: Macroeconomics Support
Strategic objective performance indicator
Indicator title Number of information activities performed to support sound decision
making
Short definition Information activities refer to information requests, reports produced, surveys
conducted, databases, information dissemination activities
Purpose/importance To provide macro and resource economics intelligence to inform planning
and sound decision making
Source/collection of data Enquiry database, databases, reports, questionnaires, event booklets,
attendance register, presentations/scripts
Method of calculation Simple count
Data limitations None
Type of indicator Output
Calculation type Cumulative and noncumulative
Reporting cycle Quarterly and annually
New indicator No
Desired performance Enhance decision making
Indicator responsibility Sub-programme Mangers
Evidence Enquiry database, databases, reports, questionnaires, event booklets,
attendance register, presentations/scripts
Key risk Unreliable agricultural data leads to poor policy and decision making and
improper/skewed results on analysis conducted
Mitigation: Collaborate and forge relationships with various stakeholders.
Also subscribe to various platforms to obtain data
Sector specific indicators
Indicator title Number of agricultural economic information responses provided
Short definition
This information from existing sources provided to clients and it may include
single figures, emails and datasets.
Purpose/importance Information to support planning and decision making
Source/collection of data Databases that covers regional agricultural statistics, enterprises data, pluri-
activity data – data is collected from both primary and secondary data
sources
Method of calculation Simple count
Data limitations Availability and reliability of data
Type of indicator Input
Calculation type Cumulative
Reporting cycle Quarterly
New indicator Significantly changed
Desired performance Higher performance is desired
Indicator responsibility Sub-programme manager: Statistics
Evidence Request Database OR Copy of Response OR Client Contact Form OR

Page 209 of 227
Reports
Key risk
The lack of qualified and experienced personnel seriously hampers service
delivery and may result in less enquiries received due to loss of trust in data
integrity, as well as data not captured properly. Mitigation includes
conducting in-service training, continuous motivating personnel and to
attempt to improve careers within the ambit of Agricultural Economics
Indicator title Number of economic reports compiled
Short definition Reports adding value to existing macroeconomic and statistical information
with the objective of supporting strategic planning and policy decision
making in the sector to implement frameworks. This may include situational
analysis, pamphlets, articles, presentations, scheduled publications (e.g.
economic performance report).
Purpose/importance Information to support planning and decision making
Source/collection of data Record of actual reports, pamphlets, articles, presentations, scheduled
publications, and ad hoc reports during the reporting year
Method of calculation Simple count
Data limitations Availability and reliability of data
Type of indicator Input
Calculation type Cumulative
Reporting cycle Quarterly
New indicator Significantly changed
Desired performance Higher performance is desired
Indicator responsibility Sub-programme manager
Evidence Reports
Key risk The high staff turnover (specialised & scarce skills) within AES is diminishing the
pool of scarce specialised skills and this is primarily due to the lack of market
related salaries, lack of career paths which negatively affects the
Programme's ability to deliver on their mandates.
Mitigation: Collaborate with various stakeholders, training of personnel and
or use outsourced services. Play an advocacy role and lobby for agricultural
economists in other platforms
Provincial specific indicators
Indicator title Number of databases populated
Short definition A database developed to share agri processing economic opportunities
Purpose/importance
A database is the electronic grouping of demand driven data/information
which generally have to be generated and populated continuously and
stored in an accessible way in order to extract data and information
Source/collection of data Databases captures information including time series data which is critical for
research and sound and rational decision-making at all levels
Method of calculation Data/information are sourced from a diverse array of both primary and
secondary data sources
Data limitations
Data/information is captured within electronic databases, mostly excel and
backups are made so as to ascertain that datasets are not lost due to power
failures, fires, theft etc.
Type of indicator The accurate input/capturing of data/information may be problematic but is
offset by the use of graphic presentations which may indicate
data/information that is not within certain parameters. Data/information is
also just as good as its source and the accuracy of this cannot always be
guaranteed
Calculation type Input and output
Reporting cycle Cumulative
New indicator Annually, and databases worked on during the year are counted to give a
total for the year

Page 210 of 227
Desired performance No
Indicator responsibility The number of databases is demand driven. Time series data of longer than
ten years is preferable. All data wherever possible should be spatially linked
Evidence Programme manager
Key risk A template that indicates quarterly changes to databases.
Indicator title Number of surveys conducted
Short definition A data collection method/tool used to gather information on identified issues
Purpose/importance
Agricultural surveys are conducted to source primary data that is not
available in the general domain. This provides insight into matters of concern
to the agricultural sector and will enhance improved agricultural decision
making
Source/collection of data Surveys are generally conducted amongst agricultural stakeholders through
various methods not limited to questionnaires that are developed and sent
out for completion.
Method of calculation Simple count
Data limitations
Data is only as good as its source. If inaccurate data is sourced, the analysis
thereof would prove to be a waste of time and money. Data integrity checks
are therefore of the utmost importance and not negotiable.
Type of indicator Input and output
Calculation type Cumulative
Reporting cycle Quarterly
New indicator No
Desired performance Agricultural programmes who wish to conduct surveys should liaise with this
Programme who will assist in the design of questionnaires and who will take
responsibility for the capturing and analysis of data.
Indicator responsibility Programme manager
Evidence
Documentation of the management process of the survey e.g. a
questionnaires and survey results.
Key risk The main risk is that respondents do not give accurate evidence/data and
that the designated populations do not respond in number big enough so as
to allow for successful and representative generation of information
Mitigation: Proper consultation and feedback to stakeholders and
strengthen relation with stakeholders
Indicator Title Number of information dissemination activities conducted
Short definition Information dissemination activities include events organised or attended
where presentations on agricultural economics information were made. This
may include radio talks, group talks, road shows, farmers days etc.
Purpose/Importance Tracks the information disseminated to clients and ensures transfer of
knowledge and information for improved decision making
Source/collection of data Record of presentations/scripts made or produced, or attendance register,
event booklet with list of companies where exhibitions were organised or
report by the company/s participated
Method of calculation Simple count
Data limitations Accuracy of record kept
Type of indicator Cumulative for the year
Calculation type Output
Reporting cycle Quarterly
New indicator Yes
Desired performance Increased number of information dissemination sessions for improved transfer
of knowledge and information
Indicator responsibility Sub-programme manager
Evidence Actual presentation/script made or produced, or attendance register, event
booklet with list of companies where exhibitions were organised or report by
the company/s participated.

Page 211 of 227
Key risk
(New)
Unreliable agricultural data leads to poor policy skewed results on analysis
conducted. This is mainly due to the lack of resources (human, budget, skills
and systems) to source, analyse & verify data. Also lack of cooperation,
cohesion from clients and respondents is problematic at times (info supplied
can be questionable and/or unreliable).
Mitigation: Collaborate with various stakeholders and or use outsourced
services.
Indicator title A database developed to share agri processing economic opportunities
Short definition A database is the electronic grouping of demand driven data/information
which generally have to be generated and populated continuously and
stored in an accessible way in order to extract data and information
Purpose/importance
Databases captures information including time series data which is critical for
research and sound and rational decision-making at all levels
Source/collection of data Data/information are sourced from a diverse array of both primary and
secondary data sources
Method of calculation Data/information is captured within electronic databases, mostly excel and
backups are made so as to ascertain that datasets are not lost due to power
failures, fires, theft etc.
Data limitations The accurate input/capturing of data/information may be problematic but is
offset by the use of graphic presentations which may indicate
data/information that is not within certain parameters. Data/information is
also just as good as its source and the accuracy of this cannot always be
guaranteed
Type of indicator Input and output
Calculation type Cumulative
Reporting cycle Annually, and databases worked on during the year are counted to give a
total for the year
New indicator Yes
Desired performance The number of databases is demand driven. Time series data of longer than
ten years is preferable. All data wherever possible should be spatially linked
Indicator responsibility Programme manager
Evidence A template that indicates quarterly changes to databases.
Key risk
(New)
Data is not accurate and cannot be verified. Electronic databases may go
corrupt and not adequate back-ups are made
Mitigation: Collaborate with various stakeholders, have systems and SOPS to
ensure backups and also share the data with integrated systems
Programme 7: Structured Agricultural Education and Training
Sub-Programme 7.1: Higher Education and Training
Strategic objective performance indicator
Indicator title Number of agricultural Higher Education and Training graduates
Short definition Total number of students graduating with full qualifications according to
the Higher Education Qualification Framework (HEQF) structure.
Purpose/importance
To indicate the number of graduates available for potential participation
in the sector
Source/collection of data Student records
Method of calculation Simple count
Data limitations None
Type of indicator Output
Calculation type Non-cumulative
Reporting cycle Annually

Page 212 of 227
New indicator Significantly changed
Desired performance Higher performance is desired (More students are desired to complete)
Indicator responsibility Sub-programme manager
Evidence
Student files (includes registration forms, certified copy of IDs, copy of
diplomas); Graduation Programme; Graduation list
Key risk
Risk 1
Limitations of the student system that does not generate accurate
information regarding the prerequisites for the achievements of a
qualification could result in the department being exposed to litigations
and adverse publicity.
Mitigation of Risk 1
Documents are checked and verified by 3 administrative staff members
before recommendation and signed off by Student Administration Head
Sector specific indicators
Indicator title Number of agricultural Higher Education and Training graduates
Short definition Total number of students graduating with full qualifications according to the
Higher Education Qualification Framework (HEQF) structure.
Purpose/importance
To indicate the number of graduates available for potential participation in
the sector
Source/collection of data Student records
Method of calculation Simple count
Data limitations None
Type of indicator Output
Calculation type Non-cumulative
Reporting cycle Annually
New indicator Significantly changed
Desired performance Higher performance is desired (More students are desired to complete)
Indicator responsibility Sub-programme manager
Evidence
Student files (includes registration forms, certified copy of IDs, copy of
diplomas); Graduation Programme; Graduation list
Key risk
Risk 1
Limitations of the student system that does not generate accurate
information regarding the prerequisites for the achievements of a
qualification could result in the department being exposed to litigations and
adverse publicity.
Mitigation of Risk 1
Documents are checked and verified by 3 administrative staff members
before recommendation and signed off by Student Administration Head
Provincial specific indicators
Indicator title Number of students registering into accredited Higher Education
Short definition Total number of students who registered for accredited qualifications
according to the Higher Education Qualification Framework (HEQF) structure
Purpose/importance To indicate the uptake / interest in the different programmes that are
offered and to ensure agricultural education and training programmes are
aligned to the agricultural education and training (AET)strategy
Source/collection of data AET Strategy, Student files, Prospectus
Method of calculation Simple count
Data limitations None
Type of indicator Output
Calculation type Non-cumulative
Reporting cycle Annually
New indicator No

Page 213 of 227
Desired performance Higher performance is desired
Indicator responsibility Sub-programme manager
Evidence Student database OR Student files (includes registration forms and
certified copy of IDs)
Key risk Risk 1
Limitations of number of applicants applying for admission and full-filling the
minimum academic requirement.
Mitigation of Risk 1
Marketing of available training programmes and promoting agriculture as
potential career option to learners at school.
Indicator title Number of internal bursaries awarded
Short definition Total number of students who receive bursaries from own budget
Purpose/importance To indicate the number of students who benefit from the Human Capital
Development Strategy of the province
Source/collection of data Student files, application forms, ID documents; proof of bank statements for 3
months; income statements approval letters and academic record
Method of calculation Simple count
Data limitations None
Type of indicator Output
Calculation type Non – Cumulative
Reporting cycle Annually
New indicator Unchanged
Desired performance Higher performance is desired
Indicator responsibility Sub - Programme Manager
Evidence
Student files, application forms, ID documents; proof of bank statements for 3
months; income statements approval letters and academic record
Key risk
Risk 1
Limitations of the budget available to assist students who cannot afford to
pay required fees and who has no access to loan financing
Mitigation of Risk 1
Sourcing of external bursaries.
Indicator title Implementation of student equity targets
Short definition Total number of Black students who registered for accredited Higher
Education Programmes
Purpose/importance
To indicate the up take / interest of Black students in the different
programmes that are offered.
Source/collection of data Student system, ID’s
Method of calculation Simple count
Data limitations None
Type of indicator Output
Calculation type Non – Cumulative
Reporting cycle Annually
New indicator Unchanged
Desired performance Higher performance is desired
Indicator responsibility Sub - Programme Manager
Evidence
Student database OR Student files (includes registration forms and
certified copy of IDs)
Key risk
Risk 1
Very limited number of Black applicants who satisfy the entry requirements
Mitigation of Risk 1
Marketing agriculture as career at schools, expo’s career exhibitions, in
media, etc.
Offer limited number of bursaries
Source external bursaries.

Page 214 of 227
Indicator title Number of short courses offered
Short definition Total number of short courses offered to students and public on HET level
Purpose/importance
To indicate the different short courses that are offered and to ensure
agricultural education and training programmes are aligned to the
agricultural education and training (AET)strategy
Source/collection of data AET Strategy, Student files, Prospectus and attendance registers
Method of calculation Simple count
Data limitations None
Type of indicator Output
Calculation type Cumulative
Reporting cycle Quarterly
New indicator Unchanged
Desired performance Higher performance is desired
Indicator responsibility Sub - Programme Manager
Evidence
Student database OR Student files (includes registration forms and
attendance registers and certified copies of IDs.)
Key risk
Risk 1
Relative high staff turnover within the unit due to more lucrative offers
being accepted by staff which results in severe service disruption and
affects the quality of service provided to the students and can affect
accreditation.
Mitigation Risk 1
1. Counter offers where possible.
2. Application done to review job description from lecturing staff to
training coordinators (at least level 9).
3. Organisational development investigation pending.
Indicator title Number of students completing short courses
Short definition Total number of students who completed the short courses as outlined in the
prospectus
Purpose/importance
To indicate the up take / interest in the different short courses that are
offered and to ensure agricultural education and training short courses are
aligned to the agricultural education and training (AET)strategy
Source/collection of data AET Strategy, Student application records, Marks; Attendance registers
Method of calculation Simple count
Data limitations None
Type of indicator Output
Calculation type Cumulative
Reporting cycle Quarterly
New indicator Unchanged
Desired performance Higher performance is desired
Indicator responsibility Sub - Programme Manager
Evidence Student files (includes registration forms and certified copy of IDs)
Key risk
Risk 1
Relative high staff turnover within the unit due to more lucrative offers being
accepted by staff which results in severe service disruption and affects the
quality of service provided to the students and can affect accreditation.
Mitigation Risk 1
1. Counter offers where possible.
2. Application done to review job description from lecturing staff to
training coordinators (at least level 9).
3. Organisational development investigation pending.
Indicator title Number of agri processing short courses offered and/or supported
Short definition Total number of short courses offered to support and enhance agri

Page 215 of 227
processing and value addition
Purpose/importance
To indicate the different short courses that are offered to support secondary
agriculture and to ensure agricultural education and training programmes
are aligned to the agricultural education and training (AET)strategy
Source/collection of data AET Strategy, Student files, Prospectus and attendance registers
Method of calculation Simple count
Data limitations None
Type of indicator Output
Calculation type Cumulative
Reporting cycle Quarterly
New indicator Unchanged
Desired performance Higher performance is desired
Indicator responsibility Sub - Programme Manager
Evidence
Student database OR Student files (includes registration forms and
attendance registers and certified copies of ID’s.)
Key risk
Risk 1
Relative high staff turnover within the unit due to more lucrative offers being
accepted by staff which results in severe service disruption and affects the
quality of service provided to the students and can affect accreditation.
Mitigation Risk 1
1. Counter offers where possible.
2. Application done to review job description from lecturing staff to
training coordinators (at least level 9).
3. Organisational development investigation pending.
Sub-Programme 7.2: Further Education and Training
Strategic objective performance indicator
Indicator title Number of participants trained in Further Education and Training
programmes
Short definition Total number of learners completing non-accredited and accredited skills
training programmes Learners may include farmers, farm workers, youth and
all interested in agriculture.
Purpose/importance To indicate the number of persons within the sector who have improved
their skills.
Source/collection of data Skills audit report OR Training Needs Analysis (TNA) Report OR Approved
project list OR Learner records
Method of calculation Simple count
Data limitations Dependent on the accuracy and validity of information instruments (E.g.
Completion of registration forms, ID documents etc.)
Type of indicator Output
Calculation type Cumulative
Reporting cycle Quarterly
New indicator Significantly Changed
Desired performance Higher performance is desired
Indicator responsibility Sub-programme manager
Evidence Attendance registers OR Certificates of attendance OR Training Report
Key risk Risk 1
Limited basket of FET learning offerings may result in fewer industry-driven
training programmes.
Mitigation Risk 1
Marketing of training programmes/modules available
Regular training needs assessments
Outsourcing of training where internal capacity may not be able to
address the need.

Page 216 of 227
Forming strategic partnerships with industry bodies
Sector specific indicators
Indicator title Number of participants trained in Further Education and Training
programmes
Short definition Total number of learners completing non-accredited and accredited skills
training programmes Learners may include farmers, farm-aids, extension
officers etc.
Purpose/importance
To indicate the number of persons within the sector who have improved their
skills.
Source/collection of data Skills audit report OR Training Needs Analysis (TNA) Report OR Approved
project list OR Learner records
Method of calculation Simple count
Data limitations
Dependent on the accuracy and validity of information instruments (E.g.
Completion of registration forms, ID documents etc.)
Type of indicator Output
Calculation type Cumulative
Reporting cycle Quarterly
New indicator Significantly Changed
Desired performance Higher performance is desired
Indicator responsibility Sub-programme manager
Evidence Attendance registers OR Certificates of attendance OR Training Report
Key risk Risk 1
Limited basket of FET learning offerings may result in fewer industry-driven
training programmes.
Mitigation Risk 1
Marketing of training programmes/modules available
Regular training needs assessments
Outsourcing of training where internal capacity may not be able to
address the need.
Forming strategic partnerships with industry bodies
Provincial specific indicators
Indicator title Number of learners enrolled in learnership programmes
Short definition Total number of learners enrolled on accredited learnership programmes
Purpose/importance
To indicate the number of persons within the sector who have improved their
skills.
Source/collection of data Learner records or number of registration forms or formal application forms
or Learnership contract
Method of calculation Simple Count
Data limitations
Issuing of student cards and or certificates issued by external body at end of
programme
Type of indicator Output
Calculation type Non-Cumulative
Reporting cycle Annually
New indicator No
Desired performance Higher performance is desired
Indicator responsibility Sub-Programme Manager
Evidence Letters of acceptance on the learnership programme
Key risk
Large quantity of learnership applications and limited budget to
accommodate need; this will be mitigated by lobbying for additional funds
from AgriSETA

Page 217 of 227
Indicator title Number of learners completing learnership programmes
Short definition Total number of learners declared competent in accredited formal skills
programmes aligned to unit standards and outcomes e.g. learnerships;
accredited short skills modules; Learners include farmers, farm-aids,
extension officers, etc.
Purpose/importance To indicate the number of persons within the sector who have improved
their skills.
Source/collection of data Learner records OR Training Needs Assessment OR Formal Application OR
Learnership contract
Method of calculation Simple Count
Data limitations Certificates issued by external body
Type of indicator Output
Calculation type Non-Cumulative
Reporting cycle Annually
New indicator No
Desired performance Higher performance is desired
Indicator responsibility Sub-programme manager
Evidence Certificates of competence OR Portfolio of evidence OR Student database
Key risk Accreditation and Quality Assurance; the root cause is the lack of a
properly staff quality management unit and to mitigate this risk, greater
emphasis being placed on internal evaluation systems and processes.
Indicator title Articulation / RPL of FET learners to HET
Short definition Number of learners gaining access to higher education
Purpose/importance
To indicate the number of persons within the sector who have gained
access to higher education through an articulation process
Source/collection of data Applications received from learners to be articulated
Method of calculation Simple Count
Data limitations None
Type of indicator Output
Calculation type Non-Cumulative
Reporting cycle Annually
New indicator No
Desired performance Higher performance is desired
Indicator responsibility Sub-Programme Manager
Evidence
Letters of acceptance to higher education programme or Minutes of
Articulation Committee Meeting
Key risk
Limited number of learners can be articulated due to financial constraints
and or entry requirements for different programmes; risks mitigated through
on-going support in terms of Maths & Science subjects, as well as lobbying
for additional funding sources.
Programme 8: Rural Development
Sub-programme 8.1: Rural Development Planning
Strategic objective performance indicator
Indicator Title Number of rural nodes where coordination of socio- economic development is
facilitated through the implementation of the Comprehensive Rural
Development Programme
Short definition The phased process that includes the formation of an Interdepartmental
Steering Committee in collaboration with the Municipality, DRDLR and
various government departments to facilitate social up-liftment,
infrastructure development and economic development is operational.
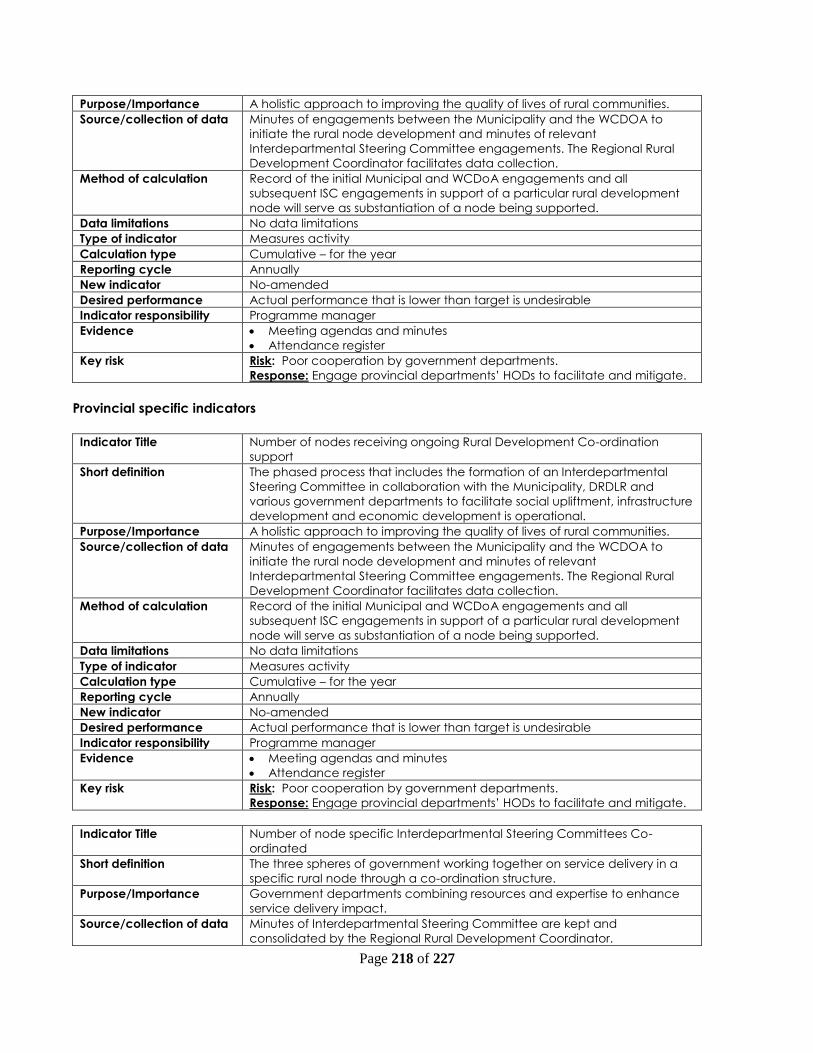
Page 218 of 227
Purpose/Importance A holistic approach to improving the quality of lives of rural communities.
Source/collection of data Minutes of engagements between the Municipality and the WCDOA to
initiate the rural node development and minutes of relevant
Interdepartmental Steering Committee engagements. The Regional Rural
Development Coordinator facilitates data collection.
Method of calculation Record of the initial Municipal and WCDoA engagements and all
subsequent ISC engagements in support of a particular rural development
node will serve as substantiation of a node being supported.
Data limitations No data limitations
Type of indicator Measures activity
Calculation type Cumulative – for the year
Reporting cycle Annually
New indicator No-amended
Desired performance Actual performance that is lower than target is undesirable
Indicator responsibility Programme manager
Evidence
Meeting agendas and minutes
Attendance register
Key risk Risk: Poor cooperation by government departments.
Response: Engage provincial departments’ HODs to facilitate and mitigate.
Provincial specific indicators
Indicator Title Number of nodes receiving ongoing Rural Development Co-ordination
support
Short definition The phased process that includes the formation of an Interdepartmental
Steering Committee in collaboration with the Municipality, DRDLR and
various government departments to facilitate social upliftment, infrastructure
development and economic development is operational.
Purpose/Importance A holistic approach to improving the quality of lives of rural communities.
Source/collection of data Minutes of engagements between the Municipality and the WCDOA to
initiate the rural node development and minutes of relevant
Interdepartmental Steering Committee engagements. The Regional Rural
Development Coordinator facilitates data collection.
Method of calculation Record of the initial Municipal and WCDoA engagements and all
subsequent ISC engagements in support of a particular rural development
node will serve as substantiation of a node being supported.
Data limitations No data limitations
Type of indicator Measures activity
Calculation type Cumulative – for the year
Reporting cycle Annually
New indicator No-amended
Desired performance Actual performance that is lower than target is undesirable
Indicator responsibility Programme manager
Evidence
Meeting agendas and minutes
Attendance register
Key risk Risk: Poor cooperation by government departments.
Response: Engage provincial departments’ HODs to facilitate and mitigate.
Indicator Title Number of node specific Interdepartmental Steering Committees Co-
ordinated
Short definition The three spheres of government working together on service delivery in a
specific rural node through a co-ordination structure.
Purpose/Importance Government departments combining resources and expertise to enhance
service delivery impact.
Source/collection of data Minutes of Interdepartmental Steering Committee are kept and
consolidated by the Regional Rural Development Coordinator.

Page 219 of 227
Method of calculation Interdepartmental Steering Committees’ minutes pertaining to a specific
rural development node will serve as substantiation of coordination.
Data limitations No data limitations
Type of indicator Measures activity
Calculation type Cumulative – for the year
Reporting cycle Annually
New indicator No
Desired performance Actual performance that is lower than target is undesirable
Indicator responsibility Programme manager
Evidence
ISC meeting agenda and minutes
Attendance register
Key risk Risk: The availability of personnel from all spheres of government.
Response: Host meetings with relevant Heads of Departments explaining the
goal, importance and benefits of involvement and cooperation in the
process.
Indicator Title Number of Rural Development Provincial Work Group engagements
coordinated for the Province
Short definition High level coordination of provincial government activities as well as
policy changes to create development opportunities in rural areas.
Purpose/Importance Coordinated government activities to improve service delivery impact.
Source/collection of data Minutes are kept and consolidated by the Personal Assistant of the Chief
Director: Rural Development Coordination
Method of calculation The minutes of Provincial Rural Development Work Group meetings are
counted.
Data limitations No data limitations
Type of indicator Measures activity
Calculation type Cumulative – for the year
Reporting cycle Quarterly
New indicator No
Desired performance Actual performance that is lower than target is undesirable
Indicator responsibility Programme manager
Evidence
Minutes of the meeting
Attendance register
Key risk Risk: The participation and attendance of personnel from all spheres of
government.
Response: Host meetings with relevant HoDs explaining the goal,
importance and benefits of involvement and cooperation in the process.
Indicator Title Number of Interdepartmental Steering Committee engagements co-
ordinated
Short definition District level coordination of government, Council of Stakeholder and other
relevant stakeholder activities within each rural node to create socio-
economic development opportunities the applicable nodal areas.
Purpose/Importance Coordinated and share information between stakeholders on projects and
activities in the nodal area to improve service delivery impact.
Source/collection of data Minutes are kept and consolidated by the Sub-programme: Development
Planning administrative staff based on discussions signed off by the
Programme Manager.
Method of calculation The minutes of Interdepartmental Steering Committee meetings are
counted.
Data limitations No data limitations
Type of indicator Measures activity
Calculation type Cumulative – for the year
Reporting cycle Quarterly
New indicator Yes

Page 220 of 227
Desired performance Actual performance that is lower than target is undesirable
Indicator responsibility Programme manager
Evidence
Signed minutes of the meeting
Attendance register
Key risk Risk: The participation and attendance of personnel from all spheres of
government.
Response: Host meetings with relevant HoDs explaining the goal, importance
and benefits of involvement and cooperation in the process.
Sub-programme 8.2: Social Facilitation
Strategic objective performance indicator
Indicator Title Number of Councils of Stakeholders supported through the implementation
and coordination of the Comprehensive Rural Development Programmes
in selected rural development nodes.
Short definition Councils of Stakeholders institutionalised and participating in CRDP
engagements.
Purpose/Importance To ensure rural development node community involvement in CRDP
processes.
Source/collection of data Minutes of ISC and other CRDP engagements (with WCDoA and DRDLR)
and attendance registers indicating CoS participation in CRDP processes.
Method of calculation CoS captured being involved in CRDP processes by way of minutes and
agenda will be counted
Data limitations No data limitations
Type of indicator Output
Calculation type Cumulative for the year
Reporting cycle Annually
New indicator No- amended
Desired performance The indicator is monitoring targets as set out in the business plan
Indicator responsibility Programme manager
Evidence ISC minutes including CoS reports and attendance registers
List of Executive Members of CoS with signed constitution.
Key risk CoS may become defunct due to internal issues or political interference
which could limit involvement in CRDP processes.
Provincial specific indicators
Indicator Title Number of Councils of Stakeholders supported
Short definition A well-structured community organisation representing all stakeholder
groups proactively driving socio-economic development in their
communities with co-ordination support from WCDoA.
Purpose/Importance Rural communities taking ownership of socio-economic development in
partnership with government.
Source/collection of data Minutes of ISC engagements which include Council of Stakeholder (COS)
progress reports.
Method of calculation The ISC minutes including the CoS reports on progress and support for
development in a particular node will substantiate support provided to CoSs.
Data limitations No data limitations
Type of indicator Measures activity
Calculation type Cumulative – for the year
Reporting cycle Annually
New indicator No
Desired performance Actual performance that is lower than target is undesirable
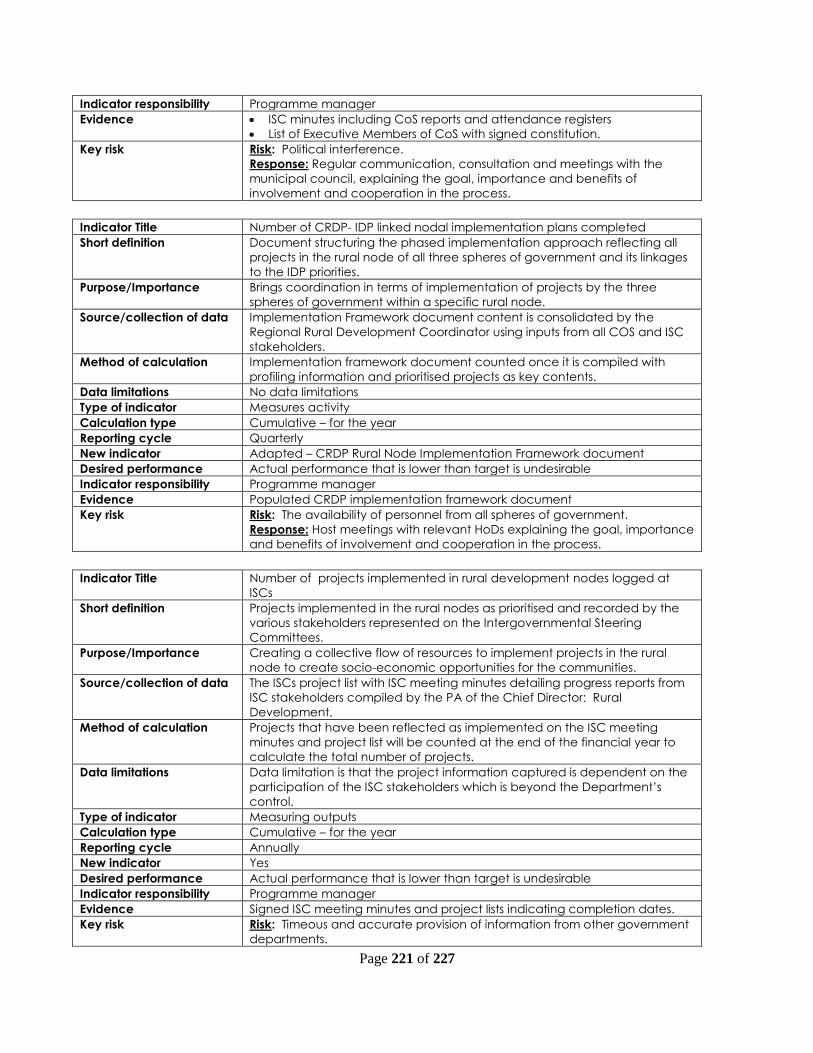
Page 221 of 227
Indicator responsibility Programme manager
Evidence
ISC minutes including CoS reports and attendance registers
List of Executive Members of CoS with signed constitution.
Key risk Risk: Political interference.
Response: Regular communication, consultation and meetings with the
municipal council, explaining the goal, importance and benefits of
involvement and cooperation in the process.
Indicator Title Number of CRDP- IDP linked nodal implementation plans completed
Short definition Document structuring the phased implementation approach reflecting all
projects in the rural node of all three spheres of government and its linkages
to the IDP priorities.
Purpose/Importance Brings coordination in terms of implementation of projects by the three
spheres of government within a specific rural node.
Source/collection of data Implementation Framework document content is consolidated by the
Regional Rural Development Coordinator using inputs from all COS and ISC
stakeholders.
Method of calculation Implementation framework document counted once it is compiled with
profiling information and prioritised projects as key contents.
Data limitations No data limitations
Type of indicator Measures activity
Calculation type Cumulative – for the year
Reporting cycle Quarterly
New indicator Adapted – CRDP Rural Node Implementation Framework document
Desired performance Actual performance that is lower than target is undesirable
Indicator responsibility Programme manager
Evidence Populated CRDP implementation framework document
Key risk Risk: The availability of personnel from all spheres of government.
Response: Host meetings with relevant HoDs explaining the goal, importance
and benefits of involvement and cooperation in the process.
Indicator Title Number of projects implemented in rural development nodes logged at
ISCs
Short definition Projects implemented in the rural nodes as prioritised and recorded by the
various stakeholders represented on the Intergovernmental Steering
Committees.
Purpose/Importance Creating a collective flow of resources to implement projects in the rural
node to create socio-economic opportunities for the communities.
Source/collection of data The ISCs project list with ISC meeting minutes detailing progress reports from
ISC stakeholders compiled by the PA of the Chief Director: Rural
Development.
Method of calculation Projects that have been reflected as implemented on the ISC meeting
minutes and project list will be counted at the end of the financial year to
calculate the total number of projects.
Data limitations Data limitation is that the project information captured is dependent on the
participation of the ISC stakeholders which is beyond the Department’s
control.
Type of indicator Measuring outputs
Calculation type Cumulative – for the year
Reporting cycle Annually
New indicator Yes
Desired performance Actual performance that is lower than target is undesirable
Indicator responsibility Programme manager
Evidence Signed ISC meeting minutes and project lists indicating completion dates.
Key risk Risk: Timeous and accurate provision of information from other government
departments.

Page 222 of 227
Response: Host meetings with relevant HoDs explaining the goal, importance
and benefits of involvement and cooperation in the process
Indicator Title Number of people trained in rural development nodes
Short definition Skills development for individuals in rural communities.
Purpose/Importance Improving life skills and increasing employment potential of individuals in
rural communities.
Source/collection of data Data collected by the Regional Rural Development Coordinator from all
government departments participating in CRDP process
Method of calculation Individuals that participated in training programmes initiated by the CRDP
process are counted as persons (people) trained.
Data limitations Data limitation is that training figures are dependent on the figures provided
by local government, provincial government departments and national
departments participating in the Comprehensive Rural Development
Programme.
Type of indicator Measuring outputs
Calculation type Cumulative – for the year
Reporting cycle Quarterly
New indicator No
Desired performance Actual performance that is lower than target is undesirable
Indicator responsibility Programme manager
Evidence
Training programmes’ outline
Attendance registers as received from the various government
departments involved.
Key risk Risk: Timeous and accurate provision of information from other government
departments.
Response: Host meetings with relevant Heads of Departments explaining the
goal, importance and benefits of involvement and cooperation in the
process
Sub-programme 8.3: Farm Worker Development
Strategic objective performance indicator
Indicator Title Number of farm workers and their family members benefitting from
training and development initiatives in the Province
Short definition Farm workers and their family members trained in different life skills and
development programmes during the reporting period
Purpose/Importance To empower farm workers and their family members through training in
different skills
Source/collection of data Number of farm workers and their family members trained via different
projects within the Western Cape
Method of calculation Each farm worker/family member that receives training has to complete
an attendance register/entry forms
Data limitations In some cases service providers will train more farm workers/family
members than indicated in the business plan
Type of indicator Output
Calculation type Cumulative for the year
Reporting cycle Quarterly
New indicator No
Desired performance The indicator is monitoring targets as set out in the business plan
Indicator responsibility Programme manager
Evidence Training programmes’ outline
Key risk Attendance registers of skills training and development programmes.

Page 223 of 227
Provincial specific indicators
Indicator Title Number of farm workers and their family members included in life skills
training and development programmes
Short definition Farm workers and their family members trained in life skills and
development programmes during the reporting period
Purpose/Importance To empower farm workers and their family members through training in
different life skills and development programmes
Source/collection of data Number of farm workers and their family members trained via different
projects within the Western Cape. Target relates to the number of
beneficiaries as indicated by the organisations in their respective business
plans submitted to the Department. The total equals the sum of the
particular projects as included in the proposed FWD Consolidated Project
Business Plan compiled by the FWD Project Evaluation Committee (PEC) to
be approved by the Departmental Project Allocation Committee (DPAC).
Method of calculation Each farm worker/family member that receives training has to complete
an attendance register
Data limitations In some cases service providers will train more farm workers and their
family members than indicated in the business plan
Type of indicator Output
Calculation type Cumulative for the year
Reporting cycle Quarterly
New indicator No
Desired performance The indicator is monitoring targets as set out in the business plan
Indicator responsibility Programme manager
Evidence
Training programmes’ outline
Attendance registers of skills training and development programmes.
Key risk Risk: The number of farm workers and their family members to be trained
as included in the business plans received from service providers are not
always accurate as the roll out of training can be affected by many
factors e.g. the number of seasonal workers, the weather and farming
activities e.g. harvesting etc.
Response: To target specific regions in the off-season.
Indicator Title Number of farm worker development projects funded
Short definition Financial aid to service providers rendering services by means of skill
development and training to farm workers and their family members in
the Western Cape.
Purpose/Importance To contribute to social upliftment of farm workers and their family
members in a holistic way
Source/collection of data Number of approved projects as included in the FWD Consolidated
Project Business Plans as well as Donations to be made to Non-Profit
Organisations for farm worker related matters.
Method of calculation Number of project files
Data limitations During harvesting it is very difficult to provide training for farm workers
Type of indicator Output
Calculation type Cumulative for the year
Reporting cycle Annually
New indicator No
Desired performance Assist farm workers and their family members of the Western Cape
through different training and skill development projects
Indicator responsibility Programme manager
Evidence Transfer Payments:

Page 224 of 227
o DPAC submission,
o HOD submission,
o MoA, and
o Proof of Payment
Donations:
o HOD submission
o Proof of Payment
Key risk Risk: Budget constraints and cuts limit the sub-programme’s ability in
terms of the number of projects that can be funded and hence has an
influence on the impact that can be made on the farm workers and their
family members as the target group.
Response: To continue to illustrate the value and benefits of these
projects on farm workers and their family members to government as well
as the private sector and thereby attempt to solicit more funding and
sponsorships.
Indicator Title Number of farm worker development related municipal engagements
Short definition Establish better working relationships with the different municipalities and to
assist where necessary with projects related to farm workers (e.g. the farm
worker survey) that form part of their Integrated Development Plan (IDP)
Purpose/Importance Engage and attend meetings of/with the different municipalities
Source/collection of data Number of municipal meetings attended or engaged in
Method of calculation Attendance registers
Data limitations Cancellation of meetings on short notice
Type of indicator Output
Calculation type Cumulative for the year
Reporting cycle Quarterly
New indicator Yes
Desired performance The indicator is a monitoring target as set out in the Programme’s business
plan
Indicator responsibility Programme manager
Evidence
Agendas,
Minutes and
Attendance Registers of meetings/engagements attended
Key risk Risk: The sub-programme links into existing structures at local government
and are not in control of the actual hosting of the meetings e.g. often
meetings are cancelled at short notice.
Response: To engage regularly with the local government structures in this
regard to ensure that farm worker development issues remain high on their
agenda.
Indicator Title Number of inter-departmental steering committees (ISC) meeting
participated in
Short definition Holistically improving the quality of life of communities living in rural areas
through a coordinated development approach between all three spheres
of government, rural communities and the private sector.
Purpose/Importance To align and assist with the social needs within the CRDP rural nodes
Source/collection of data Agendas,
Minutes and
Attendance Registers of meetings/engagements attended
Method of calculation Number of meetings attended
Data limitations Cancellation of meetings on short notice
Type of indicator Output
Calculation type Cumulative for the year
Reporting cycle Quarterly
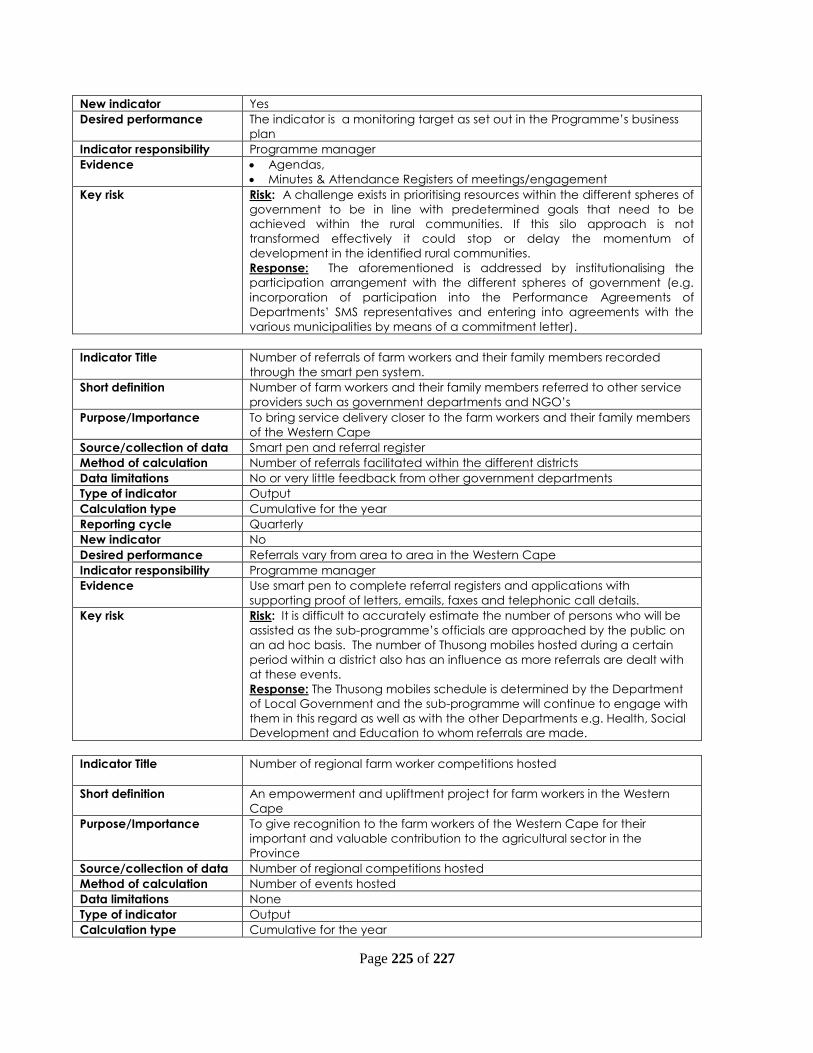
Page 225 of 227
New indicator Yes
Desired performance The indicator is a monitoring target as set out in the Programme’s business
plan
Indicator responsibility Programme manager
Evidence
Agendas,
Minutes & Attendance Registers of meetings/engagement
Key risk Risk: A challenge exists in prioritising resources within the different spheres of
government to be in line with predetermined goals that need to be
achieved within the rural communities. If this silo approach is not
transformed effectively it could stop or delay the momentum of
development in the identified rural communities.
Response: The aforementioned is addressed by institutionalising the
participation arrangement with the different spheres of government (e.g.
incorporation of participation into the Performance Agreements of
Departments’ SMS representatives and entering into agreements with the
various municipalities by means of a commitment letter).
Indicator Title Number of referrals of farm workers and their family members recorded
through the smart pen system.
Short definition Number of farm workers and their family members referred to other service
providers such as government departments and NGO’s
Purpose/Importance To bring service delivery closer to the farm workers and their family members
of the Western Cape
Source/collection of data Smart pen and referral register
Method of calculation Number of referrals facilitated within the different districts
Data limitations No or very little feedback from other government departments
Type of indicator Output
Calculation type Cumulative for the year
Reporting cycle Quarterly
New indicator No
Desired performance Referrals vary from area to area in the Western Cape
Indicator responsibility Programme manager
Evidence
Use smart pen to complete referral registers and applications with
supporting proof of letters, emails, faxes and telephonic call details.
Key risk Risk: It is difficult to accurately estimate the number of persons who will be
assisted as the sub-programme’s officials are approached by the public on
an ad hoc basis. The number of Thusong mobiles hosted during a certain
period within a district also has an influence as more referrals are dealt with
at these events.
Response: The Thusong mobiles schedule is determined by the Department
of Local Government and the sub-programme will continue to engage with
them in this regard as well as with the other Departments e.g. Health, Social
Development and Education to whom referrals are made.
Indicator Title Number of regional farm worker competitions hosted
Short definition An empowerment and upliftment project for farm workers in the Western
Cape
Purpose/Importance To give recognition to the farm workers of the Western Cape for their
important and valuable contribution to the agricultural sector in the
Province
Source/collection of data Number of regional competitions hosted
Method of calculation Number of events hosted
Data limitations None
Type of indicator Output
Calculation type Cumulative for the year

Page 226 of 227
Reporting cycle Quarterly
New indicator No
Desired performance Reach desired performance annually
Indicator responsibility Programme manager
Evidence
Invitation,
Programme and
Photographs
Key risk Risk: The willingness of farm owners to allow their farm workers to participate
in the competition may have an impact on the participation within districts.
The uncertainty of continued sponsorship for the competition.
Response: Constant communication through farmers associations to
highlight the value of the competition and the maintenance of excellent
cooperation with existing sponsors. Maintain positive relationship established
with current sponsors and explore additional opportunities as they arise.
Indicator Title Number of provincial farm worker competition engagements
Short definition An empowerment and upliftment project for farm workers in the Western
Cape
Purpose/Importance To give recognition to the farm workers of the Western Cape for their
important and valuable contribution to the agricultural sector in the
Province
Source/collection of data Number of provincial engagements i.e. the Final Adjudication and the Gala
Awards Ceremony Number of provincial engagements
Method of calculation Number of engagements hosted
Data limitations None
Type of indicator Output
Calculation type Cumulative for the year
Reporting cycle Annually
New indicator Yes
Desired performance Reach desired performance
Indicator responsibility Programme Manager
Key risk Risk: The willingness of farm owners to allow their farm workers to participate
in the competition may have an impact on the participation of all districts.
The uncertainty of continued sponsorship for the competition.
Response: Constant communication through farmers associations to
highlight the value of the competition and the maintenance of excellent
cooperation with existing sponsors. Maintain positive relationship established
with current sponsors and explore additional sponsorship opportunities as
they arise.
Indicator Title Number of district farm worker surveys completed
Short definition Compile a complete database of farm workers in the Western Cape
Purpose/Importance To compile accurate data on farm workers in the Western Cape in terms of
their needs in order to ensure that resources are aligned appropriately.
Source/collection of data Fieldworkers hosting one-on-one interviews with the farm workers
Method of calculation Fieldworkers completing a set questionnaire
Data limitations It is a very costly project and geographically it is a big challenge to
complete the database within the time frame.
Type of indicator Output
Calculation type Cumulative for the year
Reporting cycle Annually
New indicator No
Desired performance To ensure an accurate database of farm workers in the Western Cape
Indicator responsibility Programme manager
Page 227 of 227
Evidence
Monthly Progress Reports as received from the Service Provider.
A letter from the Service Provider confirming the completion of the survey
within a particular district;
Active database accessible to stakeholders including Department of
Social Services, Education etc.
Key risk
Risk: Access to farm workers and budget constraints hamper the swift roll
out of the project and the compilation of a database for the Province as a
whole.
Response: To maintain strong relations with farmers associations and
organised agriculture to assist to speed up the process of access to farm
workers and to lobby for additional funds to roll the survey out to more
regions.


