PADA TAHUN 2016 -...
103
-
Upload
vuongxuyen -
Category
Documents
-
view
217 -
download
0
Transcript of PADA TAHUN 2016 -...
DIREKTORAT INVENTARISASI GRK DAN MPVDIREKTORAT JENDERAL PENGENDALIAN PERUBAHAN IKLIM
KEMENTERIAN LINGKUNGAN HIDUP DAN KEHUTANAN2018
PROSES TECHNICAL ASSESSMENT
FOREST REFERENCE EMISSION LEVEL INDONESIA
PADA TAHUN 2016
PROSES TECHNICAL ASSESSMENT FOREST REFERENCE EMISSION LEVEL INDONESIA PERTAMA
PADA TAHUN 2016
Penanggungjawab:
Dr. Ir. Joko Prihatno, M.M
Penyunting:
1. Dr. Ir Belinda Arunarwati Margono, M.Sc
2. Dr. Solichin Manuri
3. Dr. Wawan Gunawan, S.Hut., M.Si
Penyusun:
1. Gamma Nur Merrillia Sularso, S.Hut, M.Si
2. Lolita Ratnasari, S.Hut
ISBN: 978-602-73066-6-0
Hak Cipta dilindungi Undang-Undang
© Dilarang menggunakan isi maupun memperbanyak buku ini sebagian atau seluruhnya baik dalam bentuk fotocopy, cetak, microfilm, elektronik maupun bentuk lainnya, kecuali untuk keperluan pendidikan atau non-komersial lainnya dengan mencantumkan sumber sebagai berikut:
Direktorat Inventarisasi Gas Rumah Kaca dan Monitoring, Pelaporan, dan Verifikasi (2018). “Proses Technical Assessment Forest Reference Emission Level Pertama pada Tahun 2016”. Kementerian Lingkungan Hidup dan Kehutanan, 2018.
Diterbitkan oleh:
Direktorat Inventarisasi GRK dan MPV Direktorat Jenderal Pengendalian Perubahan IklimKementerian Lingkungan Hidup dan Kehutanan
Gd. Manggala Wanabakti Blok IV Lantai 6 Wing AJl. Jend. Gatot Subroto, Senayan – Jakarta Pusat, DKI Jakarta 10270, Indonesia
Telp/Fax : 021 57903073Email: [email protected]
Website: http://www.ditjenppi.menlhk.go.id
Dicetak dengan Anggaran DIPA Direktorat Inventarisasi GRK dan MPV Tahun Anggaran 2018
i
KATA PENGANTAR
Indonesia telah secara aktif berpartisipasi dalam negosiasi
internasional terkait REDD+ sejak COP 13 di Bali pada tahun
2017 dan sejak saat itu telah membangun infrastruktur dan
perangkat REDD+. Salah satu perangkat REDD+ yang menjadi
tingkat rujukan emisi hutan dalam penentuan pembayaran
berbasis kinerja adalah tingkat rujukan emisi hutan atau forest
reference emission level (FREL). Pembangunan FREL telah
dilakukan sejak tahun 2010 oleh tiga instansi (antara lain
Kementerian Lingkungan Hidup, Badan Pengelola REDD+, dan
Kementerian Kehutanan). Namun dengan terbentuknya Kementerian Lingkungan Hidup
dan Kehutanan khususnya peleburan 4 instansi (KLH, Kemenhut, BPREDD+ dan
DNPI) yang mengelola isu perubahan iklim menjadi Direktorat Jenderal Pengendalian
Perubahan Iklim maka pembangunan FREL dilanjutkan dan diselesaikan pada tahun
2015. FREL Pertama Indonesia telah di-submit ke UNFCCC pada COP 21 di Paris.
Sebagai bagian dari prasyarat result based payment (RBP) maka FREL negara
pihak yang telah disubmit selanjutnya dinilai secara teknis dalam proses Technical
Assessment FREL yang dilakukan oleh Sekretariat UNFCCC. Indonesia melaksanakan
proses tersebut pada tahun 2016 dan telah berhasil menyelesaikan proses tersebut
secara tepat waktu. Dengan telah selesainya proses technical assessment FREL,
menandakan bahwa Indonesia telah siap menggunakan FREL nya sebagai acuan untuk
mengukur kinerja di sektor kehutanan khususnya aksi mitigasi penurunan emisi dalam
skema REDD+.
Proses TA FREL Indonesia ini penting didokumentasikan untuk meng-
komunikasikan proses panjang REDD+ Indonesia baik pada khalayak umum,
akademisi, maupun para pengambil kebijakan. Serta sebagai dokumentasi
perjalanan REDD+ Indonesia yang dapat berperan penting untuk pembelajaran,
peningkatan kapasitas, serta menjadi acuan bagi pembangunan FREL selanjutnya
dan implementasi penuh REDD+ di Indonesia.
ii
Ucapan terima kasih kami sampaikan kepada berbagai pihak yang berkontribusi
dalam proses technical assessment FREL pada tahun 2016 dan dalam proses
penyusunan buku ini khususnya yang tergabung dalam Tim Technical Assessment FREL
Indonesia, para akademisi dan para pengambil kebijakan yang turut serta berkontribusi
dalam pelaksanaan REDD+.
Jakarta, Desember 2018
Direktur Inventarisasi GRK dan MPV
Dr. Ir. Joko Prihatno, M.M
iii
DAFTAR ISI
KATA PENGANTAR i
DAFTAR ISI iii
DAFTAR TABEL iv
DAFTAR GAMBAR v
DAFTAR LAMPIRAN vi
I. PENDAHULUAN 1
A. Latar Belakang 1
B. Tujuan 4
C. Sasaran 4
II. TECHNICAL ASSESSMENT FREL DALAM PERKEMBANGAN
NEGOSIASI DI COP UNFCCC 5
III. PELAKSANAAN TECHNICAL ASSESSMENT FREL INDONESIA 8
IV. PENUTUP 19
iv
DAFTAR TABEL
Tabel 1. Matriks tata waktu pelaksanaan technical assessment (TA) FREL
Indonesia 10
Tabel 2. Pengelompokan pertanyaan selama proses TA FREL Indonesia pada
tahun 2016 15
Tabel 3. Matriks perbandingan hasil TA Penilaian Awal dengan hasil TA
Penilaian Akhir/Final 16
v
DAFTAR GAMBAR
Gambar 1. REDD+ Building Blocks and Guiding Implementation 7
Gambar 2. Tata waktu proses persiapan untuk RBP REDD+ 20
vi
DAFTAR LAMPIRAN
Lampiran 1. Penetapan Tim Technical Assistance Untuk Technical Assessment
of Forest Reference Emission Level di Indonesia 25
Lampiran 2. Rangkuman Pertanyaan dan Jawaban selama Proses Technical
Assessment FREL – Preliminary Technical Questions 34
Lampiran 3. Matriks Draft Laporan Technical Assessment (TA) Penilaian Awal
dan Respon Indonesia 57
Lampiran 4. Report on the technical assessment of the proposed forest
reference emission level of Indonesia submitted in 2016 74
1
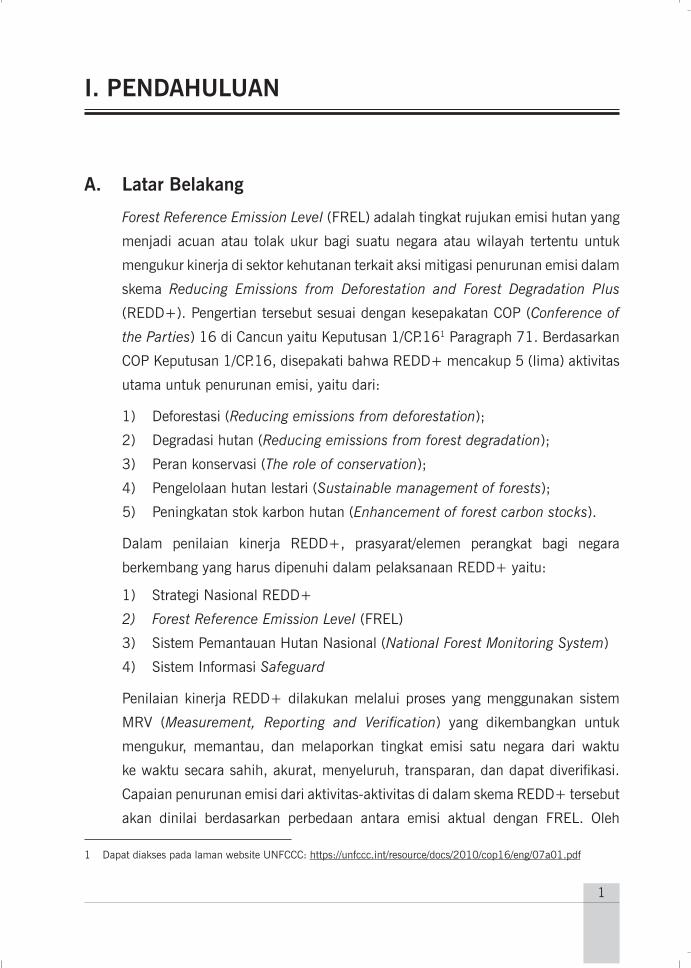
I. PENDAHULUAN
A. Latar Belakang
Forest Reference Emission Level (FREL) adalah tingkat rujukan emisi hutan yang
menjadi acuan atau tolak ukur bagi suatu negara atau wilayah tertentu untuk
mengukur kinerja di sektor kehutanan terkait aksi mitigasi penurunan emisi dalam
skema Reducing Emissions from Deforestation and Forest Degradation Plus
(REDD+). Pengertian tersebut sesuai dengan kesepakatan COP (Conference of
the Parties) 16 di Cancun yaitu Keputusan 1/CP.161 Paragraph 71. Berdasarkan
COP Keputusan 1/CP.16, disepakati bahwa REDD+ mencakup 5 (lima) aktivitas
utama untuk penurunan emisi, yaitu dari:
1) Deforestasi (Reducing emissions from deforestation);
2) Degradasi hutan (Reducing emissions from forest degradation);
3) Peran konservasi (The role of conservation);
4) Pengelolaan hutan lestari (Sustainable management of forests);
5) Peningkatan stok karbon hutan (Enhancement of forest carbon stocks).
Dalam penilaian kinerja REDD+, prasyarat/elemen perangkat bagi negara
berkembang yang harus dipenuhi dalam pelaksanaan REDD+ yaitu:
1) Strategi Nasional REDD+
2) Forest Reference Emission Level (FREL)
3) Sistem Pemantauan Hutan Nasional (National Forest Monitoring System)
4) Sistem Informasi Safeguard
Penilaian kinerja REDD+ dilakukan melalui proses yang menggunakan sistem
MRV (Measurement, Reporting and Verification) yang dikembangkan untuk
mengukur, memantau, dan melaporkan tingkat emisi satu negara dari waktu
ke waktu secara sahih, akurat, menyeluruh, transparan, dan dapat diverifikasi.
Capaian penurunan emisi dari aktivitas-aktivitas di dalam skema REDD+ tersebut
akan dinilai berdasarkan perbedaan antara emisi aktual dengan FREL. Oleh
1 Dapat diakses pada laman website UNFCCC: https://unfccc.int/resource/docs/2010/cop16/eng/07a01.pdf
2
karena itu, FREL berperan penting dalam penilaian kinerja REDD+, khususnya
dalam rangka untuk memperoleh pembayaran berbasis kinerja (result based
payment-RBP).
Selanjutnya dalam Keputusan 9/CP.192, negara berkembang yang siap untuk
melaksanakan kegiatan pembayaran REDD+ berbasis kinerja untuk mengajukan
FREL-nya kepada Sekretariat United Nations Framework Convention on Climate
Change (UNFCCC) serta mengajukan untuk mempublikasikan ke dalam REDD+
Web Platform yang merupakan information hub yang telah dibangun untuk
REDD+.
Penyusunan FREL di Indonesia telah melalui beberapa tahapan proses dalam
berbagai tingkat baik dalam skala nasional, sub-nasional, proyek hingga tapak.
Pada tingkat nasional, FREL diinisiasi oleh tiga kementerian dan lembaga yaitu
Kementerian Kehutanan, Kementerian Lingkungan Hidup, dan BPREDD+ yang
telah berlangsung sejak tahun 2010 hingga 2015. Pada tahun 2015, ketiga
institusi ini beserta DNPI dilebur menjadi satu institusi yaitu Kementerian
Lingkungan Hidup dan Kehutanan (KLHK). Dalam mandat KLHK pada Peraturan
Presiden No. 16/20153 yang selanjutnya dioperasionalisasikan dalam Peraturan
Menteri LHK No. 18/20153, bidang perubahan iklim dalam skala nasional
dikoordinasikan oleh Direktorat Jenderal Pengendalian Perubahan Iklim. Karena
itu, pada periode 2015 hingga saat ini, penyelesaian pengembangan dokumen
FREL dilanjutkan oleh KLHK.
Direktorat Jenderal Pengendalian Perubahan Iklim KLHK selanjutnya
mengkoordinasikan proses penyusunan FREL dengan partisipasi dari pakar dan
institusi lintas sektor yang tergabung dalam tim penyusunan FREL yang ditetapkan
melalui Peraturan Menteri LHK No. 134/2015. Tim FREL terdiri atas 2 grup
yang berfokus pada aspek kebijakan dan aspek teknis. Tim kebijakan membahas
isu-isu kunci dalam pembangunan FREL, termasuk mempertimbangkan
kebijakan dan kepentingan nasional. Tim teknis menganalisa implikasi
kebijakan dalam penghitungan kuantitatif dan penjelasan kualitatif termasuk
2 Dapat diakses pada laman website UNFCCC: https://unfccc.int/resource/docs/2013/cop19/eng/10a01.pdf
3 Dapat diakses pada laman website Kementeriang Lingkungan Hidup dan Kehutanan: http://www.menlhk.go.id/berita-84-kumpulan-peraturan-menteri-lingkungan-hidup-dan-kehutanan-tahun-2015.html
3
pembangunan dan penyepakatan asumsi dan penyesuaian yang diperlukan serta
memastikan membangun FREL telah memenuhi kaidah ilmiah. Setelah melalui
penyempurnaan, Indonesia mengajukan National Forest Reference Emission
Level (FREL)4 pada Desember 2015 di COP 21 Paris. Pengajuan FREL dilakukan
oleh KLHK melalui Ditjen Pengendalian Perubahan Iklim (PPI) sebagai National
Focal Point (NFP) Indonesia untuk UNFCCC.
Data dan informasi yang digunakan dalam dokumen FREL harus memenuhi prinsip-
prinsip Transparan (Transparency), Akurat (Accuracy), Konsisten (Consistency)
terhadap panduan yang disepakati oleh COP, Lengkap (Completeness), dan
dapat dibandingkan (Comparability) atau yang dikenal dengan istilah TACCC.
Penyusunan FREL harus sesuai dengan Intergovernmental Panel on Climate
Change (IPCC) Guidelines atau acuan-acuan berbasis ilmiah. Untuk menjamin
bahwa dokumen FREL telah memenuhi prinsip TACCC sebagaimana dengan
Keputusan 13/CP.193 terkait pedoman dan prosedur untuk penilaian teknis
submisi FREL/FRL dari negara yang mengajukan, maka selanjutnya Indonesia
menjalani proses review atau Technical Assessment (TA) oleh Sekretariat
UNFCCC. Proses TA ini diperuntukkan untuk negara-negara berkembang yang
mengimplementasikan REDD+ dimana FREL sebagai baseline perlu dinilai
secara teknis terkait RBP.
Indonesia telah menjalani proses TA terhadap dokumen FREL selama 10 bulan
pada tahun 2016 dan lulus dengan dikeluarkannya laporan review technical
assessment oleh Sekretariat UNFCCC. Dengan demikian dokumen FREL secara
resmi menjadi tingkat acuan emisi untuk sektor kehutanan, dan menandai
dimulainya tahap implementasi REDD+ secara penuh di Indonesia. Proses dan
hasil TA FREL yang dijalani Indonesia dapat menjadi pembelajaran bagi pihak
lain baik negara berkembang maupun negara maju khususnya terkait bagaimana
data dan informasi baseline emisi sektor kehutanan dilaporkan secara transparan
dan akuntabel.
4 Dokumen FREL dimaksud bisa diunduh di website Ditjen PPI (http://ditjenppi.menlhk.go.id/berita-ppi/2655-ting-kat-emisi-rujukan-deforestasi-dan-degradasi-hutan-frel) ataupun website UNFCCC (http://redd.unfccc.int/sub-missions.html?country=idn).
4
B. Tujuan
Buku Proses Technical Assessment Forest Reference Emission Level Indonesia
ini disusun dengan dengan tujuan untuk:
1. Memberikan pembelajaran terkait proses dan hasil technical assessment
FREL Indonesia;
2. Mendokumentasikan proses pelaksanaan Technical Assessment FREL
Indonesia yang telah dilalui Indonesia pada tahun 2016.
C. Sasaran
Buku Proses Technical Assessment Forest Reference Emission Level I Indonesia
diperuntukkan bagi:
1. State actor: Kementerian dan Lembaga Pusat (Nasional)
2. Non-state actor: Pemerintah Daerah, Organisasi Non Profit, akademisi,
pihak swasta, dan masyarakat umum.
5
II. TECHNICAL ASSESSMENT FREL DALAM PERKEMBANGAN NEGOSIASI DI COP UNFCCC
Keputusan 12/CP.175 mengadopsi modalitas untuk membangun FREL dan FRL
serta mengundang negara-negara berkembang yang melaksanakan REDD+ untuk
mengajukan FREL /FRL, secara sukarela, ke Sekretariat UNFCCC sesuai dengan panduan
yang ada dalam Annex Keputusan 12/CP.17. Selain itu, salah satu badan dalam
UNFCCC yaitu Subsidiary Body for Scientific and Technological Advice (SBSTA) untuk
membangun panduan proses TA FREL dan/atau FRL setelah disubmit atau diupdate oleh
negara berkembang tersebut.
Pada COP 19 di Warsaw pada tahun 2013 diadopsi 7 keputusan untuk isu-isu
terkait REDD+ yang selanjutnya secara kolektif mengacu sebagai Warsaw Framework for
REDD+. Dalam satu set keputusan ini, khususnya dalam keputusan 13/CP.19 disusun
panduan dan prosedur TA untuk submisi FREL/ FRL dari negara-negara pihak. COP
memutuskan bahwa FREL / FRL dapat dilakukan penilaian teknis dalam konteks untuk
memperoleh result based payments. Dalam keputusan COP juga diatur bahwa Sekretariat
UNFCCC untuk menyiapkan laporan sintesis untuk proses TA FREL dan/atau FRL yang
disubmit oleh negara-negara berkembang untuk pertimbangan SBSTA setelah TA tahun
pertama. Laporan sintesis yang pertama berisi overview dari sesi TA yang dilaksanakan
pada tahun 2014 dan 2015. Sedangkan laporan sintesis kedua berisi overview dari sesi
TA yang dilaksanakan pada tahun 2016 dan 2017.
Pelaksanaan TA pertama kali dilakukan pada tahun 2014 dan 2015 didasarkan
oleh berbagai faktor yang dipertimbangkan seperti waktu yang diperlukan dari seluruh
proses technical review yang diorganisir dibawah Konvensi dan Kyoto Protocol pada tahun
yang ditetapkan, timing dari sesi negosiasi UNFCCC, ketersediaan pakar di bidang land
use, land-use change and forestry (LULUCF) dari UNFCCC roster of experts sepanjang
tahun dan kebutuhan penggalangan dana yang terus dilakukan untuk mendukung
pengorganisasian TA.
5 Dapat diakses pada laman website UNFCCC: https://unfccc.int/resource/docs/2011/cop17/eng/09a02.pdf
6
Technical assessment ini diadakan setiap tahun sesuai dengan watu pengajuan yang
dilakukan negara-negara pihak. Keseluruhan proses TA berlangsung selama 43 minggu,
termasuk pertemuan tahunan untuk sesi centralized technical assessment (CTA) selama
satu minggu yang diorganisir oleh Sekretariat UNFCCC. Sekretariat melakukan komunikasi
kepada semua negara yang terlibat melalui surat resmi baik yang berisi notifikasi awal
terkait tata waktu indikatif technical assessment, dengan mempertimbangkan kebutuhan
pelaporan dibawah Konvensi.
Technical assessment FREL pada periode pertama (2014 dan 2015) berlangsung
dengan hanya satu pengajuan FREL dari Brazil dengan durasi yang lebih pendek
sesuai dengan permintaan dari pihak Brazil. Laporan TA FREL Brazil dipublikasikan
pada Desember 2014. Dengan telah selesainya TA FREL tersebut maka Brazil dapat
melaporkan capaian kinerja dalam technical annex Biennial Update Report (BUR) pada
akhir 2014. Walaupun pada akhirnya Brazil baru melaporkan capaian kinerjanya dalam
technical annex REDD+ dalam 2nd BUR nya pada tahun 2017.
Pada tahun 2016, TA dilakukan di sembilan (9) negara berkembang yang pada
tahun sebelumnya telah mengajukan FREL/FRL. Kesembilan negara berkembang
tersebut adalah Chile, Kongo, Kosta Rika, Ethiopia, Indonesia, Paraguay, Peru, Vietnam
dan Zambia. Sesi CTA berlangsung dari tanggal 14 – 18 Maret 2016 di Bonn, Jerman.
Keseluruhan proses, termasuk publikasi laporan TA-nya selesai pada November 2016.
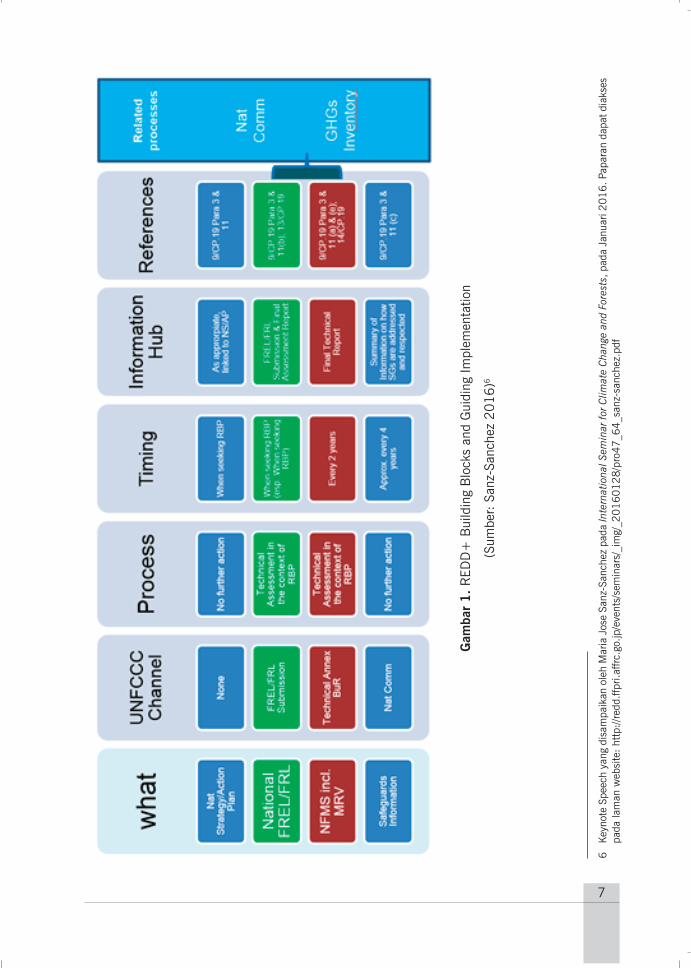
Technical Assessment merupakan bagian penting terkait pengajuan FREL/FRL dari
negara-negara yang terlibat, seperti yang terjabarkan dalam Gambar 1. Dalam REDD+
building block and guidance implementation, FREL nasional yang diajukan ke Sekretariat
UNFCCC dan dimasukkan dalam UNFCCC channel yaitu REDD+ web platform harus
melalui proses TA dalam konteks untuk memperoleh result based payment (RBP). Hal
ini sesuai dengan keputusan 9/CP.19 paragraph 3 dan keputusan 11(b) dan 13/CP.19.
Tata waktu TA FREL disesuaikan dengan kepentingan negara terkait untuk memperoleh
RBP. Bagi FREL yang telah melalui proses TA dan dinyatakan lulus/ dapat diterima maka
nantinya dokumen FREL/FRL (baik yang original maupun yang telah disempurnakan selama
proses TA) dan laporan penilaian final akan dipublikasikan oleh Sekretariat UNFCCC ke
dalam information hub (dalam hal ini pada REDD+ Web Platform). Keseluruhan proses
penyusunan dan pelaporan perangkat REDD+ berlangsung secara parallel dengan proses
pelaporan UNFCCC terkait yaitu National Communication dan National GHGs Inventory.
7
Gam
bar
1.
RED
D+
Bui
ldin
g B
lock
s an
d G
uidi
ng Im
plem
enta
tion
(Sum
ber:
San
z-Sa
nche
z 2016)6
6
Key
note
Spe
ech
yang
dis
ampa
ikan
ole
h M
aria
Jos
e Sa
nz-S
anch
ez p
ada
Inte
rnat
iona
l Sem
inar
for C
limat
e C
hang
e an
d Fo
rest
s, p
ada
Janu
ari 2
016. P
apar
an d
apat
dia
kses
pa
da la
man
web
site
: ht
tp://
redd
.ffpr
i.affr
c.go
.jp/e
vent
s/se
min
ars/
_im
g/_2
01
60
12
8/p
ro4
7_6
4_s
anz-
sanc
hez.
8
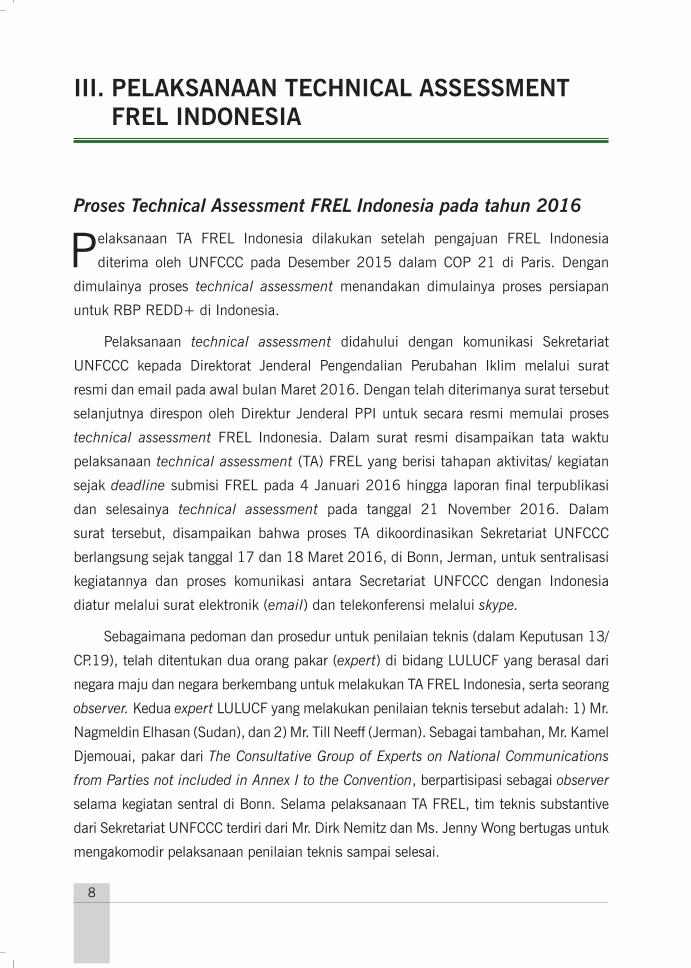
III. PELAKSANAAN TECHNICAL ASSESSMENT FREL INDONESIA
Proses Technical Assessment FREL Indonesia pada tahun 2016
Pelaksanaan TA FREL Indonesia dilakukan setelah pengajuan FREL Indonesia
diterima oleh UNFCCC pada Desember 2015 dalam COP 21 di Paris. Dengan
dimulainya proses technical assessment menandakan dimulainya proses persiapan
untuk RBP REDD+ di Indonesia.
Pelaksanaan technical assessment didahului dengan komunikasi Sekretariat
UNFCCC kepada Direktorat Jenderal Pengendalian Perubahan Iklim melalui surat
resmi dan email pada awal bulan Maret 2016. Dengan telah diterimanya surat tersebut
selanjutnya direspon oleh Direktur Jenderal PPI untuk secara resmi memulai proses
technical assessment FREL Indonesia. Dalam surat resmi disampaikan tata waktu
pelaksanaan technical assessment (TA) FREL yang berisi tahapan aktivitas/ kegiatan
sejak deadline submisi FREL pada 4 Januari 2016 hingga laporan final terpublikasi
dan selesainya technical assessment pada tanggal 21 November 2016. Dalam
surat tersebut, disampaikan bahwa proses TA dikoordinasikan Sekretariat UNFCCC
berlangsung sejak tanggal 17 dan 18 Maret 2016, di Bonn, Jerman, untuk sentralisasi
kegiatannya dan proses komunikasi antara Secretariat UNFCCC dengan Indonesia
diatur melalui surat elektronik (email) dan telekonferensi melalui skype.
Sebagaimana pedoman dan prosedur untuk penilaian teknis (dalam Keputusan 13/
CP.19), telah ditentukan dua orang pakar (expert) di bidang LULUCF yang berasal dari
negara maju dan negara berkembang untuk melakukan TA FREL Indonesia, serta seorang
observer. Kedua expert LULUCF yang melakukan penilaian teknis tersebut adalah: 1) Mr.
Nagmeldin Elhasan (Sudan), dan 2) Mr. Till Neeff (Jerman). Sebagai tambahan, Mr. Kamel
Djemouai, pakar dari The Consultative Group of Experts on National Communications
from Parties not included in Annex I to the Convention, berpartisipasi sebagai observer
selama kegiatan sentral di Bonn. Selama pelaksanaan TA FREL, tim teknis substantive
dari Sekretariat UNFCCC terdiri dari Mr. Dirk Nemitz dan Ms. Jenny Wong bertugas untuk
mengakomodir pelaksanaan penilaian teknis sampai selesai.
9
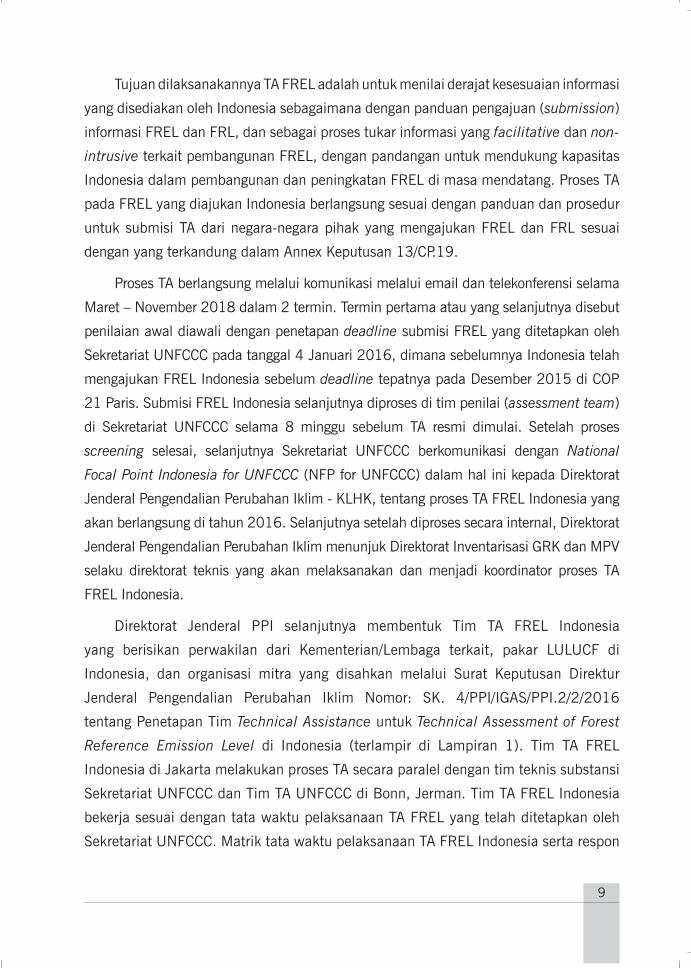
Tujuan dilaksanakannya TA FREL adalah untuk menilai derajat kesesuaian informasi
yang disediakan oleh Indonesia sebagaimana dengan panduan pengajuan (submission)
informasi FREL dan FRL, dan sebagai proses tukar informasi yang facilitative dan non-
intrusive terkait pembangunan FREL, dengan pandangan untuk mendukung kapasitas
Indonesia dalam pembangunan dan peningkatan FREL di masa mendatang. Proses TA
pada FREL yang diajukan Indonesia berlangsung sesuai dengan panduan dan prosedur
untuk submisi TA dari negara-negara pihak yang mengajukan FREL dan FRL sesuai
dengan yang terkandung dalam Annex Keputusan 13/CP.19.
Proses TA berlangsung melalui komunikasi melalui email dan telekonferensi selama
Maret – November 2018 dalam 2 termin. Termin pertama atau yang selanjutnya disebut
penilaian awal diawali dengan penetapan deadline submisi FREL yang ditetapkan oleh
Sekretariat UNFCCC pada tanggal 4 Januari 2016, dimana sebelumnya Indonesia telah
mengajukan FREL Indonesia sebelum deadline tepatnya pada Desember 2015 di COP
21 Paris. Submisi FREL Indonesia selanjutnya diproses di tim penilai (assessment team)
di Sekretariat UNFCCC selama 8 minggu sebelum TA resmi dimulai. Setelah proses
screening selesai, selanjutnya Sekretariat UNFCCC berkomunikasi dengan National
Focal Point Indonesia for UNFCCC (NFP for UNFCCC) dalam hal ini kepada Direktorat
Jenderal Pengendalian Perubahan Iklim - KLHK, tentang proses TA FREL Indonesia yang
akan berlangsung di tahun 2016. Selanjutnya setelah diproses secara internal, Direktorat
Jenderal Pengendalian Perubahan Iklim menunjuk Direktorat Inventarisasi GRK dan MPV
selaku direktorat teknis yang akan melaksanakan dan menjadi koordinator proses TA
FREL Indonesia.
Direktorat Jenderal PPI selanjutnya membentuk Tim TA FREL Indonesia
yang berisikan perwakilan dari Kementerian/Lembaga terkait, pakar LULUCF di
Indonesia, dan organisasi mitra yang disahkan melalui Surat Keputusan Direktur
Jenderal Pengendalian Perubahan Iklim Nomor: SK. 4/PPI/IGAS/PPI.2/2/2016
tentang Penetapan Tim Technical Assistance untuk Technical Assessment of Forest
Reference Emission Level di Indonesia (terlampir di Lampiran 1). Tim TA FREL
Indonesia di Jakarta melakukan proses TA secara paralel dengan tim teknis substansi
Sekretariat UNFCCC dan Tim TA UNFCCC di Bonn, Jerman. Tim TA FREL Indonesia
bekerja sesuai dengan tata waktu pelaksanaan TA FREL yang telah ditetapkan oleh
Sekretariat UNFCCC. Matrik tata waktu pelaksanaan TA FREL Indonesia serta respon
10
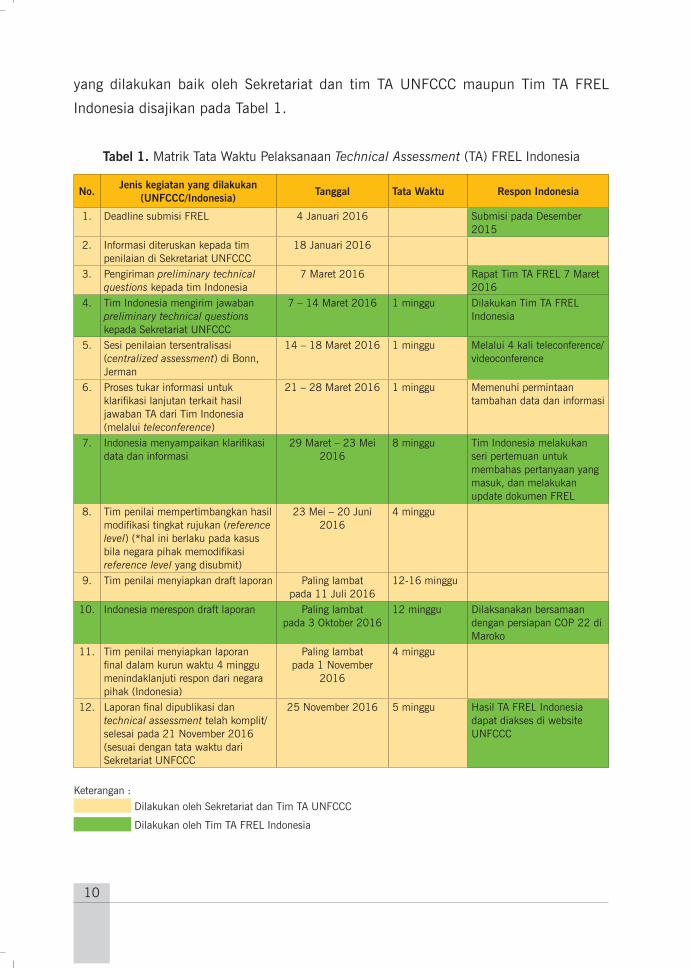
yang dilakukan baik oleh Sekretariat dan tim TA UNFCCC maupun Tim TA FREL
Indonesia disajikan pada Tabel 1.
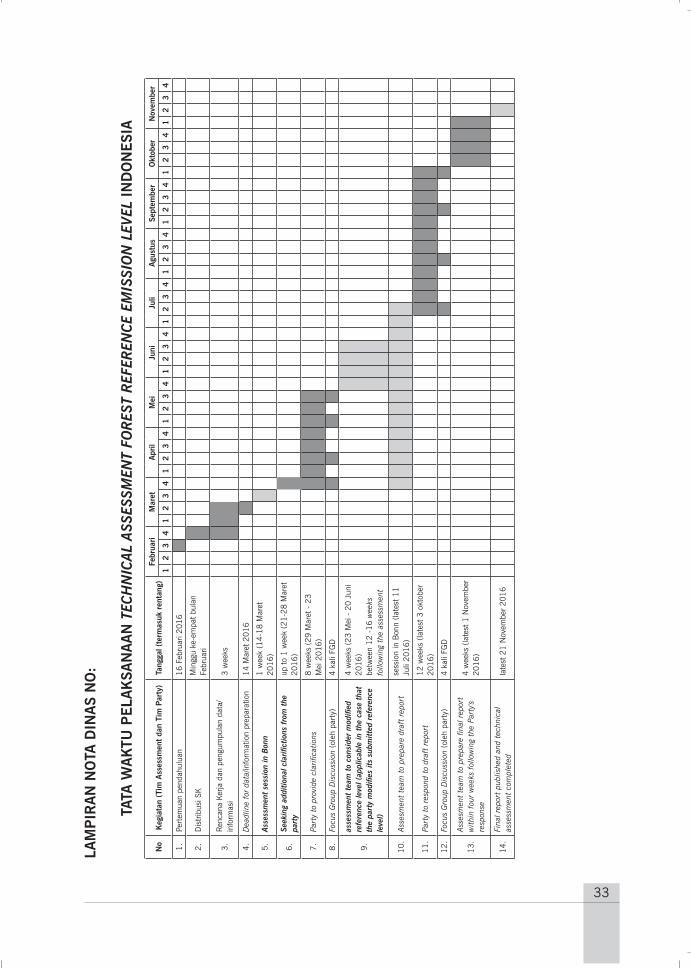
Tabel 1. Matrik Tata Waktu Pelaksanaan Technical Assessment (TA) FREL Indonesia
No.Jenis kegiatan yang dilakukan
(UNFCCC/Indonesia)Tanggal Tata Waktu Respon Indonesia
1. Deadline submisi FREL 4 Januari 2016 Submisi pada Desember 2015
2. Informasi diteruskan kepada tim penilaian di Sekretariat UNFCCC
18 Januari 2016
3. Pengiriman preliminary technical questions kepada tim Indonesia
7 Maret 2016 Rapat Tim TA FREL 7 Maret 2016
4. Tim Indonesia mengirim jawaban preliminary technical questions kepada Sekretariat UNFCCC
7 – 14 Maret 2016 1 minggu Dilakukan Tim TA FREL Indonesia
5. Sesi penilaian tersentralisasi (centralized assessment) di Bonn, Jerman
14 – 18 Maret 2016 1 minggu Melalui 4 kali teleconference/videoconference
6. Proses tukar informasi untuk klarifikasi lanjutan terkait hasil jawaban TA dari Tim Indonesia (melalui teleconference)
21 – 28 Maret 2016 1 minggu Memenuhi permintaan tambahan data dan informasi
7. Indonesia menyampaikan klarifikasi data dan informasi
29 Maret – 23 Mei 2016
8 minggu Tim Indonesia melakukan seri pertemuan untuk membahas pertanyaan yang masuk, dan melakukan update dokumen FREL
8. Tim penilai mempertimbangkan hasil modifikasi tingkat rujukan (reference level) (*hal ini berlaku pada kasus bila negara pihak memodifikasi reference level yang disubmit)
23 Mei – 20 Juni 2016
4 minggu
9. Tim penilai menyiapkan draft laporan Paling lambat pada 11 Juli 2016
12-16 minggu
10. Indonesia merespon draft laporan Paling lambat pada 3 Oktober 2016
12 minggu Dilaksanakan bersamaan dengan persiapan COP 22 di Maroko
11. Tim penilai menyiapkan laporan final dalam kurun waktu 4 minggu menindaklanjuti respon dari negara pihak (Indonesia)
Paling lambat pada 1 November
2016
4 minggu
12. Laporan final dipublikasi dan technical assessment telah komplit/selesai pada 21 November 2016 (sesuai dengan tata waktu dari Sekretariat UNFCCC
25 November 2016 5 minggu Hasil TA FREL Indonesia dapat diakses di website UNFCCC
Keterangan :
Dilakukan oleh Sekretariat dan Tim TA UNFCCC
Dilakukan oleh Tim TA FREL Indonesia
11
Sesuai Tabel 1, proses TA penilaian awal mencakup kegiatan nomor 3, 4, 5 dan 6
yang ditutup dengan laporan/komunikasi rangkuman assessment oleh tim TA UNFCCC.
Rangkuman assessment ini disampaikan kepada Indonesia melalui surat elektronik
(email) dan teleconference untuk dikaji dan diklarifikasi. Tim TA FREL Indonesia
selanjutnya melakukan kajian dan menyampaikan tanggapan penilaian awal, termasuk
dokumen perbaikan FREL, pada akhir Mei 2016. Langkah kegiatan nomor urut 7 – 11
dalam Tabel 1, merupakan proses TA lanjutan dan dilakukan melalui seri pertemuan
oleh tim TA Indonesia. Walaupun tata waktu telah disusun oleh Sekretariat UNFCCC,
pada pelaksanannya tata waktu yang digambarkan pada Tabel 1 mengalami modifikasi
sesuai dengan kesepakatan antara kedua belah pihak. Namun deadline penyampaian
draft laporan resmi dan dokumen FREL final tidak melebihi tata waktu yang ada.
Tahap Penilaian Awal TA FREL Indonesia
Pada penilaian awal, tim TA UNFCCC mengidentifikasi hal-hal penting dalam
dokumen FREL Indonesia yang perlu diklarifikasi dan bersama tim secretariat UNFCCC di
Bonn melakukan klarifikasi langsung melalui email maupun video/teleconference dengan
tim TA FREL Indonesia. Dalam tim TA FREL Indonesia, terdapat tim kecil yang bertugas
melakukan komunikasi dengan keseluruhan tim TA FREL Indonesia secara periodik untuk
menjamin agar informasi utama dan pendukung yang diperlukan tersedia termasuk
penyelenggaraan pertemuan-pertemuan untuk membahas pertanyaan-pertanyaan
TA maupun komunikasi antara Tim TA FREL Indonesia dengan Tim TA UNFCCC. Tim
kecil TA FREL Indonesia terdiri atas Direktur Jenderal PPI, Direktur IGRK dan MPV, Dr.
Belinda A. Margono, Budiharto, Judin Purwanto, Dr. I Wayan Susi Darmawan, dan Dr.
Haruni Krisnawati (KLHK), Arief Wijaya (WRI), Delon Marthinus (GCF Task Force), Arief
Budiman (Winrock), Teddy Rusolono (IPB), Prof. Rizaldi Boer (CCROM-SEAP IPB), dan
Prof. Fahmuddin Agus (Kementan); dibantu oleh Sekretariat UNDP REDD+ (Muhammad
Farid, Riana Nedyawati, dan Aida Novita) dan tim pendukung Direktorat IGRK dan MPV
(Wawan Gunawan, Gamma Nur MS, Hendra Nur Rofiq).
Tim TA UNFCCC mengirimkan pertanyaan-pertanyaan selama periode penilaian
awal pada 7 – 28 Maret 2018 melalui komunikasi melalui email dan telah dilakukan
4 kali video/teleconference untuk membahas 4 set pertanyaan dengan total berisi 43
12
pertanyaan. Tim TA UNFCCC mengirimkan pertanyaan teknis pertama (preliminary
technical questions) sebanyak 18 pertanyaan pada tanggal 7 Maret 2016 yang berisi
tentang: 1) pertanyaan terkait bagian umum sebanyak 4 pertanyaan; 2) pertanyaan
terkait Bab 2 (Definisi) sebanyak 5 pertanyaan; 3) Bab 3 (Ruang lingkup) sebanyak
5 pertanyaan; 4) Bab 4 (Data dan metodologi) sebanyak 4 pertanyaan; dan 5) Bab
6 (kebijakan) sebanyak 1 pertanyaan. Tim TA FREL Indonesia selanjutnya melakukan
diskusi tim per kelompok bahasan untuk menjawab pertanyaan-pertanyaan tersebut. Tim
TA FREL Indonesia selanjutnya melakukan pertemuan diskusi terarah pada tanggal 14
Maret 2016 di Jakarta untuk membahas jawaban final untuk 18 pertanyaan tersebut.
Selanjutnya Tim TA FREL Indonesia mengirimkan jawaban tersebut melalui email
ke Tim TA UNFCCC. Kemudian Tim TA UNFCCC memberikan respon dan menambahkan
tambahan pertanyaan yaitu pertanyaan teknis kedua sebanyak 15 pertanyaan yang
dikirimkan ke tim TA UNFCCC pada tanggal 15 Maret 2016. Kelimabelas pertanyaan
tersebut berisi tentang: 1) pertanyaan terkait bagian Umum sebanyak 2 pertanyaan;
2) pertanyaan terkait deforestasi dan degradasi hutan sebanyak 3 pertanyaan; 3)
pertanyaan terkait soil organic carbon sebanyak 4 pertanyaan; 4) pertanyaan terkait
land use change matrix sebanyak 2 pertanyaan; 5) pertanyaan terkait uncertainty
analysis sebanyak 3 pertanyaan. Set pertanyaan ketiga menyusul dikirimkan oleh tim
TA UNFCCC pada tanggal 16 Maret 2016 sebanyak 4 pertanyaan yang berisi tentang:
1) pertanyaan terkait definisi hutan sebanyak 1 pertanyaan; 2) pertanyaan terkait
peatland emission factor sebanyak 2 pertanyaan; dan 3) pertanyaan terkait capacity
building for improvement FREL sebanyak 1 pertanyaan.
Pertanyaan teknis kedua dan ketiga dibahas oleh Tim TA FREL Indonesia pada
pertemuan FGD lanjutan pada tanggal 18 Maret 2016 di Jakarta. Tim TA FREL Indonesia
juga melakukan 4 kali pertemuan/diskusi internal terkait gambut, soil organic carbon,
dan penghitungan deforestasi dan degradasi hutan di Bogor pada rentang waktu 1 bulan
(20 Maret – 10 April 2016). Pertemuan diskusi ini membahas lebih detail tentang faktor
emisi gambut, kebakaran hutan dan lahan gambut, cara pengukuran dan penghitungan
data soil organic carbon, dan penyusunan simulasi penghitungan skenario deforestasi
dan degradasi hutan dengan tambahan data dari perbaikan selama proses TA. Hasil
diskusi digunakan juga sebagai pertimbangan dalam menjawab pertanyaan TA dan
sebagai bahan untuk perbaikan FREL.
13
Pertanyaan teknis keempat dikirimkan oleh Tim TA UNFCCC pada tanggal 17 Maret
2016 sebanyak 5 pertanyaan data teknis dalam bentuk tabel dan grafik tentang emisi
dari periode referensi (1990 – 2012). Kelima pertanyaan ini berisi tentang permintaan
untuk menyediakan data sebagai berikut: 1) data tabel emisi dari ketiga aktivitas
(deforestasi, degradasi hutan, dan dekomposisi gambut) pada periode referensi 1990
– 2012 dalam bentuk tabular; 2) data statistik regresi penuh untuk proyeksi emisi
gambut termasuk dengan koefisien regresi dengan standar error-nya; 3) tabel faktor
emisi yang digunakan untuk penghitungan emisi dari deforestasi dan degradasi hutan;
4) data aktivitas yang digunakan untuk menyusun reference emission level untuk lahan
gambut; dan 5) detail informasi terkait kelas penutupan lahan yang digunakan dalam
penghitungan emisi (22 kelas tutupan lahan). Tim TA FREL melakukan pertemuan
teknis lanjutan untuk menjawab pertanyaan tersebut pada tanggal 21 Maret 2018 di
Jakarta.
Tahap Penilaian Akhir TA FREL Indonesia
Sekretariat UNFCCC dengan Tim TA UNFCCC menyusun laporan penilaian
awal yang dikomunikasikan kepada Tim TA FREL Indonesia pada tanggal 28 Maret
2016. Tim TA FREL Indonesia dengan tenggat waktu 8 minggu bekerja melakukan
perbaikan dan mengirimkan tanggapan resmi terhadap penilaian awal tersebut pada
tanggal 23 Mei 2016. Dalam rentang waktu penyusunan laporan penilaian awal,
Tim TA UNFCCC dengan Tim TA FREL Indonesia melakukan teleconference untuk
membahas detail keseluruhan jawaban. Tim TA UNFCCC meminta klarifikasi langsung
kepada tim TA FREL Indonesia terhadap data dan informasi yang diberikan. Dalam
pembahasan tersebut, mencuat diskusi mengenai pentingnya penghitungan emisi
dekomposisi gambut yang dilakukan Indonesia kaitannya dengan angka emisi baseline
secara keseluruhan. Hal ini dilanjutkan oleh Tim TA UNFCCC dengan mengirimkan
pertanyaan tambahan (pertanyaan nomor 43) pada Tim TA FREL Indonesia pada
tanggal 10 April 2016 waktu Bonn. Tim TA FREL Indonesia melakukan seri pertemuan
internal yang puncaknya pada tanggal 14 April 2016 dilakukan pertemuan tim teknis
dan pendukung untuk membahas hal tersebut di Jakarta. Dalam pertemuan tersebut
dibahas mengenai pertimbangan yang digunakan oleh Indonesia dalam penghitungan
emisi dari dekomposisi gambut. Keseluruhan pertanyaan dan jawaban selama proses
14
TA FREL Indonesia terrangkum dalam Lampiran 2.
Tim TA UNFCCC pada saat teleconference dengan Tim TA FREL Indonesia
menyampaikan apresiasinya terhadap kinerja tim TA FREL Indonesia yang telah
memberikan informasi dan data secara akurat dan transparan, dan mengapresiasi
usaha Indonesia dalam menghitung emisi yang secara akurat merefleksikan profil
emissi aktual di Indonesia. Tim TA FREL Indonesia pada akhirnya memberikan jawaban
terkait signifikansi emisi dekomposisi gambut penting untuk mengangkat isu gambut
dalam perbaikan tata kelola khususnya untuk pengendalian kebakaran hutan dan lahan
gambut dan mendorong agar ada aksi-aksi mitigasi dan adaptasi untuk menurunkan
emisi dari dekomposisi gambut maupun emisi kebakaran hutan dan lahan gambut.
Tim TA UNFCCC juga mengapresiasi Tim TA FREL Indonesia yang telah memberikan
penjelasan mengenai proses penghitungan emisi kebakaran hutan dan lahan gambut
walaupun hasil emisi tidak dimasukkan dalam baseline (hanya di Annex) dengan
pertimbangan masih dalam perbaikan terus-menerus.
Selanjutnya Tim TA UNFCCC mempunyai waktu 12 – 16 minggu untuk mempelajari
laporan tanggapan resmi Indonesia dan meresponnya dalam laporan penilaian resmi,
sampai dengan tanggal 11 Juli 2016. Draft laporan resmi TA selanjutnya tersedia
di website UNFCCC pada tanggal 11 Juli 2018. Laporan resmi disampaikan kepada
Indonesia melalui Dirjen PPI (selaku NFP for UNFCCC) pada tanggal 11 Juli 2016.
Indonesia mempunyai waktu 12 minggu (paling lambat hingga 3 Oktober 2016) untuk
melakukan kajian terhadap penilaian yang masuk, menyempurnakan FREL sesuai
dengan kebutuhan (apabila diperlukan penyesuaian dari hasil facilitative dialogue),
menambahkan informasi yang diperlukan sesuai dengan perkembangan dalam
negeri, dan menyerahkan tanggapan serta laporan. Tim TA UNFCCC mengirimkan
dokumen berisi matriks rangkuman pertanyaan selama proses TA dengan dimodifikasi
sesuai dengan hasil jawaban yang telah disampaikan Indonesia yang selanjutnya
dikomunikasikan kepada Tim TA FREL Indonesia untuk dapat direspon. Matriks
ini merupakan breakdown dari draft laporan resmi hasil TA Penilaian Awal untuk
memudahkan Tim TA FREL Indonesia dalam merespon baik berupa komentar maupun
saran/masukan dari Indonesia serta keterangan apakah komentar atau saran tersebut
juga diakomodir dalam additional text dalam dokumen FREL yang di-review. Matriks
teks dalam TA sesuai dengan draft laporan TA penilaian awal maupun komentar dan
15
saran yang diberikan oleh Tim TA FREL Indonesia secara detail dapat dilihat pada
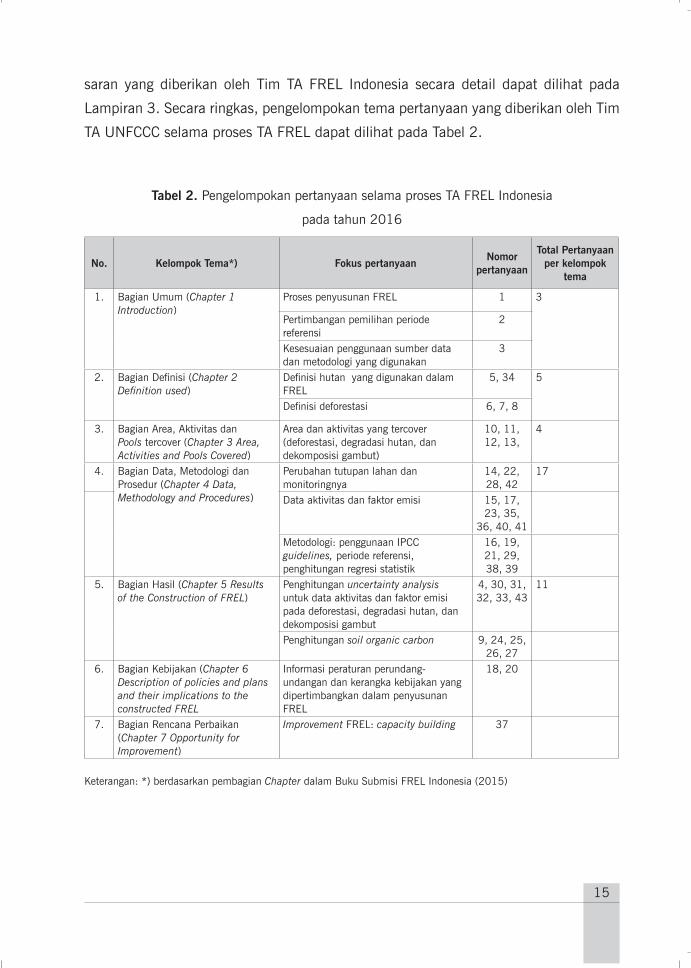
Lampiran 3. Secara ringkas, pengelompokan tema pertanyaan yang diberikan oleh Tim
TA UNFCCC selama proses TA FREL dapat dilihat pada Tabel 2.
Tabel 2. Pengelompokan pertanyaan selama proses TA FREL Indonesia
pada tahun 2016
No. Kelompok Tema*) Fokus pertanyaanNomor
pertanyaan
Total Pertanyaan per kelompok
tema
1. Bagian Umum (Chapter 1 Introduction)
Proses penyusunan FREL 1 3
Pertimbangan pemilihan periode referensi
2
Kesesuaian penggunaan sumber data dan metodologi yang digunakan
3
2. Bagian Definisi (Chapter 2 Definition used)
Definisi hutan yang digunakan dalam FREL
5, 34 5
Definisi deforestasi 6, 7, 8
3. Bagian Area, Aktivitas dan Pools tercover (Chapter 3 Area, Activities and Pools Covered)
Area dan aktivitas yang tercover (deforestasi, degradasi hutan, dan dekomposisi gambut)
10, 11, 12, 13,
4
4. Bagian Data, Metodologi dan Prosedur (Chapter 4 Data, Methodology and Procedures)
Perubahan tutupan lahan dan monitoringnya
14, 22, 28, 42
17
Data aktivitas dan faktor emisi 15, 17, 23, 35,
36, 40, 41Metodologi: penggunaan IPCC guidelines, periode referensi, penghitungan regresi statistik
16, 19, 21, 29, 38, 39
5. Bagian Hasil (Chapter 5 Results of the Construction of FREL)
Penghitungan uncertainty analysis untuk data aktivitas dan faktor emisi pada deforestasi, degradasi hutan, dan dekomposisi gambut
4, 30, 31, 32, 33, 43
11
Penghitungan soil organic carbon 9, 24, 25, 26, 27
6. Bagian Kebijakan (Chapter 6 Description of policies and plans and their implications to the constructed FREL
Informasi peraturan perundang-undangan dan kerangka kebijakan yang dipertimbangkan dalam penyusunan FREL
18, 20
7. Bagian Rencana Perbaikan (Chapter 7 Opportunity for Improvement)
Improvement FREL: capacity building 37
Keterangan: *) berdasarkan pembagian Chapter dalam Buku Submisi FREL Indonesia (2015)
16
Perbandingan hasil TA Penilaian Awal dengan hasil TA Penilaian Akhir/Final
Tim TA FREL Indonesia selanjutnya melakukan dua aktivitas parallel yaitu merespon
draft laporan resmi dan melakukan perbaikan dokumen FREL Indonesia. Tim TA FREL
Indonesia melakukan seri pertemuan sebanyak 6 kali dalam rentang waktu Agustus –
Oktober 2016 untuk menyusun respon terhadap laporan penilaian dan memperbaiki
dokumen FREL Indonesia yang dilakukan di Jakarta, Bogor, dan Bandung. Tim TA
FREL Indonesia mengajukan kedua dokumen tersebut kepada Sekretariat UNFCCC
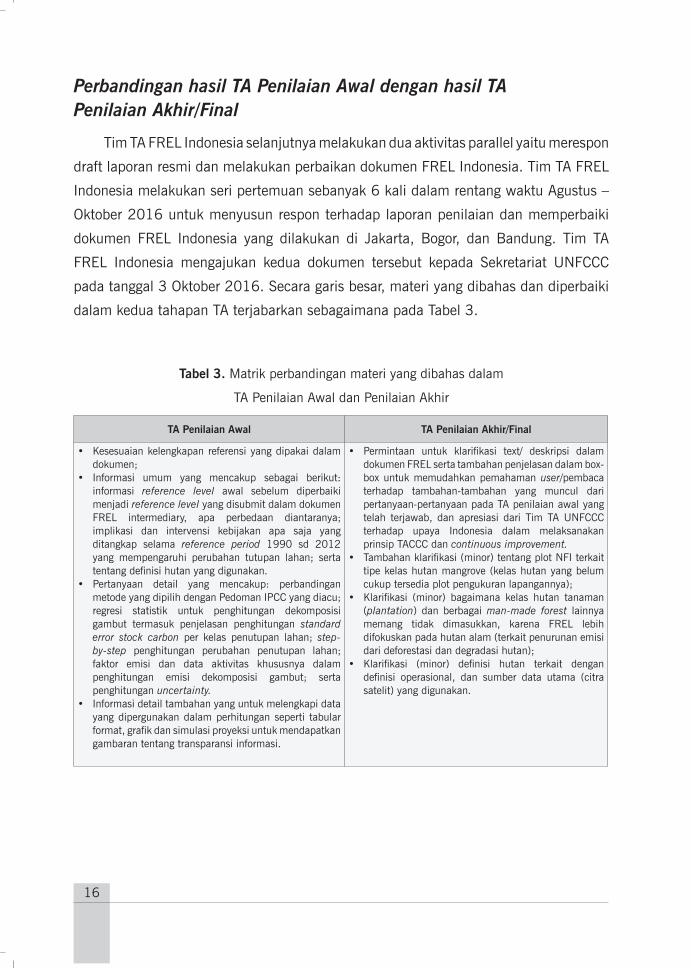
pada tanggal 3 Oktober 2016. Secara garis besar, materi yang dibahas dan diperbaiki
dalam kedua tahapan TA terjabarkan sebagaimana pada Tabel 3.
Tabel 3. Matrik perbandingan materi yang dibahas dalam
TA Penilaian Awal dan Penilaian Akhir
TA Penilaian Awal TA Penilaian Akhir/Final
• Kesesuaian kelengkapan referensi yang dipakai dalam dokumen;
• Informasi umum yang mencakup sebagai berikut: informasi reference level awal sebelum diperbaiki menjadi reference level yang disubmit dalam dokumen FREL intermediary, apa perbedaan diantaranya; implikasi dan intervensi kebijakan apa saja yang ditangkap selama reference period 1990 sd 2012 yang mempengaruhi perubahan tutupan lahan; serta tentang definisi hutan yang digunakan.
• Pertanyaan detail yang mencakup: perbandingan metode yang dipilih dengan Pedoman IPCC yang diacu; regresi statistik untuk penghitungan dekomposisi gambut termasuk penjelasan penghitungan standard error stock carbon per kelas penutupan lahan; step-by-step penghitungan perubahan penutupan lahan; faktor emisi dan data aktivitas khususnya dalam penghitungan emisi dekomposisi gambut; serta penghitungan uncertainty.
• Informasi detail tambahan yang untuk melengkapi data yang dipergunakan dalam perhitungan seperti tabular format, grafik dan simulasi proyeksi untuk mendapatkan gambaran tentang transparansi informasi.
• Permintaan untuk klarifikasi text/ deskripsi dalam dokumen FREL serta tambahan penjelasan dalam box-box untuk memudahkan pemahaman user/pembaca terhadap tambahan-tambahan yang muncul dari pertanyaan-pertanyaan pada TA penilaian awal yang telah terjawab, dan apresiasi dari Tim TA UNFCCC terhadap upaya Indonesia dalam melaksanakan prinsip TACCC dan continuous improvement.
• Tambahan klarifikasi (minor) tentang plot NFI terkait tipe kelas hutan mangrove (kelas hutan yang belum cukup tersedia plot pengukuran lapangannya);
• Klarifikasi (minor) bagaimana kelas hutan tanaman (plantation) dan berbagai man-made forest lainnya memang tidak dimasukkan, karena FREL lebih difokuskan pada hutan alam (terkait penurunan emisi dari deforestasi dan degradasi hutan);
• Klarifikasi (minor) definisi hutan terkait dengan definisi operasional, dan sumber data utama (citra satelit) yang digunakan.
17
Apresiasi Internasional pada Proses TA FREL Indonesia yang fasilitatif dan konstruktif
Setelah kedua dokumen disampaikan kepada Sekretariat UNFCCC, selanjutnya
proses penyusunan laporan akhir TA dilakukan oleh Tim TA UNFCCC dan tim
pendukung teknis Sekretariat UNFCCC selama 4 minggu setelah respon dari Indonesia
diterima. Laporan akhir TA FREL dipublikasikan pada tanggal 21 November 2016 oleh
Sekretariat UNFCCC pada website UNFCCC dan REDD+ web platform. Dalam laporan
penilaian final maupun dalam seri teleconference selama proses TA, tim TA UNFCCC
menyampaikan apresiasi kepada Indonesia yang memperhitungkan beberapa inovasi
penting yang mencakup antara lain:
i. Implementasi definisi hutan dan perubahannya yang secara tidak langsung
memperhitungkan proses integrasi antara land cover dan land use;
ii. Memiliki konsep wali data yang berlaku di Indonesia, sebagaimana penerapan
kebijakan satu peta (One Map Policy);
iii. Memasukkan informasi tentang uncertainty dan penjelasannya termasuk
upaya Indonesia dalam melakukan perbaikan untuk meningkatkan akurasi
atau mengurangi uncertainty;
iv. Melakukan kajian ekstensif mengenai penghitungan dekomposisi gambut
dalam periode panjang melalui trajectory perubahan penutupan lahan per
interval (period) waktu;
v. Menggunakan faktor emisi (FE) dari soil organic carbon gambut yang sudah
memenuhi kriteria Tier 2;
vi. Memperkenalkan data aktivitas (penutupan lahan dan perubahannya)
yang rentangnya panjang (22 tahun), dengan kelas yang cukup detail bagi
kepentingan operasional;
vii. Memberikan rencana perbaikan (plan for improvement) untuk FREL maupun
aktivitas REDD+ ke depan.
Hal – hal tersebut merupakan detail yang tidak semua dilakukan oleh negara
lain yang telah melalui proses TA (pada waktu tahun 2016) dan sangat bagus untuk
dikomunikasikan lebih jauh, sebagai pembelajaran bagi negara-negara lain yang
nantinya akan mengalami proses TA FREL maupun proses technical assessment untuk
dokumen lainnya (seperti ICA untuk BUR). Apresiasi ini juga disampaikan langsung
18
dari Sekretariat UNFCCC kepada Direktur Jenderal PPI selaku National Focal Point
for UNFCCC pada COP 22 di Marrakech terkait pelaksanaan TA yang berlangsung
secara partisipatif dan komunikasi yang baik, tepat waktu dan menjadi proses
facilitative dialogue yang dapat menjadi pembelajaran bagi experts dan stakeholders
terkait yang terlibat dalam TA baik di UNFCCC maupun di Indonesia, serta didorong
untuk dapat menjadi pembelajaran juga bagi negara-negara berkembang lainnya
yang mengimplementasikan REDD+. Laporan TA FREL Indonesia (Report on the
technical assessment of the proposed forest reference emission level of Indonesia
submitted in 2016) sebagaimana yang diupload di website UNFCCC dengan tautan
berikut: http://unfccc.int/documentation/documents/advanced_search/items/6911.
php?priref-600009397, dilengkapi dengan update dokumen FREL Indonesia hasil TA.
Laporan akhir TA FREL ini terlampir pada Lampiran 4.
19
IV. PENUTUP
REDD+ sebagai salah satu upaya mitigasi perubahan iklim dalam penurunan emisi
GRK khususnya di sektor lahan menjadi inisiatif penting terkait pemenuhan target
NDC di Indonesia. Pengukuran keberhasilan kinerja REDD+ ditentukan oleh FREL
Indonesia yang menjadi baseline REDD+ dalam skala nasional. FREL Indonesia telah
melalui proses technical assessment yang dikoordinasikan oleh Sekretariat UNFCCC
melalui proses panjang yang berlangsung selama 10 bulan pada tahun 2016.
Hal ini menandakan bahwa baseline REDD+ Indonesia ini telah memenuhi
prinsip Transparan, Akurat, Komplit, Komparabel, dan Konsisten (TACCC Principles/
Transparency, Accuracy, Completeness, Comparability, Consistency). Proses technical
assessment FREL Indonesia yang telah selesai ini menunjukkan bahwa Indonesia telah
memenuhi prasayarat yang dibutuhkan untuk dapat memperoleh RBP untuk kinerja
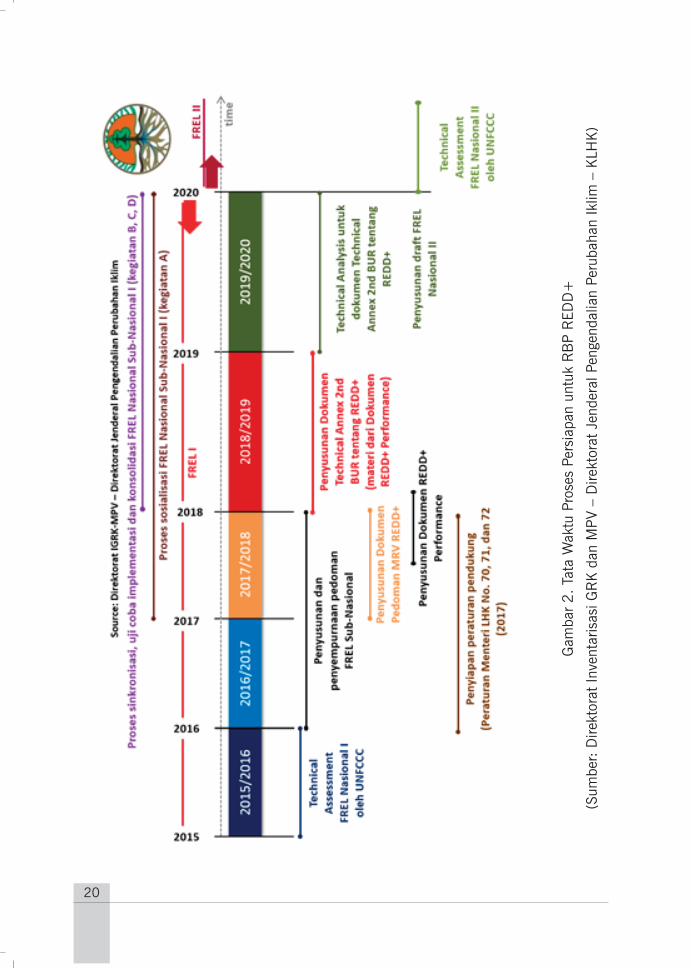
REDD+ di Indonesia. Proses persiapan RBP REDD+ dan tujuan yang ingin dicapai
di fase implementasi REDD+ tergambarkan dalam Gambar 2 yang menjabarkan
tentang tata waktu proses persiapan untuk RBP REDD+ yang diawali dari submisi
FREL Indonesia dan proses technical assessment nya hingga rencana ke depan untuk
technical analysis bagi technical annex REDD+ dalam BUR. Dengan disepakatinya
Paris Agreement Work Program (PAWP) pada COP 24 di Katowice, Polandia, pelaporan
technical annex REDD+ menjadi kewajiban bagi negara-negara berkembang yang
mengimplementasikan REDD+. Kewajiban pelaporan ini tetap menempel pada BUR
yang selanjutnya setelah tahun 2024 menjadi Biennial Transparency Report (BTR).
20
Gam
bar
2.
Tata
Wak
tu P
rose
s Pe
rsia
pan
untu
k R
BP
RED
D+
(Sum
ber:
Dire
ktor
at In
vent
aris
asi G
RK
dan
MP
V –
Dire
ktor
at J
ende
ral P
enge
ndal
ian
Peru
baha
n Ik
lim –
KLH
K)
21
Payung hukum atau peraturan untuk mendukung operasionalisasi REDD+
telah disusun oleh KLHK yaitu Peraturan Menteri LHK Nomor 70/MENLHK/
SETJEN/KUM.1/12/2017 tentang Tata Cara Pelaksanaan Reducing Emissions from
Deforestation and Forest Degradation, Role of Conservation, Sustainable Management
of Forest and Enhancement of Forest Carbon Stocks. Dalam PermenLHK No. 70/2017
ini juga diatur mengenai FREL/FRL dan pelaksanaan REDD+ periode pertama (sampai
dengan 31 Desember 2020), menggunakan FREL Nasional pertama (yang disubmit
pada Desember 2015). Penyusunan dan peninjauan kembali FREL/FRL dilaksanakan
pada periode berikutnya, dalam hal ini telah dirancang bahwa rencana penyusunan
dan peninjauan kembali FREL akan dilakukan pada tahun 2019 dan 2020. Sehingga
nantinya bila dilakukan proses technical assessment kembali direncanakan pasca
tahun 2020. Prosedur penyusunan dan peninjauan kembali FREL/FRL diatur dalam
Lampiran 1B PermenLHK No. 70/2017.
Dengan telah disetujuinya FREL Indonesia sebagai basis pengukuran kinerja
REDD+ di Indonesia yang diakui baik di level nasional maupun internasional, maka
Indonesia secara resmi masuk dalam fase implementasi REDD+. Selanjutnya FREL
digunakan untuk menghitung capaian kinerja REDD+ dalam kurun waktu tahun 2013
– 2020. Perbaikan FREL dilakukan pada setiap 5 tahunan. FREL Indonesia ini juga
menjadi basis dalam menyusun baseline sektor kehutanan dalam proyeksi pencapaian
target NDC.
Pembelajaran yang dipetik dari proses TA ini didokumentasikan dengan baik
sebagai dokumentasi dan juga menjadi pembelajaran bagi pelaksanaan REDD+ di
Indonesia maupun negara-negara berkembang lainnya yang turut mengimplementasikan
REDD+. Diharapkan Buku Proses Technical Assessment Forest Reference Emission
Level Indonesia (Tahun 2016) dapat menjadi acuan dalam pelaksanaan TA maupun
pelaksanaan REDD+ di Indonesia secara umum, serta pembelajaran bagi pihak-pihak
terkait dan dapat menjadi dokumentasi penting dalam pelaksanaan REDD+ sejak fase
persiapan hingga fase implementasi di Indonesia.

22
23
LAMPIRAN
24
25
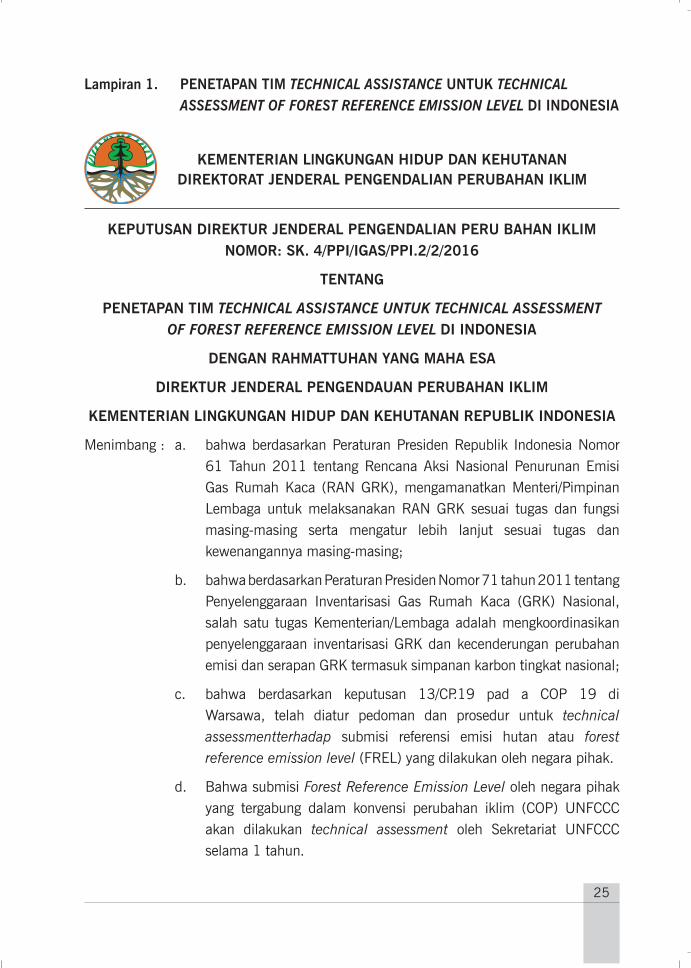
KEPUTUSAN DIREKTUR JENDERAL PENGENDALIAN PERU BAHAN IKLIM NOMOR: SK. 4/PPI/IGAS/PPI.2/2/2016
TENTANG
PENETAPAN TIM TECHNICAL ASSISTANCE UNTUK TECHNICAL ASSESSMENT OF FOREST REFERENCE EMISSION LEVEL DI INDONESIA
DENGAN RAHMATTUHAN YANG MAHA ESA
DIREKTUR JENDERAL PENGENDAUAN PERUBAHAN IKLIM
KEMENTERIAN LINGKUNGAN HIDUP DAN KEHUTANAN REPUBLIK INDONESIA
Menimbang : a. bahwa berdasarkan Peraturan Presiden Republik Indonesia Nomor 61 Tahun 2011 tentang Rencana Aksi Nasional Penurunan Emisi Gas Rumah Kaca (RAN GRK), mengamanatkan Menteri/Pimpinan Lembaga untuk melaksanakan RAN GRK sesuai tugas dan fungsi masing-masing serta mengatur lebih lanjut sesuai tugas dan kewenangannya masing-masing;
b. bahwa berdasarkan Peraturan Presiden Nomor 71 tahun 2011 tentang Penyelenggaraan Inventarisasi Gas Rumah Kaca (GRK) Nasional, salah satu tugas Kementerian/Lembaga adalah mengkoordinasikan penyelenggaraan inventarisasi GRK dan kecenderungan perubahan emisi dan serapan GRK termasuk simpanan karbon tingkat nasional;
c. bahwa berdasarkan keputusan 13/CP.19 pad a COP 19 di Warsawa, telah diatur pedoman dan prosedur untuk technical assessmentterhadap submisi referensi emisi hutan atau forest reference emission level (FREL) yang dilakukan oleh negara pihak.
d. Bahwa submisi Forest Reference Emission Level oleh negara pihak yang tergabung dalam konvensi perubahan iklim (COP) UNFCCC akan dilakukan technical assessment oleh Sekretariat UNFCCC selama 1 tahun.
KEMENTERIAN LlNGKUNGAN HIDUP DAN KEHUTANAN DIREKTORAT JENDERAL PENGENDALIAN PERUBAHAN IKLlM
Lampiran 1. PENETAPAN TIM TECHNICAL ASSISTANCE UNTUK TECHNICAL ASSESSMENT OF FOREST REFERENCE EMISSION LEVEL DI INDONESIA
26
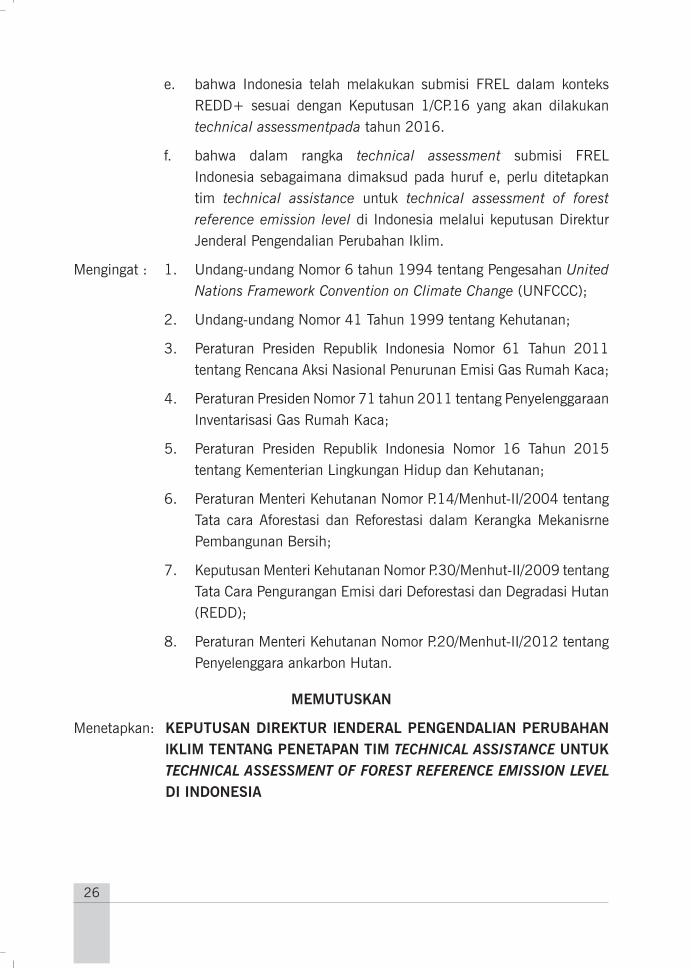
e. bahwa Indonesia telah melakukan submisi FREL dalam konteks REDD+ sesuai dengan Keputusan 1/CP.16 yang akan dilakukan technical assessmentpada tahun 2016.
f. bahwa dalam rangka technical assessment submisi FREL Indonesia sebagaimana dimaksud pada huruf e, perlu ditetapkan tim technical assistance untuk technical assessment of forest reference emission level di Indonesia melalui keputusan Direktur Jenderal Pengendalian Perubahan Iklim.
Mengingat : 1. Undang-undang Nomor 6 tahun 1994 tentang Pengesahan United Nations Framework Convention on Climate Change (UNFCCC);
2. Undang-undang Nomor 41 Tahun 1999 tentang Kehutanan;
3. Peraturan Presiden Republik Indonesia Nomor 61 Tahun 2011 tentang Rencana Aksi Nasional Penurunan Emisi Gas Rumah Kaca;
4. Peraturan Presiden Nomor 71 tahun 2011 tentang Penyelenggaraan Inventarisasi Gas Rumah Kaca;
5. Peraturan Presiden Republik Indonesia Nomor 16 Tahun 2015 tentang Kementerian Lingkungan Hidup dan Kehutanan;
6. Peraturan Menteri Kehutanan Nomor P.14/Menhut-II/2004 tentang Tata cara Aforestasi dan Reforestasi dalam Kerangka Mekanisrne Pembangunan Bersih;
7. Keputusan Menteri Kehutanan Nomor P.30/Menhut-II/2009 tentang Tata Cara Pengurangan Emisi dari Deforestasi dan Degradasi Hutan (REDD);
8. Peraturan Menteri Kehutanan Nomor P.20/Menhut-II/2012 tentang Penyelenggara ankarbon Hutan.
MEMUTUSKAN
Menetapkan: KEPUTUSAN DIREKTUR lENDERAL PENGENDALIAN PERUBAHAN lKLIM TENTANG PENETAPAN TIM TECHNICAL ASSISTANCE UNTUK TECHNICAL ASSESSMENT OF FOREST REFERENCE EMISSION LEVEL DI INDONESIA
27
KESATU : Tim Technical Assistance untuk technical assessment of Forest Reference Emission Level (FREL) di Indonesia terdiri dari Tim Pengarah dan Tim Teknis sebagaimana tercantum pada lampiran keputusan ini;
KEDUA : 2.1 Tim Pengarah untuk technical assessment FREL di Indonesia bertugas untuk:2.1.1 Memberi arahan dalam penyiapan dan pelaksanaan
technical assessment FREL di Indonesia;2.1.2 Memberikan pertimbangan teknis/non-teknis dalam
pelaksanaan technical assessment FREL di Indonesia;2.1.3 Memonitor hasil kerja Tim Teknis technical assessment
FREL di Indonesia;
2.2 Tim Teknis untuk technical assessment FREL di Indonesia bertugas untuk:2.2.1 Mempersiapkan/ melengkapi dan menyediakan akses
terhadap data yang dipergunakan dalam dokumen FREL Indonesia;
2.2.2 Menyiapkan hal-hal terkait informasi dan kelengkapan teknis FREL dalam rangka pelaksanaan technical assessment FREL di Indonesia;
2.2.3 Melakukan komunikasi teknis dan mempersiapkan jawaban serta hal-hal yang terkait permintaan Tim Technical Assessment FREL dari HNFCCC; dan
2.2.4 Menganalisa serta memformulasikan hasil huruf 2.2.1 sampai dengan 2.2.3 dalam bentuk draft kepada Direktur Jenderal Pengendalian Perubahan Iklim;
2.2.5 Menyelesaikan proses technical assessment FREL dan menyusun dokumen untuk submisi terkait Technical Assessment FREL dari UNFCCC.
KETIGA : Dalam melaksanakan tugas, Tim Pengarah dan Tim Teknis technical assistance untuk technical assessment FREL di Indonesia bertanggung jawab kepada Direktur Jenderal Pengendalian Perubahan Iklim;
KEEMPAT : Biaya yang timbul akibat keputusan ini dibebankan pada anggaran DIPA Kementerian Lingkungan Hidup dan Kehutanan dan sumber dana lainnya yang dapat dipertanggungjawabkan;
28
KELIMA : Keputusan ini berlaku sejak tanggal ditetapkan dengan ketentuan akan diadakan perbaikan apabila terdapat kekeliruan dalam penetapannya.
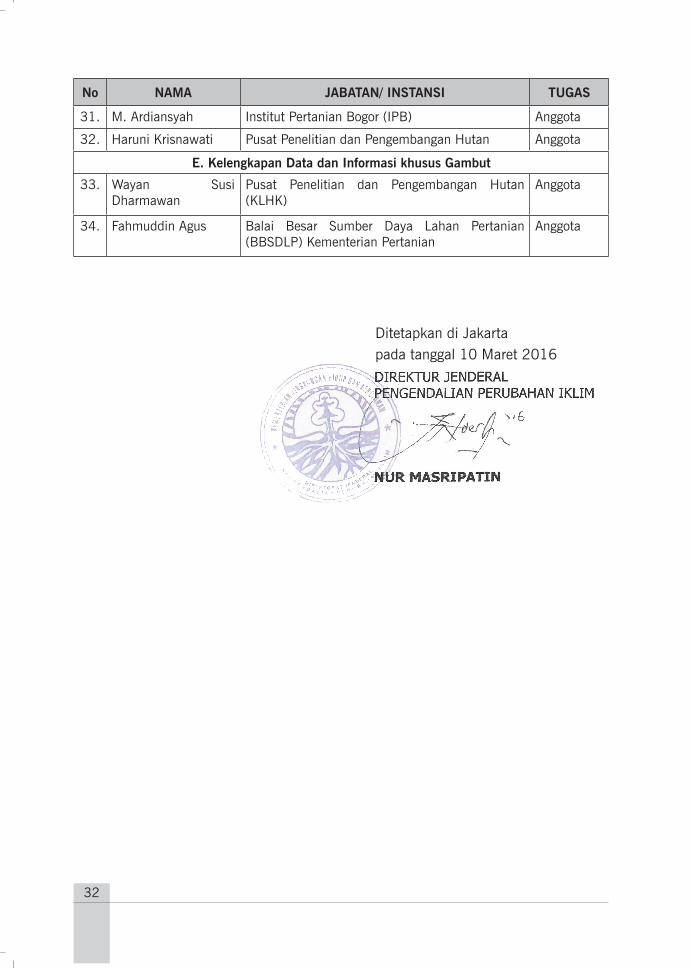
Ditetapkan di Jakartapada tanggal 10 Maret 2016
Salinan keputusan ini disampaikan kepada Yth. :1. Seluruh eselon II Lingkup Direktorat Jenderal Pengendalian Perubahan Iklim2. Seluruh eselon II terkait lingkup Kementerian Lingkungan Hidup dan Kehutanan3. Yang bersangkutan
29
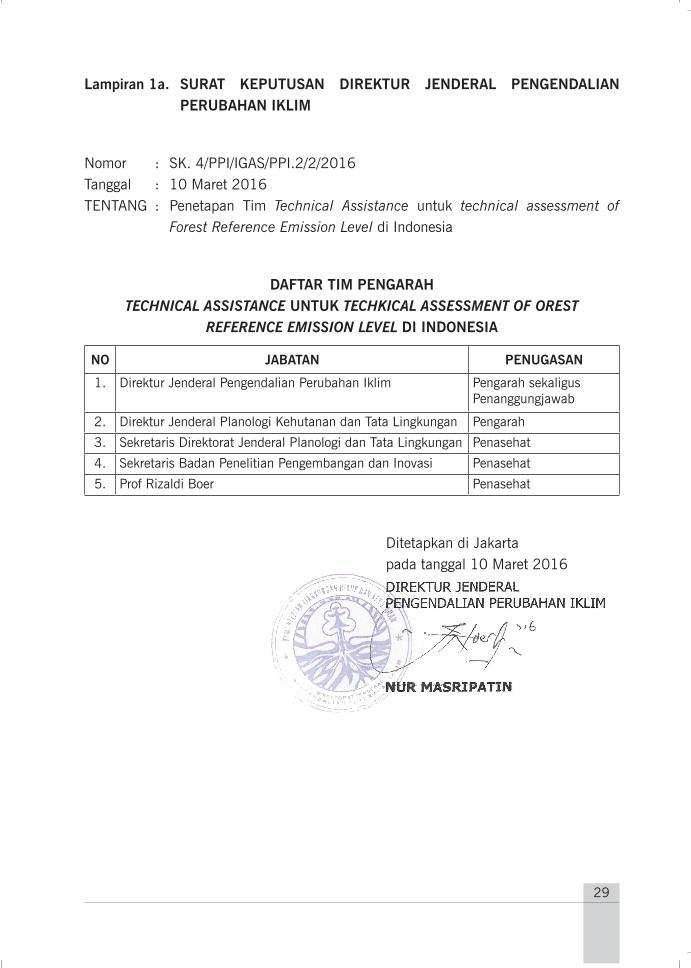
Lampiran 1a. SURAT KEPUTUSAN DIREKTUR JENDERAL PENGENDALIAN PERUBAHAN IKLIM
Nomor : SK. 4/PPI/IGAS/PPI.2/2/2016Tanggal : 10 Maret 2016TENTANG : Penetapan Tim Technical Assistance untuk technical assessment of
Forest Reference Emission Level di Indonesia
DAFTAR TIM PENGARAH TECHNICAL ASSISTANCE UNTUK TECHKICAL ASSESSMENT OF OREST
REFERENCE EMISSION LEVEL DI INDONESIA
NO JABATAN PENUGASAN
1. Direktur Jenderal Pengendalian Perubahan Iklim Pengarah sekaligus Penanggungjawab
2. Direktur Jenderal Planologi Kehutanan dan Tata Lingkungan Pengarah
3. Sekretaris Direktorat Jenderal Planologi dan Tata Lingkungan Penasehat
4. Sekretaris Badan Penelitian Pengembangan dan Inovasi Penasehat
5. Prof Rizaldi Boer Penasehat
Ditetapkan di Jakartapada tanggal 10 Maret 2016
30
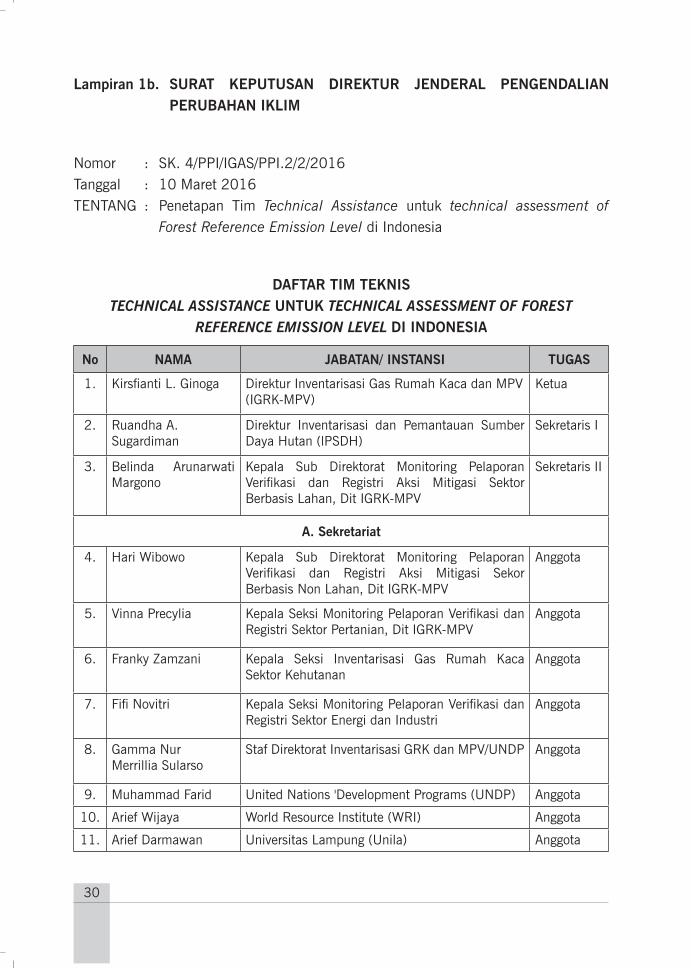
Lampiran 1b. SURAT KEPUTUSAN DIREKTUR JENDERAL PENGENDALIAN PERUBAHAN IKLIM
Nomor : SK. 4/PPI/IGAS/PPI.2/2/2016Tanggal : 10 Maret 2016TENTANG : Penetapan Tim Technical Assistance untuk technical assessment of
Forest Reference Emission Level di Indonesia
DAFTAR TIM TEKNIS TECHNICAL ASSISTANCE UNTUK TECHNICAL ASSESSMENT OF FOREST
REFERENCE EMISSION LEVEL DI INDONESIA
No NAMA JABATAN/ INSTANSI TUGAS
1. Kirsfianti L. Ginoga Direktur Inventarisasi Gas Rumah Kaca dan MPV (IGRK-MPV)
Ketua
2. Ruandha A. Sugardiman
Direktur Inventarisasi dan Pemantauan Sumber Daya Hutan (lPSDH)
Sekretaris I
3. Belinda Arunarwati Margono
Kepala Sub Direktorat Monitoring Pelaporan Verifikasi dan Registri Aksi Mitigasi Sektor Berbasis Lahan, Dit IGRK-MPV
Sekretaris II
A. Sekretariat
4. Hari Wibowo Kepala Sub Direktorat Monitoring Pelaporan Verifikasi dan Registri Aksi Mitigasi Sekor Berbasis Non Lahan, Dit IGRK-MPV
Anggota
5. Vinna Precylia Kepala Seksi Monitoring Pelaporan Verifikasi dan Registri Sektor Pertanian, Dit IGRK-MPV
Anggota
6. Franky Zamzani Kepala Seksi Inventarisasi Gas Rumah Kaca Sektor Kehutanan
Anggota
7. Fifi Novitri Kepala Seksi Monitoring Pelaporan Verifikasi dan Registri Sektor Energi dan Industri
Anggota
8. Gamma Nur Merrillia Sularso
Staf Direktorat Inventarisasi GRK dan MPV/UNDP Anggota
9. Muhammad Farid United Nations 'Development Programs (UNDP) Anggota
10. Arief Wijaya World Resource Institute (WRI) Anggota
11. Arief Darmawan Universitas Lampung (Unila) Anggota
31
No NAMA JABATAN/ INSTANSI TUGAS
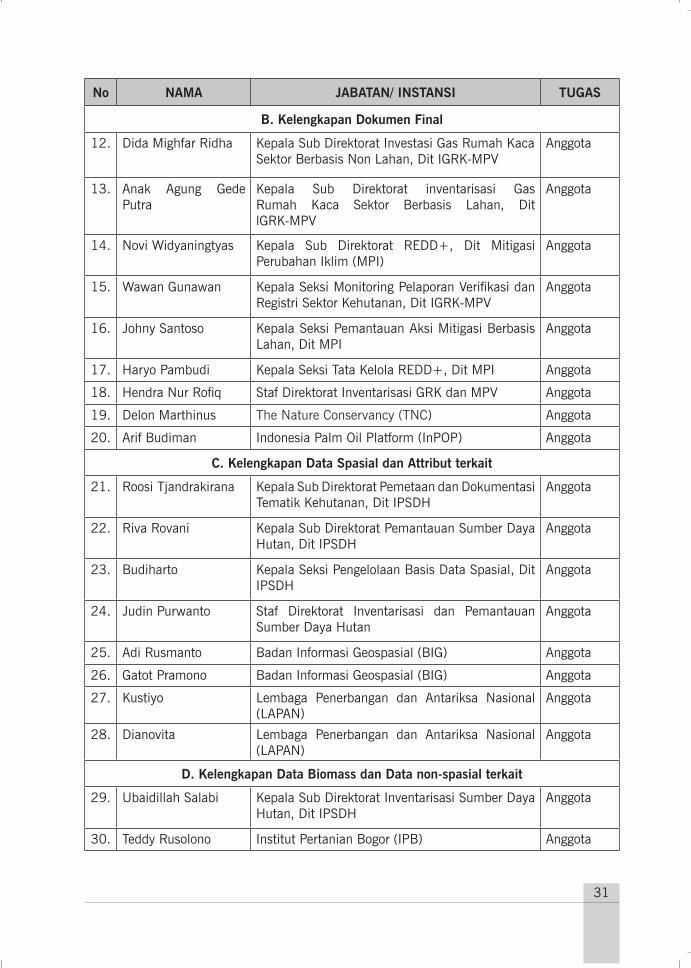
B. Kelengkapan Dokumen Final
12. Dida Mighfar Ridha Kepala Sub Direktorat Investasi Gas Rumah Kaca Sektor Berbasis Non Lahan, Dit IGRK-MPV
Anggota
13. Anak Agung Gede Putra
Kepala Sub Direktorat inventarisasi Gas Rumah Kaca Sektor Berbasis Lahan, Dit lGRK-MPV
Anggota
14. Novi Widyaningtyas Kepala Sub Direktorat REDD+, Dit Mitigasi Perubahan Iklim (MPI)
Anggota
15. Wawan Gunawan Kepala Seksi Monitoring Pelaporan Verifikasi dan Registri Sektor Kehutanan, Dit IGRK-MPV
Anggota
16. Johny Santoso Kepala Seksi Pemantauan Aksi Mitigasi Berbasis Lahan, Dit MPI
Anggota
17. Haryo Pambudi Kepala Seksi Tata Kelola REDD+, Dit MPI Anggota
18. Hendra Nur Rofiq Staf Direktorat Inventarisasi GRK dan MPV Anggota
19. Delon Marthinus The Nature Conservancy (TNC) Anggota
20. Arif Budiman Indonesia Palm Oil Platform (InPOP) Anggota
C. Kelengkapan Data Spasial dan Attribut terkait
21. Roosi Tjandrakirana Kepala Sub Direktorat Pemetaan dan Dokumentasi Tematik Kehutanan, Dit IPSDH
Anggota
22. Riva Rovani Kepala Sub Direktorat Pemantauan Sumber Daya Hutan, Dit IPSDH
Anggota
23. Budiharto Kepala Seksi Pengelolaan Basis Data Spasial, Dit IPSDH
Anggota
24. Judin Purwanto Staf Direktorat Inventarisasi dan Pemantauan Sumber Daya Hutan
Anggota
25. Adi Rusmanto Badan Informasi Geospasial (BIG) Anggota
26. Gatot Pramono Badan Informasi Geospasial (BIG) Anggota
27. Kustiyo Lembaga Penerbangan dan Antariksa Nasional (LAPAN)
Anggota
28. Dianovita Lembaga Penerbangan dan Antariksa Nasional (LAPAN)
Anggota
D. Kelengkapan Data Biomass dan Data non-spasial terkait
29. Ubaidillah Salabi Kepala Sub Direktorat Inventarisasi Sumber Daya Hutan, Dit IPSDH
Anggota
30. Teddy Rusolono Institut Pertanian Bogor (IPB) Anggota
32
No NAMA JABATAN/ INSTANSI TUGAS
31. M. Ardiansyah Institut Pertanian Bogor (IPB) Anggota
32. Haruni Krisnawati Pusat Penelitian dan Pengembangan Hutan Anggota
E. Kelengkapan Data dan Informasi khusus Gambut
33. Wayan Susi Dharmawan
Pusat Penelitian dan Pengembangan Hutan (KLHK)
Anggota
34. Fahmuddin Agus Balai Besar Sumber Daya Lahan Pertanian (BBSDLP) Kementerian Pertanian
Anggota
Ditetapkan di Jakartapada tanggal 10 Maret 2016
33
LAM
PIR
AN
NO
TA D
INA
S N
O:
TATA
WA
KTU
PELA
KSA
NA
AN
TEC
HN
ICAL
ASS
ESS
MEN
T FO
RES
T R
EFER
ENCE
EM
ISS
ION
LEV
EL I
ND
ON
ESI
A
No
Keg
iata
n (T
im A
sses
smen
t da
n Ti
m P
arty
)Ta
ngga
l (te
rmas
uk r
enta
ng)
Febr
uari
Mar
etA
pril
Mei
Juni
Juli
Agu
stus
Sept
embe
rO
ktob
erN
ovem
ber
12
34
12
34
12
34
12
34
12
34
12
34
12
34
12
34
12
34
12
34
1.
Pert
emua
n pe
ndah
ulua
n16 F
ebru
ari 2
016
2.
Dis
trib
usi S
KM
ingg
u ke
-em
pat
bula
n Fe
brua
ri
3.
Ren
cana
Ker
ja d
an p
engu
mpu
lan
data
/in
form
asi
3 w
eeks
4.
Dea
dlin
e fo
r da
ta/in
form
atio
n pr
epar
atio
n14 M
aret
2016
5.
Asse
ssm
ent
sess
ion
in B
onn
1 w
eek
(14
-18 M
aret
2016)
6.
See
king
add
ition
al c
larifi
ctio
ns f
rom
the
pa
rty
up t
o 1 w
eek
(21-2
8 M
aret
2016)
7.
Part
y to
pro
vide
cla
rific
atio
ns8 w
eeks
(29 M
aret
- 2
3
Mei
2016)
8.
Focu
s G
roup
Dis
cuss
ion
(ole
h pa
rty)
4 k
ali F
GD
9.
asse
ssm
ent
team
to
cons
ider
mod
ified
re
fere
nce
leve
l (ap
plic
able
in t
he c
ase
that
th
e pa
rty
mod
ifies
its
subm
itted
ref
eren
ce
leve
l)
4 w
eeks
(23 M
ei -
20 J
uni
2016)
betw
een
12 -
16 w
eeks
fo
llow
ing
the
asse
ssm
ent
10.
Ass
esm
ent
team
to
prep
are
draf
t re
port
sess
ion
in B
onn
(late
st 1
1
Juli
2016)
11.
Part
y to
res
pond
to
draf
t re
port
12 w
eeks
(la
test
3 o
ktob
er
2016)
12.
Focu
s G
roup
Dis
cuss
ion
(ole
h pa
rty)
4 k
ali F
GD
13.
Ass
esm
ent
team
to
prep
are
final
rep
ort
wit
hin
four
wee
ks f
ollo
win
g th
e Pa
rty's
re
spon
se
4 w
eeks
(la
test
1 N
ovem
ber
2016)
14.
Fina
l rep
ort
publ
ishe
d an
d te
chni
cal
asse
ssm
ent
com
plet
edla
test
21 N
ovem
ber
2016
34
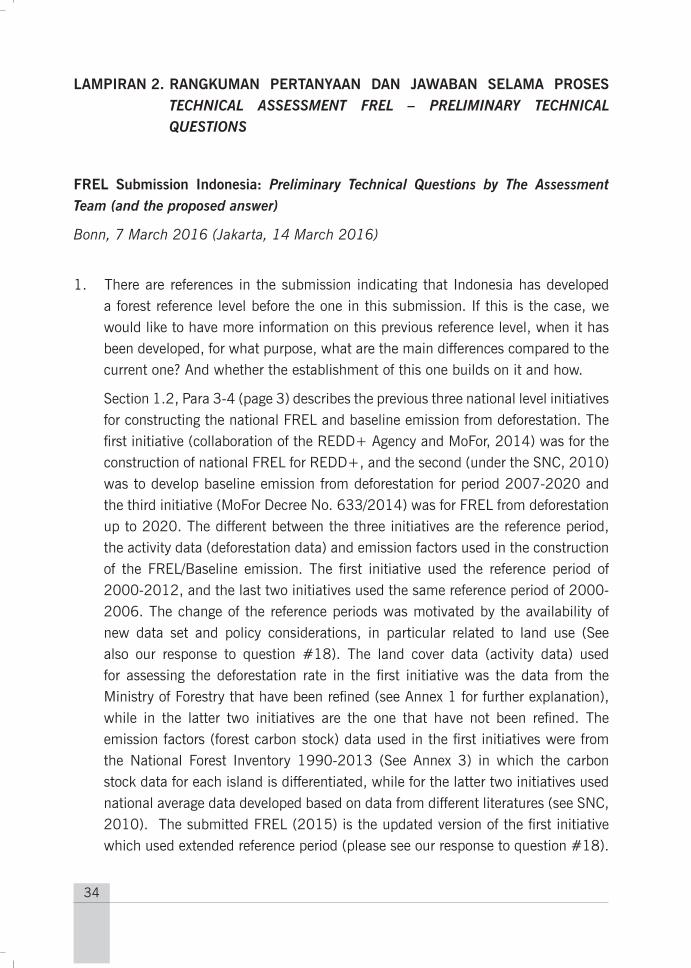
LAMPIRAN 2. RANGKUMAN PERTANYAAN DAN JAWABAN SELAMA PROSES TECHNICAL ASSESSMENT FREL – PRELIMINARY TECHNICAL QUESTIONS
FREL Submission Indonesia: Preliminary Technical Questions by The Assessment Team (and the proposed answer)
Bonn, 7 March 2016 (Jakarta, 14 March 2016)
1. There are references in the submission indicating that Indonesia has developed a forest reference level before the one in this submission. If this is the case, we would like to have more information on this previous reference level, when it has been developed, for what purpose, what are the main differences compared to the current one? And whether the establishment of this one builds on it and how.
Section 1.2, Para 3-4 (page 3) describes the previous three national level initiatives for constructing the national FREL and baseline emission from deforestation. The first initiative (collaboration of the REDD+ Agency and MoFor, 2014) was for the construction of national FREL for REDD+, and the second (under the SNC, 2010) was to develop baseline emission from deforestation for period 2007-2020 and the third initiative (MoFor Decree No. 633/2014) was for FREL from deforestation up to 2020. The different between the three initiatives are the reference period, the activity data (deforestation data) and emission factors used in the construction of the FREL/Baseline emission. The first initiative used the reference period of 2000-2012, and the last two initiatives used the same reference period of 2000-2006. The change of the reference periods was motivated by the availability of new data set and policy considerations, in particular related to land use (See also our response to question #18). The land cover data (activity data) used for assessing the deforestation rate in the first initiative was the data from the Ministry of Forestry that have been refined (see Annex 1 for further explanation), while in the latter two initiatives are the one that have not been refined. The emission factors (forest carbon stock) data used in the first initiatives were from the National Forest Inventory 1990-2013 (See Annex 3) in which the carbon stock data for each island is differentiated, while for the latter two initiatives used national average data developed based on data from different literatures (see SNC, 2010). The submitted FREL (2015) is the updated version of the first initiative which used extended reference period (please see our response to question #18).
35
More comprehensive text to explain the above information has been added in the updated FREL document.
2. What was the reasoning behind setting the reference period? It would be good to understand how the start date was chosen and how it can be justified that also the earlier years of the reference period are representative of expected land-use change trends in the near future?
In Section 1.4 Para 5, five scenarios have been exercised in setting the reference period. Those are also depending on data reliability and consistency of the date during the reference period (1990 to 2012) derived from NFMS. From this process, as elaborated in sub section 4.2.1, we concluded that the longest reference periods captured plausible dynamics of policy and social aspects, which provides opportunity to appropriately predict national circumstances affecting land use policy, for example: change of government regime, anthropogenic disaster and market demand for commodities (please see our response to question #18). Some text to better explain the reasons have been added.
3. Could Indonesia provide some information on whether the same data sources and methods used in the GHG inventory of the LULUCF sector have also been used for the development of this FREL?
As seen in Section 1.2 Para 3 (page 3), for this FREL submission we use the improved activity data and updated emission factor (see our response to question #1). MoEF has refined the land cover map over the last 24 years (1990 – 2014) as more satellite data become publicly available (please refer to annex 1, page 50 – 54). This land cover data was used for both FREL construction and the development of GHG Inventory prepared for the first BUR. In the development of GHG Inventory all activities occurred in the six land-use categories have been included, while in the FREL, we only calculated the emission from deforestation and forest degradation. The method used for calculating the emission follows the IPCC Methodology.
4. Regarding the calculation of uncertainties of emission factors in Annex 7, were the uncertainties for deforestation and forest degradation emission factors calculated from confidence intervals presented in Table 2 on page 16? If yes, how can it be explained that in all cases the percentage uncertainty for deforestation and for forest degradation are equal?
36
Yes, uncertainties of emission factors in what was Annex 7 (we inserted new annex as annex 7 to explain the SE, so that uncertainty would be in annex 8) were calculated from AGB stocks (with 95% confidence intervals) presented in re-arranged Table 2 (Page 16). The uncertainties of emission factor were generated from standard error (SE) of carbon stock values from every forest types/classes in each major island/group of island. Information on the SE has been added in the revised table 2 on the updated FREL document. In the updated FREL, uncertainties explained in annex 8.1 to 8.7 and in revised table 4. The uncertainty values were calculated from activity data as well as from emission factor (as seen in section 4.2.5. Para 2, page 22). Those numbers represent the average of SE that will reflect the difference of the uncertainty between the deforestation and forest degradation. These two uncertainties will be combined to reflect the uncertainty of the total historical emission from deforestation and forest degradation. Thank you for your observation, and we will carefully re-check the appropriate improvement before make it final.
5. How the forest definition was used is not very clear. The submission states that the definition of the MoFor is relevant because it was made for CDM purposes, but then in the next para it is stated that the definition used for reporting to FAO, which is different from the MoFor one, has been, for the purpose of this submission, adjusted to the country natural tropical forest ecosystems, excluding other tree covers and wood land areas. Please clarify whether the two definitions have been used, how and whether the definition used is different from the one used for the national GHG inventory of the LULUCF sector reported in National communications, and give more rationale on how and why the used definition is chosen from the different available definitions.
Many forest definitions have been introduced in the submitted FREL for giving an overview in how the forests have been defined for many purposes. Yet, not all definition is practicable. Forest definitions that used in SNC and BUR included Natural Forests (Primary and Secondary Forests) and Plantation Forest, but in the submitted FREL we only include Natural Forests (Primary and Secondary Forest), and excluded the plantation forest. CDM definition was used by the Ministry of Forestry for the purpose of defining criteria (threshold) for defining forests. Since in this submitted FREL the forest being considered was only natural forest, the criteria only apply for natural forest. So in the case of there is a land that covered by trees (i.e. plantation forest) but not natural forest would not be considered as a forest.
37
Refer to section 1.2. General Approach, this FREL does not only merely apply TACCC concepts, but also considers concept of “practicality” and cost effectiveness especially in measuring the REDD+ performance in the future. Practicality means that definition employed need to refer to operational processes, which related to data availability and reliability. The definition call up here leads to what we named working definition. In order to give more comprehensive information on definition used, we added some boxes in the updated document, in which each of the box explains the existing renowned definition, and how it is connected to what we mean in the FREL document.
6. The definition of deforestation of the MoFor is consistent with FAO and IPCC. What is the rationale for the Party to make (chose) another definition of deforestation for the purpose of this submission, which as in sections 2.2, reads “In this submission, deforestation was defined as a conversion of natural forest cover into other land-cover categories that has only occurred one time in particular areas. While the definition of MoFor in the same para reads “The Minister of Forestry No. 30/2009 that stated deforestation as the permanent alteration from forested area into a non-forested area as a result of human activities (MoFor, 2009)”. Please explain what is the difference, what is meant by “other land-cover categories”, does it also include forests?
As referring to our response to question #5, we have clarified forests definition used in the submitted FREL. As described in section 2.2. (Page 6), in this submission the deforestation only refers to the conversion of natural forest cover into non-forested lands. In most cases in Indonesia, when natural forest has been changed into non-forested lands, they rarely grow back into natural forest. Other land-cover categories in our definition are non-forest class plus plantation forest. Non-forest class includes crop, agriculture, shrub, savanna and grasses; paddy field, transmigration areas, settlement areas, port & harbor, mining areas, and bare lands (Refer to Table Annex 1.1 page 50). In the case of The Minister of Forestry No. 30/2009, “deforestation as the permanent alteration from forested area into a non-forested area as a result of human activities”, refers to natural forest and plantation forest. The box for forest and deforestation respectively, have been added in the updated FREL document.
38
7. What does it mean in practice that section 2.2 explains that deforestation “has only occurred one time in particular areas”? It would be good to understand how the measurement approach accounts for the case that the same location loses tree cover more than once during the reference period. For example, how about the case that a specific location had forest cover in 1990, is deforestation in 1997, regrows in 2001 and again loses forest cover in 2007?
Does the approach count this same area as deforested twice (namely in 1997 and in 2007)?
The deforestation in this submission estimated emission from gross deforestation of natural forest or loss of natural forest at one particular time at particular area. This means that the deforested area that might regenerate and meet again the forest definition was not taken into account in the calculation of the emission. As previously mentioned in our response to question #6, in most cases in Indonesia, when natural forest has been changed into non forested land, they rarely grow back into natural forest. The box for forest and deforestation respectively, have been added in the updated FREL document.
8. How is temporary unstocking dealt with and the carbon removals in subsequent regeneration?
Section 2 explains that deforestation also includes conversion of secondary forest to non-forest. Secondary forest seems to include both regeneration after temporary unstocking and also forests that suffered from selective logging but did not undergo unstocking. For the former case of conversion from regeneration forest to non-forest - would you agree that carbon emission in this process are matched by carbon removals in the preceding regeneration process? What was the rationale for not including the regeneration process in the scope of the reference level?
See our response to questions #6 and #7. As we defined above, the intention of Indonesia submission is to develop reference emission level only from the change of natural forest into other land categories, and from the change of primary forest into secondary forest (log-over forest; see also section 4.2.3. para 2). Please also noted that the class named secondary forest is a class that represents only remaining forest that suffered from selective logging, not refers to regeneration areas after temporary unstocking (See table Annex 1.1 for land cover class definition). Emission from further degradation of secondary forest was not included in the construction of FREL, as at present we do not have good data available
39
to assess the further degradation occurring in the secondary forest. This is one of the areas for improvement in the next FREL submission (see section 7.5). In the current submission Indonesian objective to submit the FREL is to evaluate Indonesian performance for reducing emission from the deforestation of natural forest and from degradation of the natural forest (loss of carbon stock from primary to secondary forest, as elaborated in class description in Annex 1). See also our added explanation for box of forest, deforestation and forest degradation: definition and understanding, respectively, in the updated FREL document.
9. Can you explain how the forest types and the occurrence of peatlands relate to the occurrence of mineral / organic soils? Some of the listed forest types in Table 1 seem to imply that they occur on organic soils: notably swamp forests and possibly mangroves. Others seem to imply that they occur on mineral soil: notably dryland forests. The calculations, however, seem to also identify organic soils under dryland forests and mineral soils under swamp forests. Related to this, the Table Annex 6.1 and Annex 6.2 show some transitions that are hard to imagine. How can there be transition from dryland forest to swamps, for example?
Table annexes 6.1 and 6.2 actually presenting the emission from peat decomposition, not presenting emission from land-use transition. This issue appears due to the use of two independent data sets, in this case (a) land cover data as elaborated in table Annex 1.1, and (b) peatland data set as elaborated in section 2.4 and Annex 2. During the calculation of emission from peat decomposition, the process of spatial overlaying between those two data sets resulted in what named “sliver” areas. These sliver areas, might be recognized as dryland within peat lands. The algorithm we used here: in the case of sliver areas is the dryland within the peat lands, we consider that area as a peat; while in the case of sliver area is within swamp forest outside the peat land, we consider that area as fresh water swamp (no peat). So, with this algorithm it is possible emission estimates appear in cell representing transition from dryland to swamp. Thank you for your observation, we will enhance the clarity on this issue in the final revised version, including explains the concept of custodian data under the One-Map Policy (as a background situation) in additional annex.
40
Questions on section 3: Areas and Activities Covered
10. Section 3.1: It is not clear why non-natural-forested peatland are excluded from the FREL. Wouldn’t they also be subjected to human activities resulting in emissions and removals and most likely have better records of data to estimate their gains and losses? There is a need to maintain consistency with national GHGs inventory in developing the FREL, please explain why this land type was excluded here but is included in the LULUCF inventory of the NC and BUR.
In the construction of FREL we did include non-natural forested peatland which was deforested in 1990 since we have to calculate the inherited emission come from peat soil of deforested peat land occurred in 1990. Thus, we only excluded the peat decomposition from non-natural forested peatland which already existed before 1990 (see area covered in section 3.1. Para 1 page 9). In the case of secondary forest, we calculated peat decomposition for all area across Indonesia as the secondary forest that already existed in 1990 is considered as disturbed natural forest. In the calculation of emission from LULUCF inventory in SNC and BUR, both emissions from non-natural forest and natural forested peatland are included. As already mention before the intention of submitted FREL for REDD+ in Indonesia is confined in natural forest exist from 1990 only.
11. In section 3.2 it is stated “The data of deforestation and forest degradation from available monitoring system are methodologically consistent, which is important in the FREL development process.” What is meant by consistency here? Is the same data also used in the national forest inventory in the national communication?
This FREL submission employs nation-wide land cover data set which was generated using the same methods/approaches since the establishments of land cover data sets from 1990s up to now (see Annex 1). The activity data for deforestation and forest degradation is part of national forest inventory, and has been used in the national communication, though some data adjustment has been done to match the current technology, as explained in Annex 1 para 6 and para 8.
12. In section 3.2 it is also stated “Despite the availability of long time-series of activity data at national level, data on carbon sequestration is very limited and scarce.” Please clarify, when there is long time-series of activity data, does it not include also the parameter necessary for estimating carbon stock change? What data is missing that led to Indonesia’s decision to exclude the other REDD+ activities?
41
Given the availability of long time series land cover data, this submission focused on the emission from deforestation and forest degradation. Besides, we have limited data on carbon sequestration across land cover types in Indonesia. So in this case, as seen in Chapter 7, we described the plan for improving our estimate to include the other REDD+ activities.
13. What was the thinking behind not including carbon stock enhancement in standing forests (opposite of forest degradation)? Forest degradation is included and quantified as corresponding to the change from primary forest to secondary forest. The inverse change is not included. It seems, though, that the exact same data sources being used to quantify change from primary to secondary forest could also be used to quantify change from secondary forest to primary forest. Is this correct?
See our response to question #5-7.
14. How were land-use change areas measured and calculated? Do we understand correctly that (a) the satellite images from the individual time points were interpreted separately to generate separate land-use maps, and (b) land-use change areas were calculated from overlaying these maps, i.e., area classified as primary forest in an earlier map and as secondary forest in a later map are degradation areas?
Thank you for your clarification, we agree to your comments as we did similar sequential processes as you mentioned.
15. Could Indonesia provide more detail on some emission factors and activity data? Could you please provide a table with the emission factors applied for deforestation and forest degradation next to their standard deviations? We had difficulties to locate the peatland EF provided in Table 3 of Indonesia’s FREL submission in the IPCC guidelines. Could you provide the exact in-document references for the emission factors used? Information provided in Annex 6 implies that full land-use change matrices are available. Could you provide us with the full land-use change matrices showing hectare estimates across the reference period?
Yes, certainly we could. We provide the complete emission factors for each forest cover type as seen in the updated table 2 (04_160321_EF_SE_Rearrange_Table_2.xlsx specific for Supplementary Table 1) and Annex 7 (table annex 7.1 and annex 7.2). We also provide the complete land cover transition matrices from 1990 to
42
2012 within peat land only, in the Supplementary Table 3 to 9 (01_160321_FREL_INDONESIA_all_data_calculation.xlsx). Small slivers may occur due to spatial overlaying process as explained in our response related to #9. The updated table Annex 6.1 and 6.2 as found in 03_160321_Explanation_Table_for_Annex_6.xlsx) are explained only the “transition emission factors”, not the “transition emission matrix” (rephrased table title). For the peat emission factors, we actually produced the figure from the document “2013 supplement to the IPCC 2006 Guidelines for National GHG Inventory: Wetlands (2014)”. We rephrase all reference from Hiraishi, et al. (2014) to IPCC (2014) as appropriate. Please noted, that all excel files that too complicated to be inserted into the document, would be assigned as supplementary document and only provided during the process of technical assessment.
16. What is the methodology to figure out whether deforestation and forest degradation also lead to emissions from peat decomposition? Do we understand correctly that such emissions are calculated for all areas with deforestation or forest degradation that occur on peatlands without a distinction between areas with and without drainage?
The methodology for estimating emission from peat decomposition in the deforested areas and degraded forest is simply by multiplying the area of the deforested and degraded forest with emission factors for the associated classes (see Section 4.2.4. page 21). The emission factors used are taken from the document “2013 supplement to the IPCC 2006 Guidelines for National GHG Inventory: Wetlands (2014)”. The emission factors reported in the supplement guideline are mostly derived from Indonesia’s peat researches publications/articles. Some of the articles clearly mention the status of water management for each land cover type (with and without drainage) (See Table 3 in Section 4.1.4 page 18). Most of the manage lands such as plantation forest, and estate crops, mixed dry agriculture are drained since without drainage the crop/trees cannot grow.
17. For which timeframes are the peatland emission factors designed? Emissions could not occur indefinitely but eventually a new equilibrium will be attained. The submission considers potentially timeframes of up to 30 years in the extreme case, since the cumulative approach is also taken in Table 5 on page 31 up to 2020. Related to this, how does the measurement approach account for the possibility that much could happen on post-conversion lands during such a long-time frame that would change the emission profile?
43
We constructed the FREL only up to the 2020, so does the peat land emission factor. The peat is being predicted would be remaining up to the period of 2020. We are aware that the emissions from peat decomposition are not indefinite and will not cover the same magnitude for each decomposition period. However, at the time of analysis we have limited reliable information on peat thickness and peat fire depth which is required to predict the period when peatland will be completely decomposed. This submission does not design maximum eriod of peat decomposition emission. Inherited emissions from previous activities occurs within subsequent land cover (e.g. Agus et al., 2011), so that the total emission from peat decomposition is the accumulation of peat emissions from 1990 onward. Emissions from peat decomposition are from areas of peat that experiencing deforestation and forest degradation activities. The peat decomposition from degraded forest was calculated not only from forest which degraded since 1990 but also degraded forest which already exists in 1990 (as seen in Page 30 Para 1).
18. Section 6 gives general description of the historical and current legal and policy framework, but it does not describe how these have been taken into consideration in the construction of the FREL, and also it does not provide information on further changes to domestic policies and how these are considered in the construction of the FREL. Could you elaborate a bit further on this?
Section 6 described policies and plans with intention to provide information on their implications to the constructed forest reference emission level (FREL). These policies and plans were used in determining the reference period for the construction of FREL. Section 6.1 describes briefly about the categorization of Indonesian by forest functions and illustrates the land use planning process that synchronizes between national forest land-use map called TGHK (for administer state forest) and provincial spatial planning. This policy was initiated due to the fact that many development areas at provinces were not consistent with the TGHK due to the absence of clear forest boundaries. Many developed area occurred in the forest areas (conservation, protection and production). The forest area that can be used for development is only HPK (convertible production forest) in which local government has to submit proposal to Ministry of Environment and Forestry to release the HPK to become non-forest area (APL; see page 44-paragraph 2). Further, sub-section 6.2 illustrates the policy dynamic on land uses between government regimes. Changes of development policies under new government may have significant effect on land use policies. Demand for releasing forest area
44
for the development would change significantly under the different government regime. At present there are about 14.72 million ha of natural forest located in HPK (7.24 Mha) and APL (7.48 Mha, see Page 46-paragraph 2) in which by regulation the forests would be subject to deforestation in the future. However, it is also difficult to assess when these natural forest (both APL and HPK) will be finally all used for the development. On the other hand unplanned deforestation (deforestation that took place in permanent forest area) might continue to occur due to various illegal activities with different rates. Efforts for reducing and stopping unplanned deforestation have been implemented. Section 6.3 describes briefly main policies intervention to reduce the deforestation. Considering the complexity of factors causing deforestation in Indonesia and difficulties to assess the impact of changing policies between the government regimes, Indonesia used long reference period (1990-2012) with simple average of historical emissions in constructing the FREL. This is to allow capturing well the impact of policy dynamics across different government regimes on land uses in Indonesia. This is also one of the motivations hy under the current submission the reference period is extended to 1990-2012. We would add some of the above text with appropriate explanation to fit in the updated FREL documents.
FREL Submission Indonesia: 2nd set of technical questions by the assessment team
Bonn, 15 March 2016 (Jakarta, 18 March 2016)
General
19. Can you please clarify which version of the IPCC guidelines was used in the submission?
“The IPCC Guideline 2006” and “2013 supplement to the 2006 IPCC Guidelines for National GHG Inventory: Wetlands (2014)” – for drained organic soils emission factors. For emission factor from deforestation and forest degradation, Tier-2 EF was mainly used in the analysis. We noticed that some important reference was not listed in the references. Thank you for your observation.
20. The submission does not provide any information about policies relating to the causes of deforestation and forest degradation such as agriculture, energy consumption, timber use or trading, etc. Can Indonesia please clarify whether these have been considered in the construction of the FREL?
45
Although addressing drivers of DD is one of the ultimate goals for REDD+ initiative, this FREL submission focused to project future land based CO2 emission which can be used as a baseline for crediting baseline or carbon payments. We recognized the necessity to include different policies, such as policy against illegal logging, reducing deforestation, etc., which should be better explained in the submission, to highlight the impact of these policies in future emissions projection. Yet, the causes of DD have been considered in the construction of FREL. There was no specific quantitative calculation of DD drivers in the document, since the DD drivers are very complex, involving cross cutting issues among policy, economic growth, population growth and sectors, as well as requires appropriate data sets and research outputs to support. Yet, some specific qualitative information has been elaborated, as expressed in Chapter 2, Section 2.2 and 2.3, as well as expressed in the table 1.1 (Annex 1) for each LC class description; Chapter 5 Sub-section 5.1.1 specific for drivers of deforestation, and Sub-section 5.1.2 for forest degradation. Chapter 6 Section 6.1 describes the past conditions (referring to the several published documents such as IFCA (2008), RKTN (National Forestry Planning), etc.) that were affecting the DD drivers; and Section 6.2, explains trend that may influence the DD drivers, as well as illustrating future potential risks for DD. Deforestation and forest degradation.
21. What are the methodologies, assumptions and parameters used to identify forest degradation from remote sensing data? Can you provide a step-by-step explanation in order to demonstrate the methodology?
We did not automatically generate the degraded forest class (secondary forest) based on the pixel value from satellite imagery. We employed a visual manual classification method that based on image interpretation techniques (Section 4.1.1.). Reason why we did this has been explained during the March 15 teleconference. Step-by-step explanation to demonstrate the methodology for classification can be seen in Annex 1 and Margono et al (2015). As elaborated in the Annex 1, the land cover (LC) data is a series (T1 to Tx), and we generated the degraded forest by comparing the LC of T1 (class of primary forests) to the LC of T2 (becoming class of secondary forests). The assumption we made for this method is that a change from primary forests to secondary forest usually occurs because of subtle to excessive disturbances to the primary forest due to logging operation (legal and illegal) and other activities, without causing deforestation. We added some appropriate texts to explain the steps above carefully in the updated FREL document.
46
22. Is the national forest monitoring system also able to monitor deforested and degraded land areas and the carbon stock changes on them?
Yes and No. Yes, if we considered that the NFMS and NFI as an integrated system for forest resource monitoring system. No, as the NFMS actually is not directly capture the carbon stock change. It is an indirect carbon stock change monitoring system; since we estimated the emission of DD from the activity data (AD) generated from NFMS and multiplied by emission factor (EF) from the NFI (or some other additional sources). Following our 16 March teleconference for EF, please refers to Table 2 (Section 4.1.3.) and Annex 3 (Documentation and specification of the forest carbon stock data) to explore the EF calculation. Further, please also note that the NFMS (as well as the NFI) is the official system in the country, which used for day-by-day (operational) monitoring system since 1990s, and is not specifically established for carbon monitoring and the construction of FREL.
23. Can Indonesia please provide further information on the wood density (WD) values used for the construction of the FREL?
Wood density values have been used as one of key parameters to estimate AGB for each individual tree in the forest inventory plots (in addition to diameter at breast height (DBH)). The WD values were taken from the database of the Ministry of Environment and Forestry (through the Research, Development and Innovation Agency) which is a compendium of WD data for Indonesian tree species. The database provides information on WD data by species, genus, and family. It also helps in filling and locating the information on botanical name of the species not available in the inventory plots. [Often, nly local species name was available for the individual tree in the plots]. We added the text of WD in the document. Soil organic carbon
24. During the call it was pointed out that there is insufficient data available for the inclusion of changes in soil organic carbon on mineral soils in the FREL. Can you provide some information on what exactly the data gaps are? The IPCC tier 1 approach would allow to employ default stock change factors that can be fixed using information on management systems in cropland and grasslands. To which extent could these be available?
Soil organic carbon of each land cover category/forest cover type has high variability. In the case of the forests were disturbed, either due to forest fire, heavily logged, or
47
land subsidence, it becomes more challenging to estimate the soil organic matters. We are aware that some spotted local studies are available, but given high variability of the carbon stocks across main Islands in Indonesia (e.g. Sumatera, Kalimantan, etc.), it is decided to exclude this carbon pool in the current submission. We are aware that we could estimate soil organic content using default EF value of IPCC Guidelines (Tier 1). However, our observation has shown that this will create biased estimate, especially for rich and complex tropical ecosystem in Indonesia.
25. Please help us understand the methodologies and assumptions for calculation emissions from peatland decomposition on all areas of deforestation and forest degradation. We went back to the 2013 Wetland Supplement, and it seems to refer to “drained organic soils”. Is this the correct reference?
Yes, we confirm that estimation of peatland decomposition refers mainly to “2013 supplement to the 2006 IPCC Guidelines for National GHG Inventory: Wetlands (2014)”, especially the section of drained inland organic soils.
26. Could you please provide the exact page number for the emission factors within the 2013 wetlands supplement?
2013 supplement to the 2006 IPCC Guidelines for National GHG Inventory: Wetlands (2014), Table 2.1. Page 2.11 – 2.15, numbers in the table were multiplied by 3.67 to get CO2eq.
27. The emissions from peatland decomposition are applied also for many years after the actual conversion event (e.g., deforestation) took place. During such long time frames, much could happen on these lands. Lands could recover, be converted to different land use types, regenerate, peatlands could be rewetted. All of such events would change the emissions profile. Will data be collected to track deforested peatlands across the years and decades after the conversion? Given the long time periods of land use change, would such data already available?
We approach the estimate of peat decomposition emission by investigating the initial land cover and the subsequent land cover types. For example, if in 1990 there was primary peat forest which was converted to shrub in 1996, we used mean EF (i.e. primary peat forest and shrub on peat) in the earlier and latter period (following the 2013 IPCC Table) to estimate the peat emissions. Subsequently, if the area was then converted to oil palm in 2000, mean EF of shrub and oil palm

48
was used to estimate peat decomposition emission between 1996 and 2000. This is actually our approach to capture the dynamic of peat decomposition emissions over the period of analysis. Land use change matrix
28. A set of land-use change matrices were provided in response to earlier questions, which is very useful for understanding the structure of the data. From these, we extracted the totals for all land-cover categories across the seven time points. We found that totals of all land cover categories in years 2006 and 2009 to be identical. Could you explain what happened there?
For example:
Year PF SF PMF SMF PSF SSF TP
2006 386,317 329,980 240,644 89,486 2,342,518 4,569,680 160,272
2009 386,317 329,980 240,644 89,486 2,342,518 4,569,680 160,272
We admit that the supplementary tables 3-9 (01_160321_FREL_Indonesia_All_Data_Calculation.xls) need to be re-checked and revised. We admit, that minor mistake may occur, in this case, the minor mistake was on the “total” number within the supplementary table; though the other numbers are correct. Thank you for your observation.
29. The set of category totals across the years also shows several discontinuities between the years 2009 and 2011. For example SSF area decreases from 4.6m ha to 3.7m ha. We assume that this is somehow related to the changes in methodologies that the submission text discusses. Could you provide more explanation on this point? What is your assessment of the impact of such discontinuity on the estimates of deforestation and forest degradation?
This is the effect of unnecessary minor mistake calculation within total number of one of the supplementary tables. Thank you for your observation, we will recheck and revise it before make it final document. Uncertainty analysis
30. A table with EF and their uncertainties was provided that is very useful. It seems to suggest that the lower bound of the 95% confidence intervals was calculated as mean - SE * mean. It would appear that the calculation of a 95% confidence interval would also need to use a t-value (e.g., t=1.96 or similar). Can you explain?
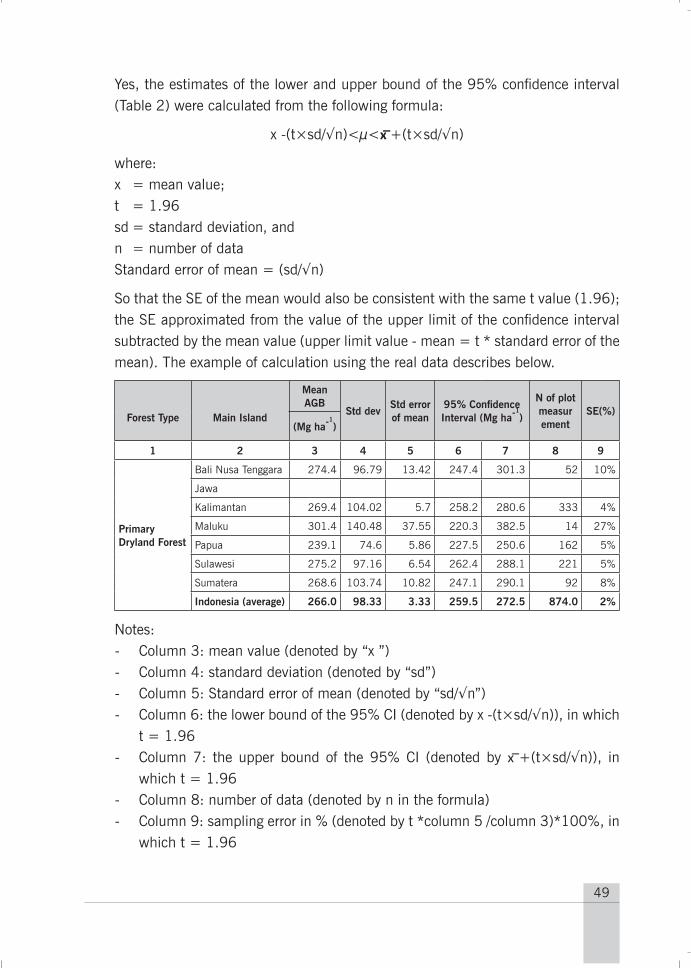
49
Yes, the estimates of the lower and upper bound of the 95% confidence interval (Table 2) were calculated from the following formula:
x -(t×sd/√n)<μ<x ̅+(t×sd/√n)
where: x = mean value; t = 1.96 sd = standard deviation, and n = number of dataStandard error of mean = (sd/√n)
So that the SE of the mean would also be consistent with the same t value (1.96); the SE approximated from the value of the upper limit of the confidence interval subtracted by the mean value (upper limit value - mean = t * standard error of the mean). The example of calculation using the real data describes below.
Forest Type Main Island
Mean AGB
Std devStd error of mean
95% ConfidenceInterval (Mg ha-1
)
N of plot measur ement
SE(%)(Mg ha-1
)
1 2 3 4 5 6 7 8 9
Primary Dryland Forest
Bali Nusa Tenggara 274.4 96.79 13.42 247.4 301.3 52 10%
Jawa
Kalimantan 269.4 104.02 5.7 258.2 280.6 333 4%
Maluku 301.4 140.48 37.55 220.3 382.5 14 27%
Papua 239.1 74.6 5.86 227.5 250.6 162 5%
Sulawesi 275.2 97.16 6.54 262.4 288.1 221 5%
Sumatera 268.6 103.74 10.82 247.1 290.1 92 8%
Indonesia (average) 266.0 98.33 3.33 259.5 272.5 874.0 2%
Notes:- Column 3: mean value (denoted by “x ”)- Column 4: standard deviation (denoted by “sd”)- Column 5: Standard error of mean (denoted by “sd/√n”)- Column 6: the lower bound of the 95% CI (denoted by x -(t×sd/√n)), in which
t = 1.96- Column 7: the upper bound of the 95% CI (denoted by x ̅+(t×sd/√n)), in
which t = 1.96- Column 8: number of data (denoted by n in the formula)- Column 9: sampling error in % (denoted by t *column 5 /column 3)*100%, in
which t = 1.96
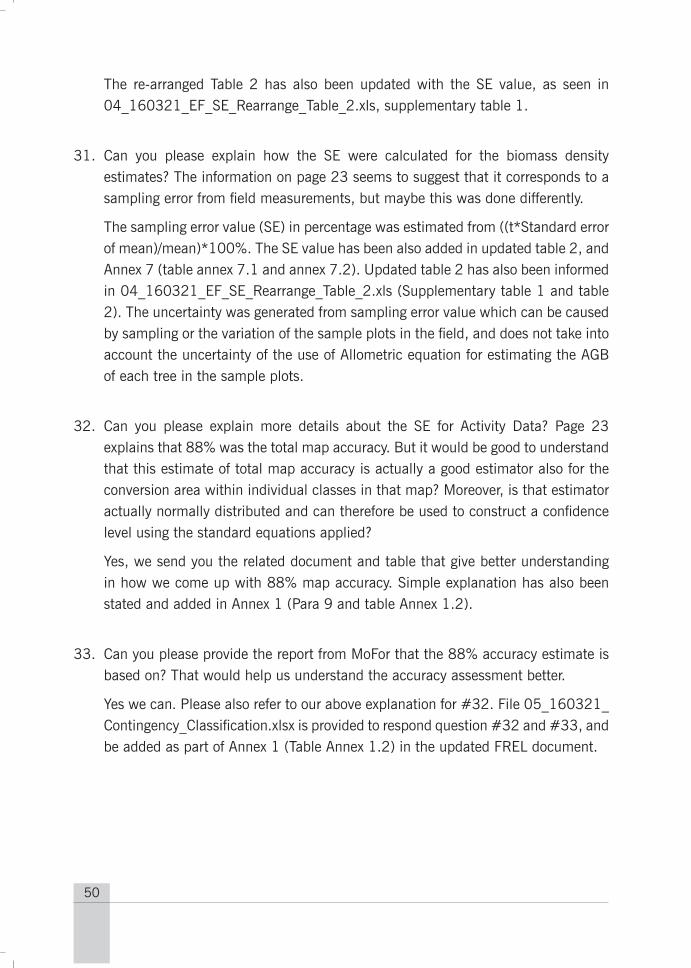
50
The re-arranged Table 2 has also been updated with the SE value, as seen in 04_160321_EF_SE_Rearrange_Table_2.xls, supplementary table 1.
31. Can you please explain how the SE were calculated for the biomass density estimates? The information on page 23 seems to suggest that it corresponds to a sampling error from field measurements, but maybe this was done differently.
The sampling error value (SE) in percentage was estimated from ((t*Standard error of mean)/mean)*100%. The SE value has been also added in updated table 2, and Annex 7 (table annex 7.1 and annex 7.2). Updated table 2 has also been informed in 04_160321_EF_SE_Rearrange_Table_2.xls (Supplementary table 1 and table 2). The uncertainty was generated from sampling error value which can be caused by sampling or the variation of the sample plots in the field, and does not take into account the uncertainty of the use of Allometric equation for estimating the AGB of each tree in the sample plots.
32. Can you please explain more details about the SE for Activity Data? Page 23 explains that 88% was the total map accuracy. But it would be good to understand that this estimate of total map accuracy is actually a good estimator also for the conversion area within individual classes in that map? Moreover, is that estimator actually normally distributed and can therefore be used to construct a confidence level using the standard equations applied?
Yes, we send you the related document and table that give better understanding in how we come up with 88% map accuracy. Simple explanation has also been stated and added in Annex 1 (Para 9 and table Annex 1.2).
33. Can you please provide the report from MoFor that the 88% accuracy estimate is based on? That would help us understand the accuracy assessment better.
Yes we can. Please also refer to our above explanation for #32. File 05_160321_Contingency_Classification.xlsx is provided to respond question #32 and #33, and be added as part of Annex 1 (Table Annex 1.2) in the updated FREL document.
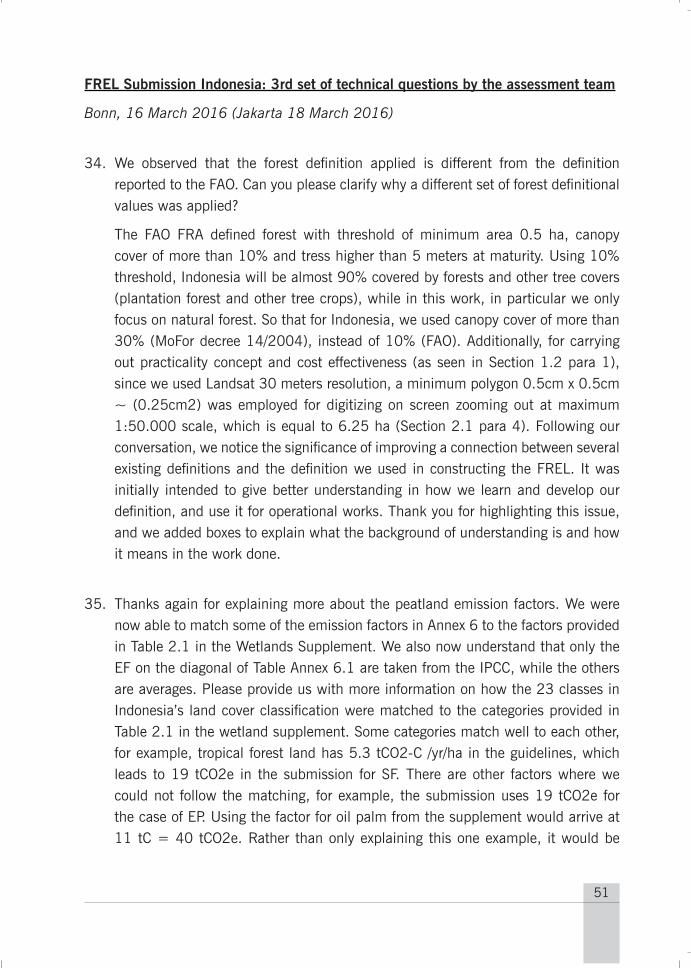
51
FREL Submission Indonesia: 3rd set of technical questions by the assessment team
Bonn, 16 March 2016 (Jakarta 18 March 2016)
34. We observed that the forest definition applied is different from the definition reported to the FAO. Can you please clarify why a different set of forest definitional values was applied?
The FAO FRA defined forest with threshold of minimum area 0.5 ha, canopy cover of more than 10% and tress higher than 5 meters at maturity. Using 10% threshold, Indonesia will be almost 90% covered by forests and other tree covers (plantation forest and other tree crops), while in this work, in particular we only focus on natural forest. So that for Indonesia, we used canopy cover of more than 30% (MoFor decree 14/2004), instead of 10% (FAO). Additionally, for carrying out practicality concept and cost effectiveness (as seen in Section 1.2 para 1), since we used Landsat 30 meters resolution, a minimum polygon 0.5cm x 0.5cm ~ (0.25cm2) was employed for digitizing on screen zooming out at maximum 1:50.000 scale, which is equal to 6.25 ha (Section 2.1 para 4). Following our conversation, we notice the significance of improving a connection between several existing definitions and the definition we used in constructing the FREL. It was initially intended to give better understanding in how we learn and develop our definition, and use it for operational works. Thank you for highlighting this issue, and we added boxes to explain what the background of understanding is and how it means in the work done.
35. Thanks again for explaining more about the peatland emission factors. We were now able to match some of the emission factors in Annex 6 to the factors provided in Table 2.1 in the Wetlands Supplement. We also now understand that only the EF on the diagonal of Table Annex 6.1 are taken from the IPCC, while the others are averages. Please provide us with more information on how the 23 classes in Indonesia’s land cover classification were matched to the categories provided in Table 2.1 in the wetland supplement. Some categories match well to each other, for example, tropical forest land has 5.3 tCO2-C /yr/ha in the guidelines, which leads to 19 tCO2e in the submission for SF. There are other factors where we could not follow the matching, for example, the submission uses 19 tCO2e for the case of EP. Using the factor for oil palm from the supplement would arrive at 11 tC = 40 tCO2e. Rather than only explaining this one example, it would be
52
useful if Indonesia provided a table that matches each of Indonesia’s 22 land use categories against the categories in the Table 2.1 in the Wetlands Supplement. We need to rephrase the Annex 6 (including Table Annex 6.1), as we noticed that some misunderstandings were occurred due to our short simple explanation. The Annex 6 was actually constructed to explain our logical thinking in estimating peat decomposition; we did rephrase it (text in file 02_160321_explanation_for_annex_6.docx and matrixes in file 03_160321_explanation_table_for_Annex_6.xlsx to), yet we may need more time to complete, as a careful scrutiny is necessary to avoid misunderstanding.
36. During the call it was clarified that the calculations apply the peatland emission factors from Annex 6 not only according to the land cover immediately after the deforestation or forest degradation events, but that at each mapping interval, the land cover is re-evaluated to choose the right peatland emission factor. Can you please confirm again that we understood correctly?
Yes, you have understood the situation correctly. The available land cover data (AD) has an uneven year interval (e.g. 1990-1996, and 1996-2000) in its nature. We considered the importance of re-evaluating the land cover change for each time interval (1990-1996, 1996-2000, etc.), by averaging the EF based on the land cover type of each time interval (please also refer to our response to Question 27), to capture all changes on water level variation during the time interval. Considerably, we did not deal with an immediate change but gradual or subtle change within each mapping interval. We will add related text considerably before make the document final.
37. What does Indonesia consider priority areas for capacity building to contribute to the improvement of future work on the reference level?
There are some obstacles occurred during the construction of FREL, due to several factors including the limited data, lack of technology used, limited researches, etc. However, we consider that the most important areas for improvement would be to reduce uncertainty of peat fire emissions, inclusion of other carbon pools (i.e. dead wood, below ground biomass, litter and soil organic carbon) and to elaborate other three REDD+ activities (i.e. forest conservation, enhancement of forest carbon stocks and sustainable management of forest).
53
FREL Submission Indonesia: 4th set of technical questions by the assessment team
Bonn, 17 March 2016 (Jakarta 21 March 2016)
38. Please provide us with a table that lists for each of the years in the reference period 1990-2012 the emissions that occur in the three activities. This is essentially the data shown in Figure 11, but we hope to receive this in a tabular format.
The table has been provided in the file (01_160321_FREL_Indonesia_All_Data_Calculation.xls), which has been delivered just after the week of teleconference.
39. Please provide full regression statistics for the projection of peatland emissions described on page 30. This would include a scatterplot of observations with a trend line and including a residual plot, and including regression coefficients with standard errors.
The graphs/figures have been provided in the file (01_160321_FREL_Indonesia_All_Data_Calculation.xls), which has also been delivered just after the week of teleconference.
40. Please provide a table with all emission factors that were used for estimating emission from deforestation and forest degradation. At the moment, the submission only includes biomass densities that these derive from. Please also provide the set of other more generic emission factors, e.g., carbon content in biomass, ratio of molecular weights, etc. that were used.
The table has been provided in the file (04_160321_EF_SE_Rearrange_Table_2.xls). This table also completed the question #15, #30 and #31.
41. Please provide the activity data that were used to construct the FREL for peatland. If we understand the approach well, this includes information for each year in 1990-2012. The information would include area estimates of deforestation and forest degradation in the 22 land use / land cover classes that fall on peatlands.
The data has been provided in the attached file (01_160321_FREL_Indonesia_All_Data_Calculation.xls). The land cover change matrices from 1990 – 2012 that located in peat land are presented in respective worksheets. This table also completed the question #15.
54
42. We are thinking of such data as actually introducing more detail into the 22 land use / land cover classes that are being used. In effect, it is necessary to distinguish for each class based on whether it falls on peatlands or not. So, effectively, we are looking at 44 land use/ land cover classes then. Can you confirm this?
Yes, we confirm your clarification. The data can be found in the file (01_160321_FREL_Indonesia_All_Data_Calculation.xls), which has been delivered just after the week of teleconference. The land cover change matrices from 1990 – 2012 that located in peat land are presented in respective worksheets.
Additional explanation
Please also find the file 02_160321_explanation_for_annex_6.docx and 03_160321_explanation_table_for_Annex_6.xlsx to complete our respond related to question #15, #35 and #36.
File 05_160321_Contingency_Classification.xlsx is provided to respond question #32 and #33, which would be added as part of Annex 1 (Table Annex 1.2).
File 06_2015_paper_step_by_step_Margono_etal.pdf is provided to respond question #21.
All above files have been delivered just after the week of teleconference.
FREL Submission Indonesia: paragraph for feedback
Bonn, 10 April 2016 (Jakarta 14 April 2016)
As discussed during today’s teleconference, the assessment team would like to invite Indonesia to provide reflections on the following consideration:
43. The AT points out that a large part of emissions from peatland decomposition occurring in the reference period are likely to cancel out with emissions from peatland decomposition o be picked up by later results monitoring. The boundaries applied in setting the FREL are the same for later results measurement; the FREL and the results measurement will cover the same lands. For any given year within the FREL, the approach to calculating peatland emissions is based on the total area of natural forest loss since 1990. Therefore, for any given year in the results phase, the approach to calculating peatland emissions will also need to be based
55
on the total area of natural forest loss since 1990. With this, the emissions from peatland decomposition on lands converted in 1990-2012 are counted both in the reference period and again for results measurement. In taking the difference, the emission estimates will cancel each other out (except for the relatively minor effects of changing emission factors due to possibly changing land use / land cover on the lands). Although emissions from peatland decomposition likely have only small impact on future results, they are still highly significant. The AT commends Indonesia on the efforts undertaken in accurately reflecting the country’s emissions profile.
If we understood correctly your question, our explanation is as follow:
1. We strongly agree with your statement that emissions from peatland decomposition are likely to have only small impact on future results, but they are still highly significant. With that consideration, Indonesia included the calculation of emissions from peat decomposition from deforestation and degradation annually since 1990.
2. Chapter 4.2.4 para. 2 stated that the inherited emissions from previous activities occurs within subsequent land cover so that the total emission from peat decomposition is the accumulation of peat emission from 1990 onward.
Peat decomposition emission calculation was based on the cumulative process of decomposition due to changes in peatland forest cover since the peatland forest area opened in 1990 and thereafter until 2012. This was stated also by Hooijer et al. (2006) that large areas of deforested peatland have been converted to oil palm and timber plantations but there are also extensive degraded peatlands, mainly located in the Indonesian provinces of Central, East and South Kalimantan and the provinces of Riau and Jambi in Sumatra where, as a result of deforestation, drainage and repeated fire, vital peatland ecosystem services have been impaired.
Although it is less favorable, the inclusion of peat in the calculation of emission is very important as it is the significant carbon pool. The appropriate management of peatland (particularly water management) is very important to reduce the rate of peat decomposition. Indonesia has set up plan for stopping conversion of peat natural forest for development, and focusing more into restoration of peatland as well as improving water management of the existing managed peat land (palm oil, timber plantation etc.).
With those plans, Indonesia expects to reduce significantly the emission from peat decomposition in post 2012 up to 2020, and even onward. The challenge is to
56
have reliable monitoring system specific for peat emission. This is also one of the areas for future improvement. The emission factor used in the calculation of peat decomposition in the FREL was from the IPCC, and it was the general EF. The emission factor used may increase or decrease with some peat management employed on the ground, such as water management. The implementation of better water management will change the emission in post 2012 considerably. Some of the above text would also be added in the updated documents.
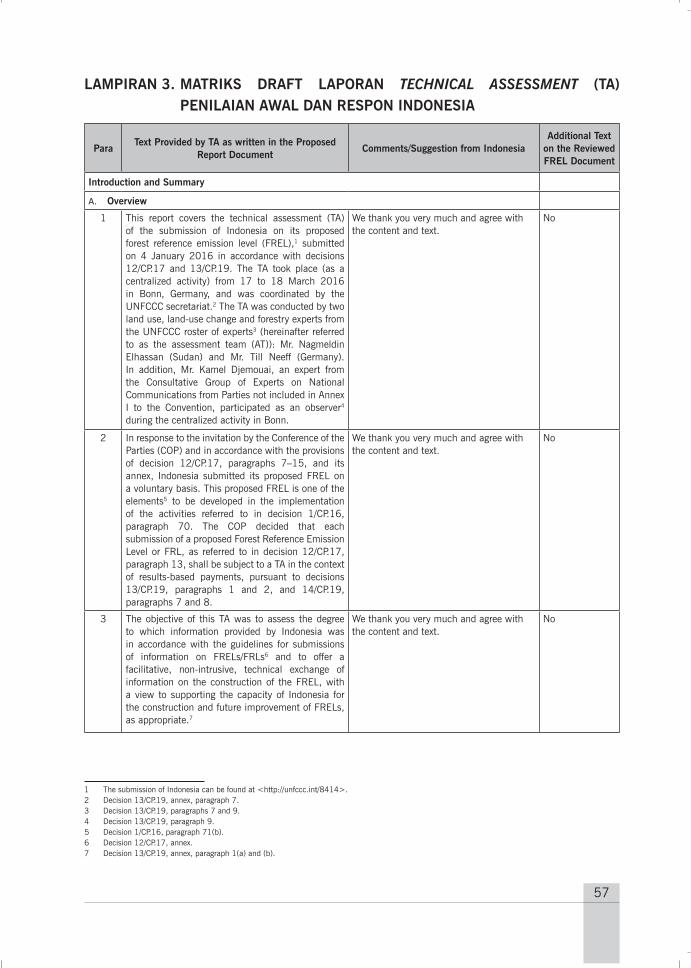
57
LAMPIRAN 3. MATRIKS DRAFT LAPORAN TECHNICAL ASSESSMENT (TA) PENILAIAN AWAL DAN RESPON INDONESIA
ParaText Provided by TA as written in the Proposed
Report DocumentComments/Suggestion from Indonesia
Additional Text on the Reviewed FREL Document
Introduction and Summary
A. Overview
1 This report covers the technical assessment (TA) of the submission of Indonesia on its proposed forest reference emission level (FREL),1 submitted on 4 January 2016 in accordance with decisions 12/CP.17 and 13/CP.19. The TA took place (as a centralized activity) from 17 to 18 March 2016 in Bonn, Germany, and was coordinated by the UNFCCC secretariat.2 The TA was conducted by two land use, land-use change and forestry experts from the UNFCCC roster of experts3 (hereinafter referred to as the assessment team (AT)): Mr. Nagmeldin Elhassan (Sudan) and Mr. Till Neeff (Germany). In addition, Mr. Kamel Djemouai, an expert from the Consultative Group of Experts on National Communications from Parties not included in Annex I to the Convention, participated as an observer4 during the centralized activity in Bonn.
We thank you very much and agree with the content and text.
No
2 In response to the invitation by the Conference of the Parties (COP) and in accordance with the provisions of decision 12/CP.17, paragraphs 7–15, and its annex, Indonesia submitted its proposed FREL on a voluntary basis. This proposed FREL is one of the elements5 to be developed in the implementation of the activities referred to in decision 1/CP.16, paragraph 70. The COP decided that each submission of a proposed Forest Reference Emission Level or FRL, as referred to in decision 12/CP.17, paragraph 13, shall be subject to a TA in the context of results-based payments, pursuant to decisions 13/CP.19, paragraphs 1 and 2, and 14/CP.19, paragraphs 7 and 8.
We thank you very much and agree with the content and text.
No
3 The objective of this TA was to assess the degree to which information provided by Indonesia was in accordance with the guidelines for submissions of information on FRELs/FRLs6 and to offer a facilitative, non-intrusive, technical exchange of information on the construction of the FREL, with a view to supporting the capacity of Indonesia for the construction and future improvement of FRELs, as appropriate.7
We thank you very much and agree with the content and text.
No
1 The submission of Indonesia can be found at <http://unfccc.int/8414>.2 Decision 13/CP.19, annex, paragraph 7.3 Decision 13/CP.19, paragraphs 7 and 9.4 Decision 13/CP.19, paragraph 9.5 Decision 1/CP.16, paragraph 71(b).6 Decision 12/CP.17, annex.7 Decision 13/CP.19, annex, paragraph 1(a) and (b).
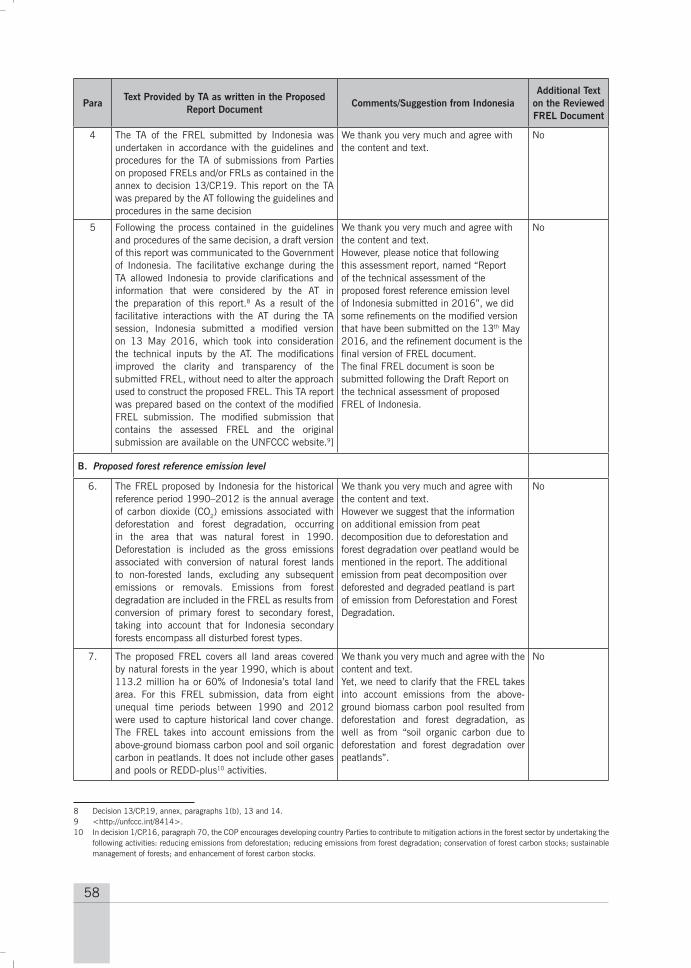
58
ParaText Provided by TA as written in the Proposed
Report DocumentComments/Suggestion from Indonesia
Additional Text on the Reviewed FREL Document
4 The TA of the FREL submitted by Indonesia was undertaken in accordance with the guidelines and procedures for the TA of submissions from Parties on proposed FRELs and/or FRLs as contained in the annex to decision 13/CP.19. This report on the TA was prepared by the AT following the guidelines and procedures in the same decision
We thank you very much and agree with the content and text.
No
5 Following the process contained in the guidelines and procedures of the same decision, a draft version of this report was communicated to the Government of Indonesia. The facilitative exchange during the TA allowed Indonesia to provide clarifications and information that were considered by the AT in the preparation of this report.8 As a result of the facilitative interactions with the AT during the TA session, Indonesia submitted a modified version on 13 May 2016, which took into consideration the technical inputs by the AT. The modifications improved the clarity and transparency of the submitted FREL, without need to alter the approach used to construct the proposed FREL. This TA report was prepared based on the context of the modified FREL submission. The modified submission that contains the assessed FREL and the original submission are available on the UNFCCC website.9]
We thank you very much and agree with the content and text.However, please notice that following this assessment report, named “Report of the technical assessment of the proposed forest reference emission level of Indonesia submitted in 2016”, we did some refinements on the modified version that have been submitted on the 13th May 2016, and the refinement document is the final version of FREL document. The final FREL document is soon be submitted following the Draft Report on the technical assessment of proposed FREL of Indonesia.
No
B. Proposed forest reference emission level
6. The FREL proposed by Indonesia for the historical reference period 1990–2012 is the annual average of carbon dioxide (CO2) emissions associated with deforestation and forest degradation, occurring in the area that was natural forest in 1990. Deforestation is included as the gross emissions associated with conversion of natural forest lands to non-forested lands, excluding any subsequent emissions or removals. Emissions from forest degradation are included in the FREL as results from conversion of primary forest to secondary forest, taking into account that for Indonesia secondary forests encompass all disturbed forest types.
We thank you very much and agree with the content and text.However we suggest that the information on additional emission from peat decomposition due to deforestation and forest degradation over peatland would be mentioned in the report. The additional emission from peat decomposition over deforested and degraded peatland is part of emission from Deforestation and Forest Degradation.
No
7. The proposed FREL covers all land areas covered by natural forests in the year 1990, which is about 113.2 million ha or 60% of Indonesia’s total land area. For this FREL submission, data from eight unequal time periods between 1990 and 2012 were used to capture historical land cover change. The FREL takes into account emissions from the above-ground biomass carbon pool and soil organic carbon in peatlands. It does not include other gases and pools or REDD-plus10 activities.
We thank you very much and agree with the content and text.Yet, we need to clarify that the FREL takes into account emissions from the above-ground biomass carbon pool resulted from deforestation and forest degradation, as well as from “soil organic carbon due to deforestation and forest degradation over peatlands”.
No
8 Decision 13/CP.19, annex, paragraphs 1(b), 13 and 14. 9 <http://unfccc.int/8414>. 10 In decision 1/CP.16, paragraph 70, the COP encourages developing country Parties to contribute to mitigation actions in the forest sector by undertaking the
following activities: reducing emissions from deforestation; reducing emissions from forest degradation; conservation of forest carbon stocks; sustainable management of forests; and enhancement of forest carbon stocks.

59
ParaText Provided by TA as written in the Proposed
Report DocumentComments/Suggestion from Indonesia
Additional Text on the Reviewed FREL Document
8. Indonesia is applying a step-wise approach in the development of the FREL, in accordance with decision 12/CP.17, paragraph 10, with the aim of improving the FREL by incorporating better data, improved methodologies and, where appropriate, additional pools. The submission lists a number of areas for technical improvement, such as improvement of activity data and emission factors, estimating peatland fire emissions, and the inclusion of additional REDD-plus activities.
We thank you very much and agree with the content and text.
No
9. The national FREL submitted by Indonesia is 568,859,881 tonnes of carbon dioxide equivalent (t CO2 eq) for the year 2013, but increasing annually because of accumulating emissions from peat decomposition, and reaching 593,329,235 tonnes of carbon dioxide equivalent (t CO2 eq) for the year 2020.
We thank you very much and agree with the content and text.
No
II. Data, methodologies and procedures used in the construction of the proposed forest reference emission level : How each element in the annex to decision 12/CP.17 was taken into account in the construction of the forest reference emission level
1. Information that was used by the Party in the construction of the forest reference emission level
10. Indonesia includes in its FREL submission information about earlier work on reference levels related to deforestation and forest degradation. The current FREL builds upon experiences and capacities gained from these efforts. The AT commends Indonesia for early action on implementation of activities to reduce emissions from deforestation and forest degradation.
We thank you very much and agree with the content and text.
No
11 The methods used by Indonesia are consistent with the Intergovernmental Panel on Climate Change (IPCC) Good Practice Guidance for Land Use, Land-Use Change and Forestry (hereinafter referred to as the IPCC good practice guidance for LULUCF) and the 2006 IPCC Guidelines for National Greenhouse Gas Inventories (hereinafter referred to as the 2006 IPCC Guidelines), as applied to the construction of the FREL. For estimation of emissions from peat decomposition the 2013 Supplement to the 2006 Guidelines for National Greenhouse Gas Inventories: Wetlands (hereinafter referred to as 2013 IPCC Wetlands Supplement) was used.
We thank you very much and agree with the content and text.
No
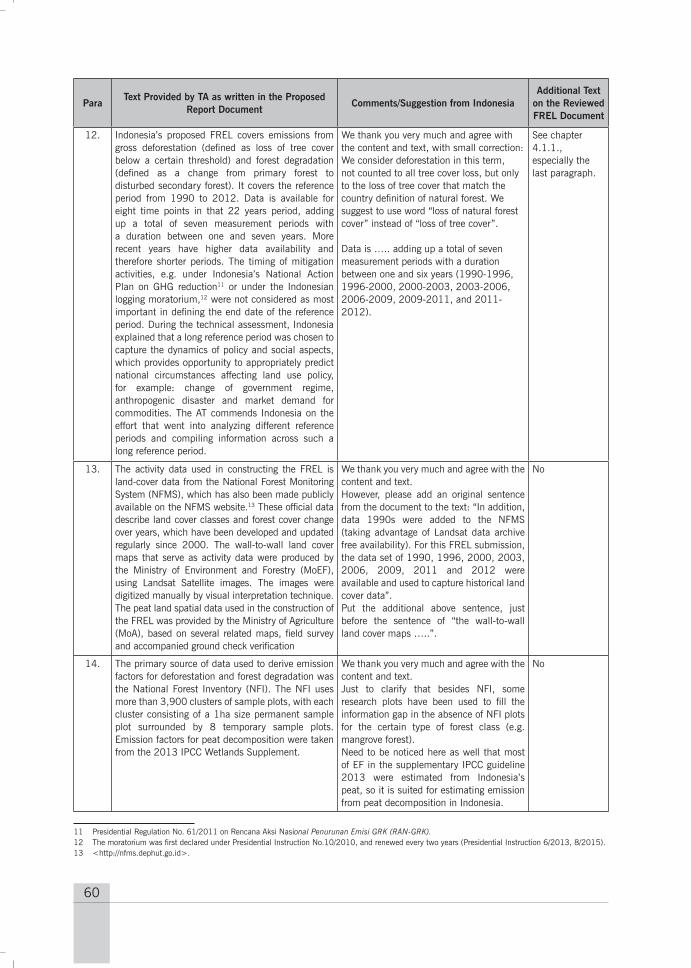
60
ParaText Provided by TA as written in the Proposed
Report DocumentComments/Suggestion from Indonesia
Additional Text on the Reviewed FREL Document
12. Indonesia’s proposed FREL covers emissions from gross deforestation (defined as loss of tree cover below a certain threshold) and forest degradation (defined as a change from primary forest to disturbed secondary forest). It covers the reference period from 1990 to 2012. Data is available for eight time points in that 22 years period, adding up a total of seven measurement periods with a duration between one and seven years. More recent years have higher data availability and therefore shorter periods. The timing of mitigation activities, e.g. under Indonesia’s National Action Plan on GHG reduction11 or under the Indonesian logging moratorium,12 were not considered as most important in defining the end date of the reference period. During the technical assessment, Indonesia explained that a long reference period was chosen to capture the dynamics of policy and social aspects, which provides opportunity to appropriately predict national circumstances affecting land use policy, for example: change of government regime, anthropogenic disaster and market demand for commodities. The AT commends Indonesia on the effort that went into analyzing different reference periods and compiling information across such a long reference period.
We thank you very much and agree with the content and text, with small correction:We consider deforestation in this term, not counted to all tree cover loss, but only to the loss of tree cover that match the country definition of natural forest. We suggest to use word “loss of natural forest cover” instead of “loss of tree cover”.
Data is ….. adding up a total of seven measurement periods with a duration between one and six years (1990-1996, 1996-2000, 2000-2003, 2003-2006, 2006-2009, 2009-2011, and 2011-2012).
See chapter 4.1.1., especially the last paragraph.
13. The activity data used in constructing the FREL is land-cover data from the National Forest Monitoring System (NFMS), which has also been made publicly available on the NFMS website.13 These official data describe land cover classes and forest cover change over years, which have been developed and updated regularly since 2000. The wall-to-wall land cover maps that serve as activity data were produced by the Ministry of Environment and Forestry (MoEF), using Landsat Satellite images. The images were digitized manually by visual interpretation technique. The peat land spatial data used in the construction of the FREL was provided by the Ministry of Agriculture (MoA), based on several related maps, field survey and accompanied ground check verification
We thank you very much and agree with the content and text.However, please add an original sentence from the document to the text: “In addition, data 1990s were added to the NFMS (taking advantage of Landsat data archive free availability). For this FREL submission, the data set of 1990, 1996, 2000, 2003, 2006, 2009, 2011 and 2012 were available and used to capture historical land cover data”. Put the additional above sentence, just before the sentence of “the wall-to-wall land cover maps …..”.
No
14. The primary source of data used to derive emission factors for deforestation and forest degradation was the National Forest Inventory (NFI). The NFI uses more than 3,900 clusters of sample plots, with each cluster consisting of a 1ha size permanent sample plot surrounded by 8 temporary sample plots. Emission factors for peat decomposition were taken from the 2013 IPCC Wetlands Supplement.
We thank you very much and agree with the content and text.Just to clarify that besides NFI, some research plots have been used to fill the information gap in the absence of NFI plots for the certain type of forest class (e.g. mangrove forest).Need to be noticed here as well that most of EF in the supplementary IPCC guideline 2013 were estimated from Indonesia’s peat, so it is suited for estimating emission from peat decomposition in Indonesia.
No
11 Presidential Regulation No. 61/2011 on Rencana Aksi Nasional Penurunan Emisi GRK (RAN-GRK).12 The moratorium was first declared under Presidential Instruction No.10/2010, and renewed every two years (Presidential Instruction 6/2013, 8/2015).13 <http://nfms.dephut.go.id>.
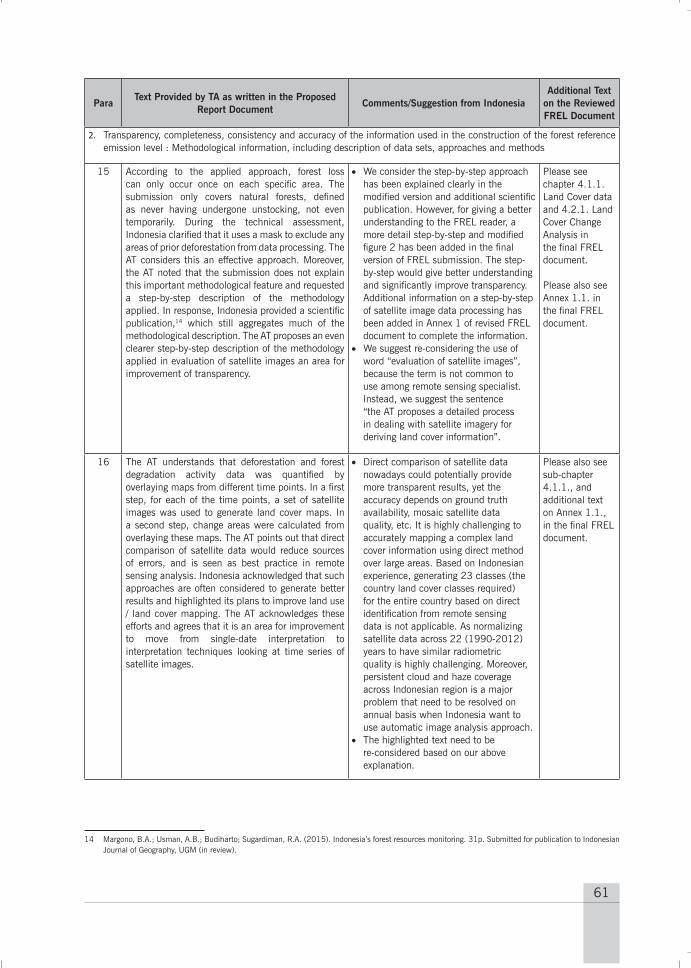
61
ParaText Provided by TA as written in the Proposed
Report DocumentComments/Suggestion from Indonesia
Additional Text on the Reviewed FREL Document
2. Transparency, completeness, consistency and accuracy of the information used in the construction of the forest reference emission level : Methodological information, including description of data sets, approaches and methods
15 According to the applied approach, forest loss can only occur once on each specific area. The submission only covers natural forests, defined as never having undergone unstocking, not even temporarily. During the technical assessment, Indonesia clarified that it uses a mask to exclude any areas of prior deforestation from data processing. The AT considers this an effective approach. Moreover, the AT noted that the submission does not explain this important methodological feature and requested a step-by-step description of the methodology applied. In response, Indonesia provided a scientific publication,14 which still aggregates much of the methodological description. The AT proposes an even clearer step-by-step description of the methodology applied in evaluation of satellite images an area for improvement of transparency.
• We consider the step-by-step approach has been explained clearly in the modified version and additional scientific publication. However, for giving a better understanding to the FREL reader, a more detail step-by-step and modified figure 2 has been added in the final version of FREL submission. The step-by-step would give better understanding and significantly improve transparency. Additional information on a step-by-step of satellite image data processing has been added in Annex 1 of revised FREL document to complete the information.
• We suggest re-considering the use of word “evaluation of satellite images”, because the term is not common to use among remote sensing specialist. Instead, we suggest the sentence “the AT proposes a detailed process in dealing with satellite imagery for deriving land cover information”.
Please see chapter 4.1.1. Land Cover data and 4.2.1. Land Cover Change Analysis in the final FREL document.
Please also see Annex 1.1. in the final FREL document.
16 The AT understands that deforestation and forest degradation activity data was quantified by overlaying maps from different time points. In a first step, for each of the time points, a set of satellite images was used to generate land cover maps. In a second step, change areas were calculated from overlaying these maps. The AT points out that direct comparison of satellite data would reduce sources of errors, and is seen as best practice in remote sensing analysis. Indonesia acknowledged that such approaches are often considered to generate better results and highlighted its plans to improve land use / land cover mapping. The AT acknowledges these efforts and agrees that it is an area for improvement to move from single-date interpretation to interpretation techniques looking at time series of satellite images.
• Direct comparison of satellite data nowadays could potentially provide more transparent results, yet the accuracy depends on ground truth availability, mosaic satellite data quality, etc. It is highly challenging to accurately mapping a complex land cover information using direct method over large areas. Based on Indonesian experience, generating 23 classes (the country land cover classes required) for the entire country based on direct identification from remote sensing data is not applicable. As normalizing satellite data across 22 (1990-2012) years to have similar radiometric quality is highly challenging. Moreover, persistent cloud and haze coverage across Indonesian region is a major problem that need to be resolved on annual basis when Indonesia want to use automatic image analysis approach.
• The highlighted text need to be re-considered based on our above explanation.
Please also see sub-chapter 4.1.1., and additional text on Annex 1.1., in the final FREL document.
14 Margono, B.A.; Usman, A.B.; Budiharto; Sugardiman, R.A. (2015). Indonesia’s forest resources monitoring. 31p. Submitted for publication to Indonesian Journal of Geography, UGM (in review).
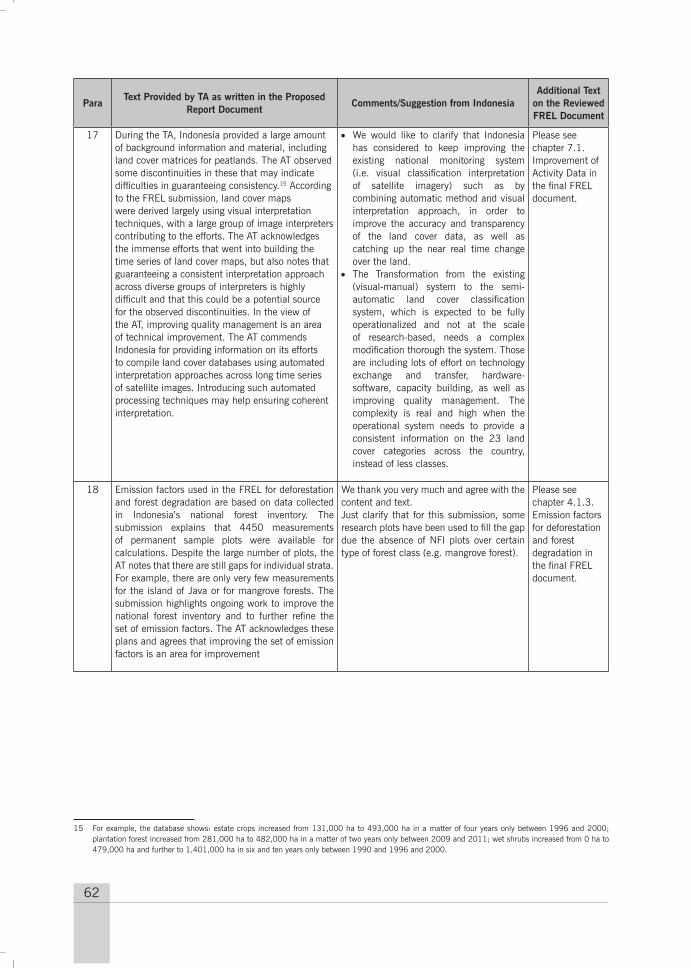
62
ParaText Provided by TA as written in the Proposed
Report DocumentComments/Suggestion from Indonesia
Additional Text on the Reviewed FREL Document
17 During the TA, Indonesia provided a large amount of background information and material, including land cover matrices for peatlands. The AT observed some discontinuities in these that may indicate difficulties in guaranteeing consistency.15 According to the FREL submission, land cover maps were derived largely using visual interpretation techniques, with a large group of image interpreters contributing to the efforts. The AT acknowledges the immense efforts that went into building the time series of land cover maps, but also notes that guaranteeing a consistent interpretation approach across diverse groups of interpreters is highly difficult and that this could be a potential source for the observed discontinuities. In the view of the AT, improving quality management is an area of technical improvement. The AT commends Indonesia for providing information on its efforts to compile land cover databases using automated interpretation approaches across long time series of satellite images. Introducing such automated processing techniques may help ensuring coherent interpretation.
• We would like to clarify that Indonesia has considered to keep improving the existing national monitoring system (i.e. visual classification interpretation of satellite imagery) such as by combining automatic method and visual interpretation approach, in order to improve the accuracy and transparency of the land cover data, as well as catching up the near real time change over the land.
• The Transformation from the existing (visual-manual) system to the semi-automatic land cover classification system, which is expected to be fully operationalized and not at the scale of research-based, needs a complex modification thorough the system. Those are including lots of effort on technology exchange and transfer, hardware-software, capacity building, as well as improving quality management. The complexity is real and high when the operational system needs to provide a consistent information on the 23 land cover categories across the country, instead of less classes.
Please see chapter 7.1. Improvement of Activity Data in the final FREL document.
18 Emission factors used in the FREL for deforestation and forest degradation are based on data collected in Indonesia’s national forest inventory. The submission explains that 4450 measurements of permanent sample plots were available for calculations. Despite the large number of plots, the AT notes that there are still gaps for individual strata. For example, there are only very few measurements for the island of Java or for mangrove forests. The submission highlights ongoing work to improve the national forest inventory and to further refine the set of emission factors. The AT acknowledges these plans and agrees that improving the set of emission factors is an area for improvement
We thank you very much and agree with the content and text.Just clarify that for this submission, some research plots have been used to fill the gap due the absence of NFI plots over certain type of forest class (e.g. mangrove forest).
Please see chapter 4.1.3. Emission factors for deforestation and forest degradation in the final FREL document.
15 For example, the database shows: estate crops increased from 131,000 ha to 493,000 ha in a matter of four years only between 1996 and 2000; plantation forest increased from 281,000 ha to 482,000 ha in a matter of two years only between 2009 and 2011; wet shrubs increased from 0 ha to 479,000 ha and further to 1,401,000 ha in six and ten years only between 1990 and 1996 and 2000.

63
ParaText Provided by TA as written in the Proposed
Report DocumentComments/Suggestion from Indonesia
Additional Text on the Reviewed FREL Document
19 Indonesia includes only the gross emissions from deforestation that are associated with clear-cuts, ignoring any potential biomass regrowth and associated removals after the deforestation event. This approach intended to protect the remaining natural tropical forest of Indonesia. The AT notes that this is a reasonable approach when forest is converted to cropland with annual crops, but not necessarily when the crops are perennial or when there are other woody biomass stocks. In response, Indonesia clarified that when natural forest has been converted to non-forested lands, they rarely grow back into natural forest. Therefore the proposed FREL excludes plantation forests and non-forest classes such as croplands, agriculture, shrub, savanna and grasses, paddy field, transmigration areas, settlement areas, port & harbor, mining areas, and bare lands. The AT notes that this exclusion of removals in post-conversion carbon stocks likely leads to an overestimation of emissions from deforestation. The AT considers that it would be useful to assess whether post-conversion removals are significant and could be taken into account when estimating emissions from deforestation, and notes this as an area for improvement.16
We agree with some notes :• Please change the word “ignoring” into
“excluding”• Until we have a convincing method
and technology to appropriately and accurately to enough distinguish different level of degraded forest and processes (i.e. differentiate degradation level of primary to secondary forests (high/medium/low degradation), or different level of regeneration of secondary forest), Indonesia considers that estimating forest regrowth (post-conversion carbon stock) within the secondary forest is problematic. So that, please consider a better expression to replace the terms “overestimation of emissions”.
• In our point of view, the emission from deforestation is real, as the removal would be accounted not under emission from deforestation, but under other activity (i.e. carbon enhancement).
No
20. The FREL submission makes use of several data sources on the distribution of organic soils. First, the breakdown of forest types includes several types of organic soils (notably swamp forests and mangroves). Second, the calculation of peatland emissions draws on a soil map showing the location of peatlands. These two datasets are not perfectly harmonized with each other and the calculations identify dryland forests growing on organic soils and swamp forests growing on mineral soils. During the technical assessment, Indonesia recognized that such imperfect harmonization may occur in “sliver areas”. While technically maps and definitions could be harmonized, Indonesia also explained that fully harmonizing datasets would require collaboration and arrangements between several ministry level agencies and is therefore not easy to achieve. The AT acknowledges that Indonesia has plans to improve peatland mapping and agrees that ensuring consistency between the land cover map and the peatland map is an area for improvement.
• We did not use several data sources for generating the distribution of organic soils. We relied on peat land map produced by MoA (2011) to distinguish organic from mineral soil. In order to differentiate forests on peat land and forests on mineral soil, we overlaid the peat map of MoA with land-cover (LC) maps of MoEF. The LC of MoEF depends only on remote sensing data and capture vegetation information from above, not including detail type of soil information.
• Please notice that biophysically, mangrove and fresh-water swamp forests could exist either on organic (peat) or mineral soil. In Indonesia case, regardless of its possibility on biophysical condition, the peat soil map is independently generated from what the land cover is. Indeed, the calculation of peatland emissions is based on the presence of peatland. Therefore, if the mangrove forests over peatland are primary forest, the emission factor of primary peat forest, which is zero, is applied for estimating peat decomposition emission. The same approach was applied for secondary mangrove forest. Improving the quality of Indonesia’s peat map is important.
No
16 Based on a set of land-cover change matrices provided by Indonesia, the AT estimated the relevance of such conversion for natural forests on peatlands. With the available data, the estimation was possible only for peatlands, where over the reference period 999,694 ha of natural forests were converted to estate crops and 549,366 ha of natural forests were converted to forest plantations, representing 35 per cent of natural forest loss. Total forest loss until 2012 amounted to 4,407,621 ha. Based on the available information, it is unclear whether this could give an indication of the more general trend.
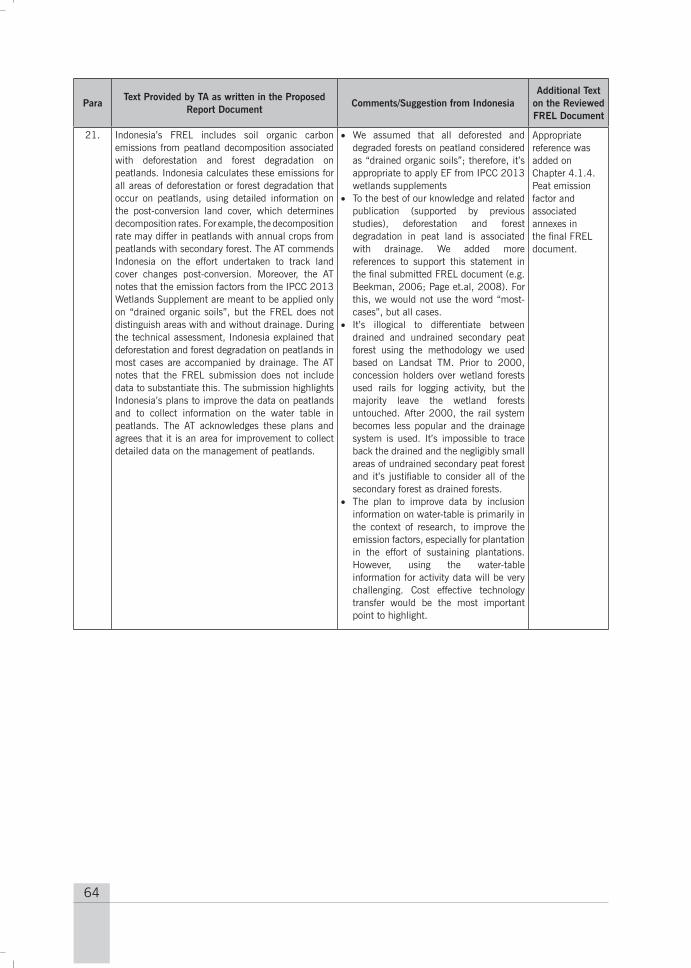
64
ParaText Provided by TA as written in the Proposed
Report DocumentComments/Suggestion from Indonesia
Additional Text on the Reviewed FREL Document
21. Indonesia’s FREL includes soil organic carbon emissions from peatland decomposition associated with deforestation and forest degradation on peatlands. Indonesia calculates these emissions for all areas of deforestation or forest degradation that occur on peatlands, using detailed information on the post-conversion land cover, which determines decomposition rates. For example, the decomposition rate may differ in peatlands with annual crops from peatlands with secondary forest. The AT commends Indonesia on the effort undertaken to track land cover changes post-conversion. Moreover, the AT notes that the emission factors from the IPCC 2013 Wetlands Supplement are meant to be applied only on “drained organic soils”, but the FREL does not distinguish areas with and without drainage. During the technical assessment, Indonesia explained that deforestation and forest degradation on peatlands in most cases are accompanied by drainage. The AT notes that the FREL submission does not include data to substantiate this. The submission highlights Indonesia’s plans to improve the data on peatlands and to collect information on the water table in peatlands. The AT acknowledges these plans and agrees that it is an area for improvement to collect detailed data on the management of peatlands.
• We assumed that all deforested and degraded forests on peatland considered as “drained organic soils”; therefore, it’s appropriate to apply EF from IPCC 2013 wetlands supplements
• To the best of our knowledge and related publication (supported by previous studies), deforestation and forest degradation in peat land is associated with drainage. We added more references to support this statement in the final submitted FREL document (e.g. Beekman, 2006; Page et.al, 2008). For this, we would not use the word “most-cases”, but all cases.
• It’s illogical to differentiate between drained and undrained secondary peat forest using the methodology we used based on Landsat TM. Prior to 2000, concession holders over wetland forests used rails for logging activity, but the majority leave the wetland forests untouched. After 2000, the rail system becomes less popular and the drainage system is used. It’s impossible to trace back the drained and the negligibly small areas of undrained secondary peat forest and it’s justifiable to consider all of the secondary forest as drained forests.
• The plan to improve data by inclusion information on water-table is primarily in the context of research, to improve the emission factors, especially for plantation in the effort of sustaining plantations. However, using the water-table information for activity data will be very challenging. Cost effective technology transfer would be the most important point to highlight.
Appropriate reference was added on Chapter 4.1.4. Peat emission factor and associated annexes in the final FREL document.
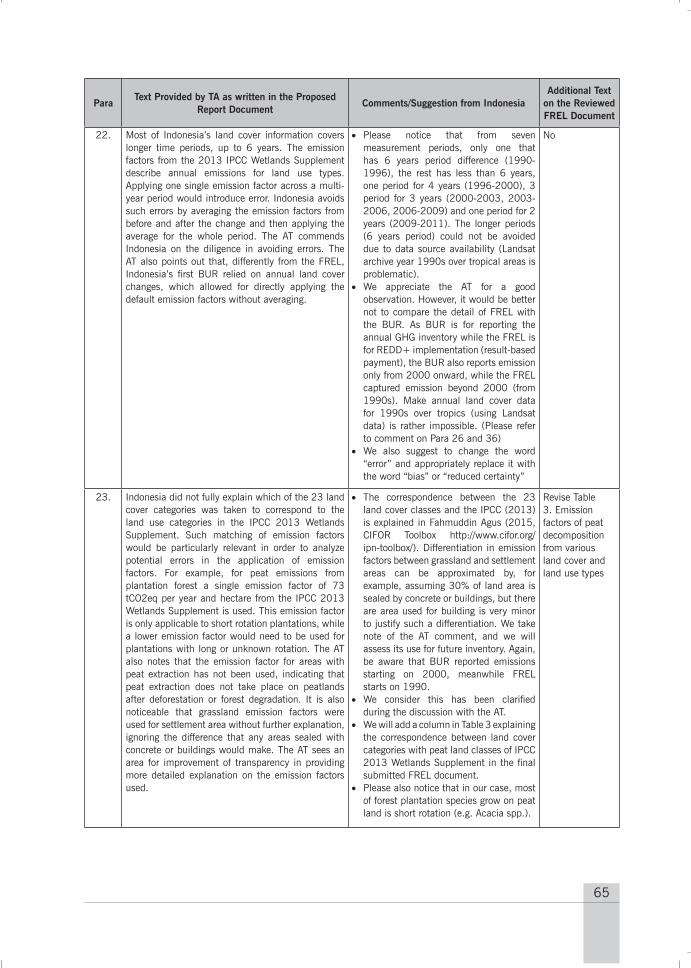
65
ParaText Provided by TA as written in the Proposed
Report DocumentComments/Suggestion from Indonesia
Additional Text on the Reviewed FREL Document
22. Most of Indonesia’s land cover information covers longer time periods, up to 6 years. The emission factors from the 2013 IPCC Wetlands Supplement describe annual emissions for land use types. Applying one single emission factor across a multi-year period would introduce error. Indonesia avoids such errors by averaging the emission factors from before and after the change and then applying the average for the whole period. The AT commends Indonesia on the diligence in avoiding errors. The AT also points out that, differently from the FREL, Indonesia’s first BUR relied on annual land cover changes, which allowed for directly applying the default emission factors without averaging.
• Please notice that from seven measurement periods, only one that has 6 years period difference (1990-1996), the rest has less than 6 years, one period for 4 years (1996-2000), 3 period for 3 years (2000-2003, 2003-2006, 2006-2009) and one period for 2 years (2009-2011). The longer periods (6 years period) could not be avoided due to data source availability (Landsat archive year 1990s over tropical areas is problematic).
• We appreciate the AT for a good observation. However, it would be better not to compare the detail of FREL with the BUR. As BUR is for reporting the annual GHG inventory while the FREL is for REDD+ implementation (result-based payment), the BUR also reports emission only from 2000 onward, while the FREL captured emission beyond 2000 (from 1990s). Make annual land cover data for 1990s over tropics (using Landsat data) is rather impossible. (Please refer to comment on Para 26 and 36)
• We also suggest to change the word “error” and appropriately replace it with the word “bias” or “reduced certainty”
No
23. Indonesia did not fully explain which of the 23 land cover categories was taken to correspond to the land use categories in the IPCC 2013 Wetlands Supplement. Such matching of emission factors would be particularly relevant in order to analyze potential errors in the application of emission factors. For example, for peat emissions from plantation forest a single emission factor of 73 tCO2eq per year and hectare from the IPCC 2013 Wetlands Supplement is used. This emission factor is only applicable to short rotation plantations, while a lower emission factor would need to be used for plantations with long or unknown rotation. The AT also notes that the emission factor for areas with peat extraction has not been used, indicating that peat extraction does not take place on peatlands after deforestation or forest degradation. It is also noticeable that grassland emission factors were used for settlement area without further explanation, ignoring the difference that any areas sealed with concrete or buildings would make. The AT sees an area for improvement of transparency in providing more detailed explanation on the emission factors used.
• The correspondence between the 23 land cover classes and the IPCC (2013) is explained in Fahmuddin Agus (2015, CIFOR Toolbox http://www.cifor.org/ipn-toolbox/). Differentiation in emission factors between grassland and settlement areas can be approximated by, for example, assuming 30% of land area is sealed by concrete or buildings, but there are area used for building is very minor to justify such a differentiation. We take note of the AT comment, and we will assess its use for future inventory. Again, be aware that BUR reported emissions starting on 2000, meanwhile FREL starts on 1990.
• We consider this has been clarified during the discussion with the AT.
• We will add a column in Table 3 explaining the correspondence between land cover categories with peat land classes of IPCC 2013 Wetlands Supplement in the final submitted FREL document.
• Please also notice that in our case, most of forest plantation species grow on peat land is short rotation (e.g. Acacia spp.).
Revise Table 3. Emission factors of peat decomposition from various land cover and land use types
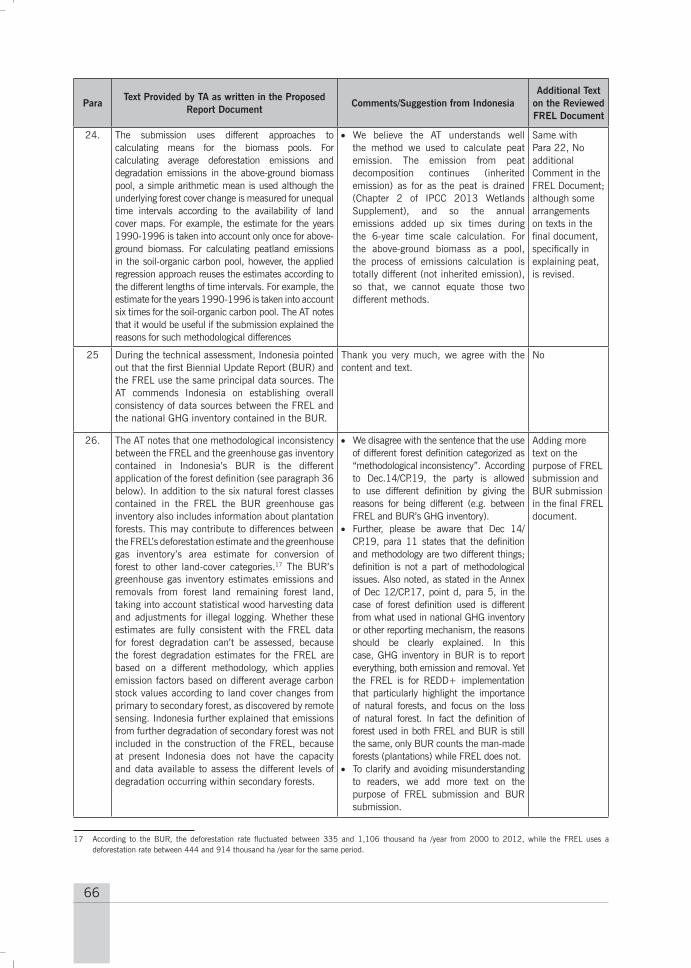
66
ParaText Provided by TA as written in the Proposed
Report DocumentComments/Suggestion from Indonesia
Additional Text on the Reviewed FREL Document
24. The submission uses different approaches to calculating means for the biomass pools. For calculating average deforestation emissions and degradation emissions in the above-ground biomass pool, a simple arithmetic mean is used although the underlying forest cover change is measured for unequal time intervals according to the availability of land cover maps. For example, the estimate for the years 1990-1996 is taken into account only once for above-ground biomass. For calculating peatland emissions in the soil-organic carbon pool, however, the applied regression approach reuses the estimates according to the different lengths of time intervals. For example, the estimate for the years 1990-1996 is taken into account six times for the soil-organic carbon pool. The AT notes that it would be useful if the submission explained the reasons for such methodological differences
• We believe the AT understands well the method we used to calculate peat emission. The emission from peat decomposition continues (inherited emission) as for as the peat is drained (Chapter 2 of IPCC 2013 Wetlands Supplement), and so the annual emissions added up six times during the 6-year time scale calculation. For the above-ground biomass as a pool, the process of emissions calculation is totally different (not inherited emission), so that, we cannot equate those two different methods.
Same with Para 22, No additional Comment in the FREL Document; although some arrangements on texts in the final document, specifically in explaining peat, is revised.
25 During the technical assessment, Indonesia pointed out that the first Biennial Update Report (BUR) and the FREL use the same principal data sources. The AT commends Indonesia on establishing overall consistency of data sources between the FREL and the national GHG inventory contained in the BUR.
Thank you very much, we agree with the content and text.
No
26. The AT notes that one methodological inconsistency between the FREL and the greenhouse gas inventory contained in Indonesia’s BUR is the different application of the forest definition (see paragraph 36 below). In addition to the six natural forest classes contained in the FREL the BUR greenhouse gas inventory also includes information about plantation forests. This may contribute to differences between the FREL’s deforestation estimate and the greenhouse gas inventory’s area estimate for conversion of forest to other land-cover categories.17 The BUR’s greenhouse gas inventory estimates emissions and removals from forest land remaining forest land, taking into account statistical wood harvesting data and adjustments for illegal logging. Whether these estimates are fully consistent with the FREL data for forest degradation can’t be assessed, because the forest degradation estimates for the FREL are based on a different methodology, which applies emission factors based on different average carbon stock values according to land cover changes from primary to secondary forest, as discovered by remote sensing. Indonesia further explained that emissions from further degradation of secondary forest was not included in the construction of the FREL, because at present Indonesia does not have the capacity and data available to assess the different levels of degradation occurring within secondary forests.
• We disagree with the sentence that the use of different forest definition categorized as “methodological inconsistency”. According to Dec.14/CP.19, the party is allowed to use different definition by giving the reasons for being different (e.g. between FREL and BUR’s GHG inventory).
• Further, please be aware that Dec 14/CP.19, para 11 states that the definition and methodology are two different things; definition is not a part of methodological issues. Also noted, as stated in the Annex of Dec 12/CP.17, point d, para 5, in the case of forest definition used is different from what used in national GHG inventory or other reporting mechanism, the reasons should be clearly explained. In this case, GHG inventory in BUR is to report everything, both emission and removal. Yet the FREL is for REDD+ implementation that particularly highlight the importance of natural forests, and focus on the loss of natural forest. In fact the definition of forest used in both FREL and BUR is still the same, only BUR counts the man-made forests (plantations) while FREL does not.
• To clarify and avoiding misunderstanding to readers, we add more text on the purpose of FREL submission and BUR submission.
Adding more text on the purpose of FREL submission and BUR submission in the final FREL document.
17 According to the BUR, the deforestation rate fluctuated between 335 and 1,106 thousand ha /year from 2000 to 2012, while the FREL uses a deforestation rate between 444 and 914 thousand ha /year for the same period.
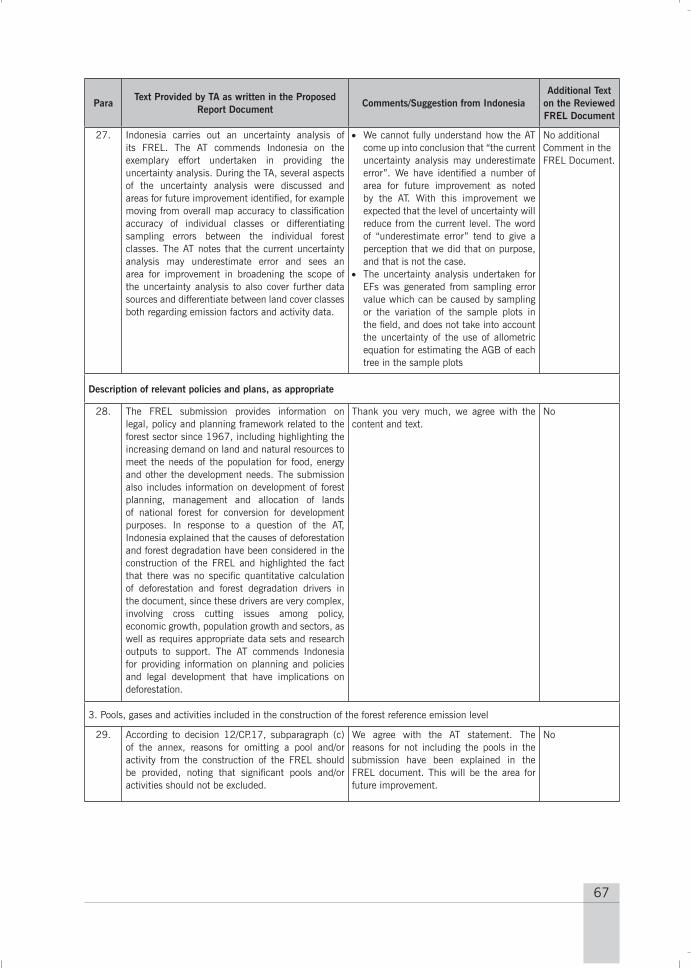
67
ParaText Provided by TA as written in the Proposed
Report DocumentComments/Suggestion from Indonesia
Additional Text on the Reviewed FREL Document
27. Indonesia carries out an uncertainty analysis of its FREL. The AT commends Indonesia on the exemplary effort undertaken in providing the uncertainty analysis. During the TA, several aspects of the uncertainty analysis were discussed and areas for future improvement identified, for example moving from overall map accuracy to classification accuracy of individual classes or differentiating sampling errors between the individual forest classes. The AT notes that the current uncertainty analysis may underestimate error and sees an area for improvement in broadening the scope of the uncertainty analysis to also cover further data sources and differentiate between land cover classes both regarding emission factors and activity data.
• We cannot fully understand how the AT come up into conclusion that “the current uncertainty analysis may underestimate error”. We have identified a number of area for future improvement as noted by the AT. With this improvement we expected that the level of uncertainty will reduce from the current level. The word of “underestimate error” tend to give a perception that we did that on purpose, and that is not the case.
• The uncertainty analysis undertaken for EFs was generated from sampling error value which can be caused by sampling or the variation of the sample plots in the field, and does not take into account the uncertainty of the use of allometric equation for estimating the AGB of each tree in the sample plots
No additional Comment in the FREL Document.
Description of relevant policies and plans, as appropriate
28. The FREL submission provides information on legal, policy and planning framework related to the forest sector since 1967, including highlighting the increasing demand on land and natural resources to meet the needs of the population for food, energy and other the development needs. The submission also includes information on development of forest planning, management and allocation of lands of national forest for conversion for development purposes. In response to a question of the AT, Indonesia explained that the causes of deforestation and forest degradation have been considered in the construction of the FREL and highlighted the fact that there was no specific quantitative calculation of deforestation and forest degradation drivers in the document, since these drivers are very complex, involving cross cutting issues among policy, economic growth, population growth and sectors, as well as requires appropriate data sets and research outputs to support. The AT commends Indonesia for providing information on planning and policies and legal development that have implications on deforestation.
Thank you very much, we agree with the content and text.
No
3. Pools, gases and activities included in the construction of the forest reference emission level
29. According to decision 12/CP.17, subparagraph (c) of the annex, reasons for omitting a pool and/or activity from the construction of the FREL should be provided, noting that significant pools and/or activities should not be excluded.
We agree with the AT statement. The reasons for not including the pools in the submission have been explained in the FREL document. This will be the area for future improvement.
No
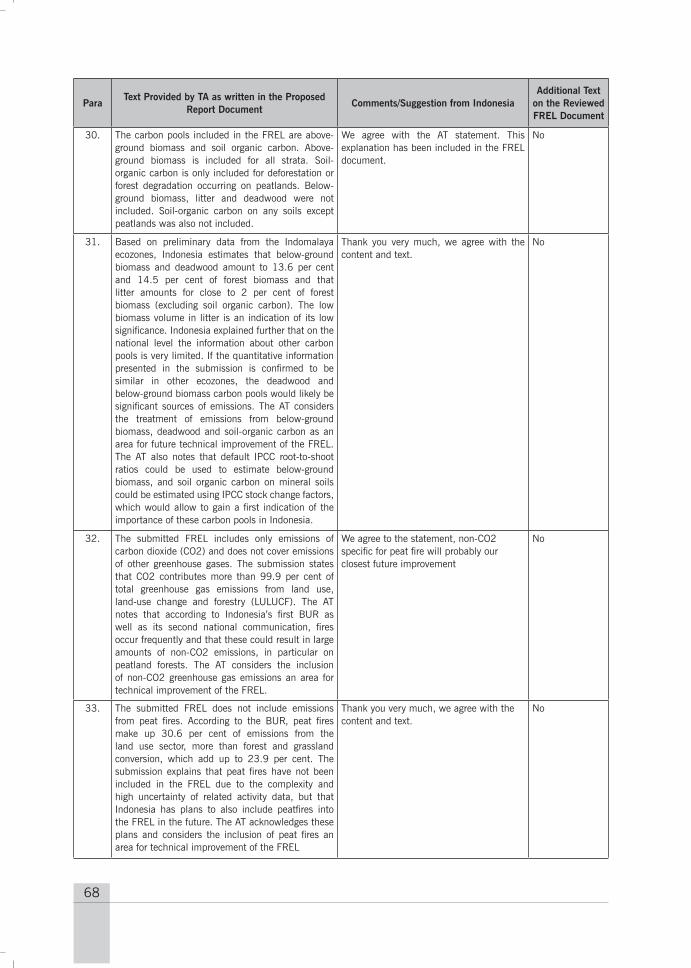
68
ParaText Provided by TA as written in the Proposed
Report DocumentComments/Suggestion from Indonesia
Additional Text on the Reviewed FREL Document
30. The carbon pools included in the FREL are above-ground biomass and soil organic carbon. Above-ground biomass is included for all strata. Soil-organic carbon is only included for deforestation or forest degradation occurring on peatlands. Below-ground biomass, litter and deadwood were not included. Soil-organic carbon on any soils except peatlands was also not included.
We agree with the AT statement. This explanation has been included in the FREL document.
No
31. Based on preliminary data from the Indomalaya ecozones, Indonesia estimates that below-ground biomass and deadwood amount to 13.6 per cent and 14.5 per cent of forest biomass and that litter amounts for close to 2 per cent of forest biomass (excluding soil organic carbon). The low biomass volume in litter is an indication of its low significance. Indonesia explained further that on the national level the information about other carbon pools is very limited. If the quantitative information presented in the submission is confirmed to be similar in other ecozones, the deadwood and below-ground biomass carbon pools would likely be significant sources of emissions. The AT considers the treatment of emissions from below-ground biomass, deadwood and soil-organic carbon as an area for future technical improvement of the FREL. The AT also notes that default IPCC root-to-shoot ratios could be used to estimate below-ground biomass, and soil organic carbon on mineral soils could be estimated using IPCC stock change factors, which would allow to gain a first indication of the importance of these carbon pools in Indonesia.
Thank you very much, we agree with the content and text.
No
32. The submitted FREL includes only emissions of carbon dioxide (CO2) and does not cover emissions of other greenhouse gases. The submission states that CO2 contributes more than 99.9 per cent of total greenhouse gas emissions from land use, land-use change and forestry (LULUCF). The AT notes that according to Indonesia’s first BUR as well as its second national communication, fires occur frequently and that these could result in large amounts of non-CO2 emissions, in particular on peatland forests. The AT considers the inclusion of non-CO2 greenhouse gas emissions an area for technical improvement of the FREL.
We agree to the statement, non-CO2 specific for peat fire will probably our closest future improvement
No
33. The submitted FREL does not include emissions from peat fires. According to the BUR, peat fires make up 30.6 per cent of emissions from the land use sector, more than forest and grassland conversion, which add up to 23.9 per cent. The submission explains that peat fires have not been included in the FREL due to the complexity and high uncertainty of related activity data, but that Indonesia has plans to also include peatfires into the FREL in the future. The AT acknowledges these plans and considers the inclusion of peat fires an area for technical improvement of the FREL
Thank you very much, we agree with the content and text.
No
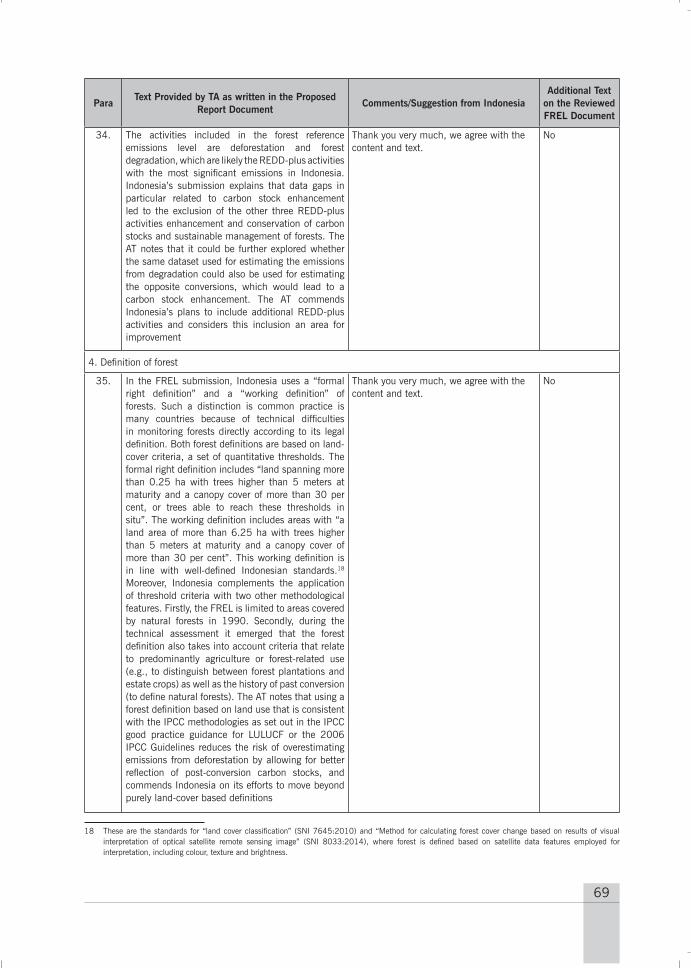
69
ParaText Provided by TA as written in the Proposed
Report DocumentComments/Suggestion from Indonesia
Additional Text on the Reviewed FREL Document
34. The activities included in the forest reference emissions level are deforestation and forest degradation, which are likely the REDD-plus activities with the most significant emissions in Indonesia. Indonesia’s submission explains that data gaps in particular related to carbon stock enhancement led to the exclusion of the other three REDD-plus activities enhancement and conservation of carbon stocks and sustainable management of forests. The AT notes that it could be further explored whether the same dataset used for estimating the emissions from degradation could also be used for estimating the opposite conversions, which would lead to a carbon stock enhancement. The AT commends Indonesia’s plans to include additional REDD-plus activities and considers this inclusion an area for improvement
Thank you very much, we agree with the content and text.
No
4. Definition of forest
35. In the FREL submission, Indonesia uses a “formal right definition” and a “working definition” of forests. Such a distinction is common practice is many countries because of technical difficulties in monitoring forests directly according to its legal definition. Both forest definitions are based on land-cover criteria, a set of quantitative thresholds. The formal right definition includes “land spanning more than 0.25 ha with trees higher than 5 meters at maturity and a canopy cover of more than 30 per cent, or trees able to reach these thresholds in situ”. The working definition includes areas with “a land area of more than 6.25 ha with trees higher than 5 meters at maturity and a canopy cover of more than 30 per cent”. This working definition is in line with well-defined Indonesian standards.18 Moreover, Indonesia complements the application of threshold criteria with two other methodological features. Firstly, the FREL is limited to areas covered by natural forests in 1990. Secondly, during the technical assessment it emerged that the forest definition also takes into account criteria that relate to predominantly agriculture or forest-related use (e.g., to distinguish between forest plantations and estate crops) as well as the history of past conversion (to define natural forests). The AT notes that using a forest definition based on land use that is consistent with the IPCC methodologies as set out in the IPCC good practice guidance for LULUCF or the 2006 IPCC Guidelines reduces the risk of overestimating emissions from deforestation by allowing for better reflection of post-conversion carbon stocks, and commends Indonesia on its efforts to move beyond purely land-cover based definitions
Thank you very much, we agree with the content and text.
No
18 These are the standards for “land cover classification” (SNI 7645:2010) and “Method for calculating forest cover change based on results of visual interpretation of optical satellite remote sensing image” (SNI 8033:2014), where forest is defined based on satellite data features employed for interpretation, including colour, texture and brightness.
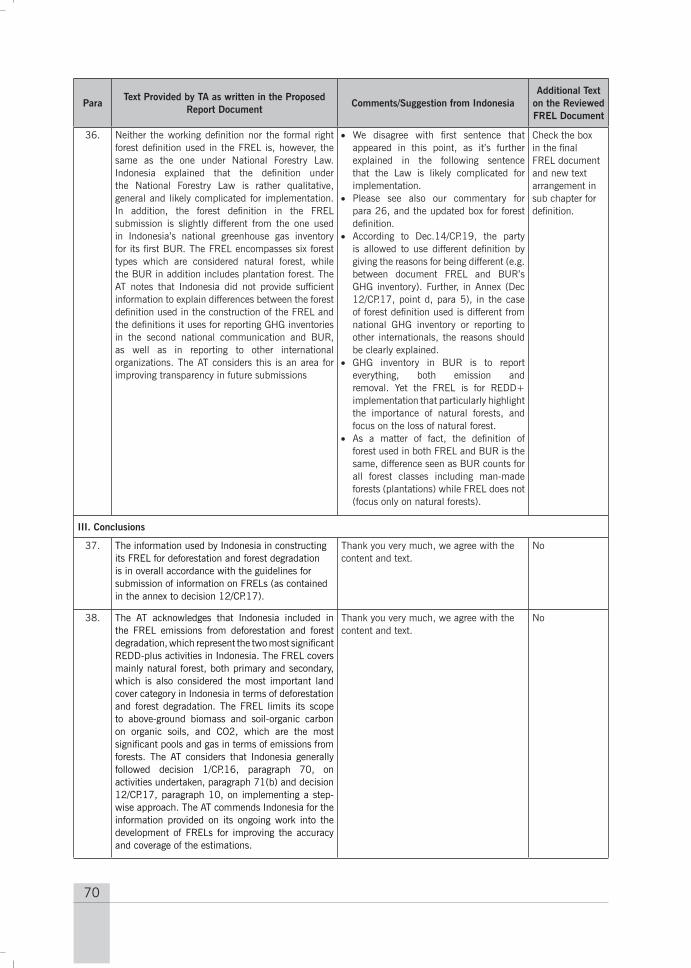
70
ParaText Provided by TA as written in the Proposed
Report DocumentComments/Suggestion from Indonesia
Additional Text on the Reviewed FREL Document
36. Neither the working definition nor the formal right forest definition used in the FREL is, however, the same as the one under National Forestry Law. Indonesia explained that the definition under the National Forestry Law is rather qualitative, general and likely complicated for implementation. In addition, the forest definition in the FREL submission is slightly different from the one used in Indonesia’s national greenhouse gas inventory for its first BUR. The FREL encompasses six forest types which are considered natural forest, while the BUR in addition includes plantation forest. The AT notes that Indonesia did not provide sufficient information to explain differences between the forest definition used in the construction of the FREL and the definitions it uses for reporting GHG inventories in the second national communication and BUR, as well as in reporting to other international organizations. The AT considers this is an area for improving transparency in future submissions
• We disagree with first sentence that appeared in this point, as it’s further explained in the following sentence that the Law is likely complicated for implementation.
• Please see also our commentary for para 26, and the updated box for forest definition.
• According to Dec.14/CP.19, the party is allowed to use different definition by giving the reasons for being different (e.g. between document FREL and BUR’s GHG inventory). Further, in Annex (Dec 12/CP.17, point d, para 5), in the case of forest definition used is different from national GHG inventory or reporting to other internationals, the reasons should be clearly explained.
• GHG inventory in BUR is to report everything, both emission and removal. Yet the FREL is for REDD+ implementation that particularly highlight the importance of natural forests, and focus on the loss of natural forest.
• As a matter of fact, the definition of forest used in both FREL and BUR is the same, difference seen as BUR counts for all forest classes including man-made forests (plantations) while FREL does not (focus only on natural forests).
Check the box in the final FREL document and new text arrangement in sub chapter for definition.
III. Conclusions
37. The information used by Indonesia in constructing its FREL for deforestation and forest degradation is in overall accordance with the guidelines for submission of information on FRELs (as contained in the annex to decision 12/CP.17).
Thank you very much, we agree with the content and text.
No
38. The AT acknowledges that Indonesia included in the FREL emissions from deforestation and forest degradation, which represent the two most significant REDD-plus activities in Indonesia. The FREL covers mainly natural forest, both primary and secondary, which is also considered the most important land cover category in Indonesia in terms of deforestation and forest degradation. The FREL limits its scope to above-ground biomass and soil-organic carbon on organic soils, and CO2, which are the most significant pools and gas in terms of emissions from forests. The AT considers that Indonesia generally followed decision 1/CP.16, paragraph 70, on activities undertaken, paragraph 71(b) and decision 12/CP.17, paragraph 10, on implementing a step-wise approach. The AT commends Indonesia for the information provided on its ongoing work into the development of FRELs for improving the accuracy and coverage of the estimations.
Thank you very much, we agree with the content and text.
No

71
ParaText Provided by TA as written in the Proposed
Report DocumentComments/Suggestion from Indonesia
Additional Text on the Reviewed FREL Document
39. As a result of the facilitative interactions with the AT during the TA session, Indonesia submitted a modified submission that took into consideration the technical inputs by the AT. The AT notes that the transparency and completeness of information improved significantly in the modified FREL submission, without the need to alter the approach or values used to construct the FREL, and commends Indonesia for the efforts made.
Thank you very much, we agree with the content and text.
No
40. The AT notes that Indonesia achieves consistency between the FREL and the national GHG inventory contained in its first BUR in terms of using the same principal datasets.
Thank you very much, we agree with the content and text.
No
41. In its submission Indonesia explains that the FREL was constructed based on the current available data and knowledge under national circumstances, capacity and capability. Indonesia indicated a number of areas with opportunities for improvement. The AT agrees with Indonesia’s assessment and commends Indonesia on the ongoing work in the following areas for improvement: (a) Improvement of activity data: The approach to
change detection could be improved among other things to achieve consistency in satellite image interpretation. Rather than analyzing satellite images for the time points individually and overlaying, change detection from satellite images would preferably directly compare the change between subsequent images. Also, introducing modern image processing techniques may facilitate consistency in image interpretation.
(b) Improvement of forest emission factor (carbon stock): The submission describes plans for further improving the emission factors derived from the national forest inventory.
(c) Improvement of peatland emission factors: The current approach assumes that deforestation and forest degradation always occur together with peatland drainage. Indonesia explains that data collection for a better understanding of peatland characteristics would help in improving peatland emission factors.
(d) Estimating peat land fire emissions: The national GHG inventory highlights the importance of peatfires in Indonesia. Indonesia is working on improvements to the methodology for activity data identification in order to reduce uncertainties and include emissions from peatland fires into the FREL.
• It is true that we implemented an epochal image interpretation to create land-cover data, and overlaid the sequential independent land-cover data to detect the change. Establishing a specific theme on change detection would be the most important need in the future, and it has been introduced in research scale (e.g. study by Margono et al. 2014 who works specific for Indonesia), if that is what called “modern image processing”. Indonesia has not yet at the point of implementing such “modern image processing”, as the country needs distinct classes between several land cover classes with similar pixels value (recall Indonesia needs 23 land cover classes for the monitoring purposes, instead of only forested and non-forested classes). In this case, as the existing system is an operational system, we need more steps, efforts and exercises to combine a knowledge of historical land covers generated from sub-national offices, with sophisticated enhanced image processing techniques. Please also noted, that the term of “modern image processing” approach is not commonly used, and we suggested to use term of “advanced image processing techniques”, instead.
• Yes, indeed, it’s a continuing research agenda.
• Yes and, it’s a big research agenda for which the national and international communities should join forces. The need is not merely on the emission factors, yet rather a combination of challenges in improving the emission factors as well as methods for collection of activity data; the latter is not any simpler owing to the complex variation of our land use and
Complementary text to explain the Indonesia’s condition in point (a) is elaborated more in the Annex 1; and more detail about future improvement is in Chapter 7.
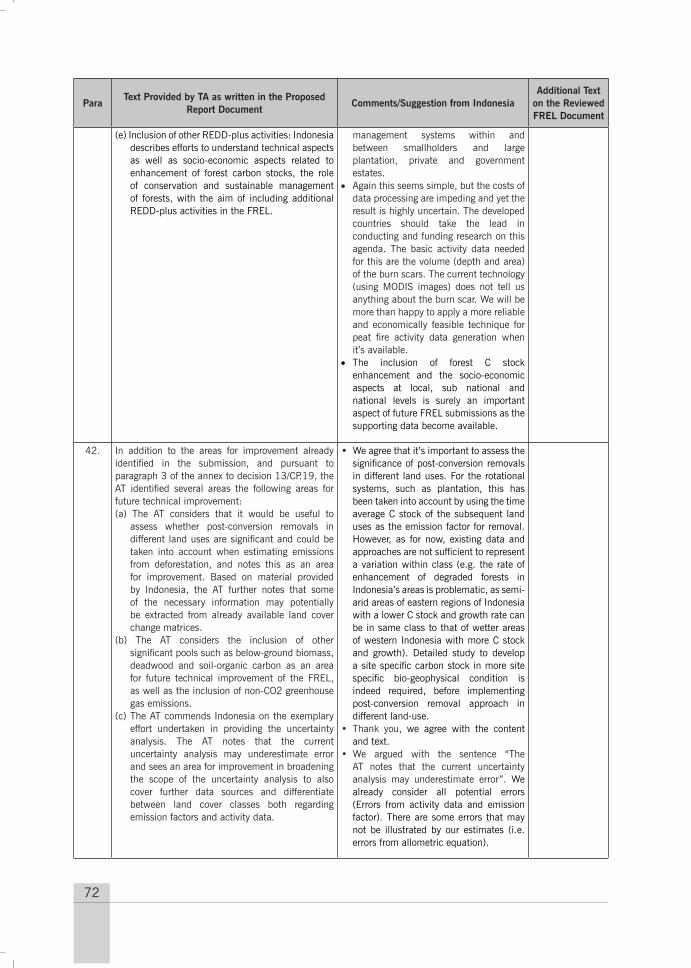
72
ParaText Provided by TA as written in the Proposed
Report DocumentComments/Suggestion from Indonesia
Additional Text on the Reviewed FREL Document
(e) Inclusion of other REDD-plus activities: Indonesia describes efforts to understand technical aspects as well as socio-economic aspects related to enhancement of forest carbon stocks, the role of conservation and sustainable management of forests, with the aim of including additional REDD-plus activities in the FREL.
management systems within and between smallholders and large plantation, private and government estates.
• Again this seems simple, but the costs of data processing are impeding and yet the result is highly uncertain. The developed countries should take the lead in conducting and funding research on this agenda. The basic activity data needed for this are the volume (depth and area) of the burn scars. The current technology (using MODIS images) does not tell us anything about the burn scar. We will be more than happy to apply a more reliable and economically feasible technique for peat fire activity data generation when it’s available.
• The inclusion of forest C stock enhancement and the socio-economic aspects at local, sub national and national levels is surely an important aspect of future FREL submissions as the supporting data become available.
42. In addition to the areas for improvement already identified in the submission, and pursuant to paragraph 3 of the annex to decision 13/CP.19, the AT identified several areas the following areas for future technical improvement:(a) The AT considers that it would be useful to
assess whether post-conversion removals in different land uses are significant and could be taken into account when estimating emissions from deforestation, and notes this as an area for improvement. Based on material provided by Indonesia, the AT further notes that some of the necessary information may potentially be extracted from already available land cover change matrices.
(b) The AT considers the inclusion of other significant pools such as below-ground biomass, deadwood and soil-organic carbon as an area for future technical improvement of the FREL, as well as the inclusion of non-CO2 greenhouse gas emissions.
(c) The AT commends Indonesia on the exemplary effort undertaken in providing the uncertainty analysis. The AT notes that the current uncertainty analysis may underestimate error and sees an area for improvement in broadening the scope of the uncertainty analysis to also cover further data sources and differentiate between land cover classes both regarding emission factors and activity data.
• We agree that it’s important to assess the significance of post-conversion removals in different land uses. For the rotational systems, such as plantation, this has been taken into account by using the time average C stock of the subsequent land uses as the emission factor for removal. However, as for now, existing data and approaches are not sufficient to represent a variation within class (e.g. the rate of enhancement of degraded forests in Indonesia’s areas is problematic, as semi-arid areas of eastern regions of Indonesia with a lower C stock and growth rate can be in same class to that of wetter areas of western Indonesia with more C stock and growth). Detailed study to develop a site specific carbon stock in more site specific bio-geophysical condition is indeed required, before implementing post-conversion removal approach in different land-use.
• Thank you, we agree with the content and text.
• We argued with the sentence “The AT notes that the current uncertainty analysis may underestimate error”. We already consider all potential errors (Errors from activity data and emission factor). There are some errors that may not be illustrated by our estimates (i.e. errors from allometric equation).

73
ParaText Provided by TA as written in the Proposed
Report DocumentComments/Suggestion from Indonesia
Additional Text on the Reviewed FREL Document
(d) The AT identified several areas in which the provision of additional information of further descriptions and details would improve the transparency of the submission. These include explanations on how the emission factors from the 2013 IPCC Wetlands Supplement were chosen and applied, reasons for differences between the forest definition used in the construction of the FREL and the definitions used for reporting GHG inventories in the second national communication and BUR, and definitions used for reporting to other international organizations. In addition to a clear step-by-step description of the methodology applied in evaluation of satellite images would be useful to improve the understanding of the provided material.
Yet we have identified a number of area for future improvement as noted by the AT. With such improvements we expect that the level of uncertainty would be closer to the real error. Saying that our approach is leading to underestimate error is not appropriate, as our approach has already been included all efforts and data we can do and gather at the time being.
• We addressed this in our response to Para 23. Several assumptions were used in adapting the IPCC 2013 to our 23 land cover classes and we will remove the assumptions when appropriate research results are available to cover those missing classes. Additional information has been added in the final version of FREL Submission (Table 3).
Improved Table 3.
43. In conclusion, the AT commends Indonesia for developing its national capabilities for forest monitoring, and for showing a strong commitment to the continuous improvement of its FREL estimates, in line with the step-wise approach. The AT acknowledges that the areas for future improvements identified in this report are subject to national capabilities and policies, and notes the importance of adequate and predictable support. The AT also acknowledges that the assessment process was an opportunity for a rich, open, facilitative and constructive technical exchange of information with Indonesia. Finally, the AT notes the willingness of Indonesia to contribute to the global effort to mitigate climate change through the REDD-plus process.
Thank you for all of your comments and inputs, especially on areas of improvements and on the AT high expectations. We commit and strive on improving our methods, and we are willing to contribute to the global effort to mitigate climate change, especially for those areas that will significantly improve the sustainability of our forests, without sacrificing our objectives on food security and economic development. We will adopt those improved emission factors and activity data collection methods when they are available and feasible to run. The agendas on improvement of emission factors and activity data are big, costly, and require long term and systematic research agendas. Join forces between developed and developing countries are necessary in this endeavor.
No
44. The table in the annex summarizes the main characteristics of Indonesia’s proposed FREL
The table is very helpful and informative to structure our respond in a systematic order
74
Report on the technical assessment of the proposed forest reference emission level of Indonesia submitted in 2016
Summary
This report covers the technical assessment of the submission of Indonesia, on a voluntary basis, on its proposed forest reference emission level (FREL), in accordance with decision 13/CP.19 and in the context of results-based payments. The FREL proposed by Indonesia covers the activities “reducing emissions from deforestation” and “reducing emissions from forest degradation”, which are among the activities included in decision 1/CP.16, paragraph 70. In its submission, Indonesia has developed a FREL for natural forests in the entire national territory of Indonesia. The assessment team notes that the data and information used by Indonesia in constructing its FREL are transparent and complete, and are in overall accordance with the guidelines contained in the annex to decision 12/CP.17. This report contains the assessed FREL and a few areas identified for further technical improvement by the assessment team, according to the scope of the technical assessment in the annex to decision 13/CP.19.
Lampiran 4. Report on the technical assessment of the proposed forest reference emission level of Indonesia submitted in 2016
75
Contents
Paragraphs Page
I. Introduction and summary 1–9 3 A. Overview 1–5 3 B. Proposed forest reference emission level 6–9 4
II. Data, methodologies and procedures used in the construction of the proposed forest reference emission level 10–35 4
How each element in the annex to decision 12/CP.17 was taken into account in the construction of the forest reference emission level 10–35 4
III. Conclusions 36–43 10
Annex
Summary of main features of the proposed forest reference emission level based on information provided by the Party 13
76
I. Introduction and summary
A. Overview
1. This report covers the technical assessment (TA) of the submission of Indonesia on its proposed forest reference emission level (FREL)1, submitted on 4 January 2016 in accordance with decisions 12/CP.17 and 13/CP.19. The TA took place (as a centralized activity) from 17 to 18 March 2016 in Bonn, Germany, and was coordinated by the secretariat.2 The TA was conducted by two land use, land-use change and forestry (LULUCF) experts from the UNFCCC roster of experts3 (hereinafter referred to as the assessment team (AT)): Mr. Nagmeldin Elhassan (Sudan) and Mr. Till Neeff (Germany). In addition, Mr. Kamel Djemouai, an expert from the Consultative Group of Experts on National Communications from Parties not included in Annex I to the Convention, participated as an observer4 during the centralized activity in Bonn.
2. In response to the invitation by the Conference of the Parties (COP) and in accordance with the provisions of decision 12/CP.17, paragraphs 7–15, and its annex, Indonesia submitted, on a voluntary basis, its proposed FREL. This proposed FREL is one of the elements5 to be developed in the implementation of the activities referred to in decision 1/CP.16, paragraph 70. The COP decided that each submission of a proposed FREL or forest reference level (FRL), as referred to in decision 12/CP.17, paragraph 13, shall be subject to a TA in the context of results-based payments, pursuant to decision 13/CP.19, paragraphs 1 and 2, and decision 14/CP.19, paragraphs 7 and 8.
3. The objective of this TA was to assess the degree to which information provided by Indonesia was in accordance with the guidelines for submissions of information on FRELs and FRLs6 and to offer a facilitative,
1 The submission of Indonesia is available at <http://unfccc.int/8414>.
2 Decision 13/CP.19, annex, paragraph 7.
3 Decision 13/CP.19, annex, paragraphs 7 and 9.
4 Decision 13/CP.19, annex, paragraph 9.
5 Decision 1/CP.16, paragraph 71(b).
6 Decision 12/CP.17, annex.
77
non-intrusive, technical exchange of information on the construction of the FREL, with a view to supporting the capacity of Indonesia for the construction and future improvement of FRELs, as appropriate.7
4. The TA of the FREL submitted by Indonesia was undertaken in accordance with the guidelines and procedures for the TA of submissions from Parties on proposed FRELs and FRLs as contained in the annex to decision 13/CP.19. This report on the TA was prepared by the AT following the guidelines and procedures in the same decision.
5. Following the process contained in the guidelines and procedures of the same decision, a draft version of this report was communicated to the Government of Indonesia. The facilitative exchange during the TA allowed Indonesia to provide clarifications and information that were considered by the AT in the preparation of this report.8 As a result of the facilitative interactions with the AT during the TA session, Indonesia submitted a modified version on 13 May 2016, which took into consideration the technical input by the AT. The modifications improved the clarity and transparency of the submitted FREL, without the need to alter the approach used to construct the originally proposed FREL. This TA report was prepared based on the context of the modified FREL submission. The modified submission, which contains the assessed FREL, and the original submission are available on the UNFCCC website.9
B. Proposed forest reference emission level
6. The FREL proposed by Indonesia for the historical reference period 1990–2012 is the annual average of carbon dioxide (CO2) emissions associated with deforestation and forest degradation occurring in the areas that were natural forest in 1990. Deforestation is included as the gross emissions associated with the conversion of natural forest lands to non-forested lands, excluding any subsequent emissions or removals. Emissions from forest degradation are included in the FREL as results from the conversion of primary forest to secondary forest, taking into account that, for Indonesia, secondary forests encompass all disturbed forest types.
7 Decision 13/CP.19, annex, paragraph 1(a) and (b).
8 Decision 13/CP.19, annex, paragraphs 1(b), 13 and 14.
9 <http://unfccc.int/8414>.
78
7. The proposed FREL covers all land areas covered by natural forests in the year 1990, which is about 113.2 million hectares (ha) or 60 per cent of Indonesia’s total land area. For this FREL submission, data from eight unequal time periods between 1990 and 2012 were used to capture historical land-cover change. The FREL takes into account emissions from the aboveground biomass carbon pool and also, for deforestation and forest degradation over peatlands, from soil organic carbon. It does not include other gases and pools or REDD-plus10 activities.
8. In its submission, Indonesia applies a stepwise approach to the development of the FREL, in accordance with decision 12/CP.17, paragraph 10, with the aim of improving the FREL by incorporating better data, improved methodologies and, where appropriate, additional pools. The submission lists a number of areas for technical improvement, such as refining activity data and emission factors, estimating peatland fire emissions and including additional REDD-plus activities.
9. The national FREL submitted by Indonesia is 568,859,881 tonnes of carbon dioxide equivalent (t CO2 eq) for the year 2013, but increasing annually because of accumulating emissions from peat decomposition, and reaching 593,329,235 t CO2 eq for the year 2020.
II. Data, methodologies and procedures used in the construction of the proposed forest reference emission level How each element in the annex to decision 12/CP.17 was taken into account in the construction of the forest reference emission level
1. Information that was used by the Party in the construction of the forest reference emission level
10. Indonesia includes in its FREL submission information about earlier work on reference levels related to deforestation and forest degradation. The current FREL builds on experiences and capacities gained from these efforts. The AT commends Indonesia for early action on the implementation of activities to reduce emissions from deforestation and forest degradation.
10 In decision 1/CP.16, paragraph 70, the COP encouraged developing country Parties to contribute to mitigation actions in the forest sector by undertaking the following activities: reducing emissions from deforestation; reducing emissions from forest degradation; conservation of forest carbon stocks; sustainable management of forests; and enhancement of forest carbon stocks.
79
11. The methods used by Indonesia are consistent with the Intergovernmental Panel on Climate Change (IPCC) Good Practice Guidance for Land Use, Land-Use Change and Forestry (hereinafter referred to as the IPCC good practice guidance for LULUCF) and the 2006 IPCC Guidelines for National Greenhouse Gas Inventories (hereinafter referred to as the 2006 IPCC Guidelines), as applied to the construction of the FREL. For the estimation of emissions from peat decomposition the 2013 Supplement to the 2006 Guidelines for National Greenhouse Gas Inventories: Wetlands (hereinafter referred to as the Wetlands Supplement) was used.
12. Indonesia’s proposed FREL covers emissions from gross deforestation (defined as loss of natural forest cover below a certain threshold) and forest degradation (defined as a change from primary forest to disturbed secondary forest). It covers the reference period from 1990 to 2012. Data are available for eight time points during that 22-year period, totalling seven measurement periods with a duration of between one and six years: 1990–1996, 1996–2000, 2000–2003, 2003–2006, 2006–2009, 2009–2011 and 2011–2012. More recent years have a greater availability of data and therefore shorter measurement periods. The timing of mitigation activities, for example under Indonesia’s National Action Plan for Reducing Greenhouse Gas Emissions11 or the Indonesian logging moratorium,12 were not considered as most important in defining the end date of the reference period. During the TA, Indonesia explained that a long reference period was chosen to capture the dynamics of policy and social aspects, which in turn provides an opportunity to appropriately predict national circumstances affecting land-use policy; for example, changes in government, anthropogenic disasters and fluctuating market demand for commodities. The AT commends Indonesia for the effort made in analysing the different measurement periods and compiling information across such a long reference period.
13. The activity data used for the construction of the FREL are land-cover data from the National Forest Monitoring System (NFMS), which are
11 Presidential regulation 61/2011 on Rencana Aksi Nasional Penurunan Emisi GRK (RAN-GRK).
12 The moratorium was first declared under presidential instruction 10/2010, and has been renewed every two years (presidential instructions 6/2013 and 8/2015).
80
publicly available on the NFMS website.13 These official data describe land-cover classes and forest-cover change over the years, which have been developed and updated regularly since 2000. In addition, data from the 1990s were added to the NFMS (from freely available Landsat satellite data archives). For this FREL submission, data sets for 1990, 1996, 2000, 2003, 2006, 2009, 2011 and 2012 were available and were used to capture historical land-cover data. The wall-to-wall land-cover maps that serve as activity data were produced by the Ministry of Environment and Forestry, using Landsat satellite images. The images were digitized manually by visual interpretation. The peatland spatial data used in the construction of the FREL were provided by the Ministry of Agriculture, and were based on several related maps, field surveys and ground checks.
14. The primary source of data used to derive emission factors for deforestation and forest degradation was the national forest inventory (NFI), complemented by additional research plots to fill information gaps for certain forest types (e.g. mangrove forest) that had not enough NFI plots. The NFI uses more than 3,900 clusters of sample plots, with each cluster consisting of a permanent sample plot of 1 ha surrounded by eight temporary sample plots. Emission factors for peat decomposition were taken from the Wetlands Supplement, which, according to Indonesia, were in fact mostly derived from data from Indonesia and can therefore be considered suitable for estimating emissions from peat decomposition in the FREL.
2. Transparency, completeness, consistency and accuracy of the information used in the construction of the forest reference emission level
Methodological information, including description of data sets, approaches and methods
15. According to the approach applied, forest loss can occur only once in each specific area. The submission covers only natural forests, defined as forests never having undergone unstocking, not even temporarily. During the TA, Indonesia clarified that it uses a mask to exclude any areas of prior deforestation from the data processing. The AT considers this to be
13 <http://nfms.dephut.go.id>.
81
an effective approach. As a result of the facilitative exchange, Indonesia included a step-by-step description of the methodology applied in the modified submission. The AT considers that the explanations improve the transparency of the submission and commends Indonesia for these efforts.
16. The AT understands that deforestation and forest degradation activity data were quantified by overlaying maps from different time points. In a first step, for each of the time points, a set of satellite images was used to generate land cover maps. In a second step, changed areas were determined from overlaying these maps with others. During the technical assessment, the AT pointed out that direct comparison of satellite images would reduce the sources of errors and is seen as best practice in remote sensing analysis. Indonesia acknowledged that such an approach is often considered to generate better results, but explained that processing data for the complex land-cover information of the whole country and for the long time frame in question would be highly challenging and would require extensive ground truthing. Indonesia highlighted, however, its plans to improve land-use and land-cover mapping. The AT acknowledges this explanation and commends Indonesia for these efforts, agreeing that moving from single-date interpretation to interpretation techniques for time series of satellite images is an area for improvement.
17. During the TA, Indonesia provided a large amount of background information and material, including land-cover matrices for peatlands. The AT observed some discontinuity in these data that may indicate difficulties in ensuring consistency.14 According to the FREL submission, land-cover maps were derived largely using visual interpretation, with a large number of image interpreters contributing to the task. The AT acknowledged the immense effort that went into building the time series of land-cover maps, but noted that maintaining a consistent interpretation approach across diverse interpreters is very difficult and that this is a potential source of the observed discontinuity. In response, Indonesia explained that it is exploring ways to develop the existing NFMS, for example by combining automated methods and visual interpretation, in order to improve the land-cover data. In line with this, in the view of the
14 For example, the data show that: estate crops increased from 131,000 ha to 493,000 ha in four years, between 1996 and 2000; plantation forest increased from 281,000 ha to 482,000 ha in two years, between 2009 and 2011; and wet shrubs increased from 0 ha to 479,000 ha and further to 1,401,000 ha in six and ten years, between 1990 and 1996 and between 1990 and 2000.
82
AT, improving quality management is an area for improvement. The AT commends Indonesia for its efforts to compile land-cover databases using automated interpretation approaches across long time series of satellite images and to improve the existing NFMS. Introducing automated processing may help to ensure a coherent interpretation.
18. Emission factors used in the FREL for deforestation and forest degradation are based on data from Indonesia’s NFI. In the submission, Indonesia reports that 4,450 measurements of permanent sample plots were available for calculations, complemented by additional forest research data. Despite the large number of plots, the AT noted that there are still gaps for individual strata. For example, there are very few measurements for the island of Java or for mangrove forests. The submission highlights ongoing work to improve the NFI and to refine the set of emission factors. The AT acknowledges these plans and agrees that improving the set of emission factors is an area for improvement.
19. In its submission, Indonesia includes only the gross emissions from deforestation that are associated with clear-cut forests, excluding any potential biomass regrowth and associated removals after the deforestation event. The AT noted that this is a reasonable approach when forest is converted to cropland with annual crops, but not necessarily when the crops are perennial or when there are other woody biomass stocks. In response, Indonesia clarified that when natural forest has been converted to non-forested lands, they rarely grow back into natural forest. Therefore the proposed FREL excludes plantation forests and non-forest classes such as croplands, agricultural lands, shrubs, savannah and grasses, paddy fields, transmigration areas, settlement areas, ports and harbours, mines and bare lands. The AT notes that this exclusion of removals in post-conversion carbon stocks likely leads to an overestimation of emissions from deforestation. The AT considers that it would be useful to assess whether post-conversion removals are significant and could be taken into account when estimating emissions from deforestation, and notes this as an area for technical improvement.15
15 The AT estimated the relevance of such conversion for natural forests on peatlands using a set of land-cover change matrices provided by Indonesia. With the available data, the estimation was possible only for peatlands where, over the reference period, 999,694 ha of natural forests were converted to estate crops and 549,366 ha of natural forests were converted to forest planta-tions, representing 35 per cent of natural forest loss. Total forest loss until 2012 amounted to 4,407,621 ha. It is unclear whether this estimation could be indicative of a more general trend.
83
20. To identify activity data for soil organic carbon emissions from peatland drainage in areas subject to deforestation or forest degradation, the FREL submission overlays land-cover maps with Indonesia’s peatland map. For deforestation and forest degradation occurring on peatlands, additional emissions from the soil organic carbon pool are then calculated. These two data sets are not perfectly harmonized.16 During the TA, Indonesia acknowledged that such imperfect harmonization may occur in “sliver areas”. While maps and definitions could technically be harmonized, Indonesia explained that fully harmonizing data sets would require collaboration and arrangements between several ministry-level agencies and is therefore not easy to achieve. The AT acknowledges that Indonesia has plans to improve peatland mapping and agrees that ensuring consistency between the land-cover map and the peatland map is an area for improvement.
21. Indonesia’s FREL includes soil organic carbon emissions from peatland decomposition associated with deforestation and forest degradation on peatlands. Indonesia calculates these emissions for all areas of deforestation or forest degradation that occur on peatlands using detailed information on the post-conversion land cover, which determines decomposition rates. The decomposition rate is variable; for example, the rate in peatlands with annual crops may differ from that in peatlands with secondary forest. The AT commends Indonesia for its efforts to track land-cover changes post-conversion. The AT noted that while the emission factors from the Wetlands Supplement are intended to be applied only to “drained organic soils”, the FREL does not distinguish areas with and without drainage. During the facilitative exchange for the TA, Indonesia explained that deforestation and forest degradation on peatlands are usually accompanied by drainage. The Party also included information in the modified FREL submission explaining that it is impossible to trace back the drained and the negligibly small areas of undrained secondary peat forest and therefore Indonesia considers it justifiable to consider all of the secondary forests as drained forests. The AT notes that the FREL submission does not currently include data to substantiate this. The submission does, however, highlight Indonesia’s plans to improve the data on peatlands, chiefly with regard to emission factors and their
16 For example, the calculations identify dryland forests growing on organic soils.
84
dependency on the water table. The AT acknowledges these plans and agrees that collecting more detailed data on the management of peatlands is an area for improvement.
22. Most of Indonesia’s land-cover information covers time periods of up to six years. The emission factors from the Wetlands Supplement describe annual emissions for land use types. Applying one single emission factor across a multi-year period would introduce bias. Indonesia avoids such bias by averaging the emission factors from before and after the change and then applying the average to the whole period. The AT commends Indonesia for its diligence in avoiding bias.
23. The submission uses different approaches to calculating means for the biomass pools over the reference period. For calculating average deforestation emissions and degradation emissions in the aboveground biomass pool, a simple arithmetic mean is used across all available periods, although the underlying forest-cover change is measured for unequal time intervals according to the availability of land-cover maps. For example, the estimate for the years 1990–1996 is taken into account only once for aboveground biomass. For calculating peatland emissions in the soil organic carbon pool, however, the applied regression approach reuses the estimates according to the different lengths of time interval. For example, the estimate for the years 1990–1996 is taken into account six times for the soil organic carbon pool. The AT notes that it would be useful if the submission explained the reasons for such methodological differences.
24. During the TA, Indonesia pointed out that the first biennial update report (BUR) of Indonesia and the FREL use the same principal data sources. The AT commends Indonesia for establishing overall consistency of data sources between the FREL and the national greenhouse gas (GHG) inventory contained in the BUR.
25. The AT notes that the FREL applies a different forest definition than that used in the national GHG inventory contained in Indonesia’s first BUR (see paras. 34 and 35 below). In addition to the six natural forest classes contained in the FREL, the GHG inventory includes information about plantation forests. This addition may contribute to the difference between the deforestation estimate in the FREL and the area estimate
85
for conversion of forest to other land-cover categories in the GHG inventory.17 The GHG inventory estimates emissions and removals from forest land remaining forest land, taking into account statistical wood harvesting data and adjustments for illegal logging. Whether these estimates are fully consistent with the FREL data for forest degradation cannot be assessed, because the forest degradation estimates for the FREL are prepared using a different methodology that applies emission factors based on different average carbon stock values according to land-cover changes from primary to secondary forest, as discovered by remote sensing. In the modified FREL submission, Indonesia addressed this concern by explaining that emissions from further degradation of secondary forest were not included in the construction of the FREL because, at present, Indonesia does not have the capacity or data to assess the different levels of degradation occurring within secondary forests. The AT commends Indonesia for including an explanation of the forest definition in the modified FREL submission.
26. Indonesia carries out an uncertainty analysis of its FREL. The AT commends Indonesia for the exemplary effort made in providing the uncertainty analysis. During the TA, several aspects of the uncertainty analysis were discussed and areas for future improvement were identified; for example, moving from overall map accuracy to classification accuracy of individual classes or differentiating sampling errors between the individual forest classes. The AT notes that, in line with the stepwise approach, the current uncertainty analysis covers only selected sources of error, and the AT sees broadening the scope of the uncertainty analysis to cover further potential sources of error, and differentiating between land-cover classes with regard to emission factors and activity data, as an area for technical improvement.
Description of relevant policies and plans, as appropriate
27. The FREL submission provides information on legal, policy and planning frameworks related to the forest sector since 1967, and highlights the increasing demand on land and natural resources to meet the population’s food, energy and other development needs. The submission
17 According to the BUR, the deforestation rate fluctuated between 335 and 1,106 thousand ha/year from 2000 to 2012, while in the FREL the deforestation rate fluctuated between 444 and 914 thousand ha/year in the same period.
86
also includes information on the development of forest planning, management and allocation of lands of national forest for conversion for development purposes. In response to a question raised by the AT during the TA, Indonesia explained that the causes of deforestation and forest degradation have been considered in the construction of the FREL, and highlighted the fact that there was no specific quantitative calculation of deforestation and forest degradation drivers in the submission, because these drivers are very complex, involving cross-cutting issues related to policy, economic growth, population growth and individual sectors, as well as requiring appropriate data sets and research outputs to support them. The AT commends Indonesia for providing information on planning and policies and legal developments that have implications for deforestation.
3. Pools, gases and activities included in the construction of the forest refer-ence emission level
28. According to decision 12/CP.17, annex, subparagraph (c), reasons for omitting a pool and/or activity from the construction of the FREL should be provided, noting that significant pools and/or activities should not be excluded.
29. The carbon pools included in the FREL are aboveground biomass and soil organic carbon. Aboveground biomass is included for all strata, while soil organic carbon is included only for deforestation or forest degradation occurring on peatlands. Belowground biomass, litter and deadwood are not included. Soil organic carbon on any soils except peatlands is also not included.
30. Based on preliminary data from the Indomalaya ecozone, Indonesia estimates that belowground biomass, deadwood and litter amount to 13.6 per cent, 14.5 per cent and close to 2 per cent, respectively, of forest biomass (excluding soil organic carbon). The low biomass volume in litter is an indication of its low significance. In the modified FREL submission Indonesia explains that, at the national level, the information about other carbon pools is very limited. If the quantitative information presented in the submission is confirmed to be similar in other ecozones, the deadwood and belowground biomass carbon pools would likely be significant sources of emissions. The AT considers the treatment
87
of emissions from belowground biomass, deadwood and soil organic carbon as an area for technical improvement. Further, the AT notes that default IPCC root-to-shoot ratios could be used to estimate belowground biomass, and soil organic carbon on mineral soils could be estimated using IPCC stock change factors, which would allow a first indication of the importance of these carbon pools in Indonesia to be gained.
31. The submitted FREL includes only CO2 emissions and does not cover emissions of other GHGs. The submission states that CO2 contributes more than 99.9 per cent of total GHG emissions from LULUCF. The AT noted that, according to Indonesia’s first BUR as well as its second national communication, fires occur frequently in the country and these could result in large amounts of non-CO2 emissions, in particular on peatland forests. The AT considers the inclusion of non-CO2 GHG emissions an area for technical improvement.
32. The submitted FREL does not include emissions from peatland fires. According to the first BUR, peatland fires make up 30.6 per cent of emissions from the land use sector, which is more than forest and grassland conversion, which total 23.9 per cent. In the submission Indonesia explains that peatland fires have not been included in the FREL owing to the complexity and high uncertainty of related activity data, but that the Party has plans to include peatland fires in the FREL in the future. The AT acknowledges these plans and considers the inclusion of peatland fires an area for improvement.
33. The activities included in the FREL that are likely the REDD-plus activities with the most significant emissions in Indonesia are: reducing emissions from deforestation and from forest degradation. In its submission, Indonesia explains that data gaps, in particular those related to carbon stock enhancement, led to the exclusion of the other three REDD-plus activities (conservation and enhancement of forest carbon stocks and sustainable management of forests). The AT notes that Indonesia could explore whether the data set used for estimating the emissions from degradation could also be used for estimating the opposite conversions, which would lead to a carbon stock enhancement. The AT commends Indonesia for its plans to include additional REDD-plus activities and considers this inclusion an area for improvement.
88
4. Definition of forest
34. In the FREL submission, Indonesia uses a “formal right definition” and a “working definition” of forests. Such a distinction is common practice in many countries because of the technical difficulties in monitoring forests directly according to their legal definition. Both forest definitions are based on land-cover criteria, a set of quantitative thresholds. The formal right definition includes “land spanning more than 0.25 ha with trees higher than 5 metres at maturity and a canopy cover of more than 30 per cent, or trees able to reach these thresholds in situ”. The working definition includes areas with “a land area of more than 6.25 ha with trees higher than 5 metres at maturity and a canopy cover of more than 30 per cent”. This working definition is in line with well-defined Indonesian standards.18Moreover, Indonesia complements the application of threshold criteria with two other methodological features. First, the FREL is limited to areas covered by natural forests in 1990. Second, the forest definition takes into account criteria that relate to predominantly agricultural or forest-related use (e.g. to distinguish between forest plantations and estate crops) as well as the history of past conversion (to define natural forests). The AT notes that using a forest definition based on land use that is consistent with the IPCC methodologies as set out in the IPCC good practice guidance for LULUCF or the 2006 IPCC Guidelines reduces the risk of overestimating emissions from deforestation by allowing for better reflection of post-conversion carbon stocks, and commends Indonesia for its efforts to move beyond purely land cover based definitions.
35. The forest definition in the FREL submission is slightly different from that used in Indonesia’s national GHG inventory for its first BUR. The FREL encompasses six forest types that are considered natural forest, and the FREL does not include plantations, while the BUR does include plantations. During the TA, Indonesia explained that this discrepancy results from natural forests being the main concern for REDD-plus implementation.
18 These are the standards for “Land cover classification” (SNI 7645:2010) and “Method for calculating forest cover change based on results of visual interpretation of optical satellite remote sensing image” (SNI 8033:2014), where forests are defined based on satellite data features used for interpretation, including colour, texture and brightness.
89
III. Conclusions
36. The information used by Indonesia in constructing its FREL for deforestation and forest degradation is transparent and complete and is in overall accordance with the guidelines for submission of information on FRELs (as contained in the annex to decision 12/CP.17).
37. The AT acknowledges that Indonesia included in the FREL emissions from deforestation and forest degradation, which are the two most significant REDD-plus activities in Indonesia. The FREL covers mainly natural forest, both primary and secondary, which is considered to be the most important land-cover category in Indonesia in terms of deforestation and forest degradation. The FREL limits its scope to aboveground biomass and soil organic carbon on organic soils, and to CO2, which are the most significant pools and gas in terms of emissions from forests. The AT considers that Indonesia generally followed decision 1/CP.16, paragraph 70, on activities undertaken, paragraph 71(b) and decision 12/CP.17, paragraph 10, on implementing a stepwise approach. The AT commends Indonesia for the information provided on its ongoing work in the development of the FREL and improving the accuracy and coverage of the estimates.
38. As a result of the facilitative interactions with the AT during the TA session, Indonesia submitted a modified submission that took into consideration the technical inputs by the AT. The AT notes that the transparency and completeness of information improved significantly in the modified FREL submission, without the need to alter the approach or values used to construct the FREL, and commends Indonesia for the efforts it made.
39. The AT notes that Indonesia achieves consistency between the FREL and the national GHG inventory contained in its first BUR in terms of using the same principal data sets.
40. In its submission, Indonesia explains that the FREL was constructed based on the currently available data and knowledge of national circumstances, capacity and capability. Indonesia indicated a number of areas with opportunities for improvement. The AT agrees with Indonesia’s assessment and commends Indonesia for the ongoing work in the following areas for improvement:
(a) Activity data: to improve accuracy and consistency in satellite image interpretation, time series satellite images could be directly compared (rather than analysing satellite images for time points individually by
90
overlaying maps to detect changes) and automated image processing techniques could be introduced (see paras. 16 and 17 above);
(b) Forest emission factors (carbon stock): the submission describes plans for further improving the emission factors derived from the NFI (see para. 18 above);
(c) Peatland emission factors: the current approach assumes that deforestation and forest degradation always occur together with peatland drainage. Indonesia’s plans to improve data collection on peatlands will lead to a better understanding of their characteristics and to better peatland emission factors (see para. 21 above);
(d) Peatland fire emission estimates: the national GHG inventory highlights the importance of peatland fires in Indonesia. Indonesia is working on improvements to the methodology for activity data identification in order to reduce uncertainties and include emissions from peatland fires in the FREL (see para. 32 above);
(e) Inclusion of other REDD-plus activities: Indonesia describes efforts to understand the technical aspects as well as the socioeconomic aspects related to the enhancement of forest carbon stocks and the role of conservation and sustainable management of forests, with the aim of including additional REDD-plus activities in the FREL (see para. 33 above).
41. In addition to the areas for improvement already identified in the submission, and pursuant to decision 13/CP.19, annex, paragraph 3, the AT identified the following areas for future technical improvement:
(a) Assessment of whether post-conversion removals in different land uses are significant and could be taken into account when estimating emissions from deforestation. Based on information provided by Indonesia, the AT notes that some of the necessary information may potentially be extracted from already available land-cover change matrices (see para. 19 above);
(b) Broadening of the scope of the uncertainty analysis to cover further potential sources of error, and differentiating between land-cover classes with regard to emission factors and activity data (see para. 26 above);
(c) Inclusion of other significant pools, such as belowground biomass, deadwood and soil organic carbon (see para. 30 above), as well as the inclusion of non-CO2 GHG emissions (see para. 31 above).
91
42. In conclusion, the AT commends Indonesia for developing its national capabilities for forest monitoring, and for showing a strong commitment to the continuous improvement of its FREL estimates, in line with the stepwise approach. The AT acknowledges that the areas for future improvement identified in this report are subject to national capabilities and policies, and notes the importance of adequate and predictable support. The AT also acknowledges that the assessment process was an opportunity for a rich, open, facilitative and constructive technical exchange of information with Indonesia. Finally, the AT notes the willingness of Indonesia to contribute to the global effort to mitigate climate change through REDD-plus.
43. The table in the annex summarizes the main characteristics of Indonesia’s proposed FREL.
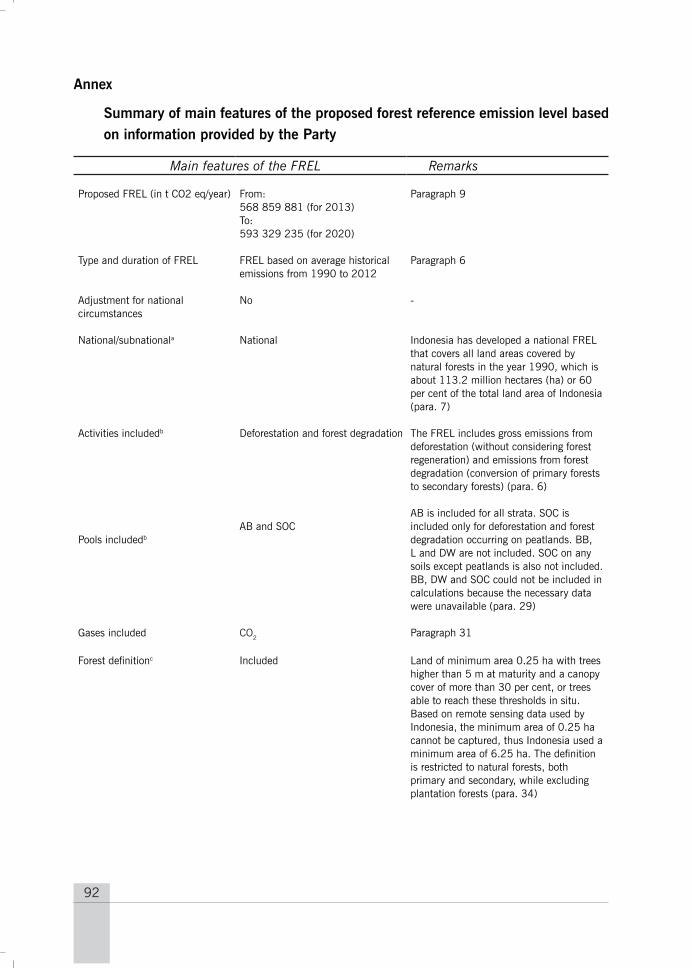
92
Annex
Summary of main features of the proposed forest reference emission level based on information provided by the Party
Main features of the FREL Remarks
Proposed FREL (in t CO2 eq/year)
Type and duration of FREL
Adjustment for national circumstances
National/subnationala
Activities includedb
Pools includedb
Gases included
From: 568 859 881 (for 2013) To: 593 329 235 (for 2020)
FREL based on average historical emissions from 1990 to 2012
No
National
Deforestation and forest degradation
AB and SOC
CO2
Paragraph 9
Paragraph 6
-
Indonesia has developed a national FREL that covers all land areas covered by natural forests in the year 1990, which is about 113.2 million hectares (ha) or 60 per cent of the total land area of Indonesia (para. 7)
The FREL includes gross emissions from deforestation (without considering forest regeneration) and emissions from forest degradation (conversion of primary forests to secondary forests) (para. 6)
AB is included for all strata. SOC is included only for deforestation and forest degradation occurring on peatlands. BB, L and DW are not included. SOC on any soils except peatlands is also not included. BB, DW and SOC could not be included in calculations because the necessary data were unavailable (para. 29)
Paragraph 31
Forest definitionc Included Land of minimum area 0.25 ha with trees higher than 5 m at maturity and a canopy cover of more than 30 per cent, or trees able to reach these thresholds in situ. Based on remote sensing data used by Indonesia, the minimum area of 0.25 ha cannot be captured, thus Indonesia used a minimum area of 6.25 ha. The definition is restricted to natural forests, both primary and secondary, while excluding plantation forests (para. 34)
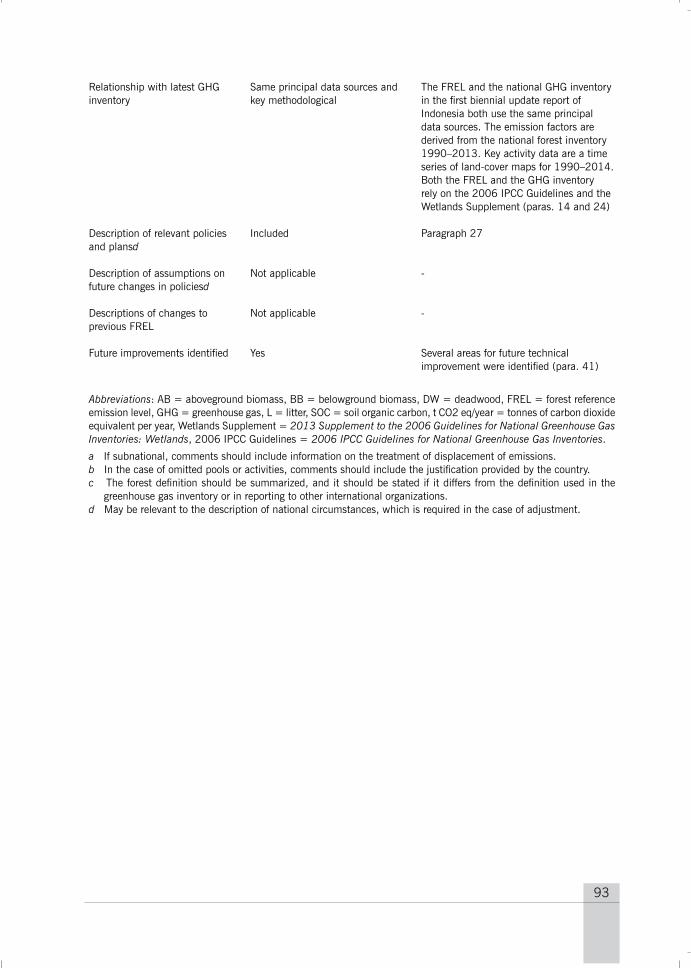
93
Relationship with latest GHG inventory
Same principal data sources and key methodological
The FREL and the national GHG inventory in the first biennial update report of Indonesia both use the same principal data sources. The emission factors are derived from the national forest inventory 1990–2013. Key activity data are a time series of land-cover maps for 1990–2014. Both the FREL and the GHG inventory rely on the 2006 IPCC Guidelines and the Wetlands Supplement (paras. 14 and 24)
Description of relevant policies and plansd
Description of assumptions on future changes in policiesd
Descriptions of changes to previous FREL
Future improvements identified
Included
Not applicable
Not applicable
Yes
Paragraph 27
-
-
Several areas for future technical improvement were identified (para. 41)
Abbreviations: AB = aboveground biomass, BB = belowground biomass, DW = deadwood, FREL = forest reference emission level, GHG = greenhouse gas, L = litter, SOC = soil organic carbon, t CO2 eq/year = tonnes of carbon dioxide equivalent per year, Wetlands Supplement = 2013 Supplement to the 2006 Guidelines for National Greenhouse Gas Inventories: Wetlands, 2006 IPCC Guidelines = 2006 IPCC Guidelines for National Greenhouse Gas Inventories.
a If subnational, comments should include information on the treatment of displacement of emissions. b In the case of omitted pools or activities, comments should include the justification provided by the country. c The forest definition should be summarized, and it should be stated if it differs from the definition used in the
greenhouse gas inventory or in reporting to other international organizations.d May be relevant to the description of national circumstances, which is required in the case of adjustment.