PACKFLOW 2025 - Valpak 2025 SUMMARY REPORT Written by Andrew McCaffery (Valpak Consulting) Heather...
27
PACKFLOW 2025 SUMMARY REPORT Wrien by Andrew McCaffery (Valpak Consulng) Heather Thomson (Valpak Consulng) Mike Jefferson (Verde Research and Consulng Ltd)
Transcript of PACKFLOW 2025 - Valpak 2025 SUMMARY REPORT Written by Andrew McCaffery (Valpak Consulting) Heather...
PACKFLOW 2025SUMMARY REPORT
Written by
Andrew McCaffery (Valpak Consulting)Heather Thomson (Valpak Consulting)Mike Jefferson (Verde Research and Consulting Ltd)
CONTENTS
Introduction 03
Assessing the UK 04
European Schemes Research 06
Compliance Costs 07
Control and Strategic Development 08
Communication Funds 09
Changing Behaviours 10
Calculation of Recycling Rates 11
Complementary Measures 12
Summary of Lessons Learnt 13
UK Model Development 14
Model 1 Existing UK System 15
Model 2 Enhanced UK System 16
Model 3 Strategic UK System 18
Model 4 Direct Control System 21
Summary of Models – Costs and Conclusion 23
Next Steps 25
Glossary 26
Get in Touch 27
02
Introduction
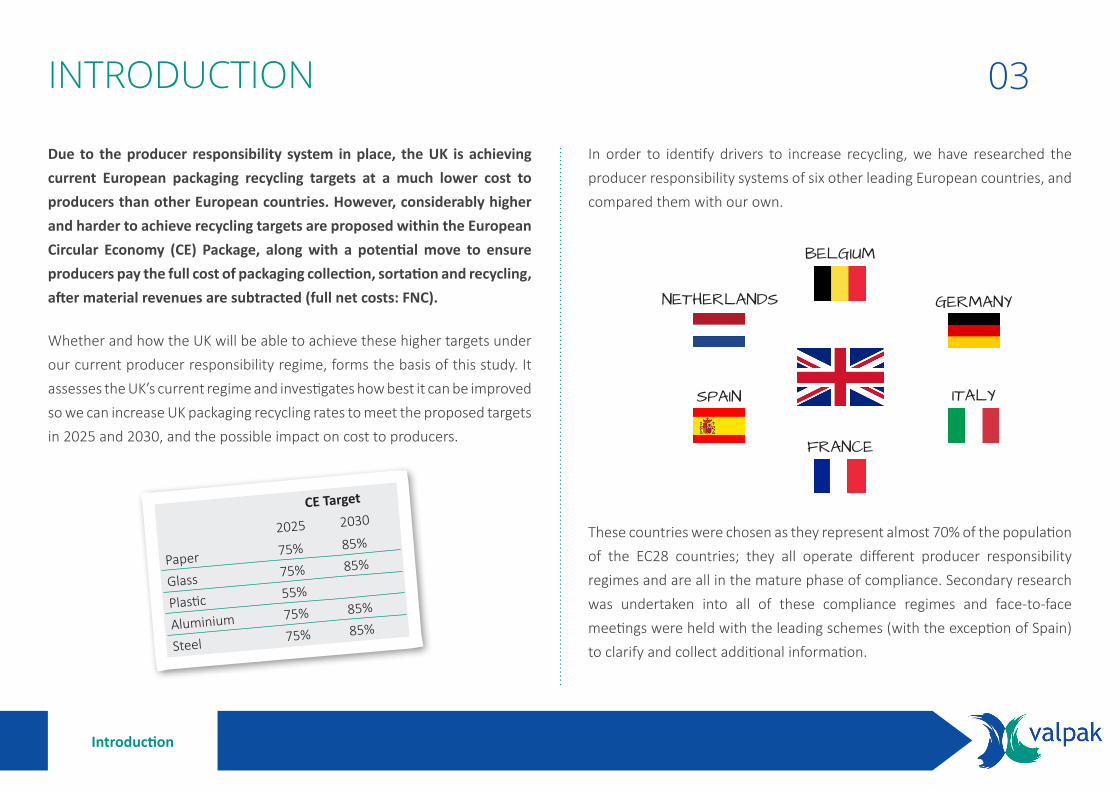
Due to the producer responsibility system in place, the UK is achieving current European packaging recycling targets at a much lower cost to producers than other European countries. However, considerably higher and harder to achieve recycling targets are proposed within the European Circular Economy (CE) Package, along with a potential move to ensure producers pay the full cost of packaging collection, sortation and recycling, after material revenues are subtracted (full net costs: FNC).
Whether and how the UK will be able to achieve these higher targets under our current producer responsibility regime, forms the basis of this study. It assesses the UK’s current regime and investigates how best it can be improved so we can increase UK packaging recycling rates to meet the proposed targets in 2025 and 2030, and the possible impact on cost to producers.
In order to identify drivers to increase recycling, we have researched the producer responsibility systems of six other leading European countries, and compared them with our own.
These countries were chosen as they represent almost 70% of the population of the EC28 countries; they all operate different producer responsibility regimes and are all in the mature phase of compliance. Secondary research was undertaken into all of these compliance regimes and face-to-face meetings were held with the leading schemes (with the exception of Spain) to clarify and collect additional information.
INTRODUCTION
CE Target
2025 2030
Paper 75% 85%
Glass 75% 85%
Plastic 55%
Aluminium 75% 85%
Steel 75% 85%
03
BELGIUM
GERMANY
ITALY
NETHERLANDS
SPAIN
FRANCE
Assessing the UK
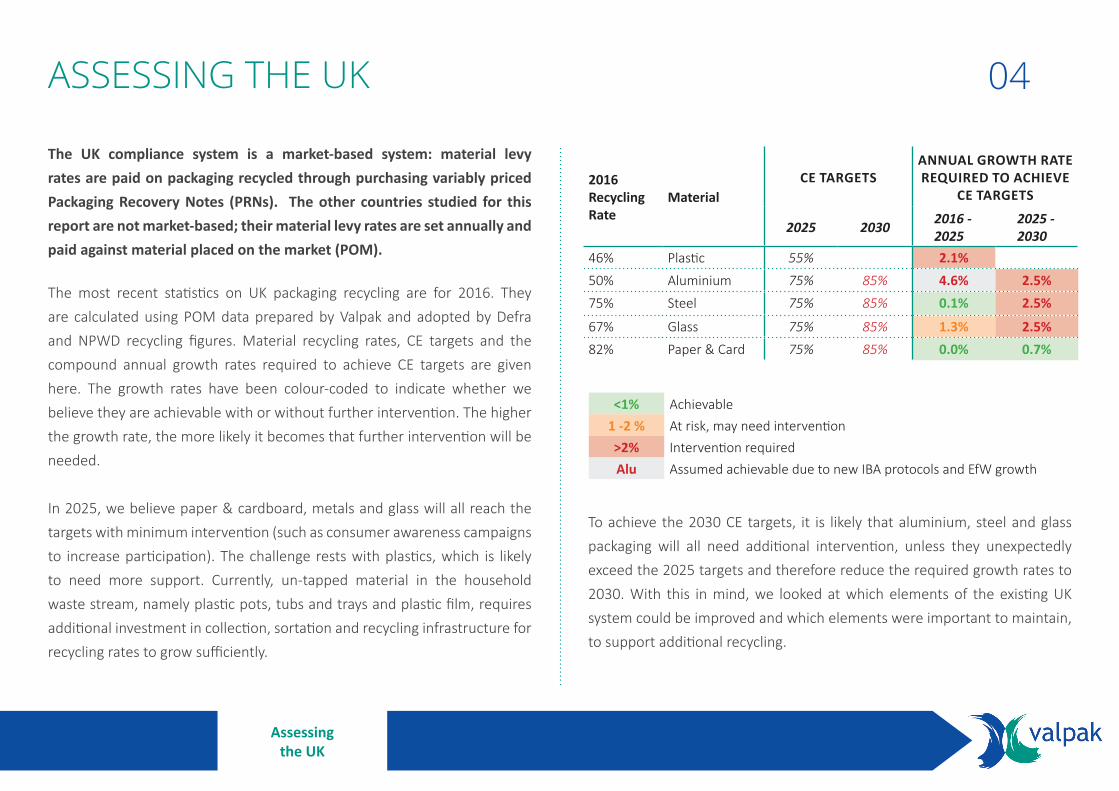
The UK compliance system is a market-based system: material levy rates are paid on packaging recycled through purchasing variably priced Packaging Recovery Notes (PRNs). The other countries studied for this report are not market-based; their material levy rates are set annually and paid against material placed on the market (POM).
The most recent statistics on UK packaging recycling are for 2016. They are calculated using POM data prepared by Valpak and adopted by Defra and NPWD recycling figures. Material recycling rates, CE targets and the compound annual growth rates required to achieve CE targets are given here. The growth rates have been colour-coded to indicate whether we believe they are achievable with or without further intervention. The higher the growth rate, the more likely it becomes that further intervention will be needed.
In 2025, we believe paper & cardboard, metals and glass will all reach the targets with minimum intervention (such as consumer awareness campaigns to increase participation). The challenge rests with plastics, which is likely to need more support. Currently, un-tapped material in the household waste stream, namely plastic pots, tubs and trays and plastic film, requires additional investment in collection, sortation and recycling infrastructure for recycling rates to grow sufficiently.
To achieve the 2030 CE targets, it is likely that aluminium, steel and glass packaging will all need additional intervention, unless they unexpectedly exceed the 2025 targets and therefore reduce the required growth rates to 2030. With this in mind, we looked at which elements of the existing UK system could be improved and which elements were important to maintain, to support additional recycling.
ASSESSING THE UK
2016 Recycling Rate
MaterialCE TARGETS
ANNUAL GROWTH RATE REQUIRED TO ACHIEVE
CE TARGETS
2025 2030 2016 - 2025
2025 - 2030
46% Plastic 55% 2.1%50% Aluminium 75% 85% 4.6% 2.5%75% Steel 75% 85% 0.1% 2.5%
67% Glass 75% 85% 1.3% 2.5%82% Paper & Card 75% 85% 0.0% 0.7%
<1% Achievable1 -2 % At risk, may need intervention>2% Intervention requiredAlu Assumed achievable due to new IBA protocols and EfW growth
04
Assessing the UK
What is not driving growth?
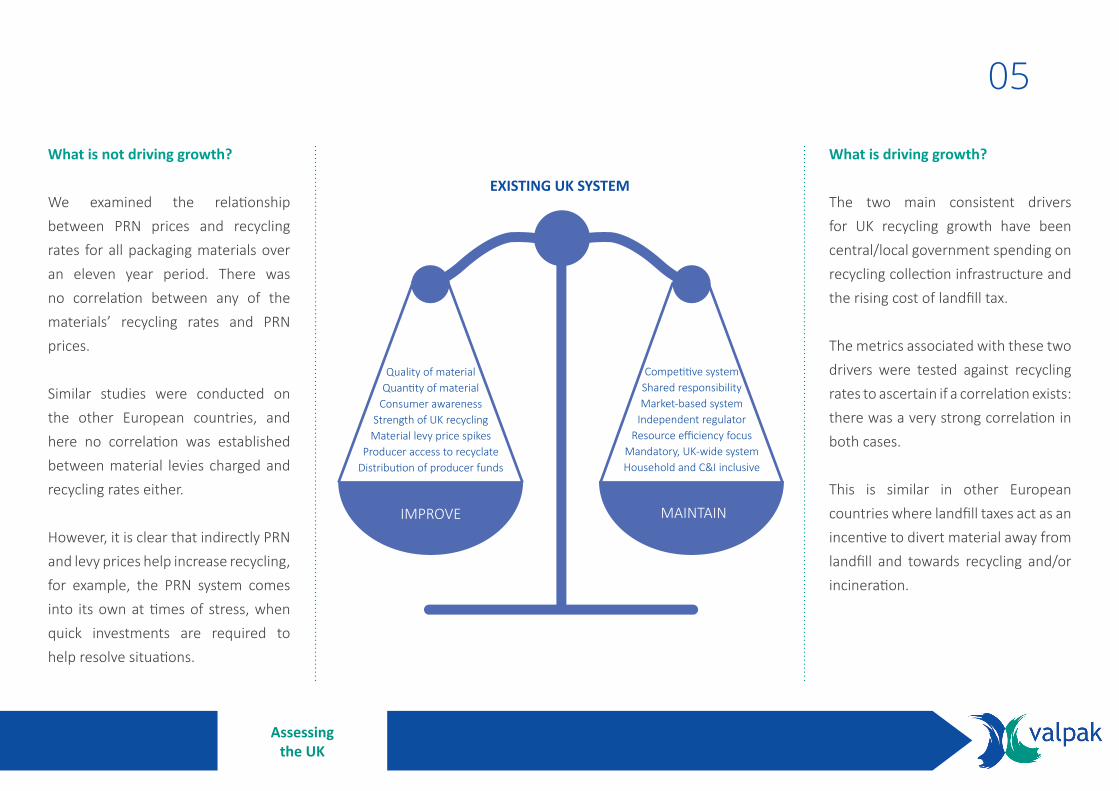
We examined the relationship between PRN prices and recycling rates for all packaging materials over an eleven year period. There was no correlation between any of the materials’ recycling rates and PRN prices.
Similar studies were conducted on the other European countries, and here no correlation was established between material levies charged and recycling rates either.
However, it is clear that indirectly PRN and levy prices help increase recycling, for example, the PRN system comes into its own at times of stress, when quick investments are required to help resolve situations.
What is driving growth?
The two main consistent drivers for UK recycling growth have been central/local government spending on recycling collection infrastructure and the rising cost of landfill tax.
The metrics associated with these two drivers were tested against recycling rates to ascertain if a correlation exists: there was a very strong correlation in both cases.
This is similar in other European countries where landfill taxes act as an incentive to divert material away from landfill and towards recycling and/or incineration.
EXISTING UK SYSTEM
IMPROVE MAINTAIN
Quality of materialQuantity of material
Consumer awareness Strength of UK recycling
Material levy price spikesProducer access to recyclate
Distribution of producer funds
Competitive systemShared responsibilityMarket-based system
Independent regulatorResource efficiency focus
Mandatory, UK-wide systemHousehold and C&I inclusive
05

European Schemes Research
To learn from elsewhere, we researched compliance regimes in Germany, France, Belgium, Netherlands, Spain and Italy. Due to aspects such as national legislation, waste management structure and culture, these regimes all have their own differences and complications, making it difficult to compare them directly. However, key differences and good practices were identified and lessons learned from them.
These regimes have a mix of single, complementary and competitive schemes. They mainly fund household recycling collections, but charge material levy fees against a mixture of household and C&I packaging (obligated packaging). In the UK, we have a more comprehensive approach, incorporating both household and C&I packaging in both our packaging obligations and waste packaging collections.
All obligated producers are charged per tonne of packaging material placed on the market or recycled (UK), whether this covers just household or household and C&I packaging. Some schemes have additional charges, such as component and recyclability charges (France) or a unit charge (Spain). Sometimes there is a choice between € per tonne or € per unit (Belgium).
It is not just the UK that has work to do to ensure we achieve the CE recycling targets. Other than Germany and the Netherlands, all the countries have the potential to miss targets unless further intervention is undertaken. The plastic target presents the biggest challenge for all countries, with France having the greatest work to do: in 2014 it only recycled 25% of plastic packaging.
Our research identified six key themes that incorporate the most significant differences between the schemes. These themes also include ideas and opportunities for improving recycling rates in the UK and achieving the CE targets.
Each theme is discussed in turn in the following sections.
EUROPEAN SCHEMES RESEARCH
6Cs1 Compliance costs2 Control & Strategic Development3 Communication funds
4 Changing behaviour5 Calculation of recycling rates6 Complementary measures
Main EPR Scheme(s)
Other EPR Schemes?
Waste Streams Collected
Obligated Packaging
Belgium Fost Plus & Val -I -Pac Complementary
France Eco-Emballages Single
Germany DSD Competitive
Italy Conai Single
Netherlands Afvalfonds/Nedvang Single
Spain Ecoembes Complementary
UK Valpak Competitive
Household Household and Household-type (Hospitality, Schools, Offices, etc.) Commercial & Industrial (C&I)
06

European Schemes Research
Currently in the UK we are achieving the required European recycling targets, but not exceeding them to the extent of some other European countries. Compliance costs are spread wider along the UK supply chain, to include raw material manufacturers and convertors, but less widely in terms of company size, due to our high de minimis level.
If we compare all the compliance schemes’ total costs to business per capita (blue bars) with the recycling levels per capita (red line) for 2014, the graph confirms on one hand, that Germany has both the highest scheme costs and recycling levels for its size of population. On the other hand, it shows that the UK has the lowest scheme costs for its size of population.
What the graph does not show is low packaging recycling levels in the UK, as a result of low producer costs.
The main cost to business is the material levy fee (i.e. euro per tonne of material). The structure of the material levy fee in each country is different, with some including a per item charge, a per component charge, an ‘unrecyclable’ charge, or a surplus fee for materials excluded from complementary deposit schemes.
In Italy, the majority of material levies are passed to the material organisations which are responsible for purchasing sorted materials and selling them to reprocessors. The material organisations retain the revenue from material sales and the net cost is used to set the next year’s material levy fee.
Compliance Costs
*Estimate, due to there being multiple competitive compliance schemes charging different material levy fee. Levy fees can also vary between clients of a scheme.
Income
2014 Material Levy Fees/PRNs (UK)
Scheme Retains Material Revenue
Belgium €74m Yes
France €670m No (municipalities retain)
Germany €950m* Yes
Italy €354m No (material organisations retain)
Netherlands €125m No (municipalities/WMC retain)
Spain €453m Yes
UK €79m No (local authorities/WMCs retain)
France Belgium The Germany Italy Spain UK Netherlands
14
12
10
8
6
4
2
0
0.180
0.160
0.140
0.120
0.100
0.080
0.060
0.040
0.020
0.000
€ pe
r cap
ita
Tonn
es p
er c
apita
Scheme cost to business per capita (€) Packaging waste recycled per capita (t)
07

European Schemes Research
Schemes researched typically had greater control and input into waste packaging collections, sortation and recycling than the UK; however, there were marked differences between countries. Monopoly and complementary schemes benefited from 5-6 year governmental contracts, which facilitated longer-term strategic planning.
Arguably, the Belgian scheme has most control as it defines collections and only pays FNCs to compliant municipalities. They also sell the sorted recyclables and reward/penalise municipalities based on collected material quality. Other schemes encourage municipalities to collect packaging waste in a certain way, but have no power to enforce or penalise, only to specify sorted material quality. In Italy municipalities are paid according to quality. Typically municipalities are paid defined net costs (e.g. average historical prices), rather than actual costs incurred, and system inefficiencies are therefore left for municipalities to fund. Germany is an exception, where actual costs are paid for packaging collections.
In the Netherlands the national ‘average value’ of sorted material is used to calculate full net costs; municipalities are incentivised to negotiate hard with reprocessors as they keep any additional revenue received above the national ‘average full net cost’.
Scheme revenues mainly fund operational costs; however, non-operational and strategic activities such as communications, strategic projects and litter campaigns are also funded. In France, research and trials into collection, sorting and recycling of non-bottle plastic packaging and eco-design has been funded; Belgium is also trialling non-bottle plastic collections; Italy is trialling additional polymer sortation and recycling and Spain has trialled and introduced sortation of residual waste.
Although there is no direct spend on recycling in the other countries, schemes support national recycling through strategic projects and minimising the export of waste packaging.
Control & Strategic Development 08
SPEND
Collections Sortation Recycling Communications Strategic/R&D Projects
Belgium Yes(up to 100% FNC) Indirectly Indirectly Yes Yes
France Yes(80% FNC) Indirectly Indirectly Yes Yes
Germany Yes(100% FNC) Directly Indirectly Minimal Yes
Italy Yes(100% FNC) Indirectly Indirectly Yes Yes
Netherlands Yes(100% FNC) Indirectly Indirectly Yes Yes
Spain Yes(100% FNC)
Directly (some residual sort) Indirectly Yes Yes
UK Indirectly(through PRNs)
None(through PRNs) Directly Minimal No
Sufficient undertaken to achieve consumer information obligation only
European Schemes Research
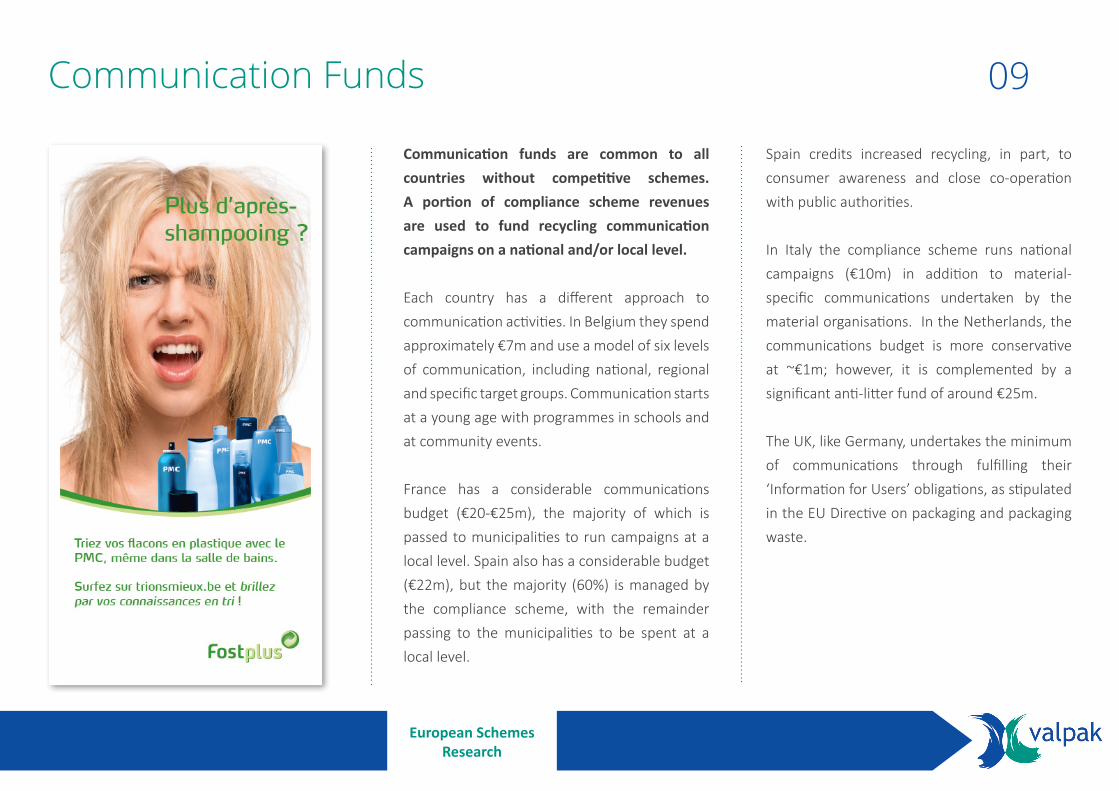
Communication funds are common to all countries without competitive schemes. A portion of compliance scheme revenues are used to fund recycling communication campaigns on a national and/or local level.
Each country has a different approach to communication activities. In Belgium they spend approximately €7m and use a model of six levels of communication, including national, regional and specific target groups. Communication starts at a young age with programmes in schools and at community events.
France has a considerable communications budget (€20-€25m), the majority of which is passed to municipalities to run campaigns at a local level. Spain also has a considerable budget (€22m), but the majority (60%) is managed by the compliance scheme, with the remainder passing to the municipalities to be spent at a local level.
Spain credits increased recycling, in part, to consumer awareness and close co-operation with public authorities.
In Italy the compliance scheme runs national campaigns (€10m) in addition to material-specific communications undertaken by the material organisations. In the Netherlands, the communications budget is more conservative at ~€1m; however, it is complemented by a significant anti-litter fund of around €25m.
The UK, like Germany, undertakes the minimum of communications through fulfilling their ‘Information for Users’ obligations, as stipulated in the EU Directive on packaging and packaging waste.
Communication Funds 09
European Schemes Research
There is a drive to increase recycling levels through positive behaviour change in all countries researched; it is not just being asked of producers and householders, but also local authorities and waste management companies (WMCs).
Householders
To encourage better separation of recyclables by householders, both carrot and stick approaches are being adopted. National and local communications campaigns reinforce what can be recycled, why it is recycled and how it can be recycled. Positive messages are backed up by financial penalties for poor behaviour.
Belgian householders are fined for poor separation of recyclables. In Germany, parts of the Netherlands and Belgium, pay as you throw systems (PAYT) charge less for recycling than for residual waste. Poorly sorted recycling is not picked up and householders are left to dispose of the material through their residual waste (at a higher cost), or re-sort and re-present the material for recycling. Spain and France, like the UK, do not have a ‘stick’ approach; in France it was felt that compulsory participation was needed to meet higher recycling targets.
Producers
Behaviour change in producers is most typically encouraged through material levy fees. High levy fees can serve to discourage certain packaging materials/formats and cover the cost of their collections. In the Netherlands, considerably lower fees are charged against bio and re-usable plastic packaging. Behaviour change can also be encouraged through imposing a recyclability charge for types of packaging that are less technically, economically and sustainably recyclable, or a bonus for pack types that fit well with current national recycling systems, as found in France since 2011.
Local authorities and WMCs
In Belgium, Italy, France and Spain, local authority behaviours are influenced through the rates paid for the material they collect: higher quality and quantities generate higher income. For countries like Germany and Italy, sortation is the critical stage in ensuring the quality of recyclables. In Germany, all waste packaging is collected and the quality and efficiency of sort is a key area of competition for compliance schemes. In Italy, sort facilities can face a double financial penalty if the quality of material is not up to quality standards – they can receive a fine and/or have to pay for rejected material to be sent to EfW. Equally, they can receive double benefits through good-sort bonuses and minimising EfW costs.
Changing Behaviour 10
European Schemes Research
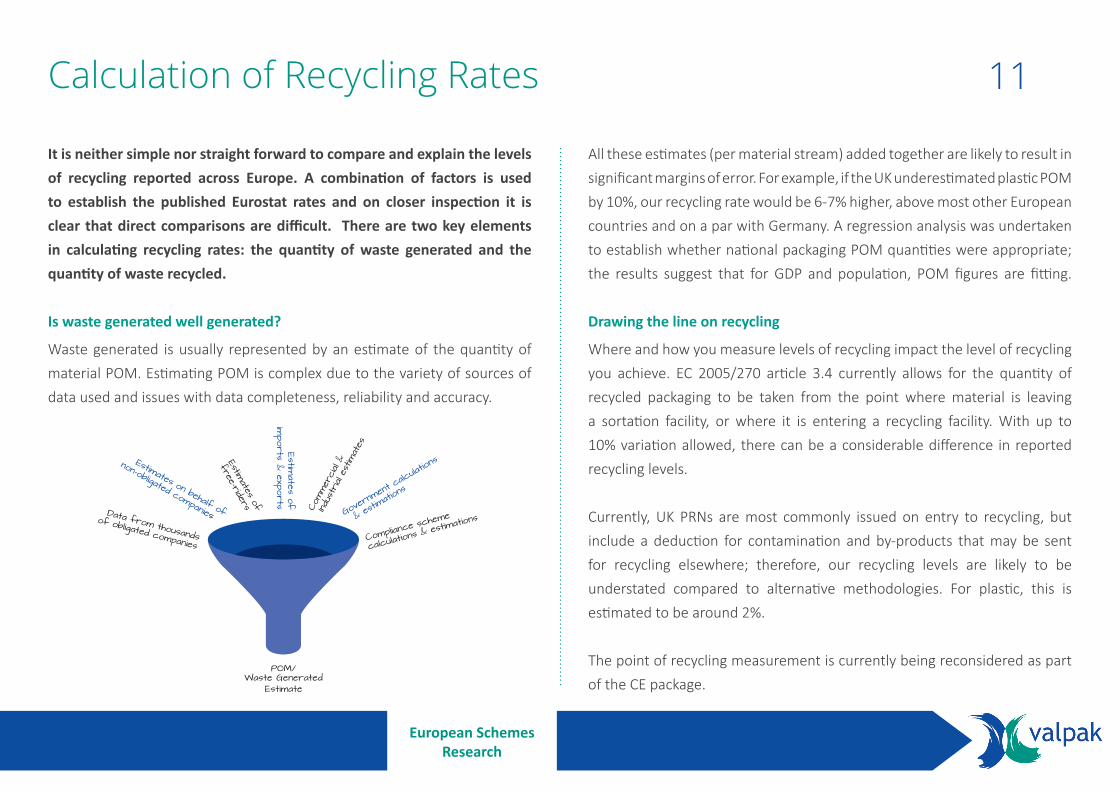
It is neither simple nor straight forward to compare and explain the levels of recycling reported across Europe. A combination of factors is used to establish the published Eurostat rates and on closer inspection it is clear that direct comparisons are difficult. There are two key elements in calculating recycling rates: the quantity of waste generated and the quantity of waste recycled.
Is waste generated well generated?
Waste generated is usually represented by an estimate of the quantity of material POM. Estimating POM is complex due to the variety of sources of data used and issues with data completeness, reliability and accuracy.
All these estimates (per material stream) added together are likely to result in significant margins of error. For example, if the UK underestimated plastic POM by 10%, our recycling rate would be 6-7% higher, above most other European countries and on a par with Germany. A regression analysis was undertaken to establish whether national packaging POM quantities were appropriate; the results suggest that for GDP and population, POM figures are fitting.
Drawing the line on recycling
Where and how you measure levels of recycling impact the level of recycling you achieve. EC 2005/270 article 3.4 currently allows for the quantity of recycled packaging to be taken from the point where material is leaving a sortation facility, or where it is entering a recycling facility. With up to 10% variation allowed, there can be a considerable difference in reported recycling levels.
Currently, UK PRNs are most commonly issued on entry to recycling, but include a deduction for contamination and by-products that may be sent for recycling elsewhere; therefore, our recycling levels are likely to be understated compared to alternative methodologies. For plastic, this is estimated to be around 2%.
The point of recycling measurement is currently being reconsidered as part of the CE package.
Calculation of Recycling Rates 11
Data from thousands
of obligated companies
Estimates on behalf of
non-obligated companies
Estimates of
free-riders
Estimates of
imports & exports Co
mmer
cial &
Indu
stria
l estim
ates
Govern
ment ca
lculatio
ns
& es
timations
Compliance scheme
calculations & estim
ations
POM/Waste Generated
Estimate
European Schemes Research
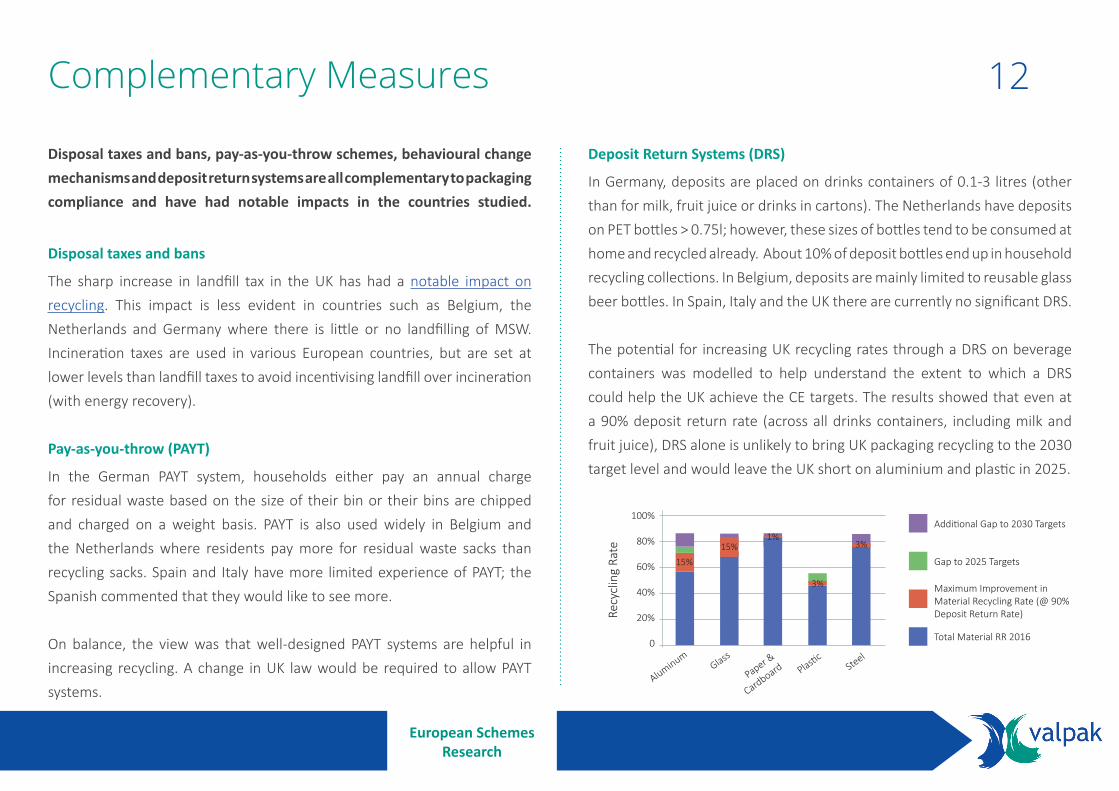
Disposal taxes and bans, pay-as-you-throw schemes, behavioural change mechanisms and deposit return systems are all complementary to packaging compliance and have had notable impacts in the countries studied.
Disposal taxes and bans
The sharp increase in landfill tax in the UK has had a notable impact on recycling. This impact is less evident in countries such as Belgium, the Netherlands and Germany where there is little or no landfilling of MSW. Incineration taxes are used in various European countries, but are set at lower levels than landfill taxes to avoid incentivising landfill over incineration (with energy recovery).
Pay-as-you-throw (PAYT)
In the German PAYT system, households either pay an annual charge for residual waste based on the size of their bin or their bins are chipped and charged on a weight basis. PAYT is also used widely in Belgium and the Netherlands where residents pay more for residual waste sacks than recycling sacks. Spain and Italy have more limited experience of PAYT; the Spanish commented that they would like to see more.
On balance, the view was that well-designed PAYT systems are helpful in increasing recycling. A change in UK law would be required to allow PAYT systems.
Deposit Return Systems (DRS)
In Germany, deposits are placed on drinks containers of 0.1-3 litres (other than for milk, fruit juice or drinks in cartons). The Netherlands have deposits on PET bottles > 0.75l; however, these sizes of bottles tend to be consumed at home and recycled already. About 10% of deposit bottles end up in household recycling collections. In Belgium, deposits are mainly limited to reusable glass beer bottles. In Spain, Italy and the UK there are currently no significant DRS.
The potential for increasing UK recycling rates through a DRS on beverage containers was modelled to help understand the extent to which a DRS could help the UK achieve the CE targets. The results showed that even at a 90% deposit return rate (across all drinks containers, including milk and fruit juice), DRS alone is unlikely to bring UK packaging recycling to the 2030 target level and would leave the UK short on aluminium and plastic in 2025.
Complementary Measures 12
Aluminum
100%
80%
60%
40%
20%
0
Recy
clin
g Ra
te
Steel Plastic
Paper &
CardboardGlass
15%
15%1%
3%
3%
Additional Gap to 2030 Targets
Gap to 2025 Targets
Maximum Improvement in Material Recycling Rate (@ 90% Deposit Return Rate)
Total Material RR 2016

European Schemes Research
Summary of Lessons Learnt 13
Improve quantity and quality of recyclate
Influence behaviour
Maximise measurement
Increase revenue in the system
Consistent collections light packaging/paper/glass
Communications at a local & national level
Minimise fraud - accurate auditable POM calculations
Reduce de minimis: capture more companies and raise awareness of regulations
Collection/sort contracts LAs have to deliver quality to receive full payment
Encourage switching to recyclable formats/ polymers
Align recycling measurement point
Longer term strategic planning & investment by compliance schemes
Influence reprocessing define/develop end markets creating a circular economy
Recyclability indices Review Incinerator Bottom Ash (IBA) protocols for metals to ensure alignment
Fines for contamination of recyclate streams
Pay as You Throw (PAYT)
Model 1: Existing UK
System
Model 2: Enhanced UK
System
Better use of existing system
• Communications fund
• Compliance fee to avoid large price spikes
• Reduced de minimus
Model 3: Strategic UK
System
Investing in infrastructure
growth
• Strategic fund• More stable
investment platform
• More direct control of material
Model 4: Direct Control
System
European-style Full Net Cost System
• Levy on household POM
• Household collections funded via LAs/WMCs
Evolution of existing systemIntroduction of
new system
UK ModelDevelopment
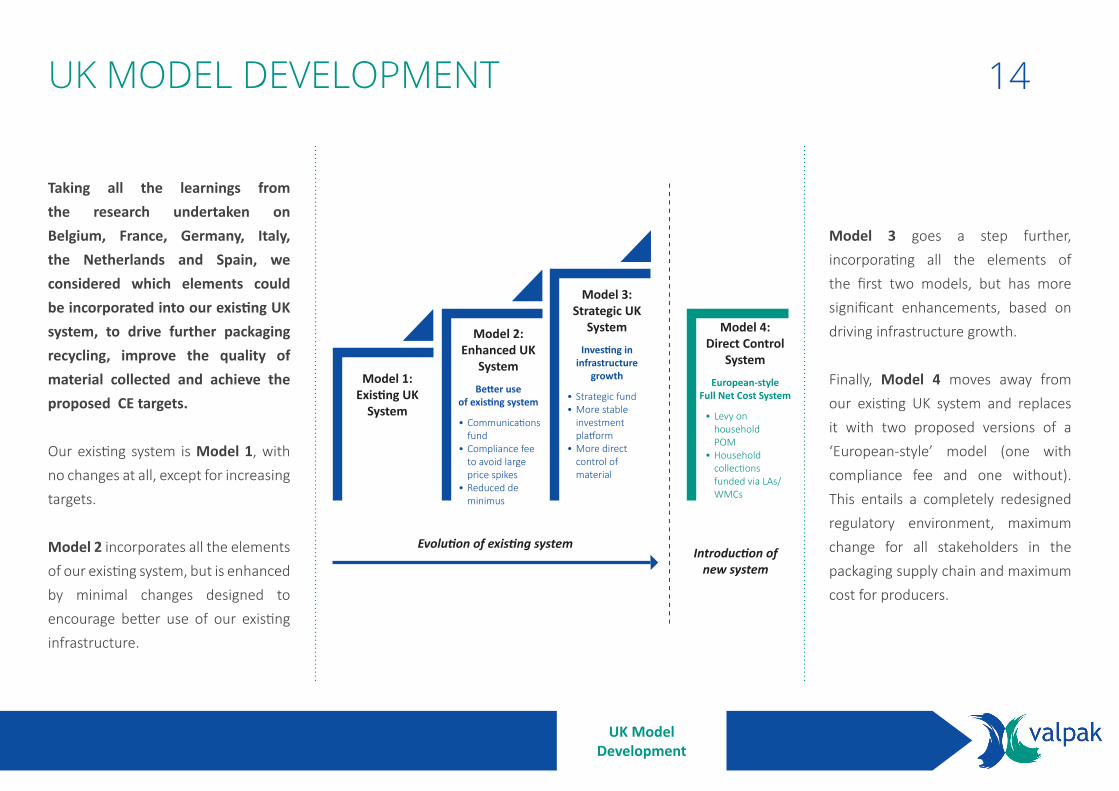
Taking all the learnings from the research undertaken on Belgium, France, Germany, Italy, the Netherlands and Spain, we considered which elements could be incorporated into our existing UK system, to drive further packaging recycling, improve the quality of material collected and achieve the proposed CE targets.
Our existing system is Model 1, with no changes at all, except for increasing targets.
Model 2 incorporates all the elements of our existing system, but is enhanced by minimal changes designed to encourage better use of our existing infrastructure.
Model 3 goes a step further, incorporating all the elements of the first two models, but has more significant enhancements, based on driving infrastructure growth.
Finally, Model 4 moves away from our existing UK system and replaces it with two proposed versions of a ‘European-style’ model (one with compliance fee and one without). This entails a completely redesigned regulatory environment, maximum change for all stakeholders in the packaging supply chain and maximum cost for producers.
14UK MODEL DEVELOPMENT
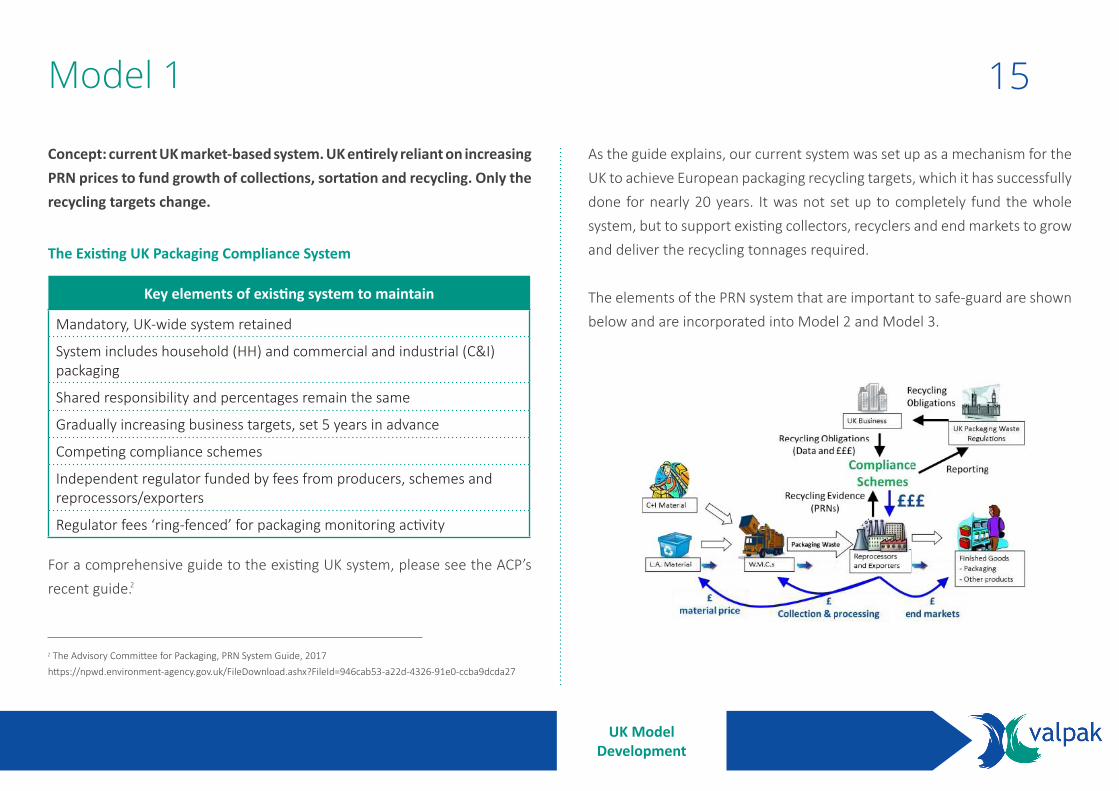
Concept: current UK market-based system. UK entirely reliant on increasing PRN prices to fund growth of collections, sortation and recycling. Only the recycling targets change.
The Existing UK Packaging Compliance System
For a comprehensive guide to the existing UK system, please see the ACP’s recent guide.
The Advisory Committee for Packaging, PRN System Guide, 2017https://npwd.environment-agency.gov.uk/FileDownload.ashx?FileId=946cab53-a22d-4326-91e0-ccba9dcda27
As the guide explains, our current system was set up as a mechanism for the UK to achieve European packaging recycling targets, which it has successfully done for nearly 20 years. It was not set up to completely fund the whole system, but to support existing collectors, recyclers and end markets to grow and deliver the recycling tonnages required.
The elements of the PRN system that are important to safe-guard are shown below and are incorporated into Model 2 and Model 3.
Key elements of existing system to maintain
Mandatory, UK-wide system retained
System includes household (HH) and commercial and industrial (C&I) packaging
Shared responsibility and percentages remain the same
Gradually increasing business targets, set 5 years in advance
Competing compliance schemes
Independent regulator funded by fees from producers, schemes and reprocessors/exporters
Regulator fees ‘ring-fenced’ for packaging monitoring activity
Model 1 15
UK ModelDevelopment
Concept: better use of existing infrastructure. Introduce a communications fund, widen the system and provide more price stability. Continue to rely principally on rising PRN prices to fund growth of collections, sortation and recycling.
Communications Fund
European schemes typically invest 4-5% of their turnover on communications at a national and/or local level. For a country the size (population) of the UK, this equates to ~€20-30m. Germany moved from a monopoly to a competitive system, saw spending on national communications cease and subsequently saw a slow-down in recycling growth.
We are suggesting that the UK generates a producer fund of up to approximately £20m that would be managed by a central body. The central body would be responsible for the delivery of national communications to raise awareness of recycling and to increase participation and would support LA campaigns at a local level.
Generation of a communications fund could come from additional fees generated by reducing the level of de minimus exemption for smaller businesses and instead paying a modest fixed fee, or adding a small additional amount to existing producer fees.
Compliance Fee
The demand for PRNs is inelastic, hence an increase in the price of PRNs will not directly increase their supply in the short term. As material targets rise, there is increasing likelihood of price spikes; in theory if a target is likely to be missed (e.g. due to external factors) then the PRN price could rise excessively, without producers benefiting from increased recycling. It is proposed to enhance the current system by introducing a ‘compliance’ option to minimise excessive price spikes. This is an alternative form of compliance that enables schemes to contribute to a central fund, when they believe a material price is unreasonably high. It is a mechanism tried and tested in UK WEEE compliance:
• Compliance fees would be set after the end of the compliance year• The Secretary of State would seek proposals on the methodology for
setting the compliance fee• Methodologies would take into account costs associated with collection/
treatment of packaging waste and PRN values• Compliance fees to be set at a level which encourages schemes to meet
their targets through actual collections and recycling but which avoids excessive costs
• All reprocessors to be registered and returns submitted• Fees go towards projects to encourage increased collections
Model 2 Enhanced UK System 16
UK ModelDevelopment
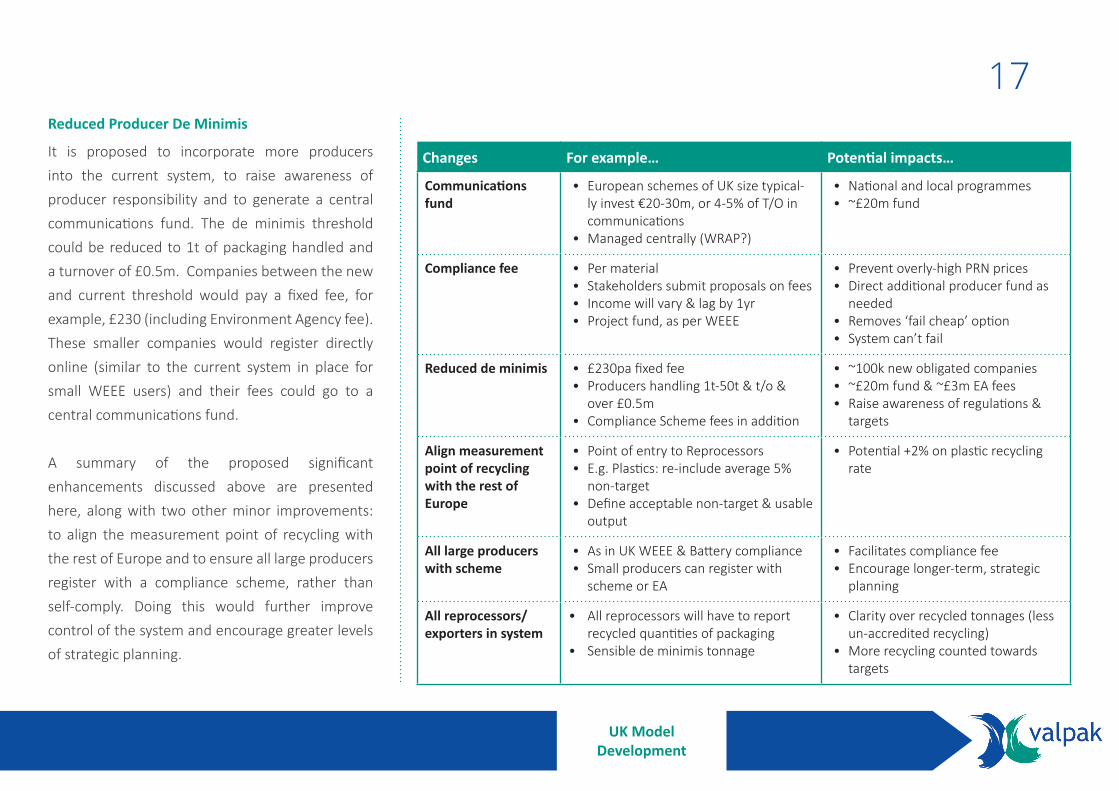
Changes For example… Potential impacts…
Communications fund
• European schemes of UK size typical-ly invest €20-30m, or 4-5% of T/O in communications
• Managed centrally (WRAP?)
• National and local programmes• ~£20m fund
Compliance fee • Per material• Stakeholders submit proposals on fees• Income will vary & lag by 1yr• Project fund, as per WEEE
• Prevent overly-high PRN prices• Direct additional producer fund as
needed• Removes ‘fail cheap’ option• System can’t fail
Reduced de minimis • £230pa fixed fee • Producers handling 1t-50t & t/o &
over £0.5m• Compliance Scheme fees in addition
• ~100k new obligated companies• ~£20m fund & ~£3m EA fees• Raise awareness of regulations &
targets
Align measurement point of recycling with the rest of Europe
• Point of entry to Reprocessors• E.g. Plastics: re-include average 5%
non-target• Define acceptable non-target & usable
output
• Potential +2% on plastic recycling rate
All large producers with scheme
• As in UK WEEE & Battery compliance• Small producers can register with
scheme or EA
• Facilitates compliance fee• Encourage longer-term, strategic
planning
All reprocessors/ exporters in system
• All reprocessors will have to report recycled quantities of packaging
• Sensible de minimis tonnage
• Clarity over recycled tonnages (less un-accredited recycling)
• More recycling counted towards targets
Reduced Producer De Minimis
It is proposed to incorporate more producers into the current system, to raise awareness of producer responsibility and to generate a central communications fund. The de minimis threshold could be reduced to 1t of packaging handled and a turnover of £0.5m. Companies between the new and current threshold would pay a fixed fee, for example, £230 (including Environment Agency fee). These smaller companies would register directly online (similar to the current system in place for small WEEE users) and their fees could go to a central communications fund.
A summary of the proposed significant enhancements discussed above are presented here, along with two other minor improvements: to align the measurement point of recycling with the rest of Europe and to ensure all large producers register with a compliance scheme, rather than self-comply. Doing this would further improve control of the system and encourage greater levels of strategic planning.
17
UK ModelDevelopment
Concept: investing in infrastructure growth. As per Model 2, with the introduction of a strategic fund to boost growth in the recycling supply chain. Considerably less reliance on rising PRN prices for funding.
Model 3 takes an additional step of driving infrastructure growth through the development and deployment of a strategic fund. The strategic fund would provide a targeted and timely investment vehicle with which to grow packaging collections, sortation, recycling and end markets. The fund could also encourage producer behaviour change by compensating for use of recycled content, recyclability or investment in other recycling projects. Model 3 does not rely on rising PRN prices for funding all additional growth, only to maintain current recycling levels with some growth.
The Strategic Fund
Government would need to legislate for the existence of a fund, its purpose and governance. It would need to create an independent body to set the fund size and associated fees to be charged to raise the funds. We propose strategic fund fees are set 12 months in advance for a three year period. The independent body would be advised by material organisations, recycling supply chain experts, and representatives from industry and LAs. In order to establish the funds to be raised and charged, the body would be
required to develop a strategy that mapped out the potential infrastructural requirements (if any) of material recycling supply chains.
Fund generation
It is likely that an initial round of fees to provide set-up funds for the governing body would be required. To provide some context, if large producers were charged 50p for every tonne of material placed on the market that a PRN is not purchased against (after shared producer responsibility is taken into account), then this would generate approximately £2 million.
The same charging mechanism would be used to generate funds annually, per material stream, as required and declared by the governing body. This mechanism would bring us in line with the rest of Europe, where producers pay fees against every tonne of material they place on the market, not just the tonnage of material recycled, as is done currently in the UK. The mechanism also reflects current recycling rates: the higher recycling levels are, the lower tonnage there is to charge against and lower requirement to charge at all. Strategic fee exemptions could also be given to producers who, for example, place their products in recyclable packaging or packaging with recycled content.
Model 3 Strategic UK System 18
UK ModelDevelopment

To illustrate potential fees, a £50-£100m fund for plastics would require a strategic fee of £50-£100 per tonne of plastic placed on the market that a PRN is not purchased against (after shared producer responsibility is taken into account).
Fund management
There are a number of ways funds could be managed, including the creation of a new charity or not-for-profit organisation. This, however, wouldn’t be a small undertaking as it would require administering and investing potentially £50-£100m per year (or more if multiple material streams were involved), which would require governing, management, operational and support staff. An alternative concept would be to adopt the funding mechanism used in Italy to channel the majority of material levy fees into the associated material sectors for which they were raised. Here, the levy fees are collected by CONAI, the national compliance scheme, and passed through to the relevant material organisations that are responsible for spending the funds on:
• Local authority payments for collected material• Sortation• Recycling support (if/where required)• R&D e.g. additional sortation or end markets
Such a concept could work well in the UK for the management and delivery of a strategic fund. As ‘material organisations’ do not currently exist in the same form for all materials in the UK (for example, plastics has a number of
different representative bodies) then trade associations could bid for funds individually, or work in partnership to create one vehicle for funds.
The advantages of this approach are that funds would lie with those who have the best understanding of what is required to support their sectors. Funds would be managed by organisations that, to some extent already exist, although additional staffing may be required. This should be less costly than ‘starting from scratch’ and due to their memberships, material organisations should have communication channels up and down their supply chains. This approach also removes any concerns about cross-subsidising of one material by another and places an element of responsibility on the material sectors to support achievement of recycling targets.
Fund managers also have the option of supporting UK reprocessors in their supply chain through insisting additional material collected as a consequence of the fund, is recycled in the UK. A metric could be incorporated in the tender approval process which benefits UK reprocessing, similar to the Belgian model.
Delivery
Collected funds would be paid into the governing body for redistribution to the relevant material organisations for management. The material organisations receiving funds would have been involved in developing the strategy for investing the funds and would start the process for delivery.
19
UK ModelDevelopment
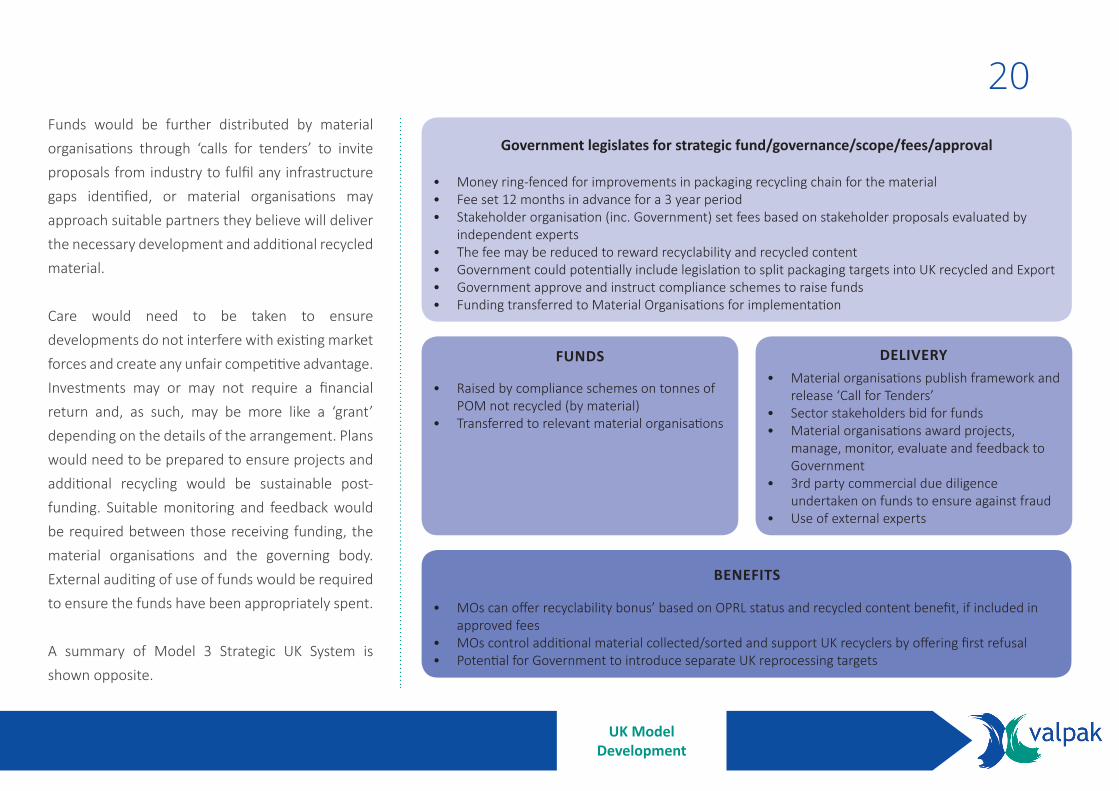
• Money ring-fenced for improvements in packaging recycling chain for the material • Fee set 12 months in advance for a 3 year period• Stakeholder organisation (inc. Government) set fees based on stakeholder proposals evaluated by
independent experts• The fee may be reduced to reward recyclability and recycled content• Government could potentially include legislation to split packaging targets into UK recycled and Export• Government approve and instruct compliance schemes to raise funds• Funding transferred to Material Organisations for implementation
• Raised by compliance schemes on tonnes of POM not recycled (by material)
• Transferred to relevant material organisations
• MOs can offer recyclability bonus’ based on OPRL status and recycled content benefit, if included in approved fees
• MOs control additional material collected/sorted and support UK recyclers by offering first refusal• Potential for Government to introduce separate UK reprocessing targets
• Material organisations publish framework and release ‘Call for Tenders’
• Sector stakeholders bid for funds• Material organisations award projects,
manage, monitor, evaluate and feedback to Government
• 3rd party commercial due diligence undertaken on funds to ensure against fraud
• Use of external experts
Funds would be further distributed by material organisations through ‘calls for tenders’ to invite proposals from industry to fulfil any infrastructure gaps identified, or material organisations may approach suitable partners they believe will deliver the necessary development and additional recycled material.
Care would need to be taken to ensure developments do not interfere with existing market forces and create any unfair competitive advantage. Investments may or may not require a financial return and, as such, may be more like a ‘grant’ depending on the details of the arrangement. Plans would need to be prepared to ensure projects and additional recycling would be sustainable post-funding. Suitable monitoring and feedback would be required between those receiving funding, the material organisations and the governing body. External auditing of use of funds would be required to ensure the funds have been appropriately spent.
A summary of Model 3 Strategic UK System is shown opposite.
20
UK ModelDevelopment
Government legislates for strategic fund/governance/scope/fees/approval
FUNDS DELIVERY
BENEFITS
Producers
End Market
End Market
LocalAuthority
EnvironmentAgency
Compliance Fee (Model 4b only)
Com
plia
nce
Sche
me
Revenue
Material
Evidence
Information
Dotted lines denote use of Compliance Fee as per Model 4b only
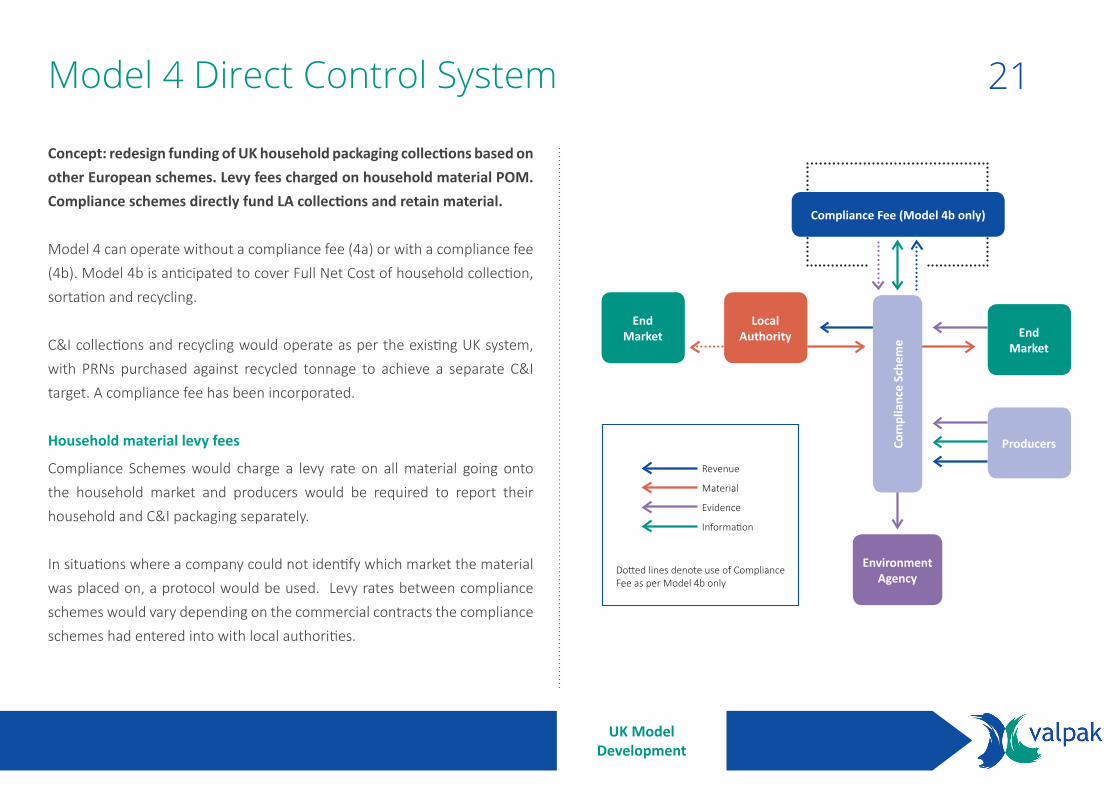
Concept: redesign funding of UK household packaging collections based on other European schemes. Levy fees charged on household material POM. Compliance schemes directly fund LA collections and retain material.
Model 4 can operate without a compliance fee (4a) or with a compliance fee (4b). Model 4b is anticipated to cover Full Net Cost of household collection, sortation and recycling.
C&I collections and recycling would operate as per the existing UK system, with PRNs purchased against recycled tonnage to achieve a separate C&I target. A compliance fee has been incorporated.
Household material levy fees
Compliance Schemes would charge a levy rate on all material going onto the household market and producers would be required to report their household and C&I packaging separately.
In situations where a company could not identify which market the material was placed on, a protocol would be used. Levy rates between compliance schemes would vary depending on the commercial contracts the compliance schemes had entered into with local authorities.
Model 4 Direct Control System 21
UK ModelDevelopment
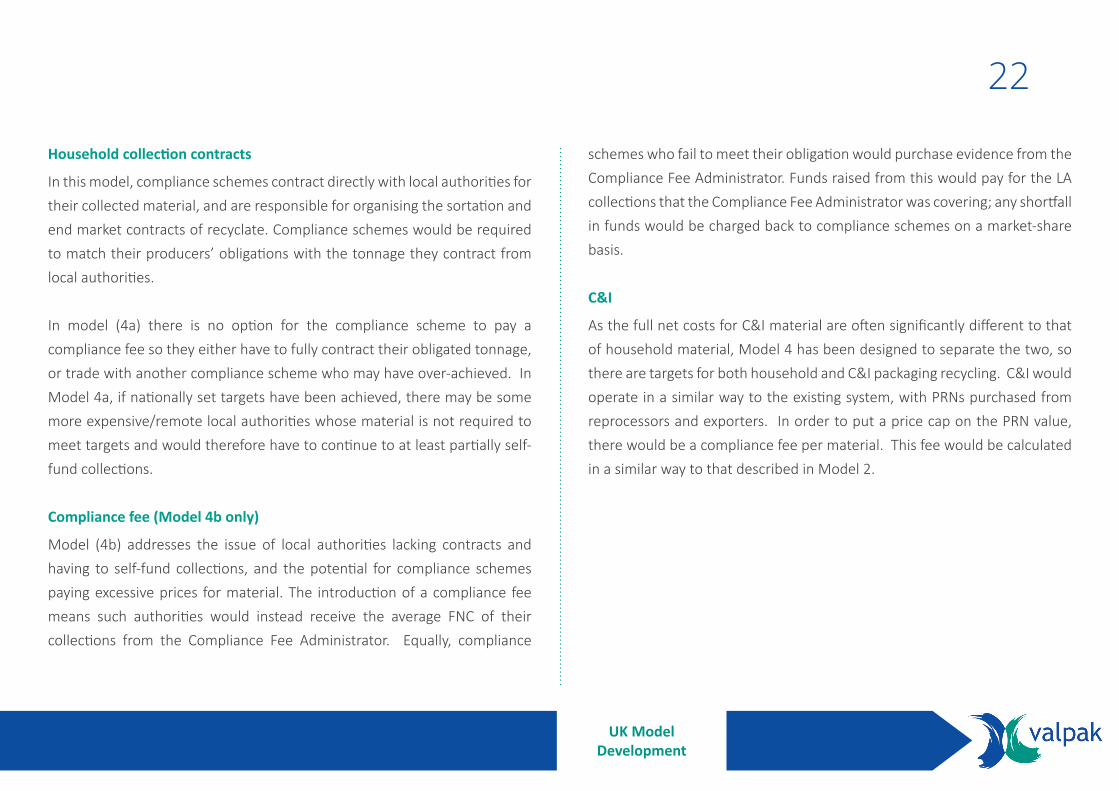
Household collection contracts
In this model, compliance schemes contract directly with local authorities for their collected material, and are responsible for organising the sortation and end market contracts of recyclate. Compliance schemes would be required to match their producers’ obligations with the tonnage they contract from local authorities.
In model (4a) there is no option for the compliance scheme to pay a compliance fee so they either have to fully contract their obligated tonnage, or trade with another compliance scheme who may have over-achieved. In Model 4a, if nationally set targets have been achieved, there may be some more expensive/remote local authorities whose material is not required to meet targets and would therefore have to continue to at least partially self-fund collections.
Compliance fee (Model 4b only)
Model (4b) addresses the issue of local authorities lacking contracts and having to self-fund collections, and the potential for compliance schemes paying excessive prices for material. The introduction of a compliance fee means such authorities would instead receive the average FNC of their collections from the Compliance Fee Administrator. Equally, compliance
schemes who fail to meet their obligation would purchase evidence from the Compliance Fee Administrator. Funds raised from this would pay for the LA collections that the Compliance Fee Administrator was covering; any shortfall in funds would be charged back to compliance schemes on a market-share basis.
C&I
As the full net costs for C&I material are often significantly different to that of household material, Model 4 has been designed to separate the two, so there are targets for both household and C&I packaging recycling. C&I would operate in a similar way to the existing system, with PRNs purchased from reprocessors and exporters. In order to put a price cap on the PRN value, there would be a compliance fee per material. This fee would be calculated in a similar way to that described in Model 2.
22
UK ModelDevelopment
Model 1 Model 2 Model 3 Model 4
£450m
£400m
£350m
£300m
£250m
£200m
£150m
£100m
£50m
£0m
100%
90%
80%
70%
60%
50%
40%
30%
20%
10%
0%
Mod
el C
ost &
Cos
t Var
iabi
lity
Cert
aint
y of
Ach
ievi
ng 2
025/
2030
Tar
gets
(Ind
icati
ve)
Material Levy
PRNs
Communication Fund
Strategic Fund
Certainty of Achieving Targets
Cost Variability
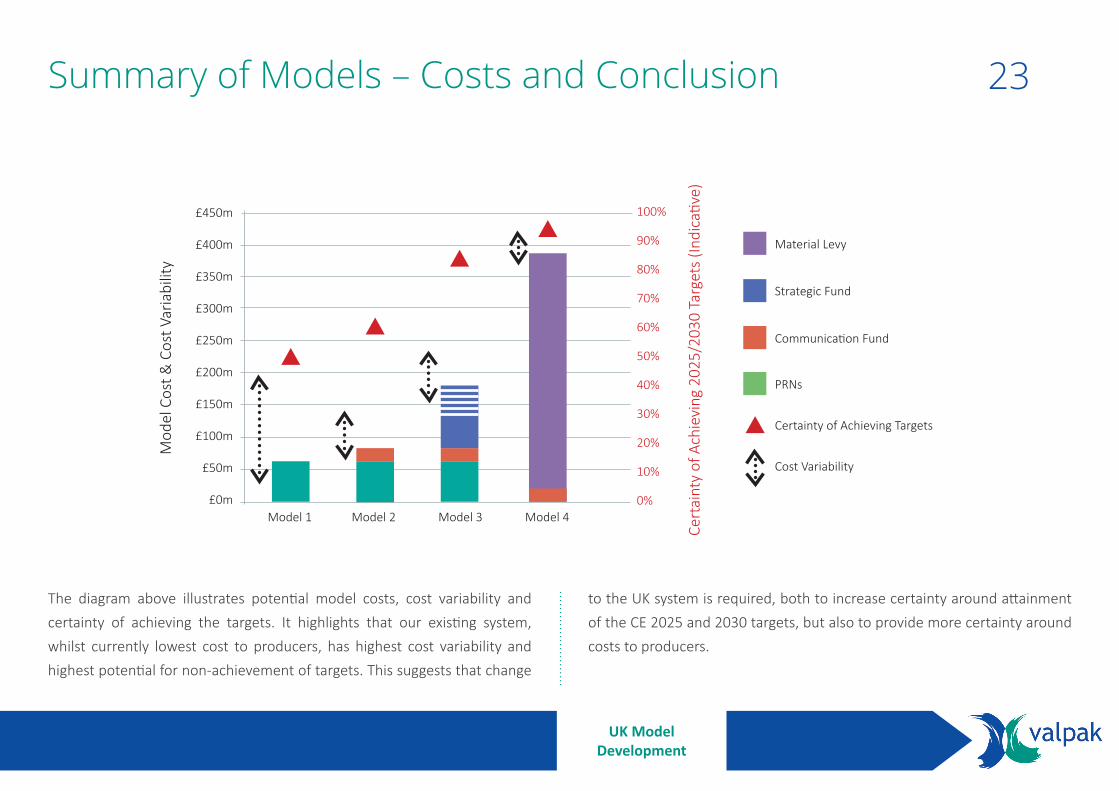
The diagram above illustrates potential model costs, cost variability and certainty of achieving the targets. It highlights that our existing system, whilst currently lowest cost to producers, has highest cost variability and highest potential for non-achievement of targets. This suggests that change
to the UK system is required, both to increase certainty around attainment of the CE 2025 and 2030 targets, but also to provide more certainty around costs to producers.
Summary of Models – Costs and Conclusion 23
UK ModelDevelopment
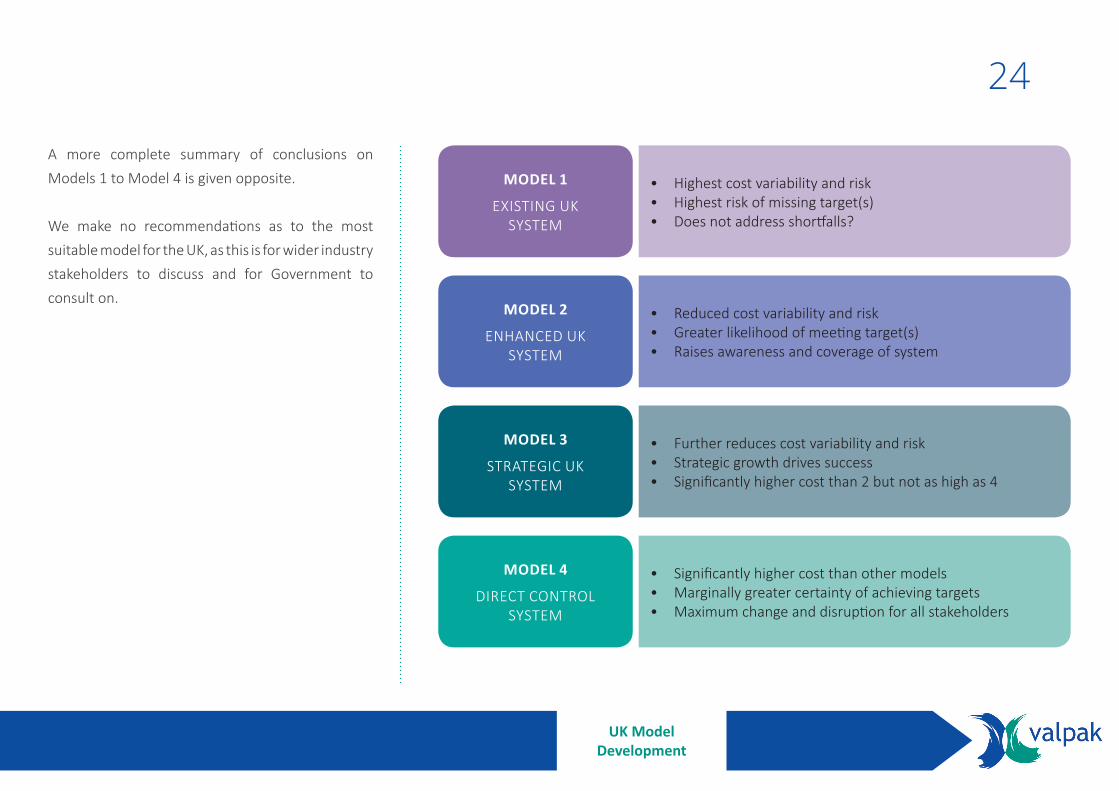
MODEL 1
EXISTING UKSYSTEM
• Highest cost variability and risk• Highest risk of missing target(s)• Does not address shortfalls?
MODEL 2
ENHANCED UK SYSTEM
• Reduced cost variability and risk• Greater likelihood of meeting target(s)• Raises awareness and coverage of system
MODEL 3
STRATEGIC UK SYSTEM
• Further reduces cost variability and risk• Strategic growth drives success• Significantly higher cost than 2 but not as high as 4
MODEL 4
DIRECT CONTROL SYSTEM
• Significantly higher cost than other models• Marginally greater certainty of achieving targets• Maximum change and disruption for all stakeholders
A more complete summary of conclusions on Models 1 to Model 4 is given opposite.
We make no recommendations as to the most suitable model for the UK, as this is for wider industry stakeholders to discuss and for Government to consult on.
24
UK ModelDevelopment
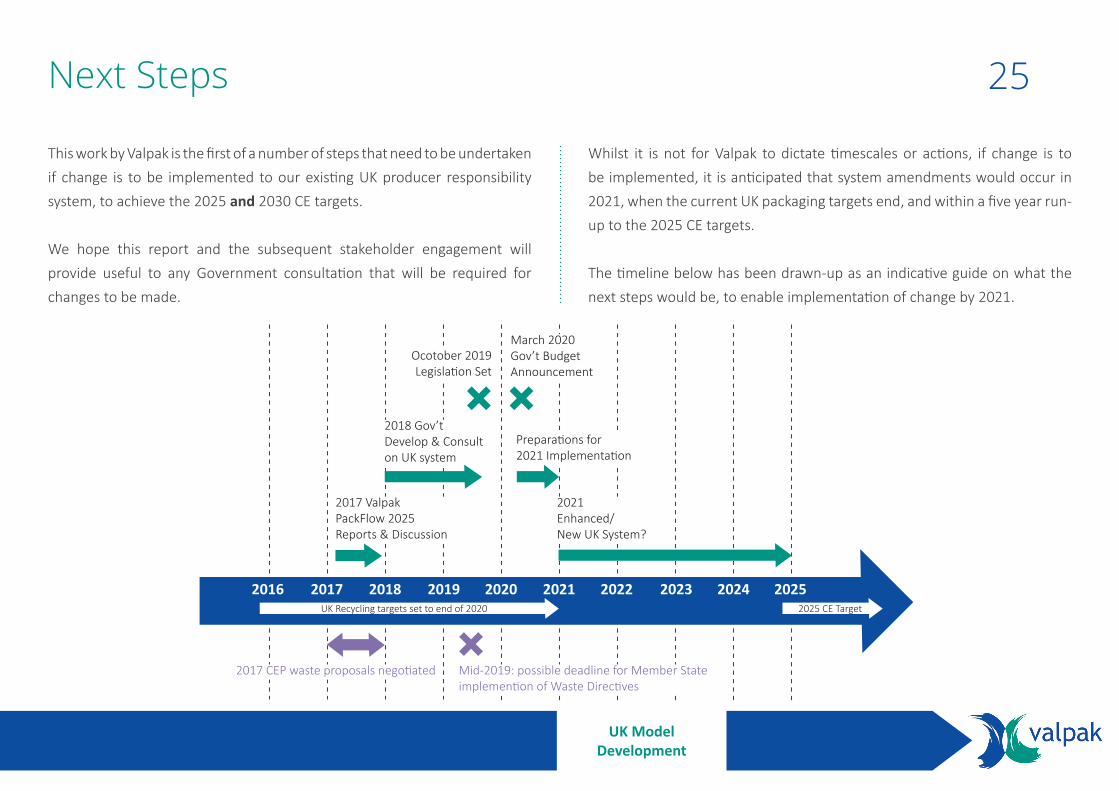
This work by Valpak is the first of a number of steps that need to be undertaken if change is to be implemented to our existing UK producer responsibility system, to achieve the 2025 and 2030 CE targets.
We hope this report and the subsequent stakeholder engagement will provide useful to any Government consultation that will be required for changes to be made.
Whilst it is not for Valpak to dictate timescales or actions, if change is to be implemented, it is anticipated that system amendments would occur in 2021, when the current UK packaging targets end, and within a five year run-up to the 2025 CE targets.
The timeline below has been drawn-up as an indicative guide on what the next steps would be, to enable implementation of change by 2021.
Next Steps 25
UK ModelDevelopment
2017 CEP waste proposals negotiated Mid-2019: possible deadline for Member State implemention of Waste Directives
2017 ValpakPackFlow 2025 Reports & Discussion
2021 Enhanced/New UK System?
2018 Gov’tDevelop & Consulton UK system
Ocotober 2019Legislation Set
March 2020Gov’t BudgetAnnouncement
UK Recycling targets set to end of 2020 2025 CE Target
Preparations for 2021 Implementation
2016 2017 2018 2019 2020 2021 2022 2023 2024 2025
ACP Advisory Committee on Packaging
C&I Commercial & Industrial
CE Circular Economy
DRS Deposit Return System
EA Environment Agency
EfW Energy from Waste
EPR Extended Producer Responsibility
FNC Full Net Cost
HH Household
IBA Incinerator Bottom Ash
k Thousand
LA Local Authority
m Million
MO Material Organisation
MSW Municipal Solid Waste
NPWD National Packaging Waste Database
PAYT Pay-as-you-Throw
POM Placed on the Market
PRN Packaging Recovery Note
R&D Research and development
t Tonnes
T/O Turnover
WEEE Waste Electrical and Electronic Equipment
WMC Waste Management Company
Glossary
GLOSSARY 26
Published
27th June 2017
Please visit www.valpak.co.uk/PF2025 to access this summary report
Contact us
Please contact us at [email protected] to
• register for the more detailed PackFlow 2025 report• leave feedback and comments on PackFlow 2025• contact the PackFlow 2025 team
Acknowledgements
Many thanks to all the schemes who shared information and gave up their time to help us:
Eco-Emballages (France)Ecoembes (Spain)Conai (Italy)DSD (Germany)Fost Plus & VAL-I-PAC (Belgium)Nedvang (The Netherlands)
PACKFLOW 2025 SUMMARY REPORT