Packers Creek Hydroelectric Project, Hydrology and Fish ...€¦ · latitude or longitude lat. or...
37
Technical Report No. 14-09 Packers Creek Hydroelectric Project, Hydrology and Fish Surveys, 2013 by Brad Dunker Packers Creek Upper Bypass Reach February 2015 Alaska Department of Fish and Game Division of Habitat
Transcript of Packers Creek Hydroelectric Project, Hydrology and Fish ...€¦ · latitude or longitude lat. or...

Technical Report No. 14-09
Packers Creek Hydroelectric Project, Hydrology and Fish Surveys, 2013
by Brad Dunker
Packers Creek Upper Bypass Reach
February 2015
Alaska Department of Fish and Game Division of Habitat

Symbols and Abbreviations The following symbols and abbreviations, and others approved for the Système International d'Unités (SI), are used without definition in Technical Reports by the Division of Habitat. All others, including deviations from definitions listed below, are noted in the text at first mention, as well as in the titles or footnotes of tables, and in figure or figure captions. Weights and measures (metric) centimeter cm deciliter dL gram g hectare ha kilogram kg kilometer km liter L meter m milliliter mL millimeter mm Weights and measures (English) cubic feet per second ft3/s foot ft gallon gal inch in mile mi nautical mile nmi ounce oz pound lb quart qt yard yd Time and temperature day d degrees Celsius °C degrees Fahrenheit °F degrees kelvin K hour h minute min second s Physics and chemistry all atomic symbols alternating current AC ampere A calorie cal direct current DC hertz Hz horsepower hp hydrogen ion activity pH (negative log of) parts per million ppm parts per thousand ppt, ‰ volts V watts W
General Alaska Administrative Code AAC all commonly accepted abbreviations e.g., Mr., Mrs., AM,
PM, etc. all commonly accepted professional titles e.g., Dr., Ph.D., R.N., etc. at @ compass directions:
east E north N south S west W
copyright corporate suffixes:
Company Co. Corporation Corp. Incorporated Inc. Limited Ltd.
District of Columbia D.C. et alii (and others) et al. et cetera (and so forth) etc. exempli gratia (for example) e.g. Federal Information Code FIC id est (that is) i.e. latitude or longitude lat. or long. monetary symbols (U.S.) $, ¢ months (tables and figures): first three letters Jan,...,Dec registered trademark trademark United States (adjective) U.S. United States of America (noun) USA U.S.C. United States Code U.S. state use two-letter
abbreviations (e.g., AK, WA)
Mathematics, statistics all standard mathematical
signs, symbols and abbreviations alternate hypothesis HA base of natural logarithm e catch per unit effort CPUE coefficient of variation CV common test statistics (F, t, χ2, etc.) confidence interval CI correlation coefficient (multiple) R correlation coefficient (simple) r covariance cov degree (angular ) ° degrees of freedom df expected value E greater than > greater than or equal to ≥ harvest per unit effort HPUE less than < less than or equal to ≤ logarithm (natural) ln logarithm (base 10) log logarithm (specify base) log2, etc. minute (angular) ' not significant NS null hypothesis HO percent % probability P probability of a type I error (rejection of the null hypothesis when true) α probability of a type II error (acceptance of the null hypothesis when false) β second (angular) " standard deviation SD standard error SE variance population Var sample var

The Alaska Department of Fish and Game (ADF&G) administers all programs and activities free from discrimination based on race, color, national origin, age, sex, religion, marital status, pregnancy, parenthood, or disability. The department administers all programs and activities in compliance with Title VI of the Civil Rights Act of 1964, Section 504 of the Rehabilitation Act of 1973, Title II of the Americans with Disabilities Act of 1990, the Age Discrimination Act of 1975, and Title IX of the Education Amendments of 1972.
If you believe you have been discriminated against in any program, activity, or facility please write:
●ADF&G ADA Coordinator, P.O. Box 115526, Juneau, AK 99811-5526
●U.S. Fish and Wildlife Service, 4401 N. Fairfax Drive, MS 2042, Arlington, VA
22203
●Office of Equal Opportunity, U.S. Department of Interior, 1849 C Street NW
MS 5230, Washington DC 20240
The department’s ADA Coordinator can be reached via phone at the following numbers:
●(VOICE) 907-465-6077
●(Statewide Telecommunication Device for the Deaf) 1-800-478-3648
●(Juneau TDD) 907-465-3646
●(FAX) 907-465-6078
For information on alternative formats and questions on this publication, please contact the following:
●ADF&G, Division of Habitat, 333 Raspberry Road, Anchorage, AK 99518 (907)267-2342.
Packers Creek Hydroelectric Project, Hydrology and Fish Surveys, 2013
Technical Report No. 14-09
by
Brad Dunker
Anthony DeGange, Director
Division of Habitat
Alaska Department of Fish and Game

TABLE OF CONTENTS Table of Contents ............................................................................................................................. i List of Tables .................................................................................................................................. ii List of Figures ................................................................................................................................ iii Acknowledgments.......................................................................................................................... iv EXECUTIVE SUMMARY ............................................................................................................ 1 INTRODUCTION .......................................................................................................................... 2 OBJECTIVES ................................................................................................................................. 3
Study Area .................................................................................................................................. 3
METHODS ..................................................................................................................................... 5 Hydrology Data Study Design .................................................................................................... 5
Analysis ...................................................................................................................................... 6
Fish Presence/Absence ............................................................................................................... 8
RESULTS ....................................................................................................................................... 9 Hydrology Data ........................................................................................................................... 9
Fish Presence/Absence ............................................................................................................. 16
DISCUSSION ............................................................................................................................... 18 Comparison with Existing Data ................................................................................................ 18
Hydrology and Habitat Considerations ..................................................................................... 22
R2CROSS ................................................................................................................................. 22
CDFW Wetted Perimeter Procedure ......................................................................................... 23
Future Water Management ....................................................................................................... 23
REFERENCES CITED ................................................................................................................. 24 APPENDIX 1 ................................................................................................................................ 26
i

LIST OF TABLES
Table Page 1. R2CROSS criteria. .................................................................................................................................................... 7
2. Mean daily flow (cfs) for Packers Creek. ............................................................................................................... 10
3. R2CROSS evaluation criteria and calculated flows from Packers Creek lower cross section data. ....................... 14
4. R2CROSS evaluation criteria and calculated flows from the Packers Creek upper cross section data. ................. 15
5. Mean fork length and CPUE for minnow trap sites. ............................................................................................... 17
6. Overall and monthly comparison of mean daily discharge at the lower cross section site from project permitting and this study. .............................................................................................................................. 19
ii
LIST OF FIGURES Figure Page 1. Packers Creek basin and study area. ......................................................................................................................... 4
2. Lower reaches of the Packers Creek study area and upper bypass reach ................................................................. 5
3. Hypothetical wetted perimeter-discharge curve demonstrates breakpoint and incipient asymptote that define flows critical to food production. .................................................................................................................... 8
4. Continuous stage data collected from the pressure transducer. Readings were taken every 30 minutes from June 25 to October 14, 2013. ........................................................................................................................... 9
5. Continuous temperature readings from the pressure transducer. Readings were taken every 30 minutes from June 25 to October 14, 2013. ......................................................................................................................... 11
6. August 2013 channel cross section at the lower site downstream of the pressure transducer site. ......................... 12
7. Percent wetted perimeter versus discharge at the lower cross section site. ............................................................ 12
8. Wetted perimeter-discharge curve for Packers Creek using the CDFW criteria. ................................................... 13
9. Cross section profile at the upper cross section site. ............................................................................................... 14
10. Percent wetted perimeter versus discharge at the upper cross section site. ........................................................... 15
11. Typical stream reach in lower Packers Creek bypass reach. ................................................................................. 16
12. Typical stream reach and steps in upper Packers Creek bypass reach. .................................................................. 16
13. Length frequency distribution of Dolly Varden. .................................................................................................... 17
14. Dolly Varden using pool habitat in the pressure transducer pool .......................................................................... 18
15. Hydrograph comparison between project permitting data and this study. ............................................................. 20
iii
ACKNOWLEDGMENTS I would like to thank Dillon Shults for his assistance with field work, drafting trip reports, and preparing us for the field. His assistance was invaluable to the project. I would also like to thank the Village of Chignik Lagoon for providing logistical information and access to the site. I specifically acknowledge Michelle Anderson for her commitment to this project. I would also like to thank some of my Alaska Department of Fish and Game colleagues: Michael Daigneault and Megan Marie for their assistance in developing the study plans and providing invaluable guidance throughout the project, and Josh Brekken for his assistance with field work.
iv

EXECUTIVE SUMMARY The Alaska Department of Fish and Game (ADF&G), Division of Habitat, issued a Fish Habitat Permit in January 2013 to allow the Village of Chignik Lagoon to construct a hydroelectric power generation project on Packers Creek. ADF&G conducted a hydrology and fish presence/absence study in Packers Creek during the summer of 2013 for the purpose of collecting additional pre-project data on stream flow and fish presence. Monitoring sites were established in the lower and upper portions of the proposed bypass reach to investigate habitat characteristics such as discharge, depth, and wetted perimeter. A pressure transducer was installed near the lower site to record continuous water stage data. Fish sampling was conducted throughout the bypass reach to determine presence/absence and general distribution of fish in the study area.
During the 2013 study, measured flows were higher than those recorded in 2010. Delayed snow melt in 2013 and large storm events contributed to the high discharge. Although the magnitude was different, the 2010 and 2013 natural hydrograph patterns were similar and consistent with known hydrograph patterns on the Alaska Peninsula. Data reported during permitting showed base flow conditions in April and peak discharge in mid-May. During this study, discharge was lowest in September and highest in October because of a substantial precipitation event.
Dolly Varden (Salvelinus malma) were the only fish species captured or observed during the study. Dolly Varden were present throughout the portion of the bypass reach sampled. Catch per unit effort was greatest at the upper bypass reach during all sampling trips. Mean fork length of fish captured was also higher in the upper bypass reach.
Both methods used in this study (R2CROSS and the California Department of Fish and Wildlife’s Standard Operating Procedure for Wetted Perimeter Analysis [2013]) suggest an instream flow requirement for Packers Creek of about 4.5 cfs. In the future, these data would be useful in advance of permitting decisions. According to the methods used, withdrawal of the appropriated water right of 8.5 cfs will result in bypass reach flows that will affect fish passage and maintenance of stream function. Post-construction monitoring is needed to understand the biological changes associated with an 8.5 cfs water withdrawal on the resident Dolly Varden.
1

INTRODUCTION High energy costs and an abundance of suitable streams and rivers for hydropower development in rural Alaskan communities have led to a number of hydropower and hydrokinetic projects being considered. Most communities are proposing traditional hydropower developments on smaller river systems (<500 cfs) that include small dams used to pond and divert water to a powerhouse. The projects typically have little to no water storage capacity. The dams are often placed at a relatively high elevation in the stream system to create enough head pressure to run the turbine. Often these projects include long bypass reaches relative to the overall length of the stream.
Data collection before flow alteration and post-flow alteration monitoring have been identified as critical needs in accurately assessing the biological changes of flow alteration on a river system (Lloyd et al. 2003; Poff and Zimmerman 2010). Small Alaska communities often have limited financial resources. When considering long-term, cost-saving hydropower projects, limited hydrology and fish resource data are collected to characterize the local fish and water resources. Also, few Alaska streams are gauged and resource managers must make decisions regarding hydropower development with minimal project-specific hydrology and fish data. Under these constraints, regulatory decisions are based on extrapolations of the existing data, assumptions regarding potential biological impacts, and professional judgment. The validity of these assumptions can be tested over time with appropriate data collection and monitoring.
Hydropower development may have multiple biological resource concerns, including adequate fish passage, sufficient instream flow within the bypass reach to maintain the indigenous aquatic life, or altered sediment transport and flow variability that maintain aquatic habitats. Because of the variability among fish species regarding fish movement, habitat use, and survival strategies, it is difficult to predict the impacts of hydropower development without site specific data on local fish, hydrology, habitats, and the expected alterations to each (Grant and Noakes 1987; Nielsen 1992; Nislow et al. 1998; Bujold et al. 2004; Bradford et al. 2011). Maintaining connectivity to smaller tributary stream systems that provide seasonal habitat for spawning salmonids or growth of rearing juveniles contributes to the overall success of the fish populations in the watershed. Ebersole et al. (2006) found that a tributary stream in Oregon that was nearly dry in midsummer supported a large spawning run of coho salmon (Oncorhynchus kisutch) in the fall, and rearing juveniles that utilized this habitat, when available, experienced high growth rates and emigrated as larger smolts compared to other parts of the watershed.
Poff and Zimmerman (2010) conducted a literature review on ecological responses to alteration of natural flow with an emphasis on projects completed in the last decade. Dams were used to alter natural flow regimes in 88% of the 165 papers reviewed. Among those papers reviewed, 92% reported negative ecological change (e.g., loss of habitat, loss of stream function) in response to flow alterations. Fish populations consistently responded negatively to changes in flow magnitude. Under reduced flows, 80% of the studies reported more than 50% reduction in aquatic organism diversity where flow magnitudes exceeded 50% decrease. Other meta-analyses reported that 87% of studies reviewed showed changes in either geomorphic or ecological variables, or both, as a result of reduced flow volumes (Lloyd et al. 2003). Water management that disrupts the natural flow regime can segment stream habitat, reduce water levels, or increase water temperature over an extended period of time by eliminating freshets and other pulse events that help maintain lower water temperatures. Alteration of stream flow and incomplete
2

information on the river systems being impacted can result in unintended impacts to the aquatic biota and ecosystem functions of a river system that cannot be reversed once a hydropower project is developed.
A recently approved, but not yet constructed, small hydropower project is proposed on Packers Creek near Chignik Lagoon. The Packers Creek hydroelectric project is authorized to withdraw up to 8.5 cfs at any given time; there is no minimum spill requirement at the diversion dam. Five tributaries are expected to provide flow to the bypass reach. Tributary and accretion flows are estimated as 2 cfs at the downstream end of the bypass reach (Polarconsult 2012). The Chignik Regional Aquaculture Association investigated the presence and distribution of fish in Packers Creek and found resident Dolly Varden (Salvelinus malma) in the lower bypass reach and in the reach below the project’s proposed powerhouse location (Barrett 2012a, 2012b).
OBJECTIVES The purpose of this study was to collect hydrology, fish presence/absence, and anadromous fish distribution data in the bypass reach of the proposed Packers Creek hydropower project. At Packers Creek, we intended to establish a stage/discharge relationship to document the range of flow and establish a stage/depth relationship. In regards to fish, we investigated the presence and absence of fish in the bypass reach to better understand their habitat use and distribution. These data will supplement the baseline data collected for the proposed project to better understand local hydrology and fish resources prior to hydropower development. More complete data will provide a better baseline condition in which to compare post-construction flow alteration conditions and assess changes after dam construction and water diversion. Information gathered during this study can be used for more informed decision-making for future hydropower projects.
STUDY AREA The Packers Creek watershed is about 2.6 km2 in size. Packers Creek originates in multiple high-gradient headwater tributaries that flow over interbedded sedimentary and volcanic rock. The middle reach of Packers Creek contains two waterfalls (24.4 m and 14.6 m in height). The lower reach of Packers Creek is moderate to low gradient and discharges into saltwater over unconsolidated alluvial deposits within the Village of Chignik Lagoon. Flow in the lower reach of Packers Creek is estimated to range from 2 to 28 cfs based on 1 year and 2 months of data. Low flow occurred in April and high flow in late May.
The lower boundary of the study area is located at the outfall of the proposed tailrace (Figure 1). This stream reach is low gradient (<2% slope). The creek channel is composed primarily of a boulder substrate with cobble and pebbles present in periodic small pools (Figure 2). Small steps are present throughout the lower reaches of the creek. Small pools are present, but uncommon in the lower most section of the study area below the pressure transducer site.
The upper extent of the study area is defined by a 24.4 m tall waterfall that flows over an exposed bedrock escarpment. The creek flows through a gorge that creates a high gradient step-pool stream channel with exposed bedrock outcrops and large boulders (Figure 2). Numerous large steps are present in the upper bypass area that have scoured out deep pools at the base of each step.
Packers Creek was listed as a specified anadromous waterbody (AWC No. 271-10-10180) that supported pink salmon (O. gorbuscha) and Dolly Varden (Johnson and Daigneault 2013).
3
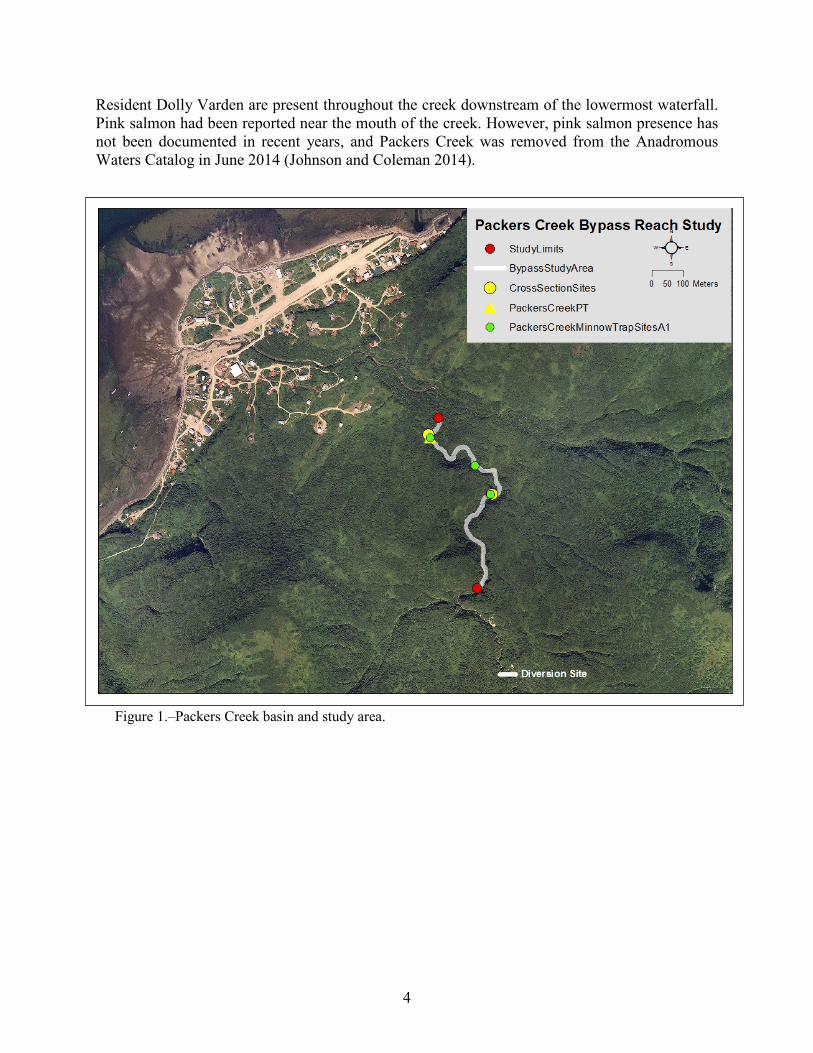
Resident Dolly Varden are present throughout the creek downstream of the lowermost waterfall. Pink salmon had been reported near the mouth of the creek. However, pink salmon presence has not been documented in recent years, and Packers Creek was removed from the Anadromous Waters Catalog in June 2014 (Johnson and Coleman 2014).
Figure 1.–Packers Creek basin and study area.
4
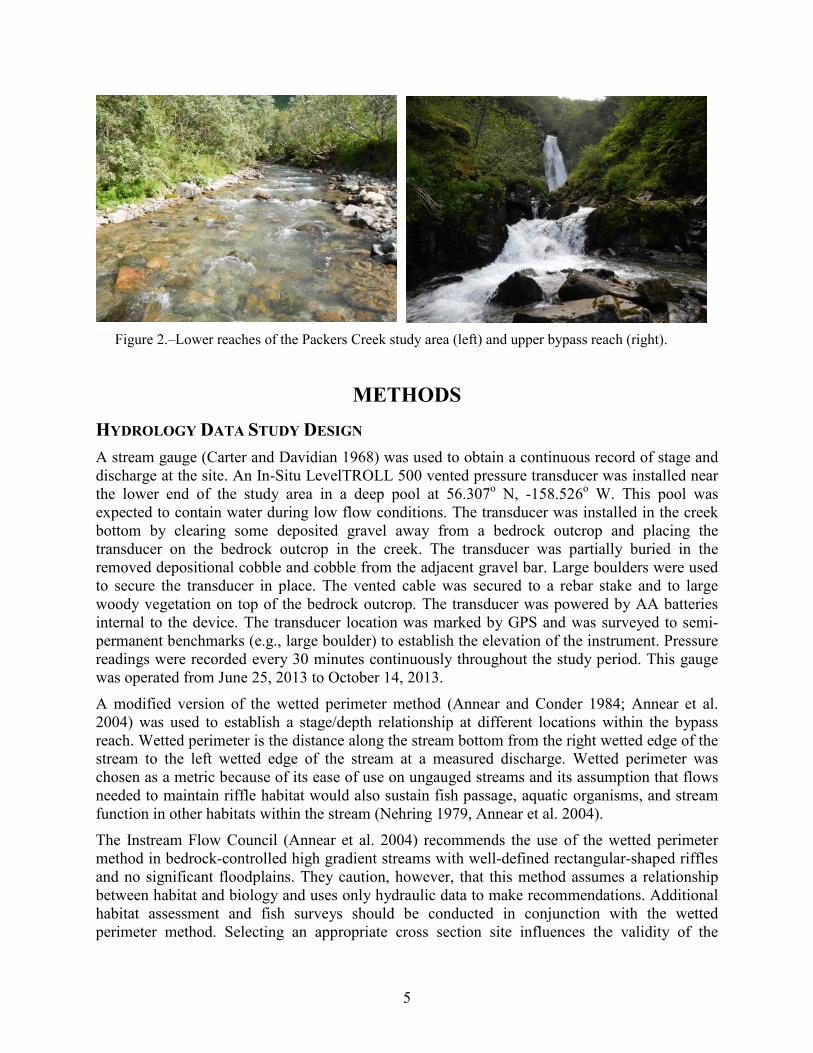
Figure 2.–Lower reaches of the Packers Creek study area (left) and upper bypass reach (right).
METHODS HYDROLOGY DATA STUDY DESIGN A stream gauge (Carter and Davidian 1968) was used to obtain a continuous record of stage and discharge at the site. An In-Situ LevelTROLL 500 vented pressure transducer was installed near the lower end of the study area in a deep pool at 56.307o N, -158.526o W. This pool was expected to contain water during low flow conditions. The transducer was installed in the creek bottom by clearing some deposited gravel away from a bedrock outcrop and placing the transducer on the bedrock outcrop in the creek. The transducer was partially buried in the removed depositional cobble and cobble from the adjacent gravel bar. Large boulders were used to secure the transducer in place. The vented cable was secured to a rebar stake and to large woody vegetation on top of the bedrock outcrop. The transducer was powered by AA batteries internal to the device. The transducer location was marked by GPS and was surveyed to semi-permanent benchmarks (e.g., large boulder) to establish the elevation of the instrument. Pressure readings were recorded every 30 minutes continuously throughout the study period. This gauge was operated from June 25, 2013 to October 14, 2013.
A modified version of the wetted perimeter method (Annear and Conder 1984; Annear et al. 2004) was used to establish a stage/depth relationship at different locations within the bypass reach. Wetted perimeter is the distance along the stream bottom from the right wetted edge of the stream to the left wetted edge of the stream at a measured discharge. Wetted perimeter was chosen as a metric because of its ease of use on ungauged streams and its assumption that flows needed to maintain riffle habitat would also sustain fish passage, aquatic organisms, and stream function in other habitats within the stream (Nehring 1979, Annear et al. 2004).
The Instream Flow Council (Annear et al. 2004) recommends the use of the wetted perimeter method in bedrock-controlled high gradient streams with well-defined rectangular-shaped riffles and no significant floodplains. They caution, however, that this method assumes a relationship between habitat and biology and uses only hydraulic data to make recommendations. Additional habitat assessment and fish surveys should be conducted in conjunction with the wetted perimeter method. Selecting an appropriate cross section site influences the validity of the
5

collected data. The cross section site should be located within a riffle at the shallowest portion (grade control). Riffles are selected because they are controlled by channel geometry rather than a downstream flow control, sensitive to changes in flow, and are the first segments of stream to dry during low flow conditions. Deviation from this location could result in artificially high or low instream flow recommendations.
Two stream cross-sections were established at the grade control of representative riffle habitats in the bypass reach. The lower bypass reach cross section was located about 10 feet downstream of the pressure transducer site (Figure 1). This site is located near the cross sections investigated by Polarconsult during project permitting (Polarconsult 2011, 2012). The upper bypass reach cross section site was located about 4.6 m downstream of a large pool that marks the downstream end of the high gradient step-pool habitat near the first waterfall (Figure 1). Flow velocity was measured at each cross-section and discharge was calculated during each field visit. Rebar stakes were placed on top of the streambank to mark the cross section locations. A laser level and sag tape were used to establish a temporary benchmark (level line) and determine distance from the point of beginning (rebar stake on the right bank facing upstream) to the corresponding rebar stake on the left bank. Discharge was measured by partitioning the creek into 16 to 20 subsections, calculating the area of each subsection using measured width and depth data, measuring mean water velocity in each subsection (from the water surface, 60% total depth), then calculating the cross-section discharge by summing the subsections discharges (Rose and Johnson 1976). The pressure transducer data were compared with the measured discharge at each cross section to establish the stage/discharge relationship. Also, at each cross-section, a hand-held YSI water quality meter was used to record temperature, pH, dissolved oxygen, and conductance.
Site visits were made 3 times during the summer of 2013 to download the data, obtain discharge measurements, and perform routine gauge maintenance. Data were downloaded from the pressure transducer to a laptop using the WinSitu software. Discharge measurement data and other site visit notes were recorded in a waterproof field notebook. Photographs of the gauge site, discharge measurement transect, and the stream were taken during each visit.
ANALYSIS We used 2 methods to identify minimum instream flow for Packers Creek. The fundamental difference in the 2 methods is in the way they view and define minimum instream flow. One method defines minimum instream flow as the flows below which the ability of fish to move throughout their range may be inhibited, while the second method defines the minimum instream flow as flows below which there would be a rapid decline in food production to support the fish population.
First, the R2CROSS method was used to identify instream flow values that would maintain fish passage. The R2CROSS software has been used in the western United States for establishing minimum instream flow (Anonymous 1974, Espegren 1996). The R2CROSS software provides an automated spreadsheet that was used to calculate discharge, hydraulic radius, and wetted perimeter. The method specifies that certain criteria be met for the discharge to be considered adequate to maintain fish passage. The 3 criteria are average water depth, percent of wetted perimeter, and average velocity. The thresholds for these criteria vary with the width of the stream at bankfull discharge. The R2CROSS requirements for different stream widths are shown in Table 1. For fish passage to be maintained the R2CROSS method requires that spring and
6

summer flow rates within the riffles satisfy all three criteria, while autumn and winter flows must meet two of the three criteria. For example, a stream with a bankfull width of 20 feet would require an average depth of 0.2 feet, need to maintain 50% wetted perimeter, and have an average velocity of 1.0 ft/s in order to maintain fish passage during the spring and summer.
Table 1.–R2CROSS criteria.
Stream top width (ft) at bankfull discharge Average depth (ft) Wetted perimeter (%) Average velocity (ft/s)
1-20 0.2 50 1.0
21-40 0.2-0.4 50 1.0
41-60 0.4-0.6 50-60 1.0
61-100 0.6-1.0 >70 1.0
Field measurements were taken within riffle habitats as described in the cross section methods above. Riffles are conducive to this type of analysis because they are controlled by channel geometry rather than a downstream flow control. They are also important habitats for fish passage, biological production, and cover for fish. Riffle habitats are also sensitive to streamflow changes. A slight reduction in streamflow may result in large reductions in water depth and wetted perimeter available for habitat (Nehring 1979). Field data were collected and input into R2CROSS for analysis. R2CROSS calculated a staging table that estimates flows needed to meet the average depth, percent wetted perimeter, and average velocity criteria. Seasonal instream flow recommendations can be made based on these criteria and information collected during the site visits.
Second, the California Department of Fish and Wildlife Instream Flow Program established standard operating procedures for the wetted perimeter method in California (CDFW 2013). This method uses the data collected in the field to establish a wetted perimeter-discharge curve and is designed to identify flows for maintaining productive riffle habitat. The curve is used to determine a range of flows that are critically important to food production. Flows above this range are considered at or near optimum for food production. Flows below this range indicate rapidly declining food production that can impact local fish populations.
This method uses a wetted perimeter-discharge curve to identify the flows at which there are significant changes in the slope of the curve. The first significant inflection point is called the breakpoint, which identifies the threshold flows below which habitat conditions (wetted perimeter, food production) rapidly decline (Figure 3). The second inflection point is called the incipient asymptote and identifies flows that create near optimum conditions for food production (Figure 3). The range of flows between the breakpoint and the incipient asymptote are considered critical for food production and maintaining stream function.
7

Figure 3.–Hypothetical wetted perimeter-discharge curve demonstrates breakpoint and incipient
asymptote that define flows critical to food production (CDFW 2013).
FISH PRESENCE/ABSENCE Baited minnow traps were set at each cross section site described above to determine fish presence or absence. A third minnow trap site was added between the 2 cross section sites to better understand fish distribution (Figure 1). Up to 3 traps per site were used during the sampling events in June, August, and October (Appendix 1). The minnow traps were 22.8 cm in diameter and constructed of 0.6 cm mesh. Each trap was baited using equal amounts of fresh or frozen salmon roe disinfected in a betadyne solution and packaged in Whirl-Paks or nylon stockings. Minnow traps were stabilized with a rock placed inside or tethered to riparian vegetation, or both. Minnow traps were soaked for 24 hours. All captured fish were identified to species, measured to the nearest millimeter (fork length), and released at the point of capture. Minnow trap sites were photographed prior to the traps being removed.
Water clarity in Packers Creek is clear and allows for visual observation of fish. A GoPro high-definition video camera was used to survey small pools where fish were observed, but no trapping effort was made. The camera was either placed in the pool or hand-held, depending on flow velocities and size of the pool. Images were reviewed on a computer each day to document the observations and habitat usage by fish. High definition images were used to identify the fish observed to species and obtain estimates of the number of fish present. Observational surveys were conducted in Packers Creek to determine the presence or absence of pink salmon in the lower reaches downstream of the bypass study area.
Catch per unit effort (CPUE) was calculated for Dolly Varden by dividing the total catch (Ct) by the total number of hours fished (cumulative of all traps; Ht) and multiplied by 24 for a
8

normalized trap catch of fish per day (equation below). Data analysis was performed using Microsoft Excel®.
𝐶𝐶𝐶𝐶𝐶𝐶𝐶𝐶 =𝐶𝐶𝐶𝐶𝐻𝐻𝐶𝐶
× 24
RESULTS HYDROLOGY DATA Continuous stage readings were recorded by the pressure transducer from June 25 to October 14, 2013 (Figure 4). These data demonstrate that Packers Creek appears to follow a similar hydrology pattern to other streams on the Alaska Peninsula where flows are elevated in the late spring and early summer by snowmelt, gradually decline throughout the summer with the exception of storm events, and rapidly increase stage during fall precipitation events.
Figure 4.–Continuous stage data collected from the pressure transducer. Readings were taken every 30
minutes from June 25 to October 14, 2013.
Pressure transducer stage data and cross section flow measurements were used to calculate mean daily discharge in Packers Creek. Mean daily discharge rates ranged from 8.30 cfs in early September to 28.03 in early October (Table 2).
0
0.5
1
1.5
2
2.5
3
3.5
4
6/15 7/
5
7/25
8/14 9/
3
9/23
10/1
3
11/2
Stag
e (f
t)
Date
9

Table 2.–Mean daily flow (cfs) for Packers Creek. Data were extrapolated from the pressure transducer stage readings.
Day June July August September October 1
14.72 10.72 8.64 10.49
2
13.88 11.87 9.70 14.00
3
13.81 12.21 9.17 28.03
4
13.88 10.94 9.14 25.55
5
13.54 12.42 8.75 23.73
6
13.88 21.24 8.68 22.09
7
13.33 20.60 8.56 21.43
8
13.21 16.06 8.30 20.89
9
13.21 14.47 9.14 19.97
10
13.39 13.54 8.99 19.55
11
13.38 12.75 8.79 19.80
12
14.28 12.04 9.13 20.84
13
14.42 11.50 9.12 20.80
14
13.03 11.16 8.96
15
12.73 10.84 8.83
16
13.57 10.60 8.75
17
15.15 10.62 8.69
18
14.21 10.46 8.57
19
12.80 9.98 8.68
20
12.64 9.95 8.77
21
12.00 9.79 8.84
22
12.27 9.63 9.03
23
11.92 9.46 9.16
24
11.87 9.29 9.07
25
11.18 9.27 9.51
26 17.54 10.79 9.17 12.31
27 17.03 10.31 9.00 13.15
28 15.85 9.98 9.07 11.47
29 15.44 9.79 9.01 11.06
30 16.28 9.69 8.80 10.80
31
10.88 8.76
The pressure transducer also recorded water temperature at 30 min intervals. Water temperature readings are presented in Figure 5. Minimum water temperature was 2.1 °C on June 27 at 0138; maximum water temperature was 10.5 °C on July 25 at 1708. Water temperature followed a diel pattern throughout the season, with lowest temperatures generally recorded from 0000-0500 and daily temperature peaking typically between 1700 and 1900.
10

Figure 5.–Continuous temperature readings from the pressure transducer. Readings were taken every 30
minutes from June 25 to October 14, 2013.
The riffle cross section shows a streambed profile for the lower cross section site (Figure 6). The monthly wetted perimeter-discharge curves produced from the R2CROSS output for the 3 different months that discharge was measured are shown in Figure 7. The wetted perimeter-discharge curve shows the breakpoint and incipient asymptote at this site based on the CDFW wetted perimeter method (Figure 8).
0
2
4
6
8
10
126/
15 7/5
7/25
8/14 9/
3
9/23
10/1
3
11/2
Tem
pera
ture
(ºC
)
Date
11

Figure 6.–August 2013 channel cross section at the lower site downstream of the pressure transducer site.
Figure 7.–Percent wetted perimeter versus discharge (cfs) at the lower cross section site.
-4.00
-3.50
-3.00
-2.50
-2.00
-1.50
-1.00
-0.50
0.00
0.00 5.00 10.00 15.00 20.00 25.00 30.00
VER
TIC
AL
DEP
TH (F
T)
Channel Bottom Computed Water Line
0.0%
20.0%
40.0%
60.0%
80.0%
100.0%
120.0%
140.0%
0.00 50.00 100.00 150.00 200.00
Perc
ent w
ette
d pe
rimet
er
Discharge (cfs)
June
August
October
DISTANCE (FT) FROM STREAMBANK STAKE
12
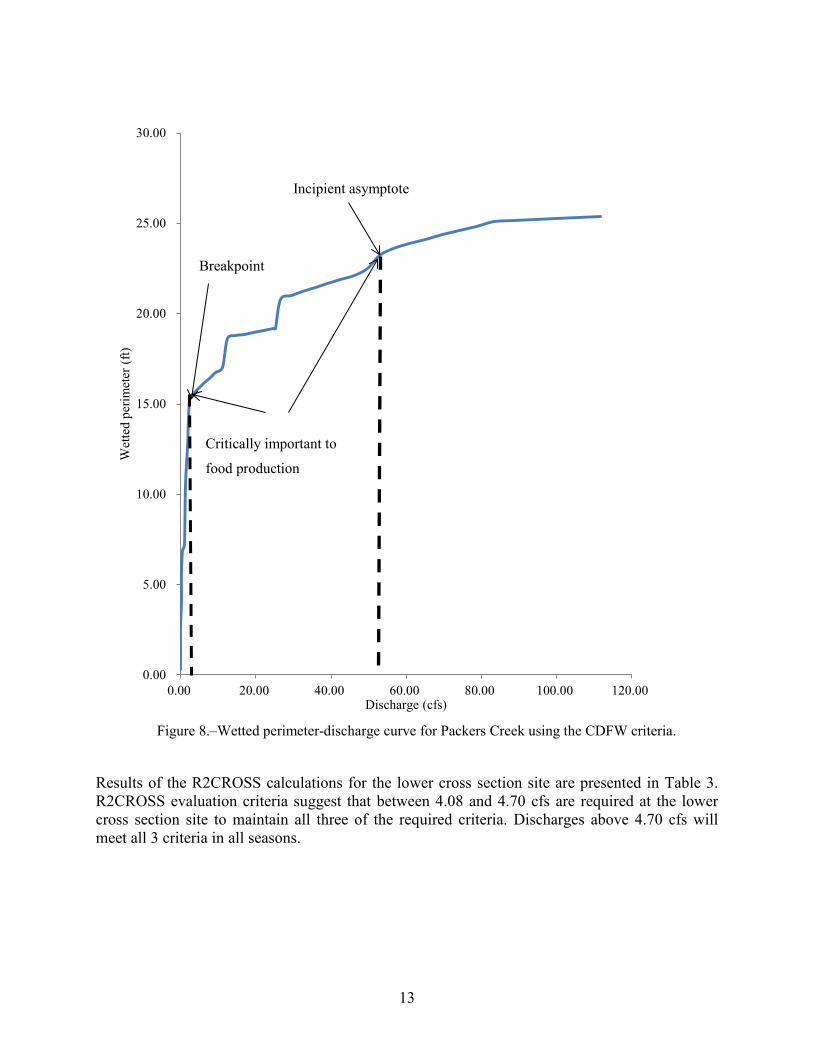
Figure 8.–Wetted perimeter-discharge curve for Packers Creek using the CDFW criteria.
Results of the R2CROSS calculations for the lower cross section site are presented in Table 3. R2CROSS evaluation criteria suggest that between 4.08 and 4.70 cfs are required at the lower cross section site to maintain all three of the required criteria. Discharges above 4.70 cfs will meet all 3 criteria in all seasons.
0.00
5.00
10.00
15.00
20.00
25.00
30.00
0.00 20.00 40.00 60.00 80.00 100.00 120.00
Wet
ted
perim
eter
(ft)
Discharge (cfs)
Breakpoint
Incipient asymptote
Critically important to
food production
13

Table 3.–R2CROSS evaluation criteria and calculated flows from Packers Creek lower cross section data.
Date Bankfull width (ft)
Required average
depth (ft)
Flow to meet
average depth (cfs)
Required wetted
perimeter (%)
Flow to meet
wetted perimeter
(cfs)
Required average velocity
(ft/s)
Flow to meet
velocity (cfs)
6/25/13 13 0.2 2.40 50 2.41 1.0 4.70 8/12/13 14 0.2 2.80 50 0.80 1.0 3.79 10/13/13 14 0.2 4.08 50 2.83 1.0 0.46
The riffle cross section shows a streambed profile for the upper cross section site (Figure 9). The monthly wetted perimeter-discharge curves produced from the R2CROSS output for the 3 different months that discharge was measured are shown in Figure 10.
Figure 9.–Cross section profile at the upper cross section site.
-4.50
-4.00
-3.50
-3.00
-2.50
-2.00
-1.50
-1.00
-0.50
0.00
0.00 5.00 10.00 15.00 20.00 25.00 30.00
VER
TIC
AL
DEP
TH (F
T)
Channel Bottom Computed Water Line
DISTANCE (FT) FROM STREAMBANK STAKE
14

Figure 10.–Percent wetted perimeter versus discharge (cfs) at the upper cross section site.
Results of the R2CROSS calculations for the upper cross section site are presented in Table 4. Because the stream bankfull width is >20 feet, a range of discharge is used for satisfying the average depth criteria (see Table 1). R2CROSS evaluation criteria indicate that flows between 6.21 and 7.10 cfs satisfy all three required criteria in all months sampled.
Table 4.–R2CROSS evaluation criteria and calculated flows from the Packers Creek upper cross
section data.
Date Bankfull width (ft)
Required average
depth (ft)
Flow to meet
average depth (cfs)
Required wetted
perimeter (%)
Flow to meet
wetted perimeter
(cfs)
Required average velocity
(ft/s)
Flow to meet
velocity (cfs)
6/2513 30 0.2-0.4 1.09-5.28 50 6.21 1.0 0.79 8/12/13 28 0.2-0.4 1.10-9.10 50 2.41 1.0 0.90 10/13/13 28 0.2-0.4 0.86-15.98 50 7.10 1.0 1.20 Small steps are present in the lower reaches of the study area, ranging from about 4 to 10 inches in height (Figure 11). These steps provide fish passage at low notches between rock and slower water areas along the banks of the creek. Pools were present downstream of large boulders or other obstructions to flow. Two of the larger pools surveyed were about 1.8 m long by 0.6 m wide and had a maximum depth of about 0.3 m.
0.0%
20.0%
40.0%
60.0%
80.0%
100.0%
120.0%
140.0%
0.00 50.00 100.00 150.00 200.00 250.00
Perc
ent w
ette
d pe
rimet
er
Discharge (cfs)
June
August
October
15
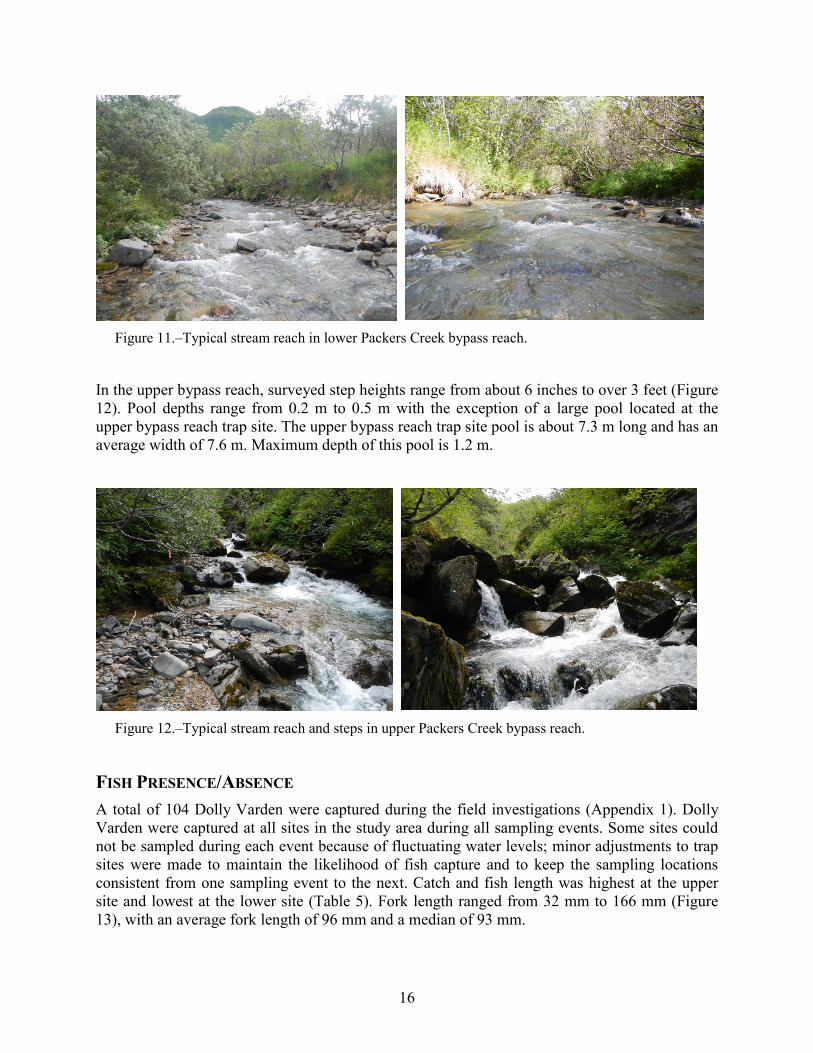
Figure 11.–Typical stream reach in lower Packers Creek bypass reach.
In the upper bypass reach, surveyed step heights range from about 6 inches to over 3 feet (Figure 12). Pool depths range from 0.2 m to 0.5 m with the exception of a large pool located at the upper bypass reach trap site. The upper bypass reach trap site pool is about 7.3 m long and has an average width of 7.6 m. Maximum depth of this pool is 1.2 m.
Figure 12.–Typical stream reach and steps in upper Packers Creek bypass reach.
FISH PRESENCE/ABSENCE A total of 104 Dolly Varden were captured during the field investigations (Appendix 1). Dolly Varden were captured at all sites in the study area during all sampling events. Some sites could not be sampled during each event because of fluctuating water levels; minor adjustments to trap sites were made to maintain the likelihood of fish capture and to keep the sampling locations consistent from one sampling event to the next. Catch and fish length was highest at the upper site and lowest at the lower site (Table 5). Fork length ranged from 32 mm to 166 mm (Figure 13), with an average fork length of 96 mm and a median of 93 mm.
16
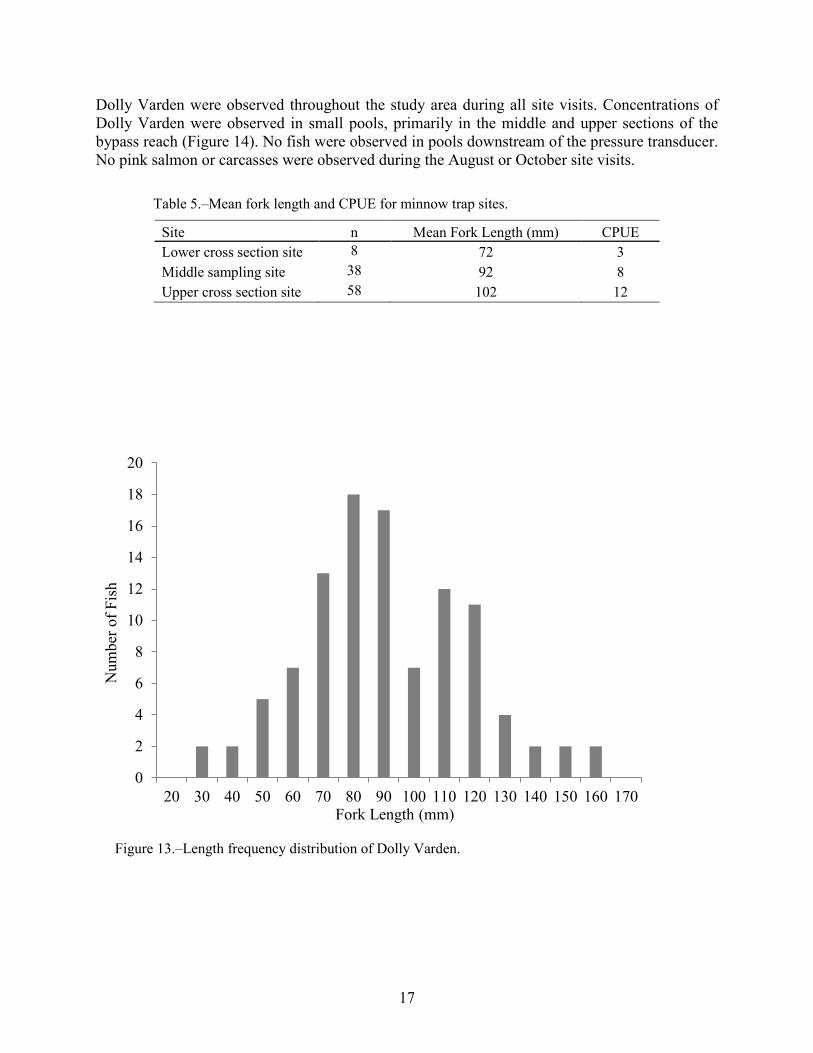
Dolly Varden were observed throughout the study area during all site visits. Concentrations of Dolly Varden were observed in small pools, primarily in the middle and upper sections of the bypass reach (Figure 14). No fish were observed in pools downstream of the pressure transducer. No pink salmon or carcasses were observed during the August or October site visits.
Table 5.–Mean fork length and CPUE for minnow trap sites.
Site n Mean Fork Length (mm) CPUE Lower cross section site 8 72 3 Middle sampling site 38 92 8 Upper cross section site 58 102 12
Figure 13.–Length frequency distribution of Dolly Varden.
0
2
4
6
8
10
12
14
16
18
20
20 30 40 50 60 70 80 90 100 110 120 130 140 150 160 170Fork Length (mm)
Num
ber o
f Fis
h
17

Figure 14.–Dolly Varden (circled) using pool habitat in the pressure transducer pool (left). Dolly Varden
captured in a minnow trap at the upper cross section site (right).
DISCUSSION Under natural conditions, variability in discharge plays an important role in stream function and maintaining aquatic life. Seasonal cycles and periodic events of higher and lower water levels influence water temperature, sediment transport, and a host of other water quality and stream function parameters (Poff et al. 1997). When water management activities begin, the natural flow regime is disrupted and replaced by longer duration base flow levels, less frequent and less intense pulse flows, and temporal shifts in flow levels.
COMPARISON WITH EXISTING DATA We compared our data to those collected during permitting to improve our understanding of the natural flow regime and fish resources in Packers Creek. Five components of a natural flow regime were considered: 1) the magnitude of discharge, 2) the frequency of pulse flow events, 3) the duration of flow conditions, 4) the timing of flow conditions, and 5) the rate of change between minimum and maximum flow conditions (i.e., the flashiness; Poff et al. 1997). Magnitude is defined as the amount of water moving past a specified location per unit time. This is often reported as discharge in cubic feet per second or cubic meters per second. The frequency of pulse flow events relates to how often a flow above a given discharge recurs over some specified time interval. Flood classification (e.g., 5-year flood, 10-year flood) is a good example of frequency. Duration is the period of time associated with a specific flow condition. This can be expressed as the number of days a floodplain is inundated or days per year flows exceed a certain value. Timing refers to the regularity of occurrence of defined flows of a specific magnitude such as annual peak flows. The rate of change or flashiness reflects how quickly flows change from one magnitude to another (Poff et al. 1997). Comparing these metrics between data sets will enhance our understanding of baseline conditions prior to construction and operation of the diversion structure and allow future comparison to data collected during future project monitoring.
Magnitude of Discharge Mean daily discharge reported for the lower cross section site from each study are shown in Table 6. Project permitting data were collected from February to mid-October, 2010; we collected data from June 25 to October 14, 2013.
18

Based on the stream gauge used for project permitting, mean daily discharge recorded during late summer and fall (August through October) ranged from a low of 3.7 cfs in mid-September to a high of 14.5 cfs in mid-August. During fall/winter months (October and February to April), mean daily discharge averaged about 4.5 cfs at the gauge site. Fall and winter low flow may be important to Dolly Varden movements within Packers Creek.
From June to October, we consistently recorded higher discharge values at the lower cross section site than those reported during project permitting (Table 6 and Figure 15). Two primary factors likely contributed to the higher 2013 flows: a delayed snowmelt and a snowpack that persisted into July, and a significant regional storm event in October. For project permitting in 2010, the lowest flow (1.7 cfs) was recorded on April 7 and the highest flow (21.7 cfs) occurred on May 28. In 2013, the lowest flow (8.3 cfs) was recorded on September 8, and the highest flow (28.0 cfs) occurred on October 3.
Table 6.–Overall and monthly comparison of mean daily discharge (cfs) at the lower cross section site
from project permitting (2010) and this study (2013). Mean Daily Discharge (cfs) Range*
Study (Date) Overall June July August September October Project permitting 1.7-21.7 10.6-17.7 7.6-14.6 5.4-14.5 3.7-5.4 4.1-5.1 (13.5) (9.7) (7.6) (4.4) (4.6) This study 8.3-28.0+ 15.4-17.5# 9.7-15.2 8.8-21.2 8.3-13.2 10.5-28.0
(16.4) (12.7) (11.5) (9.4) (20.6)
*Monthly means are shown in parenthesis. +Data were collected from June 25 to October 14, 2013. Project permitting data were collected from February to mid-October. #Only five days of data were recorded in June 2013, from June 25-30.
19

Figure 15.–Hydrograph comparison between project permitting data and this study.
Frequency of Pulse Flows and Flow Duration Packers Creek is a snowmelt-fed and precipitation-driven system, characterized by a prolonged period of elevated discharge levels in the spring and early summer based on snowmelt and intermittent pulses of higher water levels when air temperature increases and/or precipitation events occur, increasing snowmelt or adding water into the system. In 2010, 4 pulse flow events occurred where discharge increased >5 cfs: 2 in May, 1 in July, and 1 in August. Discharge returned to pre-pulse flow discharge within 10 days of peak flow. In 2013, pulse flow events where discharge increased >5 cfs in Packers Creek, occurred twice. One event occurred in early August and another in early October. Following the August event, discharge remained elevated for 5 days before returning to pre-storm event discharge. In October, discharge remained higher than pre-pulse event readings for at least 10 days. After day ten, the pressure transducer was removed from the water so the total duration of the higher discharge is unknown.
Timing of Flow In 2010, mean daily discharge above 8.5 cfs (i.e., the appropriated water right) was recorded in the lower section of the bypass reach from May 16 through July 22, on July 30, and again from August 13 through August 17 during a brief pulse flow event (Figure 15). Discharge in Packers
0
5
10
15
20
25
30
1/22 3/13 5/2 6/21 8/10 9/29 11/18
Mea
n D
aily
Dis
char
ge (c
fs)
Date
2010 data
2013 data
8.5 cfs
20
Creek did not exceed 8.5 cfs the remainder of the time period measured. These data indicate that Packers Creek will not consistently provide the 8.5 cfs water right and that post-construction flow within the Packers Creek bypass reach will be limited to tributary flows and accretion the majority of the year.
In 2013, mean daily discharge was above 8.5 cfs for the duration of our study, with the exception of September 8, 2013, when mean daily discharge was 8.3 cfs. Based on these data, Packers Creek could provide the 8.5 cfs water right for a substantial part of the summer/fall season. Comparison of the data submitted during project permitting and those data collected during this study suggest a substantial difference between water years.
It is important to distinguish that the water right is appropriated at the withdrawal point in the upstream reach of Packers Creek and the discharge measurements were taken in the lower portion of the bypass reach. Thus, the number of days that Packers Creek flow at the withdrawal point will exceed the appropriated water right will be less than what the existing data suggest. Also, variations in tributary discharges or accretion flows will change the relationship between measured discharge at the gauge site and flows at the withdrawal point.
Flashiness The frequency, duration, and timing of flows in Packers Creek suggest that the natural flow regime in Packers Creek has a high rate of change or flashiness value. While data collected from this study showed generally higher discharge rates than those reported during project permitting, the general patterns of short-duration storm events and longer term hydrology patterns are evident in both data sets (Figure 15). Sudden increases in magnitude and the short duration of pulse events indicates that Packers Creek is a dynamic system that experiences rapid change between discharge rates.
Fish Resources The Chignik Lagoon Aquaculture Association (Barrett 2012a) caught a total of 34 Dolly Varden in Packers Creek with 396 hours of minnow trap effort during a survey conducted in June of 2012. About two-thirds of the fishing effort occurred in the lower half of the bypass reach with a catch of 23 Dolly Varden; the remainder of the effort and catch occurred below the proposed powerhouse location. Mean fork length in the bypass reach sampling area was 108 mm; mean fork length in the lower sampling area was 100 mm. Barrett (2012b) reported catching a total of eight Dolly Varden in Packers Creek with 170 hours of minnow trap effort during a survey conducted in the fall of 2012. This sampling effort occurred in the reach upstream of the proposed water intake, downstream to the proposed powerhouse. Fish were captured near both of the 2013 cross sections. Six fish were trapped at the lower cross section site and 2 fish were trapped at the upper cross section site. Mean fork length was 104 mm; lengths ranged from 74 to 160 mm.
In comparison, we captured 104 fish with 312 hours of minnow trap effort. Our sampling effort focused on the lower half of the bypass reach. Fork lengths ranged from 32 mm to 166 mm, with a mean fork length of 96 mm. Dolly Varden were present in larger numbers and had larger fork length measurements in the middle and upper trap sites as compared to the lower minnow trap site (Table 5).
21

HYDROLOGY AND HABITAT CONSIDERATIONS Pulse flows and rain events appear to be a regular occurrence in the Packers Creek hydrograph (Figure 15). Generally, an inverse correlation exists between the stage and temperature data (Figures 4 and 5). Water temperature appears to lower rapidly with increases in stage height following pulse flow events. The water temperature remains lower for about 2 weeks following a pulse flow event suggesting that pulse events are important in moderating stream temperatures which can influence fish populations and food production in the stream. Also, the diurnal cycle appears to affect temperature in Packers Creek by as much as 4.5 °C in July to as little as 1 °C in late September (Figure 5). Under managed water conditions, the frequency and magnitude of pulse flow events and the depth of pools will likely be reduced, which will increase water temperature and potentially affect resident fish populations.
Winter flow rates were not collected during this field investigation. Streams on the Alaska Peninsula are typically at their base flow levels during the late winter or early spring months. It is anticipated that winter power generation will use all of the natural flow from Packers Creek at the diversion dam; bypass reach flows will consist of accretion and tributary flows below the diversion structure. Tributary flow and accretion in the bypass reach was estimated to be 2.41 cfs in October 2012 (Polarconsult 2012). Winter accretion and tributary flows will likely be lower than this estimated October flow, consistent with decreased winter stream flows on the Alaska Peninsula and throughout Alaska. Based on the available data and the expected effect of water management, connectivity to large pools and overwintering habitat in the bypass reach may be disrupted during the winter.
R2CROSS According to the R2CROSS method, spring and summer flow rates must satisfy all three criteria, while autumn and winter flows must meet 2 of the 3 criteria (see Table 1). This method was developed in Colorado where spring and summer flows are higher than fall and winter flows because of high rates of snowmelt and the resulting runoff. While this is true for portions of Alaska, the Alaska Peninsula typically sees 2 high flow periods: early summer from snowmelt and fall from rain events. Therefore, applying this method to the Alaska Peninsula may require some adjustment in the seasonal flow requirements and the number of criteria that must be met for fish passage to be maintained. For example, seasonal discharge criteria could be adjusted for fish run timing and coincide with spawning migrations or other important life stage events for the organisms that are present in the stream. We chose to analyze Packers Creek based on all 3 fish passage flow criteria being met during all seasons to determine if favorable fish passage conditions were maintained. Additional study on Packers Creek fish movement, fish passage, and flow characteristics are needed to determine appropriate adjustments to the R2CROSS method.
The R2CROSS method is sensitive to site selection. The presence of exposed rocks that separate the bankfull channel, the presence of undercut banks, and other site features can lead to artificially high or low readings (Annear et al. 2004). For this analysis, we chose to use the lower cross section site because the site had been previously sampled in 2010 and we have a higher confidence in data collected from that site.
Based on the R2CROSS method, the minimum flow required at the lower cross section to meet all 3 fish passage criteria in all seasons is 4.70 cfs (Table 3). The minimum flow required to meet 2 of the three criteria is 2.83 cfs. Based on flow data provided during permitting that covers the
22

late February to mid-October time period, the natural flow regime in Packers Creek at the lower cross section is below 2.83 cfs for 38 days and below 4.7 cfs for 104 days. The time period when flow was not measured (late October to early February) is typically a low flow time period for watersheds in the region.
R2CROSS suggests the year around withdrawal of 8.5 cfs in Packers Creek with no instream flow requirement will not maintain fish passage or stream function. Additional study is needed to determine the actual flow breakpoint at which habitat connectivity and fish passage can be maintained. As previously described, the 8.5 cfs withdrawal will remove all of the flow at the diversion dam throughout most of the year and bypass reach flows will be maintained through accretion and tributary inputs. Lower bypass reach flow was estimated to be 2.41 cfs in October 2012 and this flow will not maintain the required 50% wetted perimeter, average depth criteria, or the average velocity criteria in any season, based on the 2013 flow data and R2CROSS analysis.
CDFW WETTED PERIMETER PROCEDURE The California Department of Fish and Wildlife’s Standard Operating Procedure for the Wetted Perimeter Method in California (CDFW 2013) recommends identifying a range of flows to maintain critically important food production in order to protect fish populations. Under this method, the calculated wetted perimeter-discharge curve is used to identify flows below which food production rapidly declines and flows that provide near-optimal food production conditions. Maintaining food production is important to maintaining the indigenous fish populations in any creek. Based on this method, a range of flows between 4.7 cfs and 52.9 cfs at the gauge site are critical to food production in Packers Creek. Discharge below 4.7 cfs may result in a rapid decline in wetted perimeter and food production in Packers Creek (Figure 8). While flow of 4.7 cfs seems like a reasonable breakpoint for critical food production, Packers Creek flow of 52.9 cfs does not. The highest recorded discharge was 21.7 cfs in 2010 and 28.0 cfs in 2013 (Table 6); the CDFW modeled flow of 52.9 cfs is not within the range of measured data. A sensitivity analysis of the CDFW method and the Packers Creek flow characteristics is required to better understand this unreasonable result. CDFW (2013) recognized the limitations of the wetted perimeter method, specifically that the choice of cross-section location in a stable riffle within a rectangular-shaped channel was critical to method performance. CDFW (2013) cautioned that the method should be used in conjunction with other flow analysis methods.
FUTURE WATER MANAGEMENT We used 2 distinct instream flow methods to assess the Packers Creek flow needed to maintain stream function, fish passage, and food production. Despite the limitations of each method and the limited data used in each analysis, both methods suggest that flows above 4.5 cfs are required to maintain fish passage and critical food production within Packers Creek. Packers Creek flow below this breakpoint will likely have negative impacts on fish passage and food production, although additional data and analysis are required to understand the biological importance of these impacts on the local Dolly Varden population. Future Packers Creek water withdrawals up to 8.5 cfs will result in bypass reach flows less than 4.5 cfs for much of the year.
23

REFERENCES CITED Annear, T. C., and A. L. Conder. 1984. Relative bias of several fisheries instream flow methods. North American
Journal of Fisheries Management 4: 531-539.
Annear, T. C., I. Chisholm, H. Beecher, A. Locke, and 12 other authors. 2004. Instream flows for riverine resource stewardship, Revised edition. Instream Flow Council, Cheyenne, WY.
Anonymous. 1974. R-2 Cross Program: A sag-tape method of channel cross-section measurement for use with minimum instream flow determinations. US Forest Service, Region 2, Denver, CO.
Barrett, B. M. 2012a. Packers Creek Fisheries Survey- June 2012, Chignik Lagoon, Alaska. CRAA Tech. Report No. 12-01, Chignik Regional Aquaculture Association, Bellingham, WA.
Barrett, B. M. 2012b. Packers Creek Fisheries Survey- Fall 2012, Chignik Lagoon, Alaska. CRAA Tech. Report No. 12-04, Chignik Regional Aquaculture Association, Bellingham, WA.
Bradford, M. J., P. Higgins, J. Korman, and J. Sneep. 2011. Test of an environmental flow release in a British Columbia river: does more water mean more fish? Freshwater Biology 56: 2119-2134.
Bujold, V., R. A. Cunjak, J. P. Dietrich, and D. A. Courtemanche. 2004. Drifters versus residents: assessing size and age differences in Atlantic salmon (Salmo salar) fry. Canadian Journal of Fisheries and Aquatic Sciences 61: 273-282.
CDFW. 2013. Standard operating procedure for the wetted perimeter method in California. California Department of Fish and Wildlife, Instream Flow Program Standard Operating Procedure DFG-IFP-004.
Carter, R. W., and J. Davidian. 1968. General procedure for gaging streams. U.S. Department of the Interior, U.S. Geological Survey, Techniques of Water-Resource Investigation, Book 3, Chapter A6, Arlington, VA.
Ebersole, J. L., P. Wigington, Jr., J. Baker, M. Cairns, and M. R. Church. 2006. Juvenile coho salmon growth and survival across stream network seasonal habitats. Transactions of the American Fisheries Society 135: 1681-1697.
Espegren, G. D. 1996. Development of instream flow recommendations in Colorado using R2 Cross. Department of Natural Resources, Colorado Water Conservation Board, Denver, CO.
Grant, J. W., and D. L. G. Noakes. 1987. Movers and stayers: foraging tactics of young-of-the year- brook charr, Salvelinus fontinalis. Journal of Animal Ecology 56: 1001-1013.
Johnson, J., and J. Coleman. 2014. Catalog of waters important for spawning, rearing, or migration of anadromous fishes–Southwest Region, effective June 1, 2014. Alaska Department of Fish and Game, Special Publication No. 14-05, Anchorage.
Johnson, J., and M. Daigneault. 2013. Catalog of waters important for spawning, rearing, or migration of anadromous fishes–Southwest Region, effective July 1, 2013. Alaska Department of Fish and Game, Special Publication No. 13-10, Anchorage.
Lloyd, N., G. Quinn, M. Thoms, A. Arthington, B. Gawne, P. Humphries, and K. Walker. 2003. Does flow modification cause geomorphological and ecological response in rivers? A literature review from an Australian perspective. Technical Report 1/2004, Cooperative Research Centre for Freshwater Ecology: Canberra, Australia.
Nehring, R. B. 1979. Evaluation of instream flow methods and determination of water quality need for streams in the State of Colorado. Colorado Division of Wildlife. Fort Collins, Co.
Nielsen, J. L. 1992. Microhabitat-specific foraging behavior, diet, and growth of juvenile coho salmon. Transactions of the American Fisheries Society 121: 617-634.
Nislow, K. H., C. Folt, and M. Seandel. 1998. Food and foraging behavior in relation to microhabitat use and survival of age-0 Atlantic salmon. Canadian Journal of Fisheries and Aquatic Sciences 55: 116-127.
Poff, N. L., J. D. Allan, M. B. Bain, J. R. Karr, K. L Prestergaard, B. D. Richter, R. Sparks, and J. Stromberg. 1997. The natural flow regime: a paradigm for river conservation and restoration. BioScience 47(11): 769-784.
24

REFERENCES CITED (Continued) Poff N. L., and J. K. Zimmerman. 2010. Ecological impacts of altered flow regimes: a meta-analysis to inform
environmental flow management. Freshwater Biology 55: 194-205.
Polarconsult Alaska, Inc. 2012. Packers Creek Hydroelectric Bypass Reach Hydrology Study. Anchorage, AK.
Polarconsult Alaska, Inc. 2011. Packers Creek Hydroelectric Project Hydrology. Anchorage, AK.
Rose, K. L., and C. D. Johnson. 1976. The relative merits of the modified sag-tape method for determining instream flow requirements. US Fish and Wildlife Service, Salt Lake City, UT.
25

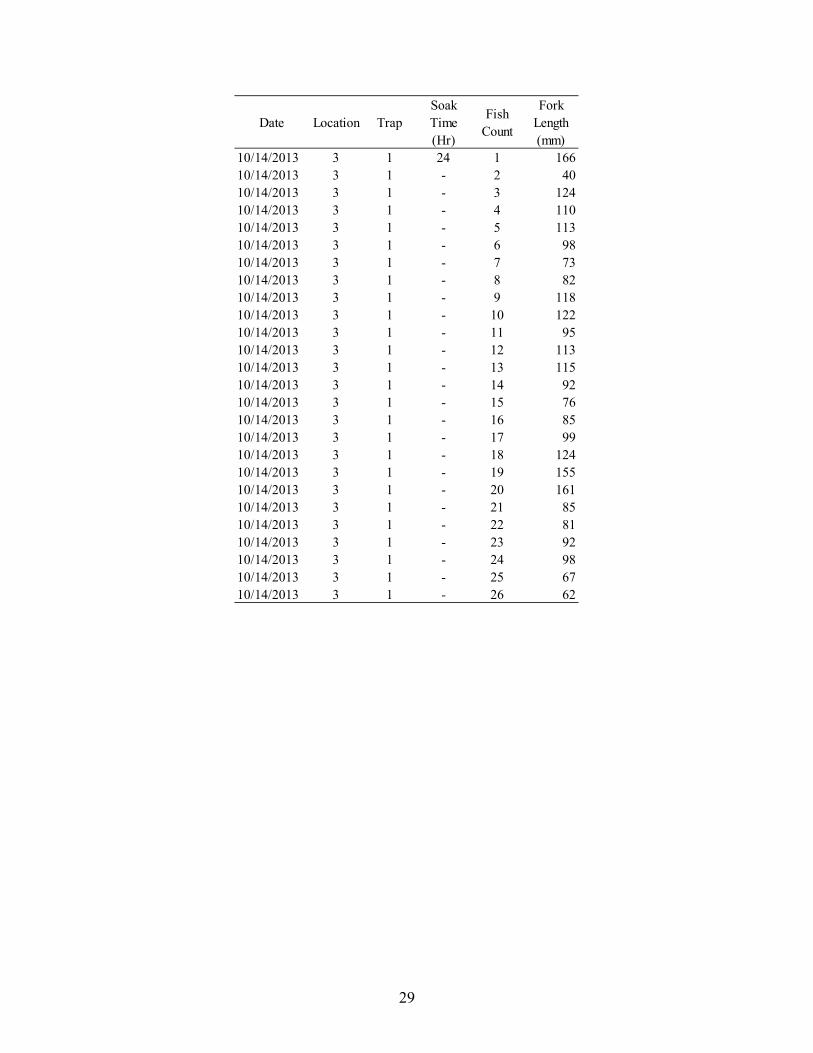
APPENDIX 1.–FISH EFFORT, CATCH, AND LENGTH DATA
26
Date Location TrapSoak Time (Hr)
Fish Count
Fork Length (mm)
6/25/2013 1 1 24 0 -6/25/2013 2 1 24 1 1046/25/2013 3 1 24 1 1156/25/2013 3 1 - 2 896/25/2013 3 1 - 3 936/25/2013 3 1 - 4 926/25/2013 3 2 24 1 1306/25/2013 3 2 - 2 808/12/2013 1 1 24 1 1328/12/2013 1 1 - 2 858/12/2013 1 1 - 3 768/12/2013 2 1 24 1 1128/12/2013 2 1 - 2 1118/12/2013 2 1 - 3 758/12/2013 2 1 - 4 758/12/2013 2 1 - 5 818/12/2013 2 1 - 6 748/12/2013 2 2 24 1 1238/12/2013 2 2 - 2 1138/12/2013 2 2 - 3 1108/12/2013 2 2 - 4 958/12/2013 2 2 - 5 958/12/2013 2 2 - 6 838/12/2013 2 2 - 7 938/12/2013 2 3 24 1 1158/12/2013 2 3 - 2 948/12/2013 2 3 - 3 1308/12/2013 2 3 - 4 1058/12/2013 2 3 - 5 1068/12/2013 2 3 - 6 858/12/2013 2 3 - 7 1138/12/2013 3 1 24 1 1508/12/2013 3 1 - 2 1458/12/2013 3 1 - 3 958/12/2013 3 1 - 4 1328/12/2013 3 1 - 5 858/12/2013 3 1 - 6 1308/12/2013 3 1 - 7 1258/12/2013 3 1 - 8 1108/12/2013 3 1 - 9 908/12/2013 3 1 - 10 1228/12/2013 3 1 - 11 908/12/2013 3 1 - 12 818/12/2013 3 1 - 13 858/12/2013 3 1 - 14 858/12/2013 3 1 - 15 60
27
Date Location TrapSoak Time (Hr)
Fish Count
Fork Length (mm)
8/12/2013 3 2 24 1 1228/12/2013 3 2 - 2 1158/12/2013 3 2 - 3 958/12/2013 3 2 - 4 858/12/2013 3 2 - 5 1158/12/2013 3 2 - 6 1358/12/2013 3 2 - 7 958/12/2013 3 2 - 8 778/12/2013 3 2 - 9 768/12/2013 3 2 - 10 908/12/2013 3 2 - 11 9210/14/2013 1 1 24 1 7510/14/2013 1 1 - 2 6010/14/2013 1 1 - 3 4510/14/2013 1 1 - 4 3210/14/2013 1 1 - 5 6810/14/2013 2 1 24 1 15510/14/2013 2 1 - 2 4810/14/2013 2 1 - 3 6310/14/2013 2 1 - 4 7810/14/2013 2 1 - 5 5510/14/2013 2 1 - 6 7710/14/2013 2 1 - 7 13610/14/2013 2 1 - 8 11010/14/2013 2 1 - 9 12410/14/2013 2 1 - 10 9110/14/2013 2 1 - 11 8310/14/2013 2 1 - 12 7110/14/2013 2 1 - 13 6710/14/2013 2 1 - 14 6410/14/2013 2 1 - 15 5510/14/2013 2 1 - 16 6210/14/2013 2 1 - 17 53
28
Date Location TrapSoak Time (Hr)
Fish Count
Fork Length (mm)
10/14/2013 3 1 24 1 16610/14/2013 3 1 - 2 4010/14/2013 3 1 - 3 12410/14/2013 3 1 - 4 11010/14/2013 3 1 - 5 11310/14/2013 3 1 - 6 9810/14/2013 3 1 - 7 7310/14/2013 3 1 - 8 8210/14/2013 3 1 - 9 11810/14/2013 3 1 - 10 12210/14/2013 3 1 - 11 9510/14/2013 3 1 - 12 11310/14/2013 3 1 - 13 11510/14/2013 3 1 - 14 9210/14/2013 3 1 - 15 7610/14/2013 3 1 - 16 8510/14/2013 3 1 - 17 9910/14/2013 3 1 - 18 12410/14/2013 3 1 - 19 15510/14/2013 3 1 - 20 16110/14/2013 3 1 - 21 8510/14/2013 3 1 - 22 8110/14/2013 3 1 - 23 9210/14/2013 3 1 - 24 9810/14/2013 3 1 - 25 6710/14/2013 3 1 - 26 62
29