Package ‘rdetools’ - The Comprehensive R Archive … ‘rdetools’ February 20, 2015 Type...
25
Package ‘rdetools’ February 20, 2015 Type Package Title Relevant Dimension Estimation (RDE) in Feature Spaces Version 1.0 Date 2008-09-03 Author Jan Saputra Mueller Maintainer Jan Saputra Mueller <[email protected]> Description The package provides functions for estimating the relevant dimension of a data set in feature spaces, applications to model selection, graphical illustrations and prediction. License GPL-2 Repository CRAN Date/Publication 2012-10-29 08:59:34 NeedsCompilation no R topics documented: rdetools-package ...................................... 2 denoiselabels ........................................ 3 distimage .......................................... 4 drawkpc ........................................... 5 estnoise ........................................... 6 isregression ......................................... 8 kpr .............................................. 9 logspace ........................................... 10 modelimage ......................................... 11 polykernel .......................................... 12 rbfkernel ........................................... 13 rde .............................................. 14 rde_loocv .......................................... 16 rde_tcm ........................................... 18 selectmodel ......................................... 20 sinc ............................................. 22 sincdata ........................................... 23 1
Transcript of Package ‘rdetools’ - The Comprehensive R Archive … ‘rdetools’ February 20, 2015 Type...

Package ‘rdetools’February 20, 2015
Type Package
Title Relevant Dimension Estimation (RDE) in Feature Spaces
Version 1.0
Date 2008-09-03
Author Jan Saputra Mueller
Maintainer Jan Saputra Mueller <[email protected]>
Description The package provides functions for estimating the relevantdimension of a data set in feature spaces, applications tomodel selection, graphical illustrations and prediction.
License GPL-2
Repository CRAN
Date/Publication 2012-10-29 08:59:34
NeedsCompilation no
R topics documented:rdetools-package . . . . . . . . . . . . . . . . . . . . . . . . . . . . . . . . . . . . . . 2denoiselabels . . . . . . . . . . . . . . . . . . . . . . . . . . . . . . . . . . . . . . . . 3distimage . . . . . . . . . . . . . . . . . . . . . . . . . . . . . . . . . . . . . . . . . . 4drawkpc . . . . . . . . . . . . . . . . . . . . . . . . . . . . . . . . . . . . . . . . . . . 5estnoise . . . . . . . . . . . . . . . . . . . . . . . . . . . . . . . . . . . . . . . . . . . 6isregression . . . . . . . . . . . . . . . . . . . . . . . . . . . . . . . . . . . . . . . . . 8kpr . . . . . . . . . . . . . . . . . . . . . . . . . . . . . . . . . . . . . . . . . . . . . . 9logspace . . . . . . . . . . . . . . . . . . . . . . . . . . . . . . . . . . . . . . . . . . . 10modelimage . . . . . . . . . . . . . . . . . . . . . . . . . . . . . . . . . . . . . . . . . 11polykernel . . . . . . . . . . . . . . . . . . . . . . . . . . . . . . . . . . . . . . . . . . 12rbfkernel . . . . . . . . . . . . . . . . . . . . . . . . . . . . . . . . . . . . . . . . . . . 13rde . . . . . . . . . . . . . . . . . . . . . . . . . . . . . . . . . . . . . . . . . . . . . . 14rde_loocv . . . . . . . . . . . . . . . . . . . . . . . . . . . . . . . . . . . . . . . . . . 16rde_tcm . . . . . . . . . . . . . . . . . . . . . . . . . . . . . . . . . . . . . . . . . . . 18selectmodel . . . . . . . . . . . . . . . . . . . . . . . . . . . . . . . . . . . . . . . . . 20sinc . . . . . . . . . . . . . . . . . . . . . . . . . . . . . . . . . . . . . . . . . . . . . 22sincdata . . . . . . . . . . . . . . . . . . . . . . . . . . . . . . . . . . . . . . . . . . . 23
1
2 rdetools-package
Index 25
rdetools-package Relevant Dimension Estimation (RDE) in Feature Spaces
Description
Only a finite number of leading kernel PCA components contain the relevant information of asupervised learning problem if the kernel matches the problem. The package provides functionsfor estimating the relevant dimension in kernel feature spaces. These functions are also able tocalculate denoised versions of your label vectors and to estimate the noise levels in your data sets.RDE can also be used for model selection. The package provides functions for this issue andgraphical functions to illustrate the results of RDE and model selection. For making predictionskernel projection regression is available.
Details
Package: rdetoolsType: PackageVersion: 1.0Date: 2008-08-03License: GPL-2
Author(s)
Jan Saputra Mueller
Maintainer: Jan Saputra Mueller <[email protected]>
References
M. L. Braun, J. M. Buhmann, K. R. Mueller (2008) \_On Relevant Dimensions in Kernel FeatureSpaces\_
Examples
## rde on a noisy sinc data setd <- sincdata(100, 0.1) # generate noisy sinc dataK <- rbfkernel(d$X) # calculate rbf kernel matrix# estimate relevant dimension, denoised ys and noise level in data setr <- rde(K, d$y, est_y = TRUE, est_noise = TRUE)r$rd # relevant dimensionr$yh # denoised ysr$noise # noise level in data setdrawkpc(r) # draw kernel pca coefficients

denoiselabels 3
## rde for model selectiond <- sincdata(100, 0.1) # generate sinc data# do model selectionm <- selectmodel(d$X, d$y, sigma = logspace(-3, 3, 100))m$best # best modelm$rd # relevant dimension for best modelmodelimage(m) # graphical illustration of model selection
## kernel projection regressiond <- sincdata(100, 0.1) # generate sinc data# do model selectionm <- selectmodel(d$X, d$y, sigma = logspace(-3, 3, 100))f <- kpr(m) # kernel projection regressionplot(f, -4, 4) # draw predicted function
denoiselabels Denoise labels
Description
The function denoises labels of a dataset by projecting them to the d first kernel pca principaldirections if d is not 0. If d is 0 the function returns a matrix containing the projected labels for eachdimension in each column. The function is primarily an auxiliary function for the rde functions,and it should not be necessary to call it by hand, because rde will do this for you (see examples).
Usage
denoiselabels(d, eigvec, kpc, regression = TRUE)
Arguments
d number of leading kernel pca principal directions to project the labels to or 0, if amatrix should be returned which contains the denoised labels for each dimension
eigvec eigenvectors of the kernel matrix
kpc kernel pca coefficients
regression set this to TRUE, if the data should be handled as data of a regression problemand to FALSE in case of a classification problem
Value
denoised version of the labels or a matrix with denoised labels for each dimension in its columns ifd was 0.
Author(s)
Jan Saputra Mueller

4 distimage
See Also
rde, rde_loocv, rde_tcm
Examples
## example with sinc datad <- sincdata(100, 0.7) # generate sinc dataK <- rbfkernel(d$X) # calculate rbf kernel matrix# rde, return also denoised labelsr <- rde(K, d$y, est_y = TRUE)r$yh # denoised labels
distimage Distance image
Description
If you’ve done a model selection with selectmodel, this function can draw you a map, in whichthe distances of the original label vector and the estimated label vectors are shown. This is done bya filled.contour plot.
Usage
distimage(model,color.palette = terrain.colors,
log = TRUE,plottitle = "Distance of Ys",...)
Arguments
model list of model selection data as it has been returned by selectmodel. selectmodelmust have been called with ydist parameter set to TRUE!
color.palette color palette function to use, see rainbow
log leave this TRUE, if the axis of the model parameter should be logarithmicallyscaled. Set this to FALSE if you want linear scaling.
plottitle title of the plot
... additional parameters for filled.contour
Author(s)
Jan Saputra Mueller
References
M. L. Braun, J. M. Buhmann, K. R. Mueller (2008) \_On Relevant Dimensions in Kernel FeatureSpaces\_

drawkpc 5
See Also
selectmodel, modelimage, drawkpc, filled.contour, rainbow
Examples
## model selection with RBF-kernel and graphical illustration## of the distances of the labelsd <- sincdata(100, 0.1) # generate sinc data# do model selectionm <- selectmodel(d$X, d$y, ydist = TRUE, sigma = logspace(-3, 3, 100))distimage(m) # distance image
drawkpc Draw kernel pca coefficients
Description
The function plots the absolute values of the kernel pca coefficients. The estimated relevant dimen-sion and the estimated noise level (if available) are also drawn. Optionally, it puts a rescaled versionof the loo-cv-error/negative-log-likelihood into the plot.
Usage
drawkpc(model,err = TRUE,
pointcol = "blue",rdcol = "red",noisecol = "black",errcol = "brown",...)
Arguments
model list of rde data returned by rde or selectmodel
err leave this TRUE, if you want to have a rescaled version of the the loo-cv-error/negative-log-likelihood in the plot
pointcol color of the kernel pca coefficients
rdcol color of the relevant dimension line
noisecol color of the noise level line
errcol color of the the loo-cv-error/negative-log-likelihood
... additional parameters to the plotting functions
Author(s)
Jan Saputra Mueller

6 estnoise
References
M. L. Braun, J. M. Buhmann, K. R. Mueller (2008) \_On Relevant Dimensions in Kernel FeatureSpaces\_
See Also
rde, selectmodel, modelimage, distimage
Examples
## draw kernel pca coefficients after calling rded <- sincdata(100, 0.1) # generate sinc dataK <- rbfkernel(d$X)r <- rde(K, d$y, est_noise = TRUE)drawkpc(r)
## draw kernel pca coefficients after calling selectmodeld <- sincdata(100, 0.1) # generate sinc datam <- selectmodel(d$X, d$y, est_noise = TRUE, sigma = logspace(-3, 3, 100))drawkpc(m)
estnoise Estimate noise level
Description
Estimates the noise level for a label vector ’y’ and a denoised version of this label vector ’yh’.Which loss function is used to estimate the noise level depends on the kind of problem (regressionproblem or classification problem).
Usage
estnoise(y, yh, regression = FALSE, nmse = TRUE)
Arguments
y a label vector containg only -1 and 1 for a classification problem, and real num-bers in case of regression
yh a denoised version of y which can be obtained by using e.g. rde
regression FALSE in case of a classification problem, TRUE in case of a regression prob-lem
nmse if ’nmse’ is TRUE and this is a regression problem, the mean squared error willbe normalized
estnoise 7
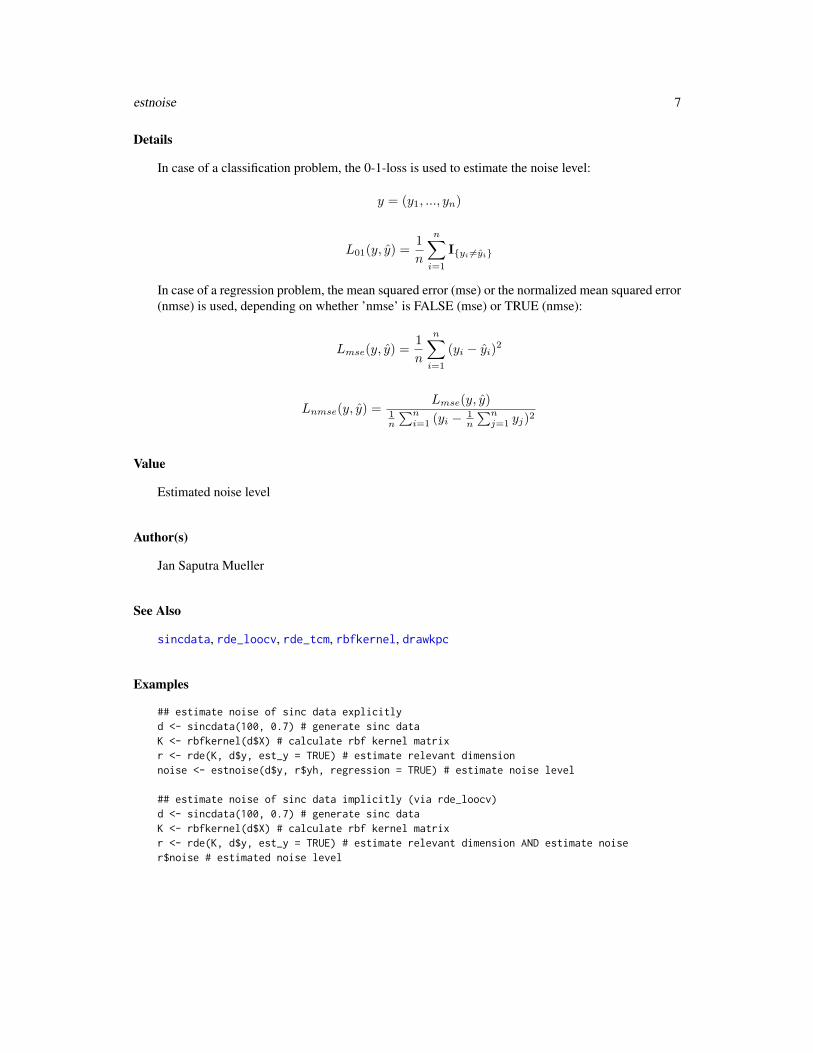
Details
In case of a classification problem, the 0-1-loss is used to estimate the noise level:
y = (y1, ..., yn)
L01(y, y) =1
n
n∑i=1
I{yi 6=yi}
In case of a regression problem, the mean squared error (mse) or the normalized mean squared error(nmse) is used, depending on whether ’nmse’ is FALSE (mse) or TRUE (nmse):
Lmse(y, y) =1
n
n∑i=1
(yi − yi)2
Lnmse(y, y) =Lmse(y, y)
1n
∑ni=1 (yi −
1n
∑nj=1 yj)
2
Value
Estimated noise level
Author(s)
Jan Saputra Mueller
See Also
sincdata, rde_loocv, rde_tcm, rbfkernel, drawkpc
Examples
## estimate noise of sinc data explicitlyd <- sincdata(100, 0.7) # generate sinc dataK <- rbfkernel(d$X) # calculate rbf kernel matrixr <- rde(K, d$y, est_y = TRUE) # estimate relevant dimensionnoise <- estnoise(d$y, r$yh, regression = TRUE) # estimate noise level
## estimate noise of sinc data implicitly (via rde_loocv)d <- sincdata(100, 0.7) # generate sinc dataK <- rbfkernel(d$X) # calculate rbf kernel matrixr <- rde(K, d$y, est_y = TRUE) # estimate relevant dimension AND estimate noiser$noise # estimated noise level

8 isregression
isregression Estimate from labels whether this is a regression problem
Description
Estimates whether this is a regression or classification problem by looking at the labels. If alllabels are only -1 and 1 a classification problem is assumed, otherwise a regression problem. If theargument ’regression’ is TRUE, the function always returns TRUE.
Usage
isregression(y, regression = FALSE)
Arguments
y label vector for which the kind of problem should be estimated
regression if regression is TRUE, the function returns always TRUE, if you want anestimation leave this FALSE
Value
TRUE, if this is a regression problem or the argument regression was TRUE, otherwise FALSE
Author(s)
Jan Saputra Mueller
See Also
rde_loocv, rde_tcm, estnoise
Examples
## some examplesy_cl <- c(-1, 1, 1, -1, 1) # label vector for classification problemy_reg <- runif(5) # label vector for regression problemisregression(y_cl) # FALSE!isregression(y_cl, regression = TRUE) # Always TRUE!isregression(y_reg) # TRUE!
kpr 9
kpr Kernel projection regression
Description
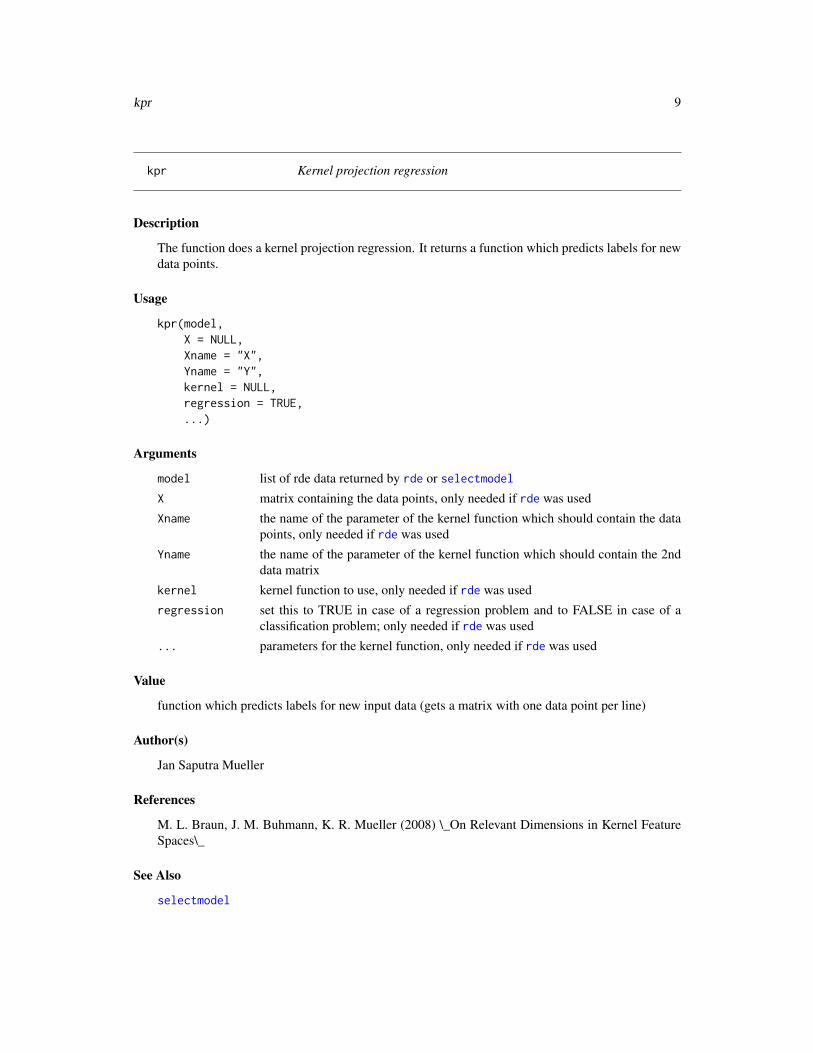
The function does a kernel projection regression. It returns a function which predicts labels for newdata points.
Usage
kpr(model,X = NULL,Xname = "X",Yname = "Y",kernel = NULL,regression = TRUE,...)
Arguments
model list of rde data returned by rde or selectmodel
X matrix containing the data points, only needed if rde was used
Xname the name of the parameter of the kernel function which should contain the datapoints, only needed if rde was used
Yname the name of the parameter of the kernel function which should contain the 2nddata matrix
kernel kernel function to use, only needed if rde was used
regression set this to TRUE in case of a regression problem and to FALSE in case of aclassification problem; only needed if rde was used
... parameters for the kernel function, only needed if rde was used
Value
function which predicts labels for new input data (gets a matrix with one data point per line)
Author(s)
Jan Saputra Mueller
References
M. L. Braun, J. M. Buhmann, K. R. Mueller (2008) \_On Relevant Dimensions in Kernel FeatureSpaces\_
See Also
selectmodel

10 logspace
Examples
## kernel projection regression after## calling selectmodel (recommended)d <- sincdata(100, 0.1) # generate sinc data# do model selectionm <- selectmodel(d$X, d$y, sigma = logspace(-3, 3, 100))f <- kpr(m)plot(f, -4, 4)
logspace Logarithmically spaced sequence generation
Description
Function generates a logarithmically spaced sequence of n values between decades 10l and 10u.
Usage
logspace(l, u, n)
Arguments
l 10l will be the lower value to start from
u 10u will be the upper value to end with
n number of values to generate
Value
Logarithmically spaced sequence of length n between 10l and 10u.
Author(s)
Jan Saputra Mueller
See Also
seq, selectmodel
Examples
## generate 100 logarithmically spaced values between 10^(-3) and 10^3logspace(-3, 3, 100)

modelimage 11
modelimage Model selection image
Description
The function produces a graphical illustration of a model selection which has been done withselectmodel. Strictly speaking it’s a filled.contour plot in which additionally the relevant di-mensions for the different models are drawn as a black line. selectmodel chooses the deepest pointin this map, that is the model and the relevant dimension with the smallest loo-cv-error/negative-log-likelihood-value.
Usage
modelimage(model,color.palette = topo.colors,
log = TRUE,plottitle = "RDE Model Selection",...)
Arguments
model list of model selection data as it has been returned by selectmodel
color.palette color palette function to use, see rainbow
log leave this TRUE, if the axis of the model parameter should be logarithmicallyscaled. Set this to FALSE if you want linear scaling.
plottitle title of the plot... additional parameters for filled.contour
Author(s)
Jan Saputra Mueller
References
M. L. Braun, J. M. Buhmann, K. R. Mueller (2008) \_On Relevant Dimensions in Kernel FeatureSpaces\_
See Also
selectmodel, distimage, drawkpc, filled.contour, rainbow
Examples
## model selection with RBF-kernel and graphical illustrationd <- sincdata(100, 0.1) # generate sinc data# do model selectionm <- selectmodel(d$X, d$y, sigma = logspace(-3, 3, 100))modelimage(m) # draw model selection image
12 polykernel
polykernel Calculate polynomial kernel matrix
Description
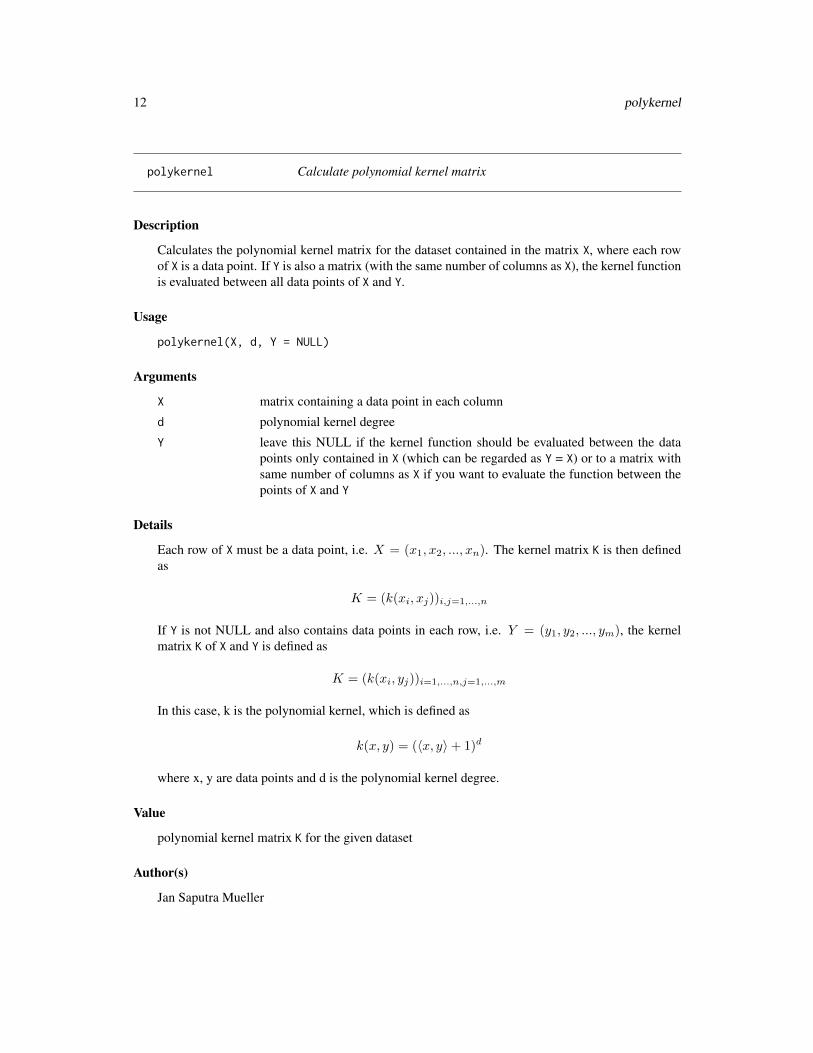
Calculates the polynomial kernel matrix for the dataset contained in the matrix X, where each rowof X is a data point. If Y is also a matrix (with the same number of columns as X), the kernel functionis evaluated between all data points of X and Y.
Usage
polykernel(X, d, Y = NULL)
Arguments
X matrix containing a data point in each column
d polynomial kernel degree
Y leave this NULL if the kernel function should be evaluated between the datapoints only contained in X (which can be regarded as Y = X) or to a matrix withsame number of columns as X if you want to evaluate the function between thepoints of X and Y
Details
Each row of X must be a data point, i.e. X = (x1, x2, ..., xn). The kernel matrix K is then definedas
K = (k(xi, xj))i,j=1,...,n
If Y is not NULL and also contains data points in each row, i.e. Y = (y1, y2, ..., ym), the kernelmatrix K of X and Y is defined as
K = (k(xi, yj))i=1,...,n,j=1,...,m
In this case, k is the polynomial kernel, which is defined as
k(x, y) = (〈x, y〉+ 1)d
where x, y are data points and d is the polynomial kernel degree.
Value
polynomial kernel matrix K for the given dataset
Author(s)
Jan Saputra Mueller
rbfkernel 13
See Also
rbfkernel, sincdata
Examples
## generate sinc data and calculate polynomial kernel matrix with d = 5d <- sincdata(100, noise = 0.1)K <- polykernel(d$X, 5)
rbfkernel Calculate RBF kernel matrix
Description
Calculates the RBF kernel matrix for the dataset contained in the matrix X, where each row of X isa data point. If Y is also a matrix (with the same number of columns as X), the kernel function isevaluated between all data points of X and Y.
Usage
rbfkernel(X, sigma = 1, Y = NULL)
Arguments
X matrix containing a data point in each rowsigma kernel width of rbf kernelY leave this NULL if the kernel function should be evaluated between the data
points only contained in X (which can be regarded as Y = X) or to a matrix withsame number of columns as X if you want to evaluate the function between thepoints of X and Y
Details
Each row of X must be a data point, i.e. X = (x1, x2, ..., xn). The kernel matrix K is then definedas
K = (k(xi, xj))i,j=1,...,n
If Y is not NULL and also contains data points in each row, i.e. Y = (y1, y2, ..., ym), the kernelmatrix K of X and Y is defined as
K = (k(xi, yj))i=1,...,n,j=1,...,m
In this case, k is the rbf (radial basis function) kernel, which is defined as
k(x, y) = exp(−||x− y||2
2σ)
where x, y are data points and sigma is the rbf kernel width.

14 rde
Value
RBF kernel matrix K for the given dataset
Author(s)
Jan Saputra Mueller
See Also
polykernel, sincdata
Examples
## generate sinc data and calculate rbf kernel matrix with sigma = 1d <- sincdata(100, noise = 0.1)K <- rbfkernel(d$X)
rde Relevant Dimension Estimation (RDE)
Description
The function estimates the relevant dimension in feature space. By default, this is done by fitting atwo-component model, but rde by leave-one-out cross-validation is also available. The function isalso able to calculate a denoised version of the labels and to estimate the noise level in the data set.
Usage
rde(K, y,est_y = FALSE,alldim = FALSE,est_noise = FALSE,regression = FALSE,nmse = TRUE,dim_rest = 0.5,tcm = TRUE)
Arguments
K kernel matrix of the inputs (e.g. rbf kernel matrix)
y label vector which contains the label for each data point
est_y set this to TRUE if you want a denoised version of the labels
alldim if this is TRUE denoised labels for all dimensions are calculated (instead of onlyfor relevant dimension)
est_noise set this to TRUE if you want an estimated noise level

rde 15
regression only interesting if one of est_y, alldim, est_noise is TRUE. Set this to TRUEif you want to force the function to handle the data as data for a regression prob-lem. If you leave this FALSE, the function will try to determine itself whetherthis is a classification or regression problem.
nmse only interesting if est_noise is TRUE and the function is handling the dataas data of a regression problem. If you leave this TRUE, the normalized meansquared error is used for estimating the noise level, otherwise the conventionalmean squared error.
dim_rest percantage of leading dimensions to which the search for the relevant dimen-sions should be restricted. This is needed due to numerical instabilities. 0.5should be a good choice in most cases (and is also the default value)
tcm this is TRUE by default; indicates whether rde should be done by TCM or LOO-CV algorithm
Details
If est_noise or alldim are TRUE, a denoised version of the labels for the relevant dimension willbe returned even if est_y is FALSE (so e.g. if you want denoised labels and noise approximation itis enough to set est_noise to TRUE).
Value
rd estimated relevant dimension
err loo-cv-error/negative-log-likelihood-value for each dimension (the position ofthe minimum is the relevant dimension)
yh only returned if est_y, alldim or est_noise is TRUE, contains the denoisedlabels
Yh only returned if alldim is TRUE, matrix with denoised labels for each dimen-sion in each column
noise only returned if est_noise is TRUE, contains the estimated noise level
kpc kernel pca coefficients
eigvec eigenvectors of the kernel matrix
eigval eigenvalues of the kernel matrix
tcm TRUE if TCM algorithm was used, otherwise (LOO-CV algorithm) FALSE
Author(s)
Jan Saputra Mueller
References
M. L. Braun, J. M. Buhmann, K. R. Mueller (2008) \_On Relevant Dimensions in Kernel FeatureSpaces\_
See Also
rde_loocv, rde_tcm, estnoise, isregression, rbfkernel, polykernel, drawkpc
16 rde_loocv
Examples
## example with sinc data using tcm algorithmd <- sincdata(100, 0.1) # generate sinc dataK <- rbfkernel(d$X) # calculate rbf kernel matrix# rde, return also denoised labels and noise, fit tcmr <- rde(K, d$y, est_y = TRUE, est_noise = TRUE)r$rd # estimated relevant dimensionr$noise # estimated noisedrawkpc(r) # draw kernel pca coefficients
## example with sinc data using loo-cv algorithmd <- sincdata(100, 0.1) # generate sinc dataK <- rbfkernel(d$X) # calculate rbf kernel matrix# rde, return also denoised labels and noiser <- rde(K, d$y, est_y = TRUE, est_noise = TRUE, tcm = FALSE)r$rd # estimated relevant dimensionr$noise # estimated noisedrawkpc(r) # draw kernel pca coefficients
rde_loocv Relevant Dimension Estimation (RDE) by Leave-One-Out Cross-Validation (LOO-CV)
Description
The function estimates the relevant dimension in feature space by leave-one-out cross-validation.It’s also able to calculate a denoised version of the labels and to estimate the noise level in the dataset.
Usage
rde_loocv(K, y,est_y = FALSE,
alldim = FALSE,est_noise = FALSE,regression = FALSE,nmse = TRUE,dim_rest = 0.5)
Arguments
K kernel matrix of the inputs (e.g. rbf kernel matrix)
y label vector which contains the label for each data point
est_y set this to TRUE if you want a denoised version of the labels
alldim if this is TRUE denoised labels for all dimensions are calculated (instead of onlyfor relevant dimension)
est_noise set this to TRUE if you want an estimated noise level

rde_loocv 17
regression only interesting if one of est_y, alldim, est_noise is TRUE. Set this to TRUEif you want to force the function to handle the data as data for a regression prob-lem. If you leave this FALSE, the function will try to determine itself whetherthis is a classification or regression problem.
nmse only interesting if est_noise is TRUE and the function is handling the dataas data of a regression problem. If you leave this TRUE, the normalized meansquared error is used for estimating the noise level, otherwise the conventionalmean squared error.
dim_rest percantage of leading dimensions to which the search for the relevant dimen-sions should be restricted. This is needed due to numerical instabilities. 0.5should be a good choice in most cases (and is also the default value)
Details
If est_noise or alldim are TRUE, a denoised version of the labels for the relevant dimension willbe returned even if est_y is FALSE (so e.g. if you want denoised labels and noise approximation itis enough to set est_noise to TRUE).
Value
rd estimated relevant dimension
err loo-cv error for each dimension (the position of the minimum is the relevantdimension)
yh only returned if est_y, alldim or est_noise is TRUE, contains the denoisedlabels
Yh only returned if alldim is TRUE, matrix with denoised labels for each dimen-sion in each column
noise only returned if est_noise is TRUE, contains the estimated noise level
kpc kernel pca coefficients
eigvec eigenvectors of the kernel matrix
eigval eigenvalues of the kernel matrix
tcm always FALSE; used to tell other functions that loo-cv method was used
Author(s)
Jan Saputra Mueller
References
M. L. Braun, J. M. Buhmann, K. R. Mueller (2008) \_On Relevant Dimensions in Kernel FeatureSpaces\_
See Also
rde, rde_tcm, estnoise, isregression, rbfkernel, polykernel, drawkpc

18 rde_tcm
Examples
## example with sinc datad <- sincdata(100, 0.1) # generate sinc dataK <- rbfkernel(d$X) # calculate rbf kernel matrix# rde, return also denoised labels and noiser <- rde_loocv(K, d$y, est_y = TRUE, est_noise = TRUE)r$rd # estimated relevant dimensionr$noise # estimated noisedrawkpc(r) # draw kernel pca coefficients
rde_tcm Relevant Dimension Estimation (RDE) by Fitting a Two-ComponentModel (TCM)
Description
The function estimates the relevant dimension in feature space by fitting a two-component model.It’s also able to calculate a denoised version of the labels and to estimate the noise level in the dataset.
Usage
rde_tcm(K, y,est_y = FALSE,
alldim = FALSE,est_noise = FALSE,regression = FALSE,nmse = TRUE,dim_rest = 0.5)
Arguments
K kernel matrix of the inputs (e.g. rbf kernel matrix)
y label vector which contains the label for each data point
est_y set this to TRUE if you want a denoised version of the labels
alldim if this is TRUE denoised labels for all dimensions are calculated (instead of onlyfor relevant dimension)
est_noise set this to TRUE if you want an estimated noise level
regression only interesting if one of est_y, alldim, est_noise is TRUE. Set this to TRUEif you want to force the function to handle the data as data for a regression prob-lem. If you leave this FALSE, the function will try to determine itself whetherthis is a classification or regression problem.
nmse only interesting if est_noise is TRUE and the function is handling the dataas data of a regression problem. If you leave this TRUE, the normalized meansquared error is used for estimating the noise level, otherwise the conventionalmean squared error.

rde_tcm 19
dim_rest percantage of leading dimensions to which the search for the relevant dimen-sions should be restricted. This is needed due to numerical instabilities. 0.5should be a good choice in most cases (and is also the default value)
Details
If est_noise or alldim are TRUE, a denoised version of the labels for the relevant dimension willbe returned even if est_y is FALSE (so e.g. if you want denoised labels and noise approximation itis enough to set est_noise to TRUE).
Value
rd estimated relevant dimension
err negative log-likelihood for each dimension (the position of the minimum is therelevant dimension)
yh only returned if est_y, alldim or est_noise is TRUE, contains the denoisedlabels
Yh only returned if alldim is TRUE, matrix with denoised labels for each dimen-sion in each column
noise only returned if est_noise is TRUE, contains the estimated noise level
kpc kernel pca coefficients
eigvec eigenvectors of the kernel matrix
eigval eigenvalues of the kernel matrix
tcm always TRUE; used to tell other functions that tcm method was used
Author(s)
Jan Saputra Mueller
References
M. L. Braun, J. M. Buhmann, K. R. Mueller (2008) \_On Relevant Dimensions in Kernel FeatureSpaces\_
See Also
rde, rde_loocv, estnoise, isregression, rbfkernel, polykernel, drawkpc
Examples
## example with sinc datad <- sincdata(100, 0.1) # generate sinc dataK <- rbfkernel(d$X) # calculate rbf kernel matrix# rde, return also denoised labels and noiser <- rde_tcm(K, d$y, est_y = TRUE, est_noise = TRUE)r$rd # estimated relevant dimensionr$noise # estimated noisedrawkpc(r) # draw kernel pca coefficients

20 selectmodel
selectmodel Model selection
Description
The function can be used for selecting the kernel from a number of possible candidates which fitsthe problem best. You need a parametrized kernel function and a number of possible parameters.A relevant dimension estimation will be done for all parameter combinations and the one with thesmallest loo-cv-error/negative-log-likelihood on its estimated relevant dimension will be chosen.
Usage
selectmodel(X, y,kernel = rbfkernel,
est_y = FALSE,ydist = FALSE,est_noise = FALSE,regression = FALSE,nmse = TRUE,tcm = TRUE,Xname = "X",...)
Arguments
X matrix containing a data point in each row
y label vector which contains the label for each data point
kernel parametrized kernel function which should be used
est_y set this to TRUE if you want a denoised version of the labels for the best model
ydist set this to TRUE if you want a matrix, which contains the distances betweenthe denoised labels and the original labels for all dimensions and all parametercombinations (each line in the matrix contains the distances for one parametercombination. This is needed for distimage)
est_noise set this to TRUE if you want an estimated noise level (for the best model)
regression only interesting if est_y or est_noise is TRUE. Set this to TRUE if you wantto force the function to handle the data as data for a regression problem. Ifyou leave this FALSE, the function will try to determine itself whether this is aclassification or regression problem.
nmse only interesting if est_noise is TRUE and the function is handling the dataas data of a regression problem. If you leave this TRUE, the normalized meansquared error is used for estimating the noise level, otherwise the conventionalmean squared error.
tcm this is TRUE by default; indicates whether rde should be done by TCM or LOO-CV algorithm

selectmodel 21
Xname the name of the parameter of the kernel function which should contain the datapoints. This is X by default and can be left as it is if you use rbfkernel orpolykernel.
... for each parameter of the kernel function you should give a list of parameters toselect the best parameter combination from (e.g. for rbfkernel this is only theparameter sigma of for polykernel it’s only the parameter d. See examples.)
Value
rd estimated relevant dimension for best model
best the best parameter combination which has been found through model selection
yh only returned if est_y, alldim or est_noise is TRUE, contains the denoisedlabels for the best model
noise only returned if est_noise is TRUE, contains the estimated noise level for thebest model
Yd contains the distances of the denoised labels and the original labels; needed fordistimage
rds estimated relevant dimensions for each model
err loo-cv-error/negative-log-likelihood-value for each dimension for the best model
errs loo-cv-error/negative-log-likelihood-value for each dimension for all models (ineach line is the error for one model)
kpc kernel pca coefficients for best model
eigvec eigenvectors of the kernel matrix for best model
eigval eigenvalues of the kernel matrix for best model
params list of parameters for the kernel function which has been given to the function
tcm TRUE if TCM algorithm was used, otherwise (LOO-CV algorithm) FALSE
kernel kernel function which has been used
Xname the name of the parameter of the kernel function which should contain the datapoints as it has been given to the function
X matrix with the data points as it has been given to the function
regression TRUE, if the data are data of a regression problem, FALSE in case of a classifi-cation problem
Author(s)
Jan Saputra Mueller
References
M. L. Braun, J. M. Buhmann, K. R. Mueller (2008) \_On Relevant Dimensions in Kernel FeatureSpaces\_
See Also
rde, modelimage, distimage, drawkpc

22 sinc
Examples
## model selection with RBF-kerneld <- sincdata(100, 0.1) # generate sinc data# do model selection, calculate also denoised labelsm <- selectmodel(d$X, d$y, est_y = TRUE, sigma = logspace(-3, 3, 100))m$best # best modelm$rd # relevant dimension for best modelmodelimage(m) # draw model selection image
## model selection with polynomial kerneld <- sincdata(100, 0.1) # generate sinc data# do model selection, calculate also denoised labelsm <- selectmodel(d$X, d$y, kernel = polykernel, est_y = TRUE, d = 1:20)m$best # best modelm$rd # relevant dimension for best modelmodelimage(m, log = FALSE) # draw model selection image
sinc Calculate sinc values
Description
Calculates (normalized) sinc values for each element of a vector/matrix/... etc.,
sinc(x) =sin(πx)
πx, x 6= 0
If x = 0, sinc(x) is defined as 1 (removable singularity in zero).
Usage
sinc(X)
Arguments
X an arbitrary vector/matrix/... containing numbers
Value
an vector/matrix/... of same size as the argument containing the sinc values for each element
Author(s)
Jan Saputra Mueller
References
http://en.wikipedia.org/wiki/Sinc\_function
sincdata 23
See Also
sincdata
Examples
## calculate sinc values of a vectorv <- 1:10sinc(v)
sincdata Generate random sinc data
Description
Function draws n points uniformly from the interval [a, b], calculates the sinc (normalized sincfunction) values for that points and adds a normal noise with a standard deviation of noise to thesevalues.
Usage
sincdata(n, noise = 0, a = -4, b = 4)
Arguments
n number of points to generate
noise noise level to add to sinc values, i.e. standard deviation of normal noise
a left bound of interval from which the xs are drawn, a must be smaller than b
b right bound of interval from which the ys are drawn, b must be larger than a
Value
Randomly generated sinc data
X matrix with one column (i.e. a vector, but returned object is a matrix) containingthe x-values
y matrix with one row (i.e. a vector, but returned object is a matrix) containing they-values
Author(s)
Jan Saputra Mueller
References
http://en.wikipedia.org/wiki/Sinc\_function

24 sincdata
See Also
sinc
Examples
## generate 100 data points with noise level 0## drawn from the interval [-4,4]sincdata(100)
## generate 1000 data points with noise level 0.7## drawn from the interval [-10, 10]sincdata(100, 0.7, a = -10, b = 10)

Index
∗Topic classifdenoiselabels, 3distimage, 4drawkpc, 5estnoise, 6isregression, 8kpr, 9modelimage, 11rde, 14rde_loocv, 16rde_tcm, 18rdetools-package, 2selectmodel, 20
∗Topic datagensincdata, 23
∗Topic hplotdistimage, 4drawkpc, 5modelimage, 11
∗Topic mathsinc, 22
∗Topic modelsdenoiselabels, 3distimage, 4drawkpc, 5estnoise, 6kpr, 9logspace, 10modelimage, 11polykernel, 12rbfkernel, 13rde, 14rde_loocv, 16rde_tcm, 18rdetools-package, 2selectmodel, 20
∗Topic packagerdetools-package, 2
∗Topic regression
denoiselabels, 3distimage, 4drawkpc, 5estnoise, 6isregression, 8kpr, 9modelimage, 11rde, 14rde_loocv, 16rde_tcm, 18rdetools-package, 2selectmodel, 20
denoiselabels, 3distimage, 4, 6, 11, 20, 21drawkpc, 5, 5, 7, 11, 15, 17, 19, 21
estnoise, 6, 8, 15, 17, 19
filled.contour, 4, 5, 11
isregression, 8, 15, 17, 19
kpr, 9
logspace, 10
modelimage, 5, 6, 11, 21
polykernel, 12, 14, 15, 17, 19, 21
rainbow, 4, 5, 11rbfkernel, 7, 13, 13, 15, 17, 19, 21rde, 4–6, 9, 14, 17, 19, 21rde_loocv, 4, 7, 8, 15, 16, 19rde_tcm, 4, 7, 8, 15, 17, 18rdetools (rdetools-package), 2rdetools-package, 2
selectmodel, 4–6, 9–11, 20seq, 10sinc, 22, 24sincdata, 7, 13, 14, 23, 23
25