Package ‘apcluster’ - The Comprehensive R Archive Network · analogous to the 'Matlab' code...
50
Package ‘apcluster’ January 30, 2018 Type Package Title Affinity Propagation Clustering Version 1.4.5 Date 2018-01-31 Depends R (>= 3.0.0) Imports Rcpp (>= 0.11.1), methods, Matrix, stats, graphics, grDevices Suggests Biostrings, kebabs (>= 1.5.4), knitr Author Ulrich Bodenhofer, Johannes Palme, Chrats Melkonian, Andreas Kothmeier Maintainer Ulrich Bodenhofer <[email protected]> Description Implements Affinity Propagation clustering introduced by Frey and Dueck (2007) <DOI:10.1126/science.1136800>. The algorithms are largely analogous to the 'Matlab' code published by Frey and Dueck. The package further provides leveraged affinity propagation and an algorithm for exemplar-based agglomerative clustering that can also be used to join clusters obtained from affinity propagation. Various plotting functions are available for analyzing clustering results. License GPL (>= 2) Collate AllClasses.R AllGenerics.R access-methods.R coerce-methods.R show-methods.R labels-methods.R length-methods.R revDend.R heatmap-methods.R plot-methods.R cutree-methods.R sort-methods.R aggExCluster-methods.R apcluster-methods.R apclusterL-methods.R apclusterK-methods.R apclusterDemo.R preferenceRange-methods.R similarity.R simpleDist.R conversions.R URL http://www.bioinf.jku.at/software/apcluster/ VignetteBuilder knitr LinkingTo Rcpp LazyLoad yes Repository CRAN NeedsCompilation yes Date/Publication 2018-01-30 20:44:12 UTC 1
Transcript of Package ‘apcluster’ - The Comprehensive R Archive Network · analogous to the 'Matlab' code...

Package ‘apcluster’January 30, 2018
Type Package
Title Affinity Propagation Clustering
Version 1.4.5
Date 2018-01-31
Depends R (>= 3.0.0)
Imports Rcpp (>= 0.11.1), methods, Matrix, stats, graphics, grDevices
Suggests Biostrings, kebabs (>= 1.5.4), knitr
Author Ulrich Bodenhofer, Johannes Palme, Chrats Melkonian, Andreas Kothmeier
Maintainer Ulrich Bodenhofer <[email protected]>
Description Implements Affinity Propagation clustering introduced by Frey andDueck (2007) <DOI:10.1126/science.1136800>. The algorithms are largelyanalogous to the 'Matlab' code published by Frey and Dueck.The package further provides leveraged affinity propagation and analgorithm for exemplar-based agglomerative clustering that can also beused to join clusters obtained from affinity propagation. Variousplotting functions are available for analyzing clustering results.
License GPL (>= 2)
Collate AllClasses.R AllGenerics.R access-methods.R coerce-methods.Rshow-methods.R labels-methods.R length-methods.R revDend.Rheatmap-methods.R plot-methods.R cutree-methods.Rsort-methods.R aggExCluster-methods.R apcluster-methods.RapclusterL-methods.R apclusterK-methods.R apclusterDemo.RpreferenceRange-methods.R similarity.R simpleDist.Rconversions.R
URL http://www.bioinf.jku.at/software/apcluster/
VignetteBuilder knitr
LinkingTo Rcpp
LazyLoad yes
Repository CRAN
NeedsCompilation yes
Date/Publication 2018-01-30 20:44:12 UTC
1

2 apcluster-package
R topics documented:apcluster-package . . . . . . . . . . . . . . . . . . . . . . . . . . . . . . . . . . . . . . 2aggExCluster . . . . . . . . . . . . . . . . . . . . . . . . . . . . . . . . . . . . . . . . 4AggExResult-class . . . . . . . . . . . . . . . . . . . . . . . . . . . . . . . . . . . . . 7apcluster . . . . . . . . . . . . . . . . . . . . . . . . . . . . . . . . . . . . . . . . . . . 9apcluster-deprecated . . . . . . . . . . . . . . . . . . . . . . . . . . . . . . . . . . . . 13apclusterDemo . . . . . . . . . . . . . . . . . . . . . . . . . . . . . . . . . . . . . . . 13apclusterK . . . . . . . . . . . . . . . . . . . . . . . . . . . . . . . . . . . . . . . . . . 14apclusterL . . . . . . . . . . . . . . . . . . . . . . . . . . . . . . . . . . . . . . . . . . 17APResult-class . . . . . . . . . . . . . . . . . . . . . . . . . . . . . . . . . . . . . . . 20ch22Promoters . . . . . . . . . . . . . . . . . . . . . . . . . . . . . . . . . . . . . . . 22coerce-methods . . . . . . . . . . . . . . . . . . . . . . . . . . . . . . . . . . . . . . . 23conversions . . . . . . . . . . . . . . . . . . . . . . . . . . . . . . . . . . . . . . . . . 25cutree-methods . . . . . . . . . . . . . . . . . . . . . . . . . . . . . . . . . . . . . . . 27ExClust-class . . . . . . . . . . . . . . . . . . . . . . . . . . . . . . . . . . . . . . . . 29heatmap . . . . . . . . . . . . . . . . . . . . . . . . . . . . . . . . . . . . . . . . . . . 31labels-methods . . . . . . . . . . . . . . . . . . . . . . . . . . . . . . . . . . . . . . . 34plot . . . . . . . . . . . . . . . . . . . . . . . . . . . . . . . . . . . . . . . . . . . . . 36preferenceRange . . . . . . . . . . . . . . . . . . . . . . . . . . . . . . . . . . . . . . 39show-methods . . . . . . . . . . . . . . . . . . . . . . . . . . . . . . . . . . . . . . . . 41similarities . . . . . . . . . . . . . . . . . . . . . . . . . . . . . . . . . . . . . . . . . . 42sort-methods . . . . . . . . . . . . . . . . . . . . . . . . . . . . . . . . . . . . . . . . 45
Index 48
apcluster-package APCluster Package
Description
The apcluster package implements affinity propagation according to Frey and Dueck and a methodfor exemplar-based agglomerative clustering. It further offers various functions for plotting cluster-ing results.
Details
The central function is apcluster. It runs affinity propagation on a given similarity matrix orit creates a similarity matrix for a given data set and similarity measure and runs affinity propa-gation on this matrix. The function returns an APResult object from which the clustering itselfand information about the affinity propagation run can be obtained. Leveraged affinity propagationclustering apclusterL allows efficient clustering of large datasets by using only a subset of thesimilarities. The package further implements an exemplar-based agglomerative clustering methodaggExCluster that can be used for computing a complete cluster hierarchy, but also for joiningfine-grained clusters previously obtained by affinity propagation clustering. Further functions areimplemented to visualize the results and to create distance matrices.

apcluster-package 3
Author(s)
Ulrich Bodenhofer, Andreas Kothmeier & Johannes Palme <[email protected]>
References
http://www.bioinf.jku.at/software/apcluster
Bodenhofer, U., Kothmeier, A., and Hochreiter, S. (2011) APCluster: an R package for affinitypropagation clustering. Bioinformatics 27, 2463-2464. DOI: 10.1093/bioinformatics/btr406.
Frey, B. J. and Dueck, D. (2007) Clustering by passing messages between data points. Science 315,972-976. DOI: 10.1126/science.1136800.
Examples
## create two Gaussian cloudscl1 <- cbind(rnorm(100, 0.2, 0.05), rnorm(100, 0.8, 0.06))cl2 <- cbind(rnorm(100, 0.7, 0.08), rnorm(100, 0.3, 0.05))x <- rbind(cl1, cl2)
## compute similarity matrix (negative squared Euclidean)sim <- negDistMat(x, r=2)
## run affinity propagationapres <- apcluster(sim, details=TRUE)
## show details of clustering resultsshow(apres)
## plot information about clustering runplot(apres)
## plot clustering resultplot(apres, x)
## employ agglomerative clustering to join clustersaggres <- aggExCluster(sim, apres)
## show informationshow(aggres)show(cutree(aggres, 2))
## plot dendrogramplot(aggres)
## plot clustering result for k=2 clustersplot(aggres, x, k=2)
## plot heatmapheatmap(apres, sim)
## leveraged apclusterapresL <- apclusterL(s=negDistMat(r=2), x=x, frac=0.2, sweeps=3)

4 aggExCluster
## show details of clustering resultsshow(apresL)
## plot clustering resultplot(apresL, x)
aggExCluster Exemplar-based Agglomerative Clustering
Description
Runs exemplar-based agglomerative clustering
Usage
## S4 method for signature 'matrix,missing'aggExCluster(s, x, includeSim=FALSE)## S4 method for signature 'matrix,ExClust'aggExCluster(s, x, includeSim=FALSE)## S4 method for signature 'Matrix,missing'aggExCluster(s, x, includeSim=FALSE)## S4 method for signature 'Matrix,ExClust'aggExCluster(s, x, includeSim=FALSE)## S4 method for signature 'missing,ExClust'aggExCluster(s, x, includeSim=TRUE)## S4 method for signature 'function,ANY'aggExCluster(s, x, includeSim=TRUE, ...)## S4 method for signature 'character,ANY'aggExCluster(s, x, includeSim=TRUE, ...)
Arguments
s an l × l similarity matrix or a similarity function either specified as the nameof a package-provided similarity function as character string or a user providedfunction object
x either a prior clustering of class ExClust (or APResult) or, if called with sbeing a function or function name, input data to be clustered (see apcluster fora detailed specification)
includeSim if TRUE, the similarity matrix (either computed internally or passed via the sargument) is stored to the slot sim of the returned AggExResult object. The de-fault is FALSE if aggExCluster has been called for a similarity matrix, otherwisethe default is TRUE.
... all other arguments are passed to the selected similarity function as they are.

aggExCluster 5
Details
aggExCluster performs agglomerative clustering. Unlike other methods, e.g., the ones imple-mented in hclust, aggExCluster is computing exemplars for each cluster and its merging objec-tive is geared towards the identification of meaningful exemplars, too.
For each pair of clusters, the merging objective is computed as follows:
1. An intermediate cluster is created as the union of the two clusters.2. The potential exemplar is selected from the intermediate cluster as the sample that has the
largest average similarity to all other samples in the intermediate cluster.3. Then the average similarity of the exemplar with all samples in the first cluster and the average
similarity with all samples in the second cluster is computed. These two values measure howwell the joint exemplar describes the samples in the two clusters.
4. The merging objective is finally computed as the average of the two measures above. Hence,we can consider the merging objective as some kind of “balanced average similarity to thejoint exemplar”.
In each step, all pairs of clusters are considered and the pair with the largest merging objective isactually merged. The joint exemplar is then chosen as the exemplar of the merged cluster.
aggExCluster can be used in two ways, either by performing agglomerative clustering of an entiredata set or by performing agglomerative clustering of data previously clustered by affinity propaga-tion or another clustering algorithm.
1. Agglomerative clustering of an entire data set can be accomplished either by calling aggExClusteron a quadratic similarity matrix without further argument or by calling aggExCluster for afunction or function name along with data to be clustered (as argument x). A full agglomera-tion run is performed that starts from l clusters (all samples in separate one-element clusters)and ends with one cluster (all samples in one single cluster).
2. Agglomerative clustering starting from a given clustering result can be accomplished by call-ing aggExCluster for an APResult or ExClust object passed as parameter x. The similaritymatrix can either be passed as argument s or, if missing, aggExCluster looks if the similaritymatrix is included in the clustering object x. A cluster hierarchy with numbers of clustersranging from the number of clusters in x down to 1 is created.
The result is stored in an AggExResult object. The slot height is filled with the merging ob-jective of each of the maxNoClusters-1 merges. The slot order contains a permutation of thesamples/clusters for dendrogram plotting. The algorithm for computing this permutation is thesame as the one used in hclust. If aggExCluster was called for an entire data set, the slot labelcontains the names of the objects to be clustered (if available, otherwise the indices are used). IfaggExCluster was called for a prior clustering, then labels are set to ‘Cluster 1’, ‘Cluster 2’, etc.
Value
Upon successful completion, the function returns an AggExResult object.
Note
Similarity matrices can be supplied in dense or sparse format. Note, however, that sparse matricesare converted to full dense matrices before clustering which may lead to memory and/or perfor-mance bottlenecks for larger data sets.

6 aggExCluster
Author(s)
Ulrich Bodenhofer & Johannes Palme <[email protected]>
References
http://www.bioinf.jku.at/software/apcluster
Bodenhofer, U., Kothmeier, A., and Hochreiter, S. (2011) APCluster: an R package for affinitypropagation clustering. Bioinformatics 27, 2463-2464. DOI: 10.1093/bioinformatics/btr406.
See Also
AggExResult, apcluster-methods, plot-methods, heatmap-methods, cutree-methods
Examples
## create two Gaussian cloudscl1 <- cbind(rnorm(50, 0.2, 0.05), rnorm(50, 0.8, 0.06))cl2 <- cbind(rnorm(50, 0.7, 0.08), rnorm(50, 0.3, 0.05))x <- rbind(cl1, cl2)
## compute agglomerative clustering from scratchaggres1 <- aggExCluster(negDistMat(r=2), x)
## show resultsshow(aggres1)
## plot dendrogramplot(aggres1)
## plot heatmap along with dendrogramheatmap(aggres1)
## plot level with two clustersplot(aggres1, x, k=2)
## run affinity propagationapres <- apcluster(negDistMat(r=2), x, q=0.7)
## create hierarchy of clusters determined by affinity propagationaggres2 <- aggExCluster(x=apres)
## show resultsshow(aggres2)
## plot dendrogramplot(aggres2)plot(aggres2, showSamples=TRUE)
## plot heatmapheatmap(aggres2)

AggExResult-class 7
## plot level with two clustersplot(aggres2, x, k=2)
AggExResult-class Class "AggExResult"
Description
S4 class for storing results of exemplar-based agglomerative clustering
Objects
Objects of this class can be created by calling aggExCluster for a given similarity matrix.
Slots
The following slots are defined for AggExResult objects:
l: number of samples in the data set
sel: subset of samples used for leveraged clustering (empty for normal clustering)
maxNoClusters: maximum number of clusters in the cluster hierarchy, i.e. it contains clusteringswith 1 - maxNoClusters clusters.
exemplars: list of length maxNoClusters; the i-th component of the list is a vector of i exemplars(corresponding to the level with i clusters).
clusters: list of length maxNoClusters; the i-th component of clusters is a list of i clusters,each of which is a vector of sample indices.
merge: a maxNoClusters-1 by 2 matrix that contains the merging hierarchy; fully analogous tothe slot merge in the class hclust.
height: a vector of length maxNoClusters-1 that contains the merging objective of each merge;largely analogous to the slot height in the class hclust except that the slot height inAggExResult objects is supposed to be non-increasing, since aggExCluster is based on sim-ilarities, whereas hclust uses dissimilarities.
order: a vector containing a permutation of indices that can be used for plotting proper dendro-grams without crossing branches; fully analogous to the slot order in the class hclust.
labels: a character vector containing labels of clustered objects used for plotting dendrograms.
sim: similarity matrix; only available if aggExCluster was called with similarity function andincludeSim=TRUE.
call: method call used to produce this clustering result

8 AggExResult-class
Methods
plot signature(x="AggExResult"): see plot-methods
plot signature(x="AggExResult", y="matrix"): see plot-methods
heatmap signature(x="AggExResult"): see heatmap-methods
heatmap signature(x="AggExResult", y="matrix"): see heatmap-methods
show signature(object="AggExResult"): see show-methods
cutree signature(object="AggExResult", k="ANY",h="ANY"): see cutree-methods
length signature(x="AggExResult"): gives the number of clustering levels in the clusteringresult.
as.hclust signature(x="AggExResult"): see coerce-methods
as.dendrogram signature(object="AggExResult"): see coerce-methods
Accessors
In the following code snippets, x is an AggExResult object.
x[[i]]: Returns an object of class ExClust corresponding to the clustering level with i clusters;synonymous to cutree(x, i).
x[i]: Returns a list of ExClust objects with all clustering levels specified in vector i. So, the listhas as many components as the argument i has elements. A list is returned even if i is a singlelevel.
similarity signature(x="AggExResult"): gives the similarity matrix.
Author(s)
Ulrich Bodenhofer, Andreas Kothmeier & Johannes Palme <[email protected]>
References
http://www.bioinf.jku.at/software/apcluster
Bodenhofer, U., Kothmeier, A., and Hochreiter, S. (2011) APCluster: an R package for affinitypropagation clustering. Bioinformatics 27, 2463-2464. DOI: 10.1093/bioinformatics/btr406.
See Also
aggExCluster, show-methods, plot-methods, cutree-methods
Examples
## create two Gaussian cloudscl1 <- cbind(rnorm(50, 0.2, 0.05), rnorm(50, 0.8, 0.06))cl2 <- cbind(rnorm(50, 0.7, 0.08), rnorm(50, 0.3, 0.05))x <- rbind(cl1, cl2)
## compute similarity matrix (negative squared Euclidean)sim <- negDistMat(x, r=2)

apcluster 9
## compute agglomerative clustering from scratchaggres1 <- aggExCluster(sim)
## show resultsshow(aggres1)
## plot dendrogramplot(aggres1)
## plot heatmap along with dendrogramheatmap(aggres1, sim)
## plot level with two clustersplot(aggres1, x, k=2)
## run affinity propagationapres <- apcluster(sim, q=0.7)
## create hierarchy of clusters determined by affinity propagationaggres2 <- aggExCluster(sim, apres)
## show resultsshow(aggres2)
## plot dendrogramplot(aggres2)
## plot heatmapheatmap(aggres2, sim)
## plot level with two clustersplot(aggres2, x, k=2)
apcluster Affinity Propagation
Description
Runs affinity propagation clustering
Usage
## S4 method for signature 'matrix,missing'apcluster(s, x, p=NA, q=NA, maxits=1000,
convits=100, lam=0.9, includeSim=FALSE, details=FALSE,nonoise=FALSE, seed=NA)
## S4 method for signature 'dgTMatrix,missing'apcluster(s, x, p=NA, q=NA, maxits=1000,
convits=100, lam=0.9, includeSim=FALSE, details=FALSE,nonoise=FALSE, seed=NA)

10 apcluster
## S4 method for signature 'sparseMatrix,missing'apcluster(s, x, ...)## S4 method for signature 'Matrix,missing'apcluster(s, x, ...)## S4 method for signature 'character,ANY'apcluster(s, x, p=NA, q=NA, maxits=1000,
convits=100, lam=0.9, includeSim=TRUE, details=FALSE,nonoise=FALSE, seed=NA, ...)
## S4 method for signature 'function,ANY'apcluster(s, x, p=NA, q=NA, maxits=1000,
convits=100, lam=0.9, includeSim=TRUE, details=FALSE,nonoise=FALSE, seed=NA, ...)
Arguments
s an l × l similarity matrix or a similarity function either specified as the nameof a package-provided similarity function as character string or a user providedfunction object. s may also be a sparse matrix according to the Matrix package.Internally, apcluster uses the dgTMatrix class; all other sparse matrices arecast to this class (if possible, otherwise the function quits with an error). If sis any other object of class Matrix, s is cast to a regular matrix internally (ifpossible, otherwise the function quits with an error).
x input data to be clustered; if x is a matrix or data frame, rows are interpretedas samples and columns are interpreted as features; apart from matrices or dataframes, x may be any other structured data type that contains multiple data items- provided that an appropriate length function is available that returns the num-ber of items
p input preference; can be a vector that specifies individual preferences for eachdata point. If scalar, the same value is used for all data points. If NA, exemplarpreferences are initialized according to the distribution of non-Inf values in s.How this is done is controlled by the parameter q.
q if p=NA, exemplar preferences are initialized according to the distribution of non-Inf values in s. If q=NA, exemplar preferences are set to the median of non-Infvalues in s. If q is a value between 0 and 1, the sample quantile with thresholdq is used, whereas q=0.5 again results in the median.
maxits maximal number of iterations that should be executed
convits the algorithm terminates if the examplars have not changed for convits itera-tions
lam damping factor; should be a value in the range [0.5, 1); higher values correspondto heavy damping which may be needed if oscillations occur
includeSim if TRUE, the similarity matrix (either computed internally or passed via the sargument) is stored to the slot sim of the returned APResult object. The defaultis FALSE if apcluster has been called for a similarity matrix, otherwise thedefault is TRUE.
details if TRUE, more detailed information about the algorithm’s progress is stored inthe output object (see APResult)
apcluster 11
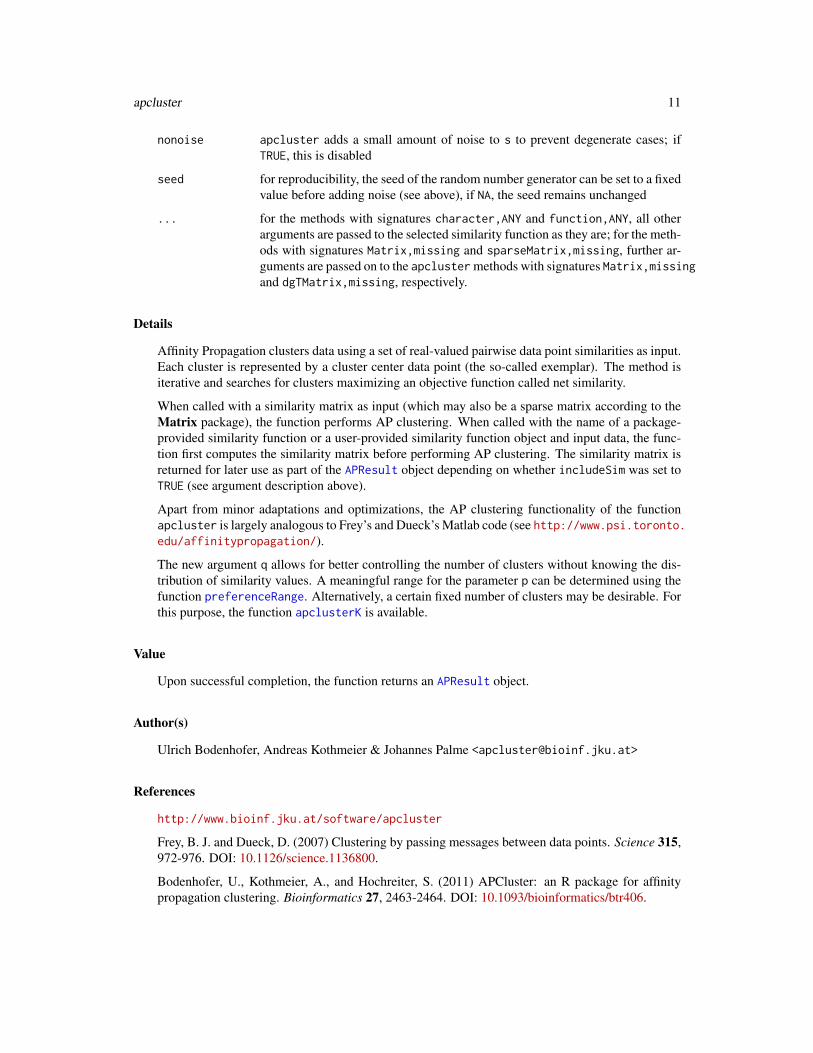
nonoise apcluster adds a small amount of noise to s to prevent degenerate cases; ifTRUE, this is disabled
seed for reproducibility, the seed of the random number generator can be set to a fixedvalue before adding noise (see above), if NA, the seed remains unchanged
... for the methods with signatures character,ANY and function,ANY, all otherarguments are passed to the selected similarity function as they are; for the meth-ods with signatures Matrix,missing and sparseMatrix,missing, further ar-guments are passed on to the apcluster methods with signatures Matrix,missingand dgTMatrix,missing, respectively.
Details
Affinity Propagation clusters data using a set of real-valued pairwise data point similarities as input.Each cluster is represented by a cluster center data point (the so-called exemplar). The method isiterative and searches for clusters maximizing an objective function called net similarity.
When called with a similarity matrix as input (which may also be a sparse matrix according to theMatrix package), the function performs AP clustering. When called with the name of a package-provided similarity function or a user-provided similarity function object and input data, the func-tion first computes the similarity matrix before performing AP clustering. The similarity matrix isreturned for later use as part of the APResult object depending on whether includeSim was set toTRUE (see argument description above).
Apart from minor adaptations and optimizations, the AP clustering functionality of the functionapcluster is largely analogous to Frey’s and Dueck’s Matlab code (see http://www.psi.toronto.edu/affinitypropagation/).
The new argument q allows for better controlling the number of clusters without knowing the dis-tribution of similarity values. A meaningful range for the parameter p can be determined using thefunction preferenceRange. Alternatively, a certain fixed number of clusters may be desirable. Forthis purpose, the function apclusterK is available.
Value
Upon successful completion, the function returns an APResult object.
Author(s)
Ulrich Bodenhofer, Andreas Kothmeier & Johannes Palme <[email protected]>
References
http://www.bioinf.jku.at/software/apcluster
Frey, B. J. and Dueck, D. (2007) Clustering by passing messages between data points. Science 315,972-976. DOI: 10.1126/science.1136800.
Bodenhofer, U., Kothmeier, A., and Hochreiter, S. (2011) APCluster: an R package for affinitypropagation clustering. Bioinformatics 27, 2463-2464. DOI: 10.1093/bioinformatics/btr406.

12 apcluster
See Also
APResult, show-methods, plot-methods, labels-methods, preferenceRange, apclusterL-methods,apclusterK
Examples
## create two Gaussian cloudscl1 <- cbind(rnorm(100, 0.2, 0.05), rnorm(100, 0.8, 0.06))cl2 <- cbind(rnorm(50, 0.7, 0.08), rnorm(50, 0.3, 0.05))x <- rbind(cl1, cl2)
## compute similarity matrix and run affinity propagation## (p defaults to median of similarity)apres <- apcluster(negDistMat(r=2), x, details=TRUE)
## show details of clustering resultsshow(apres)
## plot clustering resultplot(apres, x)
## plot heatmapheatmap(apres)
## run affinity propagation with default preference of 10% quantile## of similarities; this should lead to a smaller number of clusters## reuse similarity matrix from previous runapres <- apcluster(s=apres@sim, q=0.1)show(apres)plot(apres, x)
## now try the same with RBF kernelsim <- expSimMat(x, r=2)apres <- apcluster(s=sim, q=0.2)show(apres)plot(apres, x)
## create sparse similarity matrixcl1 <- cbind(rnorm(20, 0.2, 0.05), rnorm(20, 0.8, 0.06))cl2 <- cbind(rnorm(20, 0.7, 0.08), rnorm(20, 0.3, 0.05))x <- rbind(cl1, cl2)
sim <- negDistMat(x, r=2)ssim <- as.SparseSimilarityMatrix(sim, lower=-0.2)
## run apcluster() on the sparse similarity matrixapres <- apcluster(ssim, q=0)apres

apcluster-deprecated 13
apcluster-deprecated Deprecated functions in package ‘apcluster’
Description
These functions are provided for compatibility with older versions of ‘apcluster’ only, and will bedefunct at the next release.
Details
The following functions are deprecated and will be made defunct; use the replacement indicatedbelow:
• sparseToFull: as.DenseSimilarityMatrix
Author(s)
Ulrich Bodenhofer & Andreas Kothmeier <[email protected]>
apclusterDemo Affinity Propagation Demo
Description
Runs affinity propagation demo for randomly generated data set according to Frey and Dueck
Usage
apclusterDemo(l=100, d=2, seed=NA, ...)
Arguments
l number of data points to be generatedd dimension of data to be createdseed for reproducibility, the seed of the random number generator can be set to a fixed
value; if NA, the seed remains unchanged... all other arguments are passed on to apcluster
Details
apclusterDemo creates l d-dimensional data points that are uniformly distributed in [0, 1]d. Affin-ity propagation is executed for this data set with default parameters. Alternative settings can bepassed to apcluster with additional arguments. After completion of affinity propagation, the re-sults are shown and the performance measures are plotted.This function corresponds to the demo function in the original Matlab code of Frey and Dueck. Wewarn the user, however, that uniformly distributed data are not necessarily ideal for demonstratingclustering, as there can never be real clusters in uniformly distributed data - all clusters found mustbe random artefacts.

14 apclusterK
Value
Upon successful completion, the function returns an invisible list with three components. The firstis the data set that has been created, the second is the similarity matrix, and the third is an APResultobject with the clustering results (see examples below).
Author(s)
Ulrich Bodenhofer, Andreas Kothmeier & Johannes Palme <[email protected]>
References
http://www.bioinf.jku.at/software/apcluster
Frey, B. J. and Dueck, D. (2007) Clustering by passing messages between data points. Science 315,972-976. DOI: 10.1126/science.1136800.
Bodenhofer, U., Kothmeier, A., and Hochreiter, S. (2011) APCluster: an R package for affinitypropagation clustering. Bioinformatics 27, 2463-2464. DOI: 10.1093/bioinformatics/btr406.
See Also
APResult, plot-methods, apcluster, apclusterL
Examples
## create random data set and run affinity propagationapd <- apclusterDemo()
## plot clustering result along with data setplot(apd[[3]], apd[[1]])
apclusterK Affinity Propagation for Pre-defined Number of Clusters
Description
Runs affinity propagation clustering for a given similarity matrix adjusting input preferences itera-tively in order to achieve a desired number of clusters
Usage
## S4 method for signature 'matrix,missing'apclusterK(s, x, K, prc=10, bimaxit=20, exact=FALSE,
maxits=1000, convits=100, lam=0.9, includeSim=FALSE, details=FALSE,nonoise=FALSE, seed=NA, verbose=TRUE)
## S4 method for signature 'Matrix,missing'apclusterK(s, x, K, ...)## S4 method for signature 'dgTMatrix,missing'apclusterK(s, x, K, prc=10, bimaxit=20,

apclusterK 15
exact=FALSE, maxits=1000, convits=100, lam=0.9, includeSim=FALSE,details=FALSE, nonoise=FALSE, seed=NA, verbose=TRUE)
## S4 method for signature 'sparseMatrix,missing'apclusterK(s, x, K, ...)## S4 method for signature 'function,ANY'apclusterK(s, x, K, prc=10, bimaxit=20, exact=FALSE,
maxits=1000, convits=100, lam=0.9, includeSim=TRUE, details=FALSE,nonoise=FALSE, seed=NA, verbose=TRUE, ...)
## S4 method for signature 'character,ANY'apclusterK(s, x, K, prc=10, bimaxit=20, exact=FALSE,
maxits=1000, convits=100, lam=0.9, includeSim=TRUE, details=FALSE,nonoise=FALSE, seed=NA, verbose=TRUE, ...)
Arguments
s an l× l similarity matrix in sparse or dense format or a similarity function eitherspecified as the name of a package-provided similarity function as characterstring or a user provided function object.
x input data to be clustered; if x is a matrix or data frame, rows are interpretedas samples and columns are interpreted as features; apart from matrices or dataframes, x may be any other structured data type that contains multiple data items- provided that an appropriate length function is available that returns the num-ber of items
K desired number of clusters
prc the algorithm stops if the number of clusters does not deviate more than prcpercent from desired value K; set to 0 if you want to have exactly K clusters
bimaxit maximum number of bisection steps to perform; note that no warning is issuedif the number of clusters is still not in the desired range
exact flag indicating whether or not to compute the initial preference range exactly(see preferenceRange)
maxits maximal number of iterations that apcluster should execute
convits apcluster terminates if the examplars have not changed for convits iterations
lam damping factor for apcluster; should be a value in the range [0.5, 1); highervalues correspond to heavy damping which may be needed if oscillations occur
includeSim if TRUE, the similarity matrix (either computed internally or passed via the sargument) is stored to the slot sim of the returned APResult object. The defaultis FALSE if apclusterK has been called for a similarity matrix, otherwise thedefault is TRUE.
details if TRUE, more detailed information about the algorithm’s progress is stored inthe output object (see APResult)
nonoise apcluster adds a small amount of noise to s to prevent degenerate cases; ifTRUE, this is disabled
seed for reproducibility, the seed of the random number generator can be set to a fixedvalue, if NA, the seed remains unchanged
verbose flag indicating whether status information should be displayed during bisection

16 apclusterK
... for the methods with signatures character,ANY and function,ANY, all otherarguments are passed to the selected similarity function as they are; for the meth-ods with signatures Matrix,missing and sparseMatrix,missing, further ar-guments are passed on to the apclusterK methods with signatures Matrix,missingand dgTMatrix,missing, respectively.
Details
apclusterK first runs preferenceRange to determine the range of meaningful choices of the inputpreference p. Then it decreases p exponentially for a few iterations to obtain a good initial guess forp. If the number of clusters is still too far from the desired goal, bisection is applied.
When called with a similarity matrix as input, the function performs the procedure described above.When called with the name of a package-provided similarity function or a user-provided similarityfunction object and input data, the function first computes the similarity matrix before runningapclusterK on this similarity matrix. The similarity matrix is returned for later use as part ofthe APResult object depending on whether includeSim was set to TRUE (see argument descriptionabove).
Apart from minor adaptations and optimizations, the implementation is largely analogous to Frey’sand Dueck’s Matlab code (see http://www.psi.toronto.edu/affinitypropagation/).
Value
Upon successful completion, the function returns a APResult object.
Author(s)
Ulrich Bodenhofer & Andreas Kothmeier <[email protected]>
References
http://www.bioinf.jku.at/software/apcluster
Frey, B. J. and Dueck, D. (2007) Clustering by passing messages between data points. Science 315,972-976. DOI: 10.1126/science.1136800.
Bodenhofer, U., Kothmeier, A., and Hochreiter, S. (2011) APCluster: an R package for affinitypropagation clustering. Bioinformatics 27, 2463-2464. DOI: 10.1093/bioinformatics/btr406.
See Also
apcluster, preferenceRange, APResult
Examples
## create three Gaussian cloudscl1 <- cbind(rnorm(70, 0.2, 0.05), rnorm(70, 0.8, 0.06))cl2 <- cbind(rnorm(50, 0.7, 0.08), rnorm(50, 0.3, 0.05))cl3 <- cbind(rnorm(60, 0.8, 0.04), rnorm(60, 0.8, 0.05))x <- rbind(cl1, cl2, cl3)
## run affinity propagation such that 3 clusters are obtained

apclusterL 17
apres <- apclusterK(negDistMat(r=2), x, K=3)
## show details of clustering resultsshow(apres)
## plot clustering resultplot(apres, x)
## create sparse similarity matrixcl1 <- cbind(rnorm(20, 0.2, 0.05), rnorm(20, 0.8, 0.06))cl2 <- cbind(rnorm(20, 0.7, 0.08), rnorm(20, 0.3, 0.05))x <- rbind(cl1, cl2)
sim <- negDistMat(x, r=2)ssim <- as.SparseSimilarityMatrix(sim, lower=-0.2)
## run apcluster() on the sparse similarity matrixapres <- apclusterK(ssim, K=2)apres
apclusterL Leveraged Affinity Propagation
Description
Runs leveraged affinity propagation clustering
Usage
## S4 method for signature 'matrix,missing'apclusterL(s, x,
sel, p=NA, q=NA, maxits=1000, convits=100, lam=0.9,includeSim=FALSE, nonoise=FALSE, seed=NA)
## S4 method for signature 'character,ANY'apclusterL(s, x,
frac, sweeps, p=NA, q=NA, maxits=1000, convits=100, lam=0.9,includeSim=TRUE, nonoise=FALSE, seed=NA, ...)
## S4 method for signature 'function,ANY'apclusterL(s, x,
frac, sweeps, p=NA, q=NA, maxits=1000, convits=100, lam=0.9,includeSim=TRUE, nonoise=FALSE, seed=NA, ...)
Arguments
s an l × length(sel) similarity matrix or a similarity function either specifiedas the name of a package provided similarity function as character string or auser provided function object for similarity calculation. If s is supplied as asimilarity matrix, the columns must correspond to the same sub-selection ofsamples as specified in the sel argument and must be in the same increasing

18 apclusterL
order. For a package- or user-defined similarity function, additional parameterscan be specified as appropriate for the chosen method and are passed on to thesimilarity function via the ... argument (see below). See the package vignettefor a non-trivial example or supplying a user-defined similarity measure.
x input data to be clustered; if x is a matrix or data frame, rows are interpretedas samples and columns are interpreted as features; apart from matrices or dataframes, x may be any other structured data type that contains multiple data items- provided that an appropriate length function is available that returns the num-ber of items
frac fraction of samples that should be used for leveraged clustering. The similaritymatrix will be generated for all samples against a random fraction of the samplesas specified by this parameter.
sweeps number of sweeps of leveraged clustering performed with changing randomlyselected subset of samples.
sel selected sample indices; a vector containing the sample indices of the samplesubset used for leveraged AP clustering in increasing order.
p input preference; can be a vector that specifies individual preferences for eachdata point. If scalar, the same value is used for all data points. If NA, exemplarpreferences are initialized according to the distribution of non-Inf values in s.How this is done is controlled by the parameter q. See also apcluster.
q if p=NA, exemplar preferences are initialized according to the distribution of non-Inf values in s. If q=NA, exemplar preferences are set to the median of non-Infvalues in s. If q is a value between 0 and 1, the sample quantile with thresholdq is used, whereas q=0.5 again results in the median. See also apcluster.
maxits maximal number of iterations that should be executed
convits the algorithm terminates if the examplars have not changed for convits itera-tions
lam damping factor; should be a value in the range [0.5, 1); higher values correspondto heavy damping which may be needed if oscillations occur
includeSim if TRUE, the similarity matrix (either computed internally or passed via the sargument) is stored to the slot sim of the returned APResult object. The defaultis FALSE if apclusterL has been called for a similarity matrix, otherwise thedefault is TRUE.
nonoise apcluster adds a small amount of noise to s to prevent degenerate cases; ifTRUE, this is disabled
seed for reproducibility, the seed of the random number generator can be set to a fixedvalue before adding noise (see above), if NA, the seed remains unchanged
... all other arguments are passed to the selected similarity function as they are; notethat possible name conflicts between arguments of apcluster and argumentsof the similarity function may occur; therefore, we recommend to write user-defined similarity functions without additional parameters or to use closures tofix parameters (such as, in the example below);

apclusterL 19
Details
Affinity Propagation clusters data using a set of real-valued pairwise similarities as input. Eachcluster is represented by a representative cluster center (the so-called exemplar). The method isiterative and searches for clusters maximizing an objective function called net similarity.
Leveraged Affinity Propagation reduces dynamic and static load for large datasets. Only a subsetof the samples are considered in the clustering process assuming that they provide already enoughinformation about the cluster structure.
When called with input data and the name of a package provided or a user provided similarityfunction the function selects a random sample subset according to the frac parameter, calculatesa rectangular similarity matrix of all samples against this subset and repeats affinity propagationsweep times. A new sample subset is used for each repetition. The clustering result of the sweepwith the highest net similarity is returned. Any parameters specific to the chosen method of simi-larity calculation can be passed to apcluster in addition to the parameters described above. Thesimilarity matrix for the best trial is also returned in the result object when requested by the user(argument includeSim).
When called with a rectangular similarity matrix (which represents a column subset of the fullsimilarity matrix) the function performs AP clustering on this similarity matrix. The informationabout the selected samples is passed to clustering with the parameter sel. This function is onlyneeded when the user needs full control of distance calculation or sample subset selection.
Apart from minor adaptations and optimizations, the implementation of the function apclusterLis largely analogous to Frey’s and Dueck’s Matlab code (see http://www.psi.toronto.edu/affinitypropagation/).
Value
Upon successful completion, both functions returns an APResult object.
Author(s)
Ulrich Bodenhofer, Andreas Kothmeier & Johannes Palme <[email protected]>
References
http://www.bioinf.jku.at/software/apcluster
Frey, B. J. and Dueck, D. (2007) Clustering by passing messages between data points. Science 315,972-976. DOI: 10.1126/science.1136800.
Bodenhofer, U., Kothmeier, A., and Hochreiter, S. (2011) APCluster: an R package for affinitypropagation clustering. Bioinformatics 27, 2463-2464. DOI: 10.1093/bioinformatics/btr406.
See Also
APResult, show-methods, plot-methods, labels-methods, preferenceRange, apcluster-methods,apclusterK

20 APResult-class
Examples
## create two Gaussian cloudscl1 <- cbind(rnorm(150, 0.2, 0.05), rnorm(150, 0.8, 0.06))cl2 <- cbind(rnorm(100, 0.7, 0.08), rnorm(100, 0.3, 0.05))x <- rbind(cl1, cl2)
## leveraged apclusterapres <- apclusterL(negDistMat(r=2), x, frac=0.2, sweeps=3, p=-0.2)
## show details of leveraged clustering resultsshow(apres)
## plot leveraged clustering resultplot(apres, x)
## plot heatmap of clustering resultheatmap(apres)
## show net similarities of single sweepsapres@netsimLev
## show samples on which best sweep was basedapres@sel
APResult-class Class "APResult"
Description
S4 class for storing results of affinity propagation clustering. It extends the class ExClust.
Objects
Objects of this class can be created by calling apcluster or apclusterL for a given similaritymatrix or calling one of these procedures with a data set and a similarity measure.
Slots
The following slots are defined for APResult objects. Most names are taken from Frey’s andDueck’s original Matlab package:
sweeps: number of times leveraged clustering ran with different subsets of samples
it: number of iterations the algorithm ran
p: input preference (either set by user or computed by apcluster or apclusterL)
netsim: final total net similarity, defined as the sum of expref and dpsim (see below)
dpsim: final sum of similarities of data points to exemplars
expref: final sum of preferences of the identified exemplars

APResult-class 21
netsimLev: total net similarity of the individual sweeps for leveraged clustering; only available forleveraged clustering
netsimAll: vector containing the total net similarity for each iteration; only available if apclusterwas called with details=TRUE
exprefAll: vector containing the sum of preferences of the identified exemplars for each iteration;only available if apcluster was called with details=TRUE
dpsimAll: vector containing the sum of similarities of data points to exemplars for each iteration;only available if apcluster was called with details=TRUE
idxAll: matrix with sample-to-exemplar indices for each iteration; only available if apclusterwas called with details=TRUE
Extends
Class "ExClust", directly.
Methods
plot signature(x="APResult"): see plot-methods
plot signature(x="ExClust", y="matrix"): see plot-methods
heatmap signature(x="ExClust"): see heatmap-methods
heatmap signature(x="ExClust", y="matrix"): see heatmap-methods
show signature(object="APResult"): see show-methods
labels signature(object="APResult"): see labels-methods
cutree signature(object="APResult"): see cutree-methods
length signature(x="APResult"): gives the number of clusters.
sort signature(x="ExClust"): see sort-methods
as.hclust signature(x="ExClust"): see coerce-methods
as.dendrogram signature(object="ExClust"): see coerce-methods
Accessors
In the following code snippets, x is an APResult object.
x[[i]]: Returns the i-th cluster as a list of indices of samples belonging to the i-th cluster.
x[i]: Returns a list of integer vectors with the indices of samples belonging to this cluster. Thelist has as many components as the argument i has elements. A list is returned even if i is asingle integer.
similarity signature(x="APResult"): gives the similarity matrix.
Author(s)
Ulrich Bodenhofer, Andreas Kothmeier & Johannes Palme <[email protected]>

22 ch22Promoters
References
http://www.bioinf.jku.at/software/apcluster
Bodenhofer, U., Kothmeier, A., and Hochreiter, S. (2011) APCluster: an R package for affinitypropagation clustering. Bioinformatics 27, 2463-2464. DOI: 10.1093/bioinformatics/btr406.
Frey, B. J. and Dueck, D. (2007) Clustering by passing messages between data points. Science 315,972-976.
See Also
apcluster, apclusterL, show-methods, plot-methods, labels-methods, cutree-methods
Examples
## create two Gaussian cloudscl1 <- cbind(rnorm(100, 0.2, 0.05), rnorm(100, 0.8, 0.06))cl2 <- cbind(rnorm(50, 0.7, 0.08), rnorm(50, 0.3, 0.05))x <- rbind(cl1, cl2)
## compute similarity matrix (negative squared Euclidean)sim <- negDistMat(x, r=2)
## run affinity propagationapres <- apcluster(sim, details=TRUE)
## show details of clustering resultsshow(apres)
## plot information about clustering runplot(apres)
## plot clustering resultplot(apres, x)
## plot heatmapheatmap(apres, sim)
ch22Promoters ch22Promoters Data Set
Description
Toy data set consisting of promoter regions of 150 random genes from the human chromosome 22(obsolete)
Usage
ch22Promoters

coerce-methods 23
Format
A data set with 150 DNA sequences. Each string is a nucleotide sequence that corresponds to thepromoter region of a gene from the human chromosome no. 22 (according to the human genomeassembly hg18). The sequences start 999 bases upstream of the transcription start site (TSS) andend with the TSS itself. The names attribute contains the RefSeq IDs of the genes.
In previous version of the apcluster package, this was an R object that can be loaded via data(ch22Promoters).For better compatibility with the kebabs package, the data set has been moved to a plain text file(in FASTA format) that can be loaded from inst/examples (see examples below).
Examples
## if Biostrings package is availableif (requireNamespace("Biostrings", quietly=TRUE)){
## load data setfilepath <- system.file("examples", "ch22Promoters.fasta",
package="apcluster")ch22Promoters <- Biostrings::readDNAStringSet(filepath)
## display sequencesch22Promoters
}
coerce-methods Coercion of cluster hierarchies
Description
Functions for coercing clustering object to hclust and dendrogram objects
Usage
## S4 method for signature 'AggExResult'as.hclust(x, base=0.05)## S4 method for signature 'ExClust'as.hclust(x, base=0.05, ...)## S4 method for signature 'AggExResult'as.dendrogram(object, base=0.05, useNames=TRUE)## S4 method for signature 'ExClust'as.dendrogram(object, base=0.05, useNames=TRUE, ...)
Arguments
x a clustering result object of class APResult, ExClust, or AggExResult
object a clustering result object of class APResult, ExClust, or AggExResult
base fraction of height used for the very first join; defaults to 0.05, i.e. the first joinappears at 5% of the total height of the dendrogram (see details below).

24 coerce-methods
useNames if TRUE (default), the labels of the dendrogram are the sample/cluster names (ifavailable); otherwise, the labels are indices.
... all other arguments are passed on to aggExCluster (see details below).
Details
If called for an AggExResult object, as.hclust creates an hclust object. The heights are trans-formed to the interval from base (height of lowest join) to 1 (height of highest join). If called for anExClust or APResult object, aggExCluster is called internally to create a cluster hierarchy first.This is only possible if the pairwise similarities are included in the sim slot of x (see aggExClusteron how to ensure this).
If x is an AggExResult object obtained by clustering an entire data set, as.hclust produces a com-plete hierarchy. If, however, x is an ExClust (or APResult) object or an AggExResult obtained byrunning aggExCluster on an ExClust or APResult object, then as.hclust produces a hierarchyof clusters, not of samples.
If called for an AggExResult object, as.dendrogram creates an dendrogram object. Analogouslyto as.hclust, the heights are transformed to the interval ranging from base (height of lowest join)to 1 (height of highest join). So, any information about heights of merges is lost. If the original joinheights are relevant, call plot on the original AggExResult object directly without coercing it to adendrogram object first. If called for an ExClust or APResult object, aggExCluster is called firstto create a cluster hierarchy. Again this is only possible if the pairwise similarities are included inthe sim slot of object.
If object is an AggExResult object obtained by clustering an entire data set, as.dendrogram pro-duces a complete dendrogram. If object is an ExClust (or APResult) object or an AggExResultobtained by previously running aggExCluster on an ExClust or APResult object, then as.dendrogramproduces a complete dendrogram of all samples, too, but with the difference that entire clusters ofthe previous ExClust or APResult object are not further split up hierarchically. Consequently, ifx is not a complete cluster hierarchy, but a hierarchy of clusters, as.dendrogram(as.hclust(x))produces a dendrogram of clusters, whereas as.dendrogram(x) in any case produces a dendrogramof samples (with the special property mentioned above).
Value
see details above
Author(s)
Ulrich Bodenhofer, Andreas Kothmeier & Johannes Palme <[email protected]>
References
http://www.bioinf.jku.at/software/apcluster
Bodenhofer, U., Kothmeier, A., and Hochreiter, S. (2011) APCluster: an R package for affinitypropagation clustering. Bioinformatics 27, 2463-2464. DOI: 10.1093/bioinformatics/btr406.
See Also
APResult, AggExResult, ExClust, heatmap-methods, apcluster, apclusterL, aggExCluster,cutree-methods

conversions 25
Examples
## create two Gaussian cloudscl1 <- cbind(rnorm(20, 0.2, 0.05), rnorm(20, 0.8, 0.06))cl2 <- cbind(rnorm(20, 0.7, 0.08), rnorm(20, 0.3, 0.05))x <- rbind(cl1, cl2)
## run affinity propagationapres <- apcluster(negDistMat(r=2), x, q=0.7, details=TRUE)
## perform agglomerative clustering of affinity propagation clustersaggres1 <- aggExCluster(x=apres)
## compute and plot dendrogramdend1 <- as.dendrogram(aggres1)dend1plot(dend1)
## compute and show dendrogram computed from hclust objectdend2 <- as.dendrogram(as.hclust(aggres1))dend2plot(dend2)
## perform agglomerative clustering of whole data setaggres2 <- aggExCluster(negDistMat(r=2), x)
## compute and plot dendrogramdend3 <- as.dendrogram(aggres2)dend3plot(dend3)
conversions Conversions Between Dense and Sparse Similarity Matrices
Description
Converts a dense similarity matrix into a sparse one or vice versa
Usage
## S4 method for signature 'matrix'as.SparseSimilarityMatrix(s, lower=-Inf)## S4 method for signature 'Matrix'as.SparseSimilarityMatrix(s, lower=-Inf)## S4 method for signature 'sparseMatrix'as.SparseSimilarityMatrix(s, lower=-Inf)## S4 method for signature 'matrix'as.DenseSimilarityMatrix(s, fill=-Inf)## S4 method for signature 'Matrix'as.DenseSimilarityMatrix(s, fill=-Inf)

26 conversions
## S4 method for signature 'sparseMatrix'as.DenseSimilarityMatrix(s, fill=-Inf)
Arguments
s a similarity matrix in sparse or dense format (see details below)
lower cut-off threshold to apply when converting similarity matrices into sparse for-mat. All similarities lower than or equal to lower will be omitted from the result.The default is -Inf), i.e. only -Inf values are removed.
fill value to fill in for entries that are missing from sparse similarity matrix ’s’ (de-faults to -Inf).
Details
The function as.SparseSimilarityMatrix takes a matrix argument, removes all diagonal ele-ments and all values that are lower than or equal to the cut-off threshold lower and returns a sparsematrix of class dgTMatrix.
If the function as.DenseSimilarityMatrix is called for a sparse matrix (class sparseMatrix orany class derived from this class), a dense matrix is returned, where all values that were missing inthe sparse matrix are replaced with fill.
as.DenseSimilarityMatrix can also be called for dense matrix and Matrix objects. In thiscase, as.DenseSimilarityMatrix assumes that the matrices have three columns that encode for asparse matrix in the same way as the Matlab implementation of Frey’s and Dueck’s sparse affinitypropagation accepts it: the first column contains 1-based row indices, the second column contains 1-based column indices, and the third column contains the similarity values. The same format is alsoaccepted by as.SparseSimilarityMatrix to convert a sparse similarity matrix of this format intoa dgTMatrix object. Note that, for matrices of this format, as.DenseSimilarityMatrix replacesthe deprectated function sparseToFull (see apcluster-deprecated).
Note that as.SparseSimilarityMatrix and as.DenseSimilarityMatrix are no S4 coercionmethods. There are no classes named SparseSimilarityMatrix or DenseSimilarityMatrix.
Value
returns a square similarity matrix in sparse format (class dgTMatrix or in dense format (standardclass matrix).
Author(s)
Ulrich Bodenhofer & Andreas Kothmeier <[email protected]>
References
http://www.bioinf.jku.at/software/apcluster
Frey, B. J. and Dueck, D. (2007) Clustering by passing messages between data points. Science 315,972-976. DOI: 10.1126/science.1136800.
Bodenhofer, U., Kothmeier, A., and Hochreiter, S. (2011) APCluster: an R package for affinitypropagation clustering. Bioinformatics 27, 2463-2464. DOI: 10.1093/bioinformatics/btr406.

cutree-methods 27
Examples
## create similarity matrix in sparse format according to Frey and Duecksp <- matrix(c(1, 2, 0.5, 3, 1, 0.2, 5, 4, -0.2, 3, 4, 1.2), 4, 3, byrow=TRUE)sp
## perform conversionsas.DenseSimilarityMatrix(sp, fill=0)as.SparseSimilarityMatrix(sp)
## create dense similarity matrixcl1 <- cbind(rnorm(20, 0.2, 0.05), rnorm(20, 0.8, 0.06))cl2 <- cbind(rnorm(20, 0.7, 0.08), rnorm(20, 0.3, 0.05))x <- rbind(cl1, cl2)
sim <- negDistMat(x, r=2)ssim <- as.SparseSimilarityMatrix(sim, lower=-0.2)
## run apcluster() on the sparse similarity matrixapres <- apcluster(ssim, q=0)apres
cutree-methods Cut Out Clustering Level from Cluster Hierarchy
Description
Cut out a clustering level from a cluster hierarchy
Usage
## S4 method for signature 'AggExResult'cutree(tree, k, h)## S4 method for signature 'APResult'cutree(tree, k, h)
Arguments
tree an object of class AggExResult containing a cluster hierarchy; may also be anobject of class APResult
k the level (i.e. the number of clusters) to be selected
h alternatively, the level can be selected by specifying a cut-off for the mergingobjective

28 cutree-methods
Details
The function cutree extracts a clustering level from a cluster hierarchy stored in an AggExResultobject. Which level is selected can be determined by one of the two arguments k and h (see above).If both k and h are specified, k overrides h. This is done largely analogous to the standard functioncutree. The differences are (1) that only one level can be extracted at a time and (2) that an ExClustis returned instead of an index list.
The function cutree may further be used to convert an APResult object into an ExClust object. Inthis case, the arguments k and h are ignored.
Value
returns an object of class ExClust
Author(s)
Ulrich Bodenhofer & Andreas Kothmeier <[email protected]>
References
http://www.bioinf.jku.at/software/apcluster
Bodenhofer, U., Kothmeier, A., and Hochreiter, S. (2011) APCluster: an R package for affinitypropagation clustering. Bioinformatics 27, 2463-2464. DOI: 10.1093/bioinformatics/btr406.
See Also
AggExResult, ExClust
Examples
## create two simple clustersx <- c(1, 2, 3, 7, 8, 9)names(x) <- c("a", "b", "c", "d", "e", "f")
## compute similarity matrix (negative squared distance)sim <- negDistMat(x, r=2)
## run affinity propagationaggres <- aggExCluster(sim)
## show details of clustering resultsshow(aggres)
## retrieve clustering with 2 clusterscutree(aggres, 2)
## retrieve clustering with cut-off h=-1cutree(aggres, h=-1)

ExClust-class 29
ExClust-class Class "ExClust"
Description
S4 class for storing exemplar-based clusterings
Objects
Objects of this class can be created by calling cutree to cut out a clustering level from a clusterhierarchy of class AggExResult. Moreover, cutree can also be used to convert an object of classAPResult to class ExClust.
Slots
The following slots are defined for ExClust objects:
l: number of samples in the data set
sel: subset of samples used for leveraged clustering
exemplars: vector containing indices of exemplars
clusters: list containing the clusters; the i-th component is a vector of indices of data pointsbelonging to the i-th exemplar (including the exemplar itself)
idx: vector of length l realizing a sample-to-exemplar mapping; the i-th entry contains the indexof the exemplar the i-th sample belongs to
sim: similarity matrix; only available if the preceding clustering method was called with includeSim=TRUE.
call: method call of the preceding clustering method
Methods
plot signature(x="ExClust"): see plot-methods
plot signature(x="ExClust", y="matrix"): see plot-methods
heatmap signature(x="ExClust"): see heatmap-methods
heatmap signature(x="ExClust", y="matrix"): see heatmap-methods
show signature(object="ExClust"): see show-methods
labels signature(object="ExClust"): see labels-methods
cutree signature(object="ExClust", k="ANY", h="ANY"): see cutree-methods
length signature(x="ExClust"): gives the number of clusters.
sort signature(x="ExClust"): see sort-methods
as.hclust signature(x="ExClust"): see coerce-methods
as.dendrogram signature(object="ExClust"): see coerce-methods

30 ExClust-class
Accessors
In the following code snippets, x is an ExClust object.
x[[i]]: Returns the i-th cluster as a list of indices of samples belonging to the i-th cluster.
x[i]: Returns a list of integer vectors with the indices of samples belonging to this cluster. Thelist has as many components as the argument i has elements. A list is returned even if i is asingle integer.
similarity signature(x="ExClust"): gives the similarity matrix.
Author(s)
Ulrich Bodenhofer, Andreas Kothmeier & Johannes Palme <[email protected]>
References
http://www.bioinf.jku.at/software/apcluster
Bodenhofer, U., Kothmeier, A., and Hochreiter, S. (2011) APCluster: an R package for affinitypropagation clustering. Bioinformatics 27, 2463-2464. DOI: 10.1093/bioinformatics/btr406.
See Also
aggExCluster, show-methods, plot-methods, labels-methods, cutree-methods, AggExResult,APResult
Examples
## create two Gaussian cloudscl1 <- cbind(rnorm(20, 0.2, 0.05), rnorm(20, 0.8, 0.06))cl2 <- cbind(rnorm(25, 0.7, 0.08), rnorm(25, 0.3, 0.05))x <- rbind(cl1, cl2)
## compute similarity matrix (negative squared Euclidean)sim <- negDistMat(x, r=2)
## run affinity propagationaggres <- aggExCluster(sim)
## extract level with two clustersexcl <- cutree(aggres, k=2)
## show details of clustering resultsshow(excl)
## plot information about clustering runplot(excl, x)

heatmap 31
heatmap Plot Heatmap
Description
Functions for Plotting of Heatmap
Usage
## S4 method for signature 'ExClust,missing'heatmap(x, y, ...)## S4 method for signature 'ExClust,matrix'heatmap(x, y, ...)## S4 method for signature 'ExClust,Matrix'heatmap(x, y, ...)## S4 method for signature 'ExClust,sparseMatrix'heatmap(x, y, ...)## S4 method for signature 'AggExResult,missing'heatmap(x, y, ...)## S4 method for signature 'AggExResult,matrix'heatmap(x, y, Rowv=TRUE, Colv=TRUE,
sideColors=NULL, col=heat.colors(12),base=0.05, add.expr, margins=c(5, 5, 2),cexRow=max(min(35 / nrow(y), 1), 0.1),cexCol=max(min(35 / ncol(y), 1), 0.1), main=NULL, dendScale=1,barScale=1, legend=c("none", "col"), ...)
## S4 method for signature 'matrix,missing'heatmap(x, y, ...)## S4 method for signature 'missing,matrix'heatmap(x, y, ...)
Arguments
x a clustering result object of class APResult, ExClust, or AggExResult; forcompatibility, x may also be a similarity matrix (see details below).
y a similarity matrix
sideColors character vector of colors to be used for plotting color bars that visualize clus-ters of the finest clustering level in x. This is done in a fashion similar to usingRowSideColors or ColSideColors in the standard heatmap function. However,color bars are plotted either on both sides or not at all. The sideColors argu-ment determines the coloring of both horizontal and vertical bars. If sideColorsis shorter than the number of clusters in the finest clustering level, sideColorsis recycled. In any case, a minimum number of two colors (two elements ofsideColors) is required. If NA, no color bars are plotted. If NULL (default), colorbars are only plotted if the finest cluster level does not only consist of singlesamples. In this case, the rainbow function is used to compute the vector of

32 heatmap
colors which is shuffled such that dissimilar colors are placed next to each otherin the color bar.
col color ramp used for the heatmap image; see image
Rowv determines whether or not a row dendrogram should be plotted. If FALSE or NA,no row dendrogram is plotted. In any other case, a row dendrogram is plottedunless the number of clusters in the finest clustering level is less than 2. Notethat, in the latter case, the actual values in Rowv are ignored, so this argumentcannot be used to supply a previously computed dendrogram or re-ordering ofelements as in the standard heatmap function.
Colv determines whether or not a column dendrogram should be plotted. Fully analo-gous to Rowv, except that column dendrograms are never plotted if the similaritymatrix y is non-quadratic.
base fraction of height used for the very first join in dendrograms; see coerce-methods.add.expr,margins,cexRow,cexCol,main
largely analogous to the standard heatmap function; to omit row/column label-ing, set cexRow/cexCol to 0. The default for margins is a vector of length 3,where the third element is the right-hand side margin for the color legend (seelegend argument). It remains unused (and can also be omitted) if no color leg-end is plotted.
dendScale factor scaling the width of vertical and height of horizontal dendrograms; valueshave to be larger than 0 and no larger than 2. The default is 1 which correspondsto the same size as the dendrograms plot by the standard heatmap function
barScale factor scaling the width of color bars; values have to be larger than 0 and nolarger than 4. The default is 1 which corresponds to half the width of the colorbars plot by the standard heatmap function
legend if "col", then a color legend similar to filled.contour is added on the right-hand side of the heatmap plot; if "none" (default), no such legend is added.
... see details below
Details
The heatmap functions provide plotting of heatmaps from several different types of input object.The implementation is similar to the standard graphics function heatmap. Plotting heatmaps viathe plot command as available in previous versions of this package is still available for backwardcompatibility.
If heatmap is called for objects of classes APResult or ExClust, a heatmap of the similarity matrixin slot sim of the parameter x is created with clusters grouped together and highlighted in differentcolors. The order of clusters is determined by running aggExCluster on the clustering result x.This variant of heatmap returns an invisible AggExResult object.
If heatmap is called for an AggExResult object that contains all levels of clustering, the heatmapis displayed with the corresponding clustering dendrogram. If the AggExResult object is the resultof running aggExCluster on a prior clustering result, the same heatmap plot is produced as ifheatmap had been called on this prior clustering result, however, returning the cluster hierarchy’sdendrogram. In the latter case, color bars are plotted to visualize the prior clustering result (seedescription of argument sideColors above).

heatmap 33
All variants described above only work if the input object x contains a slot sim with the sim-ilarity matrix (which is only the case if the preceding clustering method has been called withincludeSim=TRUE). In case the slot sim of x does not contain the similarity matrix, the similar-ity matrix must be supplied as second argument y.
All variants described above internally use heatmap with signature AggExResult,matrix, so allarguments list above can be used for all variants, as they are passed through using the ... argument.All other arguments, analogously to the standard heatmap function, are passed on to the standardfunction image. This is particularly useful for using alternative color schemes via the col argument.
The two variants with one of the two arguments being a matrix and one being missing are justwrappers around the standard heatmap function with the aim to provide compatibility with thisstandard case.
Value
see details above
Note
Similarity matrices can be supplied in dense or sparse format. Note, however, that sparse matricesare converted to full dense matrices before plotting heatmaps which may lead to memory and/orperformance bottlenecks for larger data sets.
Author(s)
Ulrich Bodenhofer, Andreas Kothmeier & Johannes Palme <[email protected]>
References
http://www.bioinf.jku.at/software/apcluster
Bodenhofer, U., Kothmeier, A., and Hochreiter, S. (2011) APCluster: an R package for affinitypropagation clustering. Bioinformatics 27, 2463-2464. DOI: 10.1093/bioinformatics/btr406.
See Also
APResult, AggExResult, ExClust, apcluster, apclusterL, aggExCluster, cutree-methods,plot-methods
Examples
## create two Gaussian cloudscl1 <- cbind(rnorm(50, 0.2, 0.05), rnorm(50, 0.8, 0.06))cl2 <- cbind(rnorm(50, 0.7, 0.08), rnorm(50, 0.3, 0.05))x <- rbind(cl1, cl2)
## run affinity propagation using negative squared Euclideanapres <- apcluster(negDistMat(r=2), x, p=-0.1)
## plot heatmap clustering runheatmap(apres)

34 labels-methods
## rerun affinity propagation## reuse similarity matrix from previous runapres2 <- apcluster(s=apres@sim, q=0.6)
## plot heatmap of second runheatmap(apres2, apres@sim)
## with alternate heatmap coloring, alternating color bars, and no dendrogramsheatmap(apres2, apres@sim, Rowv=NA, Colv=NA,
sideColors=c("darkgreen", "yellowgreen"), col=terrain.colors(12))
## perform agglomerative clustering of affinity propagation clustersaggres1 <- aggExCluster(apres@sim, apres2)
## plot heatmapheatmap(cutree(aggres1, 2), apres@sim)
## perform agglomerative clustering of whole data setaggres2 <- aggExCluster(negDistMat(r=2), x)
## show heatmap along with dendrogramheatmap(aggres2)
labels-methods Generate label vector from clustering result
Description
Generate a label vector from an clustering result
Usage
## S4 method for signature 'ExClust'labels(object, type="names")
Arguments
object object of class APResult or ExClusttype specifies which kind of label vector should be created, see details below
Details
The function labels creates a label vector from a clustering result. Which kind of labels areproduced is controlled by the argument type:
“names” (default) returns the name of the exemplar to which each data sample belongs to; if nonames are available, the function stops with an error;
“enum” returns the index of the cluster to which each data sample belongs to, where clusters areenumerated consecutively from 1 to the number of clusters (analogous to other clusteringmethods like kmeans);

labels-methods 35
“exemplars” returns the index of the exemplar to which each data sample belongs to, where indicesof exemplars are within the original data, which is nothing else but the slot object@idx withattributes removed.
Value
returns a label vector as long as the number of samples in the original data set
Author(s)
Ulrich Bodenhofer & Andreas Kothmeier <[email protected]>
References
http://www.bioinf.jku.at/software/apcluster
Bodenhofer, U., Kothmeier, A., and Hochreiter, S. (2011) APCluster: an R package for affinitypropagation clustering. Bioinformatics 27, 2463-2464. DOI: 10.1093/bioinformatics/btr406.
See Also
APResult, ExClust, cutree
Examples
## create two simple clustersx <- c(1, 2, 3, 7, 8, 9)names(x) <- c("a", "b", "c", "d", "e", "f")
## compute similarity matrix (negative squared distance)sim <- negDistMat(x, r=2)
## run affinity propagationapres <- apcluster(sim)
## show details of clustering resultsshow(apres)
## label vector (names of exemplars)labels(apres)
## label vector (consecutive index of exemplars)labels(apres, type="enum")
## label vector (index of exemplars within original data set)labels(apres, type="exemplars")
## now with agglomerative clusteringaggres <- aggExCluster(sim)
## label (names of exemplars)labels(cutree(aggres, 2))

36 plot
plot Plot Clustering Results
Description
Functions for Visualizing Clustering Results
Usage
## S4 method for signature 'APResult,missing'plot(x, y, type=c("netsim", "dpsim", "expref"),
xlab="# Iterations", ylab="Similarity", ...)## S4 method for signature 'ExClust,matrix'plot(x, y, connect=TRUE, xlab="", ylab="",labels=NA, limitNo=15, ...)## S4 method for signature 'ExClust,data.frame'plot(x, y, connect=TRUE, xlab="",ylab="", labels=NA, limitNo=15, ...)## S4 method for signature 'AggExResult,missing'plot(x, y, main="Cluster dendrogram",
xlab="", ylab="", ticks=4, digits=2, base=0.05, showSamples=FALSE,horiz=FALSE, ...)
## S4 method for signature 'AggExResult,matrix'plot(x, y, k=NA, h=NA, ...)## S4 method for signature 'AggExResult,data.frame'plot(x, y, k=NA, h=NA, ...)
Arguments
x a clustering result object of class APResult, ExClust, or AggExResult
y a matrix or data frame (see details below)
type a string or array of strings indicating which performance measures should beplotted; valid values are "netsim", "dpsim", and "expref" which can be usedin any combination or order; all other strings are ignored (for the meaning seeAPResult)
xlab, ylab labels for axes of 2D plots; ignored if y has more than two columns
labels names used for variables in scatter plot matrix (displayed if y has more thantwo columns). If NA (default), column names are used. If no column names areavailable, labels such as x[, 2] are displayed.
limitNo if the number of columns/features in y is too large, problems may occur whenattempting to plot a scatter plot matrix. To avoid problems, the plot methodthrows an error if the number of columns exceeds limitNo. For special appli-cations, users can increase the value (15 by default). If limitNo is set to NAor any other non-numeric value, the limit is ignored entirely. Please note thatattempting to plot scatter plot matrices with too many features may corrupt the
plot 37
graphics device. So users are making changes at their own risk. If plotting ofmany features is necessary, make sure that the graphics device is large enoughto accommodate the plot (e.g. by using a sufficiently large graphics file device).
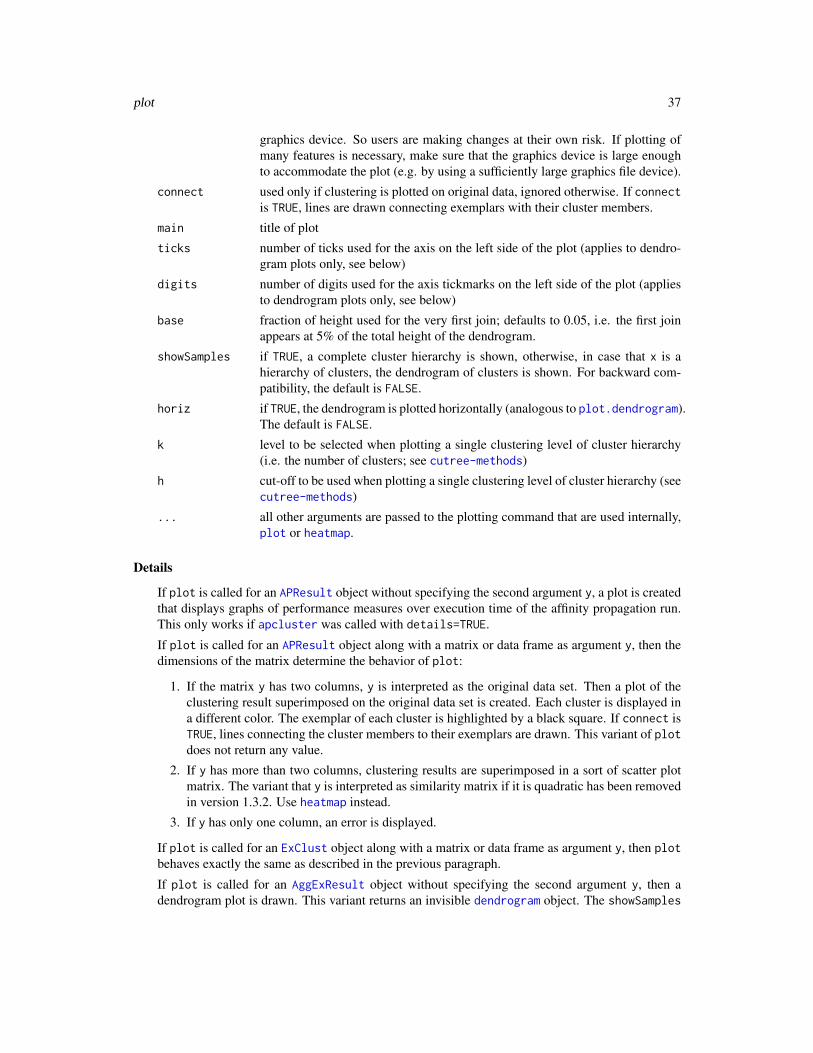
connect used only if clustering is plotted on original data, ignored otherwise. If connectis TRUE, lines are drawn connecting exemplars with their cluster members.
main title of plot
ticks number of ticks used for the axis on the left side of the plot (applies to dendro-gram plots only, see below)
digits number of digits used for the axis tickmarks on the left side of the plot (appliesto dendrogram plots only, see below)
base fraction of height used for the very first join; defaults to 0.05, i.e. the first joinappears at 5% of the total height of the dendrogram.
showSamples if TRUE, a complete cluster hierarchy is shown, otherwise, in case that x is ahierarchy of clusters, the dendrogram of clusters is shown. For backward com-patibility, the default is FALSE.
horiz if TRUE, the dendrogram is plotted horizontally (analogous to plot.dendrogram).The default is FALSE.
k level to be selected when plotting a single clustering level of cluster hierarchy(i.e. the number of clusters; see cutree-methods)
h cut-off to be used when plotting a single clustering level of cluster hierarchy (seecutree-methods)
... all other arguments are passed to the plotting command that are used internally,plot or heatmap.
Details
If plot is called for an APResult object without specifying the second argument y, a plot is createdthat displays graphs of performance measures over execution time of the affinity propagation run.This only works if apcluster was called with details=TRUE.
If plot is called for an APResult object along with a matrix or data frame as argument y, then thedimensions of the matrix determine the behavior of plot:
1. If the matrix y has two columns, y is interpreted as the original data set. Then a plot of theclustering result superimposed on the original data set is created. Each cluster is displayed ina different color. The exemplar of each cluster is highlighted by a black square. If connect isTRUE, lines connecting the cluster members to their exemplars are drawn. This variant of plotdoes not return any value.
2. If y has more than two columns, clustering results are superimposed in a sort of scatter plotmatrix. The variant that y is interpreted as similarity matrix if it is quadratic has been removedin version 1.3.2. Use heatmap instead.
3. If y has only one column, an error is displayed.
If plot is called for an ExClust object along with a matrix or data frame as argument y, then plotbehaves exactly the same as described in the previous paragraph.
If plot is called for an AggExResult object without specifying the second argument y, then adendrogram plot is drawn. This variant returns an invisible dendrogram object. The showSamples

38 plot
argument determines whether a complete dendrogram or a dendrogram of clusters is plotted (seeabove). If the option horiz=TRUE is used, the dendrogram is rotated. Note that, in this case, themargin to the right of the plot may not be wide enough to accommodate long cluster/sample labels.In such a case, the figure margins have to be widened before plot is called.
If plot is called for an AggExResult object along with a matrix or data frame y, y is again inter-preted as original data set. If one of the two arguments k or h is present, a clustering is cut outfrom the cluster hierarchy using cutree and this clustering is displayed with the original data set asdescribed above. This variant of plot returns an invisible ExClust object containing the extractedclustering.
Value
see details above
Author(s)
Ulrich Bodenhofer, Andreas Kothmeier & Johannes Palme <[email protected]>
References
http://www.bioinf.jku.at/software/apcluster
Bodenhofer, U., Kothmeier, A., and Hochreiter, S. (2011) APCluster: an R package for affinitypropagation clustering. Bioinformatics 27, 2463-2464. DOI: 10.1093/bioinformatics/btr406.
See Also
APResult, AggExResult, ExClust, heatmap-methods, apcluster, apclusterL, aggExCluster,cutree-methods
Examples
## create two Gaussian cloudscl1 <- cbind(rnorm(50, 0.2, 0.05), rnorm(50, 0.8, 0.06))cl2 <- cbind(rnorm(50, 0.7, 0.08), rnorm(50, 0.3, 0.05))x <- rbind(cl1, cl2)
## run affinity propagationapres <- apcluster(negDistMat(r=2), x, q=0.7, details=TRUE)
## plot information about clustering runplot(apres)
## plot clustering resultplot(apres, x)
## perform agglomerative clustering of affinity propagation clustersaggres1 <- aggExCluster(x=apres)
## show dendrogramsplot(aggres1)plot(aggres1, showSamples=TRUE)

preferenceRange 39
## show clustering result for 4 clustersplot(aggres1, x, k=4)
## perform agglomerative clustering of whole data setaggres2 <- aggExCluster(negDistMat(r=2), x)
## show dendrogramplot(aggres2)
## show heatmap along with dendrogramheatmap(aggres2)
## show clustering result for 2 clustersplot(aggres2, x, k=2)
## cluster iris data setdata(iris)apIris <- apcluster(negDistMat(r=2), iris, q=0)plot(apIris, iris)
preferenceRange Determine Meaningful Ranges for Input Preferences
Description
Determines meaningful ranges for affinity propagation input preference
Usage
## S4 method for signature 'matrix'preferenceRange(s, exact=FALSE)## S4 method for signature 'Matrix'preferenceRange(s, exact=FALSE)## S4 method for signature 'dgTMatrix'preferenceRange(s, exact=FALSE)## S4 method for signature 'sparseMatrix'preferenceRange(s, exact=FALSE)
Arguments
s an l × l similarity matrix in sparse or dense format
exact flag indicating whether exact ranges should be computed, which is relativelyslow; if bounds are sufficient, supply FALSE (default)

40 preferenceRange
Details
Affinity Propagation clustering relies on an appropriate choice of input preferences. This functionhelps in finding a good choice by determining meaningful lower and upper bounds.
If the similarity matrix s is sparse or if it contains -Inf similarities, only the similarities are takeninto account that are specified in s and larger than -Inf. In such cases, the lower bound returnedby preferenceRange need not correspond to one or two clusters. Moreover, it may also happenin degenerate cases that the lower bound exceeds the upper bound. In such a case, no warning orerror is issued, so it is the user’s responsibility to ensure a proper interpretation of the results. Themethod apclusterK makes use of this function internally and checks the plausibility of the resultreturned by preferenceRange.
Value
returns a vector with two entries, the first of which is the minimal input preference (which wouldlead to 1 or 2 clusters) and the second of which is the maximal input prefence (which would lead toas many clusters as data samples).
Author(s)
Ulrich Bodenhofer & Andreas Kothmeier <[email protected]>
References
http://www.bioinf.jku.at/software/apcluster
Frey, B. J. and Dueck, D. (2007) Clustering by passing messages between data points. Science 315,972-976. DOI: 10.1126/science.1136800.
Bodenhofer, U., Kothmeier, A., and Hochreiter, S. (2011) APCluster: an R package for affinitypropagation clustering. Bioinformatics 27, 2463-2464. DOI: 10.1093/bioinformatics/btr406.
See Also
apcluster
Examples
## create two Gaussian cloudscl1 <- cbind(rnorm(100, 0.2, 0.05), rnorm(100, 0.8, 0.06))cl2 <- cbind(rnorm(50, 0.7, 0.08), rnorm(50, 0.3, 0.05))x <- rbind(cl1, cl2)
## create similarity matrixsim <- negDistMat(x, r=2)
## determine boundspreferenceRange(sim)
## determine exact rangepreferenceRange(sim, exact=TRUE)

show-methods 41
show-methods Display Clustering Result Objects
Description
Display methods for S4 classes APResult, ExClust, and AggExResult
Usage
## S4 method for signature 'APResult'show(object)## S4 method for signature 'ExClust'show(object)## S4 method for signature 'AggExResult'show(object)
Arguments
object an object of class APResult, ExClust, or AggExResult
Details
show displays the most important information stored in object.
For APResult objects, the number of data samples, the number of clusters, the number of iterations,the input preference, the final objective function values, the vector of exemplars, the list of clustersand for leveraged clustering the selected sample subset are printed.
For ExClust objects, the number of data samples, the number of clusters, the vector of exemplars,and list of clusters are printed.
For AggExResult objects, only the number of data samples and the maximum number of clustersare printed. For retrieving a particular clustering level, use the function cutree.
For accessing more detailed information, it is necessary to access the slots of object directly. Usestr to get a compact overview of all slots of an object.
Value
show returns an invisible NULL
Author(s)
Ulrich Bodenhofer, Andreas Kothmeier & Johannes Palme <[email protected]>
References
http://www.bioinf.jku.at/software/apcluster
Bodenhofer, U., Kothmeier, A., and Hochreiter, S. (2011) APCluster: an R package for affinitypropagation clustering. Bioinformatics 27, 2463-2464. DOI: 10.1093/bioinformatics/btr406.

42 similarities
See Also
APResult, ExClust, AggExResult, cutree-methods
Examples
## create two Gaussian cloudscl1 <- cbind(rnorm(100, 0.2, 0.05), rnorm(100, 0.8, 0.06))cl2 <- cbind(rnorm(50, 0.7, 0.08), rnorm(50, 0.3, 0.05))x <- rbind(cl1, cl2)
## compute similarity matrix (negative squared Euclidean)sim <- negDistMat(x, r=2)
## run affinity propagationapres <- apcluster(sim)
## show details of clustering resultsshow(apres)
## apply agglomerative clustering to apresaggres <- aggExCluster(sim, apres)
## display overview of resultshow(aggres)
## show clustering level with two clustersshow(cutree(aggres, 2))
similarities Methods for Computing Similarity Matrices
Description
Compute similarity matrices from data set
Usage
negDistMat(x, sel=NA, r=1, method="euclidean", p=2)expSimMat(x, sel=NA, r=2, w=1, method="euclidean", p=2)linSimMat(x, sel=NA, w=1, method="euclidean", p=2)corSimMat(x, sel=NA, r=1, signed=TRUE, method="pearson")linKernel(x, sel=NA, normalize=FALSE)
Arguments
x input data to be clustered; if x is a vector, it is interpreted as a list of scalar val-ues that are to be clustered; if x is a matrix or data frame, rows are interpretedas samples and columns are interpreted as features; in the case that x is a data

similarities 43
frame, only numerical columns/features are taken into account, whereas cate-gorical features are neglected. If x is missing, all functions return a function thatcan be used as similarity measure, in particular, as s argument for apclusterL.
sel selected samples subset; vector of row indices for x in increasing order (seedetails below)
r exponent (see details below)
w radius (see details below)
signed take sign of correlation into account (see details below)
normalize see details below
method type of distance measure to be used; for negDistMat, expSimMat and linSimMat,this argument is analogous to the method argument of dist. For corSimMat, thisargument is analogous to the method argument of cor.
p exponent for Minkowski distance; only used for method="minkowski", other-wise ignored. See dist.
Details
negDistMat creates a square matrix of mutual pairwise similarities of data vectors as negativedistances. The argument r (default is 1) is used to transform the resulting distances by computingthe r-th power (use r=2 to obtain negative squared distances as in Frey’s and Dueck’s demos),i.e., given a distance d, the resulting similarity is computed as s = −dr. With the parameter sela subset of samples can be specified for distance calculation. In this case not the full distancematrix is computed but a rectangular similarity matrix of all samples (rows) against the subset(cols) as needed for leveraged clustering. Internally, the computation of distances is done usingan internal method derived from dist. All options of this function except diag and upper canbe used, especially method which allows for selecting different distance measures. Note that, sinceversion 1.4.4. of the package, there is an additional method "discrepancy" that implements Weyl’sdiscrepancy measure.
expSimMat computes similarities in a way similar to negDistMat, but the transformation of dis-tances to similarities is done in the following way:
s = exp
(−(d
w
)r)The parameter sel allows the creation of a rectangular similarity matrix. As above, r is an exponent.The parameter w controls the speed of descent. r=2 in conjunction with Euclidean distances cor-responds to the well-known Gaussian/RBF kernel, whereas r=1 corresponds to the Laplace kernel.Note that these similarity measures can also be understood as fuzzy equality relations.
linSimMat provides another way of transforming distances into similarities by applying the follow-ing transformation to a distance d:
s = max
(0, 1− d
w
)Thw parameter sel is used again for creation of a rectangular similarity matrix. Here w corre-sponds to a maximal radius of interest. Note that this is a fuzzy equality relation with respect to theLukasiewicz t-norm.

44 similarities
Unlike the above three functions, linKernel computes pairwise similarities as scalar products ofdata vectors, i.e. it corresponds, as the name suggests, to the “linear kernel”. Use parameter selto compute only a submatrix of the full kernel matrix as described above. If normalize=TRUE, thevalues are scaled to the unit sphere in the following way (for two samples x and y:
s =~xT~y
‖~x‖‖~y‖
The function corSimMat computes pairwise similarities as correlations. It uses link[stats:cor]{cor}internally. The method argument is passed on to link[stats:cor]{cor}. The argument r servesas an exponent with which the correlations can be transformed. If signed=TRUE (default), negativecorrelations are taken into account, i.e. two samples are maximally dissimilar if they are negativelycorrelated. If signed=FALSE, similarities are computed as absolute values of correlations, i.e. twosamples are maximally similar if they are positively or negatively correlated and the two samplesare maximally dissimilar if they are uncorrelated.
Note that the naming of the argument p has been chosen for consistency with dist and previousversions of the package. When using leveraged AP in conjunction with the Minkowski distance, thisleads to conflicts with the input preference parameter p of apclusterL. In order to avoid that, usethe above functions without x argument to create a custom similarity measure with fixed parameterp (see example below).
Value
All functions listed above return square or rectangular matrices of similarities.
Author(s)
Ulrich Bodenhofer, Andreas Kothmeier & Johannes Palme <[email protected]>
References
http://www.bioinf.jku.at/software/apcluster
Bodenhofer, U., Kothmeier, A., and Hochreiter, S. (2011) APCluster: an R package for affinitypropagation clustering. Bioinformatics 27, 2463-2464. DOI: 10.1093/bioinformatics/btr406.
Frey, B. J. and Dueck, D. (2007) Clustering by passing messages between data points. Science 315,972-976. DOI: 10.1126/science.1136800.
Micchelli, C. A. (1986) Interpolation of scattered data: distance matrices and conditionally positivedefinite functions. Constr. Approx. 2, 11-20.
De Baets, B. and Mesiar, R. (1997) Pseudo-metrics and T-equivalences. J. Fuzzy Math. 5, 471-481.
Bauer, P., Bodenhofer, U., and Klement, E. P. (1996) A fuzzy algorithm for pixel classificationbased on the discrepancy norm. In Proc. 5th IEEE Int. Conf. on Fuzzy Systems, volume III, pages2007–2012, New Orleans, LA. DOI: 10.1109/FUZZY.1996.552744.
See Also
dist, apcluster, apclusterL

sort-methods 45
Examples
## create two Gaussian cloudscl1 <- cbind(rnorm(100, 0.2, 0.05), rnorm(100, 0.8, 0.06))cl2 <- cbind(rnorm(100, 0.7, 0.08), rnorm(100, 0.3, 0.05))x <- rbind(cl1, cl2)
## create negative distance matrix (default Euclidean)sim1 <- negDistMat(x)
## compute similarities as squared negative distances## (in accordance with Frey's and Dueck's demos)sim2 <- negDistMat(x, r=2)
## compute RBF kernelsim3 <- expSimMat(x, r=2)
## compute similarities as squared negative distances## all samples versus a randomly chosen subset## of 50 samples (for leveraged AP clustering)sel <- sort(sample(1:nrow(x), nrow(x)*0.25))sim4 <- negDistMat(x, sel, r=2)
## example of leveraged AP using Minkowski distance with non-default## parameter pcl1 <- cbind(rnorm(150, 0.2, 0.05), rnorm(150, 0.8, 0.06))cl2 <- cbind(rnorm(100, 0.7, 0.08), rnorm(100, 0.3, 0.05))x <- rbind(cl1, cl2)
apres <- apclusterL(s=negDistMat(method="minkowski", p=2.5, r=2),x, frac=0.2, sweeps=3, p=-0.2)
show(apres)
sort-methods Sort clusters
Description
Rearrange clusters according to sort criterion
Usage
## S4 method for signature 'ExClust'sort(x, decreasing=FALSE,
sortBy=c("aggExCluster", "size","nameExemplar", "noExemplar"), ...)
46 sort-methods
Arguments
x object of class APResult or ExClustdecreasing logical indicating if sorting should be done in decreasing order, see details belowsortBy sort criterion, see details below... further arguments are ignored; only defined for S3 method consistency
Details
The function sort takes an APResult or ExClust clustering object x and creates a new clusteringobject of the same class, but with clusters arranged according to the sort criterion passed as argumentsortBy:
“aggExCluster” (default) order clusters as they would appear in the dendrogram produced byaggExCluster. This is also the same ordering in which the clusters are arranged by heatmap.Note that this only works if the similarity matrix is included in the input object x, otherwisean error message is produced.
“size” sorts clusters according to their size (from small to large).“nameExemplar” sorts clusters according to the names of the examplars (if available, otherwise
an error is produced).“noExemplar” sorts clusters according to the indices of the examplars.
If decreasing is TRUE, the order is reversed and, for example, sortBy="size" sorts clusters withsuch that the larger clusters come first.
Note that the cluster numbers of x are not preserved by sort, i.e. the cluster no. 1 of the objectreturned by sort is the one that has been ranked first by sort, which may not necessarily coincidewith cluster no. 1 of the original clustering object x.
Note that this is an S3 method (whereas all other methods in this package are S4 methods). This in-consistency has been introduced in order to avoid interoperability problems with the BiocGenericspackage which may overwrite the definition of the sort generic if it is loaded after the apclusterpackage.
Value
returns a copy of x, but with slots exemplars and clusters (see APResult or ExClust) reordered.
Author(s)
Ulrich Bodenhofer & Andreas Kothmeier <[email protected]>
References
http://www.bioinf.jku.at/software/apcluster
Bodenhofer, U., Kothmeier, A., and Hochreiter, S. (2011) APCluster: an R package for affinitypropagation clustering. Bioinformatics 27, 2463-2464. DOI: 10.1093/bioinformatics/btr406.
See Also
APResult, ExClust

sort-methods 47
Examples
## create two Gaussian cloudscl1 <- cbind(rnorm(50,0.2,0.05),rnorm(50,0.8,0.06))cl2 <- cbind(rnorm(50,0.7,0.08),rnorm(50,0.3,0.05))x <- rbind(cl1,cl2)
## run affinity propagationapres <- apcluster(negDistMat(r=2), x, q=0.7)
show(apres)## show dendrogramplot(aggExCluster(x=apres))
## default sort order: like in heatmap or dendrogramshow(sort(apres))
## show dendrogram (note the different cluster numbers!)plot(aggExCluster(x=sort(apres)))
## sort by sizeshow(sort(apres, decreasing=TRUE, sortBy="size"))

Index
∗Topic classesAggExResult-class, 7APResult-class, 20ExClust-class, 29
∗Topic clusteraggExCluster, 4apcluster, 9apcluster-deprecated, 13apclusterDemo, 13apclusterK, 14apclusterL, 17coerce-methods, 23conversions, 25cutree-methods, 27heatmap, 31labels-methods, 34plot, 36preferenceRange, 39show-methods, 41similarities, 42sort-methods, 45
∗Topic datasetsch22Promoters, 22
∗Topic methodsaggExCluster, 4apcluster, 9coerce-methods, 23cutree-methods, 27heatmap, 31labels-methods, 34plot, 36show-methods, 41sort-methods, 45
∗Topic packageapcluster-package, 2
[,APResult,index,missing,missing-method(APResult-class), 20
[,AggExResult,index,missing,missing-method(AggExResult-class), 7
[,ExClust,index,missing,missing-method(ExClust-class), 29
[[,APResult,index,missing-method(APResult-class), 20
[[,AggExResult,index,missing-method(AggExResult-class), 7
[[,ExClust,index,missing-method(ExClust-class), 29
aggExCluster, 2, 4, 7, 8, 24, 30, 32, 33, 38, 46aggexcluster (aggExCluster), 4aggExCluster,character,ANY-method
(aggExCluster), 4aggExCluster,function,ANY-method
(aggExCluster), 4aggExCluster,Matrix,ExClust-method
(aggExCluster), 4aggExCluster,matrix,ExClust-method
(aggExCluster), 4aggExCluster,Matrix,missing-method
(aggExCluster), 4aggExCluster,matrix,missing-method
(aggExCluster), 4aggExCluster,missing,ExClust-method
(aggExCluster), 4aggExCluster-methods (aggExCluster), 4AggExResult, 4–7, 23, 24, 27–33, 36–38, 41,
42AggExResult (AggExResult-class), 7aggexresult (AggExResult-class), 7AggExResult-class, 7apcluster, 2, 4, 9, 13–16, 18, 20–22, 24, 33,
37, 38, 40, 44apcluster,character,ANY-method
(apcluster), 9apcluster,dgTMatrix,missing-method
(apcluster), 9apcluster,function,ANY-method
(apcluster), 9
48

INDEX 49
apcluster,Matrix,missing-method(apcluster), 9
apcluster,matrix,missing-method(apcluster), 9
apcluster,sparseMatrix,missing-method(apcluster), 9
apcluster-deprecated, 13apcluster-methods (apcluster), 9apcluster-package, 2apclusterDemo, 13apclusterK, 11, 12, 14, 19, 40apclusterK,character,ANY-method
(apclusterK), 14apclusterK,dgTMatrix,missing-method
(apclusterK), 14apclusterK,function,ANY-method
(apclusterK), 14apclusterK,Matrix,missing-method
(apclusterK), 14apclusterK,matrix,missing-method
(apclusterK), 14apclusterK,sparseMatrix,missing-method
(apclusterK), 14apclusterK-methods (apclusterK), 14apclusterL, 2, 14, 17, 20, 22, 24, 33, 38, 43,
44apclusterL,character,ANY-method
(apclusterL), 17apclusterL,function,ANY-method
(apclusterL), 17apclusterL,matrix,missing-method
(apclusterL), 17apclusterL-methods (apclusterL), 17APResult, 2, 4, 5, 10–12, 14–16, 18–20, 23,
24, 27–38, 41, 42, 46APResult (APResult-class), 20apresult (APResult-class), 20APResult-class, 20as.dendrogram (coerce-methods), 23as.dendrogram,AggExResult-method
(coerce-methods), 23as.dendrogram,ExClust-method
(coerce-methods), 23as.DenseSimilarityMatrix, 13as.DenseSimilarityMatrix (conversions),
25as.DenseSimilarityMatrix,Matrix-method
(conversions), 25
as.DenseSimilarityMatrix,matrix-method(conversions), 25
as.DenseSimilarityMatrix,sparseMatrix-method(conversions), 25
as.DenseSimilarityMatrix-method(conversions), 25
as.hclust (coerce-methods), 23as.hclust,AggExResult-method
(coerce-methods), 23as.hclust,ExClust-method
(coerce-methods), 23as.SparseSimilarityMatrix
(conversions), 25as.SparseSimilarityMatrix,Matrix-method
(conversions), 25as.SparseSimilarityMatrix,matrix-method
(conversions), 25as.SparseSimilarityMatrix,sparseMatrix-method
(conversions), 25as.SparseSimilarityMatrix-methods
(conversions), 25
ch22Promoters, 22coerce-methods, 23conversions, 25cor, 43corSimMat (similarities), 42cutree, 8, 28, 29, 35, 38, 41cutree (cutree-methods), 27cutree,AggExResult-method
(cutree-methods), 27cutree,APResult-method
(cutree-methods), 27cutree-methods, 27
dendrogram, 24, 32, 37dgTMatrix, 10, 26dist, 43, 44
ExClust, 4, 5, 8, 20, 23, 24, 28, 29, 31–38, 41,42, 46
ExClust (ExClust-class), 29exclust (ExClust-class), 29ExClust-class, 29expSimMat (similarities), 42
filled.contour, 32
hclust, 5, 7, 24

50 INDEX
heatmap, 31, 31, 32, 33, 37, 46heatmap,AggExResult,matrix-method
(heatmap), 31heatmap,AggExResult,missing-method
(heatmap), 31heatmap,ExClust,Matrix-method
(heatmap), 31heatmap,ExClust,matrix-method
(heatmap), 31heatmap,ExClust,missing-method
(heatmap), 31heatmap,ExClust,sparseMatrix-method
(heatmap), 31heatmap,matrix,missing-method
(heatmap), 31heatmap,missing,matrix-method
(heatmap), 31heatmap-methods (heatmap), 31
image, 32, 33
kmeans, 34
labels (labels-methods), 34labels,APResult-method
(labels-methods), 34labels,ExClust-method (labels-methods),
34labels-methods, 34length, 10, 15, 18length,AggExResult-method
(AggExResult-class), 7length,APResult-method
(APResult-class), 20length,ExClust-method (ExClust-class),
29linKernel (similarities), 42linSimMat (similarities), 42
Matrix, 10, 26matrix, 26
negDistMat (similarities), 42
plot, 24, 32, 36, 37plot,AggExResult,data.frame-method
(plot), 36plot,AggExResult,matrix-method (plot),
36
plot,AggExResult,missing-method (plot),36
plot,APResult,missing-method (plot), 36plot,ExClust,data.frame-method (plot),
36plot,ExClust,matrix-method (plot), 36plot,ExClust,missing-method (plot), 36plot-methods (plot), 36plot.dendrogram, 37preferenceRange, 11, 12, 15, 16, 19, 39preferenceRange,dgTMatrix-method
(preferenceRange), 39preferenceRange,Matrix-method
(preferenceRange), 39preferenceRange,matrix-method
(preferenceRange), 39preferenceRange,sparseMatrix-method
(preferenceRange), 39preferenceRange-methods
(preferenceRange), 39
rainbow, 31
show (show-methods), 41show,AggExResult-method (show-methods),
41show,APResult-method (show-methods), 41show,ExClust-method (show-methods), 41show-methods, 41similarities, 42similarity (APResult-class), 20similarity,AggExResult-method
(AggExResult-class), 7similarity,APResult-method
(APResult-class), 20similarity,ExClust-method
(ExClust-class), 29sort (sort-methods), 45sort,APResult-method (sort-methods), 45sort,ExClust-method (sort-methods), 45sort-methods, 45sparseMatrix, 26sparseToFull (apcluster-deprecated), 13str, 41