dev.globus/wiki/Incubator/Introduce Shannon Hastings [email protected]
Upload
hoangduongCategory
view
216download
0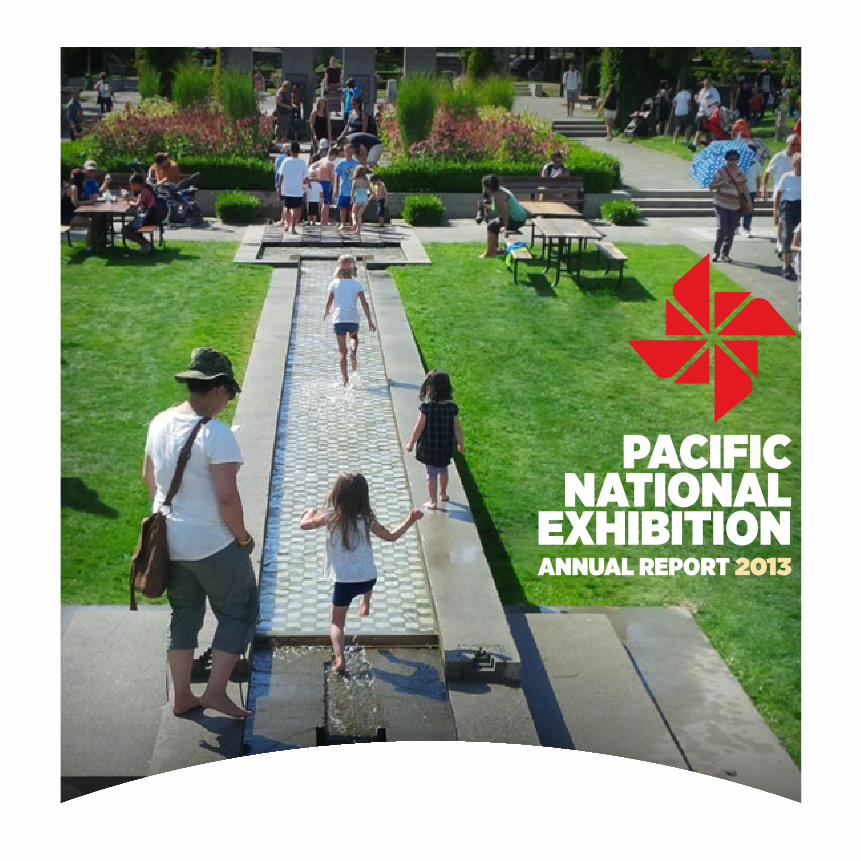
PACIFIC NATIONAL
EXHIBITIONANNUAL REPORT 2013

ANNUAL REPORT 2013
CONTENTS
3 Message from the Chair of the Board of Directors and the President and Chief Executive Officer
4 Highlights From Fiscal 2013
6 Introduction
6 The PNE’s Role at Hastings Park
7 The PNE’s Role in the Community and at the Heart of Hastings Sunrise
9 The PNE’s Role beyond Hastings Park
11 Plans for a Bright Future — Update on the Hastings Park Master Planning Process
13 PNE Business Results 2013
14 Playland
17 Fright Nights
18 The Fair at the PNE
23 PNE Prize Home Lottery
24 Year-Round Events
30 Park and Facility Maintenance
31 Commitment to Sustainability
32 Corporate Initiatives
32 Event Management Initiatives
33 Facilities Initiatives
34 Celebrating Team and Success
36 A Bright Future 39 Financial Reports
41 Report of Management’s Responsibility for Financial Statements
42 Corporate Governance
43 Independent Auditors’ Report
44 Statement of Financial Position
45 Statements of Operations and Accumulated Surplus
46 Statements of Changes in Net Debt
47 Statement of Cash Flows
48 Notes to Financial Statements
BOLLYWOOD WEDDING
1

BALLOON EXPLORERS
2
ANNUAL REPORT 2013
MESSAGE FROM THE CHAIR OF THE BOARD OF DIRECTORS AND THE PRESIDENT AND CHIEF EXECUTIVE OFFICERThe 2013 fiscal year was extremely positive for the PNE. This comes as a result of solid business planning, strong execution, well planned investment choices and cooperative weather. New business strategies were introduced, costs were effectively managed and we look forward to sharing all the highlights of this organizations 103rd year of operation in the pages that follow. We also recognize that a big part of this success comes from the efforts of staff and management who make this organization great, by providing a foundation of forward thinking and resilience to withstand challenges. We would like to take this opportunity to personally thank the PNE staff team for their tireless effort and the Board of Directors for their ongoing support and contributions to the organization throughout the year.
Fiscal 2013 was a very positive year across all activity streams. The PNE generated $45.56 million in total revenues and $329,127 in positive net income. The organization implemented year one of a five year strategic plan to rejuvenate the Fair. This included closing on the two first Mondays to save operational costs, making the event more financially efficient, as well as lowering the gate admission and parking prices by 20% to make The Fair more affordable for families. Strategic investments in two new family rides in Playland, along with great weather and a slightly adjusted operation schedule resulted in increased attendance, revenues and net income for 2013. Fright Nights also experienced very good weather and this, along with adjustments to the operational calendar and pricing structure, resulted in record breaking revenues and second highest attendance ever at Fright Nights. Year round events had a very strong year with increased trade and consumer show business and increased film revenues. Concert business held strong and combined with increased revenues from the implementation of a new ticketing system, year round event revenue and net contribution were both up from 2012. In summary, the PNE had a great year in 2013 and not only delivered a positive net income for this year but has delivered an overall positive impact of $4.4 million invested back into the site and facilities since 2002. This is over and above the $3 million budgeted annually for park and facility maintenance through regular operations.
Throughout the year, execution of the initial phases of the Hastings Park Master Plan were implemented. Creekway Park was opened in September 2013, construction continued on Empire Fields improvements and signage plans and greenways are being developed throughout the site. The Playland Master Plan is in development and the future remains very bright for the PNE. We will continue to embrace working with the City of Vancouver on the development of this vibrant urban public park and we remain committed to supporting the local community, to improving our environmental footprint and to providing diverse and unique entertainment that brings people together to celebrate.
We look forward to making continual improvements to the park and our operations in the years to come and invite you to visit us at Hastings Park in 2014.
Raymond Louie Michael McDaniel Chair, Board of Directors President and Chief Executive Officer
3
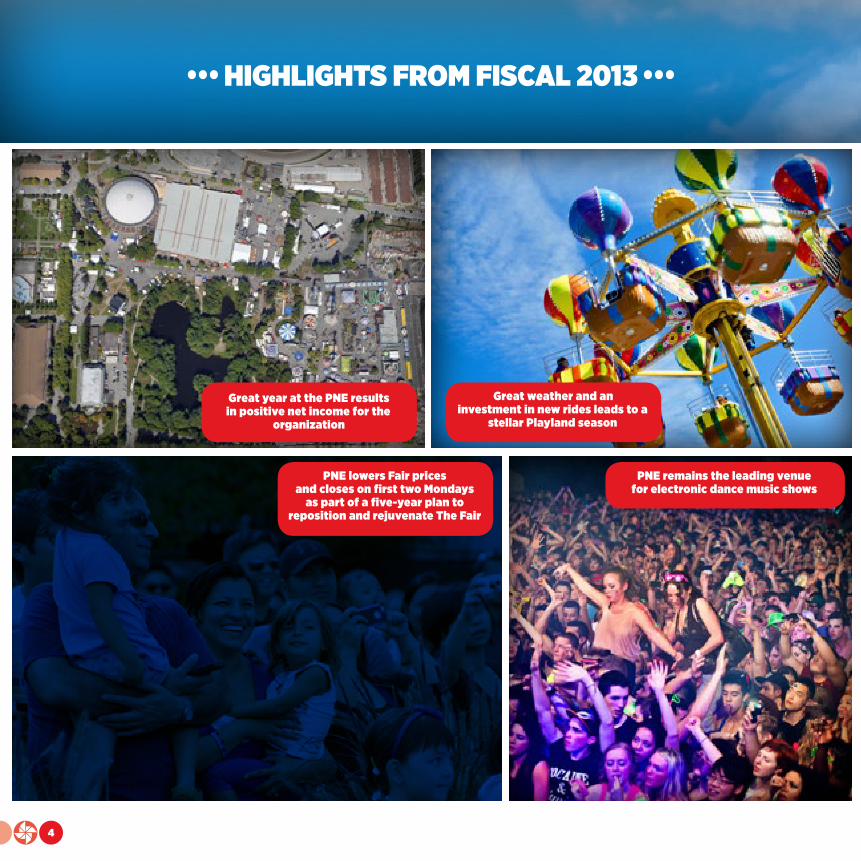
Great year at the PNE results in positive net income for the
organization
PNE lowers Fair prices and closes on first two Mondays
as part of a five-year plan to reposition and rejuvenate The Fair
Great weather and an investment in new rides leads to a
stellar Playland season
PNE remains the leading venue for electronic dance music shows
••• HIGHLIGHTS FROM FISCAL 2013 •••
4

ANNUAL REPORT 2013
PNE continues expansion of tradeshow and consumer show business
Canada’s National Truth and Reconciliation BC events hosted at the PNE
Decision on governance of Hastings Park results in
wins all around
PNE has record-breaking year in group sales attendance
Sustainability and community investment remain top priorities
(APRIL 1, 2013 – MARCH 31, 2014)
5

INTRODUCTIONThe fiscal year of 2013 reflected positively across all business streams. Solid business planning and execution was supported by great weather and resulted in a net win across all activity streams. As part of its five-year plan, the PNE lowered admission and parking prices for The Fair, making this annual summer tradition more accessible for families. This initiative, combined with new investment into Playland and Fright Nights, the continued diversification of year-round events, an expanding consumer and tradeshow market, and strong film activity all contributed to an extremely positive year for the organization.
Operating such weather-dependent activity streams often means that financial results are variable from year to year. With more than 100 years of experience on-site, the PNE understands this and has been able to mitigate the highs and lows in order to produce an operating surplus in nine of the last 11 years, including 2013. This continues to illustrate a high level of success in a volatile industry, with the PNE creating an overall positive impact of $4.4 million invested back into the site and facilities since 2002.
As the PNE enters its 104th year of operation, the future remains very bright. Implementation of the approved Master Plan for Hastings Park will deliver a solid foundation for the growth of the company and the enjoyment of park amenities. In August 2013, Vancouver City Council decided that the long-term governance of Hastings Park would remain with the PNE and the PNE Board of Directors while also providing for increased community input. The first changes of a five-year plan to reinvigorate the Fair at the PNE were implemented in 2013, and continued investments into Playland and Fright Nights attractions will keep guests returning. Additionally, continuing to diversify the year-round event portfolio and the execution of several new business development ideas in 2014 will provide a strong base for ongoing success.
THE PNE’S ROLE AT HASTINGS PARKHastings Park is a 165-acre parcel of land granted to the City of Vancouver in 1889 via the Hastings Park Trust. The PNE is owned by the City of Vancouver and operates from this City-owned land. The organization operates four activity streams and governs the facilities and outdoor spaces at Hastings Park. Great Canadian Gaming operates the racetrack through a separate operating agreement with the City of Vancouver and Empire Fields are operated by the Vancouver Park Board.
The largest and most well-known activ-ity stream is the Fair at the PNE, that iconic and 103-year-old summer event that draws 800,000 guests from across British Columbia to be entertained and to experience a range of foods, rides and exhibits. This event accounts for almost 50% of the PNE’s annual reve-nues. The PNE’s second activity stream is Playland Amusement Park. Playland is open A p r i l t h ro u g h October each year and entertains more than 375,000 guests (outside of Fair-time) with games, food and 35+ rides and attrac-tions. This activity stream accounts for approximately 25% of the PNE’s annual revenues. The third activity stream is the year-round events portfolio. This includes the use of all of the on-site facilities to host concerts, sporting events, festivals, and cultural and community events, and accounts for
the remaining 25% of the PNE’s annual revenues. The fourth activity stream is facility maintenance and park develop-ment. The PNE is solely responsible for the care and upkeep of indoor facilities such as the Pacific Coliseum, PNE Forum, Agrodome, Rollerland, Livestock building and Garden Auditorium. The PNE also ensures that outdoor spaces — including the Sanctuary, Italian Gardens, Momiji Garden, centre grounds and all outdoor spaces — blossom and thrive. The organi-zation has specially trained horticultural teams on staff to ensure that the public park, Italian Gardens, Momiji Garden and the Sanctuary remain in their naturally intended states. While this activity stream does not generate revenues, the
care of the facilities and grounds is a regularly budgeted expense.
In 2013, the PNE invested approximately $3
million in park care to ensure that the site remains well taken care of and ready to be enjoyed year-
round. To ensure best practices for
park spaces , the PNE collaborates with
Vancouver Park Board staff throughout the year; their valuable
input is reflected throughout the site.
The PNE is governed by a Board of Directors that includes leaders from the community, industry, the Vancouver Park Board and the City of Vancouver. It also includes elected officials from Vancouver City Council and Vancouver Park Board. Because Hastings Park is so vibrant and
BECAUSE HASTINGS PARK IS
SO VIBRANT AND ACTIVE, SOME PEOPLE THINK WE ARE
A COMMERCIAL COMPANY, BUT THE PNE IS — AND ALWAYS HAS
BEEN — A NOT-FOR-PROFIT ORGANIZA-TION. ONE HUNDRED PER CENT OF
PROCEEDS ARE INVESTED BACK INTO THE SITE, FACILITIES AND
PROGRAMS, AND INTO THE UPKEEP OF THE GREEN
SPACE.
6

ANNUAL REPORT 2013
THE PNE’S ROLE IN THE COMMUNITY AND AT THE HEART OF HASTINGS SUNRISESince 1910, the PNE has proudly been at the heart of Hastings Park and the Hastings Sunrise community. The organization remains committed to positively impacting the neighbourhood that it has been part of for more than 103 years, as well as recognizing and helping to mitigate any negative impacts.
Within the park, the PNE supports community activities and the use of the public space through maintenance of the grounds and facilities and through financial subsidy of programs. This includes providing over 745 hours of community ice programs throughout the year for 16 hockey and skating groups in the Agrodome, at rates equivalent to those offered by community rinks. The PNE also provides a low-cost home exclusively for the CircusWest training school in the Garden Auditorium for 11 months each year and provides subsidized venue rentals for a variety of local non-profit and community groups. The PNE partners with a variety of local schools, sport groups and non-profit organizations to support their initiatives, from fundraising to student leadership. The PNE also offers complimentary space and management support for a variety of events coordinated by neighbourhood groups including the LightWaterDrums Festival, Hasting North Community Partners Groups, Templeton School Hub Grade 7 Conference, Magpie’s Nest Community Art Group (pop-up location) and practice space for the Radiant Heat fire performance group.
The PNE is also one of the biggest local supporters of the Hastings Community Little League (HCLL). For over 50 years, the HCLL has provided thousands of children with the opportunity to have fun while being active and learning valuable skills such as teamwork. The PNE provides a complimentary Playland PlayPass to over 400 league players each year plus free indoor practice space. The PNE also provides the organization with fundraising opportunities to help fund upgrades to the ball diamonds for the upcoming 2016 National Championships. These efforts include Community Day in Playland, where a portion of every Playland PlayPass is donated to HCLL. To date, over $67,000 has been raised for HCLL through this initiative.
In addition, every year at the end of September, the PNE hosts local Hast-ings Sunrise schools at Empire Field for the annual Terry Fox National School Run Day. The schools raise awareness and funds for The Terry Fox Foundation and run a course in the park to promote physical activity. The PNE provides logistical support as well as snacks and water for the kids. In 2013, over 1,750 kids from 10 schools participated in the 9th annual Terry Fox Run at Hastings Park.
••• LITTLE-KNOWN FACTS ••• ABOUT THE PNE
The PNE is a non-profit registered charity and, as a financially viable non-profit entity, all profits are
invested back into the site and its facilities
The organization is owned by the City of Vancouver
Hastings Park is a parcel of land held in trust for the City of Vancouver and is managed and operated
by the PNE on behalf of the City
The PNE manages Hastings Park, with the exceptions of the racetrack, which is operated by Great Canadian Gaming, and
Empire Field, which is under the care of the Vancouver Park Board
Company executives report to a Board of Directors that includes business and community leaders, as well as
elected officials and senior staff from the City of Vancouver and the Vancouver Park Board
The PNE is the largest employer of youth in British Columbia, providing a range of much-needed first jobs that build essential
skills for the next generation of workers and leaders
active, some people think we are a commercial company, but the PNE is — and always has been — a not-for-profit organization. One hundred per cent of proceeds are invested back into the site, facilities and programs, and into the upkeep of the green space.
The PNE has proudly managed and governed Hastings Park since it was granted in trust to the City more than a century ago. During that time, the PNE has gained 100 years of experience with, and knowledge of, this unique site. The fine balance of community and commercial uses on-site is critical to providing the PNE with the financial flexibility to invest millions annually in supporting community use of the site and in enhancing the park areas.
7

As part of its efforts to minimize the impact of its operations on the neighbourhood during large events like The Fair, the PNE operates the Neighbourhood Clean-Up Crew and Neighbour-hood Bike Patrol programs to help keep the residential areas clean and safe. The rental of local school parking lots during The Fair helps reduce neighbourhood parking impacts and provides the schools with funding to support the programs of their choice. The PNE also engages local businesses and neighbours with complimentary tickets to attend PNE events. To ensure ongoing access to the park, the PNE provides residents in the Hastings Sunrise area with access to special passes so residents can continue to enjoy paths for jogging and other regular park activities during The Fair.
On July 28, 2013, the PNE also hosted its second annual community BBQ at Hastings Park, with local neighbours invited to enjoy complimentary food and beverages, activities and prizes. More than 550 neighbours came out to enjoy this free day of fun — this is just one way that the PNE says “Thank you for being great neighbours”.
While the PNE receives unparalleled support from many neighbours and the vast majority of Vancouver residents, the PNE management team remains fully committed to consulting with the community, minimizing negative impacts, and enhancing our positive influences now and into the future.
••• GIVING BACK IN 2013 •••
• The PNE provided over 13,400 tickets to local residents so they can come enjoy PNE events. This was an increase of almost 13% in tickets over 2012.
• Over 3,480 tickets were donated to 598 non-profit organizations and kids programs through various ticket donation programs. Examples of recipient groups included the CKNW Orphans’ Fund, the MS Society of Canada, the Make-A-Wish Foundation, the Prostate Cancer Foundation BC and the Canadian Diabetes Association.
• An additional 2,199 tickets were donated to 16 schools and several local organizations through our local community ticket donation program. Recipients included local elementary, middle and high schools as well as community groups like Hastings Community Centre, Kiwassa Neighbourhood House, Hastings North Business Improve-ment Association and Hastings Sunrise Community Policing Centre.
• The PNE also uses the electronic readerboard at the corner of Hastings and Renfrew to run complimentary messages for local non-profits. In 2013, messages ran on behalf of a number of organizations including BC Transplant, The Terry Fox Foundation, Hastings Park Conservancy and CircusWest Performing Arts Society.
• Each year, the PNE selects 12 community-minded youth ages 16–18 from across the Lower Mainland to sit on the PNE Youth Council for
a one-year term. The Council provides leadership opportunities, and allows its members to learn about the organization and a range of business and community topics. The council also provides the PNE with insights for the future. This year, council members represented Vancouver, Burnaby, Coquitlam and North Vancouver.
Although the PNE itself is a non-profit registered charity, we continue to take great pride in generously giving back to other local organizations that are doing work to support our shared communities.
The PNE understands that celebrations and events may bring both positive and negative impacts to the surrounding neighbourhood and remains committed to minimizing negative impacts and to supporting our local community. The PNE continues to be very proud of the role it plays in this regard and continues to develop and implement award-winning outreach programs. A few examples of programs implemented by the PNE to help mitigate event day impacts include the daily Neighbourhood Clean-Up Crew during The Fair, a bike security team that patrols the neighbourhood during The Fair and Fright Nights, and a community access pass that allows residents to use park facilities during The Fair. In addition, the PNE works diligently at each event to ensure the sound bylaws are met.
8
ANNUAL REPORT 2013
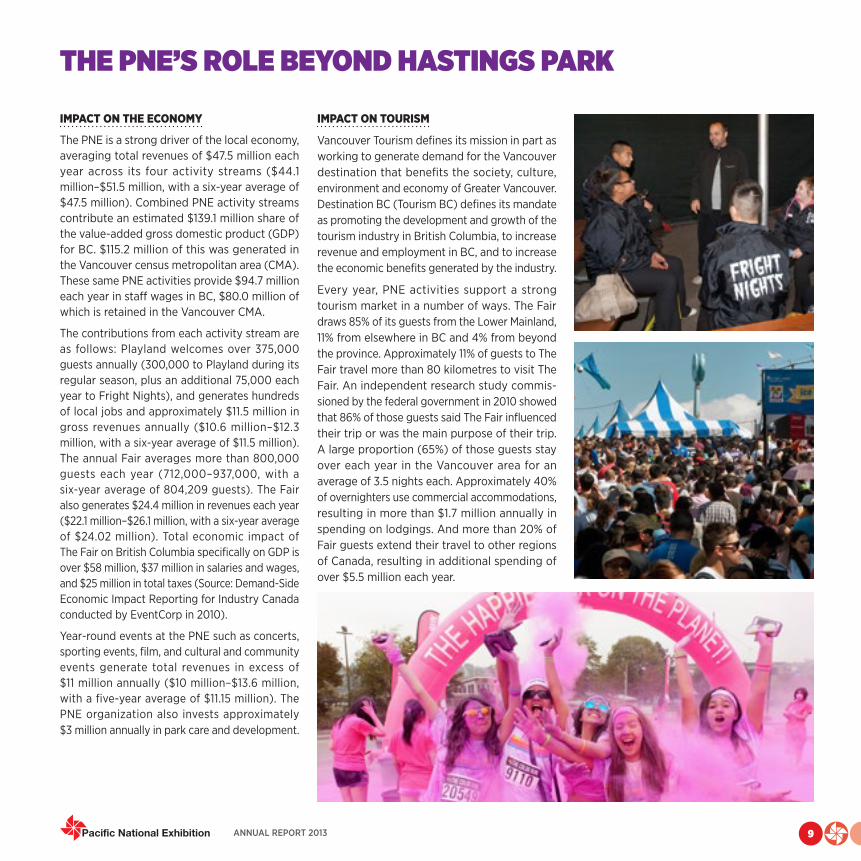
THE PNE’S ROLE BEYOND HASTINGS PARK
IMPACT ON THE ECONOMY
The PNE is a strong driver of the local economy, averaging total revenues of $47.5 million each year across its four activity streams ($44.1 million–$51.5 million, with a six-year average of $47.5 million). Combined PNE activity streams contribute an estimated $139.1 million share of the value-added gross domestic product (GDP) for BC. $115.2 million of this was generated in the Vancouver census metropolitan area (CMA). These same PNE activities provide $94.7 million each year in staff wages in BC, $80.0 million of which is retained in the Vancouver CMA.
The contributions from each activity stream are as follows: Playland welcomes over 375,000 guests annually (300,000 to Playland during its regular season, plus an additional 75,000 each year to Fright Nights), and generates hundreds of local jobs and approximately $11.5 million in gross revenues annually ($10.6 million–$12.3 million, with a six-year average of $11.5 million). The annual Fair averages more than 800,000 guests each year (712,000–937,000, with a six-year average of 804,209 guests). The Fair also generates $24.4 million in revenues each year ($22.1 million–$26.1 million, with a six-year average of $24.02 million). Total economic impact of The Fair on British Columbia specifically on GDP is over $58 million, $37 million in salaries and wages, and $25 million in total taxes (Source: Demand-Side Economic Impact Reporting for Industry Canada conducted by EventCorp in 2010).
Year-round events at the PNE such as concerts, sporting events, film, and cultural and community events generate total revenues in excess of $11 million annually ($10 million–$13.6 million, with a five-year average of $11.15 million). The PNE organization also invests approximately $3 million annually in park care and development.
IMPACT ON TOURISM
Vancouver Tourism defines its mission in part as working to generate demand for the Vancouver destination that benefits the society, culture, environment and economy of Greater Vancouver. Destination BC (Tourism BC) defines its mandate as promoting the development and growth of the tourism industry in British Columbia, to increase revenue and employment in BC, and to increase the economic benefits generated by the industry.
Every year, PNE activities support a strong tourism market in a number of ways. The Fair draws 85% of its guests from the Lower Mainland, 11% from elsewhere in BC and 4% from beyond the province. Approximately 11% of guests to The Fair travel more than 80 kilometres to visit The Fair. An independent research study commis-sioned by the federal government in 2010 showed that 86% of those guests said The Fair influenced their trip or was the main purpose of their trip. A large proportion (65%) of those guests stay over each year in the Vancouver area for an average of 3.5 nights each. Approximately 40% of overnighters use commercial accommodations, resulting in more than $1.7 million annually in spending on lodgings. And more than 20% of Fair guests extend their travel to other regions of Canada, resulting in additional spending of over $5.5 million each year.
9
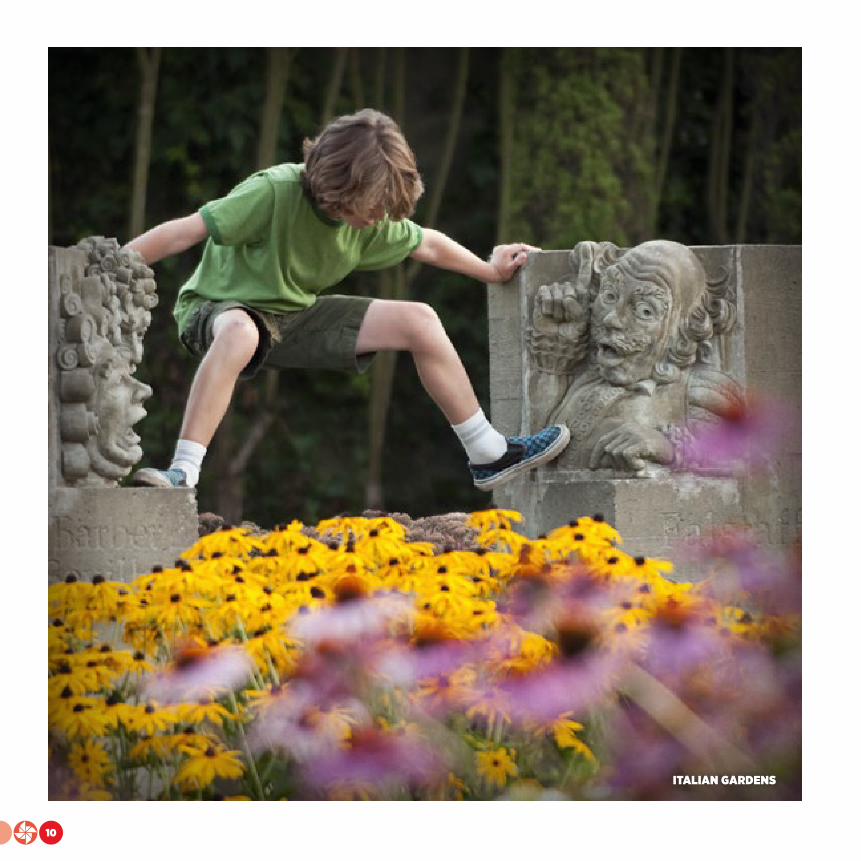
ITALIAN GARDENS
10

ANNUAL REPORT 2013
PLANS FOR A BRIGHT FUTURE — UPDATE ON THE HASTINGS PARK MASTER PLANNING PROCESSSince 2004, the City of Vancouver has been working to define the future of Hastings Park and the PNE through a Master Planning Process. In December of 2010, a significant milestone was reached in this planning — Vancouver City Council adopted a $250 million 25-year Hastings Park/PNE Master Plan. This plan guides the long-range redevelopment of Hastings Park. Then in August 2013, a further milestone was reached when Vancouver City Council completed its governance review and voted that long-term governance of Hastings Park should remain with the PNE. This decision allows the PNE and the PNE Board of Directors to plan holistically for the future with the long-term interest of the PNE, park space and increased community involvement in mind.
Through implementation of the Master Plan, Hastings Park will be transformed into a greener year-round destination with space for festivals, culture, sport and recreation, leisure and fun. The Plan provides for new and renewed facilities
on-site, with the amount of park space almost tripling, from 27 acres to 76 acres. This revital-ized Hastings Park will provide expanded green spaces that link to the City’s green corridors, quiet blooming gardens, and pathways to and from every corner of the site. Facilities will be redeveloped to enable celebrations, festivals, sport, music and family entertainment, as well as to facilitate the growth and evolution of that beloved end-of-summer tradition, the Fair at the PNE, which is the largest event in BC. Playland will remain at the heart of Hastings Park. Softer landscapes and more space will allow Playland to expand and thrive as it continues to thrill families and kids of every age.
The Master Plan is also an opportunity to significantly improve the sustainability and ecological performance of Hastings Park and the PNE, consistent with Vancouver City Coun-cil’s Greenest City Action Plan priorities. The Master Plan achieves the challenging balance
of providing a significantly greener and more publicly accessible Hastings Park while renewing Vancouver’s historic annual Fair and amusement park, and ensuring the PNE’s economic vitality and long-term sustainability.
With the Hastings Park/PNE Master Plan now approved, 2013 marked the successful implementation of several aspects of Phase 1. A redeveloped Creekway Park with a stronger connection to New Brighton Park was officially opened in September 2013, and much progress was made on defining new park greenways and signage plans throughout the site. Reinstatement of Empire Fields is also well underway. All of these park developments focus on key community priorities: creating additional park space and improving access to Hastings Park.
Ongoing information on the Hastings Park/PNE Master Plan can be found at www.vancouver.ca/pnepark.
11

“PLAYLAND HAD A VERY STRONG
SEASON BUOYED BY GOOD WEATHER, STRONG GROUP
SALES ACTIVITY AND INCREASED TRAFFIC
FROM THE FAMILY DEMOGRAPHIC…”
12

ANNUAL REPORT 2013
PNE BUSINESS RESULTS 2013While 2012 brought with it exciting business development initiatives as well as some challenges, 2013 in contrast was a very positive year across all activity streams. Playland had a very strong season buoyed by good weather, strong group sales activity and increased traffic from the family demographic in response to the PNE’s investment in two new family rides (Teacups and Balloon Explorers). This was also year one of a five-year strategic plan to rejuvenate The Fair; while attendance was slightly down over 2012, revenues were strong and several initiatives were introduced that helped set the framework for growth in future Fairs. Fright Nights had record-breaking revenues and second highest attendance ever. Year-round events showed tremendous strength, demonstrated by several high profile and unique events such as the Truth and Reconciliation Commission of Canada’s BC National Event hosted on-site, a concert supporting The Times
of India Film Awards (TOIFA), and the introduction of the first annual Vancouver Collector Car Show & Auction. The PNE and Hastings Park are truly the venue of choice for large-scale, complex events that require a wide range of resources, spaces and expertise. As well, the PNE’s outdoor Amphitheatre gained momentum, hosting two very successful outdoor summer concerts. Ultimately, successes across all activity streams resulted in a positive net contribution of $329,127 to the organization for Fiscal 2013.
The PNE has a solid foundation and a strong record of producing a net surplus. Over the past 12 years, despite very weather-dependent activ-ity streams and the decade’s economic slowdown, the organization has produced a total positive net contribution of $4.4 million invested back into the site and facilities. Following is a summary of both qualitative and quantitative results across PNE activity streams for 2013.
13

Playland Playland is an iconic part of youth culture in the Lower Mainland. Considered BC’s premier amusement park, it caters primarily to the teen thrill ride market (ages 12–24) but has also built a strong family demographic for families with young children. Playland has all of the traditional midway games, food, rides and attractions that one would expect in a regional amusement park and, in 2013, the park was open for 90 operating days, from May 4 through September 22. A key highlight for the 2013 season was the introduction of two new family rides: Teacups and Balloon Explorers. Rides designated as kids rides are ones that only small children can go on; rides designated as family rides are designed for young kids, but their parents can go on the rides with them. This is a key differentiator, as the strategy to grow Playland’s family demographic will be somewhat dependent on introducing rides that the whole family can enjoy together, which will engage kids of all ages as well as the parents. Response to these new rides was very positive — the park saw a definite increase in family traffic throughout the season.
For the fifth straight season, the price of regular admission to Playland remained unchanged, although prices were adjusted to a “tax in” price rather than a “plus tax” price. The prices of the Junior PlayPass and Guardian PlayPass were increased slightly as a result of the new family ride investment, but overall, Playland’s pricing structure has remained very competitive in the local attractions market and the team has worked hard to ensure a strong value proposition. In 2013, the park welcomed 300,157 guests, a 5.5% increase
over 2012 (see Figure 1 for a six-year history).
Playland also had a very strong season financially. Total revenues for 2013 were $12.29 million, an increase
of more than 16% over the 2012 season (see Figure 2 for a six-year history). Playland’s net
contribution was also up by 28% at $6.59 million (see Figure 3 for a six-year history).
In addition to the attendance bump resulting from the new ride investments, Playland also had record-breaking attendance from group sales initiatives. In 2013, a total of 73,086 guests came to Playland as part of an organized, pre-
arranged group. 28,656 of those guests attended Playland’s educational program
days such as Science of Fun and Amusement Park Physics. This is an attendance increase
of 40% for this program over 2012 and included 476 guests who participated in a new Science of
Agriculture day. Playland also hosted 24,615 guests and 65 companies at corporate events in the park. An additional
2,785 guests attended through organized birthday parties, and 17,030 came as part of school year-end parties.
In summary, Playland had a great season. Two new rides, great weather, strong group sales efforts and increased marketing support all drove attendance throughout the season and resulted in positive growth for 2013. The team look forward to Playland’s ongoing development through City Council’s approval of the 25-year redevelopment plan for Hastings Park that will see Playland grow and be revitalized in the coming decade. For more information on the Hastings Park Master Plan, please visit www.vancouver.ca/pnepark.
14

ANNUAL REPORT 2013
Figure 1PLAYLAND ATTENDANCE
Figure 2PLAYLAND TOTAL REVENUES
Figure 3PLAYLAND NET CONTRIBUTION
0
320000
312,
181
2008
307,
659
2009
293,
00
7
201030
8,99
52011
284
,465
2012
300
,157
2013
0
12
2008 2009 2010 2011 2012
$12.
16M
$11.1
3M
$10
.96M
$11.
95M
$10
.54
M
2013
$12.
29M
0.00
5.11
2008 2009 2010 2011 2012
$4.7
1M
$3.3
3M
$3.10
M
2013
$6.5
9M
$3.8
1M $5.11
M
Figure 1PLAYLAND ATTENDANCE
Figure 2PLAYLAND TOTAL REVENUES
Figure 3PLAYLAND NET CONTRIBUTION
0
320000
312,
181
2008
307,
659
2009
293,
00
7
2010
308,
995
2011
284
,465
2012
300
,157
2013
0
12
2008 2009 2010 2011 2012
$12.
16M
$11.1
3M
$10
.96M
$11.
95M
$10
.54
M
2013
$12.
29M
0.00
5.11
2008 2009 2010 2011 2012$4
.71M
$3.3
3M
$3.10
M
2013
$6.5
9M
$3.8
1M $5.11
M
Figure 1PLAYLAND ATTENDANCE
Figure 2PLAYLAND TOTAL REVENUES
Figure 3PLAYLAND NET CONTRIBUTION
0
320000
312,
181
2008
307,
659
2009
293,
00
7
2010
308,
995
2011
284
,465
2012
300
,157
2013
0
12
2008 2009 2010 2011 2012
$12.
16M
$11.1
3M
$10
.96M
$11.
95M
$10
.54
M
2013
$12.
29M
0.00
5.11
2008 2009 2010 2011 2012
$4.7
1M
$3.3
3M
$3.10
M
2013
$6.5
9M
$3.8
1M $5.11
M
15
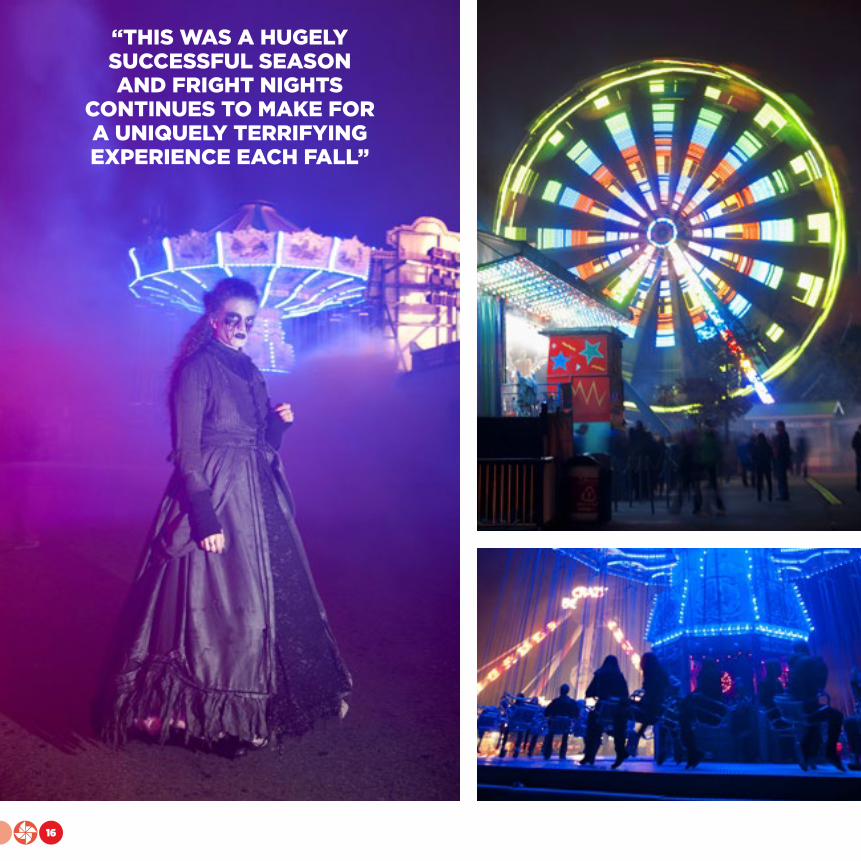
“THIS WAS A HUGELY SUCCESSFUL SEASON AND FRIGHT NIGHTS
CONTINUES TO MAKE FOR A UNIQUELY TERRIFYING EXPERIENCE EACH FALL”
16

ANNUAL REPORT 2013
Fright Nights
Playland’s regular season closed on September 22 and for the next few weeks the park underwent its annual eerie transformation into the haunted world of Fright Nights. There is no event quite like Fright Nights, a unique nighttime event with all the excitement of amusement rides, horrifying haunted attractions and roaming cast members to scare you silly. After 11 years, it truly is Vancouver’s signature Halloween event. Although there were no new attractions added to Fright Nights in 2013, good fall weather and a great experience on-site helped support a record-breaking 16-day run.
Several changes were made to Fright Nights in 2013. Instead of being open for a consecutive run, it was decided that Fright Nights would close on tradi-tionally slow nights, but would open on more weekend nights. Based on guest feedback, hours of operation were also adjusted to stay open later (until 1 am) on key weekend nights. Fright Nights opened October 11 and ran 16 nights across four weeks/weekends through November 2. In total, 79,463 guests enjoyed unlimited access to 12 rides and six haunted houses as well as the Monsters of Schlock comedy act. This was a 44% increase in attendance over 2012, when the event faced significant weather challenges (see Figure 4 for a six-year history).
Other strategic modifications to Fright Nights in 2013 involved event pricing. First, the most popular weekend days were priced at a premium; cost-conscious guests could attend a wide variety of other dates at either of two lower prices. This helped to spread attendance out across the run and improve the guests’ experience on the busiest evenings. A new Fast Pass was also introduced. Because the event
is so popular, sometimes the wait to get into the haunted houses exceeds one hour. As is common practice at other
theme parks, Fright Nights guests are now able to pay a premium to get front-of-the-line access to each haunted house.
Fright Nights achieved record revenues in 2013, reaching $2.88 million in total revenues (see Figure 5
for a six-year history) and contributing $1.58 million in net income towards the Playland activity stream (see Figure 6 for a six-year history). This was a hugely successful season and Fright Nights continues to make for a uniquely terrifying experience each fall — there really is nothing else like it in the Lower Mainland.
Note: Fright Nights revenues are included in the Playland total, although they are broken
out separately here in the Fright Nights section for comparative purposes.
Figure 4FRIGHT NIGHTS ATTENDANCE
Figure 5FRIGHT NIGHTS TOTAL REVENUES
Figure 6FRIGHT NIGHTS NET CONTRIBUTION
0
84000
83,0
76
2008
60,5
52
2009
71,5
82
2010
78,4
56
2011
55,2
54
2012
79,4
63
2013
0.0
2.6
2008 2009 2010 2011 2012
$2.13
M
$1.7
9M $2.2
7M
$2.5
8M
$1.8
9M
2013
$2.8
8M
0
2050000
2008 2009 2010 2011 2012
$687
,826
$860
,198
$983
,192
$1,15
0,0
00
$998
,016
2013
$1,5
80,0
00
Figure 4FRIGHT NIGHTS ATTENDANCE
Figure 5FRIGHT NIGHTS TOTAL REVENUES
Figure 6FRIGHT NIGHTS NET CONTRIBUTION
0
84000
83,0
76
2008
60,5
52
2009
71,5
82
2010
78,4
56
2011
55,2
54
2012
79,4
63
2013
0.0
2.6
2008 2009 2010 2011 2012$2
.13M
$1.7
9M $2.2
7M
$2.5
8M
$1.8
9M
2013
$2.8
8M0
2050000
2008 2009 2010 2011 2012
$687
,826
$860
,198
$983
,192
$1,15
0,0
00
$998
,016
2013$1
,580
,00
0
17

The Fair at the PNE The Fair at the PNE is an iconic end-of-summer tradition for people of all ages across the province. The event is responsible for approximately 50% of PNE annual revenues and is the single largest initiative the organization works on. After 103 years, it still remains the largest ticketed celebration in BC and each year, the PNE tries to preserve the fine balance between new and traditional favourites, weighing the must-have iconic things against adding new entertainment to keep the experience fresh — all to make The Fair something that guests simply can’t miss.
The entertainment landscape in BC has changed dramatically over the past decade, and the PNE understands that The Fair needs to continue to change as it finds its place in this landscape. As such, 2013 was the first year of a five-year strategy to rejuvenate The Fair. In year one, management chose to focus on cost controls (in order to invest in programming for future years), as well as shifting the value proposition so that families did not feel it was cost-prohibitive to attend The Fair and that it was well worth investing their time.
To start, both Fair gate admission and on-site parking prices were reduced by 20% for all guests on all days. New promotional days were added to make it easier to find a cost-effective way to attend. For example, for Free Admission Day on Tuesday, August 20, everyone received free gate admission between 11 am and 1 pm (Kids 13 and under are free always, any day, anytime.). Wednesday, August 21 was Wild Ride Wednesday, with two-for-one all-day ride passes if purchased on-site before 1 pm. Thursday, August 22 was Seniors Day, with guests 65 years of age and older receiving free gate admission from 11 am to 1 pm. And Vancity Member Day was held on Thursday, August 29, where admission was $5 each for Vancity members plus one guest. The Twilight Ride Pass and After Dark Gate Pass promotions also continued to provide value for guests either coming to The Fair late or purchasing an all-day ride pass later in the day.
Lastly, Heroes’ Weekend was introduced, providing first responders with free admission on the final weekend. Also, due to two short power outages earlier in The Fair, the PNE thanked the community for their support by offering another free admission day from 11 am to 1 pm during the second week of Fair.
Another new cost initiative was the introduction of a new Fair Coupon Book. This book contained over $300 in savings and deals, and provided coupons for a wide variety of concessionaires and exhibitors on-site. The intent was to help reduce the overall cost of food and other attractions for families. All of these initiatives were very well received by the public and media. There was a shift in value perception in guest on-site research, and guest service complaints about cost decreased.
The second biggest change to The Fair involved closing the fairgrounds on the first two Mondays of The Fair. These are traditionally the slowest attendance days, and it is common across many Fairs in North America to close and save the operational costs of those days to invest into other Fair initiatives.
In terms of entertainment mix, The Fair introduced a one-year-only museum-quality historical exhibit about the life of Genghis Khan. The Plaza Beer Garden was re-themed and the hugely successful Dueling Pianos were introduced to entertain guests each night. The Summer Night Concerts series included an all new lineup with performances by Melissa Etheridge, The Jacksons, Great Big Sea, The Beach Boys, Foreigner, Colin James and Martina McBride. One of the biggest changes was the relocation of the WestJet Concert stage to the PNE Amphitheatre and the introduction of paid reserved floor seating for the Summer Night Concerts. In previous years, seating was first-come, first-served festival seating. The venue change allowed for a more controlled guest experience, free seated bleachers and reserved floor seats. Again, guest feedback was extremely positive. Guests
18

ANNUAL REPORT 2013
CHEVROLET PERFORMANCE STAGE
19

DEAN BRODY, WESTJET CONCERT STAGE
AT THE PNE AMPHITHEATRE
20

ANNUAL REPORT 2013
Figure 7FAIR ATTENDANCE
Figure 8FAIR TOTAL REVENUES
Figure 9FAIR NET CONTRIBUTION
0
940000
753,
298
2008
855,
137
2009
937,
485
2010
803,
598
2011
763,
689
2012
712,
049
2013
0.000000
26.059999
2008 2009 2010 2011 2012$2
2.0
9M
$25.
82M
$26.
06M
$24
.39M
$23.
25M
2013
$22.
49M
0.00
7.35
2008 2009 2010 2011 2012
$5.2
8M $7.0
7M
$6.6
3M
$7.3
3M
$7.2
8M
2013$7
.09M
Figure 7FAIR ATTENDANCE
Figure 8FAIR TOTAL REVENUES
Figure 9FAIR NET CONTRIBUTION
0
940000
753,
298
2008
855,
137
2009
937,
485
2010
803,
598
2011
763,
689
2012
712,
049
2013
0.000000
26.059999
2008 2009 2010 2011 2012
$22.
09M
$25.
82M
$26.
06M
$24
.39M
$23.
25M
2013
$22.
49M
0.00
7.35
2008 2009 2010 2011 2012
$5.2
8M $7.0
7M
$6.6
3M
$7.3
3M
$7.2
8M
2013
$7.0
9M
no longer needed to come at 5 pm to save a spot and there were over 4,000 free seats for anyone to use. Super fans could pay a $20 premium and reserve a floor seat, allowing them to enjoy The Fair all day and then show up just as the show started and still have the best seats in the house.
This venue change also allowed for the intro-duction of a new stage in centre grounds. The Chevrolet Performance Stage showcased the Dal Richards Orchestra each afternoon, followed by cultural and community programming throughout the day, and the annual PNE Star Showdown talent competition and Tribute acts each night with the likes of Nearly Neil and the Fab Fourever Beatles experience.
Other returning favourites included the Family Feud Live game show, Superdogs, MarketPlace, Peking Acrobats, RibFest, Canfor Playhouses and atmospheric entertainment such as the DrumBeats
and KC Bear, as well as a wide range of agricultural programming including the return of the RCMP Musical Ride, and the Pacific Spirit Horse Show, 4-H Festival, Safeway Farm Country and the Kidz Discovery Farm. Access to all of these was free with admission.
Overall, Fair attendance was 712,049, down 6% from 2012. Each summer there is a variety of other events that take place creating competition in the market. 2013 saw a stronger than normal set of events, including a free two-day 125th Anniversary Festival in Stanley Park, two BC Lions games and two Vancouver Whitecaps games. Competition from these six other event days, along with two power outages on-site and rain on a couple of key Fair days, resulted in slightly lower attendance in 2013. Overall, total Fair revenues for 2013 were $22.49 million, which provided a positive net contribution of $7.09 million (see Figures 7, 8 and 9 for a six-year attendance and financial history).
ROOTED IN AGRICULTURE
The annual 4-H Festival welcomed over 300 youth from 40 clubs across BC in 2013. Over 1,600 entries were judged, and over $15,500 in prizing was awarded. The agriculture auction at the end of the 4-H Festival raised $310,495 for participants. In the Pacific Spirit Horse Show, $25,000 was awarded with 850 entries judged. During The Fair, 21,657 children went through the Kidz Discovery Farm exhibit to learn farm-to-fork basics. Lastly, each year the PNE hosts a charity auction in support of the BC Youth in Agriculture Foundation; $32,330 was raised at the 2013 Fair.
21

2013 PNE PRIZE HOME
22

ANNUAL REPORT 2013
PNE Prize Home Lottery – BC’s original and still most affordable!Win a House, Win a Car! BC’s very first home lottery was held again for the 79th year in 2013. From May 19 to September 2, the iconic PNE Prize Home Lottery gave ticket buyers a chance to dream big. Prizes for the 2013 lottery included a grand prize home package at Sun Peaks Resort as well as 12 vehicles, seven luxury trips — five from Transat Holidays and two from Rocky Mountaineer — in addition to the three early-bird prizes. Total value of all prizes was $1.82 million.
The home was again built by Britco with interior design by Jillian Harris. The grand prize package included a 3,000-square-foot luxurious resort getaway on a ski-in, ski-out mountainside lot in Sun Peaks. It was a Craftsman-style home with furnishings and accessories by Lane Home Furnishings, energy-efficient and chef-inspired appliances compliments of Coast Wholesale Appliances, a hot tub and a billiards table from Coast Spas, and outdoor living furniture from American Home and Patio. The package also included the Gladiator garage storage system from Coast Wholesale Appliances, $2,500 in groceries from MarketPlace IGA and one year of housekeeping services. More than 125,000 guests tour the home each year during The Fair, each dreaming of making it their own and imagining how they can incorporate the new interior design ideas. The lucky winner of the 2013 Prize Home was Dean Cockerill from Gibsons, BC.
The 2013 package of 12 vehicles provided by Chevrolet included everything from the sexy Camero to the electric Volt. And for the first time ever, winners had a “cash or car” option where they could accept the car or take a cash prize. The first early-bird prize was a luxury vacation to Riviera Maya, the second a luxury vacation to Cancun plus $5,000 cash, and the final prize was a luxury trip to Manzanillo plus $10,000 cash. One of the big changes to the 2013 lottery program was the introduction of an additional 50/50 draw. When a prize home ticket was purchased, guests had the ability to also purchase a ticket to win half of the almost $1 million 50/50 jackpot. The winner of the $484,805 jackpot was Nicole Vath from Kelowna, BC.
In total, 107,976 sheets of Prize Home tickets were sold, generating over $4 million in revenue. With the inclusion of the 50/50 draw, total revenues for the 2013 lottery program were $5.45 million (see Figure 10 for a six-year revenue history). Each year, revenues from the lottery program support a variety of community programs and the PNE’s rich history of agricultural programming, as well as a multitude of other non-revenue producing multicultural and family programming.
Figure 10PRIZE HOME LOTTERY TOTAL REVENUES
0.00
5.33
$4
.62M
2008
$5.3
2M
2009
$4.7
9M
2010
$4.8
6M
2011
$4.5
1M
2012
$5.4
5M
2013
23

Year-Round EventsThe year-round event portfolio, which utilizes a wide range of indoor and outdoor on-site venues, includes everything from concerts and sporting events to cultural shows, family shows and community events. As such, you will see that the PNE business is highly specialized, yet incredibly diversified. It is this diversity in activity streams that allows the company to withstand industry shifts, weather effects and economic impacts that may affect one or more aspects of the company in the short term while continuing to perform strongly overall in the long term. In 2013, total revenues from year-round events (excluding Playland, The Fair and Fright Nights) were $10.35 million, with a net contribution of $3.3 million (see Figures 11 and 12 for a six-year revenue history). The year-round event portfolio was very strong in 2013, and remains a year-round hub of activity that is important and relevant to our organization and communities.
CONCERTS
Much of the music history in Vancouver involves the PNE. From the first Canadian concerts by Elvis and The Beatles to the dance hall days of the Garden Auditorium, the major rock concerts of the 70s and 80s, and the evolution of the new electronic dance music genre, music and concerts have always played a role in the PNE entertainment mix. Some of Vancouver’s biggest and most diverse shows have come through the Pacific Coliseum
and, although the city now has alternate venues downtown, music still plays a central role in the PNE’s business.
During fiscal 2013, the PNE hosted a total of 16 concerts, 14 in the Pacific Coliseum and two in the PNE Forum. Over 70,900 guests attended those indoor concerts during the year, and over 11,000 guests attended two additional outdoor concerts held in the PNE Amphitheatre. Electronic dance music accounted for nine shows in the Pacific Coliseum; more mainstream musical acts accounted for a total of seven shows, five in the Pacific Coliseum and two in the PNE Forum.
ELECTRONIC DANCE MUSIC
The PNE has been at the heart of the electronic dance music (EDM) scene for almost a decade. What used to be considered eclectic is now very much mainstream. EDM used to play small out-of-the-way venues with niche audiences, but over the past three years, it has continued to explode into the mainstream with its own stars and infrastructure. EDM DJs are now often paid as much as, or more than, many of the more well-known concert artists to do shows at high-profile venues. What defines the venues they play has a great deal to do with venue flexibility and being able to transform to accommodate large-scale dance floors. These events are not a “sit in your seat and watch the artist” type of show — they are interactive dance parties
0.00
4.75
Figure 11FACILITY SALES TOTAL REVENUES
Figure 12FACILITY SALES NET CONTRIBUTION
Figure 13TOTAL OPERATING SURPLUS/DEFICIT (NET CONTRIBUTION)
0.0
13.7
$10
.42M
2008
$10
.01M
2009
$10
.35M
2013
$13.
43M
2010
$13.
66M
2011
$8.9
2M
2012
2008 2009 2010 2011 2012
$3.7
5M
$3.0
9M
$4.14
M
$4.7
3M
$1.7
1M
2013
$3.3
0M
$329,127$153,267
-$605,855
$1.84M$2.02M
$3.07M
$300,356
-$2.807M
$0.875M
-$1.882M
Figure 14PNE TOTAL REVENUES
0.0
51.5
2008 2009 2010 2011 2012
$45.
15M
$47.
33M
$51.
48M
$51.
44
M
$44
.06M
2013
$45.
56M
,2003 2004 2005 2006
2007
2008 2009
2010
2011
2012
2013
$589,215
24

ANNUAL REPORT 2013
that require a very different type of event management. The PNE is proud to have played a role in supporting the incredible spike in this genre’s popularity, having hosted and supported the majority of the Lower Mainland’s EDM shows over the past six years. The PNE has a unique array of venue options that meet the needs of EDM show promoters, including a very unique floor configuration that can only be accommodated at the Pacific Coliseum. Throughout 2013, the PNE played host to the very hottest acts in EDM, including Hardwell, Dash Berlin, Tiësto and Alesso. Crowds ranged from 3,000 to 6,500 people, and most shows were sold out.
MAINSTREAM MUSIC
The PNE is also proud to continue hosting more mainstream artists, as well as many newer artists and genres of music. In addition to having a niche with EDM, the PNE also hosted a number of great concerts throughout 2013. Pacific Coliseum shows included Marianas Trench, Zac Brown Band, Lady Antebellum and the Taiwanese band Mayday, with additional shows by Paramore and J. Cole in the PNE Forum. The PNE also proudly hosted a concert at the Pacific Coliseum supporting The Times of India Film Awards (TOIFA), which were held throughout Metro Vancouver. This cultural show brought out guests from all corners of the city to experience some of India’s hottest acts and film stars.
Overall, the year’s concert attendance was almost identical to 2012, although the mix of shows varies from year to year. The PNE remains focused on building new promoter relationships, working closely to meet the needs of current partners, and showcasing newer genres and artists.
PNE AMPHITHEATRE
In 2013, the PNE expanded use of its outdoor Amphitheatre for music events, and over 11,300 fans enjoyed two outdoor concerts by City and Colour and by The National. In addition, during The Fair, the PNE Amphitheatre hosted 15 concerts to capacity crowds enjoying artists such as The Beach Boys, Foreigner, Colin James, Martina McBride and Melissa Etheridge. 2013 was also spent developing relationships with a wide range of promoters looking to bring concert acts to outdoor venues, and it is fully expected that use of the PNE Amphitheatre will continue to grow year after year. The 2012 purchase of the SAM555 stage, which is being used in the PNE Amphitheatre and is rented to other events when not in use on-site, has proven a solid and successful investment.
THE NATIONAL AT THE PNE AMPHITHEATRE
25

SPORTING EVENTS
The PNE is also host to a diverse number of sporting events on-site, representing a broad range of interests throughout the community. We are proud that the Vancouver Giants junior hockey team has called the Pacific Coliseum home for over a decade. In 2013, the Giants played 36 home games and were cheered on by over 200,000 fans throughout the season. In addition to organized hockey, the PNE hosted 16 different groups who used over 746 hours of community ice in the Agrodome. These groups included Minor Hockey organizations, figure skating clubs, and a number of adult hockey and skating groups.
At the community level, the PNE hosted its 9th annual local Terry Fox Run. Over 1,780 students from 10 local schools participated and were treated to drinks and healthy snacks after the run, compliments of the PNE. The PNE also continues to work closely with and support the local baseball community through the Hastings Community Little League (HCLL). In fact, the second annual Community Day for HCLL was hosted at Playland in late May and over $18,000 was again raised in support of HCLL and their field upgrades. The PNE continues to provide free indoor practice space and tickets to Little League members each year. Redevelopment of Empire Fields by the City of Vancouver continued throughout 2013. Much progress was made, but it is expected to take until early 2015 to complete the conversion of the temporary stadium site back to a community sports fields with new and improved legacy equipment, a new plateau park and courts for community use.
From junior hockey to community ice time, and from Little League practice to the annual Terry Fox Run, the PNE remains a key location for amateur sport in BC.
CULTURAL AND FAMILY EVENTS
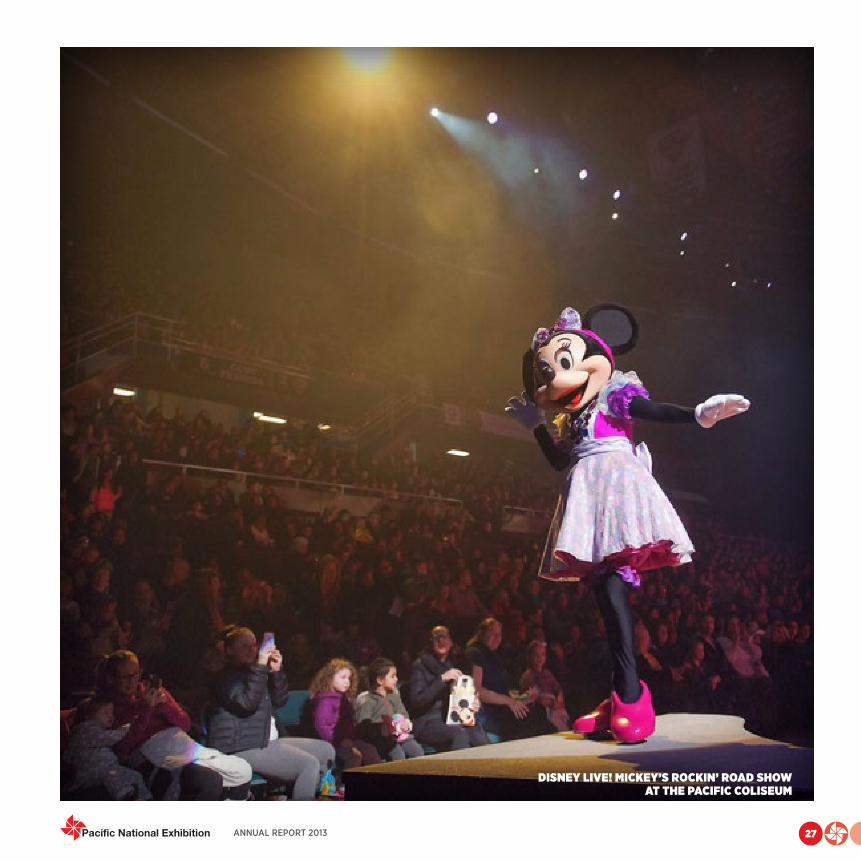
As a key location for family entertainment, the PNE hosts a dynamic range of cultural and family events throughout the year. 2013 was active with almost 47,000 guests enjoying nine performances in November of Disney on Ice’s Rockin’ Ever After show. This was followed in February by over 7,500 guests taking in the stage performance of Disney Live! Mickey’s Rockin’ Road Show. In addition, CircusWest also hosted the Kaleidoscope Circus show at the Garden Auditorium in May.
For decades, the PNE has also been home to a wide variety of cultural celebrations. One of this year’s highlights included the Truth and Reconcili-ation Commission of Canada’s BC National Event held on-site in support of documenting the history and experiences of First Nations residential school survivors. We also hosted the annual Ismaili Festival, which encompassed several venues including the Pacific Coliseum, Rollerland and Agrodome. The PNE welcomed back Bollywood Wedding to the Italian Gardens for a series of outdoor theatre performances in July of 2013, and the Nisga’a First Nations Festival was held in the PNE Forum in February. In April, the site welcomed The Times of India Film Awards musical extravaganza to the Pacific Coliseum. Each year, the PNE proudly brings tens of thousands of guests to Hastings Park site to celebrate this city’s diverse cultural heritage.
26
ANNUAL REPORT 2013
DISNEY LIVE! MICKEY’S ROCKIN’ ROAD SHOW AT THE PACIFIC COLISEUM
27
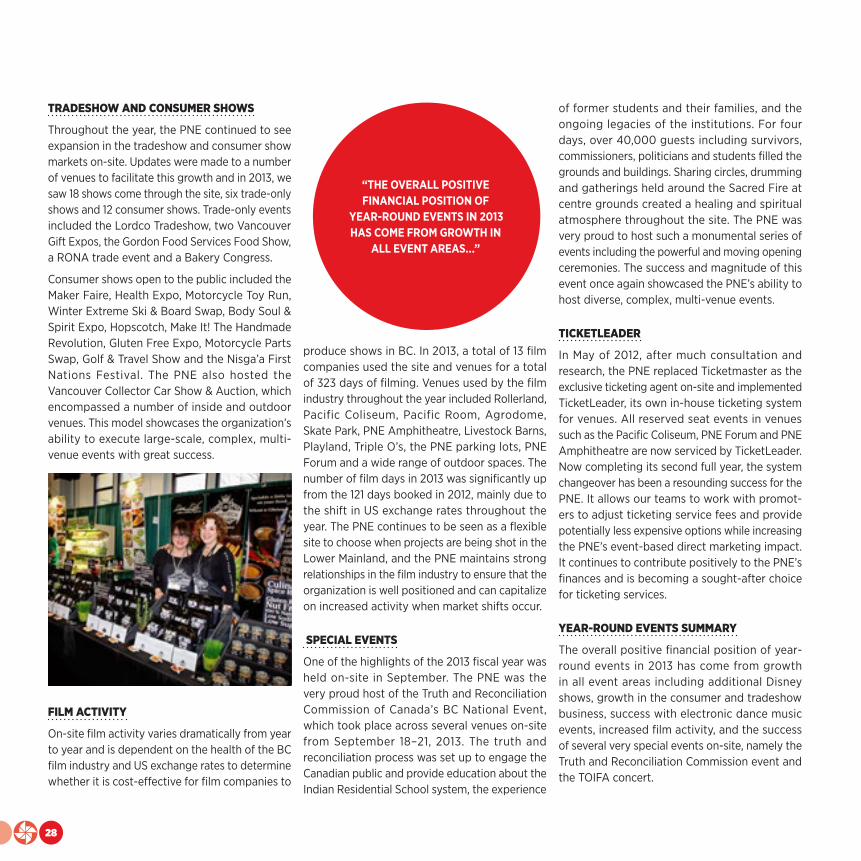
TRADESHOW AND CONSUMER SHOWS
Throughout the year, the PNE continued to see expansion in the tradeshow and consumer show markets on-site. Updates were made to a number of venues to facilitate this growth and in 2013, we saw 18 shows come through the site, six trade-only shows and 12 consumer shows. Trade-only events included the Lordco Tradeshow, two Vancouver Gift Expos, the Gordon Food Services Food Show, a RONA trade event and a Bakery Congress.
Consumer shows open to the public included the Maker Faire, Health Expo, Motorcycle Toy Run, Winter Extreme Ski & Board Swap, Body Soul & Spirit Expo, Hopscotch, Make It! The Handmade Revolution, Gluten Free Expo, Motorcycle Parts Swap, Golf & Travel Show and the Nisga’a First Nations Festival. The PNE also hosted the Vancouver Collector Car Show & Auction, which encompassed a number of inside and outdoor venues. This model showcases the organization’s ability to execute large-scale, complex, multi-venue events with great success.
FILM ACTIVITY
On-site film activity varies dramatically from year to year and is dependent on the health of the BC film industry and US exchange rates to determine whether it is cost-effective for film companies to
produce shows in BC. In 2013, a total of 13 film companies used the site and venues for a total of 323 days of filming. Venues used by the film industry throughout the year included Rollerland, Pacific Coliseum, Pacific Room, Agrodome, Skate Park, PNE Amphitheatre, Livestock Barns, Playland, Triple O’s, the PNE parking lots, PNE Forum and a wide range of outdoor spaces. The number of film days in 2013 was significantly up from the 121 days booked in 2012, mainly due to the shift in US exchange rates throughout the year. The PNE continues to be seen as a flexible site to choose when projects are being shot in the Lower Mainland, and the PNE maintains strong relationships in the film industry to ensure that the organization is well positioned and can capitalize on increased activity when market shifts occur.
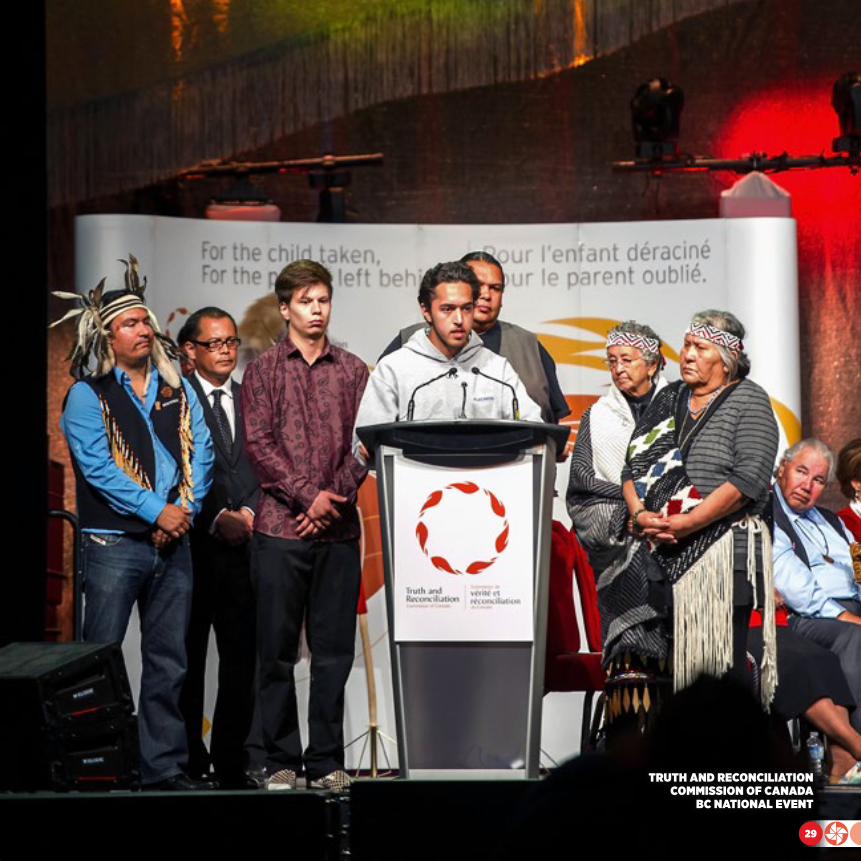
SPECIAL EVENTS
One of the highlights of the 2013 fiscal year was held on-site in September. The PNE was the very proud host of the Truth and Reconciliation Commission of Canada’s BC National Event, which took place across several venues on-site from September 18–21, 2013. The truth and reconciliation process was set up to engage the Canadian public and provide education about the Indian Residential School system, the experience
of former students and their families, and the ongoing legacies of the institutions. For four days, over 40,000 guests including survivors, commissioners, politicians and students filled the grounds and buildings. Sharing circles, drumming and gatherings held around the Sacred Fire at centre grounds created a healing and spiritual atmosphere throughout the site. The PNE was very proud to host such a monumental series of events including the powerful and moving opening ceremonies. The success and magnitude of this event once again showcased the PNE’s ability to host diverse, complex, multi-venue events.
TICKETLEADER
In May of 2012, after much consultation and research, the PNE replaced Ticketmaster as the exclusive ticketing agent on-site and implemented TicketLeader, its own in-house ticketing system for venues. All reserved seat events in venues such as the Pacific Coliseum, PNE Forum and PNE Amphitheatre are now serviced by TicketLeader. Now completing its second full year, the system changeover has been a resounding success for the PNE. It allows our teams to work with promot-ers to adjust ticketing service fees and provide potentially less expensive options while increasing the PNE’s event-based direct marketing impact. It continues to contribute positively to the PNE’s finances and is becoming a sought-after choice for ticketing services.
YEAR-ROUND EVENTS SUMMARY
The overall positive financial position of year-round events in 2013 has come from growth in all event areas including additional Disney shows, growth in the consumer and tradeshow business, success with electronic dance music events, increased film activity, and the success of several very special events on-site, namely the Truth and Reconciliation Commission event and the TOIFA concert.
“THE OVERALL POSITIVE FINANCIAL POSITION OF
YEAR-ROUND EVENTS IN 2013 HAS COME FROM GROWTH IN
ALL EVENT AREAS…”
28
ANNUAL REPORT 2013
TRUTH AND RECONCILIATION COMMISSION OF CANADA
BC NATIONAL EVENT
29
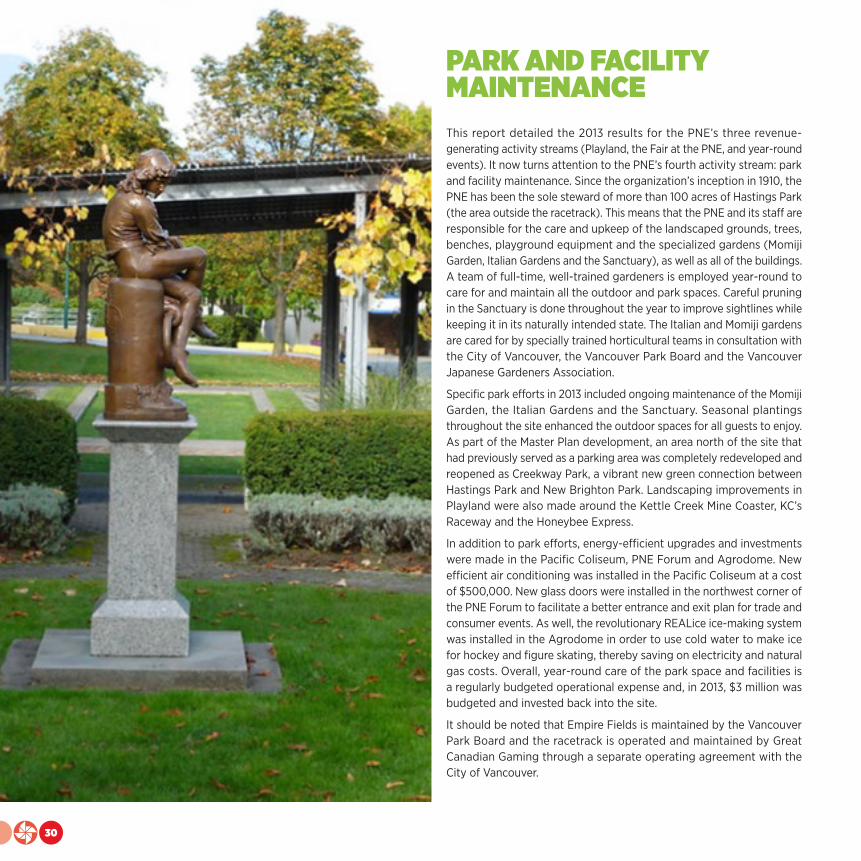
PARK AND FACILITY MAINTENANCEThis report detailed the 2013 results for the PNE’s three revenue-generating activity streams (Playland, the Fair at the PNE, and year-round events). It now turns attention to the PNE’s fourth activity stream: park and facility maintenance. Since the organization’s inception in 1910, the PNE has been the sole steward of more than 100 acres of Hastings Park (the area outside the racetrack). This means that the PNE and its staff are responsible for the care and upkeep of the landscaped grounds, trees, benches, playground equipment and the specialized gardens (Momiji Garden, Italian Gardens and the Sanctuary), as well as all of the buildings. A team of full-time, well-trained gardeners is employed year-round to care for and maintain all the outdoor and park spaces. Careful pruning in the Sanctuary is done throughout the year to improve sightlines while keeping it in its naturally intended state. The Italian and Momiji gardens are cared for by specially trained horticultural teams in consultation with the City of Vancouver, the Vancouver Park Board and the Vancouver Japanese Gardeners Association.
Specific park efforts in 2013 included ongoing maintenance of the Momiji Garden, the Italian Gardens and the Sanctuary. Seasonal plantings throughout the site enhanced the outdoor spaces for all guests to enjoy. As part of the Master Plan development, an area north of the site that had previously served as a parking area was completely redeveloped and reopened as Creekway Park, a vibrant new green connection between Hastings Park and New Brighton Park. Landscaping improvements in Playland were also made around the Kettle Creek Mine Coaster, KC’s Raceway and the Honeybee Express.
In addition to park efforts, energy-efficient upgrades and investments were made in the Pacific Coliseum, PNE Forum and Agrodome. New efficient air conditioning was installed in the Pacific Coliseum at a cost of $500,000. New glass doors were installed in the northwest corner of the PNE Forum to facilitate a better entrance and exit plan for trade and consumer events. As well, the revolutionary REALice ice-making system was installed in the Agrodome in order to use cold water to make ice for hockey and figure skating, thereby saving on electricity and natural gas costs. Overall, year-round care of the park space and facilities is a regularly budgeted operational expense and, in 2013, $3 million was budgeted and invested back into the site.
It should be noted that Empire Fields is maintained by the Vancouver Park Board and the racetrack is operated and maintained by Great Canadian Gaming through a separate operating agreement with the City of Vancouver.
30

ANNUAL REPORT 2013
Commitment to SustainabilityThe PNE continues to strive to improve its performance and to achieve sustainability in all areas of its business. From Playland and The Fair to indoor and outdoor year-round events, the PNE is committed to improving its environmental footprint and making sustainability investments a top priority. Initiatives are driven through our management-level Sustainability Captain, who works with staff at all levels, researches ideas and reports directly to the executive on sustainability efforts.
Many great strides were made in 2013, including:
More efficient air conditioning was installed in the Pacific Coliseum.
The REALice cold-water ice-making system was installed in the Agrodome.
The Good Green Composter processed 3.4 MT of compost during the 15-day Fair.
The Fair banned the use of Styrofoam and required vendors to use only recyclable plastics and compostable/recyclable containers.
During The Fair, the PNE diverted over 17 tonnes of pre-consumer food waste from the landfill, and collected and recycled 175 tonnes of animal waste and shavings from the agriculture department.
In 2012, the PNE purchased a Bulb Eater. Since then, the PNE has diverted over 20,000 fluorescent tubes and incandescent light bulbs from the landfill, turning them into recyclable glass and capturing bulb gases.
Through a 2012 grant from Vancity, the PNE worked with a consulting team to continue evaluating current efforts and developing recommendations for the most appropriate next steps. A report was completed in 2013 and several projects were green-lighted for 2014 as a result of those recommendations. This report also formed the basis of the PNE’s sustainability report card.
31
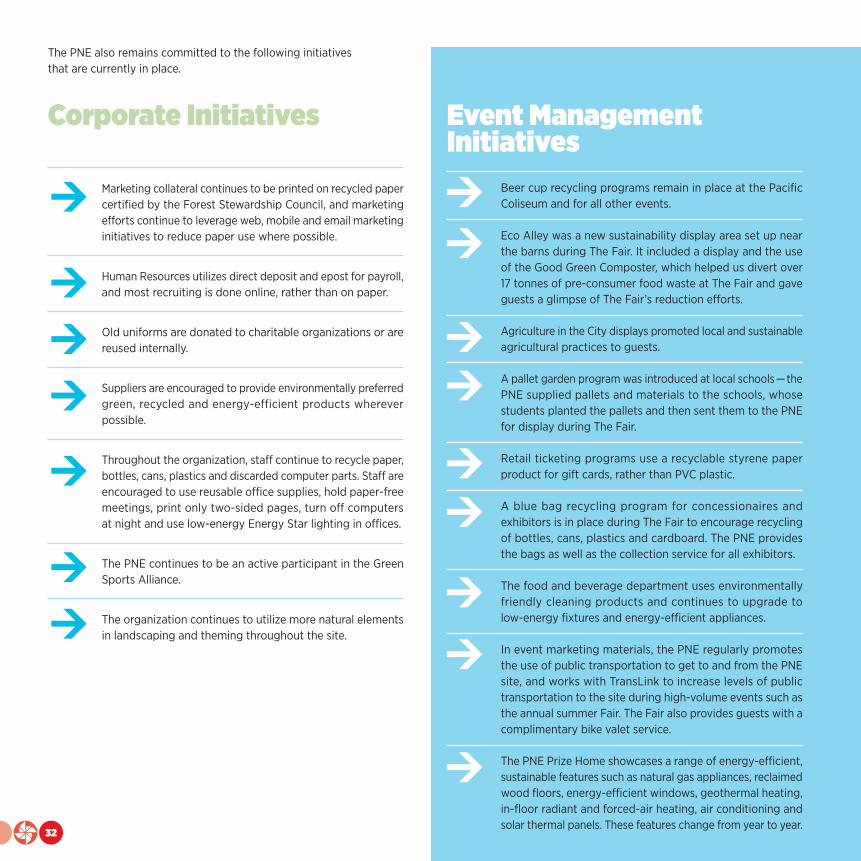
The PNE also remains committed to the following initiatives that are currently in place.
Corporate Initiatives
Marketing collateral continues to be printed on recycled paper certified by the Forest Stewardship Council, and marketing efforts continue to leverage web, mobile and email marketing initiatives to reduce paper use where possible.
Human Resources utilizes direct deposit and epost for payroll, and most recruiting is done online, rather than on paper.
Old uniforms are donated to charitable organizations or are reused internally.
Suppliers are encouraged to provide environmentally preferred green, recycled and energy-efficient products wherever possible.
Throughout the organization, staff continue to recycle paper, bottles, cans, plastics and discarded computer parts. Staff are encouraged to use reusable office supplies, hold paper-free meetings, print only two-sided pages, turn off computers at night and use low-energy Energy Star lighting in offices.
The PNE continues to be an active participant in the Green Sports Alliance.
The organization continues to utilize more natural elements in landscaping and theming throughout the site.
Event Management Initiatives
Beer cup recycling programs remain in place at the Pacific Coliseum and for all other events.
Eco Alley was a new sustainability display area set up near the barns during The Fair. It included a display and the use of the Good Green Composter, which helped us divert over 17 tonnes of pre-consumer food waste at The Fair and gave guests a glimpse of The Fair’s reduction efforts.
Agriculture in the City displays promoted local and sustainable agricultural practices to guests.
A pallet garden program was introduced at local schools — the PNE supplied pallets and materials to the schools, whose students planted the pallets and then sent them to the PNE for display during The Fair.
Retail ticketing programs use a recyclable styrene paper product for gift cards, rather than PVC plastic.
A blue bag recycling program for concessionaires and exhibitors is in place during The Fair to encourage recycling of bottles, cans, plastics and cardboard. The PNE provides the bags as well as the collection service for all exhibitors.
The food and beverage department uses environmentally friendly cleaning products and continues to upgrade to low-energy fixtures and energy-efficient appliances.
In event marketing materials, the PNE regularly promotes the use of public transportation to get to and from the PNE site, and works with TransLink to increase levels of public transportation to the site during high-volume events such as the annual summer Fair. The Fair also provides guests with a complimentary bike valet service.
The PNE Prize Home showcases a range of energy-efficient, sustainable features such as natural gas appliances, reclaimed wood floors, energy-efficient windows, geothermal heating, in-floor radiant and forced-air heating, air conditioning and solar thermal panels. These features change from year to year.
32

ANNUAL REPORT 2013
Facilities InitiativesThe technical services department remains focused on ensuring that facilities throughout the grounds continue to receive sustainable and energy-efficient upgrades:
Waste audits are conducted annually.
Low-flush toilets and urinals as well as low-water-use faucets and high-efficiency lighting have been installed in all major buildings on-site.
The Agrodome now has high-efficiency lighting in the main arena and plaza.
Our technical services department remains committed to the proper disposal and recycling of batteries, motor oil and containers, hydraulic oils, antifreeze, oil filters, containers and absorbents, aerosol cans, paint, wood, glass, vehicle tires, drywall, concrete and blacktop, steel, aluminum and copper.
Lights throughout the site have been replaced with high-efficiency fixtures.
Leaves, grass clippings and tree trimmings are recycled for composting.
The technical services team uses electric, propane or natural gas vehicles where possible (zoom booms, scissor lifts, scrub-bers, Zambonis, forklifts, electric ice edgers, electric golf carts, etc.), and remains committed to exploring the conversion of other fleet vehicles.
The PNE continues to actively work to improve its environmental footprint. In addition to working with Vancity and a team of external contractors on the next steps to take, the PNE remains proud of its progress and encourages suppliers, partners, sponsors and staff to continue to bring ideas forward. The organization understands that there is much work yet to be done and remains committed to making progress in sustainability. Watch for the 2014 report — many new, exciting initiatives are underway!
During events, agricultural event dirt is reused, shavings are purchased in bulk, and manure is composted.
Plans are underway to further improve exhibitors’ sustainability performance on-site in upcoming years, including limiting the types of materials that can be used on-site and requiring that all pre-consumer food waste be composted.
33

CELEBRATING TEAM AND SUCCESSOver the PNE’s 103 years of history, it is often said that while almost everything has changed, one thing has remained consistent — it is the people that make this organization so amazing, who make all the great events happen, and who care for and maintain this park and its facilities. Thousands of people continue to work tirelessly each year behind the scenes to build this iconic organization, and their stories are as rich as the history of this great institution. Thank you to everyone who contributes each year to make events and celebrations successful and to keep this site a dynamic social gathering place for this city’s diverse community.
SNAPSHOT OF THE TEAM
PNE activities throughout 2013 contributed 451 full-time equivalent jobs annually. The PNE employs about 3,700 people each year in a variety of roles and 3,200 of those jobs (86.5%) are in the Vancouver CMA. The PNE team is made up of 1,350 Fair-time employees, 2,250 part-time employees and seasonal staff (including Playland), 178 full-time employees, and a team of approximately 50 full-time management employees. The PNE is proud to be BC’s largest employer of youth, providing first jobs and the skills required to build a career for more than 2,000 PNE staff under the age of 24 each year.
More than 50% of PNE employees live in the City of Vancouver and all non-management staff are unionized
in one of four unions: Canadian Union of Public Employees (CUPE) Local 1004, Operating Engineers Local 882, Electri-cal Workers IUOE Local 213, and International Alliance of Theatrical and Stage Employees (IATSE) Local 118.
STAFF PROGRAMS
The PNE has always been committed to providing health and wellness opportunities for staff. Initiatives include a staff-run social club as well as a company-funded health and wellness committee. Program types vary from year-to-year depending on staff feedback, but include year-round access to an on-site fitness centre and organized boot camp classes. Most programs are made available at a reduced rate for employees.
Staff recognition also remains a cornerstone of PNE incen-tive programs. 2013 was the third year of the Spotlight-On-You program, which was designed to recognize employees who contribute to the company’s overall success and who promote productivity and creativity. The program allows managers to provide personal, informal and year-round on-the-spot recognition to deserving individuals or teams — both in bargaining units and excluded.
The team also continued a program for seasonal and Fair-time team members called Impress Our Guests. This program, which is based on the PNE’s mission and values, allows managers to recognize employees both on the front line and behind the scenes who enhance the guest experi-ence. Winners are drawn weekly during the Playland season and daily during The Fair. Recognized staff are awarded with an array of $50 gift card options.
The PNE Scholarship Program is an employee recognition program intended to identify and celebrate PNE team members who excel in performance, provide exceptional service to guests and peers, are in good academic standing and are pursuing a post-secondary academic career. Eligible PNE employees and children of PNE employees are eligible to apply for the PNE Scholarship. Four scholarships of $500 are awarded each year.
MORE THAN 50% OF THE EMPLOYEES
WHO WORK AT THE PNE LIVE
IN THE CITY OF VANCOUVER.
THE PNE IS PROUD TO BE A
CUPE 1004 SITE.
34
ANNUAL REPORT 2013
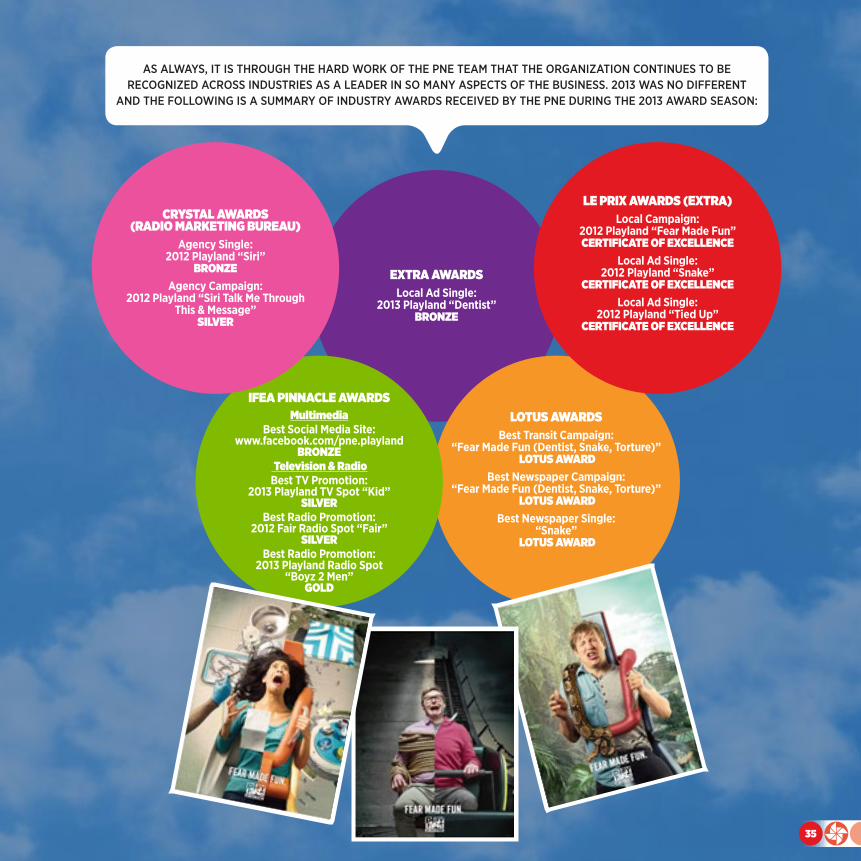
EXTRA AWARDSLocal Ad Single:
2013 Playland “Dentist” BRONZE
LOTUS AWARDSBest Transit Campaign:
“Fear Made Fun (Dentist, Snake, Torture)” LOTUS AWARD
Best Newspaper Campaign: “Fear Made Fun (Dentist, Snake, Torture)”
LOTUS AWARDBest Newspaper Single:
“Snake” LOTUS AWARD
LE PRIX AWARDS (EXTRA)Local Campaign:
2012 Playland “Fear Made Fun” CERTIFICATE OF EXCELLENCE
Local Ad Single: 2012 Playland “Snake”
CERTIFICATE OF EXCELLENCELocal Ad Single:
2012 Playland “Tied Up” CERTIFICATE OF EXCELLENCE
IFEA PINNACLE AWARDSMultimedia
Best Social Media Site: www.facebook.com/pne.playland
BRONZE Television & RadioBest TV Promotion:
2013 Playland TV Spot “Kid” SILVER
Best Radio Promotion: 2012 Fair Radio Spot “Fair”
SILVERBest Radio Promotion:
2013 Playland Radio Spot “Boyz 2 Men”
GOLD
CRYSTAL AWARDS (RADIO MARKETING BUREAU)
Agency Single: 2012 Playland “Siri”
BRONZEAgency Campaign:
2012 Playland “Siri Talk Me Through This & Message”
SILVER
AS ALWAYS, IT IS THROUGH THE HARD WORK OF THE PNE TEAM THAT THE ORGANIZATION CONTINUES TO BE RECOGNIZED ACROSS INDUSTRIES AS A LEADER IN SO MANY ASPECTS OF THE BUSINESS. 2013 WAS NO DIFFERENT
AND THE FOLLOWING IS A SUMMARY OF INDUSTRY AWARDS RECEIVED BY THE PNE DURING THE 2013 AWARD SEASON:
35

A BRIGHT FUTURE The PNE remains committed to the redevelopment of Hastings Park as defined in the Master Plan and to working with the local community to minimize impacts, and to providing opportunities to gather and celebrate throughout the year. The PNE is proud to remain at the heart of Hastings Park, honouring its history and helping to build its future. This was validated through Vancouver City Council’s decision in August 2013 to have the governance of the site remain with the PNE, as it has for 103 years. The PNE invites you to experience and enjoy this unique urban park and to be part of its transformation in the years to come.
36
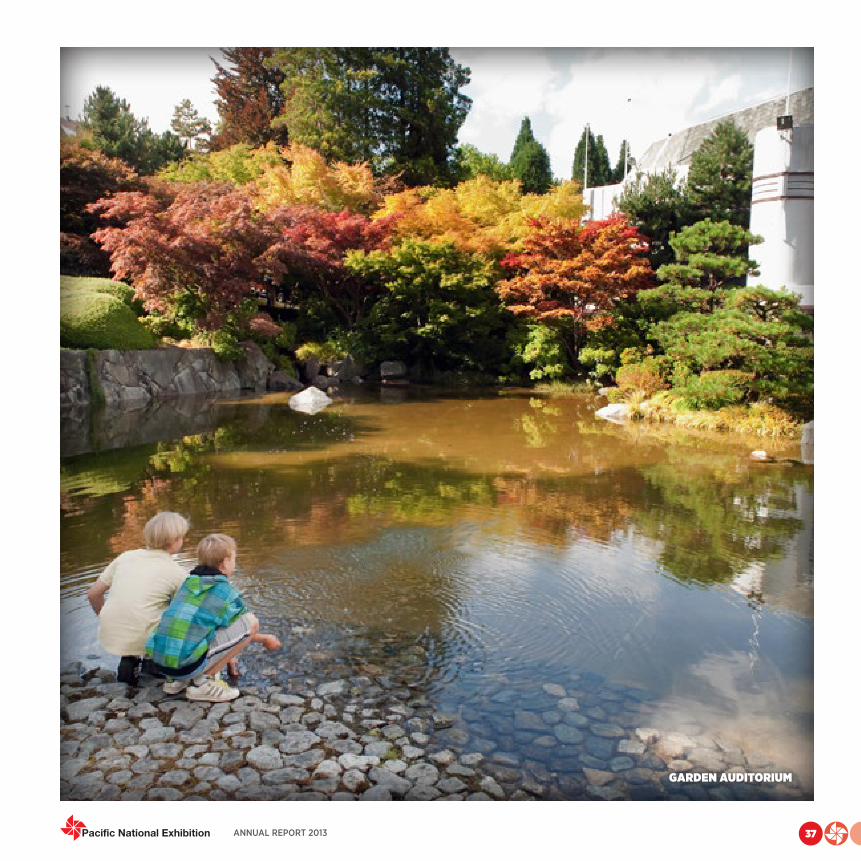
ANNUAL REPORT 2013
GARDEN AUDITORIUM
37

CITY AND COLOUR
AT THE PNE AMPHITHEATRE
CITY AND COLOUR AT THE PNE AMPHITHEATRE

ANNUAL REPORT 2013
FINANCIAL REPORTS
39


ANNUAL REPORT 2013
REPORT OF MANAGEMENT’S RESPONSIBILITY FOR FINANCIAL STATEMENTS
The Pacific National Exhibition Incorporation Act requires the PNE to table an annual report containing information about the organiza-tion’s performance. PNE management prepares the following financial statements and related information and is responsible for their integrity. As in all cases, the statements include amounts based on management’s estimates and judgments. We believe that these statements fairly represent the PNE’s current financial position. Management is also responsible for the accuracy and completeness of the information presented in the PNE’s annual report. To fulfill this responsibility, management maintains financial and management control systems and practices that provide reasonable assurance the information is accurate and complete.
PNE officials who have provided the information contained in the 2013 annual report have verified its completeness and accuracy. Our independent auditors, KPMG LLP, have audited the financial statements using Canadian public sector accounting standards to the extent necessary to form an independent opinion on the financial statements prepared by management.
Michael McDaniel Roger Gil President and Chief Executive Officer Vice President, Finance and Corporate Services
41
2012 BOARD OF DIRECTORS
Chair: Mr. Raymond Louie—Councillor, City of Vancouver
Vice Chair: Mr. Malcolm Bromley—General Manager, Vancouver Park Board
Treasurer: Ms. Patrice Impey—General Manager, Financial Services,
City of Vancouver
Directors: Ms. Sarah Blyth—Vancouver Park Board Commissioner
Ms. Cheryl Carline—President, Burnaby Hospital Foundation
Mr. Sadhu Johnston—Deputy City Manager, City of Vancouver
Mr. Peter Legge—President and CEO, Canada Wide Media Ltd
Ms. Brenda Prosken—General Manager, Community Services,
City of Vancouver
Mr. Richard Saunders—Workers’ Advocate, Labourers’
Membership Services, Construction and Specialized
Workers’ Union Local 1611Workers Compensation Board (WCB)
Mr. Paul Sihota—City of Vancouver Fire and Rescue
Ms. Nancy Wright—Vice President, Marketing, GLOBE Foundation
EXECUTIVE MANAGEMENT COMMITTEE
President and Chief Executive Officer: Mr. Michael McDaniel
Vice President, Operations: Mr. Jeff Strickland
Vice President, Marketing: Ms. Shelley Frost
Vice President, Finance and Corporate Services: Mr. Roger Gil
Vice President, Sales: Mr. Peter Male
Vice President, Human Resources: Ms. Stacy Shields
Executive Assistant and Corporate Secretary: Ms. Salome Valente
CORPORATE GOVERNANCE PRACTICES
The Pacific National Exhibition is a non-profit registered charity owned by the City of Vancouver. The company’s business affairs are the responsibility of the Board of Directors, a City Council-appointed body. The PNE’s Board of Directors is committed to ensuring that corporate governance practices are open and effective and that the Board is fully accountable and assumes responsibility for the stewardship of the organization. The Board discharges responsibility of day-to-day operations to the President and Chief Executive Officer, who in turn selects and oversees the rest of the management team. The Board encourages management, under the direction of the President and Chief Executive Officer, to make clear and appropriate executive decisions.
2013 AUDITOR
KPMG LLP, Chartered Accountants Metrotower II Suite 2400, 4720 Kingsway Burnaby, BC Canada V5H 4N2
Telephone: 604-527-3600 Fax: 604-527-3636 Web: www.kpmg.ca
CORPORATE GOVERNANCE
42

ANNUAL REPORT 2013
To the Board of Directors of the Pacific National Exhibition
Report on the Financial Statements
We have audited the accompanying financial statements of Pacific National Exhibition, which comprise the statement of financial position as at March 31, 2014, the statements of operations and accumulated surplus, changes in net debt and cash flows for the year then ended, and notes, comprising a summary of significant accounting policies and other explanatory information.
Management’s Responsibility for the Financial Statements
Management is responsible for the preparation and fair presentation of these financial statements in accordance with Canadian public sector accounting standards, and for such internal control as management determines is necessary to enable the preparation of financial statements that are free from material misstatement, whether due to fraud or error.
Auditors’ Responsibility
Our responsibility is to express an opinion on these financial statements based on our audit. We conducted our audit in accordance with Canadian generally accepted auditing standards. Those standards require that we comply with ethical requirements and plan and perform the audit to obtain reasonable assurance about whether the financial statements are free from material misstatement.
An audit involves performing procedures to obtain audit evidence about the amounts and disclosures in the financial statements. The procedures selected depend on our judgment, including the assessment of the risks of material misstatement of the financial statements, whether due to fraud or error. In making those risk assessments, we consider internal control relevant to the entity’s preparation of the financial statements in order to design audit procedures that are appropriate in the circumstances, but not for the purpose of expressing an opinion on the effectiveness of the entity’s internal control. An audit also includes evaluating the appropriateness of accounting policies used and the reasonableness of accounting estimates made by management, as well as evaluating the overall presentation of the financial statements.
We believe that the audit evidence we have obtained in our audit is sufficient and appropriate to provide a basis for our audit opinion
Opinion
In our opinion, the financial statements present fairly, in all material respects, the financial position of Pacific National Exhibition as at March 31, 2014 and its results of operations and accumulated surplus, its changes in net debt and its cash flows for the year then ended in accordance with Canadian public sector accounting standards.
Report on Other Legal and Regulatory Requirements
As required by the Pacific National Exhibition Act, we report that, in our opinion, the accounting principles in the Canadian Public Sector Accounting Standards have been applied on a consistent basis.
Chartered Accountants October 6, 2014 Burnaby, Canada KPMG LLP, a Canadian limited liability partnership and a member firm of the KPMG
network of independent member firms affiliated with KPMG International Cooperative, a Swiss entity. KPMG Canada provides services to KPMG LLP.
KPMG LLP Chartered Accountants
Metrotower II, Suite 2400-4720 Kingsway Burnaby, BC V5H 4N2 Canada
Telephone (604) 527-3600 Fax (604) 527-3636 Internet www.kpmg.ca
INDEPENDENT AUDITORS’ REPORT
43

March 31, March 31, 2014 2013
FINANCIAL ASSETS
Accounts Receivable (Note 2) $ 797,727 $ 791,646
797,727 791,646
LIABILITIES
Bank indebtedness (Note 3) 79,028 8,494,549
Bank loan (Note 3) 11,214,191 3,510,732
Accounts payable and accrued liabilities (Note 2,4) 5,449,585 3,146,403
Deferred revenue 796,430 1,695,152
Obligations under capital lease (Note 6) 23,379 231,525
17,562,613 17,078,361
Net debt (16,764,886) (16,286,715)
NON-FINANCIAL ASSETS
Tangible capital assets (Note 7) 15,756,728 15,097,537
Inventories held for use 734,717 577,084
Prepaid expenses 1,087,427 1,096,953
17,578,872 16,771,574
Accumulated surplus (Note 2) 813,986 $ 484,859
Commitments and contingent liabilities (note 9)
See accompanying notes to financial statements.
Approved on behalf of the Board:
_______________________ Director _______________________ Director
STATEMENT OF FINANCIAL POSITION YEAR ENDED MARCH 31, 2014
44

ANNUAL REPORT 2013
Budget 2014 2013
(Note 1(i))
REVENUE:
Events $ 45,307,982 $ 45,118,645 $ 42,601,009 Other - 433,140 906,235 45,307,982 45,551,785 43,507,244
EXPENSES (NOTE 10):
Office of the President 1,309,827 740,383 741,943 Media Relations 176,814 169,213 160,633 Entertainment 3,135,200 3,288,618 4,388,197 Sales 1,271,700 2,082,201 1,545,260 Group Sales 190,224 142,967 160,816 Exhibit Space 863,322 911,855 994,608 Finance 3,981,091 3,738,514 3,671,163 Information Service 871,690 905,888 1,091,711 Corporate Service 596,782 632,694 736,189 Marketing 741,925 684,092 636,336 Sponsorship 169,000 135,227 139,314 Advertising 2,246,649 2,201,175 2,152,006 Operations 950,276 855,127 916,575 Agriculture 797,879 811,581 801,985 Food & Beverage 5,425,450 5,590,184 5,359,386 Guest Services 445,634 382,276 418,534 Tech Services 5,683,398 5,928,075 5,746,803 Lotteries 2,976,233 3,170,249 2,767,052 Public Safety & Parking 2,743,335 2,924,824 2,795,932 Ride 3,214,769 2,969,078 3,206,583 Games 2,327,422 1,942,388 2,349,827 Playland Tech Services 3,562,912 3,633,332 3,456,124 Merchandise 14,968 16,188 68,644 Human Resources 1,266,177 1,366,529 1,083,241
44,962,677 45,222,658 45,388,862
Annual surplus (deficit) 345,305 329,127 (1,881,618)Accumulated surplus, beginning of year 484,859 484,859 2,366,477
Accumulated surplus, end of year $ 830,164 $ 813,986 $ 484,859
See accompanying notes to financial statements.
STATEMENTS OF OPERATIONS AND ACCUMULATED SURPLUS YEAR ENDED MARCH 31, 2014
45

STATEMENTS OF CHANGES IN NET DEBT
Budget 2014 2013 Total Total
(Note 1(i))
Annual surplus (deficit) $ 345,305 $ 329,127 $ (1,881,618)
Acquisition of tangible capital assets - (2,203,346) (1,608,518) Amortization of tangible capital assets - 1,544,155 1,475,106
- (659,191) (133,412)
Acquisition of inventories held for use - (3,708,494) (2,295,426) Acquisition of prepaid expense - (1,865,542) (1,270,734) Consumption of inventories held for use - 3,550,861 2,418,004 Use of prepaid expense - 1,875,068 1,461,664
- (148,107) 313,508
Decrease (increase) in net debt 345,305 (478,171) (1,701,522)
Net debt, beginning of year (16,286,715) (16,286,715) (14,585,193)
Net debt, end of year $ (15,941,410) $ (16,764,886) $ (16,286,715)
See accompanying notes to financial statements.
YEAR ENDED MARCH 31, 2014
46

ANNUAL REPORT 2013
STATEMENT OF CASH FLOWS
2014 2013
Cash provided by (used in):
Operations:
Annual surplus (deficit) $ 329,127 $ (1,881,618) Items not involving cash:
Amortization of tangible capital assets 1,544,155 1,475,106Change in non-cash operating working capital:
Decrease in accounts receivable (6,081) 572,499 Decrease (increase) in prepaid expenses 9,526 190,930 Decrease in inventories held for use (157,633) 122,579 Increase (decrease) in accounts payable and accrued liabilities 2,303,182 (1,241,444) Increase (decrease) in deferred revenue (898,722) 784,675
Net change in cash from operating activities 3,123,554 22,727
Capital activities:Cash used to acquire tangible capital assets (2,203,346) (1,608,518)
Net change in cash from capital activities (2,203,346) (1,608,518)
Financing activities:Increase (decrease) in bank loan 7,703,459 334,225Principal payments on tangible capital lease obligations (208,146) (364,688)
Net change in cash from financing activities 7,495,313 (30,463)
Net change in cash 8,415,521 (1,616,254)
Cash, beginning of year (8,494,549) (6,878,295)
Cash, end of year $ (79,028) $ (8,494,549)
Cash is comprised of cash and bank indebtedness.
See accompanying notes to financial statements.
YEAR ENDED MARCH 31, 2014
47
Authority and Purpose and Operations:
Pacific National Exhibition (“PNE”) is a premier entertainment destination in the Province of British Columbia. It has four main activity streams: an annual 15-day fair, Playland amusement park, year round facilities which are utilized to celebrate a variety of community, social, cultural, ethnic and commercial events, and the care and development of the park.
PNE was established in 1910 and incorporated in 1973 under the Pacific National Exhibition Incorporation Act of the Province of British Columbia.
The mission of PNE is to enrich the quality of life at Hastings Park, Vancouver, by providing family entertainment that invites its guests to celebrate Vancouver’s heritage, culture and diverse communities in a vibrant urban park.
Effective January 1, 2004, PNE became wholly owned by the City of Vancouver and is an independently operated entity. As a result of its ownership and its registered charity status, PNE is not subject to income taxes.
These financial statements have been prepared on the basis that the PNE is a going concern, which assumes that the PNE will continue to realize its assets and discharge its liabilities in the normal course of operations. The PNE’s ability to continue as a going concern is dependent upon, among other things, achieving profitable operations and the continued support of its lenders and its parent, the City of Vancouver.
1. SUMMARY OF SIGNIFICANT ACCOUNTING POLICIES:
(a) Basis of accounting:
The financial statements of PNE have been prepared by management in accordance with Canadian Public Sector Accounting Board (“PSAB”) standards.
(b) Revenue recognition:
Revenues from the annual fair (the “Fair”) are recorded as received (admissions) and as earned (exhibitors and advertisers). The Fair runs from late August to early September. Any exhibitor or advertising fees received for next year’s Fair are deferred and will not be recognized until earned during the next year’s Fair.
Revenues from Playland amusement park are recognized as received (admissions) and as earned (advertisers).
Revenues from short-term event rental of facilities are recorded upon completion of the event. Sales of goods and services are reported as revenue at the time the services are provided or the products are delivered, and collection is reasonably assured.
NOTES TO FINANCIAL STATEMENTS YEAR ENDED MARCH 31, 2014
48
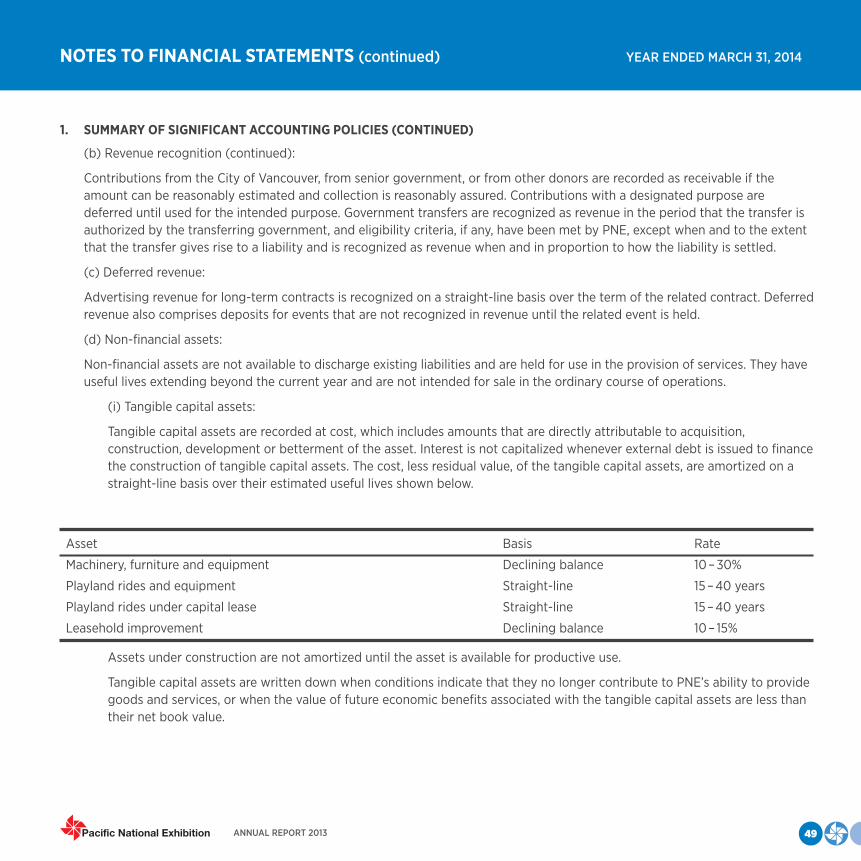
ANNUAL REPORT 2013
NOTES TO FINANCIAL STATEMENTS (continued) YEAR ENDED MARCH 31, 2014
1. SUMMARY OF SIGNIFICANT ACCOUNTING POLICIES (CONTINUED)
(b) Revenue recognition (continued):
Contributions from the City of Vancouver, from senior government, or from other donors are recorded as receivable if the amount can be reasonably estimated and collection is reasonably assured. Contributions with a designated purpose are deferred until used for the intended purpose. Government transfers are recognized as revenue in the period that the transfer is authorized by the transferring government, and eligibility criteria, if any, have been met by PNE, except when and to the extent that the transfer gives rise to a liability and is recognized as revenue when and in proportion to how the liability is settled.
(c) Deferred revenue:
Advertising revenue for long-term contracts is recognized on a straight-line basis over the term of the related contract. Deferred revenue also comprises deposits for events that are not recognized in revenue until the related event is held.
(d) Non-financial assets:
Non-financial assets are not available to discharge existing liabilities and are held for use in the provision of services. They have useful lives extending beyond the current year and are not intended for sale in the ordinary course of operations.
(i) Tangible capital assets:
Tangible capital assets are recorded at cost, which includes amounts that are directly attributable to acquisition, construction, development or betterment of the asset. Interest is not capitalized whenever external debt is issued to finance the construction of tangible capital assets. The cost, less residual value, of the tangible capital assets, are amortized on a straight-line basis over their estimated useful lives shown below.
Asset Basis Rate
Machinery, furniture and equipment Declining balance 10 – 30%
Playland rides and equipment Straight-line 15 – 40 years
Playland rides under capital lease Straight-line 15 – 40 years
Leasehold improvement Declining balance 10 – 15%
Assets under construction are not amortized until the asset is available for productive use.
Tangible capital assets are written down when conditions indicate that they no longer contribute to PNE’s ability to provide goods and services, or when the value of future economic benefits associated with the tangible capital assets are less than their net book value.
49
NOTES TO FINANCIAL STATEMENTS (continued) YEAR ENDED MARCH 31, 2014
1. SUMMARY OF SIGNIFICANT ACCOUNTING POLICIES (CONTINUED):
(d) Non-financial assets (continued):
(ii) Leased tangible capital assets:
Leases which transfer substantially all of the benefits and risks incidental to ownership of property are accounted for as leased tangible capital assets. All other leases are accounted for as operating leases and the related payments are charged to expenses as incurred.
(iii) Inventories held for use:
Inventories held for use are recorded at the lower of cost and replacement cost.
Inventories are consisted of stores, plush toys, merchandise, and food and beverages. Cost is determined using the weighted average method. Cost of inventories includes acquisition and all costs incurred to deliver inventory to PNE’s head office, including freight, non-refundable taxes, duties, and other landing costs.
Replacement cost is the estimated current price to replace the items.
(e) Financial instruments:
Financial instruments are recorded at fair value on initial recognition. Derivative instruments that are quoted in an active market are reported at fair value. All other financial instruments are subsequently recorded at cost or amortized cost unless management has elected to carry the instruments at fair value.
PNE uses the following method and assumptions to estimate the fair value of each class of financial instruments:
(i) Cash and cash equivalents, accounts receivable, bank indebtedness, accounts payable and accrued liabilities – the carrying amounts approximate fair value due to the short term nature of these instruments.
(ii) Foreign currency hedge instrument — measured at current market price.
Unrealized changes in fair value are not recognized until they are realized, when they are recorded in the statement of operations.
Transaction costs incurred on the acquisition of financial instruments measured subsequently at fair value are expensed as incurred. All other financial instruments are adjusted by transaction costs incurred on acquisition and financing costs, which are amortized using the straight-line method.
All financial assets are assessed for impairment on an annual basis. When a decline is determined to be other than temporary, the amount of the loss is reported in the statement of operations.
50

ANNUAL REPORT 2013
NOTES TO FINANCIAL STATEMENTS (continued) YEAR ENDED MARCH 31, 2014
1. SUMMARY OF SIGNIFICANT ACCOUNTING POLICIES (CONTINUED):
(f) Employee future benefits:
The PNE and its employees make contributions to the Municipal Pension Plan (the “Plan”) which is a multi-employer joint trusteed plan. This plan is a defined benefit plan, providing a pension on retirement based on the member’s age at retirement, length of service and highest earnings averaged over five years. Inflation adjustments are contingent upon available funding. As the assets and liabilities of the plan are not segregated by entity, the plan is accounted for as a defined contribution plan and any contributions of PNE to the plan are expensed as incurred.
(g) Use of estimates:
The preparation of the financial statements in accordance with Canadian public sector accounting standards requires management to make estimates and assumptions. These estimates and assumptions affect the reported amounts of assets, liabilities, and related disclosures. Key areas where management has made estimates and assumptions include those related to useful life of tangible capital assets, valuation of accounts receivable, valuation of inventory and provision for contingencies. Where actual results differ from these estimates and assumptions, the impact will be recorded in future periods when the difference becomes known.
(h) Foreign currency:
Foreign currency transactions are recorded at the exchange rate at the time of the transaction.
Assets and liabilities denominated in foreign currencies are recorded at fair value using the exchange rate at the financial statement date. Unrealized foreign exchange gains and losses are recognized in the statement of operations.
(i) Budget figures:
Budget figures have been provided for comparative purposes and have been derived from the Corporate Plan for 2013/2014 approved by the Board of Directors of PNE on February 21, 2013. The budget is reflected in the Statement of Operations and Accumulated Surplus and the Statement of Changes in Net Debt.
51

2. DUE FROM/(TO) GOVERNMENT AND OTHER GOVERNMENT ORGANIZATIONS:
Included in accounts receivable and accounts payable and accrued liabilities are the following amounts due from/to government:
2014 2013
Accounts receivable:City of Vancouver $ - $ 164,500Sales tax rebates receivable 248,392 117,384
$ 248,392 $ 281,884Accounts payable and accrued liabilities:
City of Vancouver $ (108,682) $ -Payroll remittances (131,733) (112,132)
$ 7,977 $ 169,752
3. BANK INDEBTEDNESS AND BANK LOANS:
PNE has a revolving facility with a Canadian chartered bank providing for maximum borrowing of $16.4 million in operating credit and $5 million for instalment loan for capital purchases. The facilities bear interest at the bank prime rate and are due on demand. A general security agreement covering all assets and undertakings of PNE has been provided as collateral for the operating line as well as a guarantee and postponement of claim by the City of Vancouver. In addition, the guarantee by the City of Vancouver includes letters of guarantee outstanding totaling $160,000 (2013 - $160,000).
Included in the bank loans is an amount of $4.78 million denominated in US dollars (2013 - nil). The US dollar denominated bank loan bears interest of LIBOR rate plus 1% per annum and is due April 4, 2014. The loan is renewable on a monthly basis. The interest due on this loan is payable in US dollars.
The bank loans are measured at amortized cost.
6. ACCOUNTS PAYABLE AND ACCRUED LIABILITIES:
2014 2013
Accounts payables and accrued liabilities $ 4,447,074 $ 2,225,841Salaries and benefits payable 620,079 576,392Accrued vacation pay 343,412 268,880Other 39,020 75,290
$ 5,449,585 $ 3,146,403
NOTES TO FINANCIAL STATEMENTS (continued) YEAR ENDED MARCH 31, 2014
52
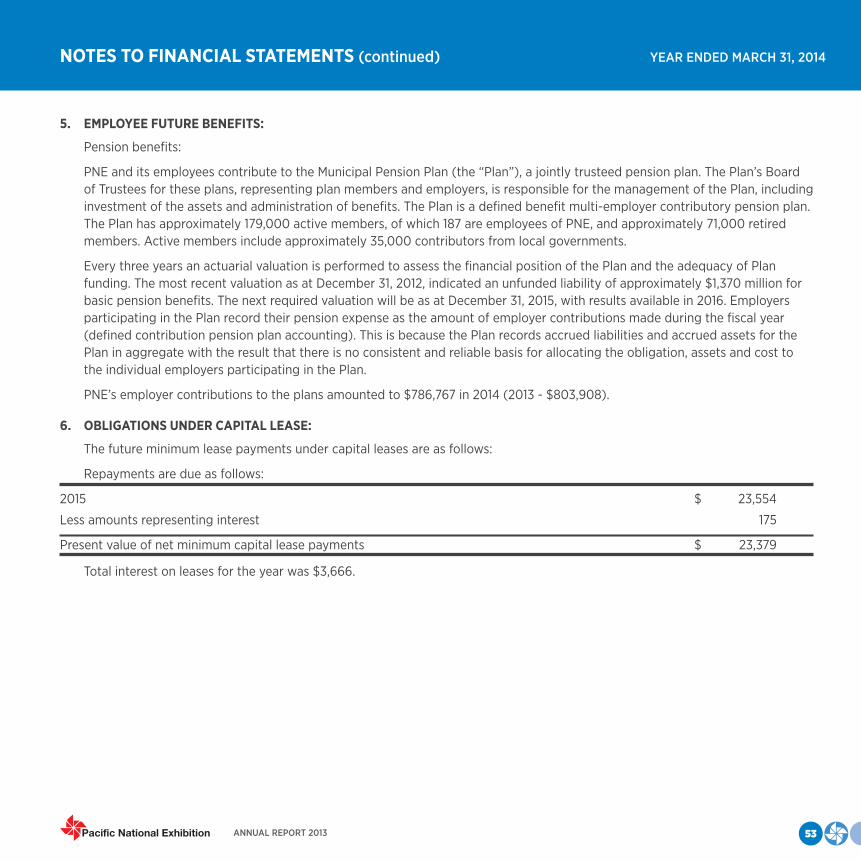
ANNUAL REPORT 2013
5. EMPLOYEE FUTURE BENEFITS:
Pension benefits:
PNE and its employees contribute to the Municipal Pension Plan (the “Plan”), a jointly trusteed pension plan. The Plan’s Board of Trustees for these plans, representing plan members and employers, is responsible for the management of the Plan, including investment of the assets and administration of benefits. The Plan is a defined benefit multi-employer contributory pension plan. The Plan has approximately 179,000 active members, of which 187 are employees of PNE, and approximately 71,000 retired members. Active members include approximately 35,000 contributors from local governments.
Every three years an actuarial valuation is performed to assess the financial position of the Plan and the adequacy of Plan funding. The most recent valuation as at December 31, 2012, indicated an unfunded liability of approximately $1,370 million for basic pension benefits. The next required valuation will be as at December 31, 2015, with results available in 2016. Employers participating in the Plan record their pension expense as the amount of employer contributions made during the fiscal year (defined contribution pension plan accounting). This is because the Plan records accrued liabilities and accrued assets for the Plan in aggregate with the result that there is no consistent and reliable basis for allocating the obligation, assets and cost to the individual employers participating in the Plan.
PNE’s employer contributions to the plans amounted to $786,767 in 2014 (2013 - $803,908).
6. OBLIGATIONS UNDER CAPITAL LEASE:
The future minimum lease payments under capital leases are as follows:
Repayments are due as follows:
2015 $ 23,554
Less amounts representing interest 175
Present value of net minimum capital lease payments $ 23,379
Total interest on leases for the year was $3,666.
NOTES TO FINANCIAL STATEMENTS (continued) YEAR ENDED MARCH 31, 2014
53

7. TANGIBLE CAPITAL ASSETS:
Balance at Balance at March 31, March 31, Cost 2013 Additions Disposals Transfers 2014
Machinery, furniture and equipment $ 15,023,275 $ - $ - $ 693,974 $ 15,717,249
Playland rides and equipment 17,853,142 - - 1,076,400 18,929,542
Assets under construction 715,719 2,203,346 - (1,770,374) 1,148,691
Total $ 33,592,136 $ 2,203,346 $ - $ - $ 35,795,482
Balance at Balance at Accumulated March 31, Amortization March 31, amortization 2013 Disposals expense 2014
Machinery, furniture and equipment $ 8,490,465 $ - $ 909,800 $ 9,400,265
Playland rides and equipment 10,004,134 - 634,355 10,638,489
Assets under construction - - - -
Total $ 18,494,599 $ - $ 1,544,155 $ 20,038,754
Net book value Net book value March 31, 2013 March 31, 2013
Machinery, furniture and equipment $ 6,532,810 $ 6,316,984
Playland rides and equipment 7,849,008 8,291,053
Assets under construction 715,719 1,148,691
Total $ 15,097,537 $ 15,756,728
(a) Work in progress:
Work in progress having a value of $1,148,691 (2013 -$714,239) have not been amortized.
Amortization of these assets will commence when the asset is put into service.
(b) Writedown of tangible capital assets:
There are no writedown of tangible capital assets in the current year (2013 - nil).
NOTES TO FINANCIAL STATEMENTS (continued) YEAR ENDED MARCH 31, 2014
54
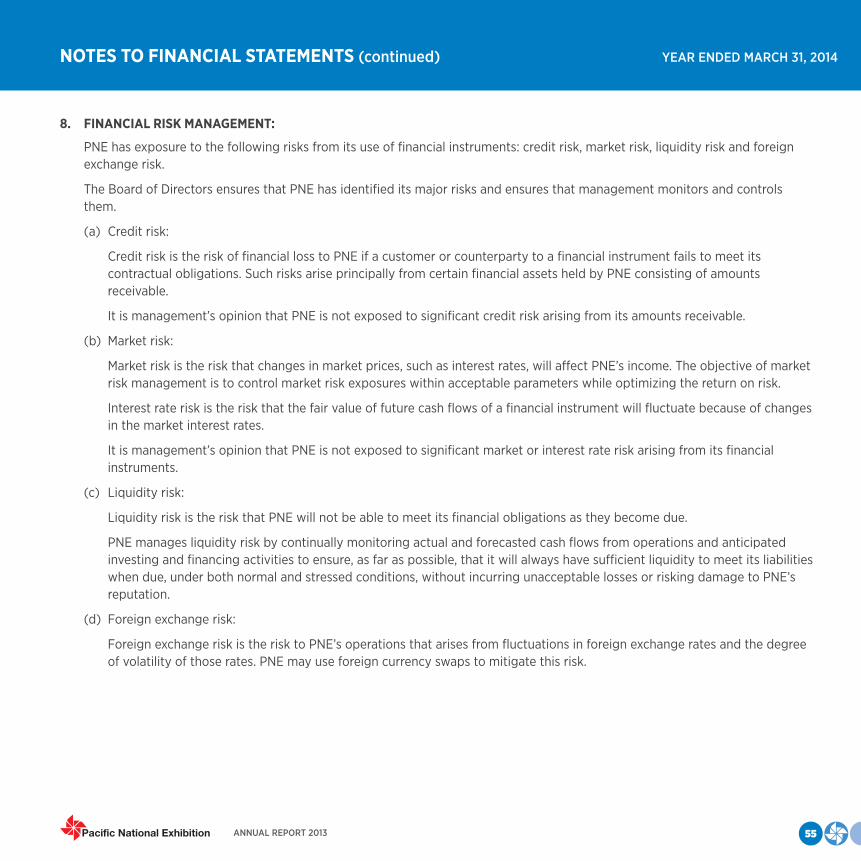
ANNUAL REPORT 2013
8. FINANCIAL RISK MANAGEMENT:
PNE has exposure to the following risks from its use of financial instruments: credit risk, market risk, liquidity risk and foreign exchange risk.
The Board of Directors ensures that PNE has identified its major risks and ensures that management monitors and controls them.
(a) Credit risk:
Credit risk is the risk of financial loss to PNE if a customer or counterparty to a financial instrument fails to meet its contractual obligations. Such risks arise principally from certain financial assets held by PNE consisting of amounts receivable.
It is management’s opinion that PNE is not exposed to significant credit risk arising from its amounts receivable.
(b) Market risk:
Market risk is the risk that changes in market prices, such as interest rates, will affect PNE’s income. The objective of market risk management is to control market risk exposures within acceptable parameters while optimizing the return on risk.
Interest rate risk is the risk that the fair value of future cash flows of a financial instrument will fluctuate because of changes in the market interest rates.
It is management’s opinion that PNE is not exposed to significant market or interest rate risk arising from its financial instruments.
(c) Liquidity risk:
Liquidity risk is the risk that PNE will not be able to meet its financial obligations as they become due.
PNE manages liquidity risk by continually monitoring actual and forecasted cash flows from operations and anticipated investing and financing activities to ensure, as far as possible, that it will always have sufficient liquidity to meet its liabilities when due, under both normal and stressed conditions, without incurring unacceptable losses or risking damage to PNE’s reputation.
(d) Foreign exchange risk:
Foreign exchange risk is the risk to PNE’s operations that arises from fluctuations in foreign exchange rates and the degree of volatility of those rates. PNE may use foreign currency swaps to mitigate this risk.
NOTES TO FINANCIAL STATEMENTS (continued) YEAR ENDED MARCH 31, 2014
55
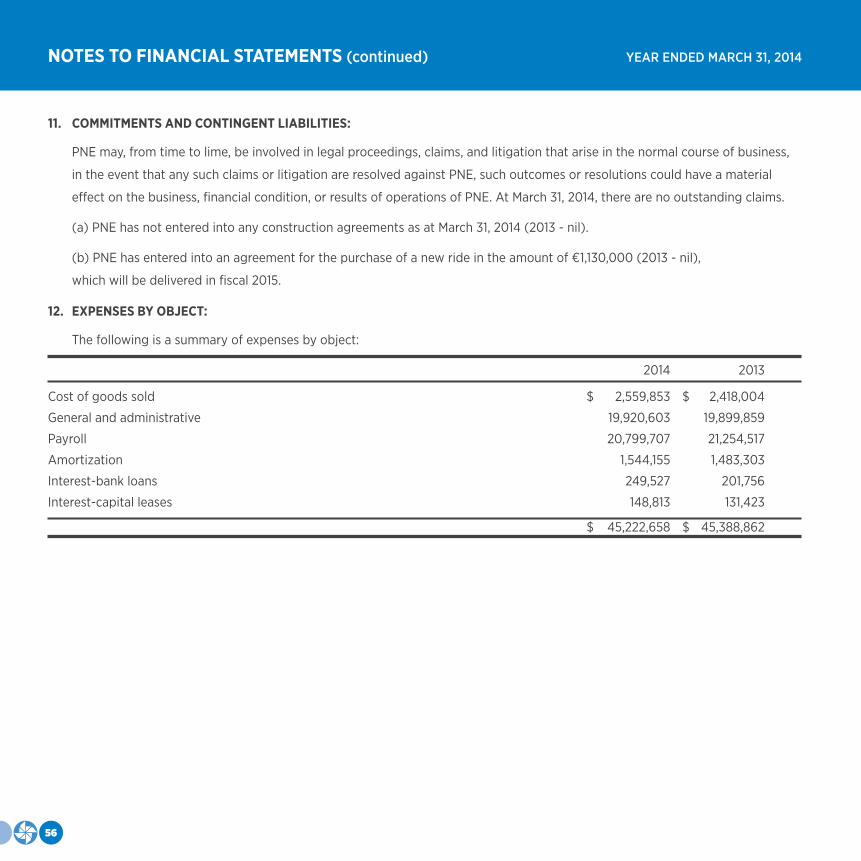
11. COMMITMENTS AND CONTINGENT LIABILITIES:
PNE may, from time to lime, be involved in legal proceedings, claims, and litigation that arise in the normal course of business,
in the event that any such claims or litigation are resolved against PNE, such outcomes or resolutions could have a material
effect on the business, financial condition, or results of operations of PNE. At March 31, 2014, there are no outstanding claims.
(a) PNE has not entered into any construction agreements as at March 31, 2014 (2013 - nil).
(b) PNE has entered into an agreement for the purchase of a new ride in the amount of €1,130,000 (2013 - nil),
which will be delivered in fiscal 2015.
12. EXPENSES BY OBJECT:
The following is a summary of expenses by object:
2014 2013
Cost of goods sold $ 2,559,853 $ 2,418,004
General and administrative 19,920,603 19,899,859
Payroll 20,799,707 21,254,517
Amortization 1,544,155 1,483,303
Interest-bank loans 249,527 201,756
Interest-capital leases 148,813 131,423
$ 45,222,658 $ 45,388,862
NOTES TO FINANCIAL STATEMENTS (continued) YEAR ENDED MARCH 31, 2014
56

2901 East Hastings Street Vancouver, BC V5K 5J1
pne.ca