Pacific Islands GIS&RS news · Pacific Islands The Newsletter of the GIS&Remote Sensing Users in...
16
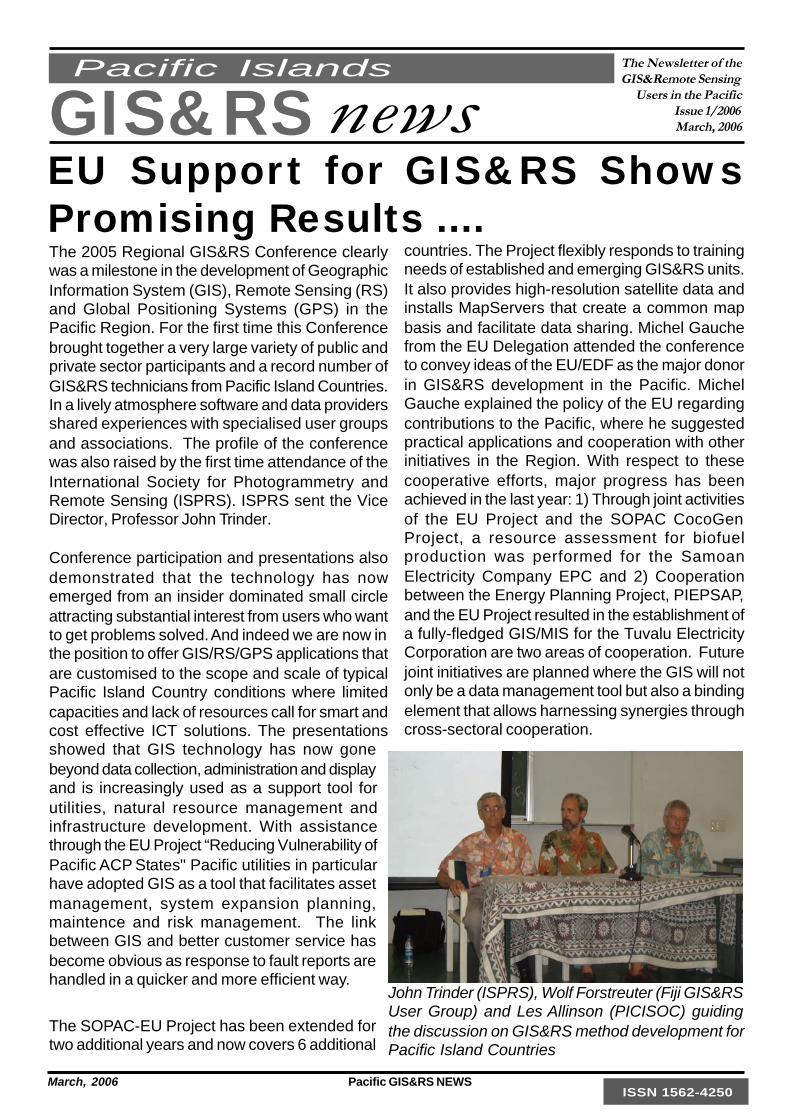
March, 2006 Pacific GIS&RS NEWS GIS&RS news Pacific Islands The Newsletter of the GIS&Remote Sensing Users in the Pacific Issue 1/2006 March, 2006 The 2005 Regional GIS&RS Conference clearly was a milestone in the development of Geographic Information System (GIS), Remote Sensing (RS) and Global Positioning Systems (GPS) in the Pacific Region. For the first time this Conference brought together a very large variety of public and private sector participants and a record number of GIS&RS technicians from Pacific Island Countries. In a lively atmosphere software and data providers shared experiences with specialised user groups and associations. The profile of the conference was also raised by the first time attendance of the International Society for Photogrammetry and Remote Sensing (ISPRS). ISPRS sent the Vice Director, Professor John Trinder. Conference participation and presentations also demonstrated that the technology has now emerged from an insider dominated small circle attracting substantial interest from users who want to get problems solved. And indeed we are now in the position to offer GIS/RS/GPS applications that are customised to the scope and scale of typical Pacific Island Country conditions where limited capacities and lack of resources call for smart and cost effective ICT solutions. The presentations showed that GIS technology has now gone beyond data collection, administration and display and is increasingly used as a support tool for utilities, natural resource management and infrastructure development. With assistance through the EU Project “Reducing Vulnerability of Pacific ACP States" Pacific utilities in particular have adopted GIS as a tool that facilitates asset management, system expansion planning, maintence and risk management. The link between GIS and better customer service has become obvious as response to fault reports are handled in a quicker and more efficient way. The SOPAC-EU Project has been extended for two additional years and now covers 6 additional ISSN 1562-4250 countries. The Project flexibly responds to training needs of established and emerging GIS&RS units. It also provides high-resolution satellite data and installs MapServers that create a common map basis and facilitate data sharing. Michel Gauche from the EU Delegation attended the conference to convey ideas of the EU/EDF as the major donor in GIS&RS development in the Pacific. Michel Gauche explained the policy of the EU regarding contributions to the Pacific, where he suggested practical applications and cooperation with other initiatives in the Region. With respect to these cooperative efforts, major progress has been achieved in the last year: 1) Through joint activities of the EU Project and the SOPAC CocoGen Project, a resource assessment for biofuel production was performed for the Samoan Electricity Company EPC and 2) Cooperation between the Energy Planning Project, PIEPSAP, and the EU Project resulted in the establishment of a fully-fledged GIS/MIS for the Tuvalu Electricity Corporation are two areas of cooperation. Future joint initiatives are planned where the GIS will not only be a data management tool but also a binding element that allows harnessing synergies through cross-sectoral cooperation. EU Support for GIS&RS Shows Promising Results .... John Trinder (ISPRS), Wolf Forstreuter (Fiji GIS&RS User Group) and Les Allinson (PICISOC) guiding the discussion on GIS&RS method development for Pacific Island Countries
Transcript of Pacific Islands GIS&RS news · Pacific Islands The Newsletter of the GIS&Remote Sensing Users in...
March, 2006 Pacific GIS&RS NEWS
GIS&RS newsPacific Islands The Newsletter of the
GIS&Remote SensingUsers in the Pacific
Issue 1/2006March, 2006
The 2005 Regional GIS&RS Conference clearlywas a milestone in the development of GeographicInformation System (GIS), Remote Sensing (RS)and Global Positioning Systems (GPS) in thePacific Region. For the first time this Conferencebrought together a very large variety of public andprivate sector participants and a record number ofGIS&RS technicians from Pacific Island Countries.In a lively atmosphere software and data providersshared experiences with specialised user groupsand associations. The profile of the conferencewas also raised by the first time attendance of theInternational Society for Photogrammetry andRemote Sensing (ISPRS). ISPRS sent the ViceDirector, Professor John Trinder.
Conference participation and presentations alsodemonstrated that the technology has nowemerged from an insider dominated small circleattracting substantial interest from users who wantto get problems solved. And indeed we are now inthe position to offer GIS/RS/GPS applications thatare customised to the scope and scale of typicalPacific Island Country conditions where limitedcapacities and lack of resources call for smart andcost effective ICT solutions. The presentationsshowed that GIS technology has now gonebeyond data collection, administration and displayand is increasingly used as a support tool forutilities, natural resource management andinfrastructure development. With assistancethrough the EU Project “Reducing Vulnerability ofPacific ACP States" Pacific utilities in particularhave adopted GIS as a tool that facilitates assetmanagement, system expansion planning,maintence and risk management. The linkbetween GIS and better customer service hasbecome obvious as response to fault reports arehandled in a quicker and more efficient way.
The SOPAC-EU Project has been extended fortwo additional years and now covers 6 additional
ISSN 1562-4250
countries. The Project flexibly responds to trainingneeds of established and emerging GIS&RS units.It also provides high-resolution satellite data andinstalls MapServers that create a common mapbasis and facilitate data sharing. Michel Gauchefrom the EU Delegation attended the conferenceto convey ideas of the EU/EDF as the major donorin GIS&RS development in the Pacific. MichelGauche explained the policy of the EU regardingcontributions to the Pacific, where he suggestedpractical applications and cooperation with otherinitiatives in the Region. With respect to thesecooperative efforts, major progress has beenachieved in the last year: 1) Through joint activitiesof the EU Project and the SOPAC CocoGenProject, a resource assessment for biofuelproduction was performed for the SamoanElectricity Company EPC and 2) Cooperationbetween the Energy Planning Project, PIEPSAP,and the EU Project resulted in the establishment ofa fully-fledged GIS/MIS for the Tuvalu ElectricityCorporation are two areas of cooperation. Futurejoint initiatives are planned where the GIS will notonly be a data management tool but also a bindingelement that allows harnessing synergies throughcross-sectoral cooperation.
EU Support for GIS&RS ShowsPromising Results ....
John Trinder (ISPRS), Wolf Forstreuter (Fiji GIS&RSUser Group) and Les Allinson (PICISOC) guidingthe discussion on GIS&RS method development forPacific Island Countries

2 Pacific GIS&RS NEWS March, 2006
ContentGIS - Making a Difference: 2005 PIC Conference Overview 3Discussions on Demand for Method Development in GIS and Remote Sensing 4FEA GIS; Separating Spatial Data and Tabular Data 61:10,000 DTM for Atoll Islands Utiising Kinematic GPS 8Application of GIS in the Samoa Water Authority Utility 10A 3D Physical Model of the South East Coastline of Vitilevu, Fij 10Geological Mapping of Kioa, Fiji 12Coastal Landform and Landuse Study and their Changes Using Multi-Temporal Remote 13Sensing Data in the South Andaman Island 13GIS Contributes to the Better Magement of SIEA 16
The crew of the International Space Station took the photograph on 16 April 2004 with a Kodak DCS760 digitalcamera equipped with a 200-mm lens. The Earth Observations Laboratory, Johnson Space Center, providedthe image. The International Space Station Program supports the laboratory to help astronauts take picturesof Earth that will be of the greatest value to scientists and the public, and to make those images freely availableon the Internet.
When this image was taken, strong currents carried turbid coastal watersfrom the Black Sea through the Strait and into the Sea of Marmara. Therugged uplands to the north of the city are forested and contain vitalreservoirs. Note Ataturk airport southwest of the city near the bottom of theimage, the picturesque Prince Islands in the Sea of Marmara, and the sinuouswaterway and harbor on the western shore known as the Golden Horn.
March, 2006 Pacific GIS&RS NEWS 3
The 2006 Annual Pacific Island Countries GIS/RS UserConference was organised by the Fiji GIS/RS UserGroup Committee from the 23rd to 25th of November2005 and attracted more than 250 participants frommost Pacific Island Countries. It was held at the MarineStudies Complex of the University of the South Pacific(USP), in Suva, Fiji. Despite the limited funding, theconference proved to be a huge success with morethan last year participants and presenters. The totalnumber of presentations had to be reduced and thetime shortened for all of the ten sessions. Theconference days probably needs to be extended tothe increased number of presentations.Participants travelled from Samoa, Vanuatu, PapuaNew Guinea, Solomon Islands, Tuvalu, Tonga and theMarshall Islands. The SOPAC-EU Project partly fundedtechnicians to attend and present on the GIS/RSactivities and updates from their countries.Special guest speakers at the conference were MrJohn Trinder, the President of the International Societyof Photogrammetry and Remote Sensing (ISPRS), MrLes Allinson, Secretary of the Pacific Islands Chapterof the Internet Society (PICISOC) and Mr MichelGauche from the EU Delegation.There was a broad coverage of presentations fromthe applications of GIS/RS, utilities sectors, institutionsand software hardware companies. Osea Tuinivanuafrom the Fisheries Department for example presentedongoing investigations on enhancing the VesselMonitoring System using space-borne radar data.Representatives of software and data vendors wereat the conference to present on the softwaredevelopments from the various companies. Theseincluded the representatives of Critchlow New Zealand(MapInfo distributor for the Pacific), RadarsatInternational, ESRI Company and Intergraph, NewZealand Limited. The presentation by Radarsat (nowknown as MDA) was quite interesting as they havebeen one of the main data distributors of satelliteimages in the Pacific for the last three years. Therewas a noted increase in the number of companiespresent at the conference, which is a result of thegrowing interest in the region.USP students presented their final year projects onnew methods of GIS/RS applications.Discussions were held in the final session, on methoddevelopment that will be at an affordable cost to the
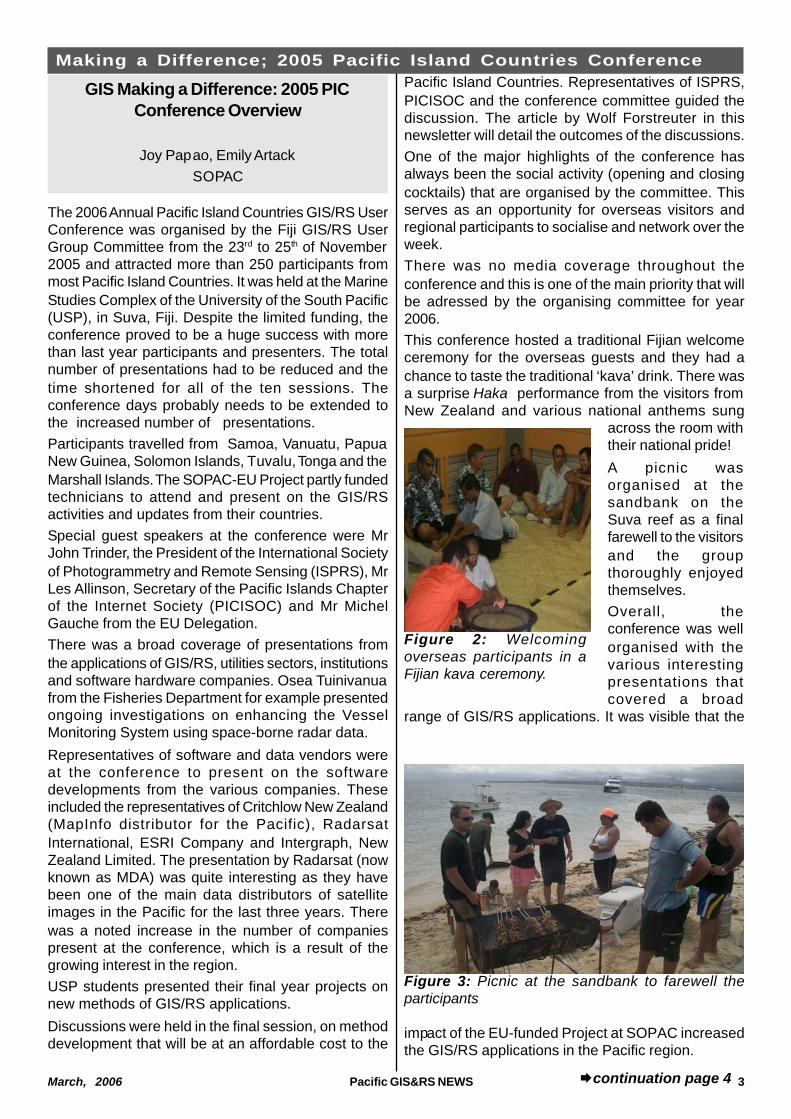
Making a Difference; 2005 Pacific Island Countries ConferencePacific Island Countries. Representatives of ISPRS,PICISOC and the conference committee guided thediscussion. The article by Wolf Forstreuter in thisnewsletter will detail the outcomes of the discussions.One of the major highlights of the conference hasalways been the social activity (opening and closingcocktails) that are organised by the committee. Thisserves as an opportunity for overseas visitors andregional participants to socialise and network over theweek.There was no media coverage throughout theconference and this is one of the main priority that willbe adressed by the organising committee for year2006.This conference hosted a traditional Fijian welcomeceremony for the overseas guests and they had achance to taste the traditional ‘kava’ drink. There wasa surprise Haka performance from the visitors fromNew Zealand and various national anthems sung
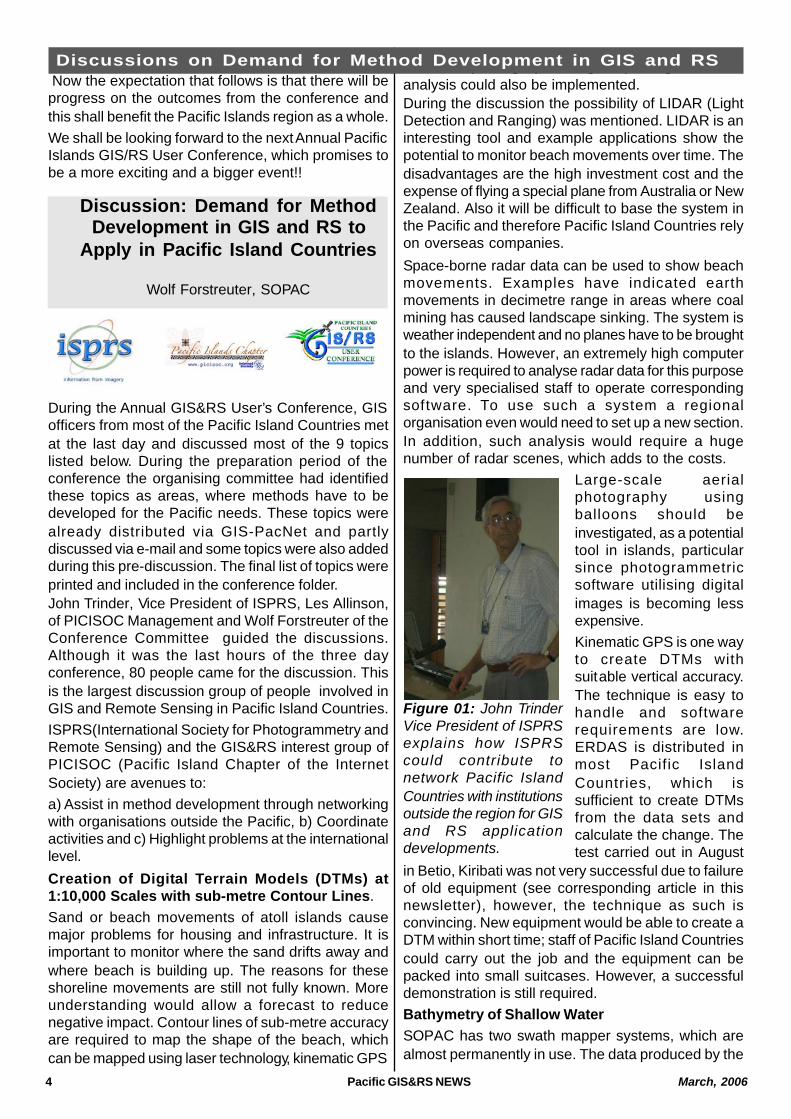
across the room withtheir national pride!A picnic wasorganised at thesandbank on theSuva reef as a finalfarewell to the visitorsand the groupthoroughly enjoyedthemselves.Overall, theconference was wellorganised with thevarious interestingpresentations thatcovered a broad
range of GIS/RS applications. It was visible that the
impact of the EU-funded Project at SOPAC increasedthe GIS/RS applications in the Pacific region.
Figure 3: Picnic at the sandbank to farewell theparticipants
Figure 2: Welcomingoverseas participants in aFijian kava ceremony.
GIS Making a Difference: 2005 PICConference Overview
Joy Papao, Emily ArtackSOPAC
continuation page 4
4 Pacific GIS&RS NEWS March, 2006
During the Annual GIS&RS User’s Conference, GISofficers from most of the Pacific Island Countries metat the last day and discussed most of the 9 topicslisted below. During the preparation period of theconference the organising committee had identifiedthese topics as areas, where methods have to bedeveloped for the Pacific needs. These topics werealready distributed via GIS-PacNet and partlydiscussed via e-mail and some topics were also addedduring this pre-discussion. The final list of topics wereprinted and included in the conference folder.John Trinder, Vice President of ISPRS, Les Allinson,of PICISOC Management and Wolf Forstreuter of theConference Committee guided the discussions.Although it was the last hours of the three dayconference, 80 people came for the discussion. Thisis the largest discussion group of people involved inGIS and Remote Sensing in Pacific Island Countries.ISPRS(International Society for Photogrammetry andRemote Sensing) and the GIS&RS interest group ofPICISOC (Pacific Island Chapter of the InternetSociety) are avenues to:a) Assist in method development through networkingwith organisations outside the Pacific, b) Coordinateactivities and c) Highlight problems at the internationallevel.Creation of Digital Terrain Models (DTMs) at1:10,000 Scales with sub-metre Contour Lines.Sand or beach movements of atoll islands causemajor problems for housing and infrastructure. It isimportant to monitor where the sand drifts away andwhere beach is building up. The reasons for theseshoreline movements are still not fully known. Moreunderstanding would allow a forecast to reducenegative impact. Contour lines of sub-metre accuracyare required to map the shape of the beach, whichcan be mapped using laser technology, kinematic GPS
or aerial photographs. Digital photogrammetricanalysis could also be implemented.During the discussion the possibility of LIDAR (LightDetection and Ranging) was mentioned. LIDAR is aninteresting tool and example applications show thepotential to monitor beach movements over time. Thedisadvantages are the high investment cost and theexpense of flying a special plane from Australia or NewZealand. Also it will be difficult to base the system inthe Pacific and therefore Pacific Island Countries relyon overseas companies.Space-borne radar data can be used to show beachmovements. Examples have indicated earthmovements in decimetre range in areas where coalmining has caused landscape sinking. The system isweather independent and no planes have to be broughtto the islands. However, an extremely high computerpower is required to analyse radar data for this purposeand very specialised staff to operate correspondingsoftware. To use such a system a regionalorganisation even would need to set up a new section.In addition, such analysis would require a hugenumber of radar scenes, which adds to the costs.
Large-scale aerialphotography usingballoons should beinvestigated, as a potentialtool in islands, particularsince photogrammetricsoftware utilising digitalimages is becoming lessexpensive.Kinematic GPS is one wayto create DTMs withsuitable vertical accuracy.The technique is easy tohandle and softwarerequirements are low.ERDAS is distributed inmost Pacific IslandCountries, which issufficient to create DTMsfrom the data sets andcalculate the change. Thetest carried out in August
in Betio, Kiribati was not very successful due to failureof old equipment (see corresponding article in thisnewsletter), however, the technique as such isconvincing. New equipment would be able to create aDTM within short time; staff of Pacific Island Countriescould carry out the job and the equipment can bepacked into small suitcases. However, a successfuldemonstration is still required.Bathymetry of Shallow WaterSOPAC has two swath mapper systems, which arealmost permanently in use. The data produced by the
Discussions on Demand for Method Development in GIS and RS Now the expectation that follows is that there will beprogress on the outcomes from the conference andthis shall benefit the Pacific Islands region as a whole.We shall be looking forward to the next Annual PacificIslands GIS/RS User Conference, which promises tobe a more exciting and a bigger event!!
Discussion: Demand for MethodDevelopment in GIS and RS to
Apply in Pacific Island Countries
Wolf Forstreuter, SOPAC
Figure 01: John TrinderVice President of ISPRSexplains how ISPRScould contribute tonetwork Pacific IslandCountries with institutionsoutside the region for GISand RS applicationdevelopments.
March, 2006 Pacific GIS&RS NEWS
instruments allow the creation of under water DTMs,which are necessary for near shore fishery, navigationand other purposes. However, the boats carrying theswath mapper cannot drive in shallow waters, whichleave a gap between the contour lines on land and indeeper water. Space Borne image data could beanalysed to map this shallow water areas between 0and 5 meter water depth. Maps of 1:10,000 scale arerequired, which restricts the analysis to multi-spectral,high-resolution satellite images. These image data areseldom available in nadir recording and the data arepatched with recordings of different view angles andatmospheric conditions. Atmospheric correction of theimage data will be necessary.Wolf Forstreuter said that SOPAC’s Director made astatement that funds would be made available tofinance a student investigating methods to developbathymetry of shallow water utilising the existing datasets.More Frequent Space Borne Image Data (MobilGround Receiving Station)With the exception of PNG all Pacific Island Countriesare outside the footprint of any ground receiving station.For every image recording, on-board tape space hasto be booked. Last minute decision related to cloudcover is therefore impossible in the Pacific. A mobileground receiving station would provide faster and morecloud- free image data. The participants suggestedthat there must be new ways to bring this topic toregional decision maker level. John Trinder suggestedthat UN organisations such as UNDP or FAO couldbe an additional source of support to distribute the ideabesides ISPRS.Ocean Colour MonitoringThe observation of ocean colour, wave height, oceantemperature and wind speed can be carried out utilisingspace borne sensors. The data show where nutrient-rich water attracts fish and therefore has potentialeconomic benefits to the Pacific Island Countries.Remotely-sensed images of open water also allowsfor the improved guiding of the local fishing fleets, aswell as indicating areas where foreign fishing vesselscould fish within the EEZ. No fishing or navigationaldepartment in the Pacific has implemented thesetechnologies. Use of this information is beingaddressed in the immediate term under the auspicesof the Pacific Islands Global Ocean Observing System(PI-GOOS) based at SOPAC. The PI-GOOS Programis working towards conducting workshops in countryin 2006-2007 that will demonstrate the use and valueof ocean colour monitoring and other remotely sensedimages of open water in the Pacific Island EEZs. Otherongoing activities at SOPAC include theimplementation of hardware, software and trainingprograms in the fishery departments of Pacific IslandCountries.
John Trinder mentioned that there is an ISPRS workinggroup taking care of activities in this area and that hewill network with institutions of the Pacific.Fishing Vessel Detection and MonitoringThe Vessel Monitoring System was established yearsago at the Forum Fisheries Agency in Honiara. SomePacific Island Countries want to have their ownmonitoring system in addition to the central one.Vessel detection and monitoring will be one of thetarget areas in research and method development forthe next few years.Fiji’s Fisheries Department and SOPAC together withthe Joint Research Centre of the EU Commissioncurrently investigate the potential of radar data toenhance the Vessel Monitoring System.Open Source SoftwareGIS and remote sensing units in Pacific IslandCountries work with a very limited budget. For thisreason investment and maintenance of software areserious financial issues. One solution would be toswitch to open-source software as soon as suchproducts are available in a quality allowing applicationfor a “normal” user. It is expected that such productswill be available within the next few years for a)database management, b) GIS application and c)image enhancement and analysis. Such software hasto be tested at SOPAC and USP before beingimplementing it in Pacific Island Countries.The University of the South Pacific stated that theywill not move into open-source software teaching withinthe next 3 years. Instead, their focus will be to developnew information systems and open-source softwareinvestigations will be only carried out as studentprojects. Les Allinson mentioned that funding wouldbe available through ISOC for research anddevelopment.Monitoring BiodiversityPacific Island Countries have a high biodiversity, whichrefers to the number of species in the water and onland. Remote sensing data and GIS will help to monitorthe biodiversity; however, new methods have to bedeveloped where statistically sound monitoring isapplied to a large geographical area.Inventory and Monitoring Palm CoverMany Pacific Island Countries are 100% dependenton imported fuels. At the same time world marketprices dictate the earnings from major exportproduction coconut oil or copra. Currently there is across over of diesel supply cost and net earnings forcopra. The coconut resource was neglected duringthe last decades. Coconut could potentially substitutediesel; but for this to occur, it is essential thatinventories have to be carried out to estimate theamount of available resource. High-resolution space-
for Pacific Island Countries
continuation page 6

March, 2006 Pacific GIS&RS NEWS
FEA GIS: Separating Spatial Data andTabular Data
Etika NaitiniFiji Electricity Authority
borne satellite images have proven to be ideal tool tomap the coconut cover. Methods have to bedeveloped to map and monitor the coconut resourcein a statistically sound way. During the discussion itwas recommended that SOPAC take responsibilityfor the investigating and implementing new methodsof palm monitoring.Data Sharing and GeoCMSUsers have indicated the need to make data sharingeasier between organisations. For this to occur, it isimportant to have policies of public data accessibility.Such datasets can then improve economicdevelopment. Data, which are publishable, can beaccessed through a Geospatial Content ManagementSystem (GeoCMS) that provides maps, geographicdata and metadata via a wiki system. Such a systemis already being deployed in the Pacific Islands: http://maps.tikiwiki.org/There will be further development at SOPAC to makethe system more user friendly. It was alsorecommended that SPC demographic data shouldbe included.Early Detection of LandslidesLandslides create major damage on roads andhouses in volcanic Islands like Samoa, Vanuatu andFiji. Mapping potential landslides employing remotesensing methods would helpful for such islands. Itshould be investigated how far GIS&RS can beutilised.The group of people interested in the topic had leftalready the room and there was no furtherdiscussion:Summary:The participants of the discussion stated that:
OOOOO the discussion should continue via GIS-PacNet;
OOOOO through ISPRS and GIS&RS interest groupof PICISOC networking will link to informationsources outside the Pacific;
OOOOO that such a discussion has to involvetechnicians, which never were contacted byorganisations such as PCGIAP or ESCAP;
OOOOO that ISPRS and the GIS&RS interest groupof PICISOC should monitor activities to avoidduplication of effort.
FEA GIS; Separating Spatial Data
IntroductionOver the last year the GIS office at the Fiji ElectricityAuthority has been working on setting up a databaseof its distribution assets. As a proven planning andanalysis tool, the introduction of GIS into FEA shouldincrease efficiency by providing users easier accessto the Authority’s distribution data, which can bequeried to provide meaningful information. Theemphasis of this article is on separating spatial andtabular data between MapInfo and Access Databaseand also the database setup. One of the duties of theGIS office at FEA,formerly known as the DrawingOffice is to store, update and disseminate data anddrawings regarding our distribution assets. A fair shareof our distribution data are still in hard copy drawings.The primary aim for setting up a GIS database was toimprove the mode of service provided by the GIS officeby transferring all our distribution data which are stillin hardcopy, into digital format and setting up adatabase. With reduction in office staff and newextensions to our distribution lines everyday, settingup a GIS database was seen as the solution toefficiently store, retrieve and update our distributiondrawings and making data easily accessible to usersData Analysis: MapInfoOnce corrected, field data is imported into MapInfo,the selected GIS software for this project. In MapInfo,routine analysis of data is carried out. This includestasks such as cross checking and supplementing fielddata with information from drawings and office recordsand separating of spatial layers. Small programs arewritten in MapBasic to perform repetitive tasks likemodifying table structure, grouping like data together,calculation of line spans and also assigning a uniqueID to assets captured in the field. Once data analysisis done, the tables are then exported to Accessdatabase where tabular data is stored whilst spatiadata is kept in MapInfo.Tabular data: Microsoft Access DatabaseWe are using Microsoft Access as the database tostore tabular data. Relationships are created betweendatasets to show how assets are linked to each other.Library tables are created to group together similardata, this would also help simplify querying and editingrecords in the database. Forms are also created foreasy navigation through the database and forsimplifying data-entry purposes.
March, 2006 Pacific GIS&RS NEWS 7
and Tabular Data
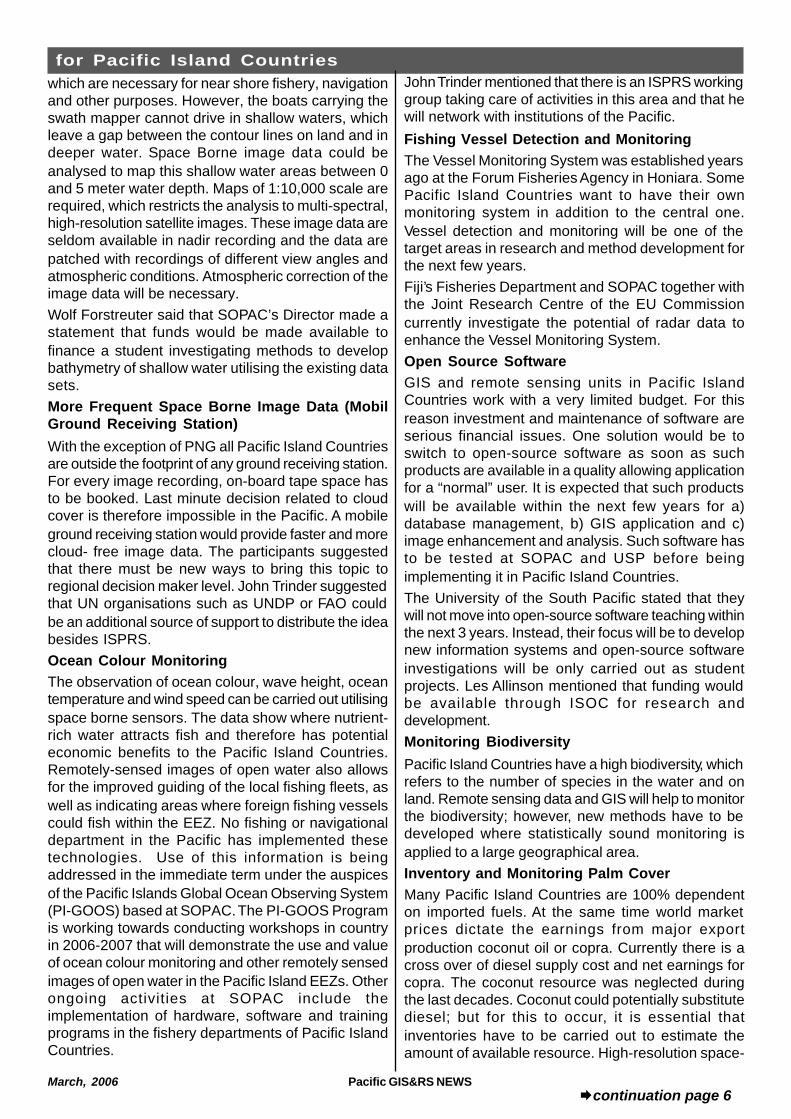
Figure 1: GIS database in Access. Asset details areviewed through the use of forms. A customised versionof MapInfo is executed from this Access by clickingon the MapInfo icon.
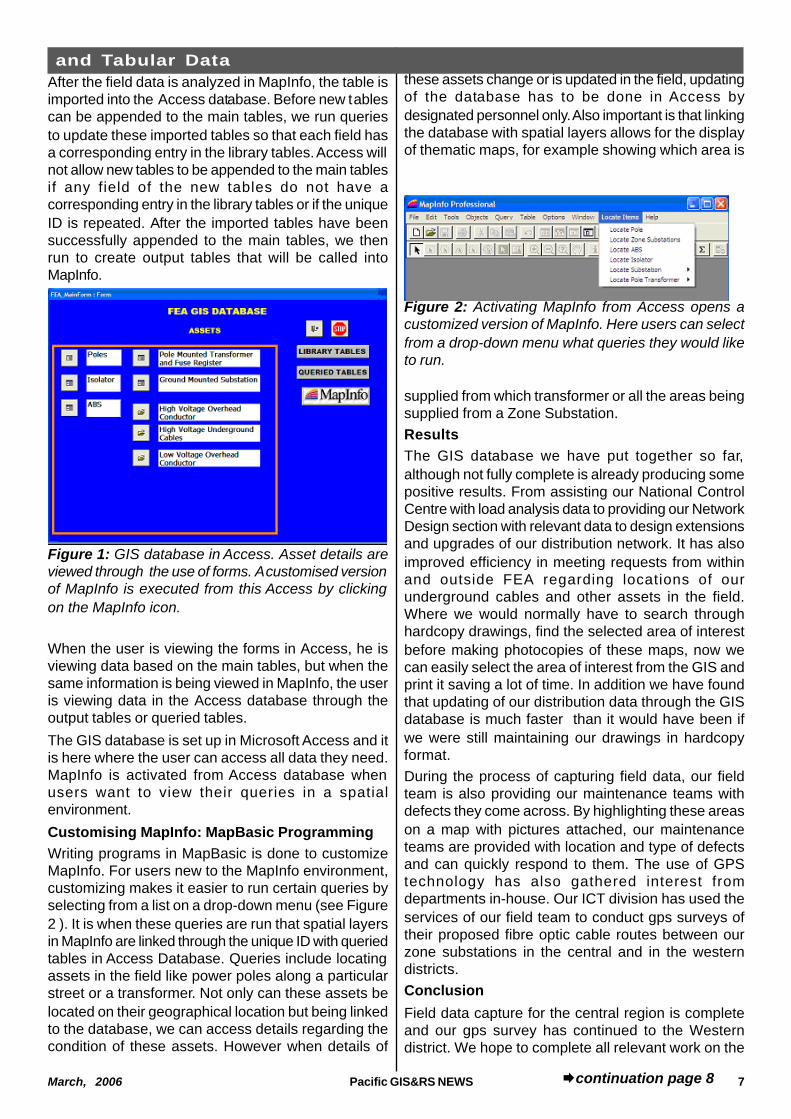
Figure 2: Activating MapInfo from Access opens acustomized version of MapInfo. Here users can selectfrom a drop-down menu what queries they would liketo run.
continuation page 8
After the field data is analyzed in MapInfo, the table isimported into the Access database. Before new tablescan be appended to the main tables, we run queriesto update these imported tables so that each field hasa corresponding entry in the library tables. Access willnot allow new tables to be appended to the main tablesif any field of the new tables do not have acorresponding entry in the library tables or if the uniqueID is repeated. After the imported tables have beensuccessfully appended to the main tables, we thenrun to create output tables that will be called intoMapInfo.
When the user is viewing the forms in Access, he isviewing data based on the main tables, but when thesame information is being viewed in MapInfo, the useris viewing data in the Access database through theoutput tables or queried tables.The GIS database is set up in Microsoft Access and itis here where the user can access all data they need.MapInfo is activated from Access database whenusers want to view their queries in a spatialenvironment.Customising MapInfo: MapBasic ProgrammingWriting programs in MapBasic is done to customizeMapInfo. For users new to the MapInfo environment,customizing makes it easier to run certain queries byselecting from a list on a drop-down menu (see Figure2 ). It is when these queries are run that spatial layersin MapInfo are linked through the unique ID with queriedtables in Access Database. Queries include locatingassets in the field like power poles along a particularstreet or a transformer. Not only can these assets belocated on their geographical location but being linkedto the database, we can access details regarding thecondition of these assets. However when details of
these assets change or is updated in the field, updatingof the database has to be done in Access bydesignated personnel only. Also important is that linkingthe database with spatial layers allows for the displayof thematic maps, for example showing which area is
supplied from which transformer or all the areas beingsupplied from a Zone Substation.ResultsThe GIS database we have put together so far,although not fully complete is already producing somepositive results. From assisting our National ControlCentre with load analysis data to providing our NetworkDesign section with relevant data to design extensionsand upgrades of our distribution network. It has alsoimproved efficiency in meeting requests from withinand outside FEA regarding locations of ourunderground cables and other assets in the field.Where we would normally have to search throughhardcopy drawings, find the selected area of interestbefore making photocopies of these maps, now wecan easily select the area of interest from the GIS andprint it saving a lot of time. In addition we have foundthat updating of our distribution data through the GISdatabase is much faster than it would have been ifwe were still maintaining our drawings in hardcopyformat.During the process of capturing field data, our fieldteam is also providing our maintenance teams withdefects they come across. By highlighting these areason a map with pictures attached, our maintenanceteams are provided with location and type of defectsand can quickly respond to them. The use of GPStechnology has also gathered interest fromdepartments in-house. Our ICT division has used theservices of our field team to conduct gps surveys oftheir proposed fibre optic cable routes between ourzone substations in the central and in the westerndistricts.ConclusionField data capture for the central region is completeand our gps survey has continued to the Westerndistrict. We hope to complete all relevant work on the
8 Pacific GIS&RS NEWS March, 2006
1:10000 DTM for Atoll Islands Utilising Kinematic GPS
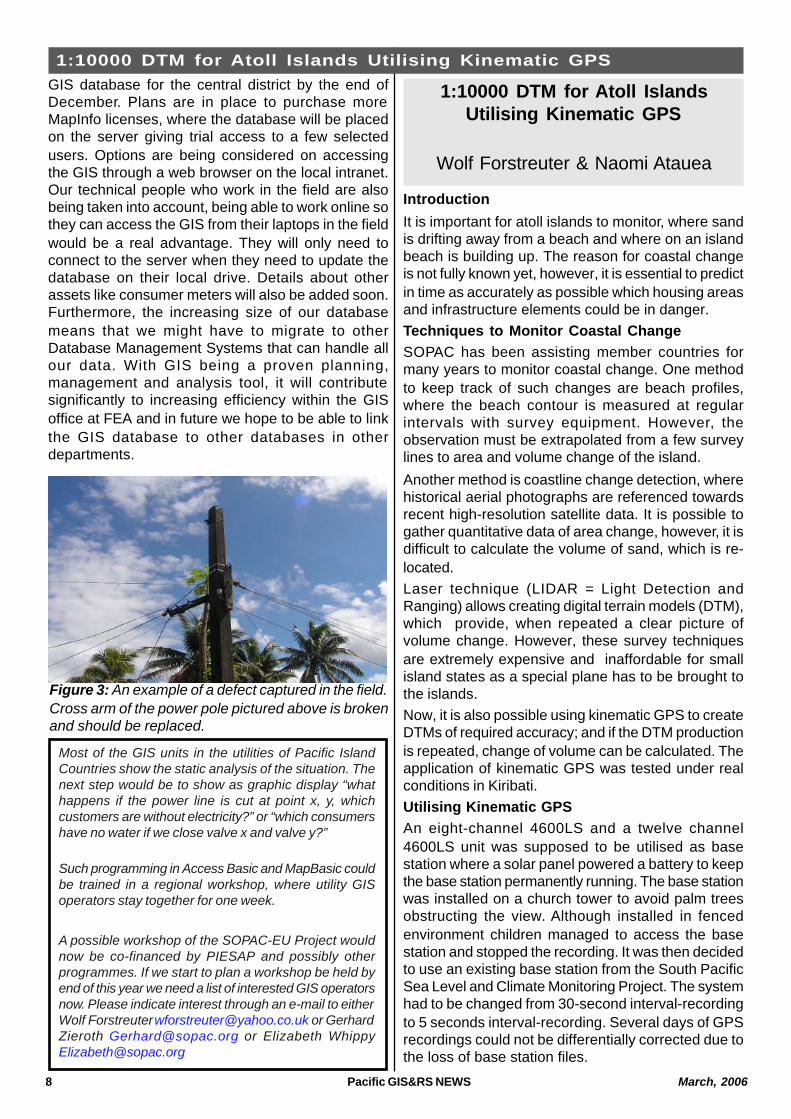
Figure 3: An example of a defect captured in the field.Cross arm of the power pole pictured above is brokenand should be replaced.
IntroductionIt is important for atoll islands to monitor, where sandis drifting away from a beach and where on an islandbeach is building up. The reason for coastal changeis not fully known yet, however, it is essential to predictin time as accurately as possible which housing areasand infrastructure elements could be in danger.Techniques to Monitor Coastal ChangeSOPAC has been assisting member countries formany years to monitor coastal change. One methodto keep track of such changes are beach profiles,where the beach contour is measured at regularintervals with survey equipment. However, theobservation must be extrapolated from a few surveylines to area and volume change of the island.Another method is coastline change detection, wherehistorical aerial photographs are referenced towardsrecent high-resolution satellite data. It is possible togather quantitative data of area change, however, it isdifficult to calculate the volume of sand, which is re-located.Laser technique (LIDAR = Light Detection andRanging) allows creating digital terrain models (DTM),which provide, when repeated a clear picture ofvolume change. However, these survey techniquesare extremely expensive and inaffordable for smallisland states as a special plane has to be brought tothe islands.Now, it is also possible using kinematic GPS to createDTMs of required accuracy; and if the DTM productionis repeated, change of volume can be calculated. Theapplication of kinematic GPS was tested under realconditions in Kiribati.Utilising Kinematic GPSAn eight-channel 4600LS and a twelve channel4600LS unit was supposed to be utilised as basestation where a solar panel powered a battery to keepthe base station permanently running. The base stationwas installed on a church tower to avoid palm treesobstructing the view. Although installed in fencedenvironment children managed to access the basestation and stopped the recording. It was then decidedto use an existing base station from the South PacificSea Level and Climate Monitoring Project. The systemhad to be changed from 30-second interval-recordingto 5 seconds interval-recording. Several days of GPSrecordings could not be differentially corrected due tothe loss of base station files.
1:10000 DTM for Atoll IslandsUtilising Kinematic GPS
Wolf Forstreuter & Naomi Atauea
GIS database for the central district by the end ofDecember. Plans are in place to purchase moreMapInfo licenses, where the database will be placedon the server giving trial access to a few selectedusers. Options are being considered on accessingthe GIS through a web browser on the local intranet.Our technical people who work in the field are alsobeing taken into account, being able to work online sothey can access the GIS from their laptops in the fieldwould be a real advantage. They will only need toconnect to the server when they need to update thedatabase on their local drive. Details about otherassets like consumer meters will also be added soon.Furthermore, the increasing size of our databasemeans that we might have to migrate to otherDatabase Management Systems that can handle allour data. With GIS being a proven planning,management and analysis tool, it will contributesignificantly to increasing efficiency within the GISoffice at FEA and in future we hope to be able to linkthe GIS database to other databases in otherdepartments.
Most of the GIS units in the utilities of Pacific IslandCountries show the static analysis of the situation. Thenext step would be to show as graphic display “whathappens if the power line is cut at point x, y, whichcustomers are without electricity?” or “which consumershave no water if we close valve x and valve y?”
Such programming in Access Basic and MapBasic couldbe trained in a regional workshop, where utility GISoperators stay together for one week.
A possible workshop of the SOPAC-EU Project wouldnow be co-financed by PIESAP and possibly otherprogrammes. If we start to plan a workshop be held byend of this year we need a list of interested GIS operatorsnow. Please indicate interest through an e-mail to eitherWolf Forstreuter [email protected] or GerhardZieroth [email protected] or Elizabeth [email protected]

March, 2006 Pacific GIS&RS NEWS 9
1:10000 DTM for Atoll Islands Utilising Kinematic GPSA ProXR and a ProXR Trimble rover unit were used tocapture data. Both units had the required accuracyand both units were operated through a pocket PC,which allowed monitoring of the survey lines (see figure1). The design of the beach survey followed theprinciple of maximum point capture in areas ofmaximum relief change. The operator followed thecontour lines, which were clearly visible through theflotsam (see figure 2). On the upper part of the beachthe survey lines were closed together and further apartat the shallow area covered with water during the hightide (see figure 3). Control lines were captured at 90degree angle to the contour lines. The survey areashad a rectangular shape and a size of about 50 x 30meter. Smaller areas created problems when closingthe file as there were insufficient carrier data recorded.The same problems occurred if the area was too large,and the reason is still not fully known. The control lineswere necessary to check the accuracy of datarecording and differential correction.The data display was first done with Vertical Mapper,which is an add-on software to MapInfo. Later, ERDASwas employed for the DTM production, which allowsthe manipulating of data sets using ERDAS ownprogramming language.Although the investigation is still incomplete severalrecommendations can be made for repeatingactivities:
OOOOO It is crucial to own a base station and create aDTM on daily basis to check the quality of datarecording, which requires 1) the base stationdata for the differential correction on a dailybasis, 2) someone who is trained to runthrough all steps of data handling.
OOOOO The locations of the base station have to beplanned before starting the survey as twoconditions have to be employed 1) 360 degreefree view and 2) protection from curiouspeople.
OOOOO A survey team must have 1) someone whotalks the local language to ask permissiondirectly before entering property at the beach,2) someone who does the data recording, and3) someone who protects the GPS operatorfrom attacking dogs.
OOOOO The survey area should be of rectangularshape the walk from the car to the survey areacannot be included in the DTM later.
OOOOO The survey area should not be smaller than50 x 30m as a minimum time is required tohave sufficient carrier data; there were alsoproblems if the area was too large.
OOOOO The survey design must have control lineswhich enable a check of accurate differentialcorrection and data recording.
OOOOO The survey areas should overlap as the overlaparea can be used as additional check.
Figure 1: While following the contour lines at thebeach the operator can monitor the survey on thedisplay.
Figure 2: Contour lines only decimetre difference areclearly visible on the beach.
Figure 3: The distance of the survey lines was closeron the upper part of the beach than of the flat partcovered by water during high tide. Control lines(hatched) show if data recording or differentialcorrection had problems.

1 0 Pacific GIS&RS NEWS March, 2006
Application of GIS in Samoa Water Authority Utility
Samoa Water Authority adopted phase 1 of theGeographic Information System (GIS) program in1990. It was used in an Apia Urban Water ConsolidationProject conducted by Dorch Consultant of Germany.Initially ArcView (ESRI) was used to superimposepipeline systems onto satellite images, available fromthe Ministry of Natural Resources and Environment. Itwas later used to provided plans and detailedschematic presentations of proposed pipeline SchemePipe2000 (KYPIPE) was then introduced (pipesimulation and modelling software). ArcView andPipe2000 developed a high level of hydraulic expertisein pipeline model development using advancedcomputer-engineering design and graphical interface.This allowed pipeline networks to be overlaid on aerialphotographs making design task easier because ofthe reality of what is in the field is being seen on thescreen.Ten years on from this introduction, an Australianfunded Project under an Institutional StrengtheningProject (ISP) developed an Asset Management Systemcalled Samoa Water Authority Assets ManagementSystem (SWAMS) using Microsoft Access basedsoftware ConQuest (Conquest Solutions Pty Ltd). TheISP Project then introduced MapInfo (MapInfoCooperation), with a schematic overview of SamoaWater Authority pipelines and assets. This allowed allassets in MapInfo to be interfaced with ConQuestproviding asset details and locations. Data for bothapplications is backed up and stored in its hard copyformat.In 2005 a pipeline simulation program, Pipe++(Watercom.com Pty. Ltd) was introduced to recreatethe interface between the pipeline simulation modeland the current GIS program (MapINFO). Pipes++ alsohas the ability to simulate larger sections of the SamoaWater Authority system but without the aerial imagesas a background layer. The simple interface allowshydraulic grade lines, pressure, elevation information,flows and demands information to be viewed inMapInfo and further down the track in Conquest.The benefit of this system is that it creates a totalinteraction between the pipeline simulation program,the GIS system and the asset management programmeaning that detailed asset information can be
provided for maintenance purposes. An examplewould be that pressure rating requirements and assetlocation information (GIS coordinates) can be viewedon a work sheet ensuring that the correct asset isrepaired using the correct class / rating of fitting.SWA has MapInfo and ArcView as GIS Packages withPipe2000 and Pipe ++ as modelling and simulationSoftware’s together with Conquest to complete theAssets Management and coordination within thecooperation.The future of GIS in Samoa Water Authority as a wholedepends on the capacity building, training, and handson experience of its technical staff in order to fully utilisethese GIS applications. GIS has been and continuesto be a vital role in asset management at Samoa WaterAuthority.
As part of one of the SOPAC/EU tasks of establishingeffective Project information delivery at community andall stakeholder levels, some students from theInternational School in Suva were assisted to build a3-D physical model of part of the SE coastline of SEViti Levu. This model is based on the IKONOS satelliteimagery, DTM and Swath Bathymetry that the Projectscientists are collating. As well as benefiting thestudents own education, this exercise is targeted atfurther enabling Project advocacy through futurecommunity awareness and school educationmeetings. We believe this is going to be particularlyvaluable for the ordinary villager, child, etc, who, nomatter how pretty the picture or contour diagram weput in front of them, cannot necessarily interpret,visualise or relate to the 3-dimensional aspects of, forexample, the deeply incised submarine canyons thatextend offshore, the continuity of land and submarinesurfaces and their integrated ecosystems. With the3-d model, they get both a “bird’s-eye” view and a“fish’s-eye” view.Discussions and planning began in mid-April’04, witha view to involving some Year 11 students from theInternational School in Suva as part of their InternationalBaccalaureate (IB) “Community Service”requirements. During a presentation to the school byProject staff, it was stressed that building a 3-DPhysical Model will involve most curriculum areaswithin the IB programme, in particular:-Discussions and planning began in mid-April’04, with
Application of GIS in the SamoaWater Authority Utility
John TagiilimaAssets Engineer
Samoa Water Authority
A 3D Physical Model of the SECoastline of Viti Levu, Fiji
Vilisi TokalauvereMineral Resources Department, Fiji
March, 2006 Pacific GIS&RS NEWS 11
A3D Physical Model of the South East Coastline of Vitilevu, Fiji
Figure 1: ISS Students adding final touches to the3D Model
Figure 2: During a presentation to the school bySOPAC/EU Project Staffs
continuation page 12
a view to involving some Year 11 students from theInternational School in Suva as part of their InternationalBaccalaureate (IB) “Community Service”requirements. During a presentation to the school byProject staff, it was stressed that building a 3-DPhysical Model will involve most curriculum areaswithin the IB programme, in particular:-Applied Mathematics – consideration of model scalingfactors and dimensionsSciences - geology,oceanography, biology, ecosystems, fisheriesInformation Technology – introduction to theapplications of GIS,Design Technology – model design, choice andworking techniques of differentconstruction materialsVisual Arts - painting,aestheticsHumanities - Physical & Human Geography,History.The resultant enthusiasm saw the start of serious
planning and decisions on the area, scale and materialrequirements in late April, 2004. The students selectedan area within the lower Southeast coast of Vitilevu
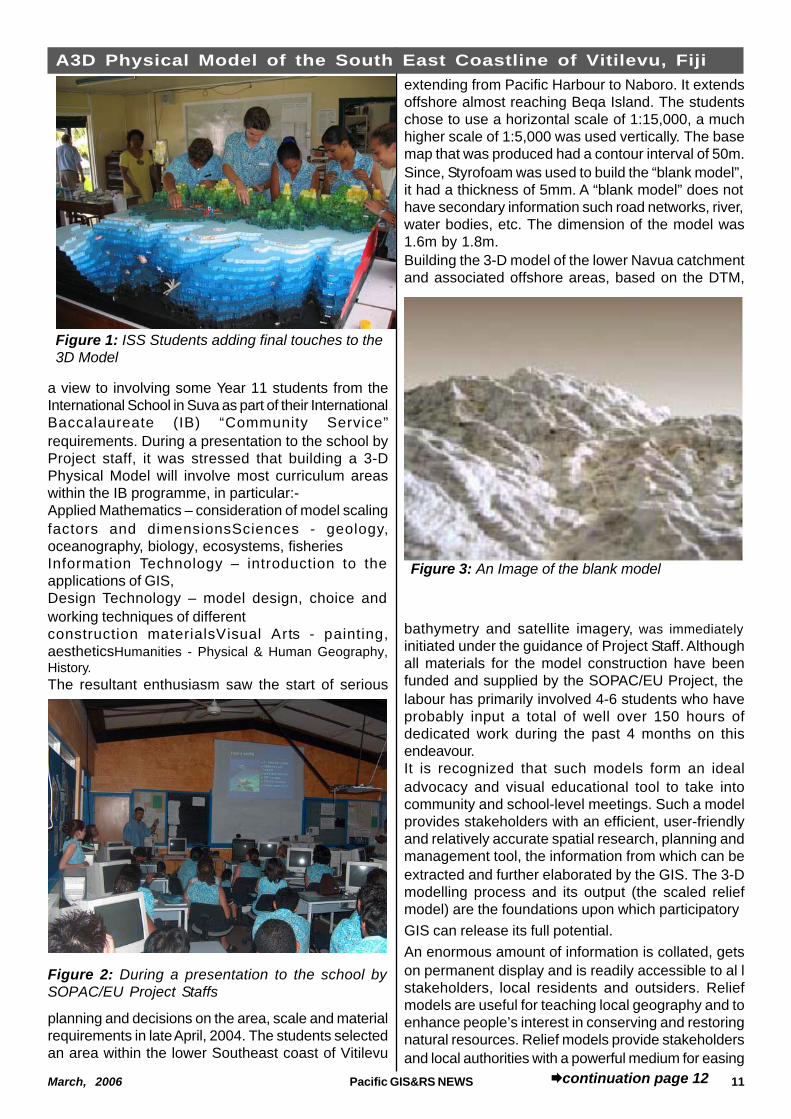
extending from Pacific Harbour to Naboro. It extendsoffshore almost reaching Beqa Island. The studentschose to use a horizontal scale of 1:15,000, a muchhigher scale of 1:5,000 was used vertically. The basemap that was produced had a contour interval of 50m.Since, Styrofoam was used to build the “blank model”,it had a thickness of 5mm. A “blank model” does nothave secondary information such road networks, river,water bodies, etc. The dimension of the model was1.6m by 1.8m.Building the 3-D model of the lower Navua catchmentand associated offshore areas, based on the DTM,
bathymetry and satellite imagery, was immediatelyinitiated under the guidance of Project Staff. Althoughall materials for the model construction have beenfunded and supplied by the SOPAC/EU Project, thelabour has primarily involved 4-6 students who haveprobably input a total of well over 150 hours ofdedicated work during the past 4 months on thisendeavour.It is recognized that such models form an idealadvocacy and visual educational tool to take intocommunity and school-level meetings. Such a modelprovides stakeholders with an efficient, user-friendlyand relatively accurate spatial research, planning andmanagement tool, the information from which can beextracted and further elaborated by the GIS. The 3-Dmodelling process and its output (the scaled reliefmodel) are the foundations upon which participatoryGIS can release its full potential.An enormous amount of information is collated, getson permanent display and is readily accessible to al lstakeholders, local residents and outsiders. Reliefmodels are useful for teaching local geography and toenhance people’s interest in conserving and restoringnatural resources. Relief models provide stakeholdersand local authorities with a powerful medium for easing
Figure 3: An Image of the blank model
1 2 Pacific GIS&RS NEWS March, 2006
Geological Mapping of Kioa, Fiji
Geological Mapping of Kioa
Jeremaia TaganesiaGeologist
Mineral Resources Department, Fiji
The geological mapping of Kioa is basically the pilotproject for the geological remapping of Vanua Levu.To date much of the interest in mineral exploration inFiji has been centred on Viti Levu namely the Vuda-Rakiraki mineralized belt, Wainivesi, Naqalimare andjust recently the Namosi Copper Porphyry Deposit.The project was initiated in 2004 with 3 geologicalmapping excursions to Kioa involving detailedgeological mapping of the island which included thecollection of rock samples for Geochemical andpetrographical analysis. 8 weeks of fieldwork werecarried out in Kioa where 26 grab samples werecollected and made into thin sections for petrographicanalysis. Of the 26 samples, 10 were sent to theUniversity of Canterbury in New Zealand forGeochemical analysis.Initial base maps and terrain analysis utilised FLIStopographic data with coarse digital terrain modelsprovided by the Australian Geological SurveyOrganisation in 1997. Other preparations includedaerial photograph interpretations of the island usingaerial photographs from FLIS, which were rectified andregistered in Erdas and MapInfo for basic structural,landslide and major landform recognition.A preliminary geophysical interpretation was carriedout using Airborne Geophysical Data. For magnetic
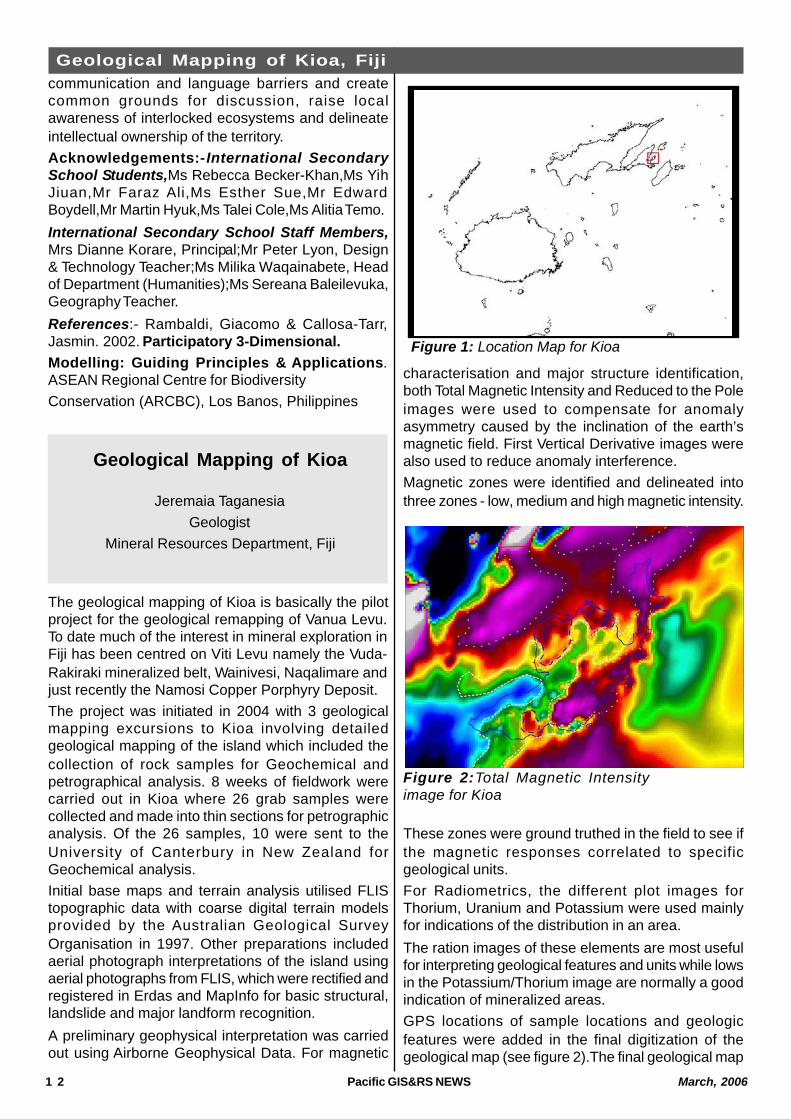
Figure 1: Location Map for Kioa
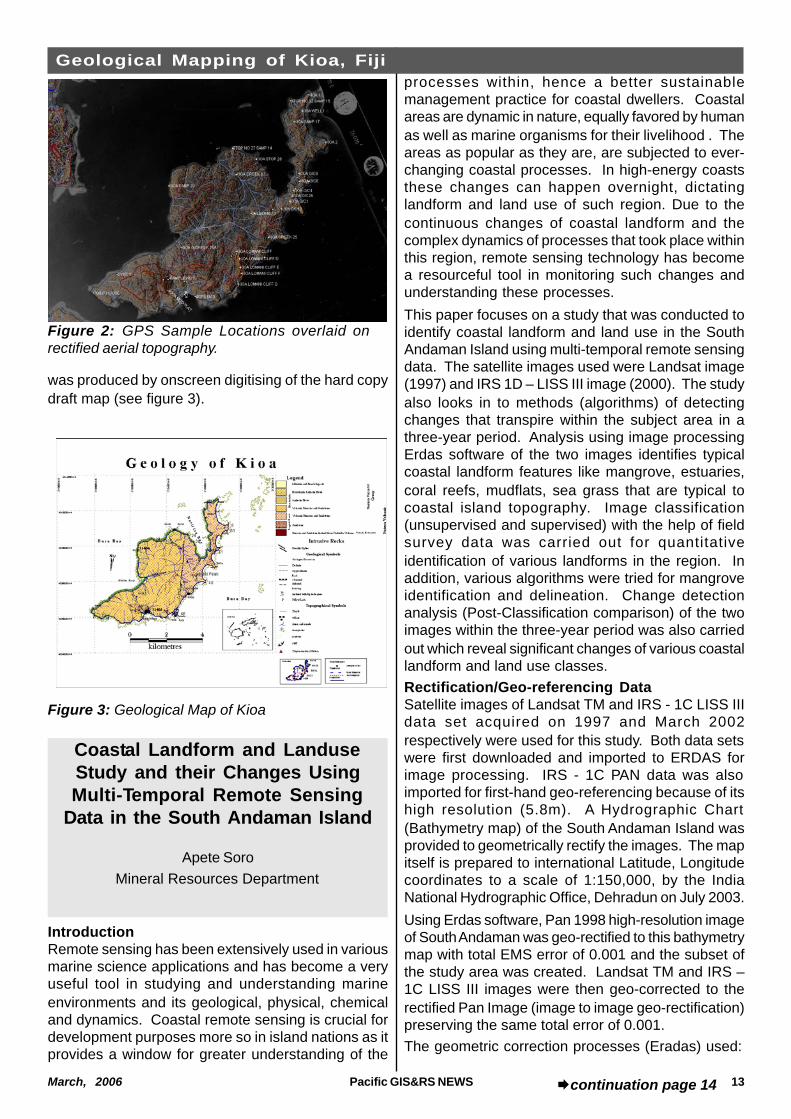
Figure 2:Total Magnetic Intensityimage for Kioa
communication and language barriers and createcommon grounds for discussion, raise localawareness of interlocked ecosystems and delineateintellectual ownership of the territory.Acknowledgements:- International SecondarySchool Students,Ms Rebecca Becker-Khan,Ms YihJiuan,Mr Faraz Ali,Ms Esther Sue,Mr EdwardBoydell,Mr Martin Hyuk,Ms Talei Cole,Ms Alitia Temo.International Secondary School Staff Members,Mrs Dianne Korare, Principal;Mr Peter Lyon, Design& Technology Teacher;Ms Milika Waqainabete, Headof Department (Humanities);Ms Sereana Baleilevuka,Geography Teacher.References:- Rambaldi, Giacomo & Callosa-Tarr,Jasmin. 2002. Participatory 3-Dimensional.Modelling: Guiding Principles & Applications.ASEAN Regional Centre for BiodiversityConservation (ARCBC), Los Banos, Philippines
characterisation and major structure identification,both Total Magnetic Intensity and Reduced to the Poleimages were used to compensate for anomalyasymmetry caused by the inclination of the earth’smagnetic field. First Vertical Derivative images werealso used to reduce anomaly interference.Magnetic zones were identified and delineated intothree zones - low, medium and high magnetic intensity.
These zones were ground truthed in the field to see ifthe magnetic responses correlated to specificgeological units.For Radiometrics, the different plot images forThorium, Uranium and Potassium were used mainlyfor indications of the distribution in an area.The ration images of these elements are most usefulfor interpreting geological features and units while lowsin the Potassium/Thorium image are normally a goodindication of mineralized areas.GPS locations of sample locations and geologicfeatures were added in the final digitization of thegeological map (see figure 2).The final geological map
March, 2006 Pacific GIS&RS NEWS 13
Figure 2: GPS Sample Locations overlaid onrectified aerial topography.
Figure 3: Geological Map of Kioa
Coastal Landform and LanduseStudy and their Changes UsingMulti-Temporal Remote Sensing
Data in the South Andaman Island
Apete SoroMineral Resources Department
IntroductionRemote sensing has been extensively used in variousmarine science applications and has become a veryuseful tool in studying and understanding marineenvironments and its geological, physical, chemicaland dynamics. Coastal remote sensing is crucial fordevelopment purposes more so in island nations as itprovides a window for greater understanding of the
processes within, hence a better sustainablemanagement practice for coastal dwellers. Coastalareas are dynamic in nature, equally favored by humanas well as marine organisms for their livelihood . Theareas as popular as they are, are subjected to ever-changing coastal processes. In high-energy coaststhese changes can happen overnight, dictatinglandform and land use of such region. Due to thecontinuous changes of coastal landform and thecomplex dynamics of processes that took place withinthis region, remote sensing technology has becomea resourceful tool in monitoring such changes andunderstanding these processes.This paper focuses on a study that was conducted toidentify coastal landform and land use in the SouthAndaman Island using multi-temporal remote sensingdata. The satellite images used were Landsat image(1997) and IRS 1D – LISS III image (2000). The studyalso looks in to methods (algorithms) of detectingchanges that transpire within the subject area in athree-year period. Analysis using image processingErdas software of the two images identifies typicalcoastal landform features like mangrove, estuaries,coral reefs, mudflats, sea grass that are typical tocoastal island topography. Image classification(unsupervised and supervised) with the help of fieldsurvey data was carried out for quantitativeidentification of various landforms in the region. Inaddition, various algorithms were tried for mangroveidentification and delineation. Change detectionanalysis (Post-Classification comparison) of the twoimages within the three-year period was also carriedout which reveal significant changes of various coastallandform and land use classes.Rectification/Geo-referencing DataSatellite images of Landsat TM and IRS - 1C LISS IIIdata set acquired on 1997 and March 2002respectively were used for this study. Both data setswere first downloaded and imported to ERDAS forimage processing. IRS - 1C PAN data was alsoimported for first-hand geo-referencing because of itshigh resolution (5.8m). A Hydrographic Chart(Bathymetry map) of the South Andaman Island wasprovided to geometrically rectify the images. The mapitself is prepared to international Latitude, Longitudecoordinates to a scale of 1:150,000, by the IndiaNational Hydrographic Office, Dehradun on July 2003.Using Erdas software, Pan 1998 high-resolution imageof South Andaman was geo-rectified to this bathymetrymap with total EMS error of 0.001 and the subset ofthe study area was created. Landsat TM and IRS –1C LISS III images were then geo-corrected to therectified Pan Image (image to image geo-rectification)preserving the same total error of 0.001.The geometric correction processes (Eradas) used:
continuation page 14
Geological Mapping of Kioa, Fiji
was produced by onscreen digitising of the hard copydraft map (see figure 3).

1 4 Pacific GIS&RS NEWS March, 2006
Coastal Landform and Landuse Study and their Changes UsingProjection: Geographic Lat/Long,Spheroid: WGS 84Datum: WGS 84Unsupervised and Supervised ClassificationPrior to ground-truthing, unsupervised classificationswere performed on both Landsat TM and LISS IIIimages. Erdas grouped pixels of the same pixelvalues together in clusters and organized them intoclasses according to their reflectance using nearestneighborhood method. The images were then usedduring the ground truthing process to confirm andlocate landforms and land use that appearscontradictory in the images.Recorded data from the field survey (GPS andRadiometric) were used for supervise classification.Eradas classify coastal landform and land use featuresmanually (test sites) highlighted by analyst accordingto the GPS reading and radiometric data collected foreach respective area. With the help of the bathymetrymap each class were accurately confirmed andentered to Eradas for the final supervised classifiedimage. Both Image (Landsat TM and LISS III) wereclassified using the same classes that are commonto both from the false color composite (FCC) of theraw imageLandform IdentificationUsing unsupervised classification image, coastallandforms that appear to be represented perfectly areidentified while other landforms needed confirmationby ground investigation. Such were done by takingGPS reading of landform locations with radiometricmeasurements and plotted on the image using ErdasImagine processing software.Mangrove Delineation (Landsat TM Data (1997)A number of algorithms were investigated; with thebest suited algorithms for this particular TM data foundto be by Grey (1990). The procedures include stackingband 3, 4 and 5 followed by 3/5 and 5/4. Thesestacked layers were then analyzed in Principal AnalysisComponent for Spectral Enhancement. The first threeprincipal components were then used for supervisedclassification for the final thematic map.IRS – 1C LISS III, IRS – 1C LISS III image wasprocessed using band ratio method. Three ratio wasgenerated – RED/NIR, RED/MIR, and NIR/MIR. Theseratioed images were stacked along with raw bands ofRed, NIR and MIR, which was then stacked and usedas an input for the generation of Principal ComponentImage. The 2, 3, 4 Principal Components were againstacked and the output image was used forsupervised classification.Change Detection AnalysisThree change detection analysis techniques werestudied for this project:
OOOOO Uni-variate image difference
I OOOOO Image ratioingOOOOO Post-classification comparison.
The Post classification technique was used due to itssuitability towards the two different images (LandsatTM (1997) and IRS – 1C LISS III (2000).The procedure includes comparing the two supervisedimages of Landsat TM and LISS III, classifiedindependently, by properly coding the classes that arecommon in both images. A comparison of areacovered by each class using pixel value converted tosquare kilometers was assessed to monitor changeswithin the three-year period of the two data sets.Results:Coastal Landform and Land use QuantificationThe supervised classified image of Landsat imagehighlights coastal landform identified within the studyarea of South Andaman. Coastal landforms that aretypically observed in such climatic conditions includemangrove, estuaries, sandy beaches and coral reefs.Quantifying coastal landforms can be an exhaustingpractice because of the vast area of the open ocean,whereas land uses on the other hand have definitearea of coverage; however using remote sensingtechnologies, one is certain that such a study can bepossible without too much strenuous work.ConclusionThroughout time it is expected that the amount ofpressure on coastal areas will grow rapidly with theincreasing rates in population and consequently furtherexpansion in development.There is no denying thecoastal areas are among the most vulnerable on earth.In order to properly maintain, protect and solve theproblems of such places, environmental changes andalterations that cause such changes should be closelymonitored. One of the most useful tools that can beused in this kind of investigation is remote sensing.The present study has shown that Landsat TM datahas the capability to be used for coastal landformidentification and quantification through unsupervisedand supervised classification. It also has potential todiscriminate each class (mangrove delineation) byapplying relevant algorithm best suited for respectiveimages. It is also possible to conduct change detectionanalysis on such images while considering the tellingfactors that do influence changes analysis.Finally, it is critical to be reminded of the capability ofremote sensing as a complementing tool and toconsider with open mind the relevant issues associatedwithin such a tool in any application.
March, 2006 Pacific GIS&RS NEWS 15
Multi-Temporal Remote Sensing Data in South Andaman Island
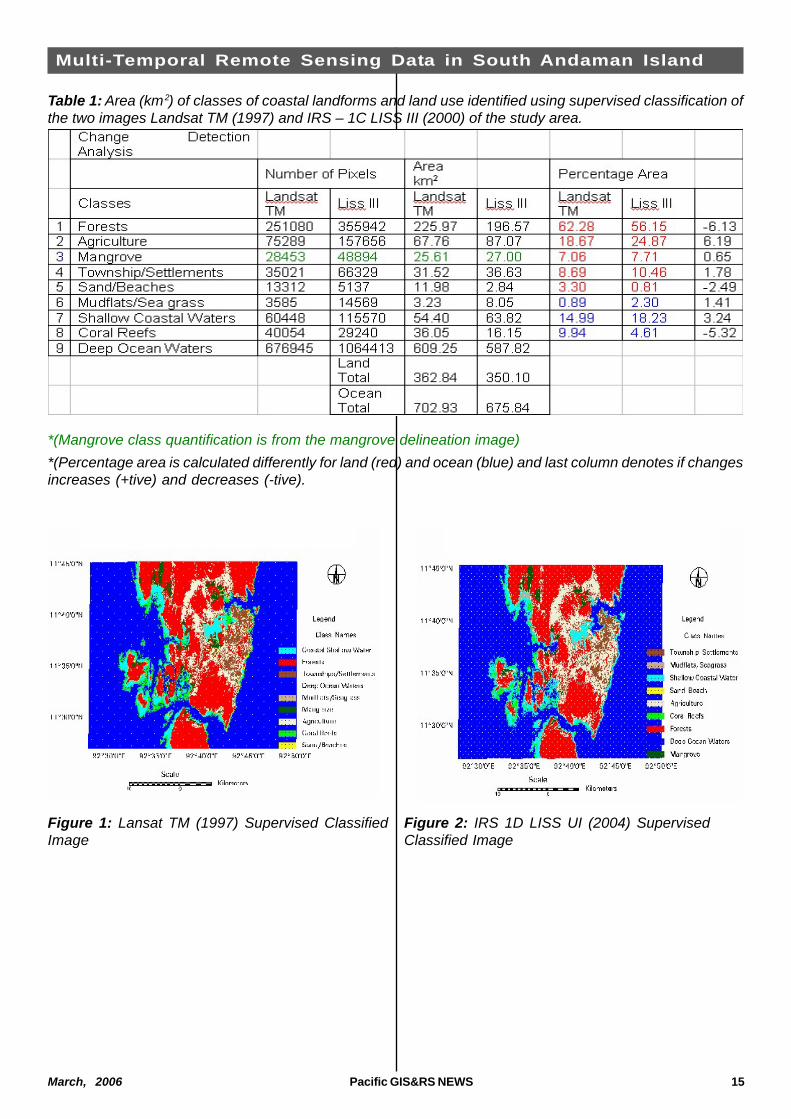
*(Mangrove class quantification is from the mangrove delineation image)*(Percentage area is calculated differently for land (red) and ocean (blue) and last column denotes if changesincreases (+tive) and decreases (-tive).
Figure 2: IRS 1D LISS UI (2004) SupervisedClassified Image
Figure 1: Lansat TM (1997) Supervised ClassifiedImage
Table 1: Area (km2) of classes of coastal landforms and land use identified using supervised classification ofthe two images Landsat TM (1997) and IRS – 1C LISS III (2000) of the study area.

1 6 Pacific GIS&RS NEWS March, 2006
GIS Contributes to the Better Management of SIEA
The Solomon Islands Electricity Authority hadexperienced revenue losses for the past yearsalthough customer audit has been carried out forcustomers with zero readings, the billing system hasyet to locate other meters with wrong billingaddresses. The SOPAC/EU Project has provided aQuick Bird high-resolution image backdrop that the
authority has utilised to identify the meters with wrongaddresses and locations.The new backdrop also helps to provide a bar chatthat displays consumers with meter temparing eg.illegal connection.This has madelife easier and saved time andmoney for the Authority and theUtilities. Likewise, the SolomonIslands Water Authority has alsoconfirmed that the same problemhas been faced with theircustomers when addressedduring the User group meeting.(Where meter number in therecord hasn’t bill to the consumerin the record instead bill to otherconsumer in other locations.)The Utilities Management has onceagain assigned a team to carry outcustomer audit on cycle by cycleto identify the following causes:(Meter tempering, Meter Status,Meter Seal not present, Meter Cardpresent or not) after viewing withthese tools. The Authority has alsoprosecuted consumers that continuing practicing
meter temparing with wrong means using a wireinstead of a proper fusing or bypassing the meter.TheSolomon Islands Electricity Authority is now using a
proper way of recording meters with a Hand held unitthat will provide accurate readings for each customer’sand will also provide accurate bar chart of averagefive month consumption with the present consumptionwhen displayed on the new high resolution imageBackdrop. The meter readers will no longer beguessing any reading for the Unix system otherwise;they have to go on site to obtain a proper reading.Itwas agreed between the Utilities to share information’sand ideas that help to provide better management; asthe practice of sharing of site plan, print out of projectmaps, plans and more visibility with the new imagebackdrop has ben greatly successful.
GIS Contributes to the bettermanagement of SIEA
Robinson WoodSIEA
Figure 1: Customer temparing the meter at BetikamaHigh School.
Figure 2: Reading show customers swapping