Pacific Herring Stocks and Fisheries in the Arctic-Yukon
42
Pacific Herring Stocks and Fisheries in the Arctic-Yukon-Kuskokwim Region of the Bering Sea, Alaska, 1993 A Report to the Alaska Board of Fisheries Compiled by Helen H. Hamner and Carol Kerkvliet Regional Information Report l No. 3A94-01 Alaska Department of Fish and Game Division of Commercial Fisheries, AYK Region 333 Raspberry Road Anchorage, Alaska 99518 January 1994 lThe Regional Information Report Series was established in 1987 to provide an information access system for all unpublished divisional reports. These reports frequently serve diverse and ad hoc informational purposes or archive basic uninterpreted data. To accommodate timely report ing of recent ly collected information, reports in this series undergo only limited internal review and may contain preliminary data; this information may be subsequently finalized and published in the formal literature. Consequently, these reports should not be cited without prior approval of the author or the Division of Commercial Fisheries.
Transcript of Pacific Herring Stocks and Fisheries in the Arctic-Yukon
Pacific Herring Stocks and Fisheries in theArctic-Yukon-Kuskokwim Region
of the Bering Sea,Alaska, 1993
A Report to the Alaska Board of Fisheries
Compiled by
Helen H. Hamnerand
Carol Kerkvliet
Regional Information Reportl No. 3A94-01
Alaska Department of Fish and GameDivision of Commercial Fisheries, AYK Region
333 Raspberry RoadAnchorage, Alaska 99518
January 1994
lThe Regional Information Report Series was established in 1987 to provide an information access systemfor all unpublished divisional reports. These reports frequently serve diverse and ad hoc informationalpurposes or archive basic uninterpreted data. To accommodate timely report ing of recent ly collectedinformation, reports in this series undergo only limited internal review and may contain preliminary data; thisinformation may be subsequently finalized and published in the formal literature. Consequently, these reportsshould not be cited without prior approval of the author or the Division of Commercial Fisheries.


ACKNOWLEDGEMENTS
Data collection and reporting for the subsistence and commercial fisheries for Pacific herring inthe northeastern Bering Sea were provided by the following AYK Region staff:
Security Cove, Goodnews Bay, Cape Avinof, Nelson Island, and Nunivak Island DistrictsKim Francisco, Area Manager, and Charles Burkey and Cindy Anderson, Asst. Area Managers.Commercial Fisheries Division, P.O. Box 90, Bethel, Alaska. 99559-9990. 543-2433.
Cape Romanzof DistrictDan Bergstrom, Area Manager, and Chuck Blaney, Asst. Area Manager. Commercial FisheriesDivision, 333 Raspberry Rd., Anchorage, Alaska. 99518-1599. 344-0541.
Norton Sound and Port Clarence DistrictsCharles Lean, Area Manager, and Fred Bue, Asst. Area Manager. Commercial Fisheries Division,P.O. Box 1148, Nome, Alaska. 99762-1148. 443-5167.
AYK RegionRich Cannon, Regional Management Biologist, Commercial Fisheries Division, 333 RaspberryRd., Anchorage, Alaska. 99518-1599. 344-0541.

TABLE OF CONTENTS
LIST OF TABLES . . . . . . . . . . . . . . . . . . . . . . . . . . . . . . . . . . . . . . . . . . . . . . . . . . i
LIST OF FIGURES " 11
INTRODUCTION .. . . . . . . . . . . . . . . . . . . . . . . . . . . . . . . . . . . . . . . . . . . . . . .. 1
STOCK STATUS 3
Assessment Methods 3
Spawning Populations 4Security Cove District . . . . . . . . . . . . . . . . . . . . . . . . . . . . . . . . . . . . . . " 4Goodnews Bay District " 4Cape Avinof District " 4Nelson Island District . . . . . . . . . . . . . . . . . . . . . . . . . . . . . . . . . . . . . . .. 5Nunivak Island District " 5Cape Romanzof District 6Norton Sound District " 6Port Clarence District . . . . . . . . . . . . . . . . . . . . . . . . . . . . . . . . . . . . . . " 7
SUBSISTENCE FISHERY 7
COMMERCIAL FISHERY " 8Security Cove District " 8Goodnews Bay District " 9Cape Avinof District . . . . . . . . . . . . . . . . . . . . . . . . . . . . . . . . . . . . . . . " 9Nelson Island District , . . . . . . . . . . . . . . . . 10Nunivak Island District 10Cape Romanzof District 11Norton Sound District . . . . . . . . . . . . . . . . . . . . . . . . . . . . . . . . . . . . . . . . 11Port Clarence District . . . . . . . . . . . . . . . . . . . . . . . . . . . . . . . . . . . . . . . . 13
ENFORCEMENT 13
OUTLOOK AND MANAGEMENT STRATEGY FOR 1994 13Security Cove District 14Goodnews Bay District 14Cape Avinof District . . . . . . . . . . . . . . . . . . . . . . . . . . . . . . . . . . . . . . . . . 14Nelson Island District . . . . . . . . . . . . . . . . . . . . . . . . . . . . . . . . . . . . . . . . 15Nunivak Island District . . . . . . . . . . . . . . . . . . . . . . . . . . . . . . . . . . . . . . . 15Cape Romanzof District 16

Norton Sound District 16Port Clarence District . . . . . . . . . . . . . . . . . . . . . . . . . . . . . . . . . . . . . . . . 16
LITERATURE CITED . . . . . . . . . . . . . . . . . . . . . . . . . . . . . . . . . . . . . . . . . . . . . . 17

LIST OF TABLES
1. Pacific herring harvests by domestic commercial fishermen in the northeasternBering Sea, Alaska, 1909-1993 . . . . . . . . . . . . . . . . . . . . . . . . . . . . . . . . . . . . .. 18
2. Estimated biomass and commercial harvest of Pacific herring in northeastern BeringSea fishing districts, Alaska, 1988-1993 . . . . . . . . . . . . . . . . . . . . . . . . . . . . . . .. 19
3. Number of buyers and fishermen participating in northeastern Bering Sea Pacificherring fisheries, Alaska, 1987-1993 20
4. Pacific herring subsistence harvest Cst) and effort data from selected northeasternBering Sea areas, Alaska, 1977-1993 . . . . . . . . . . . . . . . . . . . . . . . . . . . . . . . . .. 21
5. Pacific herring estimated biomass in the northeastern Bering Sea, Alaska, 1978-1993 22
6. Summary of Pacific herring commercial harvest by fishing period for fishing districtsin the northeastern Bering Sea, Alaska, 1993 23
7. Projections of Pacific herring spawning biomass and harvest for commercial fishingdistricts in the northeastern Bering Sea, Alaska, 1994 25
8. Herring harvest by gear type and subdistrict, Norton Sound District, 1981-1993. . . .. 26
1

LIST OF FIGURES
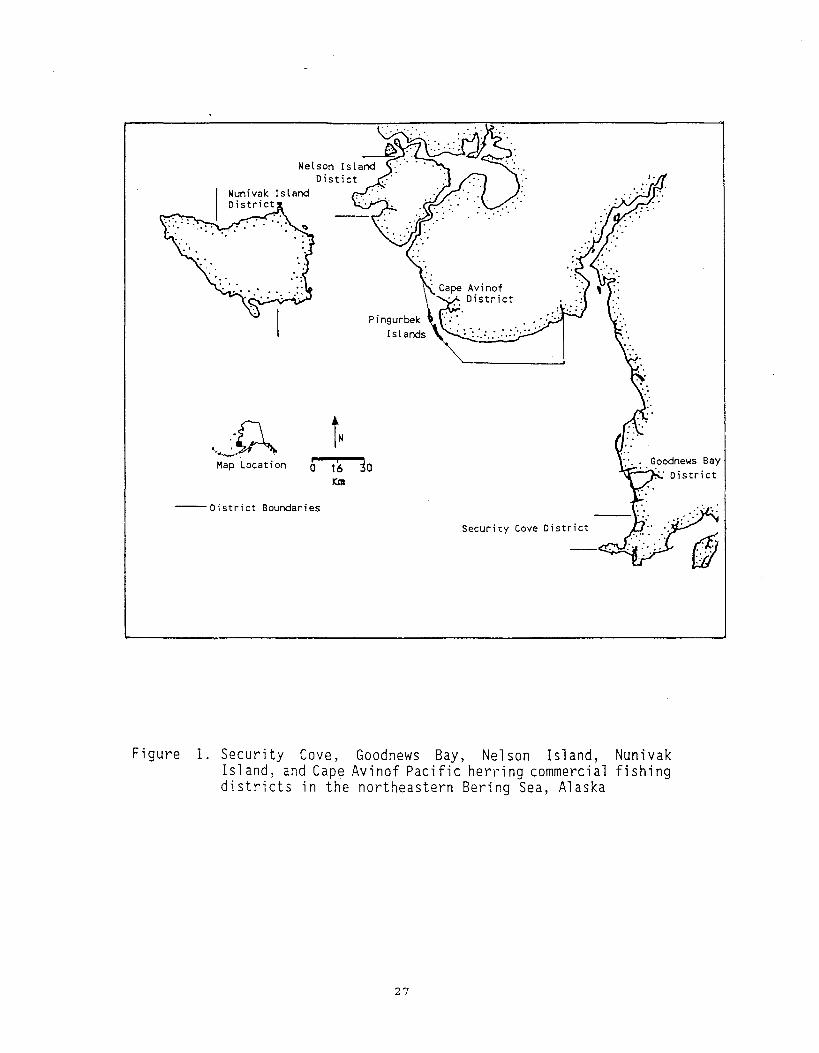
1. Security Cove, Goodnews Bay, Cape Avinof, Nelson Island, and Nunivak IslandPacific herring commercial fishing districts in the northeastern Bering Sea, Alaska .. 27
2. Cape Romanzof, Norton Sound, and Port Clarence Pacific herring commercialfishing districts in the northeastern Bering Sea, Alaska 28
3. Pacific herring spawning biomass distribution by commercial fishing district, Arctic-Yukon-Kuskokwim Region, Alaska, 1993 29
4. Age composition of the total biomass and commercial harvest for the Security Cove,Goodnews Bay, Cape Avinof and Nelson Island commercial herring fishing districtswithin the Arctic-Yukon-Kuskokwim Region, Alaska, 1993 30
5. Age composition of the total biomass and commercial harvest for the Nunivak.Island, Cape Romanzof, and Norton Sound commercial herring fishing districtswithin the Arctic-Yukon-Kuskokwim Region, Alaska, 1993 31
6. Pacific herring recruits (ages 2, 3, 4 and 5) in commercial fishing districts withinthe Arctic-Yukon-Kuskokwim Region, Alaska, 1993 32
11


INTRODUCTION
The objectives of this report are to summarize the results of the 1993 herring stock assessmentprograms of the Arctic-Yukon-Kuskokwim (AYK) Region, review and evaluate 1993 harvestsand management strategies of all AYK commercial herring fisheries and the Yukon-KuskokwimRiver Delta subsistence fishery, and present general management strategies planned for the AYKherring fishing season in 1994. Commercial fishing districts included in this report consist ofthe Security Cove, Goodnews Bay, Cape Avinof, Nelson Island, Nunivak Island, Cape Romanzof,Norton Sound, and Port Clarence Districts (Figures 1 and 2).
The Alaska Board of Fisheries established threshold biomass levels, below which harvests arenot allowed under the Bering Sea Herring Fishery Management Plan (5 AAC 27.060), for alldistricts with the exception of the Port Clarence District. Exploitation rates are limited to amaximum of 20% in all areas. In some areas the Board of Fisheries has further restrictedexploitation rates to protect subsistence harvests. A moratorium was placed on entry into theNelson Island, Nunivak Island, Cape Romanzof, and Norton Sound herring fisheries in 1987.The Commercial Fisheries Entry Commission has been issuing limited entry permits for thesefisheries. All AYK Region commercial herring districts, except Security Cove and PortClarence, are designated as superexclusive use areas.
A total biomass of 76,712 tons of herring was estimated to have been present in the surveyedportion of the AYK Region herring districts. This estimate is lower than the record biomass of90,243 tons observed in 1992, but is the second highest on record (Tables 2 and 5). Ages 5,6 and 9 dominated herring biomass in most districts south of Cape Romanzof. The biomass inCape Romanzof was dominated by older fish and ages 5 and 11 comprised the major age groupsin the Norton Sound biomass. The number of recruits, ages 2 through 5, was over 35% of thespawning population in all AYK districts with the exception of Cape Romanzof where recruitscomprised 18% of the population.
The 1993 herring harvest for the AYK Region was approximately 7,363 tons with an estimatedexvessel value of $2,089,000 (Tables 1 and 2). The 1993 harvest greatly exceeded the 1992harvest of 2,828 tons when the Norton Sound fishery did not open. However, the 1993 harvestwas near average when compared to the previous five years. Excluding 1992, the value of thefishery was the lowest since 1984. Fishermen received approximately $150 less per ton for sacroe herring than they received in 1992. The price paid to fishennen in AYK fishing districts wasapproximately $300 per ton for herring with 10% roe content plus or minus $30 a percentagepoint and $50 per ton for bait-quality herring. Food and bait sales during the sac roe fisherytotaled 391 tons, with the remaining harvest sold as sac roe product. Harvest identified as foodand bait primarily occurs during the sac roe fisheries when fish are sold with a roe content thatis below buyer's acceptable minimums.
1

A total of 546 fishermen participated in AYK sac roe herring fisheries during the 1993 season.Effort was low in all districts as fishermen were discouraged by both low prices and fewerbuyers. In addition, an exceptionally early return to the Togiak fishery surprised managers,fishermen and buyers and resulted in an extended season in that district which kept the fleet fromarriving in Security Cove District until the end of the spawning migration. Only 9 fishermenparticipated in the Security Cove fishery compared to a five year average of 61.
There were no herring fisheries in the Port Clarence and Nunivak Island Districts during the sacroe season in 1993. There has not been a commercial fishery in the Port Clarence District since1988 due to a lack of buyers. One ton of bait-quality herring has been harvested in Port Clarencesince the end of the sac roe season. In the Nunivak Island District, fishermen were unable tolocate herring of marketable-quality during the three days that a tender was present in the area.
Surveyed subsistence fishermen from selected Yukon-Kuskokwim River Delta villages harvestedapproximately 89 tons of herring (Table 4).
Average roe recovery of the sac roe harvest ranged from 9.6% in the Cape Romanzof Districtto 12.8% in the Security Cove District, with a regional average of 10.1%. A preseason meetingbetween processors, managers and fishermen was held to discuss poor market conditions and theneed for a high-quality product. Managers were asked to limit period harvests to an amount thatcould be processed within three days. This resulted in an extended commercial season for mostdistricts and helped produce a record roe recovery for the region. Exploitation rates weregenerally low in AYK Region herring districts. The 1993 total exploitation rate for the AYKRegion was 9.6 %. Exploitation rates ranged from less than 1% in the Security Cove Districtto 15.4% in the Goodnews Bay District (Table 2).
Biomass projections for each district using postseason escapement estimates, historic mean ratesof survival and current mean weights for each age class (Bromaghin and Hamner 1993, AlaskaDepartment of Fish and Game, Anchorage, personal communication), and estimates ofrecruitment for each age class (Wespedstad 1982), indicate that the 1994 spawning biomass forthe northeastern Bering Sea herring stocks (Security Cove to Norton Sound) will beapproximately 67,760 tons. These projections do not include newly recruiting herring.
Variability in the quality of aerial survey assessments of biomass and deviations from theassumed survival or recruitment rates may result in the observed biomass being either above orbelow these projections. Harvest levels will be adjusted during the season according to observedherring spawning biomass. In addition, in accordance with the AYK Region harvest policy,newly recruited age classes will not be targeted by the commercial fishery. If it is not possibleto determine herring abundance using aerial survey methods, stock abundance will be assessedusing information from the projected biomass, test and commercial catches and spawn depositionobservations.
2

STOCK STATUS
Assessment Methods
The arrival of herring in the northeastern Bering Sea is greatly influenced by climate and oceanicconditions, particularly the extent and distribution of the Bering Sea ice pack. Most herringappear immediately after ice breakup which generally occurs between mid-May and mid-June.Spawning usually begins in the Security Cove District and generally progresses in a northerlydirection. In some areas spawning may continue as late as July.
Aerial survey technique has been used since 1978 in Bering Sea herring fisheries to estimateherring spawning biomass (Lebida and Whitmore 1985). However, it is often difficult to obtainbiomass estimates from aerial surveys in the AYK Region because of poor survey conditionscaused by unfavorable weather, ice conditions or turbid water. Herring school surface areas arerecorded in 538 frZ relative abundance index (RAI) units. In the AYK Region, RAI units areconverted to biomass using conversions of 1.52 tons per RAI unit for water depths of 16 ft orless, 2.58 tons per RAI unit for water depths between 16 and 26 ft and 2.83 tons per RAI unitfor water depths greater than 26 ft per RAI unit. Because purse seine gear is needed to estimatethe conversion factors, and purse seine gear is not fished in the AYK Region, these conversionfactors were estimated from sampling performed in the Togiak District. Ground surveys areconducted in some districts to obtain information on the distribution and density of kelp beds andherring spawn deposition.
During 1993, 106 aerial surveys totalling 118.4 hours of flight time were flown in the AYKRegion: 12 (6.1 hours) in Security Cove, 12 (5.9 hours) in Goodnews Bay, 10 (2.7 hours) inJacksmith Bay, 6 (4.4 hours) in Cape Avinof, 15 (6.2 hours) in Nelson Island, 11 (16.9 hours)in Nunivak Island, 7 (1.9 hours) in Cape Romanzof, 32 (71.3 hours) in Norton Sound, and 1 (3hours) in Port Clarence.
Gillnets are the only legal gear in the AYK Region with the exception of Norton Sound, wherea small portion of the harvest is taken by beach seine. An attempt was made to sample at least420 herring from each commercial gear type and district or subdistrict. The sampling goal fortest fish catches was to sample a minimum of 60 herring per day or 420 per week from eachdistrict or subdistrict. Herring from test fish and commercial catches were sampled in all but thePort Clarence District to estimate age, sex, size, and sexual maturity of herring and to note theoccurrence of other schooling fishes. Approximately 15,981 herring from commercial and testcatches were sampled from seven of the eight AYK herring districts during the 1993 fishingseason.
In most districts, fishermen, in cooperation with the department, provided catch samples for roequality evaluation by industry representatives. Participation by fishermen in collecting samples,processor evaluation of samples, and the flexibility of fishermen to fish on short notice aided inobtaining optimum roe recoveries.
3

Spawning Populations
Security Cove District
Since 1981, the estimated biomass of herring in the Security Cove District has ranged from 2,300tons in 1987 to 8,267 tons in 1981 (Table 5). During the 1993 season, twelve aerial surveyswere flown in the district between April 28 and May 17 to estimate herring biomass andspawning activity. Only four of these were flown under acceptable survey conditions. On April29, 2,774 tons of herring were observed during an aerial survey. Another 4,216 tons were seenduring a May 16 survey. Total biomass present in the district was estimated to be 6,995 tons bycombining these two surveys with the harvest. A total of 12.7 miles of spawn was observed inthe district with peak spawning activity occurring on May 4 when 2.7 miles of milt weredocumented.
The Security Cove test fish crew fished from May 4 to May 26 with variable mesh gillnets.From this catch, 1,294 herring were sampled for biological data. Ages 5 and 6 dominated thereturn in both biomass (33.0% and 23.2%, respectively) and numbers of fish (38.3% and 21.4%respectively) (Figure 4). Age 9 and older herring comprised 24.9% of the biomass. Recruitherring represented 61.9% of the return in numbers of fish (Figure 6).
Goodnews Bay District
Since 1981, the estimated biomass of herring in the Goodnews Bay District has ranged from2,000 tons in 1987 to 6,211 tons in 1993 (Table 5).
During the 1993 season, twelve aerial surveys were flown between April 28 and May 27 in thedistrict. Only one of these surveys was flown under satisfactory aerial survey conditions. TheDepartment's test fish crew documented spawning activity on May 4. On May 14 5,970 tonswere observed during an aerial survey. The total biomass of 6,211 tons was calculated by addinga harvest of 241 tons, which occurred prior to the peak aerial survey, to the peak survey. Nospawn was observed during aerial surveys of the district.
Department test fishing was conducted from May 18 to May 29. A total of 1,497 herring weresampled for biological data. Age 5 herring dominated both the biomass (30.9%) and the returnin numbers of fish (38.6%) (Figure 4). Age 9 and older herring represented 25.9% of thebiomass. Recruit herring were 49.5% of the spawning population (Figure 6).
Cape Avinof District
Aerial surveys have been conducted by the department in the Cape Avinof area since 1985 andhave ranged from 1,225 tons in 1987 to 4,108 tons in 1988 (Table 5). Weather and iceconditions in 1986, 1989, 1990 and 1993 precluded biomass estimates by aerial survey.
4

During 1993, 6 aerial surveys were flown in the Cape Avinof District between May 20 and June1. Only two of these surveys were flown under satisfactory conditions. During an aerial surveyon May 31, 203 tons of herring were observed. Due to poor aerial survey conditions the totalbiomass present in the district was estimated to be 2,358 tons based on the projected return fromthe 1992 escapement. The biomass was revised postseason to 2,837 tons based on updatedsurvival rates. No spawn was observed during aerial surveys.
The department's test fisheries near Kipnuk and Kwigillingok captured 1,575 herring betweenMay 18 and June 9 to sample for biological data. Age 5 herring dominated the return in bothbiomass (26.2%) and numbers of fish (33.9%) (Figure 4). Age 9 and older herring comprised35.1 % of the biomass. Recruit herring represented 50.9% of the return in numbers of fish(Figure 6).
Nelson Island District
Since 1985, biomass observations of herring in the Nelson Island District have ranged from 2,385tons in 1991 to 9,500 tons in 1985 (Table 5).
In 1993, fifteen aerial surveys were flown in the Nelson Island area between May 8 and June 1.Four of these surveys were made under acceptable aerial survey conditions. During an aerialsurvey on May 17,4,944 tons of herring were observed in the district. A total of 13.0 miles ofspawn was observed during aerial surveys of the district. Peak spawning was observed on May25 when 5.5 miles of spawn were sighted.
Test fishing with variable mesh gillnets occurred from May 22 to June 12. A total of 1,400herring were sampled for biological data. Age 5 fish dominated the return in both biomass(33.3%) and numbers of fish (41.8%) (Figure 4). Age 9 and older herring comprised 35.2% ofthe biomass. Recruit herring represented 62.5% of the spawning population in numbers (Figure6).
Nunivak Island District
Since 1985, the estimated biomass in the Nunivak Island District has ranged from 422 tons in1990 to 6,000 tons in 1985 (Table 5).
In 1993, 11 aerial surveys were flown in the Nunivak Island District between May 8 and June1. During an aerial survey flown on May 8, 2,694 tons of herring were observed. Anothersurvey was conducted on May 31 during which 2,482 tons of herring were sighted. The totalbiomass in the Nunivak Island District was estimated to be 5,176 tons by combining the twosurveys. Only 2.6 miles of spawn were observed during aerial surveys with a peak spawn of 2.0miles documented on May 8.
5

Test fishing with variable mesh gillnets occurred from May 16 to June 2. From this catch, 263herring were sampled for biological data. Age 5 fish dominated the return in both biomass(25.7%) and numbers of fish (37.9%) (Figure 5). Age 9 and older herring comprised 48.4% ofthe biomass. Recruit herring represented 47.4% of the spawning population in numbers (Figure6).
Cape Romanzof District
Since 1980, the estimated biomass of herring in the Cape Romanzof District has ranged from2,976 tons in 1980 to 7,500 tons in 1986 (Table 5). Due to excessive water turbidity in the CapeRomanzof area, it is generally not possible to estimate herring biomass using aerial surveytechniques. Biomass has been estimated using information from test and commercial catches,spawn deposition, and age composition. Seven aerial surveys were flown during the 1993season from May 10 through June 3. A total of 1.9 hours was spent surveying the district. Allsurveys were unacceptable due to poor weather and/or turbid water conditions. No peak biomassestimate based upon aerial surveys was possible. Since it was not possible to estimate thebiomass inseason, the projected biomass of 2,449 tons was used to manage the fishery.
Daily qualitative spawn deposition surveys were conducted from May 12 until June 2. The firstobservations were recorded on May 14 in Kokechik Bay. A gradual increase in spawn depositionfollowed, both in layers of eggs and distribution. Spawn deposition peaked approximately May27, with an average of 3.4 layers on Fucus substrate and an average of 2.2 egg layers on rocksubstrate, depending on location.
A new quantitative study of spawn deposition started in 1992 was continued in 1993. Artificialsubstrates of astroturf were located in the same general spawning locations as in 1992. Spawndeposited on the astroturf was removed and weighted daily at low tide. The results indicated thatthe largest spawn deposition within the study area occurred on May 18 and 25. This data willbe analyzed more rigorously at a later date, however subjectively it appeared that the overalldeposition of spawn within the study area was greater in 1993 than in 1992.
Test fishing with variable mesh gillnets was conducted by the Department from May 13 to June4. A total of 4,077 herring were caught, of which 1,349 were sampled for biological data. Age9 and older herring comprised 74.0% of the run by weight (Figure 5). Recruit herringrepresented 18.4% of the spawning population in numbers (Figure 6).
Norton Sound District
Historically, the primary spawning areas within Norton Sound have been from Stuart Island toTolstoi Point. Additional spawning areas have been documented along Cape Denbigh and severalbedrock outeroppings along the northern shore of Norton Sound between Bald Head and Topkok,especially in years when sea ice has remained in the nearshore areas into June.
6

Since 1978, herring biomass estimates in the Norton Sound District have fluctuated from 5,291tons in 1978 to 57,974 tons in 1992. During 1993, 32 surveys were flown on 29 different daysbetween April 19 and June 15. Twelve of these surveys were flown under acceptable surveyconditions. The peak: aerial survey of 41,298 tons on June 2 was the second largest biomassobserved in Norton Sound. A regular schedule of surveying the entire district was continuedthrough June 9, when the aerial survey fund was exhausted. Pilots and fishermen reportedsignificant herring biomass present in Norton Sound for at least another week. A late run ofsmall ripe fish was reported in the vicinity of Cape Denbigh on June 12. Forty-four miles ofspawn were observed during surveys with a peak: spawn of 8.4 miles seen on May 27. The 1993biomass, which includes the harvest, is estimated to be 46,549 tons (Table 2).
Two Department field crews were operational during the 1993 season. One crew operated fromCape Denbigh and the second crew operated from Klikitarik. The Klikitarik camp closed June1 due to a limited budget. Test fish crews sampled 2,597 herring caught with variable meshgillnets for biological data. Age 11 herring comprised 22.1 % of the biomass. Age 5 dominated(28.0%) the return in numbers of fish. The biomass consisted of 58.4% age 9 and older herring(Figure 5). Recruit herring represented 36.2% of the return in numbers of fish (Figure 6).
Port Clarence District
Generally, it is not possible to survey this district due to ice, water stain, and poor weather. Inaddition, it is difficult to identify herring due to the large numbers of saffron cod, whitefish, andother pelagic species typically present in the area. A record biomass for this district of 1,652tons was sighted during an aerial survey in 1992. One aerial survey was flown in 1993. Underfair aerial survey conditions on June 15, 822 tons of herring were observed. No herring spawnwas sighted.
SUBSISTENCE FISHERY
Pacific herring are an important component of the diet of residents of many Yukon-KuskokwimDelta villages. Surveys of subsistence harvests have been conducted annually in Yukon Deltavillages and sporadically in Kuskokwim Delta villages since 1975. The total catch reported fromsurveys or mailed questionnaires should be considered minimum levels of effort and harvest sincenot all fishing families are contacted and not all families contacted by mail return completedquestionnaires.
Extensive subsistence surveys have been conducted by Subsistence Division in the Nelson andNunivak: Island Districts in the Kuskokwim Area since 1990 (Pete 1990, 1991, 1992). This effortwas prompted by concern over expected low returns of herring to these districts. A total of 82tons of herring was harvested for subsistence by 89 Nelson Island fishing families in 1993 (MaryPete, 1993, ADF&G Alaska Department of Fish and Game, Bethel, personal communication)(Table 4). Sixteen fishing families in the village of Mekoryuk on Nunivak Island harvested 1.5
7

tons of herring.
During 1993, 190 subsistence herring survey questionnaires were mailed to subsistence fishingfamilies in the Yukon Delta villages of Hooper Bay, Chevak and Scammon Bay. Additionally,personal interviews were conducted in Hooper Bay and Scammon Bay in September to contactfishermen who did not return questionnaires. Seventy-eight (41 %) of the 190 identifiedsubsistence fishing households were contacted. Approximately 5 tons of herring were reportedas having been harvested by 42 fishing families (Table 4). In addition, 513 pounds of roe-onkelp (Fucus) were taken by 19 kelpers for subsistence use.
COMMERCIAL FISHERY
Security Cove District
The commercial herring fishery in the Security Cove District has opened and closed byemergency order since 1981 to provide for an orderly fishery and periodic assessment of herringbiomass. Only 5 tons of herring were harvested during four openings for a total fishing time of24.5 hours in the Security Cove District in 1993 (Tables 1, 2 and 6 ).
The low harvest in the Security Cove District was probably due to the relatively late arrival offishermen and processors. The district was placed on two hour advanced notice for commercialfishing on May 5; however fishermen did not arrive in the district until May 12. The averagetime between the first commercial periods in the Togiak and Security Cove Districts is four days(range 2 to 9 days). This year there were 15 days between the first opening at Togiak andSecurity Cove. There was a total of 11.7 miles of spawn observed in the district before May 12.
The district was opened to commercial harvest for three hours starting at 12:00 noon on May 12(Table 6). One processor purchased 5.2 tons of sac roe herring with an average roe percentageof 12.8% from nine fishermen (Tables 2 and 3). There were three more openings: 6 hours onMay 12-13, 6.5 hours on May 13 and 9 hours on May 14. No herring were delivered duringthese openings. The processor and all fishermen left the district after the May 14 opening. Thetotal exvessel value of the catch to nine fishermen was approximately $2,000 (compared to$285,000 in 1992) (Table 2). The exploitation rate is estimated to be 0.1% of the observedbiomass.
A sample of 98 herring was taken from the commercial catch. Age 9 and older herringrepresented 76.2% of the harvest (Figure 4). Recruits were only 1.4% of the catch.
Goodnews Bay District
Since 1981, commercial herring fishing in Goodnews Bay has opened and closed by emergency
8

order to provide for an orderly fishery and periodic reassessments of herring biomass. In 1993,954.2 tons were harvested in a record 20 commercial periods for a total fishing time of 123 hours(Tables 1, 2 and 6).
A meeting with fishermen and processors was held on May 11. Commercial fishermen broughtcatch samples to the meetings for evaluation by industry roe technicians. Roe content ofcommercial test fish samples averaged 13.8%. The fishery first opened on May 12 for 6 hourswith 33 fishermen delivering 65.5 tons of sac roe herring with an average roe content of 10.5%and 0.7 tons of bait. The total catch was 944.9 tons of sac roe quality herring with an averageroe content of 10.3% and 9.3 tons of bait. Catches ranged from 130 tons on May 18 to 0.0 tonson May 27 and May 28-29. During the fishery, roe contents ranged from 9.6% to 12.1 %. Threeprocessors bought herring from 63 permit holders who made 705 deliveries with an estimated exvessel value of $293,000 (Tables 2 and 3). The exploitation rate was 15.4% of the availablebiomass.
A sample of 745 herring was taken from the commercial catch. Age 9 and older herring madeup 61.4% of the catch by weight (Figure 4). Recruit herring comprised only 4.5% of the harvest.
Cape Avinal District
This was the sixth year of commercial herring fishing in the Cape Avinof District. As in allother Kuskokwim Bay districts, commercial herring fishing is regulated by emergency order. InNovember 1989, the Alaska Board of Fisheries moved the eastern boundary of the Cape AvinofDistrict from Tsintulik Slough to the Ishkowik River. This area was previously closed tocommercial fishing at the request of local residents to prevent interference with the subsistenceharvest. In 1993, fishermen caught 215.2 tons of herring in sixteen commercial openings fora total of 106 hours of fishing time (Tables 1, 2 and 6).
Samples brought to Kipnuk by commercial fishermen on May 22 had an average roe content of11.7%. The district was first opened to commercial fishing for 2 hours starting at 1:30 pm onMay 23. The harvest was 28.3 tons of sac roe herring with an average roe content of 10.8%.Fifty-three fishers made deliveries. Between May 24 and June 1 the district was reopened fifteentimes for 104 hours of fishing time. Catches ranged from 59.6 tons on May 24 to 0.1 tons onJune 1. Roe contents ranged from 15.0% to 10.4%. A total of 205.9 tons of sac roe qualityherring with an average roe content of 12.0% and 9.3 tons of bait were caught. In the CapeAvinof District, 97 fishermen made 478 deliveries to one processor worth approximately $75,000(Tables 2 and 3). The exploitation rate was 7.6% of the available biomass. During the first fiveopenings approximately twelve permit holders made 41 deliveries for 18 tons of sac roe herringwith a 12.1 % roe content in the Kwigillingok area.
A sample of 980 herring was taken from the commercial catch. Age 9 and older herring madeup 82.3% of the catch by weight (Figure 4). Young herring (ages 3, 4, and 5) comprised only3.0% of the harvest.
9
Nelson Island District
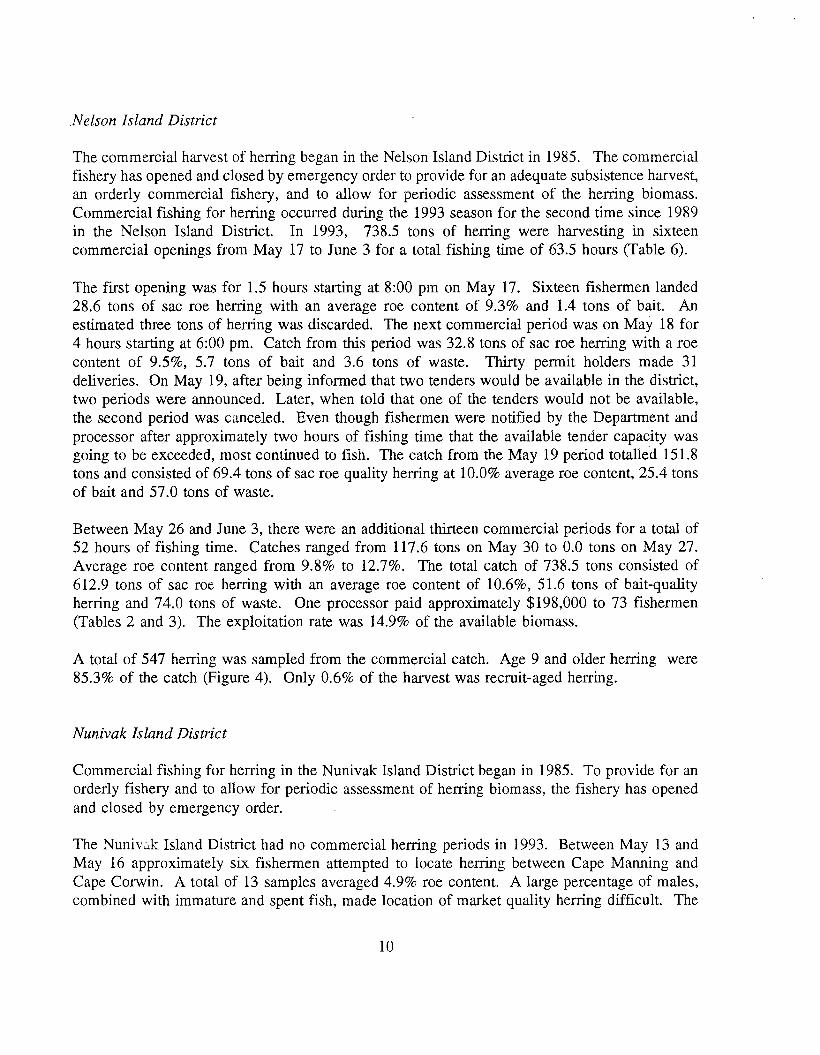
The commercial harvest of herring began in the Nelson Island District in 1985. The commercialfishery has opened and closed by emergency order to provide for an adequate subsistence harvest,an orderly commercial fishery, and to allow for periodic assessment of the herring biomass.Commercial fishing for herring occurred during the 1993 season for the second time since 1989in the Nelson Island District. In 1993, 738.5 tons of herring were harvesting in sixteencommercial openings from May 17 to June 3 for a total fishing time of 63.5 hours (Table 6).
The first opening was for 1.5 hours starting at 8:00 pm on May 17. Sixteen fishermen landed28.6 tons of sac roe herring with an average roe content of 9.3% and 1.4 tons of bait. Anestimated three tons of herring was discarded. The next commercial period was on May 18 for4 hours starting at 6:00 pm. Catch from this period was 32.8 tons of sac roe herring with a roecontent of 9.5%, 5.7 tons of bait and 3.6 tons of waste. Thirty permit holders made 31deliveries. On May 19, after being informed that two tenders would be available in the district,two periods were announced. Later, when told that one of the tenders would not be available,the second period was canceled. Even though fishermen were notified by the Department andprocessor after approximately two hours of fishing time that the available tender capacity wasgoing to be exceeded, most continued to fish. The catch from the May 19 period totalled 151.8tons and consisted of 69.4 tons of sac roe quality herring at 10.0% average roe content, 25.4 tonsof bait and 57.0 tons of waste.
Between May 26 and June 3, there were an additional thirteen commercial periods for a total of52 hours of fishing time. Catches ranged from 117.6 tons on May 30 to 0.0 tons on May 27.Average roe content ranged from 9.8% to 12.7%. The total catch of 738.5 tons consisted of612.9 tons of sac roe herring with an average roe content of 10.6%, 51.6 tons of bait-qualityherring and 74.0 tons of waste. One processor paid approximately $198,000 to 73 fishermen(Tables 2 and 3). The exploitation rate was 14.9% of the available biomass.
A total of 547 herring was sampled from the commercial catch. Age 9 and older herring were85.3% of the catch (Figure 4). Only 0.6% of the harvest was recruit-aged herring.
Nunivak Island District
Commercial fishing for herring in the Nunivak Island District began in 1985. To provide for anorderly fishery and to allow for periodic assessment of herring biomass, the fishery has openedand closed by emergency order.
The NunivJ.k Island District had no commercial herring periods in 1993. Between May 13 andMay 16 approximately six fishermen attempted to locate herring between Cape Manning andCape Corwin. A total of 13 samples averaged 4.9% roe content. A large percentage of males,combined with immature and spent fish, made location of market quality herring difficult. The
10

tender left the Nunivak Island District for the season on May 17.
Cape Romanzof District
A total of 371 tons of herring was harvested by 41 fishermen utilizing 41 fishing vessels in 1993(Tables 1, 2 and 3). All 371 tons were purchased as sac roe. The average sac roe recovery of9.6% was the second highest on record. Approximately 2 tons of herring were discarded in anabandoned gillnet. The commercial fishery consisted of 6 periods between May 17 and May 23.Fishing periods ranged from 1 hour to 4 hours duration for a total fishing time of 12.5 hours.
The commercial harvest was managed to achieve the preseason harvest projection of 367 tons,since no inseason biomass estimate was obtained. Fishing gear was restricted to one 50-fathomgillnet per vessel throughout the commercial season. Low effort, stormy weather and arelatively small tendering capacity resulted in low period catches. Fishing effort in 1993 was thelowest on record, and was 44% below the 1992 effort level. Local Alaskan residents (definedas residents of Chevak, Hooper Bay, and Scammon Bay) accounted for 95% (39 permits) of theeffort and 91% (338 tons) of the harvest. The estimated value of the total harvest to fishermenwas $106,403. Two companies purchased herring (Table 3). These companies were representedby two processing vessels and four tenders during the fishery.
A total of 886 herring were sampled from the commercial harvest. Age 9 and older herringmade up 93.3% of the catch by weight (Figure 5). Herring recruits comprised only 0.5% of theharvest.
Norton Sound District
The 1993 Norton Sound herring fishery opened by emergency order on May 24. During the sacroe season, there were seven gillnet openings for a total fishing time of 41.5 hours; four beachseine openings for a total fishing time of 11 hours; and two cooperative beach seine openings fora total fishing time of 36.5 hours (Table 6). Two educational openings were also allowed for atotal fishing time of 10 hours. Subdistricts 1 through 5 were closed on June 9. An additional0.2 tons of bait-quality herring were taken after the sac roe season during 96 hours of fishing insubdistrict 7. The total harvest based on fish ticket data for the sac roe fishery wasapproximately 5,034 tons of herring. In addition, approximately 45 tons estimated to have beenlost in abandoned beach seine sets were added to the commercial catch for a total commercialremoval of 5,079 tons of herring (Tables 1 and 2). Since 1981, catches have averaged 4,667tons. Table 8 compares historic beach seine and gillnet commercial catches in the Norton SoundDistrict.
There were 264 fishermen who made at least one delivery during the season (Table 3). This isthe lowest effort since 1985, excluding 1992 when there was no fishery. Fishing effort has beendeclining since limited entry was put into effect. This season's low effort was in part due to the
11

poor price projected prior to the season, the lack of a commercial herring fishery in 1992, andan extended commercial season in 1993.
During the 1993 season, 256 fishermen used gillnets, landing a total of 4,291.5 tons (Tables 3and 6). The average sac roe recovery for the gillnet fishery was 10.0%. Seven fishermenparticipated in the beach seine fishery, landing 742.4 tons of herring. The average sac roerecovery for the beach seine fishery herring was 8.9%. One educational gillnet permit wasissued by CFEC,and fished by the Bering Straits School District Commercial FisheriesVocational class on May 30 and 31. A total of 8.7 tons was landed on this permit, and isincluded in the total gillnet harvest.
The average sac roe recovery for all gear types was 9.9% (Table 2). The average price paid tothe fishermen for a short ton of herring with 9.9% roe recovery was approximately $294. Of the5,034 tons harvested, 320.7 tons were purchased as bait-herring (with roe content less than 7.0%).The total value of the herring harvest to Norton Sound fishermen was approximately $1,411,142.Six companies registered 10 processors and 48 tenders to operate in Norton Sound (Table 3).
The commercial fishery was managed using the preseason biomass projection. The preseasonguideline harvest was 9,054 tons, with 8,149 tons allocated to the gillnet fishery and 905 tonsallocated to the beach seine fishery. During the fishery, it was assumed the projected biomasswas present and that the preseason guideline harvest could be harvested.
The first beach seine opening was held on the morning of May 24. Because roe quality wasgood at some locations, a beach seine opening was scheduled for mid-day and a gillnet openingwas scheduled for the evening of May 25. In order to minimize the harvest rate and to requirethe fishermen to more closely tend their nets, the gillnet fishery was restricted to one 50 fathomnet. A second gillnet opening was announced the following day to allow approximately 1.5 daysfor processing the harvest. The catch rate for the second opening was less than expected so anextension of two hours was allowed. A third gillnet opening held on May 27 resulted in lessthan 500 tons harvested. On May 28, a beach seine opening produced a catch of less than 9.0%roe-recovery. The decision to curtail fishing for several days was made in order for the spawnedout older age classes to move out of nearshore waters and allow time for the younger age classesto migrate in. Over the next four days the educational permit fishery and test fishing occurred.Many fishermen made the decision to leave the area for the season.
On June 2, a large biomass of the younger age classes arrived in nearshore waters. Test fishingin the vicinity of St. Michael Island resulted in good roe quality and the gillnet fishery resumedthat afternoon. The fishing fleet was reduced to one-half its size compared to the week before.During this time, the beach seine fishermen agreed to cooperatively harvest the remainder of theirharvest allocation. The beach seine fleet fished the evening of June 1 at Besboro Island and onJune 3 and 4 near Portage Roadhouse. The gillnet fleet completed their season in the vicinityof Cape Darby on June 5. Test fishing continued the next day, but no concentrations ofmarketable fish were found. During late June, three fishermen continued to fish in the vicinityof Nome and Port Clarence for small quantities of bait. The final harvest of 5,034 tons combined
12

with an estimated waste of 45 tons gives a total harvest of 5,079 tons with an exploitation rateof 10.9%.
A total of 2,630 herring were sampled from the commercial harvest. Age 9 and older dominated(94.5%) the gillnet harvest. Ages 5 and 11 herring comprised 23.5% and 18.1 % of beach seinecatches, respectively.
Port Clarence District
There has not been a commercial sac-roe fishery in the Port Clarence District since 1988 becausebuyers have not been present in the district. During 1993, 1 ton of bait-quality herring washarvested between April 15 and November 15 in the Port Clarence District.
ENFORCEMENT
At least 8 people from the Division of Fish and Wildlife Protection (FWP) were present in allbut the Security Cove, Cape Avinof and Cape Romanzof Districts in 1993. The PIV Wolstad,a C-185 aircraft and a helicopter spent time in the Goodnews Bay, Nelson Island and NunivakIsland Districts during the season.
Protection efforts in Norton Sound consisted of three single engine aircraft (a super cub onwheels, a helicopter and a C-185 on wheels) and several small boats as well as the PN Wolstad.Personnel consisted of 8 permanent, full-time Fish and Wildlife Protection officers and fourcivilian Public Safety employees. Fish and Wildlife Protection officers patrolled the groundsduring each opening and closure. Twenty five citations were issued for the following sorts ofviolations: fishing after a closure, abandoned nets, vessel registration, over gear limit, improperlymarked vessels, fishing without a permit, no photo ID and fishing without a crew memberlicense. In addition, investigations are pending on abandoned gillnet gear and superexclusive useviolations. A total of 10.9 st at 10.2% of herring was confiscated by the State of Alaska duringthe 1993 season in the Norton Sound District.
OUTLOOK AND MANAGEMENT STRATEGY FOR 1994
Projections from post-season escapement estimates, using historic mean rates of survival andcurrent mean weights for each age class (Bromaghin and Hamner 1993, Alaska Department ofFish and Game, Anchorage, personal communication), and estimates of recruitment for each ageclass (Wespedstad 1982), indicate that the 1994 spawning biomass for the northeastern BeringSea herring stocks (Security Cove to Norton Sound) will be approximately 67,760 tons (Table7). Variability in the quality of aerial survey assessments of biomass and deviations from the
13

assumed survival or recruitment rates may result in the observed biomass being either above orbelow these projections. Therefore, harvest levels will be adjusted during the season accordingto observed herring spawning biomass. In addition, in accordance with the AYK Region harvestpolicy, newly recruited age classes (age 2 through 5 year-old-herring) will not be targeted by thecommercial fishery. If it is not possible to determine herring abundance using aerial surveymethods, stock abundance will be assessed using information from the projected biomass, testand commercial catches and spawn deposition observations.
Security Cove District
The 1994 projected return to the Security Cove District is 7,638 tons. A 20% exploitation ratewould result in a harvest of about 1,528 tons (Table 7). This harvest would be a historic recordfor this district. A larger catch may occur if the 1994 biomass assessment is greater than theprojection. Commercial fishing will not be allowed until the observed biomass reaches 1,200tons or significant spawning activity is observed. The occurrence and length of fishing periodswill depend on stock strength, fishing effort, and spawning activity.
Ages 5, 6 and 7 herring are expected to dominate the return. Age 9 and older herring areexpected to comprise approximately 16.1% of the biomass.
Goodnews Bay District
Management strategy for this district will be similar to that used for Security Cove. The seasonwill open and close by emergency order when a biomass of 1,200 tons is observed or spawningactivity occurs. The 1994 projected return of herring to the Goodnews Bay District is 5,679 tons.A 20% exploitation rate would result in a harvest of 1,136 tons which if taken would be ahistoric record for this district (Table 7). A larger catch may occur if the 1994 biomassassessment is greater than the projection.
Ages 6 and 7 herring are expected to be the dominant year classes in the return. Age 9 andolder herring are expected to comprise approximately 20% of the biomass.
Cape Avinoj District
Either significant spawning aCtiVIty or a biomass of 500 tons must be observed before thecommercial herring season can be opened. The season will open and close by emergency order.The projected 1994 biomass for the Cape Avinof area stock is 2,827 tons (Table 7). Theexploitation rate will be set at 15% because of the limited data base for this area and the priorityof subsistence fishing. Assuming a 15% commercial exploitation rate, the projected harvestwould be 424 tons of herring.
14

Age 6 herring are expected to be the largest year class in the returning population. Age 9 andolder herring are expected to comprise approximately 29.4% of the returning population.
Nelson Island District
In the Bering Sea Herring Fishery Management Plan the Alaska Board of Fisheries set aminimum biomass threshold of 3,000 tons necessary for a commercial herring fishery in theNelson Island District. The inseason estimate of herring biomass must exceed the threshold levelbefore a commercial fishery can be allowed.
The spawning biomass projected to return to the Nelson Island District in 1994 is 4,888 tons(Table 7). At an exploitation rate of 15%, the harvest will be 733 tons of herring. A larger catchmay occur if the 1994 biomass assessment is greater than the projection.
To provide additional protection for the subsistence harvest of herring, the following guidelineswill be followed:
1. The commercial fishery will not be allowed to take more than 15% of the herringbiomass, compared to up to 20% for most other fisheries having stocks of similar sizeand condition.
2. Periodic closures of the commercial fishery will be scheduled, during which time onlysubsistence fishing will be allowed.
3. Several important subsistence use areas occur throughout the district, including thewaters north of Cape Vancouver. Specific areas may be closed to commercial fishingto insure the adequacy of subsistence harvests.
4. The department will by all available means, including input from local residents, insurethe adequacy of subsistence herring harvests during the commercial fishing season.
Age 6 herring are expected to be the dominant age group. Herring age 9 and older are expectedto comprise approximately 16.7% of the biomass in 1993.
Nunivak Island District
The commercial season will open when the biomass reaches 1,500 tons or when significantspawning is observed. The projected biomass of herring returning to the Nunivak Island Districtin 1994 is 4,909 tons. A 15% exploitation rate would result in a 736 ton harvest (Table 7). Alarger catch may occur if the 1994 biomass assessment is greater than the projection.
Age 6 herring are expected to be the dominant age group. Age 9 and older herring are expected
15

to comprise 39.5% of the return.
Cape Romanzof District
The projected return for 1994, based upon limited data, is 2,758 tons which would result in a 414ton harvest at a 15% exploitation rate (Table 7). Ages 10 and 12 herring are expected todominate the biomass. Age 9 and older herring are expected to comprise 62.7% of the biomass.
Emergency order authority will be used to regulate the occurrence and length of fishing periods.Aerial biomass assessment cannot be used to determine the opening of commercial fishing dueto typically poor survey conditions caused by turbid water. Therefore, spawn depositionobservations and test and commercial catch rates will be used to determine timing and durationof commercial fishing periods. If stock abundance is judged to be lower or higher than theprojection, the projected harvest of 414 tons will be modified accordingly.
Norton Sound District
The Norton Sound projected return is 39,061 tons. A 20% exploitation rate would result in aharvest of 7,812 tons (Table 7). The 1994 biomass is expected to be dominated by 6 and 12year old herring. Age 9 and older herring are expected to comprise 47.2% of the biomass.
Inseason assessment of herring biomass will supersede projected biomass for management of theNorton Sound herring fishery except where weather prevents obtaining an inseason estimate. Thebeach seine harvest is, by regulation, 10% of the projected harvest, or 781 tons.
The 1994 herring fishery will be opened by emergency order. The fishery will close byemergency order when up to 20% of the available herring biomass has been harvested. Variedharvest rates may be applied to individual subdistricts based on biomass distribution, roe quality,weather, and sea ice conditions.
Port Clarence District
The department does not generally project an outlook for the Port Clarence fishery due to thelack of data on Port Clarence herring and the very limited scope of the fishery. The guidelineharvest of 165 tons established by the Board of Fisheries in 1981 will determine the allowableharvest in 1994. This harvest guideline is based on two years research by the department in boththe Port Clarence and Kotzebue Districts. Even though this guideline has not appeared in theregulation book since 1984, it still represents the best estimate of harvestable biomass at thistime.
16
LITERATURE CITED
Alaska Department of Fish and Game. February 1993. 1993 Herring Fisheries ManagementPlan. Regional Infonnation Report No. 3A93-06. 7pp. Anchorage, Alaska.
Lebida, R. C. and D. C. Whitmore. 1985. Bering Sea Herring Aerial Survey Manual. AlaskaDepartment of Fish and Game, Division of Commercial Fisheries, Bristol Bay Data Report85-2, Anchorage.
Pete, Mary C. 1990. Subsistence-Herring Fishing in the Nelson Island and Nunivak IslandDistricts, 1990. Alaska Department of Fish and Game, Division of Subsistence, Juneau.Technical Paper No. 196.
Pete, Mary C. 1991. Subsistence-Herring Fishing in the Nelson Island and Nunivak IslandDistricts, 1991. A Report to the Alaska Board of Fisheries. Alaska Department of Fish andGame, Division of Subsistence, Juneau.
Pete, Mary C. 1992. Subsistence-Herring Fishing in the Nelson Island and Nunivak IslandDistricts, 1992. Alaska Department of Fish and Game, Division of Subsistence, Juneau.Technical Paper No. 221.
Pete, Mary C. 1993. Subsistence-Herring Fishing in the Nelson Island and Nunivak IslandDistricts, 1992. Alaska Department of Fish and Game, Division of Subsistence, Juneau.Technical Paper No. 192.
Wespestad, V.G. 1982. Cohort analysis of catch data on Pacific herring in the eastern BeringSea, 1959-81. National Oceanic and Atmospheric Administration, National Marine FisheriesService, Technical Memorandum NMFS F/NWC-24, Seattle.
17

Table I. Pacific herring harvests by domestic commercial fishermen during the sac-roe fisheries in the northeastern Bering Sea, Alaska, 1909-1993.
Spawn onHerring (st)' Kelp (st)
Security Goodnews Cape Nelson Nunivak Cape Norton Port Total NortonYear Cove Bay Avinof Island Island Romanzof Sound Clarence Harvest Sound
1909-1916 _b
1916-1928 1,881 1,8811929 166 1661930 441 4411931 86 861932 529 5291933 31 311934 4 41935 15 1519361937 6 61938 10 101939 6 61940 14 141941 3 3
1942-194419451946
1947-19631964 20 2019651966 12 12196719681969 2 21970 8 81971 20 201972 17 171973 35 351974 2 219751976 9 91977 11 11 <11978 286 15 301 41979 424 90 1,292 1,806 131980 697 448 611 2,452 4,208 241981 1,173 657 720 4,371 6,921 471982 813 486 657 3,933 5,889 381983 1,073 435 816 4,582 6,906 291984 335 717 1,185 3,662 5,899 19"1985 733 724 977 358 1,299 3,548 7,6391986 751 557 886 511 1,865 5,194 9,7641987 313 321 923 414 1,342 4,082 146 7,5411988 324 483 348 775 1,119 4,672 80 7,8011989 554 616 129 233 116 926 4,771 7,3451990 234 455 50 329 6,439 7,5071991 570 263 267 59 526 5,672 7,3571992 834 740 451 246 27 530 2,8281993 5 954 215 739 371 5,079 7,363
• Pre-1964 harvest primarily in summer and fall for food; post 1964 harvest primarily in spring for sac roe. Wastage included.b Fishery occurred some years but harvest data unavailable.o Additional 3 st harvested from imported kelp (Macrocystis sp) not included.
18
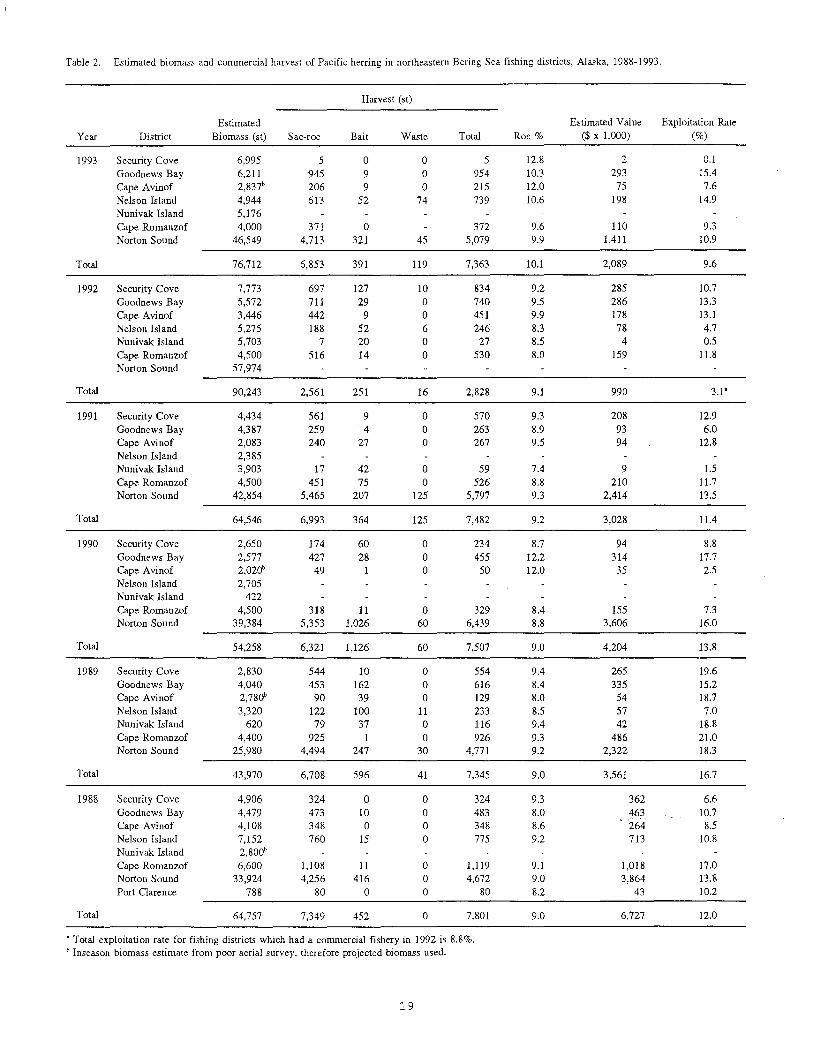
Table 2. Estimated biomass and commercial harvest of Pacific herring in northeastern Bering Sea fishing districts, Alaska, 1988-1993.
Harvest (st)
Estimated Estimated Value Exploitation Rate
Year District Biomass (st) Sac-roe Bait Waste Total Roe % ($ x 1,000) (%)
1993 Security Cove 6,995 5 0 0 5 12.8 2 0.1
Goodnews Bay 6,211 945 9 0 954 10.3 293 15.4
Cape Avinof 2,837b 206 9 0 215 12.0 75 7.6
Nelson Island 4,944 613 52 74 739 10.6 198 14.9
Nunivak Island 5,176Cape Romanzof 4,000 371 0 372 9.6 110 9.3
Norton Sound 46,549 4,713 321 45 5,079 9.9 1,411 10.9
Total 76,712 6,853 391 119 7,363 10.1 2,089 9.6
1992 Security Cove 7,773 697 127 10 834 9.2 285 10.7
Goodnews Bay 5,572 711 29 0 740 9.5 286 13.3
Cape Avinof 3,446 442 9 0 451 9.9 178 13.1
Nelson Island 5,275 188 52 6 246 8.3 78 4.7
Nunivak Island 5,703 7 20 0 27 8.5 4 0.5
Cape Romanzof 4,500 516 14 0 530 8.0 159 11.8
Norton Sound 57,974
Total 90,243 2,561 251 16 2,828 9.1 990 3.1'
1991 Security Cove 4,434 561 9 0 570 9.3 208 12.9
Goodnews Bay 4,387 259 4 0 263 8.9 93 6.0Cape Avinof 2,083 240 27 0 267 9.5 94 12.8
Nelson Island 2,385Nunivak Island 3,903 17 42 0 59 7.4 9 1.5
Cape Romanzof 4,500 451 75 0 526 8.8 210 11.7
Norton Sound 42,854 5,465 207 125 5,797 9.3 2,414 13.5
Total 64,546 6,993 364 125 7,482 9.2 3,028 11.4
1990 Security Cove 2,650 174 60 0 234 8.7 94 8.8
Goodnews Bay 2,577 427 28 0 455 12.2 314 17.7Cape Avinof 2,020b 49 1 0 50 12.0 35 2.5
Nelson Island 2,705Nunivak Island 422Cape Romanzof 4,500 318 II 0 329 8.4 155 7.3Norton Sound 39,384 5,353 1,026 60 6,439 8.8 3,606 16.0
Total 54,258 6,321 1,126 60 7,507 9.0 4,204 13.8
1989 Security Cove 2,830 544 10 0 554 9.4 265 19.6Goodnews Bay 4,040 453 162 0 616 8.4 335 15.2Cape Avinof 2,780b 90 39 0 129 8.0 54 18.7Nelson Island 3,320 122 100 11 233 8.5 57 7.0Nuniyak Island 620 79 37 0 116 9.4 42 18.8
Cape Romanzof 4,400 925 1 0 926 9.3 486 21.0Norton Sound 25,980 4,494 247 30 4,771 9.2 2,322 18.3
Total 43,970 6,708 596 41 7,345 9.0 3,561 16.7
1988 Security Cove 4,906 324 0 0 324 9.3 362 6.6Goodnews Bay 4,479 473 10 0 483 8.0 463 10.7Cape Avinof 4,108 348 0 0 348 8.6 264 8.5Nelson Island 7,152 760 15 0 775 9.2 713 10.8Nunivak Island 2,800b
Cape Romanzof 6,600 1,108 11 0 1,119 9.1 1,018 17.0Norton Sound 33,924 4,256 416 0 4,672 9.0 3,864 13.8
Port Clarence 788 80 0 0 80 8.2 43 10.2
Total 64,757 7,349 452 0 7,801 9.0 6,727 12.0
• Total exploitation rate for fishing districts which had a commercial fishery in 1992 is 8.8%.b Inseason biomass estimate from poor aerial survey, therefore projected biomass used.
19

Table 3. Number of buyers and fishermen participating in northeastern Bering Sea Pacific herring fisheries,Alaska, 1988-1993.
Number of Fishermen
Seine"
Year District Number of Buyers Gill Net Purse Beach
1993 Security Cove 1 9Goodnews Bay 3 63Cape Avinof 1 97Nelson Island 1 73Nunivak IslandCape Romanzof 2 41Norton Sound 6 256 7
1992 Security Cove 6 58Goodnews Bay 3 78Cape Avinof 2 121Nelson Island 3 85Nunivak Island 1 14Cape Romanzof 2 73Norton Sound 0
1991 Security Cove 6 52Goodnews Bay 2 103Cape Avinof 1 137Nelson IslandNunivak Island 2 17Cape Romanzof 2 80Norton Sound 8 272 7
1990 Security Cove 9 52Goodnews Bay 3 126Cape Avinof 1 101Nelson IslandNunivak IslandCape Romanzof 4 95Norton Sound 8 357 8
1989 Security Cove 8 110Goodnews Bay 6 138Cape Avinof 3 147Nelson Island 4 162Nunivak Island 3 45Cape Romanzof 6 115Norton Sound 9 351 6
1988 Security Cove 4 31Goodnews Bay 6 60Cape Avinof 1 98Nelson Island 7 174Nunivak IslandCape Romanzof 6 113Norton Sound 11 343 6Port Clarence 1 6 1
" Gear prohibited in all districts except Norton Sound and Port Clarence.
20

Table 4. Pacific herring subsistence harvest (st) and effort data from selected northeastern Bering Sea areas, Alaska, 1977-1993."
Village 1977 1978 1979 1980 1981 1982 1983 1984 1985 1986 1987 1988 1989 1990 1991 1992 1993
Nelson Island
Tununak 57 38 34 65 40 48 94 - 43 63 48 49 47 54 21 32 45Umkumiut 3 11 8 3 10 0 - - - - -c -c -c -c -0 -c
Toksook Bay 21 37 51 29 14 35 - - 46 70 51 58 52 46 40 43 23Nightmute - - - - - - - 3b 21 15 16 15 18 8 10 9Newtok - - - - - - - 7b 13 10 12 10 8 1 7 6
Total 81 86 93 97 64 83 94 - 99 167 124 136 124 126 70 92 82
No. FishingFamilies 90 83 54 70 93 65 43 - 65b n b 96 104 -b 100 85 97 89
Nunivak Island
Mekoryuk - - - - - - - <1 <1 - - - 5 4 4 2
No. FishingFamilies - - - - - - - 11 6b - - - 19 20 17 16
Other Kuskokwim Delta
~ Chefornak - - - - - - - - 13b - 14Kipnuk - - - - - - - 9 - 14Kongiganak - - - - - - - 3 2b
Kwigillingok 1 - 8 13 - 13 - - 5
Total 1 - 8 13 - 13 - - 30 2 28
No. FishingFamilies 9 - 22 19 - 21 - - 55b 12b 49
Yukon Delta
Scammon Bay 1 6 3 8 4 3 4 2 2 1 2 1 2 1 1 3Chevak <1 - 2 4 2 2 1 3 2 1 1 2 <1 1 <1 <1 <1Hooper Bay 2 4 3 4 4 5 5 4 4 4 1 4 2 6 2 2 2
Total <3 5 11 11 14 11 9 11 8 7 3 7 3 8 3 4 5
No. Fishing 30 29 84 61 46 43 37 47 44 41 39 32 24 32 18 30 42Families
" Subsistence survey results are believed to accurately reflect harvest trends, however, reported catches reflect minimum figures since all fishermen cannot be contacted.b Fishing families were not interviewed or only a portion of fishing families were interviewed as catch was enumerated while on drying racks.C Umkumiut effort included with Tununak.

Table 5. Pacific herring estimated biomass in the northeastern Bering Sea, Alaska, 1978-1993.
Herring (st)
Security Goodnews Cape Nelson Nunivak Cape Norton Port TotalYear Cove Bay Avinof Island Island Romanzof' Sound Clarence Biomass
1978 1,323 441 5,952 805 2,976 5,291 16,7881979 21,495 7,385 5,952 2,976 7,716 45,5241980 1.213 1,213 5,952 2,976 8,377 19,7311981 8,267 4,299 3,968 19 4,850 22,360 44,3311982 5,071 2,646 3,968 4,850 19,403 33,9511983 6,393 3,197 7,275 7,606 5,512 6,841 58,0921984 5,071 4,079 11,023 6,695 6,063 21,475 56,0791985 4,900 4,300 2,000 9,5()()b 5,700b 7,000 20,000 51,4001986 3,700b 3,()()()b 7,3()()b 6,000 7,500 28,100 55,6001987 2,300b 2,()()()b 1,225 8,100 4,400b 7,200 32,370 932 57,3321988 4,906 4,479 4,108 7,152 2,800b 6,600 33,924 788 64,7571989 2,830 4,040 2,78d' 3,320 620 4,400 25,981 43,9701990 2,650 2,577 2,02d' 2,705 422 4,500 39,384 54,2581991 4,434 4,387 2,083 2,385 3,903 4,500 42,854 64,5461992 7,773 5,572 3,446 5,275 5,703 4,500 57,974 1,652 91,8950
1993 6,995 6,211 2,837b 4,944 5,176 4,000 46,549 822 77,534d
a Biomass estimate based on aerial surveys, spawn deposition, age composition, and the CPUE from commercial and testfisheries.
b Inseason biomass estimated from poor aerial survey, therefore projected biomass was used.o Biomass is 90,243 tons if Port Clarence is excluded from total.d Biomass is 76,712 tons if Port Clarence is excluded from total.
22

Table 6. Summary of Pacific herring commercial harvest by fishing period for northeastern Bering Sea fishingdistricts, Alaska, 1993.
Subdistrict Total HarvestDistrict Section\Area Gear Period Date Time Hours Cst)
Security Cove Entire GN I 5\12 1200-1500 3.0 5.22 5\12-13 2200-0400 6.0 0.03 5\13 1000-1630 6.5 0.04 5\14 0900-1800 9.0 0.0
Total 24.5 5.2
Goodnews Bay Entire GN 1 5\12 0900-1500 6.0 66.32 5\13 1000-1800 8.0 119.83 5\14 1100-1700 6.0 55.34 5\15 1200-1800 6.0 100.35 5\16 1300-1900 6.0 68.06 5\17 1400-2100 7.0 99.57 5\18 1500-2200 7.0 130.08 5\19 1500-2200 7.0 124.49 5\20 0400-1000 6.0 59.3
10 5\21 0400-1000 6.0 21.611 5\21 1730-2300 6.0 41.412 5\22 0530-1130 6.0 26.213 5\22 1800-2400 6.0 17.414 5\23-24 1900-0100 6.0 2.215 5\24 0800-1200 4.0 11.516 5\27 0830-1430 6.0 8.917 5\27-28 2030-0230 6.0 0.018 5\28 0930-1530 6.0 1.919 5\28-29 2130-0330 6.0 0.220 5\29 1030-1630 6.0 0.0
Total 123.0 954.2
Cape Avinof Entire GN I 5\23 1330-1530 2.0 28.32 5\24 1000-1600 6.0 59.63 5\25 1000-1700 7.0 22.24 5\26 1100-1800 7.0 21.95 5\26-27 2300-0630 7.0 19.76 5\27 1200-1900 7.0 0.37 5\28 0030-0730 7.0 13.78 5\28 1300-2000 7.0 27.69 5\29 0130-0830 7.0 8.5
10 5\29 1400-2100 7.0 2.7II 5\30 0230-0930 7.0 5.312 5\30 1500-2200 7.0 0.213 5\31 0330-1030 7.0 1.714 5\31 1530-2230 7.0 1.515 6\01 0400-1100 7.0 0.116 6\01 1630-2330 7.0 1.9
Total 106.0 215.2
Nelson Island Entire GN 1 5\17 2000-2130 1.5 33.02 5\18 1800-2200 4.0 42.13 5\19 1700-2300 6.0 152.04 5\26 0230-0430 2.0 23.05 5\27 1400-1700 3.0 0.06 5\29 0230-0630 4.0 35.47 5\29 1300-1900 6.0 60.38 5\30 0200-0700 5.0 4.99 5\30 1400-2000 6.0 117.6
10 5\31 0700-0900 2.0 30.2II 5\31 1700-2100 4.0 20.112 6\01 0700-1000 3.0 26.813 6\01 1830-2230 4.0 56.614 6\02 0800-1100 3.0 24.315 6\02 1730-2330 6.0 86.316 6\03 0800-1200 4.0 25.9
Total 63.5 738.5
23

Table 6. (page 2 of 2).
Subdistrict Total HarvestDistrict Section\Area Gear Period Date Time Hours Cst)
Nunivak Island Entire GN No Commercial Fishery
Cape Romanzof Entire GN 1 5\17 2230-2400 1.5 98.82 5\18 1400-1500 1.0 44.73 5\20 1400-1500 1.0 22.14 5\22 0000-0400 4.0 104.35 5\22 1400-1700 3.0 59.26 5\23 1530-1730 2.0 41.9
Total 12.5 371.0
Norton Sound S.D. 1,2,3 GN 1 5\25 1700-2000 3.0 1,038.9S.D. 1,2,3 2 5\26 1100-1800 7.0 1,126.3S.D. 1,3 3 5\27 1130-1630 5.0 441.9S.D. 1 4 6\02 1700-2300 6.0 630.2S.D. 1 5 6\03 1430-2200 7.5 720.5S.D. 1 6 6\04 0900-1500 6.0 100.3S.D.5 7 6\05 1200-1900 7.0 224.5S.D.7 8 6\10-12 1800-1800 48.0 0.0S.D.7 9 6\16-18 1800-1800 48.0 0.2
Total 137.5 4,282.8'
S.D. 1 Educational 5\30-31 12oo-open 10.0 8.7
Total 147.5 4,291.52
S.D. 2,3 BS 1 5\24 1130-1430 3.0 166.2S.D. 2,3 2 5\25 1100-1400 3.0 162.7S.D.2 3 5\28 1200-1500 3.0 257.3S.D.2 4 5\31 1300-1500 2.0 78.0S.D.2 Coop 5 6\1-2 1830-0400 9.5 24.4S.D.5 Coop 6 6\3-4 1300-1600 27.0 53.8
Total 47.5 742.4
Port Clarence Open 4\15-8\15 0.58\16-11\15 0.5
Total 1.0
, Includes 6.9 st confiscated by Alaska Department of Public Safety.2 Does not include 45 st of waste.
24

Table 7. Projections of Pacific herring spawning biomass and harvest for commercial fishingdistricts in the northeastern Bering Sea, Alaska, 1994.
1994 Projection"
ExploitationDistrict Biomass(st) Threshold Harvest(st) Rate (%)
Security Cove 7,638 1,200 1,528 20Goodnews Bay 5,679 1,200 1,136 20Cape Avinof 2,827 500 424 15Nelson Island 4,888 3,000 733 15Nunivak Island 4,909 1,500 736 15Cape Romanzof 2,758b 1,500 414 15Norton Sound 39,061 7,000 7,812 20Port Clarence 1650
" Preseason projection. Biomass and harvest may be adjusted based on inseason estimates.b Projection from estimated 1993 relative biomass which was based on 1993 aerial surveys, spawn
deposition, age composition, and the CPUE from commercial and test fisheries.o Harvest guideline of 165st (150mt).
25

Table 8. Herring harvest by gear type and subdistrict, Norton Sound District, 1981-1993.
NORTON SOUND HERRING CATCHES
1981 1982 1983 1984 1985 1986 1987 1988 1989 1990 1991 1992 1993
GILLNET HARVEST (tons)St. Michael 3,067 2,062 434 _ 1,538 2,560 2,214 3,215 2,927 4,491 - _ 2,288Unalakleet 831 946 1,264 - 95 - - 42 10 618 731 - 120Cape Denbigh 472 925 2,692 3,244 1,599 2,420 1,545 1,211 1,414 923 4,419 _ 1,659Elim - - 65 - 147 - - 6 - - - - 225Golovin - - 85total aI 4,370 3,933 4,540 3,244 3,379 4,980 3,759 4,474 4,351 6,032 5,150 b/ 4,291
SEINE HARVEST (tons)St. Michael (beach) - - - - - - 4 45 329 6 - -
tv Unalakleet (beach) - - - - 93 - - 58 50 332 149 - 4670\ Cape Denbigh (beach) 41 327 76 30 293 96 11 9 373 222- - -
Elim (beach) - - - - - 185 - 54Cape Denbigh (purse) - - - - - - 26total aI 0 0 41 327 169 215 323 198 390 347 522 b/ 743
TOTAL HARVEST (tons) aI 4,370 3,933 4,581 3,571 3,548 5,195 4,082 4,672 4,741 6,380 5,672 0 5,034
Percent of total harvestGillnet Harvest 100.0 100.0 99.1 90.8 95.2 95.9 92.1 95.8 91.8 94.6 90.8 85.2Seine Harvest 0.0 0.0 0.9 9.2 4.8 4.1 7.9 4.2 8.2 5.4 9.2 14.8
aI Totals do not include waste.b/ No commercial fishery.
.,'. : . G.oodnews Bay,'. District
. Cape Avi nof .
R:District .,:
•• ° 0 •
Pi ngurbek .... : '.' . ,'.: :.': '. ' .Islands .. : .::.:.:.:.::......
Q\~.: .. . ':.;J-..:}t;....-'?WL;2id'~·.
Nelson Island .:..... . '. ':.
Distict
t.·.·(A iN_. .i 10Map Location
,0 16
KIll
Security Cove District
--District Boundaries
Figure 1. Security Cove, Goodnews Bay, Nelson Island,Island, and Cape Avinof Pacific herring commercialdistricts in the northeastern Bering Sea, Alaska
Nunivakfishing
27

C
f\~
IN.~
Map Location, i •0 16 30
Km
-----District Boundaries
-------Subdistrict Boundaries
NorIan Sound Olslrlcl
G
~.'... ,.
E~'/~""":
( t',·~.,"Y Cape Rornanzor/~Dis,ric:
-" ..
V·~.\l: ,
Figure 2. Cape Romanzof, ~jorton Sound, and Port Clarence Pacificherring commercial fishing districts in the northeasternBering Sea, Alaska
:23

Norton Sounc1(60.7%)
. . . . . . . . . . . . . . . . . . . . . . . . ..... - , ........................ , ............ . " .. - .. . . . . . . . . . . . . . . . . . . . . . . . . .. - - ............ . , ................................. - .... , - ........ ....... .. - - - ... . . . . . . . . . . . . . . . . . . . . . . . . . ........ ' ... . . . . . . . . . . . . . . . . . . . . . . . . . .. . . . . . . . . . . . . . . . . . . . . . . . . . ...... - '" .......... '" ............... - .. . . . . . . . . . . . . . . . . . . . . . . . . . . .. . . . . . . . . . . . . . . . . . . . . . . . .................. .................................................. .
. . . . . . . . . . . . . . . . . . . . . . . . . . . .. . . . . . . . . . . . . . . . . . . . . . . . . .. . . . . . . . . . . . . . . . . . . . . . . . . . . .. . . . . . . . . . . . . . . . . . . . . . . . . . .
Security COVE(9.1 %)
Goodnews Bay(8.1 %)
Cape Avinof(3.7%)
Nelson Island(6.4%)
Nunivak Island(6.7%)
Cape Romanzof(5.2%)
Figure 3. Pacific herring spawning biomass distribution by commercial fishing district,
Arctic- Yukon - Kuskokwim Region, Alaska, 1993.

Figure 4. Age composition of the total biomass and commercial harvest for the SecurityCove, Goodnews Bay, Cape Avinof, and Nelson Island commercial fishing districtswithin the Arctic-Yukon-Kuskokwim Region, Alaska, 1993.
30

Nunivak IslandTotal Run =5,176 sl
f-
l-
I-
~ f'V'O ro<l ~ P'VI
40
30
20
10
o4 8 10 11 12 13+
40 .----------------------------------,
+-'cCDU!l.-
CD0...
30
20
10
Cape RomanzofTotal Run = 4,000 st
Figure 5. Age composition of the total biomass and commercial harvest for the NunivakIsland, Cape Romanzof, Norton Sound commercial fishing districts, and theArctic-Yukon - Kuskokwim Region, Alaska, 1993.
31

~ 70P-1r:Q;S~ 60
~r:Q
~ 50
~~ 40P-1P-4ZH
rf) 30~H
~~U 20P-1~
o~ 10~~P-1~ 0
I I I
Security Cove Cape Avinof Nunivak Island Norton SoundGoodnews Bay Nelson Island Cape Romanzof
DISTRICT
Figure 6. Pacific herring recruits (ages 2, 3, 4, and 5) for commercial fishingdistricts within the Arctic-Yukon-KuskokWim Region, Alaska 1993.
N("'f)