P6.0 WG Highway Subcommittee Meeting #2
37
P6.0 WG Highway Subcommittee Meeting #2 December 18, 2018
Transcript of P6.0 WG Highway Subcommittee Meeting #2
P6.0 WG Highway Subcommittee
Meeting #2
December 18, 2018
Agenda
2
• Introductions
• Topics to Discuss
• Recap of P5.0 Highway Scoring
• Mobility and Modernization Default Percentages
• Resiliency Factor concept
• Reliability Travel Time Measure (HERE Data)
• Schedule / Next Steps

Introductions

Topics to Discuss

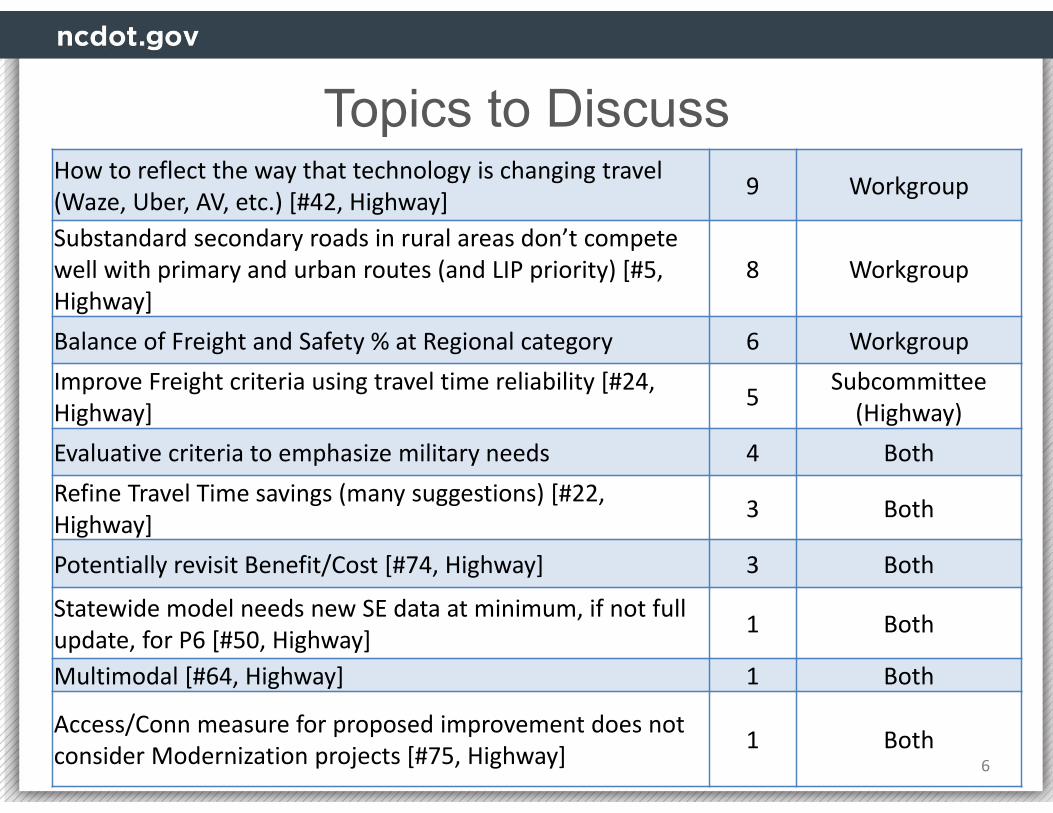
Topics to Discuss
5
Resiliency factor ‐ help projects that reduce occurrence of major roadway inundation and mobility issues [#2, Highway]
14 Subcommittee (Highway)
Peak ADT [#61, Highway] 12 Subcommittee (Highway)
Economic Competitiveness [#65, Highway] 11 Both
Safety Benefits Calculations and Urban/Rural Designations [#12, Highway] 10 Subcommittee
(Highway)
Division Needs level Travel Time Savings Calculations [#13, Highway] 10 Subcommittee
(Highway)
Linking SPOT criteria to performance measures and targets 10 Workgroup
Topics to Discuss
6
How to reflect the way that technology is changing travel (Waze, Uber, AV, etc.) [#42, Highway] 9 Workgroup
Substandard secondary roads in rural areas don’t compete well with primary and urban routes (and LIP priority) [#5, Highway]
8 Workgroup
Balance of Freight and Safety % at Regional category 6 WorkgroupImprove Freight criteria using travel time reliability [#24, Highway] 5 Subcommittee
(Highway)Evaluative criteria to emphasize military needs 4 BothRefine Travel Time savings (many suggestions) [#22, Highway] 3 Both
Potentially revisit Benefit/Cost [#74, Highway] 3 Both
Statewide model needs new SE data at minimum, if not full update, for P6 [#50, Highway] 1 Both
Multimodal [#64, Highway] 1 Both
Access/Conn measure for proposed improvement does not consider Modernization projects [#75, Highway] 1 Both
Recap of P5.0 Highway Scoring
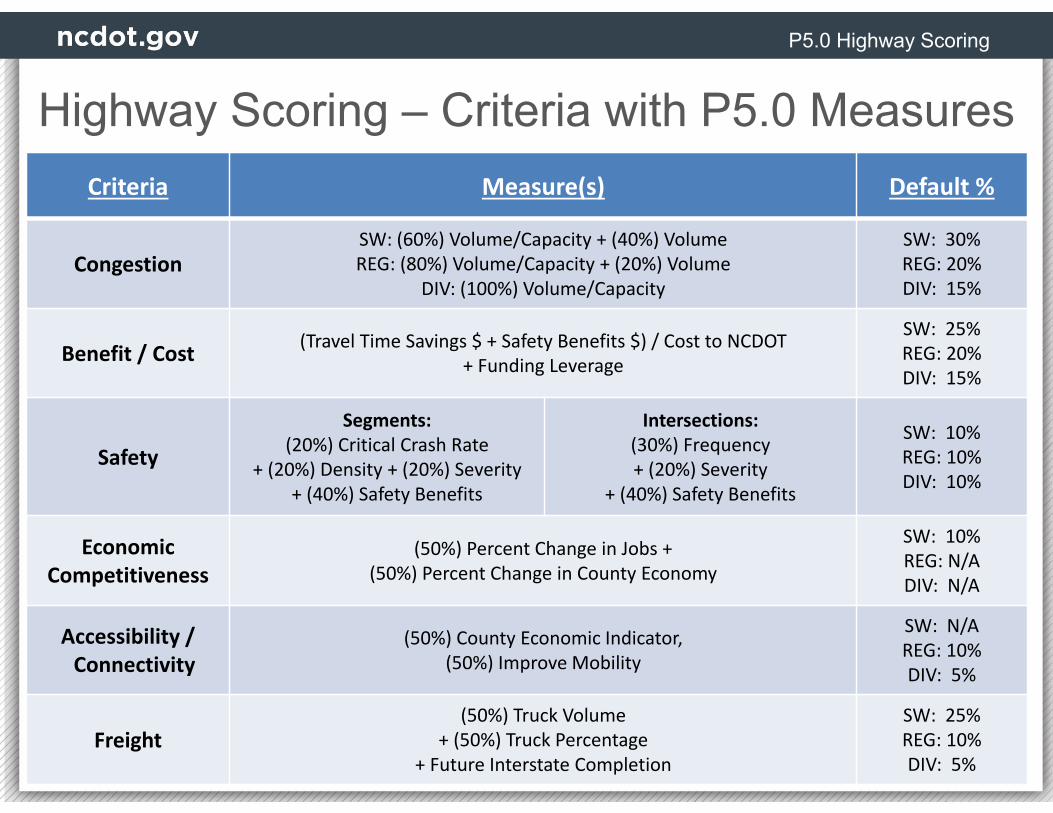
Criteria Measure(s) Default %
CongestionSW: (60%) Volume/Capacity + (40%) VolumeREG: (80%) Volume/Capacity + (20%) Volume
DIV: (100%) Volume/Capacity
SW: 30%REG: 20%DIV: 15%
Benefit / Cost (Travel Time Savings $ + Safety Benefits $) / Cost to NCDOT+ Funding Leverage
SW: 25%REG: 20%DIV: 15%
Safety
Segments: (20%) Critical Crash Rate
+ (20%) Density + (20%) Severity + (40%) Safety Benefits
Intersections: (30%) Frequency + (20%) Severity
+ (40%) Safety Benefits
SW: 10%REG: 10%DIV: 10%
Economic Competitiveness
(50%) Percent Change in Jobs + (50%) Percent Change in County Economy
SW: 10%REG: N/ADIV: N/A
Accessibility / Connectivity
(50%) County Economic Indicator, (50%) Improve Mobility
SW: N/AREG: 10%DIV: 5%
Freight(50%) Truck Volume
+ (50%) Truck Percentage + Future Interstate Completion
SW: 25%REG: 10%DIV: 5%
P5.0 Highway Scoring
Highway Scoring – Criteria with P5.0 Measures
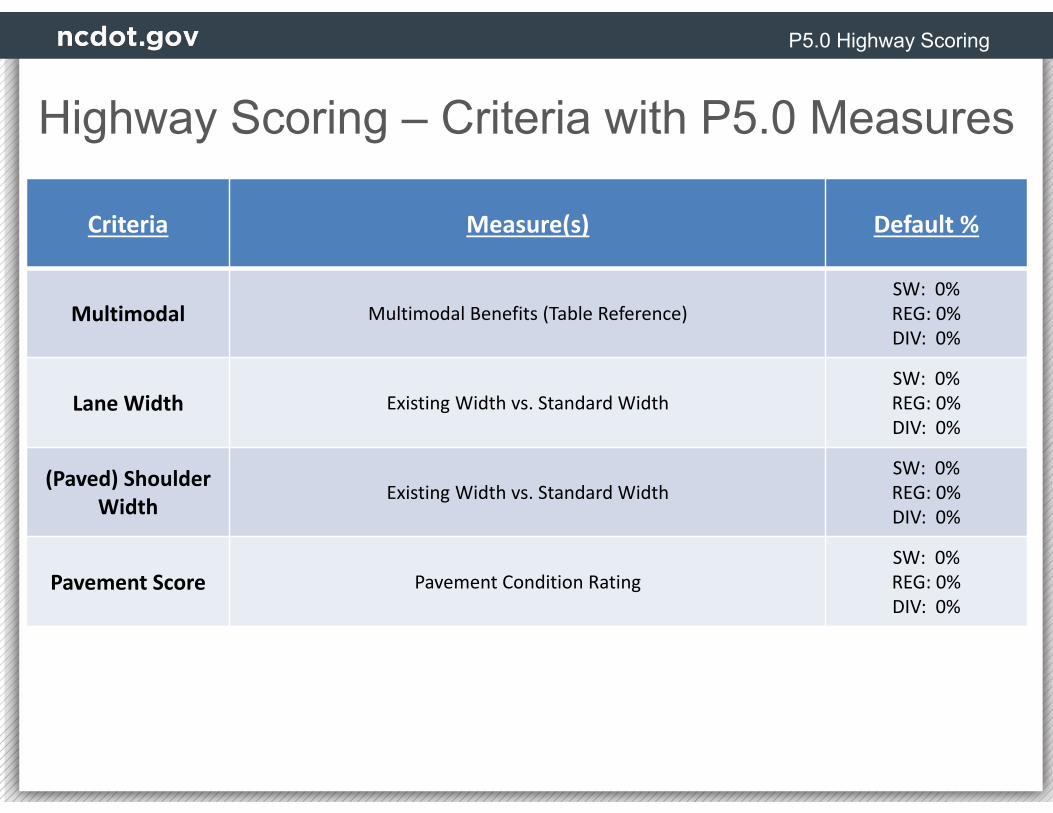
Criteria Measure(s) Default %
Multimodal Multimodal Benefits (Table Reference)SW: 0%REG: 0%DIV: 0%
Lane Width Existing Width vs. Standard WidthSW: 0%REG: 0%DIV: 0%
(Paved) Shoulder Width
Existing Width vs. Standard WidthSW: 0%REG: 0%DIV: 0%
Pavement Score Pavement Condition RatingSW: 0%REG: 0%DIV: 0%
P5.0 Highway Scoring
Highway Scoring – Criteria with P5.0 Measures
Mobility & Modernization Default %s
26
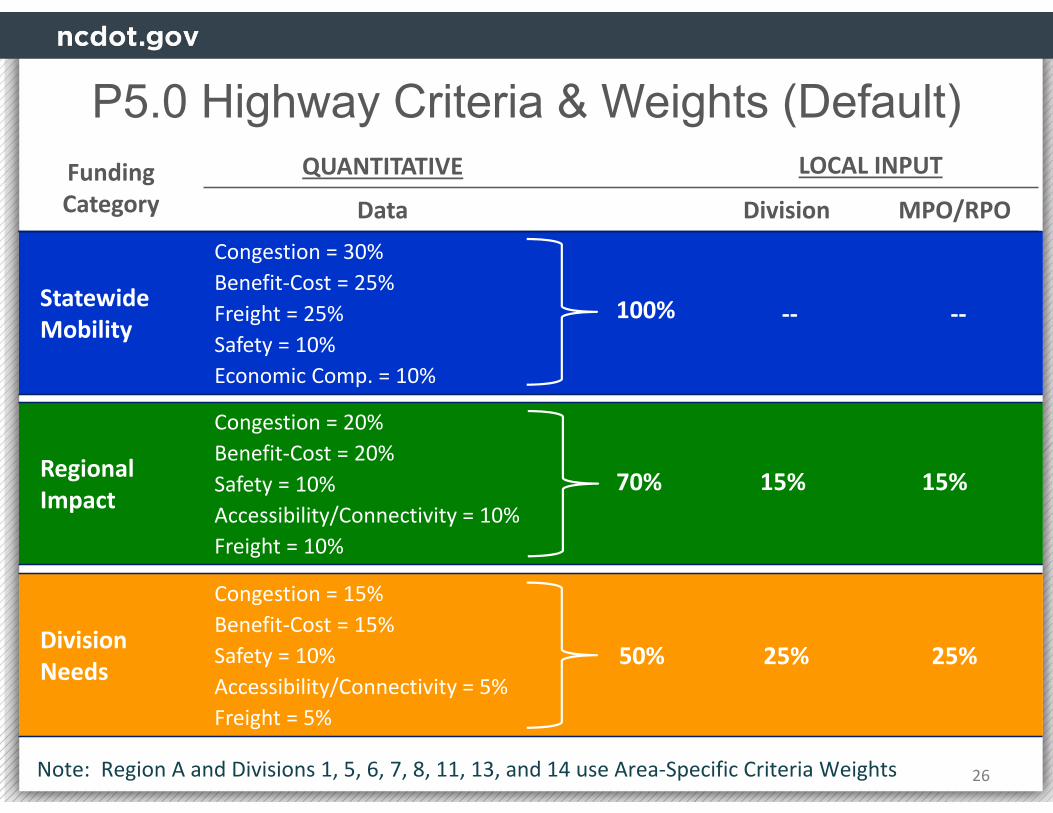
P5.0 Highway Criteria & Weights (Default)
Statewide Mobility
Congestion = 30%Benefit‐Cost = 25%Freight = 25%Safety = 10%Economic Comp. = 10%
‐‐ ‐‐
Funding Category
QUANTITATIVE LOCAL INPUT
Data Division MPO/RPO
Regional Impact
Congestion = 20%Benefit‐Cost = 20%Safety = 10%Accessibility/Connectivity = 10%Freight = 10%
Division Needs
Congestion = 15%Benefit‐Cost = 15%Safety = 10%Accessibility/Connectivity = 5%Freight = 5%
100%
70%
50% 25% 25%
15% 15%
Note: Region A and Divisions 1, 5, 6, 7, 8, 11, 13, and 14 use Area‐Specific Criteria Weights
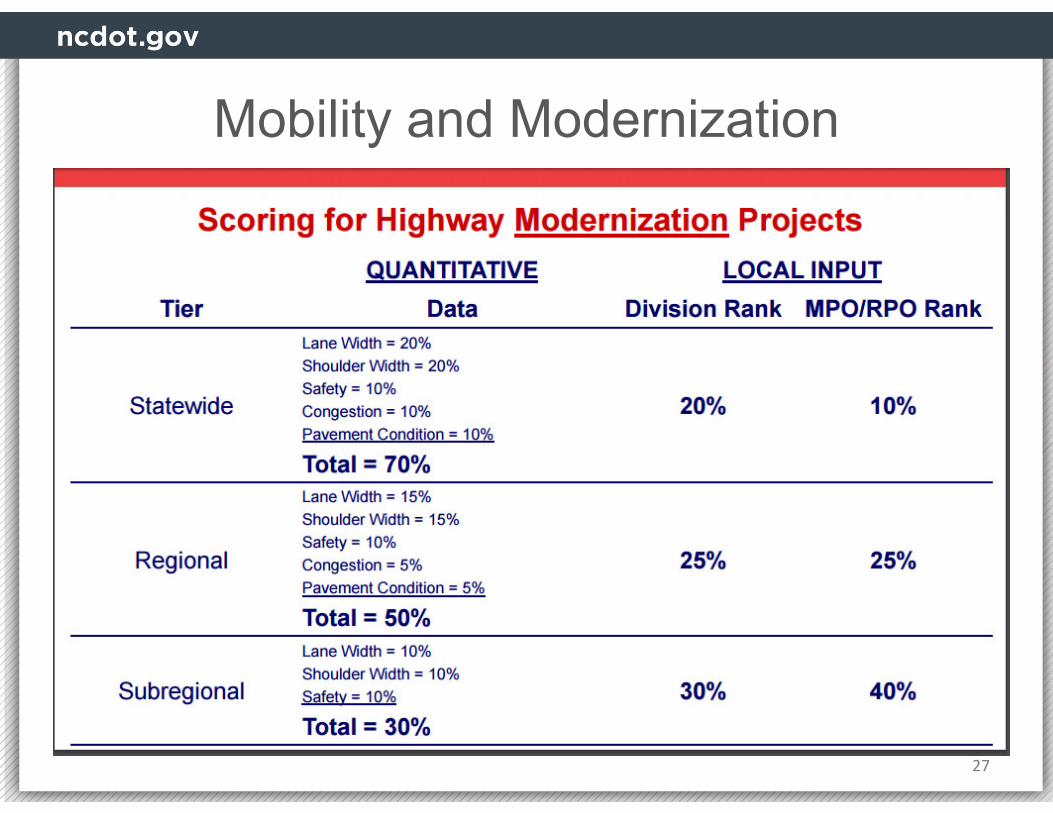
Mobility and Modernization
27

Mobility and Modernization
28
STATEWIDE:Congestion 10%Benefit/Cost 10%Safety 20%Lane Width 20%Shoulder Width 20%Pavement Cond. 20%
REGIONAL:Congestion 5%Benefit/Cost 5%Safety 20%Lane Width 15%Shoulder Width 15%Pavement Cond. 10%
DIVISION:Congestion 5%Benefit/Cost 5%Safety 15%Lane Width 10%Shoulder Width 10%Pavement Cond. 5%
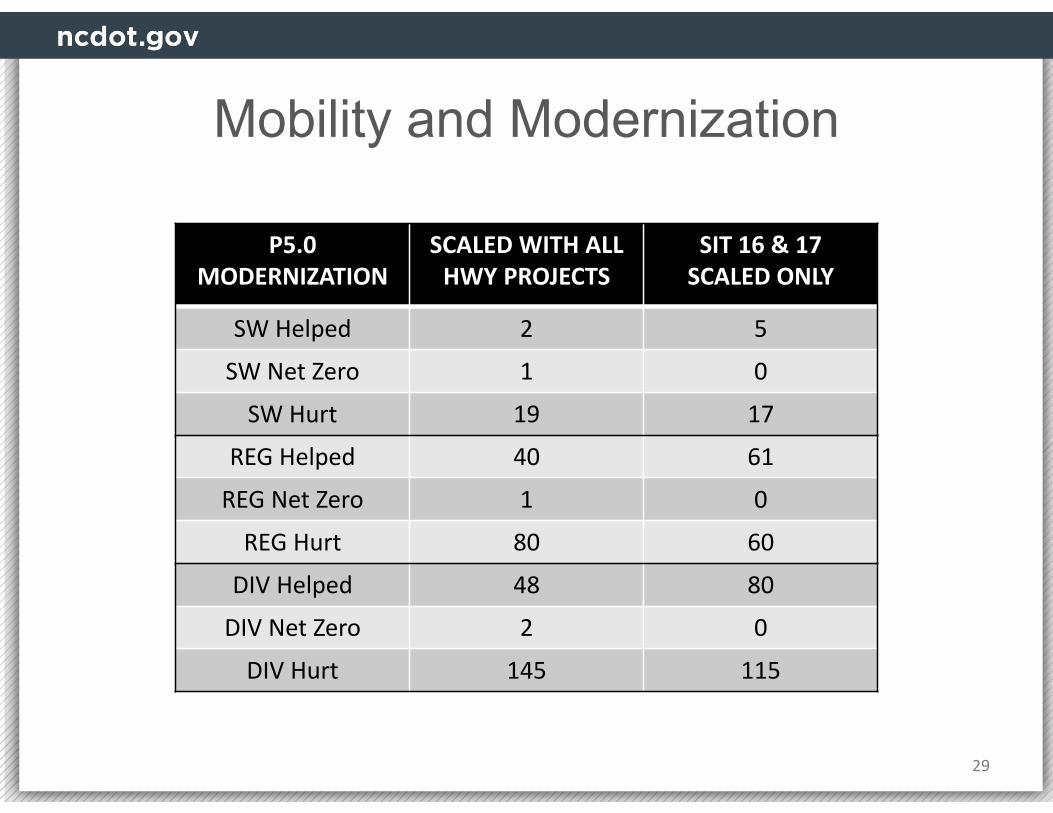
Mobility and Modernization
29
P5.0MODERNIZATION
SCALED WITH ALL HWY PROJECTS
SIT 16 & 17 SCALED ONLY
SW Helped 2 5
SW Net Zero 1 0
SW Hurt 19 17
REG Helped 40 61
REG Net Zero 1 0
REG Hurt 80 60
DIV Helped 48 80
DIV Net Zero 2 0
DIV Hurt 145 115
Resiliency Factor concept

Resiliency Factor
31
CDM Smith’s response to using NCSTM:
ResiliencyNetwork resiliency may be best defined as the ability of a network to maintain level-of-service even with the loss of portions of the network.
An individual network link’s contribution to network resiliency can be measured by analyzing the deterioration of network performance when that link is removed from the network. Those links which result in the most deterioration in network performance when removed contribute significantly to the network performance.
The goal would be to safeguard those links (i.e. roadway segments) or to develop additional projects serving the same travel shed to protect against the loss of performance due to the loss of those links.
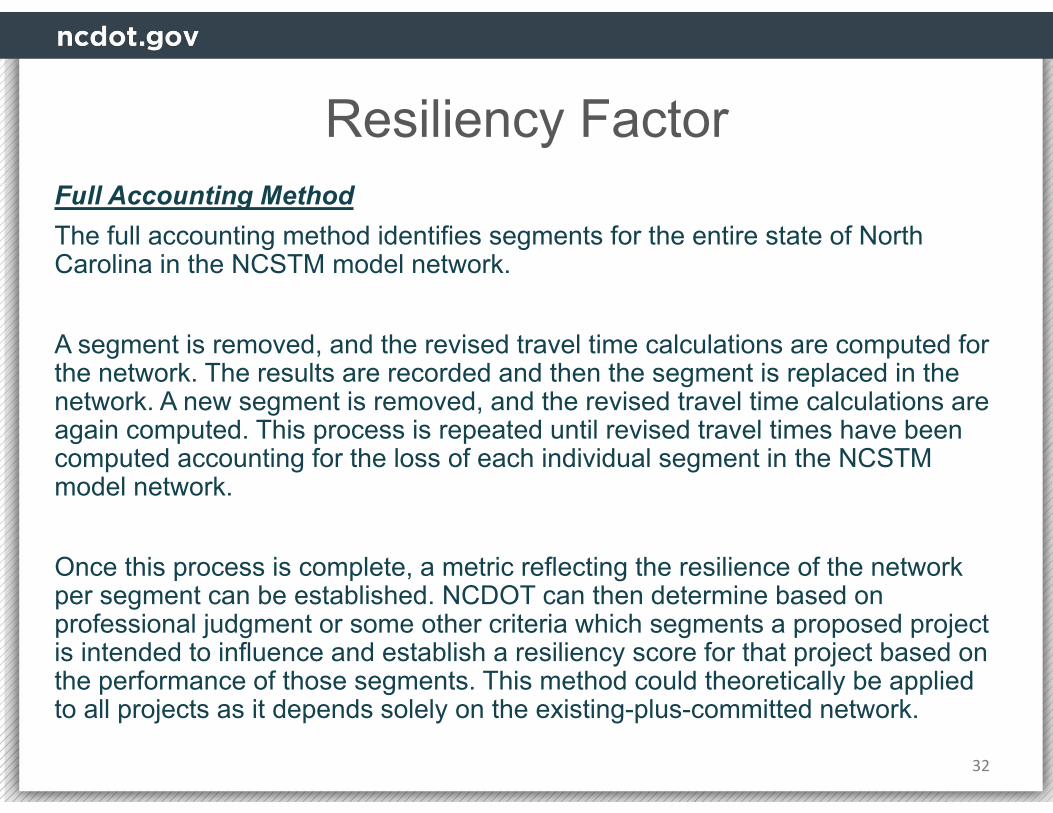
Resiliency Factor
32
Full Accounting MethodThe full accounting method identifies segments for the entire state of North Carolina in the NCSTM model network.
A segment is removed, and the revised travel time calculations are computed for the network. The results are recorded and then the segment is replaced in the network. A new segment is removed, and the revised travel time calculations are again computed. This process is repeated until revised travel times have been computed accounting for the loss of each individual segment in the NCSTM model network.
Once this process is complete, a metric reflecting the resilience of the network per segment can be established. NCDOT can then determine based on professional judgment or some other criteria which segments a proposed project is intended to influence and establish a resiliency score for that project based on the performance of those segments. This method could theoretically be applied to all projects as it depends solely on the existing-plus-committed network.
Resiliency Factor
33
Project Specific MethodThe project specific method is similar to the full accounting method. The key difference is that only those segments corresponding to proposed projects are analyzed. Project segments are deleted one at a time as per the full accounting method and revised travel times are calculated.
This can be applied directly to widening projects as those facilities are already on the existing network. For new construction projects, the revised travel time calculations would require that the project be coded into the network to capture the improvements of the project and then use the inverse of those travel times for network resilience.
This approach restricts the analysis of resilience only to those parts of the network on which projects are located but requires that projects be known ahead of time. This means that the resiliency score would be calculated at the same time that travel time benefits are being captured.
Resiliency Factor
34
Congested Times MethodThe congested times method requires that the model’s highway assignment be recomputed for each segment being analyzed. This can be a particularly time-consuming process in terms of model run times, but more accurately captures network resiliency. This is due to the inability of lower capacity roads to handle the additional volumes created by the loss of higher capacity roads. The resulting congestion results in proportionally higher travel times that truly capture the impacts experienced by the travelers.
The labor effort involved in this approach is not significantly greater than the free flow times approach but will require a longer schedule as each assignment run can be measured in hours.
Resiliency Factor
35
Free Flow Times MethodThe free flow time method does not recompute congested travel times for each segment. Instead, only the free flow travel times are used. In this case, the result is a resiliency metric based more on circuity rather than on congestion.
This method requires additional consideration in how to properly scale the resiliency metric to compensate for the fact that the true impacts to travel times are not be captured. This scaling would be intended to reflect the number of travelers impacted rather than the intensity of the impact.
This approach requires a similar level of effort to the congested times method but can be accomplished on a shorter schedule as the highway assignment portion of the NCSTM does not have to be executed to assess network resiliency.

Resiliency Factor
36
CDM Smith recommends to use a combination of the Full Accounting Method and the Free Flow Times Method. This approach will provide the greatest level of flexibility in terms of implementation and application by NCDOT. CDM Smith has successfully employed this approach on behalf of the Florida Department of Transportation for a similar purpose.
Regardless of the method used by NCDOT, the following activities would be required to complete the analysis:1. Identify segments for analysis and code segment IDs into the model.2. Prepare model scripts to automate the process of iteratively removing and
inserting segments from the network and computing revised travel times.3. Development of a scaling method to convert calculated travel times to a
resiliency score.4. Compile and document the resiliency score for all segments.
Resiliency Factor
37
Discussion?
If calculated, where to implement into criteria scoring?
Reliability Travel Time Measure
December 18, 2018
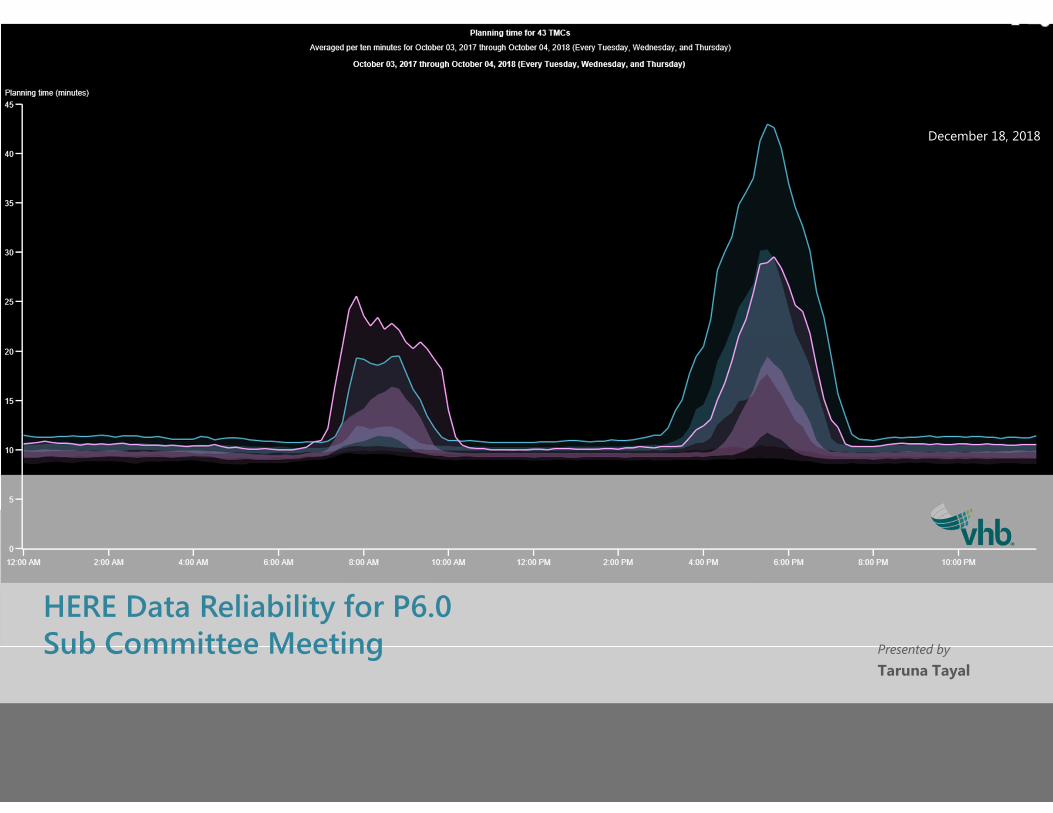
HERE Data Reliability for P6.0Sub Committee Meeting Presented by
Taruna Tayal
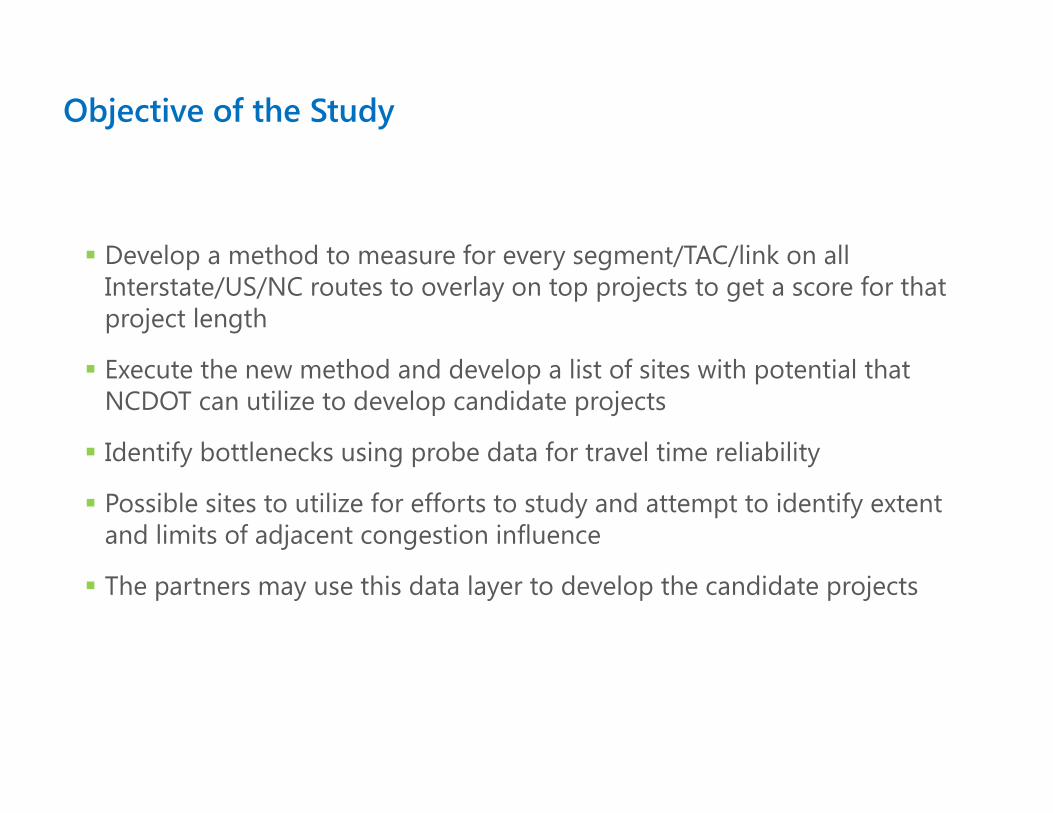
Objective of the Study
Develop a method to measure for every segment/TAC/link on all Interstate/US/NC routes to overlay on top projects to get a score for that project length
Execute the new method and develop a list of sites with potential that NCDOT can utilize to develop candidate projects
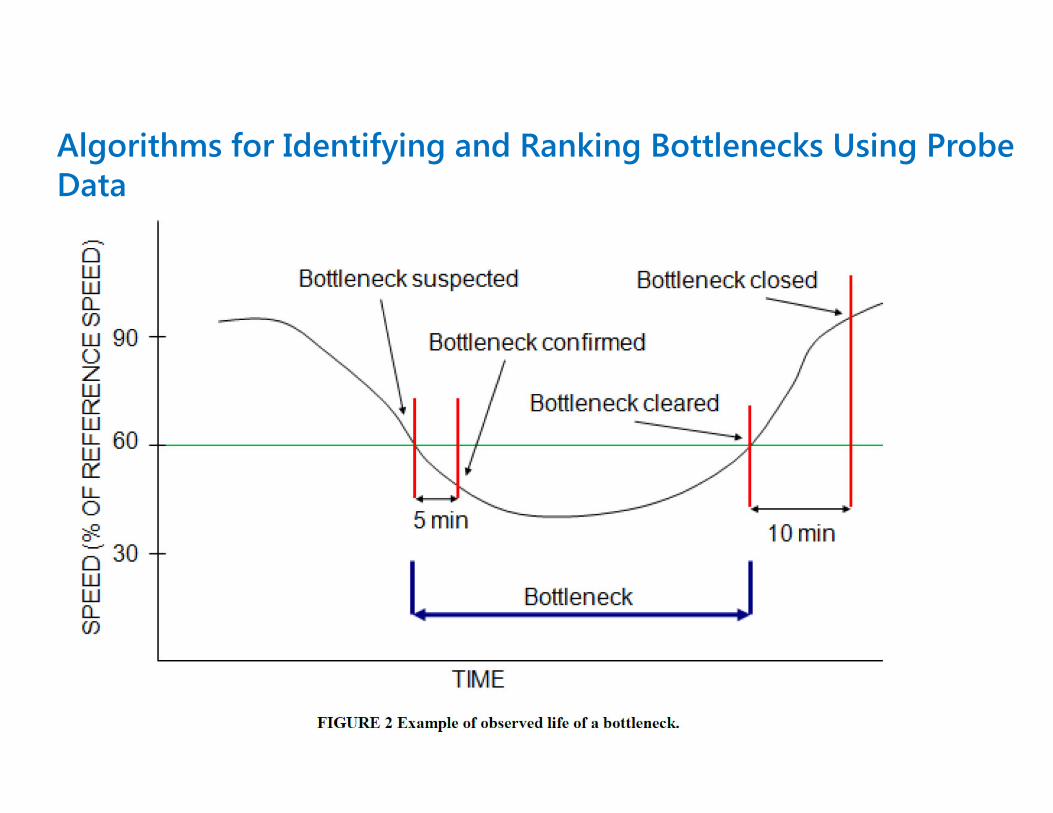
Identify bottlenecks using probe data for travel time reliability
Possible sites to utilize for efforts to study and attempt to identify extent and limits of adjacent congestion influence
The partners may use this data layer to develop the candidate projects

Rural SPOT Mobility - Analysis based on TTI & Daily V/C
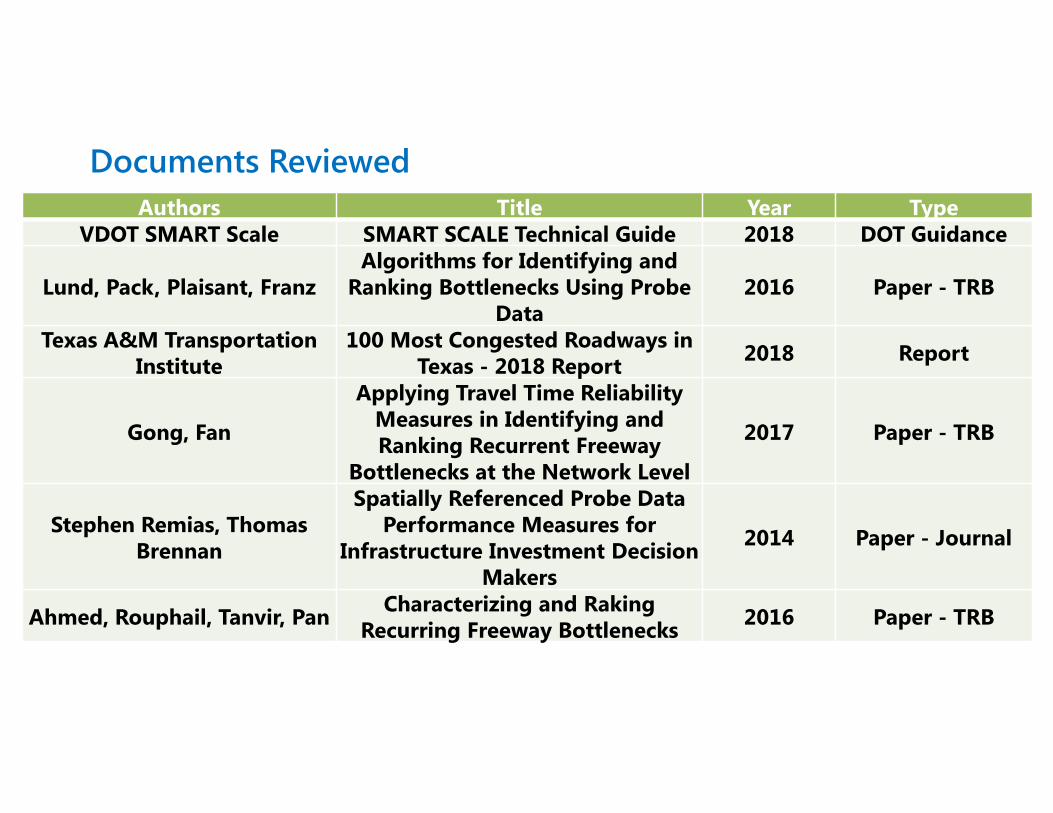
Documents ReviewedAuthors Title Year Type
VDOT SMART Scale SMART SCALE Technical Guide 2018 DOT Guidance
Lund, Pack, Plaisant, FranzAlgorithms for Identifying and
Ranking Bottlenecks Using Probe Data
2016 Paper - TRB
Texas A&M Transportation Institute
100 Most Congested Roadways in Texas - 2018 Report 2018 Report
Gong, Fan
Applying Travel Time Reliability Measures in Identifying and Ranking Recurrent Freeway
Bottlenecks at the Network Level
2017 Paper - TRB
Stephen Remias, Thomas Brennan
Spatially Referenced Probe Data Performance Measures for
Infrastructure Investment Decision Makers
2014 Paper - Journal
Ahmed, Rouphail, Tanvir, Pan Characterizing and Raking Recurring Freeway Bottlenecks 2016 Paper - TRB
Summary of Findings
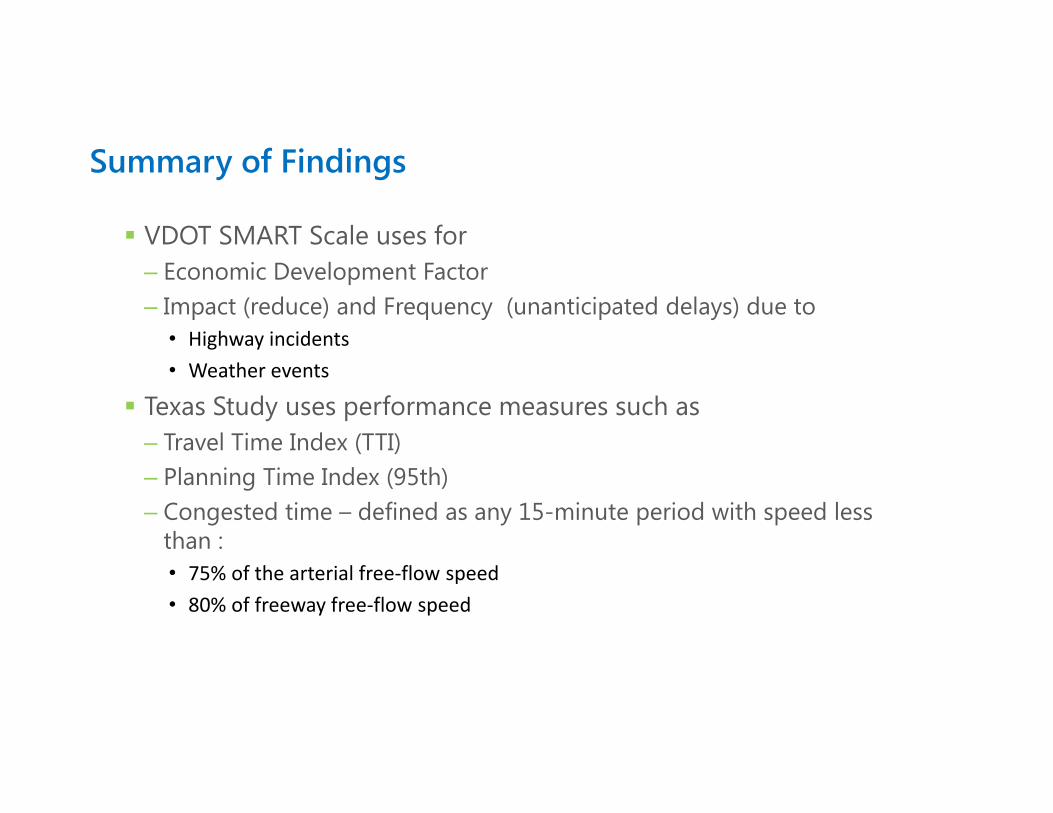
VDOT SMART Scale uses for– Economic Development Factor– Impact (reduce) and Frequency (unanticipated delays) due to
• Highway incidents• Weather events
Texas Study uses performance measures such as – Travel Time Index (TTI)– Planning Time Index (95th)– Congested time – defined as any 15-minute period with speed less
than :• 75% of the arterial free‐flow speed • 80% of freeway free‐flow speed

NC Studies
Using INRIX data in Mecklenburg County bottlenecks ranked by:– Frequency of Congestion (FOC) - percentage of time when travel speed
drops below a reference speed across multiple days– Planning Time Index (PTI) - >3 for Freeways– Findings - FOC and PTI are relevant for travel time reliability Characterizing and Ranking Recurring Freeway Bottlenecks
– I-40 in NC using September and October 2015 INRIX data– 15-minute interval– FOC – 40% frequency less than 75% of FF Speed– PTI – 3 and over– Ten recurring bottleneck regions were identified impacting 422
centerline miles of the facility.
Data Sources for Travel Time Reliability
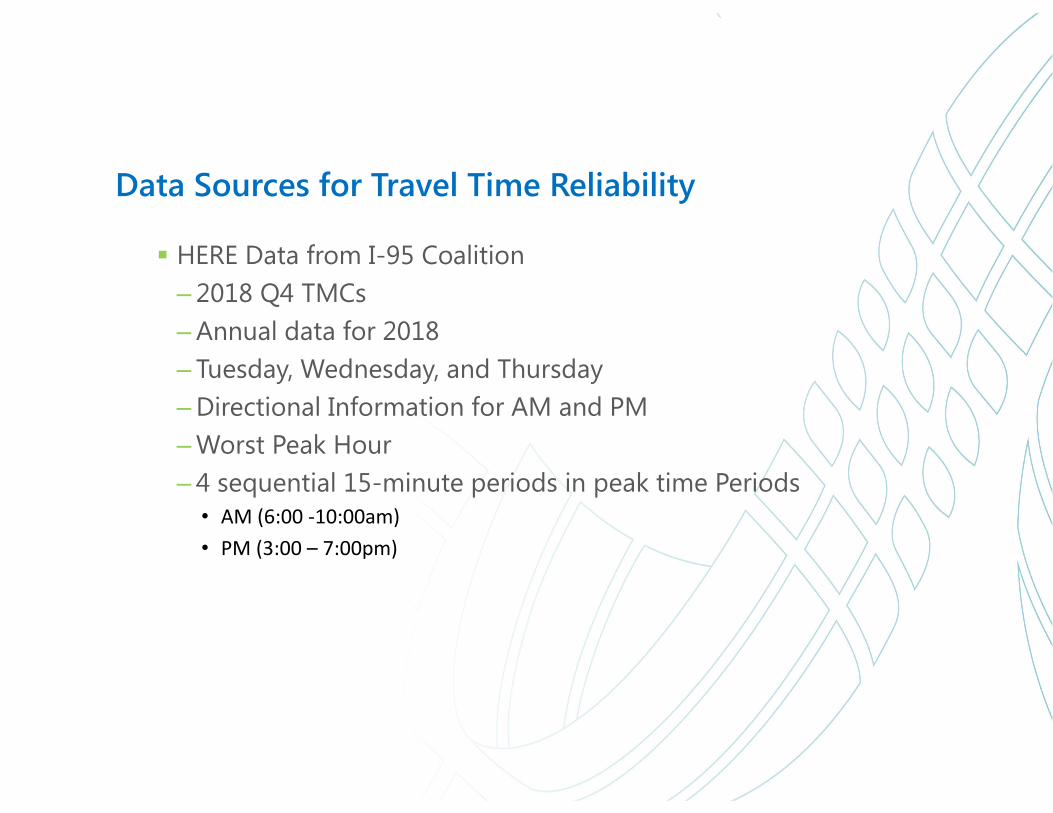
HERE Data from I-95 Coalition– 2018 Q4 TMCs– Annual data for 2018– Tuesday, Wednesday, and Thursday – Directional Information for AM and PM– Worst Peak Hour– 4 sequential 15-minute periods in peak time Periods
• AM (6:00 ‐10:00am) • PM (3:00 – 7:00pm)
Parameter-Based Screening
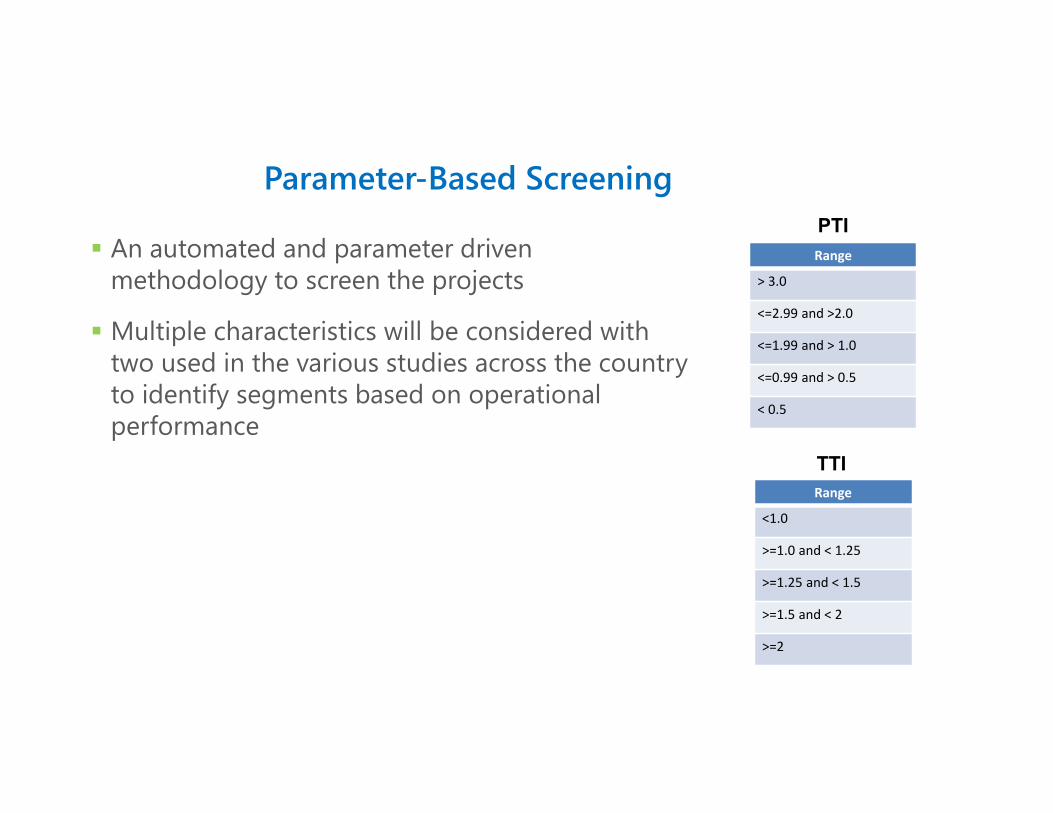
An automated and parameter driven methodology to screen the projects
Multiple characteristics will be considered with two used in the various studies across the country to identify segments based on operational performance
Range
> 3.0
<=2.99 and >2.0
<=1.99 and > 1.0
<=0.99 and > 0.5
< 0.5
PTI
Range
<1.0
>=1.0 and < 1.25
>=1.25 and < 1.5
>=1.5 and < 2
>=2
TTI
Algorithms for Identifying and Ranking Bottlenecks Using Probe Data
Taruna Tayal | [email protected] | 919.741.5525
ww
w.v
hb.c
om
Offices located throughout the east coast
Reliability Travel Time Measure
49
Discussion?
If calculated, where to implement into criteria scoring?
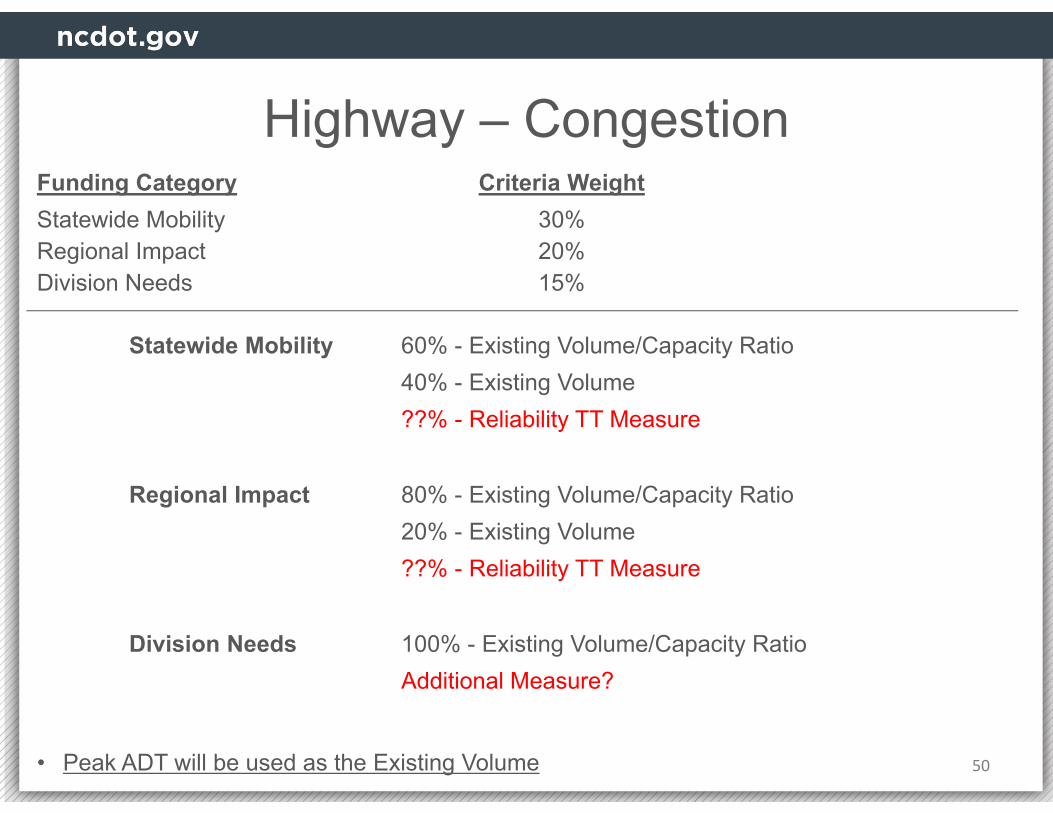
Highway – Congestion
50• Peak ADT will be used as the Existing Volume
Funding Category Criteria WeightStatewide Mobility 30%Regional Impact 20%Division Needs 15%
Statewide Mobility 60% - Existing Volume/Capacity Ratio40% - Existing Volume??% - Reliability TT Measure
Regional Impact 80% - Existing Volume/Capacity Ratio20% - Existing Volume??% - Reliability TT Measure
Division Needs 100% - Existing Volume/Capacity RatioAdditional Measure?

Next Steps
Next Steps
57
Schedule next meeting(s)
Will share notes/recordings from meetings on Workgroup website
Homework: ??


![DRPT Transportation Subcommittee 1-25-12[1].pptsfc.virginia.gov/pdf/transportation/2012/012512_No1_Drake.pdfTransportation Subcommittee Transportation Subcommittee DRPT Presentation](https://static.fdocuments.net/doc/165x107/5ab89e3d7f8b9ac1058cdecf/drpt-transportation-subcommittee-1-25-121-subcommittee-transportation-subcommittee.jpg)