P2.2 Assessment of TAMDAR System Performance on Various ...
13
CORRESPONDING AUTHOR ADDRESS: DANIEL MULALLY, AIRDAT, 30746 BRYANT DR., EVERGREEN, CO 80439 720-836-1331, E-MAIL: DMULALLY@AIRDAT.COM P2.2 Assessment of TAMDAR System Performance on Various Aircraft * Daniel J. Mulally, Cyrena-Marie Druse and Paul Marinello AirDat, LLC, 30746 Bryant Dr., Suite 410, Evergreen, CO 1 Introduction The TAMDAR (Tropospheric Airborne Meteorological Data Reporting) Sensor is an airborne atmospheric instrument developed under contract by AirDat for NASA. It is aircraft mounted and measures or calculates: winds, temperature, humidity, turbulence, pressure altitude, airspeed and icing. All measurements are corrected in the TAMDAR Sensor software to reflect ambient conditions. A built-in GPS along with an external heading input allows for the winds calculation and time and position stamping of the atmospheric observations. The standard TAMDAR system consists of the TAMDAR Sensor and an Iridium Satellite link which provides for two-way communications. A system of TAMDAR Sensors and data links on a sufficient number of aircraft would provide high temporal and spatial resolution data in the lower troposphere. The inclusion of a relative humidity (RH) measurement on an aircraft is a new development and along with the other measurements promises to provide significant improvements to forecasting. There are two RH sensors for redundancy and they are field replaceable without requiring removal of the Sensor. References in Section 6 describe previous tests of the Sensor and provide a more detailed description of the Sensor itself. It was determined early on that an incentive for carriers to allow TAMDAR to be installed is required. In the case of Mesaba, the TAMDAR system also provides automated OOOI (Out of gate, Off wheels, On wheels, In to gate) times which are transmitted via the satellite link. The data is downlinked in near real-time to the AirDat ground center where it is put into a database and finally formatted and sent to the customer. Other incentives include satellite voice and text messaging capabilities and flight following capabilities with AirDat’s airmap. This paper describes installation and shows results of the TAMDAR performance on various airplane types. 2 Installation Considerations In addition to the TAMDAR Sensor, all installations discussed except the Twin Otter and the Cessna 206 included an Iridium Satcom Transceiver with a dual Satcom/GPS antenna to provide for both the TAMDAR GPS and Iridium transceiver antenna requirements. The Sensor is mounted through a hole in the aircraft so that the probe is in the air stream. Attached to the probe but inside the aircraft (either pressurized or non-pressurized), is the SPU (signal processing unit) box which performs all the data calculations and message formatting. Photos of typical installations are in Figure 8 and Figure 13. On any particular installation, a Sensor calibration test flight needs to be done in order for the Sensor to report accurate airspeed and pressure altitude. Probe location and aircraft effects are compensated for in the TAMDAR firmware calibration constants based on the results of the test flight. This need only be done once on a particular installation; for example, calibration was done on one SAAB 340 and those same constants were used on the rest of the SAAB fleet. The installations have certain things in common but there are some unique details on the various platforms. In all cases the Sensor needs to be mounted with the probe in clean airflow. Flow separation and prop wash is to be avoided. The probe in all cases except two is mounted towards the front of the nose. The exceptions are: the NASA Cessna 206 and the NOAA P3. The 206 single engine configuration does not allow for a nose mount due to the prop wash so it was mounted under the wing. There wasn’t an available instrument mounting hole on the P3 nose so TAMDAR was mounted on a pedestal aft of the cockpit. TAMDAR requires only one input from the aircraft system: heading is required for the winds aloft calculation. Table I shows some of the aircraft on which TAMDAR has been installed and some of the installation details.
Transcript of P2.2 Assessment of TAMDAR System Performance on Various ...
CORRESPONDING AUTHOR ADDRESS: DANIEL MULALLY, AIRDAT, 30746 BRYANT DR., EVERGREEN, CO 80439 720-836-1331, E-MAIL: [email protected]
P2.2 Assessment of TAMDAR System Performance on Various Aircraft
* Daniel J. Mulally, Cyrena-Marie Druse and Paul Marinello
AirDat, LLC, 30746 Bryant Dr., Suite 410, Evergreen, CO
1 Introduction The TAMDAR (Tropospheric Airborne Meteorological Data Reporting) Sensor is an airborne atmospheric instrument developed under contract by AirDat for NASA. It is aircraft mounted and measures or calculates: winds, temperature, humidity, turbulence, pressure altitude, airspeed and icing. All measurements are corrected in the TAMDAR Sensor software to reflect ambient conditions. A built-in GPS along with an external heading input allows for the winds calculation and time and position stamping of the atmospheric observations. The standard TAMDAR system consists of the TAMDAR Sensor and an Iridium Satellite link which provides for two-way communications. A system of TAMDAR Sensors and data links on a sufficient number of aircraft would provide high temporal and spatial resolution data in the lower troposphere. The inclusion of a relative humidity (RH) measurement on an aircraft is a new development and along with the other measurements promises to provide significant improvements to forecasting. There are two RH sensors for redundancy and they are field replaceable without requiring removal of the Sensor. References in Section 6 describe previous tests of the Sensor and provide a more detailed description of the Sensor itself. It was determined early on that an incentive for carriers to allow TAMDAR to be installed is required. In the case of Mesaba, the TAMDAR system also provides automated OOOI (Out of gate, Off wheels, On wheels, In to gate) times which are transmitted via the satellite link. The data is downlinked in near real-time to the AirDat ground center where it is put into a database and finally formatted and sent to the customer. Other incentives include satellite voice and text messaging capabilities and flight following capabilities with AirDat’s airmap. This paper describes installation and shows results of the TAMDAR performance on various airplane types.
2 Installation Considerations In addition to the TAMDAR Sensor, all installations discussed except the Twin Otter and the Cessna 206 included an Iridium Satcom Transceiver with a dual Satcom/GPS antenna to provide for both the TAMDAR GPS and Iridium transceiver antenna requirements. The Sensor is mounted through a hole in the aircraft so that the probe is in the air stream. Attached to the probe but inside the aircraft (either pressurized or non-pressurized), is the SPU (signal processing unit) box which performs all the data calculations and message formatting. Photos of typical installations are in Figure 8 and Figure 13. On any particular installation, a Sensor calibration test flight needs to be done in order for the Sensor to report accurate airspeed and pressure altitude. Probe location and aircraft effects are compensated for in the TAMDAR firmware calibration constants based on the results of the test flight. This need only be done once on a particular installation; for example, calibration was done on one SAAB 340 and those same constants were used on the rest of the SAAB fleet. The installations have certain things in common but there are some unique details on the various platforms. In all cases the Sensor needs to be mounted with the probe in clean airflow. Flow separation and prop wash is to be avoided. The probe in all cases except two is mounted towards the front of the nose. The exceptions are: the NASA Cessna 206 and the NOAA P3. The 206 single engine configuration does not allow for a nose mount due to the prop wash so it was mounted under the wing. There wasn’t an available instrument mounting hole on the P3 nose so TAMDAR was mounted on a pedestal aft of the cockpit. TAMDAR requires only one input from the aircraft system: heading is required for the winds aloft calculation. Table I shows some of the aircraft on which TAMDAR has been installed and some of the installation details.
PAGE: 2 OF 13
Aircraft Sensor location/orientation from vertical
Heading source Operator Comments
SAAB 340 Nose/45 deg ARINC 473 FDAU bus Mesaba 63 planes equipped. Magnetic heading corrected in TAMDAR to true heading
Citation II Nose/60 deg APPLANIX inertial reference
UND True heading supplied to TAMDAR
Piper Seminole Nose/90 deg ARINC 407 HSI bus UND 5 planes equipped. Magnetic heading corrected in TAMDAR to true heading
Cessna 206 Under wing/90 deg Microstrain compass NASA Magnetic heading corrected in TAMDAR to true heading
P3 Side of fuselage on pedestal On board inertial system NOAA True heading supplied to TAMDAR Twin Otter Nose/90 deg Not Used CIRPAS Winds not reported
Table I Selected list of Aircraft with TAMDAR Installed
3 Aircraft Specific Studies Data obtained from three aircraft types are presented below. The Twin Otter, P3, and Cessna 206 are not presented due to space limitations and the similarity of the results. Some P3 and 206 results are included in section 4. The Cessna 206 atmospheric results were not compared with any reference although its airspeed and pressure altitude calibration were verified. Various comparisons were made depending on what reference data was available. Radiosonde comparisons, the Dev2 RUC Model (a Rapid Update Cycle model run by FSL for the Great Lakes Fleet Experiment), and on-board instrumentation comparisons are used when available.
3.1 UND Citation II The Citation II is a fully instrumented research aircraft which allows for direct comparison of TAMDAR measurements to high quality reference instrumentation. Higher sampling rates can also be logged. NCAR at the time of this writing is doing studies on TAMDAR’s turbulence algorithm with 10.67 Hz and 25 Hz data logged on board the Citation.
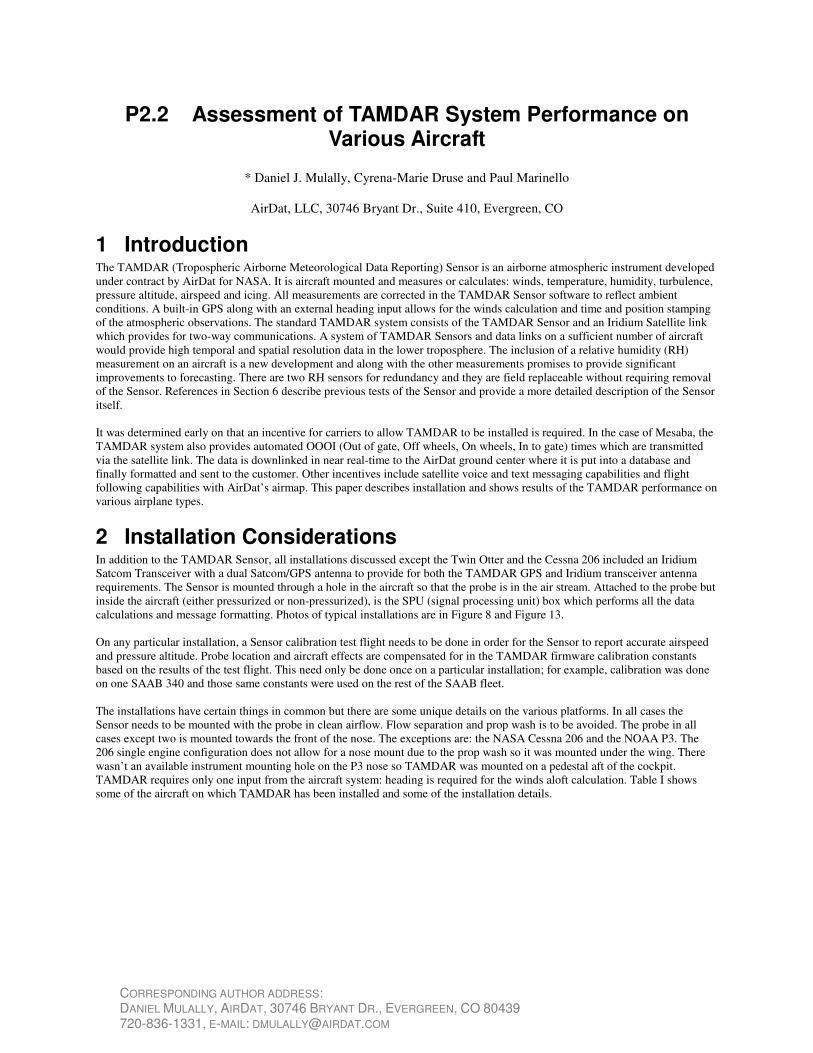
3.1.1 Citation Temperature & Pressure Altitude Figure 1 shows excellent agreement between TAMDAR’s output and the UND reference pressure altitude and temperature. A Rosemont total temperature probe corrected for Mach heating is used for the Citation Reference. The temperature profile in Figure 2 compares TAMDAR, the Citation and a Radiosonde launch. Again this shows a very good agreement. Figure 3 shows a short portion of a Citation flight where the plane is porpoising intentionally. The variation in altitude results in a corresponding temperature variation. Although the TAMDAR response isn’t quite as fast as the Rosemont, it still does a good job of following the reference.
Figure 1 UND Citation and TAMDAR Probe 27, 24 September 2004

PAGE: 3 OF 13
Figure 2 Temperature, Bismark Raobs 2300Z Figure 3 Temperature Response 08 October 2003
08 October 2003
3.1.2 Citation Relative Humidity The UND Citation is equipped with a tunable laser hygrometer (TDL) for humidity detection. Laser hygrometers measure the amount of water vapor directly via absorption of laser light. All relative humidities are with respect to liquid water even below freezing. The comparison in Figure 4 also shows temperature, the TDL RH and both TAMDAR RH readings. The two TAMDAR readings are virtually on top of one another.
Figure 4 UND Citation Relative Humidity Based on Liquid H20 and TAMDAR 17 October 2004
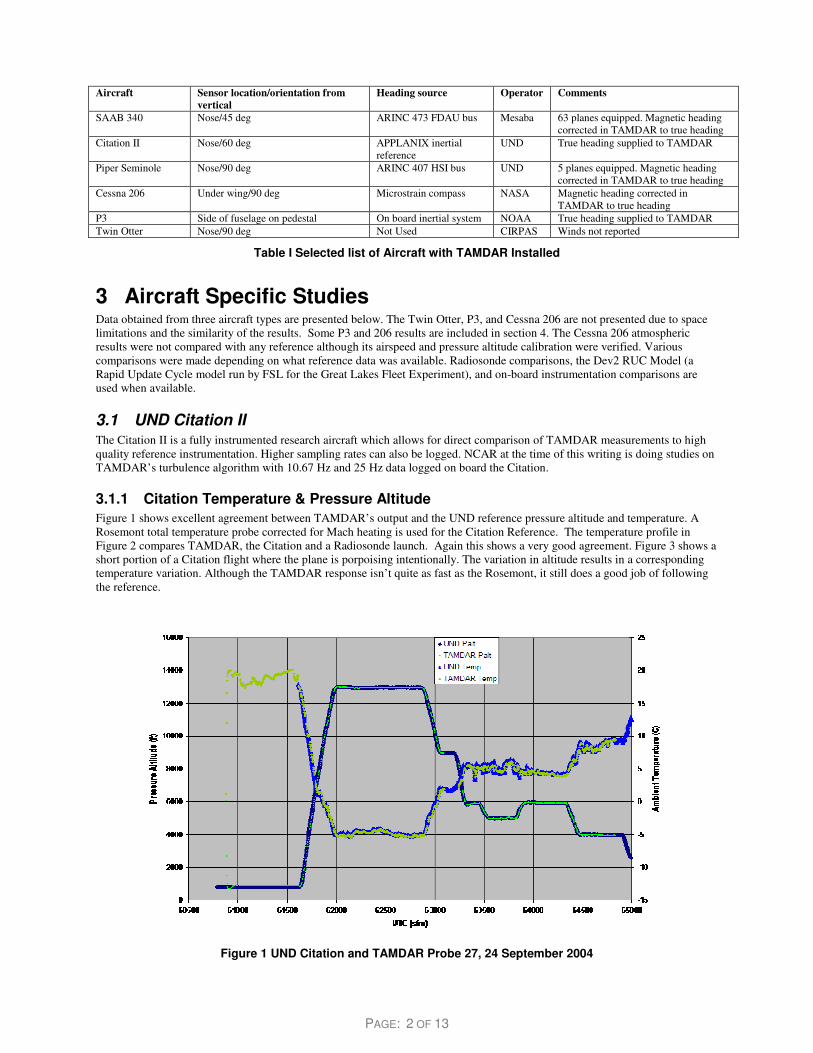
3.1.3 Citation Winds Wind comparisons on the Citation were very good for both speed and direction (see Figure 5). Results of TAMDAR and Citation comparisons demonstrate that with the high quality heading source used on the Citation, TAMDAR wind computations are very good.
PAGE: 4 OF 13
Figure 5 UND Citation & TAMDAR Wind Directions and Speeds, 16 October 2004
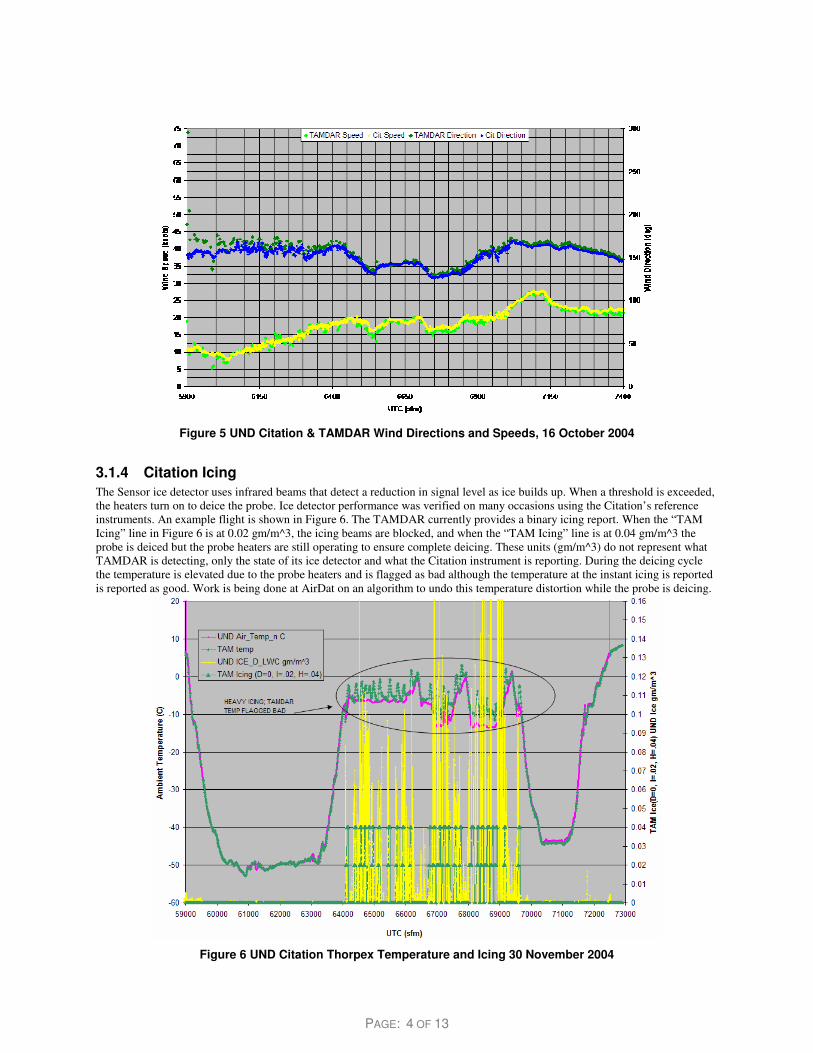
3.1.4 Citation Icing The Sensor ice detector uses infrared beams that detect a reduction in signal level as ice builds up. When a threshold is exceeded, the heaters turn on to deice the probe. Ice detector performance was verified on many occasions using the Citation’s reference instruments. An example flight is shown in Figure 6. The TAMDAR currently provides a binary icing report. When the “TAM Icing” line in Figure 6 is at 0.02 gm/m^3, the icing beams are blocked, and when the “TAM Icing” line is at 0.04 gm/m^3 the probe is deiced but the probe heaters are still operating to ensure complete deicing. These units (gm/m^3) do not represent what TAMDAR is detecting, only the state of its ice detector and what the Citation instrument is reporting. During the deicing cycle the temperature is elevated due to the probe heaters and is flagged as bad although the temperature at the instant icing is reported is reported as good. Work is being done at AirDat on an algorithm to undo this temperature distortion while the probe is deicing.
Figure 6 UND Citation Thorpex Temperature and Icing 30 November 2004
PAGE: 5 OF 13
3.2 Citation Turbulence Turbulence is measured in two different locations on the Citation, on the nose and under the right wing. The nose has an array of five different pressure sensors, four in a square with a fifth located in the center. This array allows for detection of pressure gradients along any plane. Both TAMDAR and the Citation use a TAS (true airspeed) based turbulence algorithm. TAMDAR uses a DFT (discrete Fourier transform) based MacCready Algorithm and the Citation uses a time-based algorithm. Comparisons are shown in Figure 7.
Figure 7 UND Citation Turbulence and TAMDAR Turbulence 24 September 2004
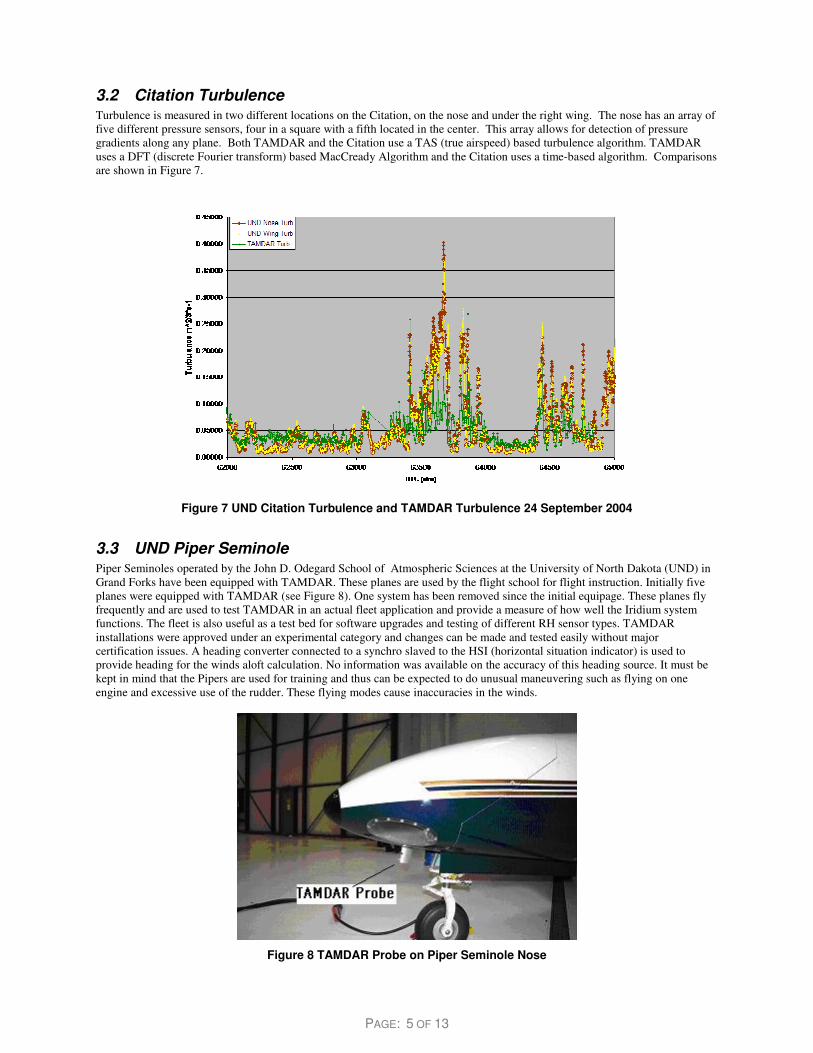
3.3 UND Piper Seminole Piper Seminoles operated by the John D. Odegard School of Atmospheric Sciences at the University of North Dakota (UND) in Grand Forks have been equipped with TAMDAR. These planes are used by the flight school for flight instruction. Initially five planes were equipped with TAMDAR (see Figure 8). One system has been removed since the initial equipage. These planes fly frequently and are used to test TAMDAR in an actual fleet application and provide a measure of how well the Iridium system functions. The fleet is also useful as a test bed for software upgrades and testing of different RH sensor types. TAMDAR installations were approved under an experimental category and changes can be made and tested easily without major certification issues. A heading converter connected to a synchro slaved to the HSI (horizontal situation indicator) is used to provide heading for the winds aloft calculation. No information was available on the accuracy of this heading source. It must be kept in mind that the Pipers are used for training and thus can be expected to do unusual maneuvering such as flying on one engine and excessive use of the rudder. These flying modes cause inaccuracies in the winds.
Figure 8 TAMDAR Probe on Piper Seminole Nose
PAGE: 6 OF 13
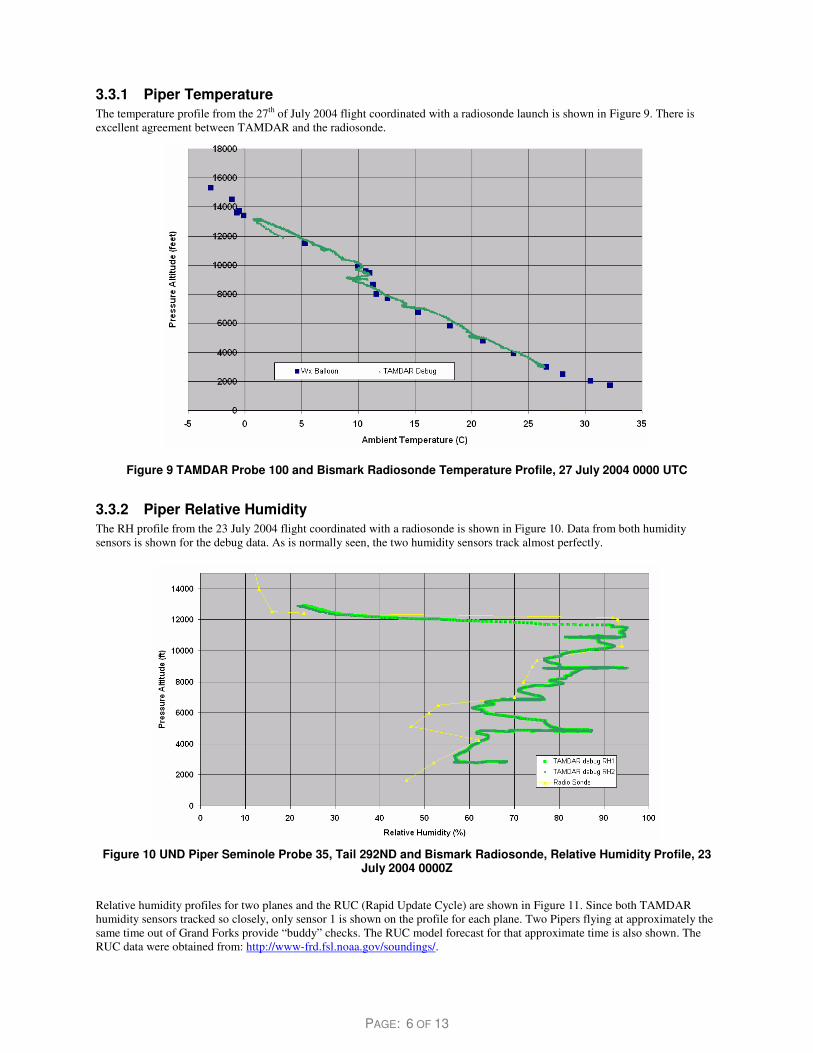
3.3.1 Piper Temperature The temperature profile from the 27th of July 2004 flight coordinated with a radiosonde launch is shown in Figure 9. There is excellent agreement between TAMDAR and the radiosonde.
Figure 9 TAMDAR Probe 100 and Bismark Radiosonde Temperature Profile, 27 July 2004 0000 UTC
3.3.2 Piper Relative Humidity The RH profile from the 23 July 2004 flight coordinated with a radiosonde is shown in Figure 10. Data from both humidity sensors is shown for the debug data. As is normally seen, the two humidity sensors track almost perfectly.
Figure 10 UND Piper Seminole Probe 35, Tail 292ND and Bismark Radiosonde, Relative Humidity Profile, 23
July 2004 0000Z
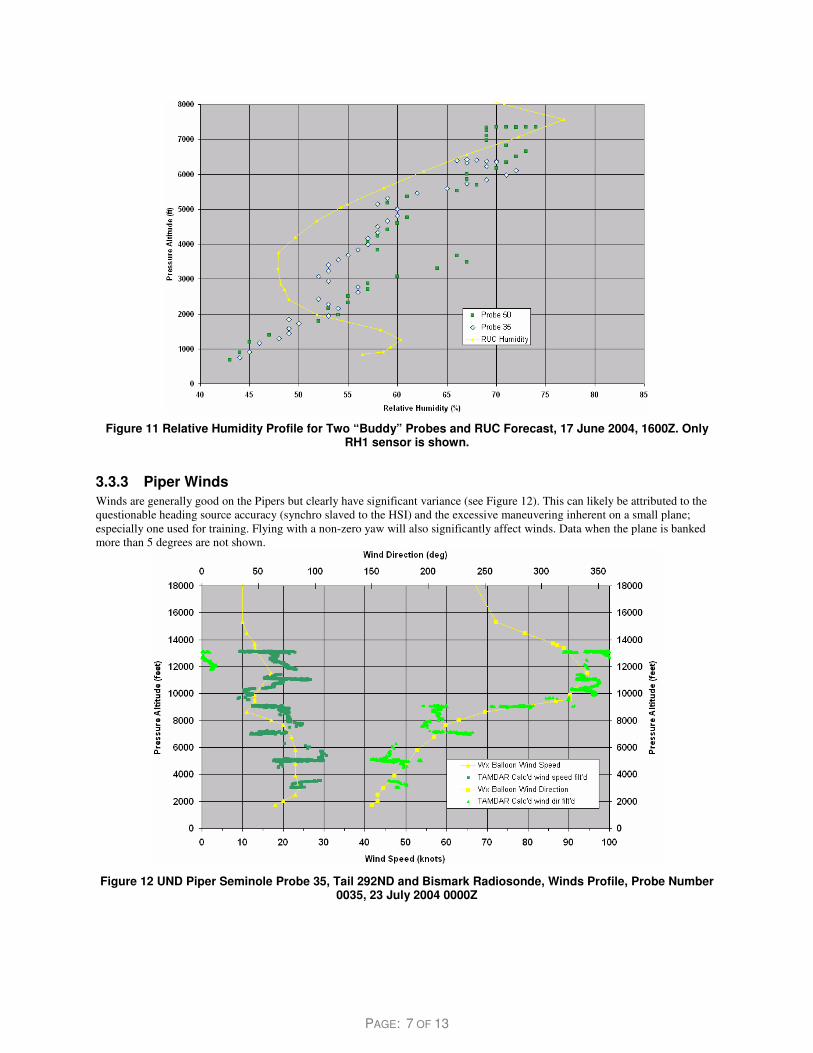
Relative humidity profiles for two planes and the RUC (Rapid Update Cycle) are shown in Figure 11. Since both TAMDAR humidity sensors tracked so closely, only sensor 1 is shown on the profile for each plane. Two Pipers flying at approximately the same time out of Grand Forks provide “buddy” checks. The RUC model forecast for that approximate time is also shown. The RUC data were obtained from: http://www-frd.fsl.noaa.gov/soundings/.
PAGE: 7 OF 13
Figure 11 Relative Humidity Profile for Two “Buddy” Probes and RUC Forecast, 17 June 2004, 1600Z. Only
RH1 sensor is shown.
3.3.3 Piper Winds Winds are generally good on the Pipers but clearly have significant variance (see Figure 12). This can likely be attributed to the questionable heading source accuracy (synchro slaved to the HSI) and the excessive maneuvering inherent on a small plane; especially one used for training. Flying with a non-zero yaw will also significantly affect winds. Data when the plane is banked more than 5 degrees are not shown.
Figure 12 UND Piper Seminole Probe 35, Tail 292ND and Bismark Radiosonde, Winds Profile, Probe Number 0035, 23 July 2004 0000Z
PAGE: 8 OF 13
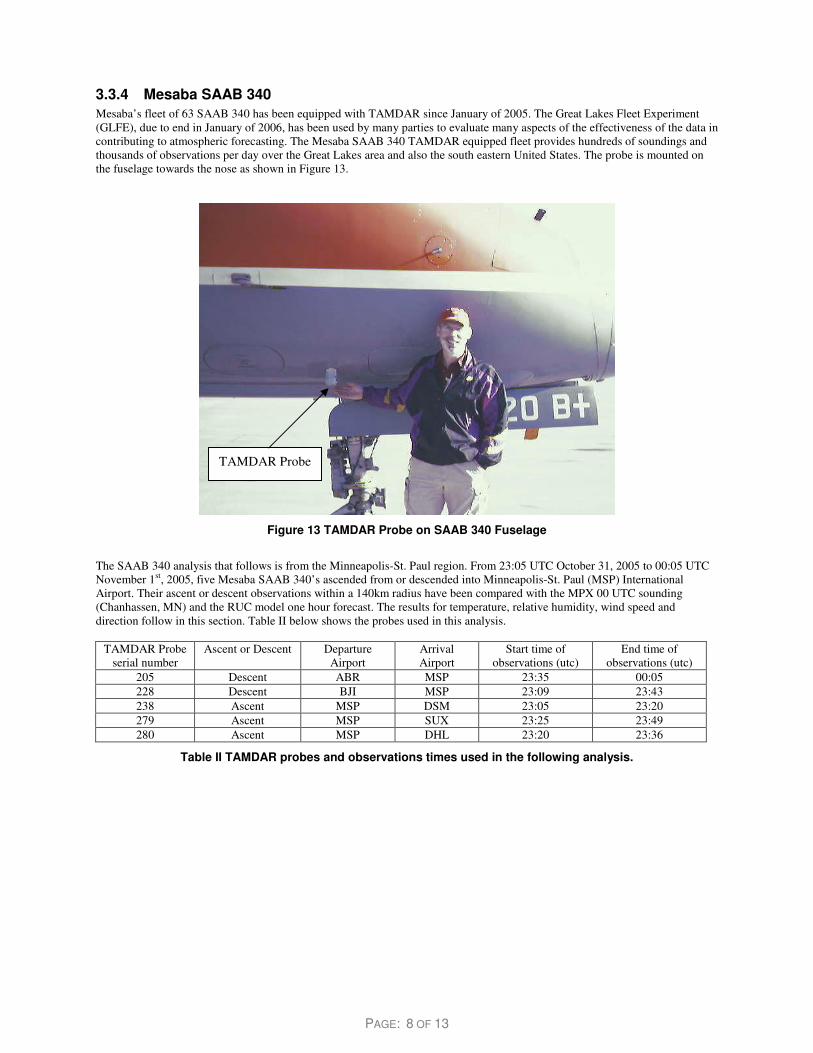
3.3.4 Mesaba SAAB 340 Mesaba’s fleet of 63 SAAB 340 has been equipped with TAMDAR since January of 2005. The Great Lakes Fleet Experiment (GLFE), due to end in January of 2006, has been used by many parties to evaluate many aspects of the effectiveness of the data in contributing to atmospheric forecasting. The Mesaba SAAB 340 TAMDAR equipped fleet provides hundreds of soundings and thousands of observations per day over the Great Lakes area and also the south eastern United States. The probe is mounted on the fuselage towards the nose as shown in Figure 13.
Figure 13 TAMDAR Probe on SAAB 340 Fuselage
The SAAB 340 analysis that follows is from the Minneapolis-St. Paul region. From 23:05 UTC October 31, 2005 to 00:05 UTC November 1st, 2005, five Mesaba SAAB 340’s ascended from or descended into Minneapolis-St. Paul (MSP) International Airport. Their ascent or descent observations within a 140km radius have been compared with the MPX 00 UTC sounding (Chanhassen, MN) and the RUC model one hour forecast. The results for temperature, relative humidity, wind speed and direction follow in this section. Table II below shows the probes used in this analysis.
TAMDAR Probe
serial number Ascent or Descent Departure
Airport Arrival Airport
Start time of observations (utc)
End time of observations (utc)
205 Descent ABR MSP 23:35 00:05 228 Descent BJI MSP 23:09 23:43 238 Ascent MSP DSM 23:05 23:20 279 Ascent MSP SUX 23:25 23:49 280 Ascent MSP DHL 23:20 23:36
Table II TAMDAR probes and observations times used in the following analysis.
TAMDAR Probe

PAGE: 9 OF 13
3.3.5 SAAB Temperature TAMDAR, RUC, and radiosonde temperatures with respect to altitude are shown in Figure 14, with substantial agreement. The radiosonde detects an inversion near 6000ft. This is a feature the model does not forecast. It can be seen that TAMDAR observations have confirmed the presence of this inversion.
Figure 14. MSP TAMDAR observations compared to the RUC one hour forecast and the MPX 0000Z sounding
3.3.6 SAAB Relative Humidity TAMDAR, RUC, and radiosonde relative humidities with respect to altitude are shown in Figure 15. Observations to note are how TAMDAR detects the moist layer just below 6000ft and the dry layer above 8000ft. The variance at the higher altitudes is acceptable considering the varying distances from the origin the aircraft are at these altitudes.
Figure 15 MSP TAMDAR observations compared to the RUC one hour forecast and the MPX 0000Z sounding
PAGE: 10 OF 13
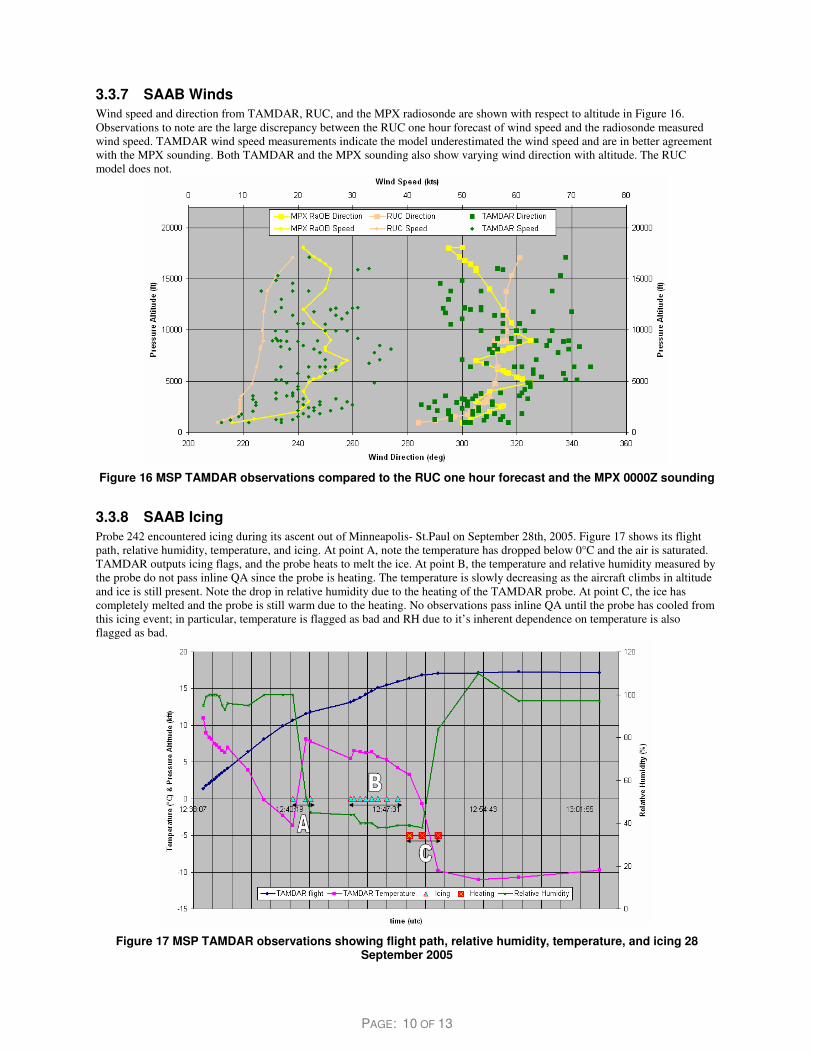
3.3.7 SAAB Winds Wind speed and direction from TAMDAR, RUC, and the MPX radiosonde are shown with respect to altitude in Figure 16. Observations to note are the large discrepancy between the RUC one hour forecast of wind speed and the radiosonde measured wind speed. TAMDAR wind speed measurements indicate the model underestimated the wind speed and are in better agreement with the MPX sounding. Both TAMDAR and the MPX sounding also show varying wind direction with altitude. The RUC model does not.
Figure 16 MSP TAMDAR observations compared to the RUC one hour forecast and the MPX 0000Z sounding
3.3.8 SAAB Icing Probe 242 encountered icing during its ascent out of Minneapolis- St.Paul on September 28th, 2005. Figure 17 shows its flight path, relative humidity, temperature, and icing. At point A, note the temperature has dropped below 0°C and the air is saturated. TAMDAR outputs icing flags, and the probe heats to melt the ice. At point B, the temperature and relative humidity measured by the probe do not pass inline QA since the probe is heating. The temperature is slowly decreasing as the aircraft climbs in altitude and ice is still present. Note the drop in relative humidity due to the heating of the TAMDAR probe. At point C, the ice has completely melted and the probe is still warm due to the heating. No observations pass inline QA until the probe has cooled from this icing event; in particular, temperature is flagged as bad and RH due to it’s inherent dependence on temperature is also flagged as bad.
Figure 17 MSP TAMDAR observations showing flight path, relative humidity, temperature, and icing 28
September 2005
PAGE: 11 OF 13
4 Results
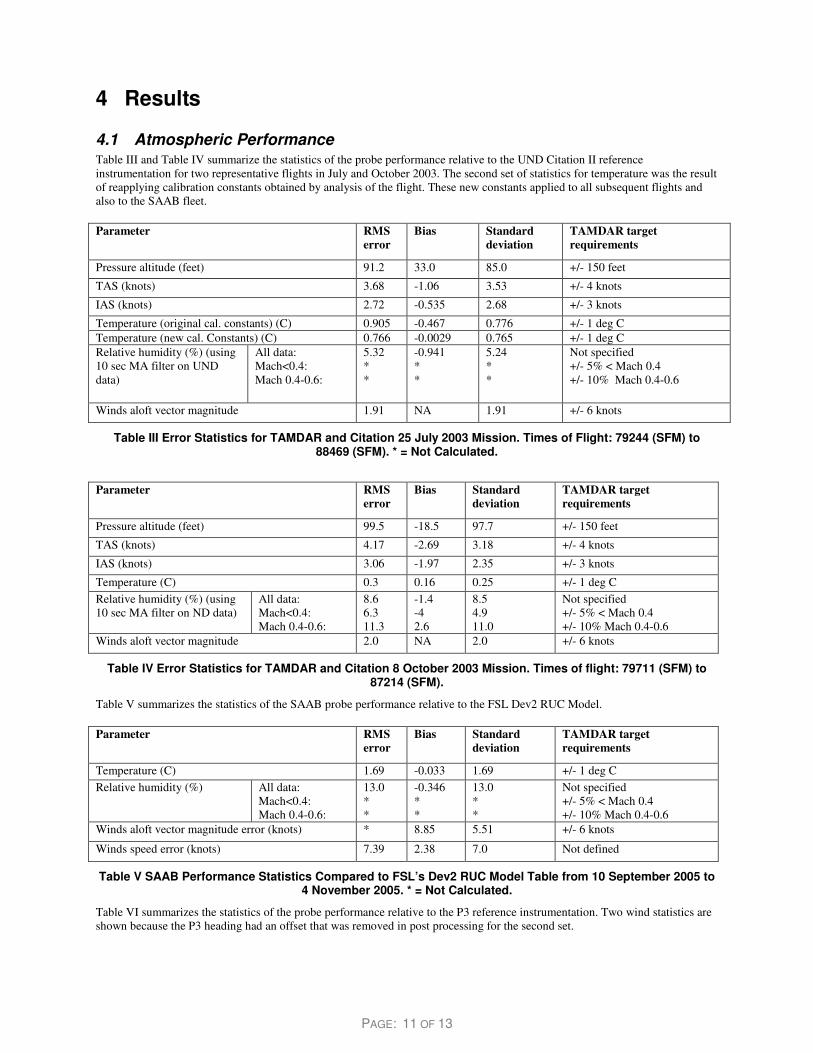
4.1 Atmospheric Performance Table III and Table IV summarize the statistics of the probe performance relative to the UND Citation II reference instrumentation for two representative flights in July and October 2003. The second set of statistics for temperature was the result of reapplying calibration constants obtained by analysis of the flight. These new constants applied to all subsequent flights and also to the SAAB fleet. Parameter RMS
error Bias Standard
deviation TAMDAR target requirements
Pressure altitude (feet) 91.2 33.0 85.0 +/- 150 feet
TAS (knots) 3.68 -1.06 3.53 +/- 4 knots
IAS (knots) 2.72 -0.535 2.68 +/- 3 knots
Temperature (original cal. constants) (C) 0.905 -0.467 0.776 +/- 1 deg C Temperature (new cal. Constants) (C) 0.766 -0.0029 0.765 +/- 1 deg C Relative humidity (%) (using 10 sec MA filter on UND data)
All data: Mach<0.4: Mach 0.4-0.6:
5.32 * *
-0.941 * *
5.24 * *
Not specified +/- 5% < Mach 0.4 +/- 10% Mach 0.4-0.6
Winds aloft vector magnitude 1.91 NA 1.91 +/- 6 knots
Table III Error Statistics for TAMDAR and Citation 25 July 2003 Mission. Times of Flight: 79244 (SFM) to 88469 (SFM). * = Not Calculated.
Parameter RMS
error Bias Standard
deviation TAMDAR target requirements
Pressure altitude (feet) 99.5 -18.5 97.7 +/- 150 feet
TAS (knots) 4.17 -2.69 3.18 +/- 4 knots
IAS (knots) 3.06 -1.97 2.35 +/- 3 knots
Temperature (C) 0.3 0.16 0.25 +/- 1 deg C Relative humidity (%) (using 10 sec MA filter on ND data)
All data: Mach<0.4: Mach 0.4-0.6:
8.6 6.3 11.3
-1.4 -4 2.6
8.5 4.9 11.0
Not specified +/- 5% < Mach 0.4 +/- 10% Mach 0.4-0.6
Winds aloft vector magnitude 2.0 NA 2.0 +/- 6 knots
Table IV Error Statistics for TAMDAR and Citation 8 October 2003 Mission. Times of flight: 79711 (SFM) to 87214 (SFM).
Table V summarizes the statistics of the SAAB probe performance relative to the FSL Dev2 RUC Model. Parameter RMS
error Bias Standard
deviation TAMDAR target requirements
Temperature (C) 1.69 -0.033 1.69 +/- 1 deg C Relative humidity (%) All data:
Mach<0.4: Mach 0.4-0.6:
13.0 * *
-0.346 * *
13.0 * *
Not specified +/- 5% < Mach 0.4 +/- 10% Mach 0.4-0.6
Winds aloft vector magnitude error (knots) * 8.85 5.51 +/- 6 knots
Winds speed error (knots) 7.39 2.38 7.0 Not defined
Table V SAAB Performance Statistics Compared to FSL’s Dev2 RUC Model Table from 10 September 2005 to 4 November 2005. * = Not Calculated.
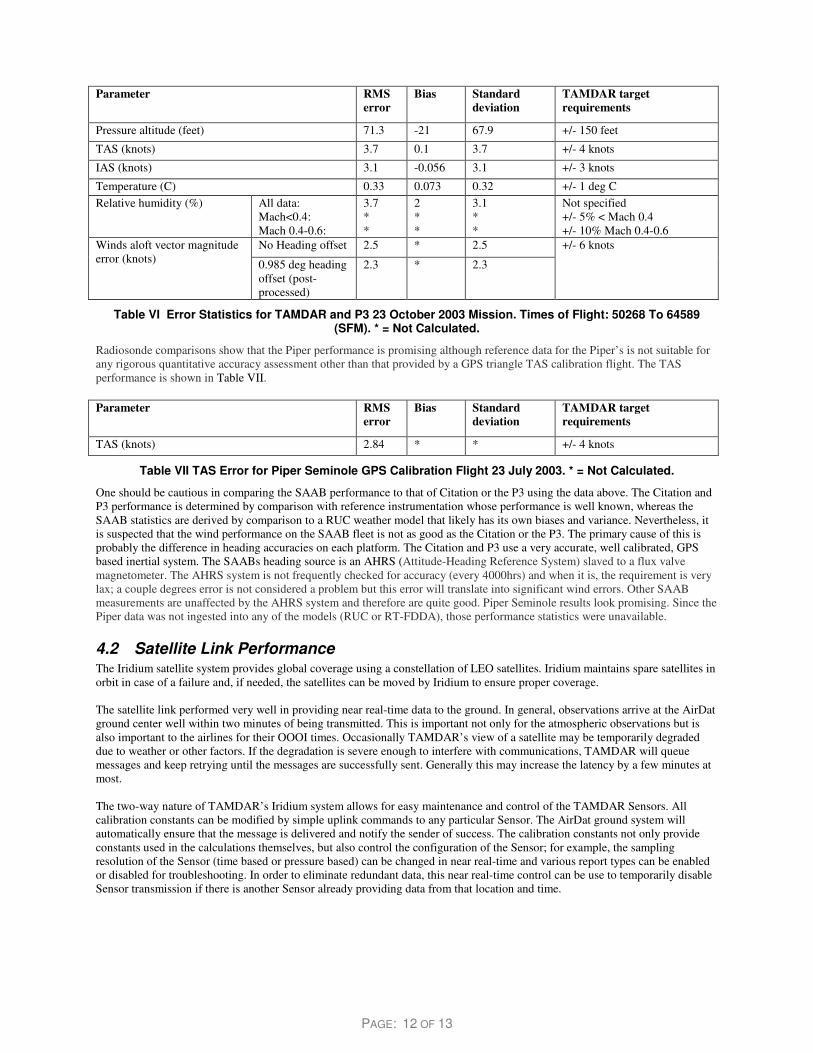
Table VI summarizes the statistics of the probe performance relative to the P3 reference instrumentation. Two wind statistics are shown because the P3 heading had an offset that was removed in post processing for the second set.
PAGE: 12 OF 13
Parameter RMS error
Bias Standard deviation
TAMDAR target requirements
Pressure altitude (feet) 71.3 -21 67.9 +/- 150 feet
TAS (knots) 3.7 0.1 3.7 +/- 4 knots
IAS (knots) 3.1 -0.056 3.1 +/- 3 knots
Temperature (C) 0.33 0.073 0.32 +/- 1 deg C Relative humidity (%) All data:
Mach<0.4: Mach 0.4-0.6:
3.7 * *
2 * *
3.1 * *
Not specified +/- 5% < Mach 0.4 +/- 10% Mach 0.4-0.6
No Heading offset 2.5 * 2.5 Winds aloft vector magnitude error (knots) 0.985 deg heading
offset (post-processed)
2.3 * 2.3
+/- 6 knots
Table VI Error Statistics for TAMDAR and P3 23 October 2003 Mission. Times of Flight: 50268 To 64589 (SFM). * = Not Calculated.
Radiosonde comparisons show that the Piper performance is promising although reference data for the Piper’s is not suitable for any rigorous quantitative accuracy assessment other than that provided by a GPS triangle TAS calibration flight. The TAS performance is shown in Table VII. Parameter RMS
error Bias Standard
deviation TAMDAR target requirements
TAS (knots) 2.84 * * +/- 4 knots
Table VII TAS Error for Piper Seminole GPS Calibration Flight 23 July 2003. * = Not Calculated.
One should be cautious in comparing the SAAB performance to that of Citation or the P3 using the data above. The Citation and P3 performance is determined by comparison with reference instrumentation whose performance is well known, whereas the SAAB statistics are derived by comparison to a RUC weather model that likely has its own biases and variance. Nevertheless, it is suspected that the wind performance on the SAAB fleet is not as good as the Citation or the P3. The primary cause of this is probably the difference in heading accuracies on each platform. The Citation and P3 use a very accurate, well calibrated, GPS based inertial system. The SAABs heading source is an AHRS (Attitude-Heading Reference System) slaved to a flux valve magnetometer. The AHRS system is not frequently checked for accuracy (every 4000hrs) and when it is, the requirement is very lax; a couple degrees error is not considered a problem but this error will translate into significant wind errors. Other SAAB measurements are unaffected by the AHRS system and therefore are quite good. Piper Seminole results look promising. Since the Piper data was not ingested into any of the models (RUC or RT-FDDA), those performance statistics were unavailable.
4.2 Satellite Link Performance The Iridium satellite system provides global coverage using a constellation of LEO satellites. Iridium maintains spare satellites in orbit in case of a failure and, if needed, the satellites can be moved by Iridium to ensure proper coverage. The satellite link performed very well in providing near real-time data to the ground. In general, observations arrive at the AirDat ground center well within two minutes of being transmitted. This is important not only for the atmospheric observations but is also important to the airlines for their OOOI times. Occasionally TAMDAR’s view of a satellite may be temporarily degraded due to weather or other factors. If the degradation is severe enough to interfere with communications, TAMDAR will queue messages and keep retrying until the messages are successfully sent. Generally this may increase the latency by a few minutes at most. The two-way nature of TAMDAR’s Iridium system allows for easy maintenance and control of the TAMDAR Sensors. All calibration constants can be modified by simple uplink commands to any particular Sensor. The AirDat ground system will automatically ensure that the message is delivered and notify the sender of success. The calibration constants not only provide constants used in the calculations themselves, but also control the configuration of the Sensor; for example, the sampling resolution of the Sensor (time based or pressure based) can be changed in near real-time and various report types can be enabled or disabled for troubleshooting. In order to eliminate redundant data, this near real-time control can be use to temporarily disable Sensor transmission if there is another Sensor already providing data from that location and time.
PAGE: 13 OF 13
5 Conclusions The intent of this paper is to describe the effectiveness of TAMDAR on several different aircraft types. The most desirable mounting location on twin engine types is on the nose, preferably between vertical and 45 degrees to the vertical. Proper operation was verified with this mounting configuration on the following four planes: Twin Otter, Piper, SAAB and Citation. One type, the Cessna 206, is a single engine plane so mounting on the fuselage will not work because of the prop wash. This installation was mounted under the wing. Initial calibration results showed this location is feasible. The P3 mounting was also unique in that the Sensor probe was mounted on a pedestal due to limitations in mounting location and the requirement that the probe be in an area of clean air flow (no separation). This configuration also was satisfactory. Results from all installations indicate that with proper forethought, TAMDAR can be mounted successfully on most aircraft. The Sensor accuracies met all the design goals. Data from the GLFE has already shown improvement in atmospheric forecasting using both the RUC and NCAR’s RT-FDDA (Real-time Four Dimensional Data Analysis) model. The effect of TAMDAR data from the SAAB 340 fleet on improving atmospheric model output accuracy has been demonstrated and covered in other papers. In addition the skew-T plots provided by AirDat’s airmap and Bill Moninger’s FSL airmap have proven useful for forecasters. Icing and turbulence studies done by NCAR are being evaluated at the time of this writing.
6 References Taumi. S. Daniels, John J. Murray, Mark V. Anderson,Daniel J. Mulally, Kristopher R. Jensen, Cedric A. Grainger , David
J. Delene, “TAMDAR Sensor Validation in 2003 AIRS II,” 43rd Aerospace Sciences Meeting and Exhibit Conference. AIAA-2005-0259. 10-14 January 2005, Reno, Nevada.
Daniels, T. S., Tsoucalas, G., Anderson, M., Mulally, D., Moninger, W., Mamrosh, R., "Tropospheric Airborne Meteorological Data Reporting (TAMDAR) Sensor Development," 11th Conf. on Aviation, Range, and Aerospace Meteorology, Hyannis, MA, American Meteorological Society, November 2004.
Taumi S. Daniels, NASA, Hampton, VA; and J. J. Murray, C. A. Grainger, D. K. Zhou, M. A. Avery, M. F. Cagle, G. Tsoucalas, P. Schaffner, and R. T. Neece, “Validation of Tropospheric Airborne Meteorological Data Reporting (TAMDAR) Temperature, Relative Humidity, and Wind Sensors During the 2003 Atlantic THORPEX Regional Campaign and the Alliance Icing Research Study (AIRS II),” 11th Conference on Aviation, Range, and Aerospace
John J. Murray, Louis A Nguyen, Taumi S. Dainies, Patrick Minnis, Phillip R. Schaffner, Melinda F. Cagle, Michele L. Nordeen, Cory A. Wolff, Mark V. Anderson, Daniel J. Mulally, Kristopher R. Jensen, Cedric A. Granger, David J. Delene, “Tropospheric Airborne Meteorological Data and Reporting (TAMDAR) Icing Sensor Performance during the 2003/2004 Alliance Icing Research Study (AIRS II),” 43rd AIAA Aerospace Science Meeting & Exhibit Conference, 10-13 January 2005, Reno, NV