P10.11 AUTOMATIC DETECTION AND REMOVAL OF GROUND CLUTTER ...cimms.ou.edu/~torres/Documents/Radar...
10
P10.11 AUTOMATIC DETECTION AND REMOVAL OF GROUND CLUTTER CONTAMINATION ON WEATHER RADARS David A. Warde* and Sebastián M. Torres Cooperative Institute for Mesoscale Meteorological Studies, The University of Oklahoma, and NOAA/OAR National Severe Storms Laboratory, Norman, Oklahoma 1. INTRODUCTION Radar backscatter from the ground can contaminate weather signals, often resulting in severely biased meteorological estimates. If not removed, these clutter returns tend to bias reflectivity high as well as Doppler velocity and spectrum width toward zero. A ground clutter filter (GCF) can mitigate this contamination and provide unbiased meteorological estimates but typically with reduced quality. Moreover, significant biases could occur if the GCF is applied when clutter is not present and the weather signal has near-zero Doppler velocities. Thus, the overall quality of the meteorological estimates needlessly suffers when a GCF is misapplied. The problem of applying the GCF becomes very complex, especially when considering the dynamic nature of the atmosphere. Anomalous propagation can cause the radar beam to increase contact or overshoot the clutter, giving the appearance that the clutter shifts within or disappears from the radar volume coverage very rapidly. In this dynamic environment, spectral examination of the received echoes provides a means to determine the presence of clutter in real time without having to rely on static clutter maps. However, spectral analysis on a finite number of samples suffers from spectral leakage. To combat spectral leakage, tapered windows are typically applied. Strong clutter returns may require the use of windows with high dynamic ranges, but the use of these windows reduces the quality and resolution of the meteorological estimates. On the other hand, weaker clutter returns may only require low dynamic range windows, which help preserve the quality and resolution of the meteorological estimates. Consequently, a ‘smart' filter is needed that can examine the received radar echoes, apply a tapered window that best suits the conditions, determine the exact number of spectral coefficients affected by clutter contamination, and, only then, apply the GCF. In this paper, we introduce a spectral GCF capable of satisfying the aforementioned considerations. The filter is referred to as Clutter Environment ANalysis using Adaptive Processing (CLEAN-AP) and performs real-time detection and suppression of ground clutter returns in dynamic atmospheric environments. We characterize the statistical performance of the CLEAN-AP filter with simulated clutter/weather mix and show real weather examples. * Corresponding Author Address: David A. Warde, CIMMS/University of Oklahoma, National Severe Storms Laboratory, National Weather Center, 120 David L. Boren Blvd. Norman, OK, 73072; [email protected] 2. GROUND CLUTTER FILTERING The effects of ground clutter contamination on meteorological estimates are well understood. Ground clutter is characterized as having strong received power with a very narrow spectrum width and near zero velocity (Doviak and Zrnić 1993, Sirmans 1987, Sirmans 1992). The large concentration of power in a small band of frequencies centered at zero tends to bias both velocity and spectrum width estimates toward zero while increasing the reflectivity estimate. Equally known is the mitigation of ground clutter contamination. A high pass filter tuned to capture the Doppler characteristics of the ground clutter can mitigate the contamination and provide meaningful estimates. Sirmans (1992) detailed the use of a five- pole elliptic infinite impulse response (IIR) filter for the NEXRAD WSR-88D radar system to mitigate ground clutter. A notch width parameter selection of low, medium and high allowed the operator to tune the filter to suppress varying levels of clutter contamination. In 2004, Ice et. al. (2004a, 2004b) evaluated the Gaussian Model Adaptive Processing (GMAP) (Siggia and Passarrelli 2004) filter as a replacement GCF for the NEXRAD WSR-88D radar system. The main advantages of this spectral GCF are its ability to automatically tune the filter with a single parameter and to recover spectral coefficients in the stop band of the filter. Although mitigation of ground clutter is rather straight forward, filtering also has its drawbacks in that meteorological estimates along the zero-isodop (i.e., the contour of near-zero radial velocity weather) are biased or completely removed. When a bias is observed, the GCF induces a slight shift in the velocity estimate away from zero while increasing the spectrum width and reducing the reflectivity estimates. Thus, judicious application of the GCF by the operator is warranted (Chrisman et. al. 1994). Recently, an automated ground clutter detection algorithm, Clutter Mitigation Decision (CMD) (Hubbert et. al. 2009), designed by scientists and engineers at the National Center for Atmospheric Research (NCAR) has been implemented into the NEXRAD WSR-88D radar system (Ice et. al. 2009). The fuzzy logic based algorithm provides real time ground clutter mitigation decision eliminating the need for operator interaction. Here we show an efficient GCF algorithm, CLEAN-AP, which combines both the detection and mitigation of ground clutter contamination from the weather radar returns. The filter dynamically changes its clutter suppression characteristics to optimally match the ground clutter environment. When a large ground
Transcript of P10.11 AUTOMATIC DETECTION AND REMOVAL OF GROUND CLUTTER ...cimms.ou.edu/~torres/Documents/Radar...
P10.11 AUTOMATIC DETECTION AND REMOVAL OF GROUND CLUTTER CONTAMINATION ON WEATHER RADARS
David A. Warde* and Sebastián M. Torres
Cooperative Institute for Mesoscale Meteorological Studies, The University of Oklahoma, and NOAA/OAR National Severe Storms Laboratory, Norman, Oklahoma
1. INTRODUCTION
Radar backscatter from the ground can contaminate weather signals, often resulting in severely biased meteorological estimates. If not removed, these clutter returns tend to bias reflectivity high as well as Doppler velocity and spectrum width toward zero. A ground clutter filter (GCF) can mitigate this contamination and provide unbiased meteorological estimates but typically with reduced quality. Moreover, significant biases could occur if the GCF is applied when clutter is not present and the weather signal has near-zero Doppler velocities. Thus, the overall quality of the meteorological estimates needlessly suffers when a GCF is misapplied. The problem of applying the GCF becomes very complex, especially when considering the dynamic nature of the atmosphere. Anomalous propagation can cause the radar beam to increase contact or overshoot the clutter, giving the appearance that the clutter shifts within or disappears from the radar volume coverage very rapidly. In this dynamic environment, spectral examination of the received echoes provides a means to determine the presence of clutter in real time without having to rely on static clutter maps. However, spectral analysis on a finite number of samples suffers from spectral leakage. To combat spectral leakage, tapered windows are typically applied. Strong clutter returns may require the use of windows with high dynamic ranges, but the use of these windows reduces the quality and resolution of the meteorological estimates. On the other hand, weaker clutter returns may only require low dynamic range windows, which help preserve the quality and resolution of the meteorological estimates. Consequently, a ‘smart' filter is needed that can examine the received radar echoes, apply a tapered window that best suits the conditions, determine the exact number of spectral coefficients affected by clutter contamination, and, only then, apply the GCF.
In this paper, we introduce a spectral GCF capable of satisfying the aforementioned considerations. The filter is referred to as Clutter Environment ANalysis using Adaptive Processing (CLEAN-AP) and performs real-time detection and suppression of ground clutter returns in dynamic atmospheric environments. We characterize the statistical performance of the CLEAN-AP filter with simulated clutter/weather mix and show real weather examples. * Corresponding Author Address: David A. Warde, CIMMS/University of Oklahoma, National Severe Storms Laboratory, National Weather Center, 120 David L. Boren Blvd. Norman, OK, 73072; [email protected]
2. GROUND CLUTTER FILTERING The effects of ground clutter contamination on
meteorological estimates are well understood. Ground clutter is characterized as having strong received power with a very narrow spectrum width and near zero velocity (Doviak and Zrnić 1993, Sirmans 1987, Sirmans 1992). The large concentration of power in a small band of frequencies centered at zero tends to bias both velocity and spectrum width estimates toward zero while increasing the reflectivity estimate.
Equally known is the mitigation of ground clutter contamination. A high pass filter tuned to capture the Doppler characteristics of the ground clutter can mitigate the contamination and provide meaningful estimates. Sirmans (1992) detailed the use of a five-pole elliptic infinite impulse response (IIR) filter for the NEXRAD WSR-88D radar system to mitigate ground clutter. A notch width parameter selection of low, medium and high allowed the operator to tune the filter to suppress varying levels of clutter contamination. In 2004, Ice et. al. (2004a, 2004b) evaluated the Gaussian Model Adaptive Processing (GMAP) (Siggia and Passarrelli 2004) filter as a replacement GCF for the NEXRAD WSR-88D radar system. The main advantages of this spectral GCF are its ability to automatically tune the filter with a single parameter and to recover spectral coefficients in the stop band of the filter.
Although mitigation of ground clutter is rather straight forward, filtering also has its drawbacks in that meteorological estimates along the zero-isodop (i.e., the contour of near-zero radial velocity weather) are biased or completely removed. When a bias is observed, the GCF induces a slight shift in the velocity estimate away from zero while increasing the spectrum width and reducing the reflectivity estimates. Thus, judicious application of the GCF by the operator is warranted (Chrisman et. al. 1994). Recently, an automated ground clutter detection algorithm, Clutter Mitigation Decision (CMD) (Hubbert et. al. 2009), designed by scientists and engineers at the National Center for Atmospheric Research (NCAR) has been implemented into the NEXRAD WSR-88D radar system (Ice et. al. 2009). The fuzzy logic based algorithm provides real time ground clutter mitigation decision eliminating the need for operator interaction.
Here we show an efficient GCF algorithm, CLEAN-AP, which combines both the detection and mitigation of ground clutter contamination from the weather radar returns. The filter dynamically changes its clutter suppression characteristics to optimally match the ground clutter environment. When a large ground

AMS 34th Radar Conference, Williamsburg, VA P10.11 2
clutter contamination is detected the filter provides clutter suppression of up to 60 dB; and, when no ground clutter contamination is present, the filter provides no suppression of weather signals.
2. GROUND CLUTTER DETECTION
The digitized complex, in-phase and quadrature-
phase (I and Q), voltage samples of received distributed weather echoes of a coherent Doppler weather radar are independent random variables in phase and amplitude (Doviak and Zrnić 1993). If the observation time of this stochastic process is limited to a several milliseconds, the process can be considered wide-sense stationary (WSS). Typical WSR-88D dwell times range from about 35 ms to about 80 ms in Surveillance and Doppler modes to about 250 ms in Clear Air mode (FMH-11). As such, spectral moment estimation is a useful tool to analyze these digitized voltages and extract meteorological estimates from other undesired signals such as ground clutter.
Typically, the periodogram is used to create the power spectral density; however, the periodogram may not be suited to identify ground clutter contamination. Additionally, exact replication of the power spectral density is not possible with a finite dwell time using the digital Fourier transform (DFT) unless the received signals are exactly periodic over the basis of the transform. Since the digitized I and Q voltages represent a continuum of received frequencies, the aperiodic received signals will spread (leak) across the frequency domain of the DFT. Tapered windows such as Hamming, von Hann (Hanning), or Blackman can be used to control the amount of spectral leakage at the cost of decreased resolution and increased variance of the estimates (Harris 1978, Nuttall 1981).
Spectral leakage is an unfortunate side effect of the limited record length of the digitized signal, but increased record lengths would most likely violate the WSS notion for the weather estimate and result in impractical dwell times. Fortunately, spectral leakage can be measured using the phases of the coefficients in the linear cross-correlation spectrum (here out referred to as cross-spectrum) of the signal with itself as:
= +*( ) ( ) ( )k kF k X m X m l (1)
where X = DFT(d · x), k is the coefficient of the DFT, m is the sample index, l is the delay or lag, d is the tapered window and x is the digitized received complex voltage.
It is easy to show that when the tapered window (d) is rectangular, the cross-spectrum in equation (1) is the periodogram for l = 0 and leads to a complex spectrum for which the sum is the lag-l autocorrelation when l > 0. The cross-spectrum in equation (1) preserves the phase relation of both periodic and aperiodic signals. Thus, each coefficient in the cross-spectrum of equation (1) becomes the superposition of a single periodic signal with all the aperiodic signals that make up the digitized I and Q samples. The aperiodic signals bias the coefficients of the cross-spectrum and the argument of the resultant phasor indicates the amount of bias.
An analysis of the cross-spectrum of equation (1) created by using a delay of 1 sample (l = 1), reveals that narrow spectrum width signals provide increased phase bias than a like signal with a larger spectrum width. This is significant since the spectrum width of weather is expected to be much greater (2 m/s to 4 m/s in convective storms) than the spectrum width of ground clutter (< 0.3 m/s) (Sirmans 1992).
Fig. 1 shows the magnitude (left) and phase (right) relationship of the cross-spectrum at lag-1 of two 20 dB signals with a velocity of 0 m/s. The signal in blue has a wide spectrum width of 4 m/s and the signal in red has a narrow spectrum width of 0.3 m/s. The green line in the phase plot indicates that periodic signals are not affected by the presence of aperiodic signals in the signal (e.g., white noise); whereas, deviations from the green line indicate biases caused by aperiodic signals present in the spectrum. Note that where the signal is present, the narrow spectrum width signal has more coefficients that are phase biased than does the wider spectrum width signal. This behavior of narrow spectrum width signals is due to the large power/frequency gradient (i.e., large concentration of power in a small band of frequencies) and provides the method to identify ground clutter contamination near zero velocity used in the CLEAN-AP filter. In regions where the signal drops near the noise level, the phase becomes random.
3. CONTROLLING SPECTRAL LEAKAGE
As mentioned, a true representation of the power
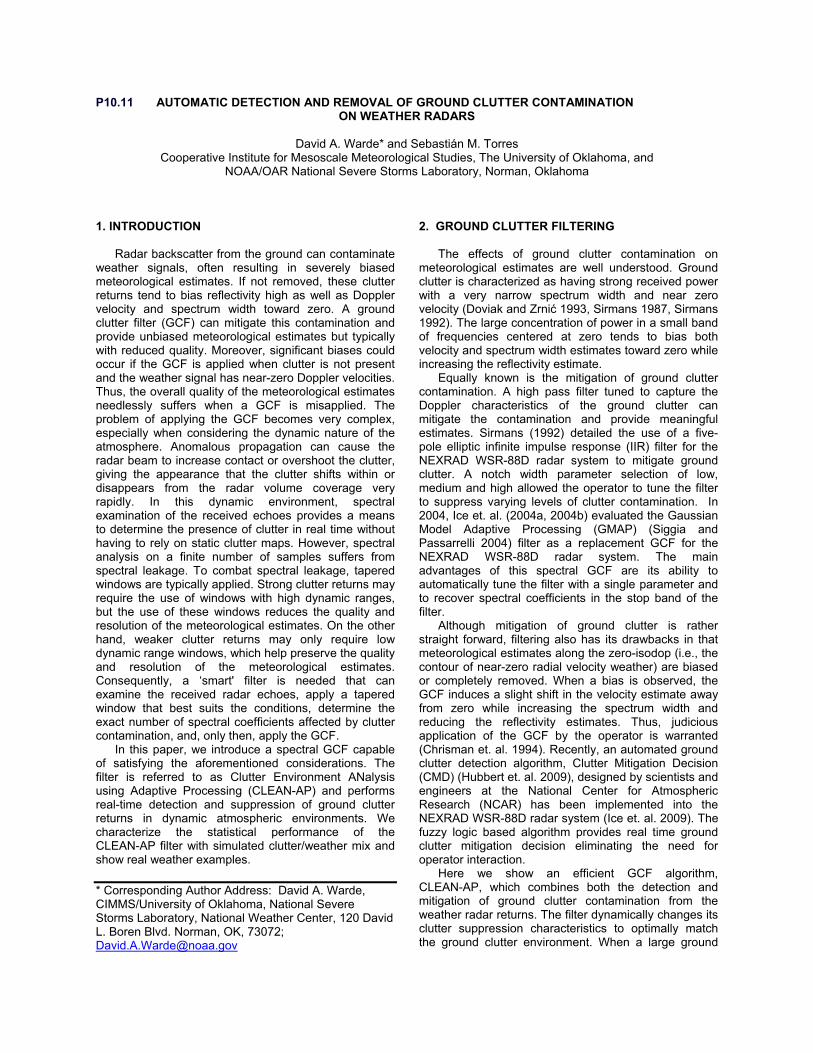
spectral density cannot be achieved from the digitized complex voltages due to the finite observation period; thus, it becomes necessary to monitor the intrinsic spectral leakage of our time-limited signals. It should be noted that spectral leakage in and of itself is not a problem, but the presence of two signal sources (e.g., ground clutter and weather) impinging on each other is a problem. Take for example a pure tone at a frequency that is midway between two basis vectors of the DFT. The pure tone will be spread to the maximum extent. The spectral leakage can be visualized as the convolution of the tapered window spectrum with this aperiodic tone. Using the cross-spectrum at lag-1, the phase is constant at a single phase (representative of the frequency of the signal).
An example of a pure tone that is sampled midway between the basis vectors of the DFT is shown in Fig. 2. Since the cross-spectral phase is equal throughout the Nyquist co-interval, the magnitude of the sum of the cross-spectrum coefficients at lag-1 (or at any lag) is equal to the magnitude of the sum of the cross-spectrum at lag-0 (i.e., periodogram). That is, the pure tone signal is completely correlated at all lags of the cross-spectrum as expected.
To preserve the superposition of the pure tones of the weather signal, a method is needed that ensures clutter contamination does not bias the coefficients of the weather signal. Tapered windows provide a method to smooth (whiten or flatten) the cross-spectrum (Schwartz and Shaw 1975); thus, controlling the clutter
AMS 34th Radar Conference, Williamsburg, VA P10.11 3
power gradient across frequencies. The consequence of this smoothing process is the loss of fidelity of the weather signal in the form of increased variance and loss of resolution (Torres 2007).
There are many sources in the literature that describe the effects of tapered windowing, so this paper will not review these effects. However, there are two characteristics of the tapered window spectrum that are of interest when controlling spectral leakage: highest sidelobe level and sidelobe falloff rate. Harris (1975) and Nuttall (1981) detail these characteristics for many of the common tapered windows and Table 1 provides a quick reference to five windows used in the CLEAN-AP filter. Although the Hamming window has a lower sidelobe level than does the Hanning window, it is listed first in Table 1 because of the sidelobe falloff rate is much lower.
Table 1. Tapered window sidelobe characteristics
Window Highest Sidelobe
Level (dB)
Sidelobe Falloff Rate (dB/octave)
Rectangular -13 -6 Hamming -43 -6 Hanning (a = 2.0) -32 -18 Blackman -58 -18 Blackman-Nuttall -98 -18
The highest sidelobe level and the sidelobe falloff
rate of the tapered window provide the method to control spectral leakage. If the clutter-to-noise ratio (CNR) is limited to the highest sidelobe level, then the leakage of the clutter signal away from zero will occur at or below the noise level. Additionally, by choosing a tapered window which exhibits a good sidelobe falloff rate, the clutter contamination will be suppressed well below the noise level concentrating the clutter bias at frequencies near zero. An estimation of CNR used by the CLEAN-AP filter is provided by comparing the average DC (or zero-frequency) power to the noise power:
−
==∑
21
0
1 ( )CNR
noise
M
mx m
M (2)
4. CLEAN-AP ALGORITHM DESCRIPTION
For each range bin:
a. Compute the estimated CNR using equation (2) b. Select a tapered window from Table 1 such that
the estimated CNR does not exceed the highest sidelobe level.
c. Create two complex time-series as: =1 1( )x x m and =2 2( ),x x m where ≤ < −1 0 1m M and ≤ <21 .m M
d. Compute the DFT of windowed spectrum 1X and
2X from 1x and 2x respectively. e. Compute the periodogram from 1X and the lag-1
cross-spectrum using equation (1) (with 1X as the first term and 2X as the second term).
f. Compare the absolute value of the argument of
each coefficient of the cross-spectrum at lag-1 to a clutter bias threshold parameter (angular error).
g. Notch the coefficients of the periodogram and
cross-spectrum where the cross-spectrum coefficients are less than the angular error and exceed the spectral noise level.
h. Identify the range bin as filtered if a notch has
been applied. i. Linearly interpolate across the spectral notch
width for both the periodogram and the cross-spectrum. j. Estimate the meteorological parameters per
Doviak and Zrnić (1993).
5. SIMULATION ANALYSIS Reasonable weather and clutter simulations are
provided by modeling the signals as having a Gaussian power spectrum (Sirmans and Bumgarner 1975, Zrnić 1975) with a larger number of coefficients than are needed in the time series. Using simulations, the clutter filter characteristics and clutter detection capability of the CLEAN-AP filter can be shown. The following paragraphs depicts some selected performance characteristics of the filter.
5.1 Ground Clutter Suppression
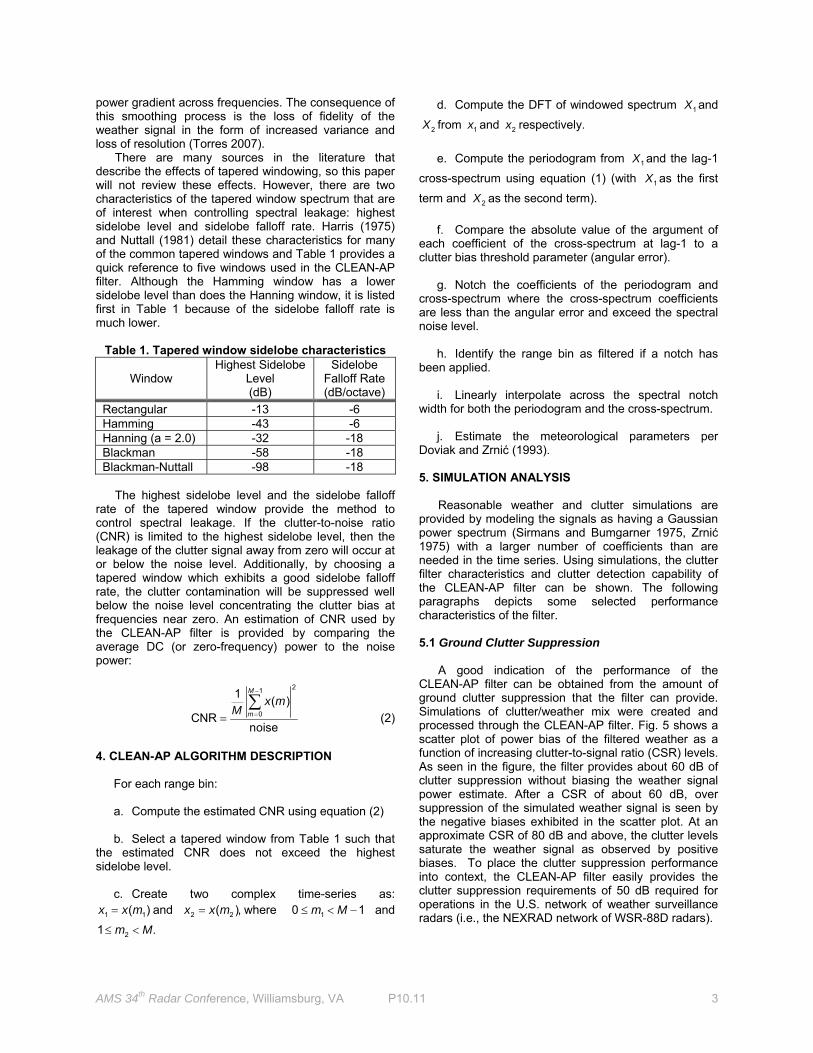
A good indication of the performance of the
CLEAN-AP filter can be obtained from the amount of ground clutter suppression that the filter can provide. Simulations of clutter/weather mix were created and processed through the CLEAN-AP filter. Fig. 5 shows a scatter plot of power bias of the filtered weather as a function of increasing clutter-to-signal ratio (CSR) levels. As seen in the figure, the filter provides about 60 dB of clutter suppression without biasing the weather signal power estimate. After a CSR of about 60 dB, over suppression of the simulated weather signal is seen by the negative biases exhibited in the scatter plot. At an approximate CSR of 80 dB and above, the clutter levels saturate the weather signal as observed by positive biases. To place the clutter suppression performance into context, the CLEAN-AP filter easily provides the clutter suppression requirements of 50 dB required for operations in the U.S. network of weather surveillance radars (i.e., the NEXRAD network of WSR-88D radars).

AMS 34th Radar Conference, Williamsburg, VA P10.11 4
5.2 Reflectivity Bias The reflectivity bias from the filtering process when
ground clutter is not present is shown in Fig. 6 through Fig. 8. In these figures, power bias is shown as a function of the spectrum width using simulations of a 20 dB weather signal with 0 m/s velocity and varying spectrum widths. Different pulse-repetition-frequencies are used for the three weather modes described in the FMH-11. The CLEAN-AP filter provides small biases over the range of spectrum widths. Performance is shown against the filters used (past and present) in the WSR-88D for the operational scanning modes: Clear Air, Surveillance, and Doppler. The blue dots on each plot indicate the WSR-88D reflectivity bias requirements (WSR-88D SS).
5.3 Ground Clutter Detection
The CLEAN-AP filter has the ability to identify
ground clutter in the presence of weather echoes as shown in Fig. 9 where clutter likelihood is plotted as a function of CSR. The detection rate is calculated as the mean of 5100 detections (identified filtering of a range bin as in 4h above) at each CSR level for a simulated 20 dB signal with varying velocities and a 4 m/s spectrum width. The CLEAN-AP filter has approximately 50% detection rate down to -12 dB CSR and about 83% detection rate at 0 dB CSR with over 90% detection rate above about 3.7 dB CSR.
5.4 Velocity Bias
The CLEAN-AP filter has no appreciable velocity
bias (< 0.8 m/s) over the entire Nyquist co-interval for a composite signal with 55 dB CSR as seen in Fig. 10. The scatter plot shows the filtered velocity bias as a function of 100 simulations for each velocity tested. The CLEAN-AP filter easily meets WSR-88D velocity bias requirments (< 2 m/s) at the highest clutter suppression (50 dB) levels.
5.5 Spectrum Width Bias
The CLEAN-AP filter provides unbiased spectrum
width estimates with low error of estimates as seen in Fig. 11 when providing 55 dB of clutter suppression. In this figure, the green line shows zero bias; while the red lines indicate the WSR-88D allowed bias of 2 m/s for filtered spectrum width estimates. The red circles indicate the estimate mean and the red bars indicate the standard deviation at the mean. The CLEAN-AP filter easily meets WSR-88D spectrum width bias and error of estimate requirments (< 2 m/s) at the highest clutter suppression levels (50 dB).
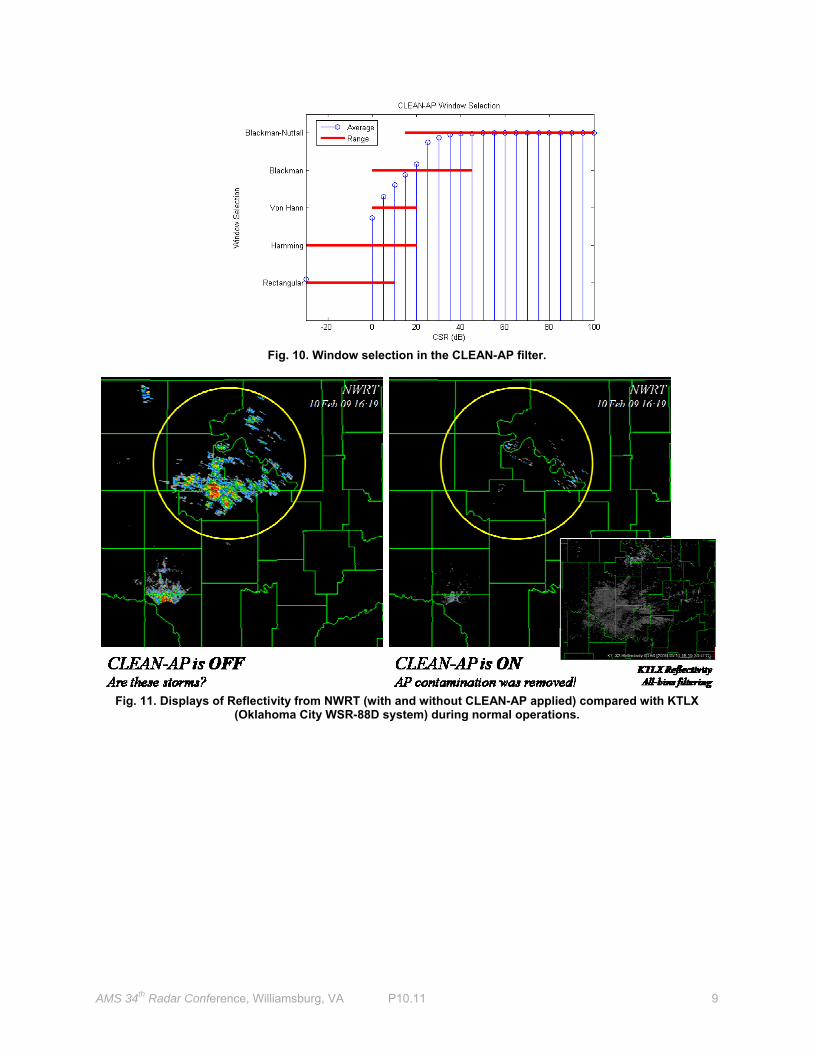
5.6 Window Selection
Closely related to low errors of estimates is the
selection of low dynamic-range tapered windows. On the other hand, high dynamic-range tapered windows are needed for adequate clutter suppression. The
CLEAN-AP filter provides automated tapered window selection among five windows as listed in Table 1. Fig. 11 shows how the CLEAN-AP filter selects the lowest dynamic-range window when ground clutter is low and increasingly selects a higher dynamic-range window as the amount of ground clutter increases. This performance ensures the best possible quality of estimate for a given ground clutter environment. 6. REAL WEATHER EXAMPLES
The CLEAN-AP filter was implemented in the Fall of 2008 into the weather digital signal processing suite of the National Weather Radar Testbed (NWRT) Phased Array Radar (PAR) located in Norman, Oklahoma (Torres et. al. 2009). During the Phased Array Radar Innovative Sensing Experiment (PARISE) (Heinselman et. al. 2009), the CLEAN-AP filter provided automatic ground clutter detection and suppression. In Fig. 11, the CLEAN-AP filter is shown to remove ground clutter caused by anomalous propagation. The filter performance is contrasted against the operational WSR-88D radar system KTLX in Oklahoma City. In the operational system, operators applied filtering at all ranges to combat the dynamic atmospheric conditions as the inversion moved over the region to the North of the radar.
In Fig. 12, normal propagation (NP) clutter contamination biases are shown to be removed from reflectivity, velocity and spectrum width near the NWRT PAR (red circles) without affecting areas outside the clutter regions. The images captured a mesocyclone (yellow circles) just 2 hours before it developed into an EF0 tornado that touched down at lake Stanley Draper in southern Oklahoma City, OK. Note that there are no observable differences inside the yellow circles indicating that the CLEAN-AP filter did not bias the weather estimates in this region.
7. SUMMARY
We have introduced a new spectral GCF, referred to as CLEAN-AP, capable of automatic real-time detection and mitigation of ground clutter contamination in weather radars. We have characterized the statistical performance of the CLEAN-AP filter and compared the performance with NEXRAD WSR-88D standards. Through simulations, we have shown that the filter is capable of providing clutter filtering on par with current techniques, but does so without operator interaction. Examples of the filters real-time performance was shown to remove clutter contamination in both severe AP and NP events without detriment to meteorological estimates as part of the NWRT PAR digital signal processing suite.
ACKNOWLEDGEMENTS
This conference paper was prepared by David Warde and Sebastián Torres with funding provided by NOAA/Office of Oceanic and Atmospheric Research under NOAA-University of Oklahoma Cooperative

AMS 34th Radar Conference, Williamsburg, VA P10.11 5
Agreement #NA17RJ1227, U.S. Department of Commerce. The statements, findings, conclusions, and recommendations are those of the authors and do not necessarily reflect the views of NOAA or the U.S. Department of Commerce. The authors would like to thank the NSSL software engineers, with special thanks to Eddie Forren for his invaluable expertise in implementing the CLEAN-AP filter on the NWRT PAR and Rick Adams for his constant attention to data collection opportunities and replay of numerous hours of NWRT PAR time-series data.
REFERENCES Chrisman, J., D. Rinderknecht, and R. Hamilton, 1994:
WSR-88D Clutter Suppression and Its Impact on Meteorological Data Interpretation. Postprints, The First WSR-88D Users’ Conference, Norman, OK, USA, Oct 1994.
Doviak, D. and D. Zrinć, 1993: Doppler Radar and
Weather Observations, 2nd edition. Academic Press. Federal Meteorological Handbook, Number 11, 1989.
Part B, Doppler radar theory and meteorology. Harris, F., 1978: On the use of windows for harmonic
analysis with the discrete Fourier transform, Proc. IEEE, vol. 66, 51-83.
Heinselman, P., S. Torres, R. Adams, C. Curtis, E.
Forren, I. Ivic, D. Priegnitz, J. Thompson, and D. Warde, 2009: Phased array radar innovative sensing experiment, Preprints 34th Radar Conf., Williamsburg, VA, Amer. Metoer. Soc.
Hubbert, J., M. Dixon, and S. Ellis, 2009: Weather radar ground clutter. Part II: Real-Time Identification and Filtering, Journal of Atmos. Oceanic Technol., vol. 26, 1118-1196. Ice, R., D. Warde, D. Sirmans, D. Rachel, 2004a:
Report on Open RDA – RVP8 Signal Processing, Part 1 – Simulation Study, WS-88D Radar Operations Center Report, January 2004. 87 pp.
___, D. Warde, D. Sirmans, D. Rachel, 2004b: Report
on Open RDA – RVP8 Signal Processing, Part 2 – Engineering Analysis with Meteorological Data, WS-88D Radar Operations Center Report, July 2004. 56 pp.
___, R. Rhoton, J. Krause, D. Saxion, O. Boydstun, A.
Heck, J. Chrisman, D. Berkowitz, W. Zittel, and D. Warde, 2009: Automatic clutter mitigation in the WSR-88D, design, evaluation, and implementation, Preprints 34th Radar Conf., Williamsburg, VA, Amer. Metoer. Soc.
Schwartz, M. and L. Shaw, 1975: Signal Processing:
Discrete Spectral Analysis, Detection, and Estimation. McGraw-Hill.
Siggia, A., and J. Passarelli, 2004: Gaussian model adaptive processing (GMAP) for improved ground clutter cancellation and moment calculation. Proc. Third European Conf. on Radar in Meteorology and Hydrology, Visby,Gotland, Sweden, ERAD, 67–73.
Sirmans, D., and Bill Bumgarner, 1975: Numerical
comparison of five mean frequency estimators. Journal of Applied Meteorology, vol.14, 991-1003.
___, 1987: NEXRAD suppression of land clutter echo
due to anomalous microwave propagation - Part I, NSSL Internal Report. 54 pp.
___, 1992: Clutter filtering in the WSR-88D, OSF
Internal Report. 125 pp. Torres, S., C. Curtis, D. Zrnic, M. Jain, 2007: Analysis of
the new NEXRAD spectrum width estimator. Proc. 33rd Conference on Radar Meteorology, Cairns, Australia, AMS, CD-ROM, P7.8.
___, ___, I. Ivic, D. Warde, E. Forren, J. Thompson, D.
Priegnitz, and R. Adams, 2009: Update on signal processing upgrades for the National Weather Radar Testbed. Preprints, 25th IIPS for Meteorology, Oceanography, and Hydrology, Phoenix, AZ, USA, Amer. Meteor. Soc.
Nuttall, A., 1981: Some windows with very good
sidelobe behavior, Trans. ASSP, vol. 29, pp. 84-91. WSR-88D System Specifications 2810000H, 25 April
2008, Radar Operations Center, 160 pp. Zrnić, D. S., 1975: Simulation of weather like Doppler
spectrum and signals, Journal of Applied Meteorology, 14, 619-620.
AMS 34th Radar Conference, Williamsburg, VA P10.11 6
Fig. 1. Lag-1 Cross-Spectrum of two signals:
sig1 (SNR = 20 dB, v = 0 m/s, σv = 4 m/s) and sig2 (SNR = 20 dB, v = 0 m/s, σv = 0.3 m/s)
Fig. 2. Lag-1 Cross-Spectrum of pure tone leakage across Nyquist co-interval (v/Va = 0.05 ≡ ω/π)
Fig. 3. Example of Clutter Suppression exhibited by the CLEAN-AP filter

AMS 34th Radar Conference, Williamsburg, VA P10.11 7
Fig. 4. Reflectivity bias in Clear Air Mode for the WSR-88D and the CLEAN-AP filters.
Fig. 5. Reflectivity bias in Surveillance Mode for the WSR-88D and the CLEAN-AP filters.
Fig. 6. Reflectivity bias in Doppler Mode for the WSR-88D and the CLEAN-AP filters.

AMS 34th Radar Conference, Williamsburg, VA P10.11 8
Fig. 7. Example of likelihood of ground clutter detection using the CLEAN-AP filter.
Fig. 8. Example of velocity bias in a high-suppression regime for the CLEAN-AP filter.
Fig. 9. Example of spectrum width bias and error of estimate in a high-suppression regime for the CLEAN-AP
filter.
AMS 34th Radar Conference, Williamsburg, VA P10.11 9
Fig. 10. Window selection in the CLEAN-AP filter.
Fig. 11. Displays of Reflectivity from NWRT (with and without CLEAN-AP applied) compared with KTLX
(Oklahoma City WSR-88D system) during normal operations.

AMS 34th Radar Conference, Williamsburg, VA P10.11 10
Fig. 12. Displays of reflectivity, velocity, and spectrum width with CLEAN-AP on and off,
the red circles indicate where normal clutter contamination is present when not filtering (reflectivity is biased high, velocity is biased toward zero, and spectrum width is biased toward zero in this region)