P October 26, 2012 Massachusetts Department of Public Health Office of HIV/AIDS 2012 Update P roject...
45
Massachusetts Department of Public Health Office of HIV/AIDS 2012 Update P Project ABLE Annual Meeting October 26, 2012 October 26, 2012
-
Upload
susan-adams -
Category
Documents
-
view
213 -
download
0
Transcript of P October 26, 2012 Massachusetts Department of Public Health Office of HIV/AIDS 2012 Update P roject...
Massachusetts Department of Public Health
Office of HIV/AIDS2012 Update
PProject ABLE Annual MeetingOctober 26, 2012October 26, 2012
General Updates in the Office of HIV/AIDS
OHA/BID Activities and Events
• Massachusetts Integrated Prevention and Care Committee (MIPCC), November 2012
• Implementation of Electronic Lab Reporting (ELR) effective January, 2012
• 4th Generation HIV assay at State Lab
• National HIV/AIDS Strategy—State Plan meeting, March 13th, 2013
OHA Changes
• Prevention and Screening• Integrated testing across HIV, STI and HCV• Client Health Services• HIV/Infectious Disease Correctional Health • HIV/Infectious Disease policy efforts • Contract Management • Capacity Building • 27% decline in the number of OHA staff over the past
eight years
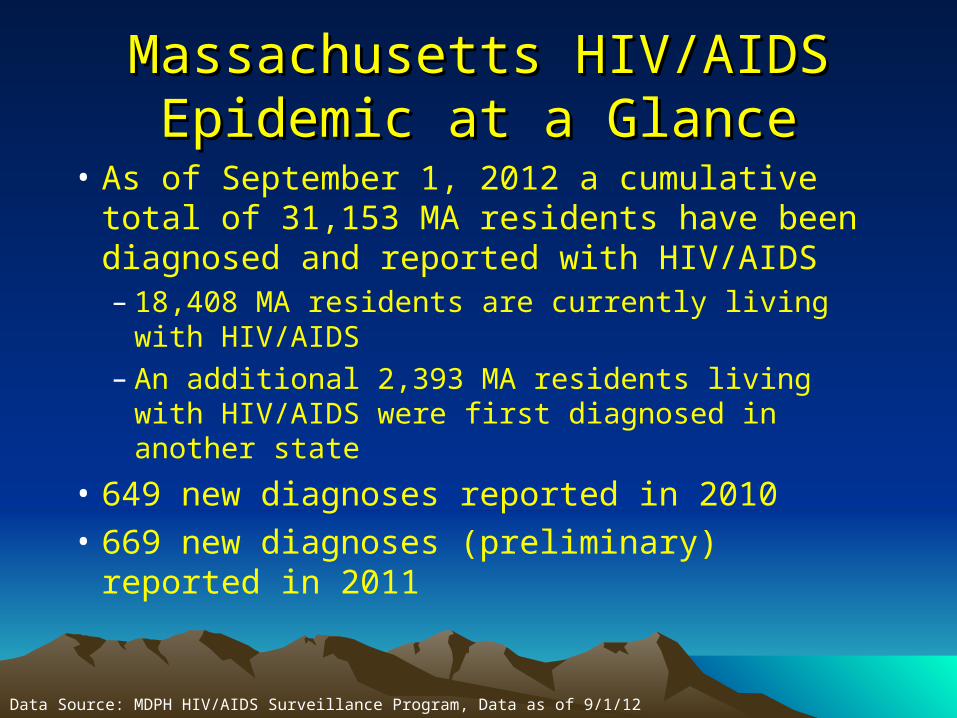
Massachusetts HIV/AIDS Epidemic at Massachusetts HIV/AIDS Epidemic at a Glancea Glance
• As of September 1, 2012 a cumulative total of 31,153 MA residents have been diagnosed and reported with HIV/AIDS– 18,408 MA residents are currently living with
HIV/AIDS– An additional 2,393 MA residents living with
HIV/AIDS were first diagnosed in another state
• 649 new diagnoses reported in 2010• 669 new diagnoses (preliminary) reported in
2011
Data Source: MDPH HIV/AIDS Surveillance Program, Data as of 9/1/12
National Estimates of Unmet Need
• CDC now estimates that 18% of HIV infected persons nationwide are not aware of their HIV status.
• OHA is able to estimate that as of January 1st, 2012 approximately 4,692 people living in Massachusetts are infected with HIV and are not aware of their HIV status.
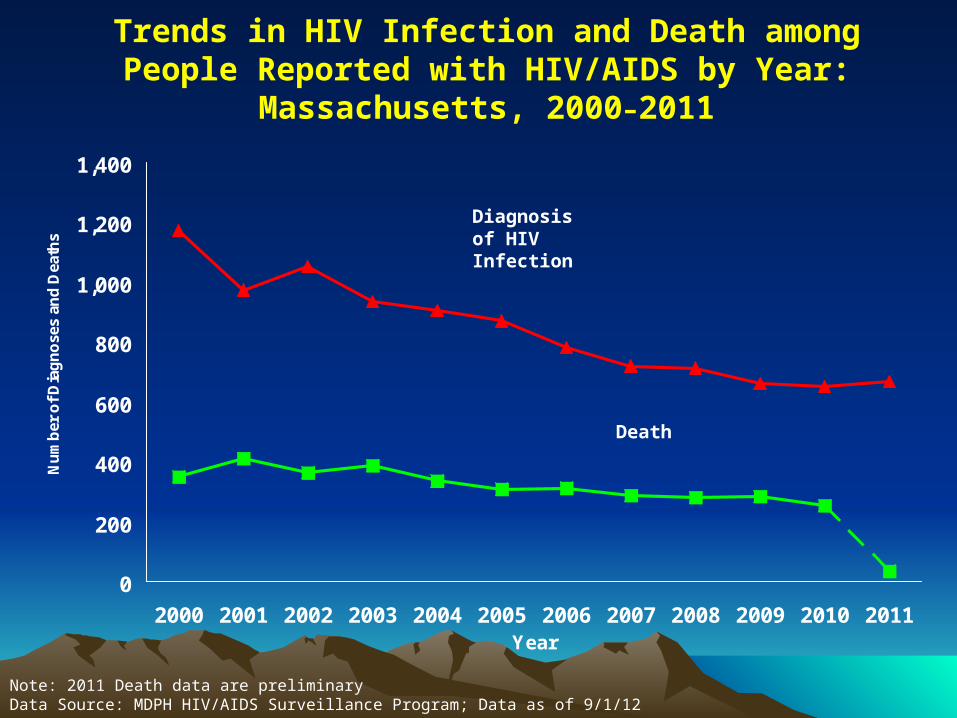
Trends in HIV Infection and Death among People Reported with HIV/AIDS by Year: Massachusetts, 2000–2011
0
200
400
600
800
1,000
1,200
1,400
2000 2001 2002 2003 2004 2005 2006 2007 2008 2009 2010 2011Year
Nu
mb
er o
f D
iag
no
ses
and
Dea
ths
Diagnosis of HIV Infection
Death
Note: 2011 Death data are preliminaryData Source: MDPH HIV/AIDS Surveillance Program; Data as of 9/1/12
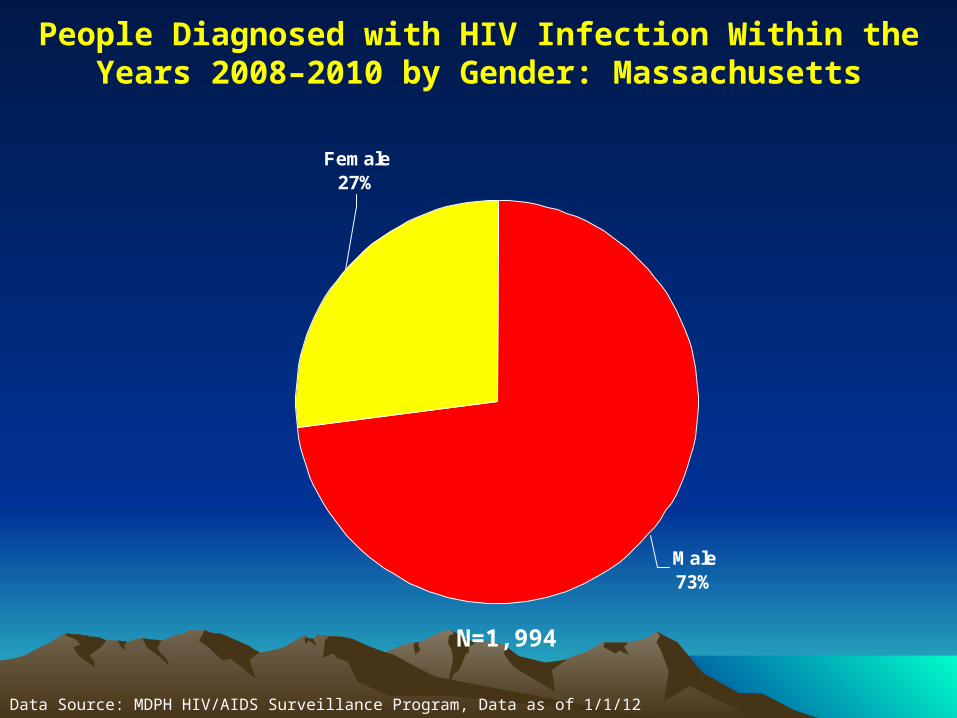
People Diagnosed with HIV Infection Within the Years 2008–2010 by Gender: Massachusetts
Male73%
Female27%
Data Source: MDPH HIV/AIDS Surveillance Program, Data as of 1/1/12
N=1,994
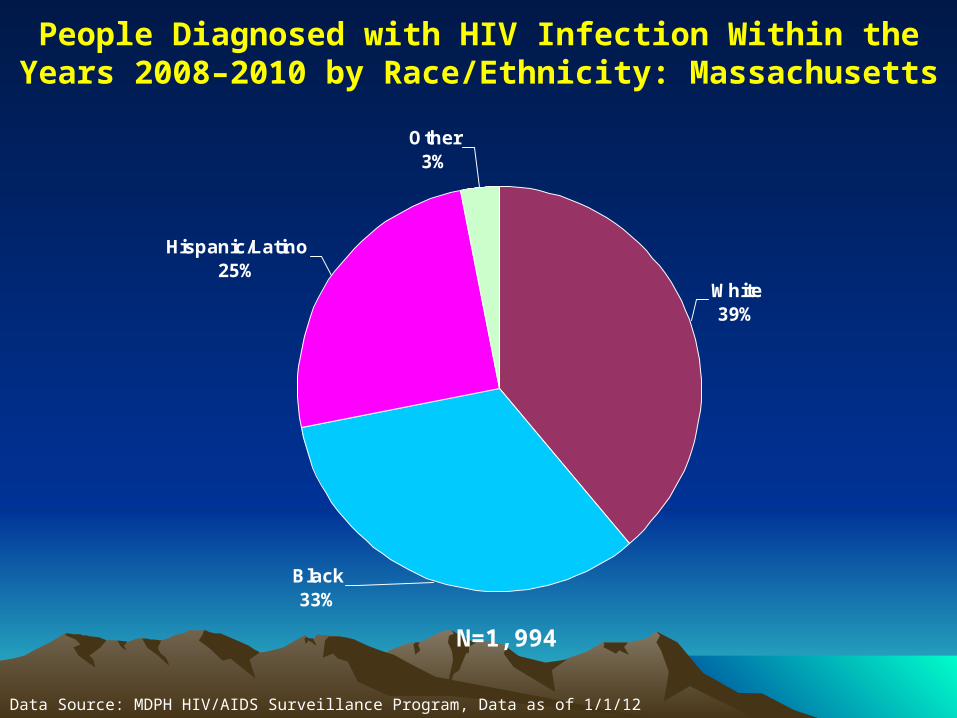
People Diagnosed with HIV Infection Within the Years 2008–2010 by Race/Ethnicity: Massachusetts
White39%
Hispanic/Latino25%
Other3%
Black33%
Data Source: MDPH HIV/AIDS Surveillance Program, Data as of 1/1/12
N=1,994
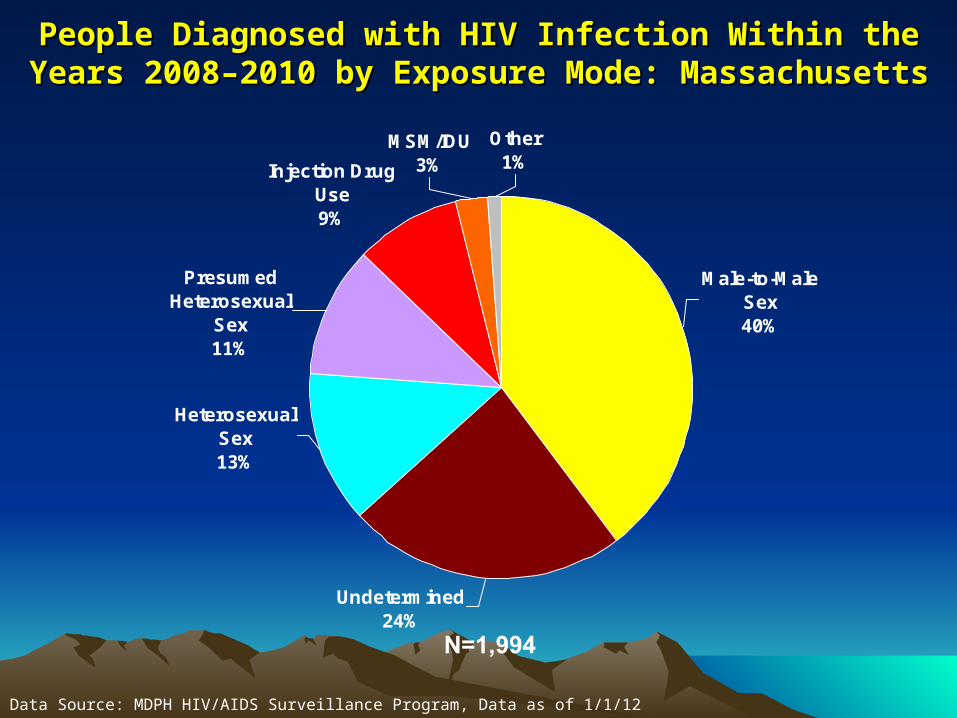
People Diagnosed with HIV Infection Within the Years 2008–2010 People Diagnosed with HIV Infection Within the Years 2008–2010 by Exposure Mode: Massachusettsby Exposure Mode: Massachusetts
Undetermined24%
Presumed Heterosexual
Sex11%
Injection Drug Use9%
MSM/IDU3%
Other1%
Heterosexual Sex13%
Male-to-Male Sex40%
Data Source: MDPH HIV/AIDS Surveillance Program, Data as of 1/1/12
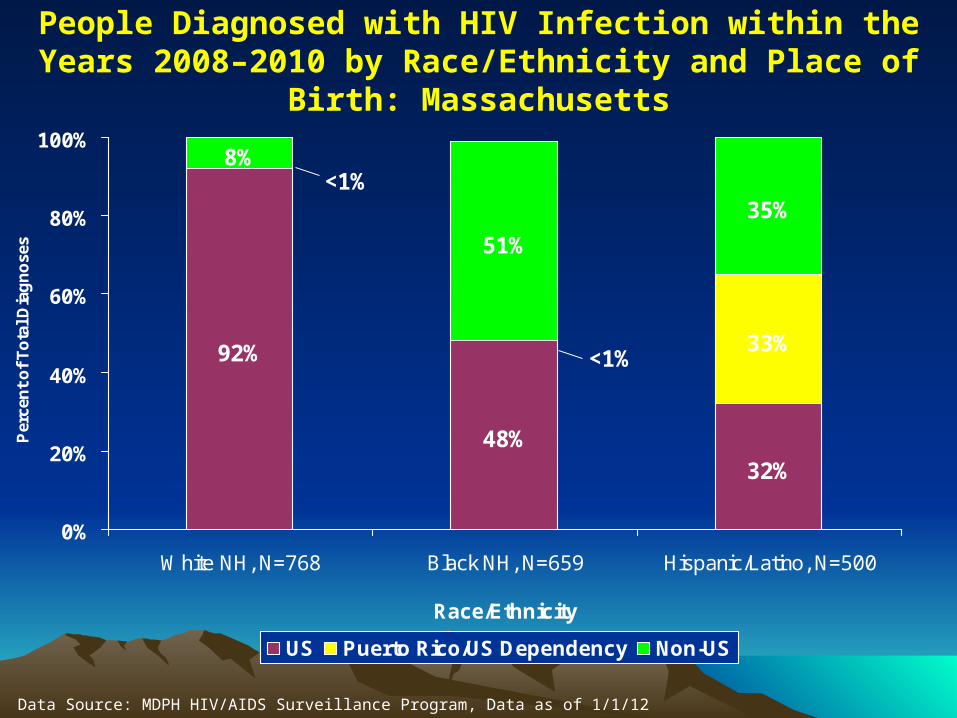
People Diagnosed with HIV Infection within the Years 2008–2010 by Race/Ethnicity and Place of Birth: Massachusetts
92%
48%32%
33%
8%
51%
35%
<1%
<1%
0%
20%
40%
60%
80%
100%
White NH, N=768 Black NH, N=659 Hispanic/Latino, N=500
Race/Ethnicity
Per
cen
t o
f T
ota
l Dia
gn
ose
s
US Puerto Rico/US Dependency Non-US
Data Source: MDPH HIV/AIDS Surveillance Program, Data as of 1/1/12
Trends in new HIV diagnosesA declining epidemic across
populations
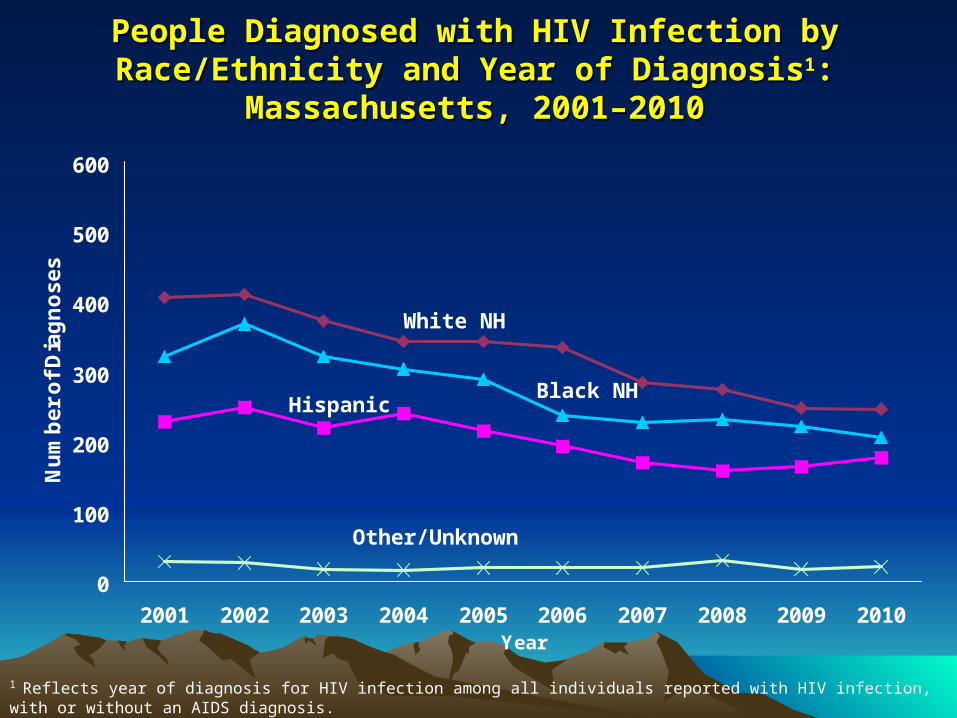
People Diagnosed with HIV Infection by Race/Ethnicity and People Diagnosed with HIV Infection by Race/Ethnicity and Year of DiagnosisYear of Diagnosis11: Massachusetts, 2001–2010: Massachusetts, 2001–2010
0
100
200
300
400
500
600
2001 2002 2003 2004 2005 2006 2007 2008 2009 2010Year
Nu
mb
er
of
Dia
gn
os
es
1 Reflects year of diagnosis for HIV infection among all individuals reported with HIV infection, with or without an AIDS diagnosis. Data Source: MDPH HIV/AIDS Surveillance Program; NH = Non-Hispanic; Data as of 1/1/12
White NH
Other/Unknown
HispanicBlack NH
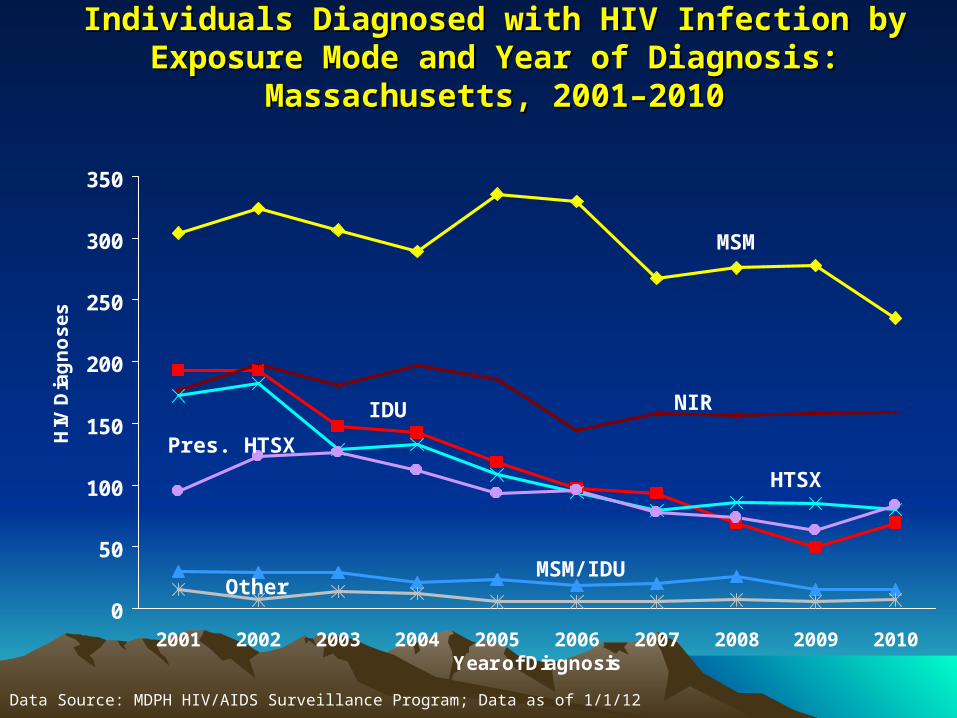
Individuals Diagnosed with HIV Infection by Exposure Mode and Individuals Diagnosed with HIV Infection by Exposure Mode and Year of Diagnosis: Massachusetts, 2001–2010Year of Diagnosis: Massachusetts, 2001–2010
0
50
100
150
200
250
300
350
2001 2002 2003 2004 2005 2006 2007 2008 2009 2010Year of Diagnosis
HIV
Dia
gn
os
es
IDU
Pres. HTSX
HTSX
Data Source: MDPH HIV/AIDS Surveillance Program; Data as of 1/1/12
MSM
MSM/IDU
NIR
Other
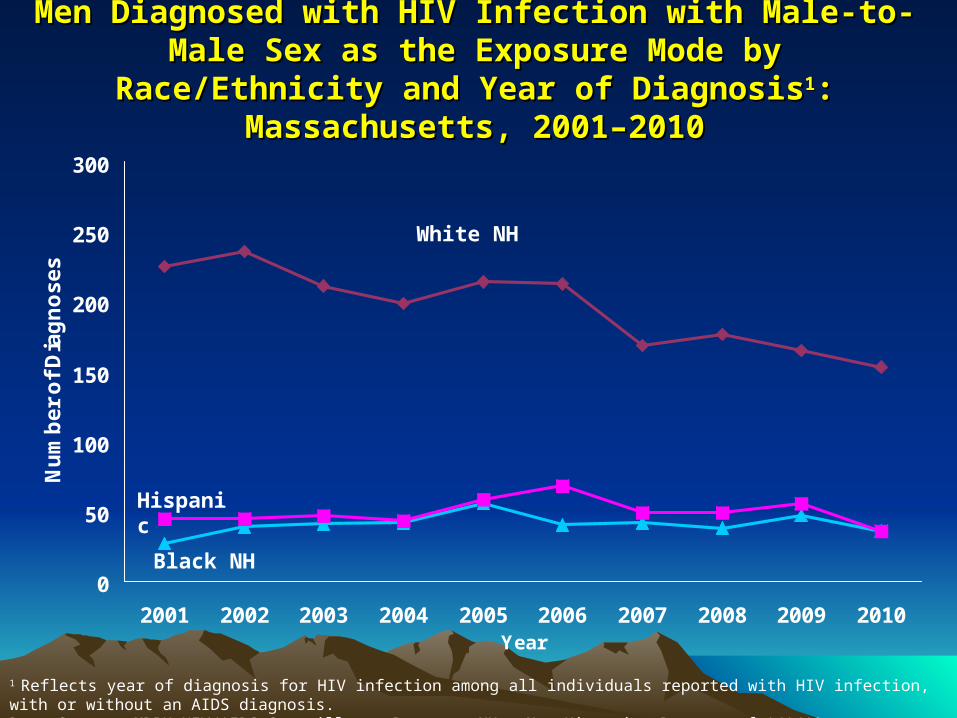
Men Diagnosed with HIV Infection with Male-to-Male Sex as Men Diagnosed with HIV Infection with Male-to-Male Sex as the Exposure Mode by Race/Ethnicity and Year of Diagnosisthe Exposure Mode by Race/Ethnicity and Year of Diagnosis11: :
Massachusetts, 2001–2010Massachusetts, 2001–2010
0
50
100
150
200
250
300
2001 2002 2003 2004 2005 2006 2007 2008 2009 2010Year
Nu
mb
er
of
Dia
gn
os
es
1 Reflects year of diagnosis for HIV infection among all individuals reported with HIV infection, with or without an AIDS diagnosis. Data Source: MDPH HIV/AIDS Surveillance Program; NH = Non-Hispanic; Data as of 1/1/12
White NH
Black NH
Hispanic
HIV/AIDS Epidemiology of New Infections—Geographic Analysis
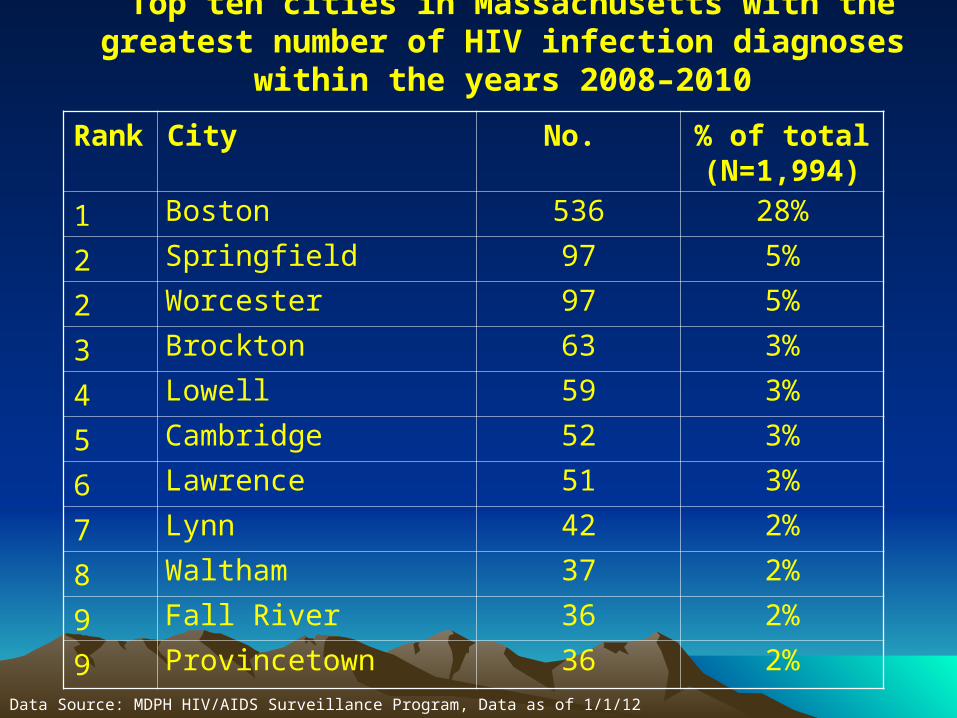
Top ten cities in Massachusetts with the greatest number of HIV infection diagnoses within the years 2008–2010
Rank City No. % of total (N=1,994)
1 Boston 536 28%
2 Springfield 97 5%
2 Worcester 97 5%
3 Brockton 63 3%
4 Lowell 59 3%
5 Cambridge 52 3%
6 Lawrence 51 3%
7 Lynn 42 2%
8 Waltham 37 2%
9 Fall River 36 2%
9 Provincetown 36 2%Data Source: MDPH HIV/AIDS Surveillance Program, Data as of 1/1/12
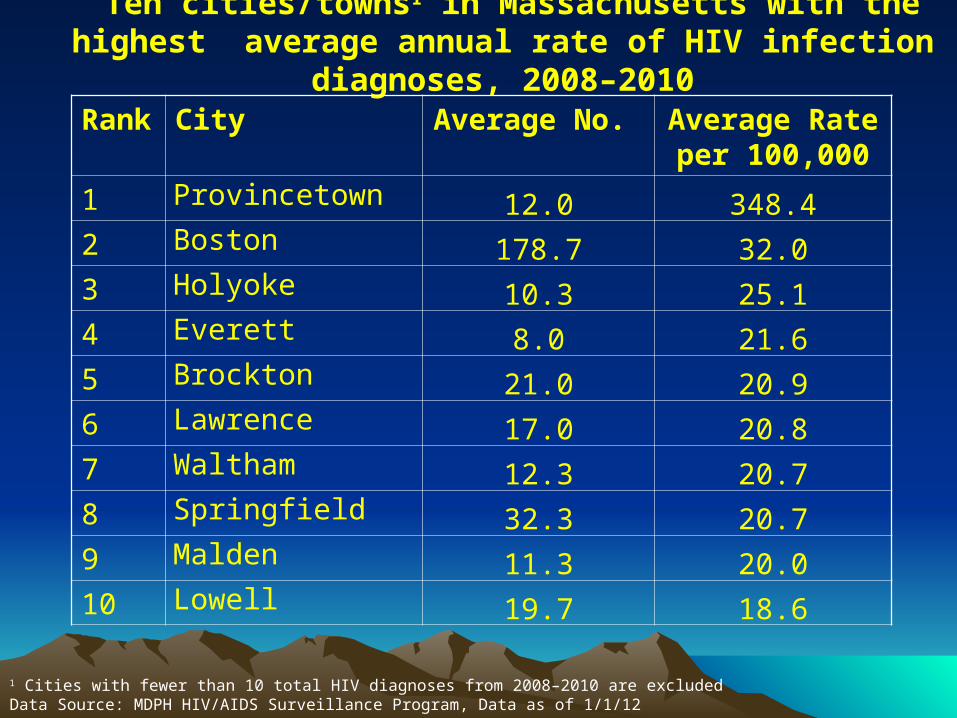
Ten cities/towns1 in Massachusetts with the highest average annual rate of HIV infection diagnoses, 2008–2010
Rank City Average No. Average Rate per 100,000
1 Provincetown 12.0 348.42 Boston 178.7 32.03 Holyoke 10.3 25.14 Everett 8.0 21.65 Brockton 21.0 20.96 Lawrence 17.0 20.87 Waltham 12.3 20.78 Springfield 32.3 20.79 Malden 11.3 20.010 Lowell 19.7 18.6
1 Cities with fewer than 10 total HIV diagnoses from 2008–2010 are excludedData Source: MDPH HIV/AIDS Surveillance Program, Data as of 1/1/12
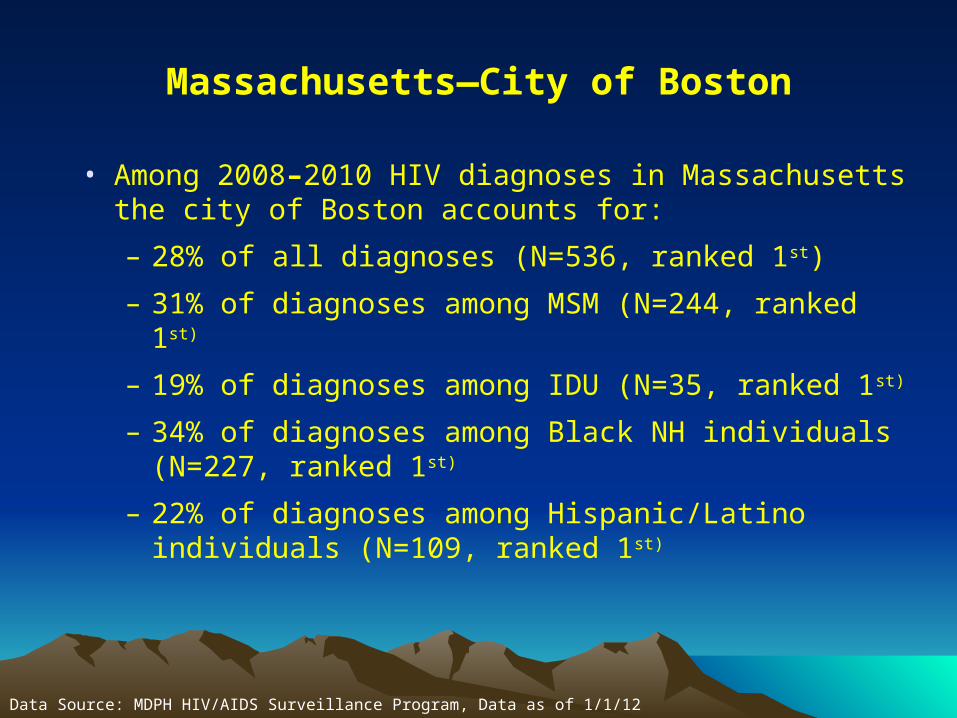
Massachusetts—City of Boston
• Among 2008–2010 HIV diagnoses in Massachusetts the city of Boston accounts for:
– 28% of all diagnoses (N=536, ranked 1st)
– 31% of diagnoses among MSM (N=244, ranked 1st)
– 19% of diagnoses among IDU (N=35, ranked 1st)
– 34% of diagnoses among Black NH individuals (N=227, ranked 1st)
– 22% of diagnoses among Hispanic/Latino individuals (N=109, ranked 1st)
Data Source: MDPH HIV/AIDS Surveillance Program, Data as of 1/1/12
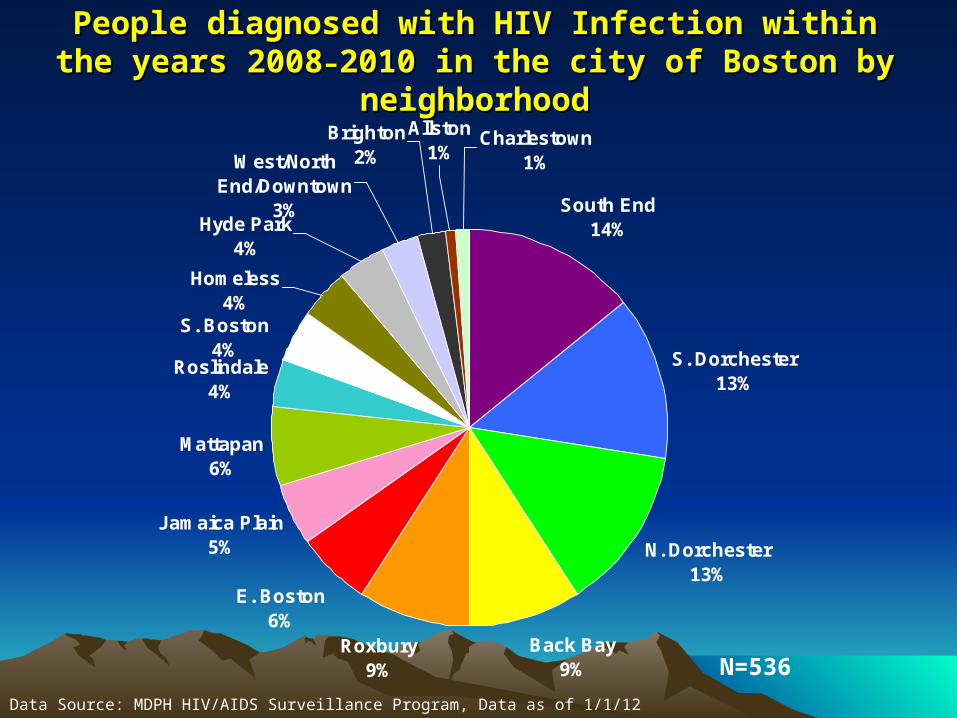
People diagnosed with HIV Infection within the years 2008People diagnosed with HIV Infection within the years 2008––
2010 in the city of Boston by neighborhood2010 in the city of Boston by neighborhood
N. Dorchester13%
Back Bay9%
Roxbury9%
E. Boston6%
Jamaica Plain5%
Mattapan6%
Roslindale4%
S. Dorchester13%
South End14%
Brighton2%
Allston1%
Charlestown1%
S. Boston4%
Hyde Park4%
West/North End/Downtown
3%
Homeless4%
Data Source: MDPH HIV/AIDS Surveillance Program, Data as of 1/1/12
N=536
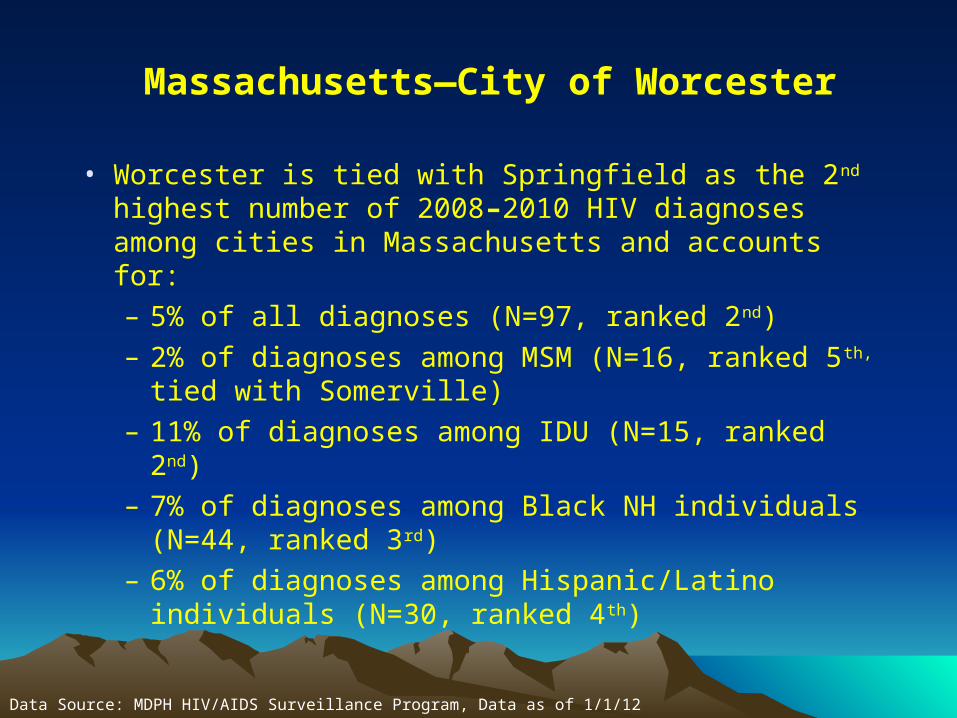
Massachusetts—City of Worcester
• Worcester is tied with Springfield as the 2nd highest number of 2008–2010 HIV diagnoses among cities in Massachusetts and accounts for:
– 5% of all diagnoses (N=97, ranked 2nd)
– 2% of diagnoses among MSM (N=16, ranked 5th, tied with Somerville)
– 11% of diagnoses among IDU (N=15, ranked 2nd)
– 7% of diagnoses among Black NH individuals (N=44, ranked 3rd)
– 6% of diagnoses among Hispanic/Latino individuals (N=30, ranked 4th)
Data Source: MDPH HIV/AIDS Surveillance Program, Data as of 1/1/12
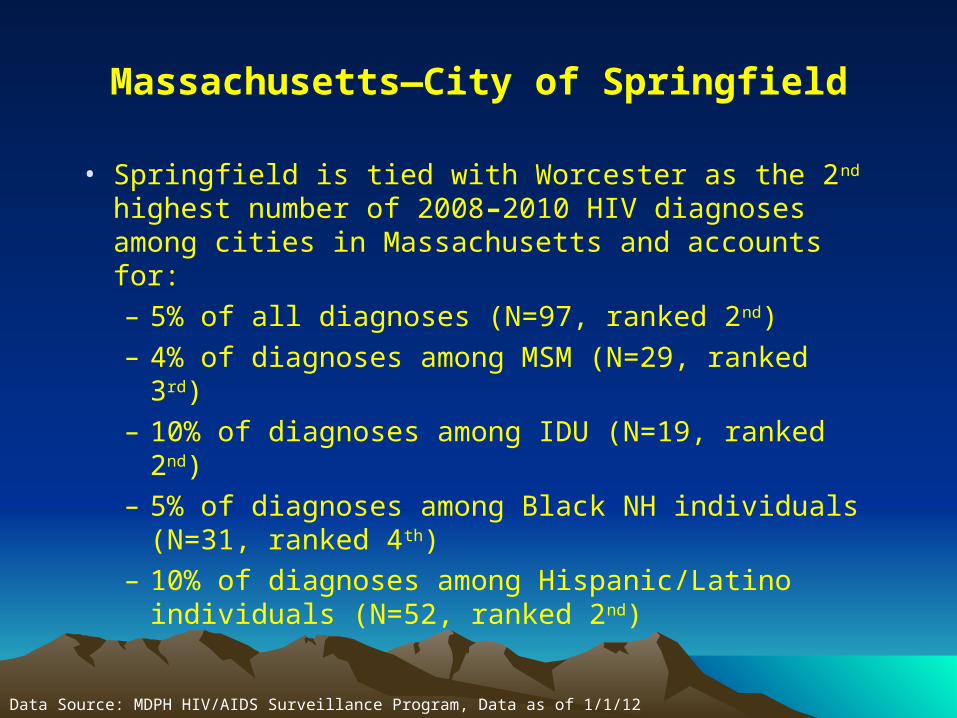
Massachusetts—City of Springfield
• Springfield is tied with Worcester as the 2nd highest number of 2008–2010 HIV diagnoses among cities in Massachusetts and accounts for:
– 5% of all diagnoses (N=97, ranked 2nd)
– 4% of diagnoses among MSM (N=29, ranked 3rd)
– 10% of diagnoses among IDU (N=19, ranked 2nd)
– 5% of diagnoses among Black NH individuals (N=31, ranked 4th)
– 10% of diagnoses among Hispanic/Latino individuals (N=52, ranked 2nd)
Data Source: MDPH HIV/AIDS Surveillance Program, Data as of 1/1/12
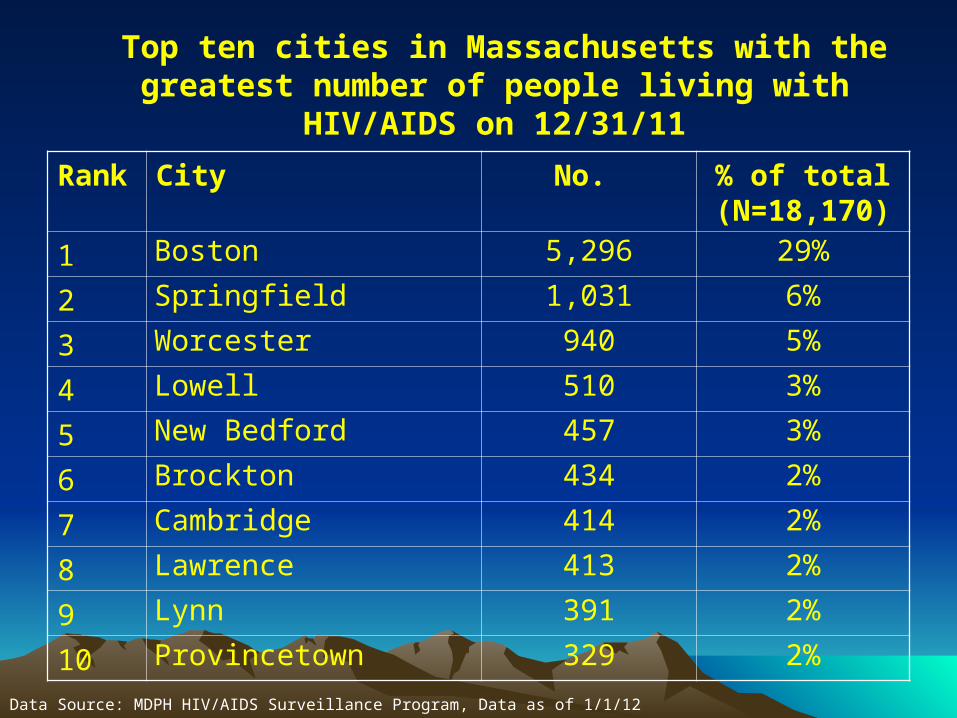
Top ten cities in Massachusetts with the greatest number of people living with HIV/AIDS on 12/31/11
Rank City No. % of total (N=18,170)
1 Boston 5,296 29%
2 Springfield 1,031 6%
3 Worcester 940 5%
4 Lowell 510 3%
5 New Bedford 457 3%
6 Brockton 434 2%
7 Cambridge 414 2%
8 Lawrence 413 2%
9 Lynn 391 2%
10 Provincetown 329 2%
Data Source: MDPH HIV/AIDS Surveillance Program, Data as of 1/1/12

Hepatitis C OverviewMassachusetts
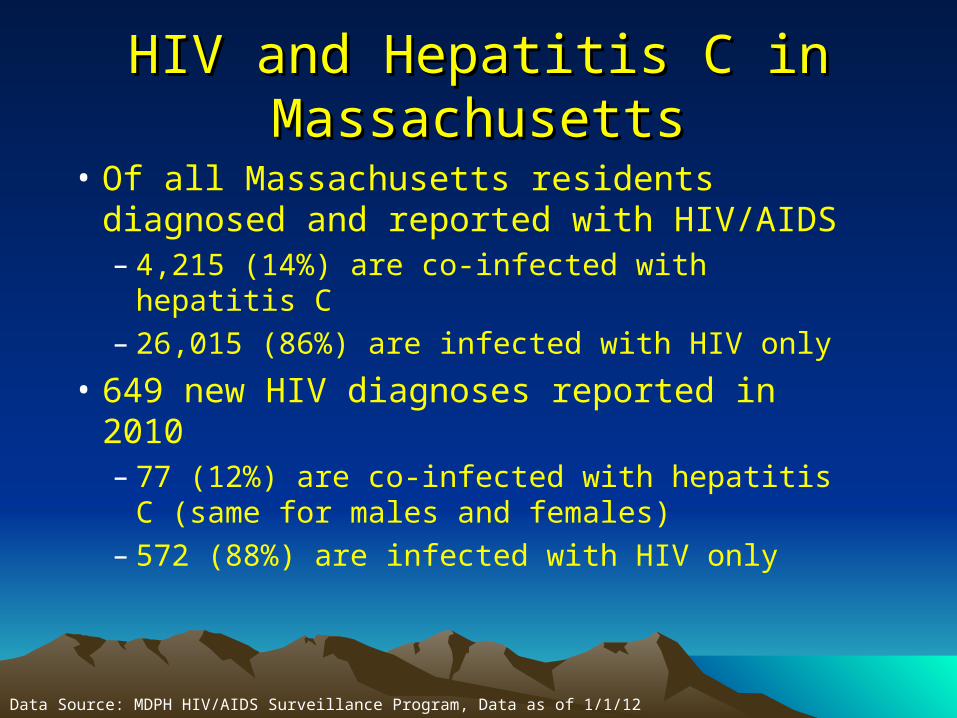
HIV and Hepatitis C in MassachusettsHIV and Hepatitis C in Massachusetts
• Of all Massachusetts residents diagnosed and reported with HIV/AIDS– 4,215 (14%) are co-infected with hepatitis C– 26,015 (86%) are infected with HIV only
• 649 new HIV diagnoses reported in 2010– 77 (12%) are co-infected with hepatitis C (same
for males and females)– 572 (88%) are infected with HIV only
Data Source: MDPH HIV/AIDS Surveillance Program, Data as of 1/1/12
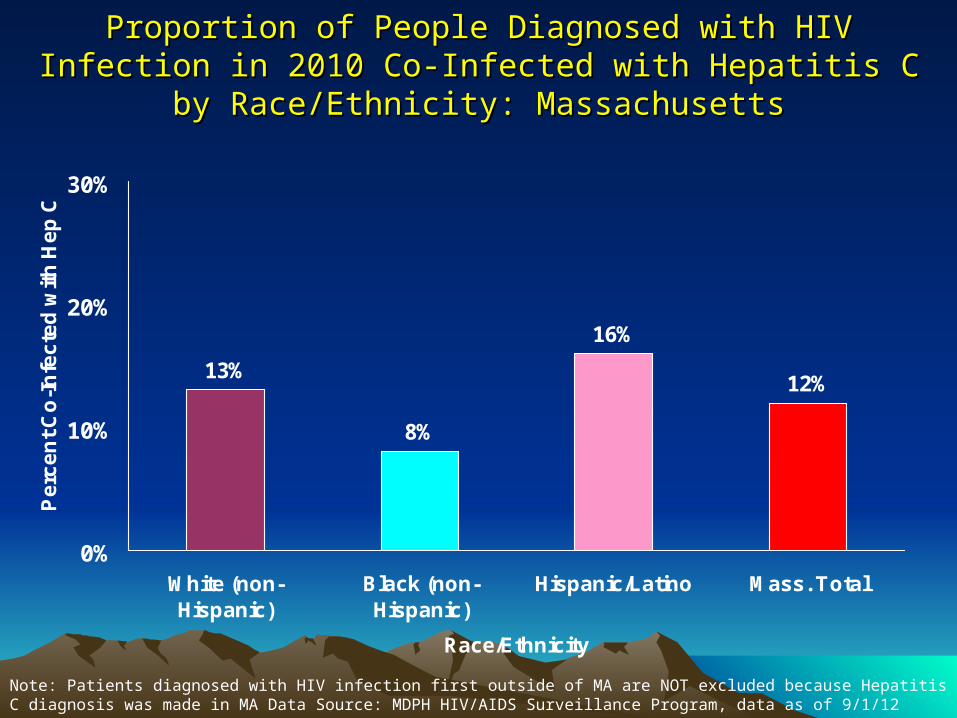
Proportion of People Diagnosed with HIV Infection in 2010 Co-Infected Proportion of People Diagnosed with HIV Infection in 2010 Co-Infected with Hepatitis C by Race/Ethnicity: Massachusettswith Hepatitis C by Race/Ethnicity: Massachusetts
13%
8%
16%
12%
0%
10%
20%
30%
White (non-Hispanic)
Black (non-Hispanic)
Hispanic/Latino Mass. Total
Race/Ethnicity
Pe
rce
nt
Co
-In
fec
ted
wit
h H
ep
C
Note: Patients diagnosed with HIV infection first outside of MA are NOT excluded because Hepatitis C diagnosis was made in MA Data Source: MDPH HIV/AIDS Surveillance Program, data as of 9/1/12
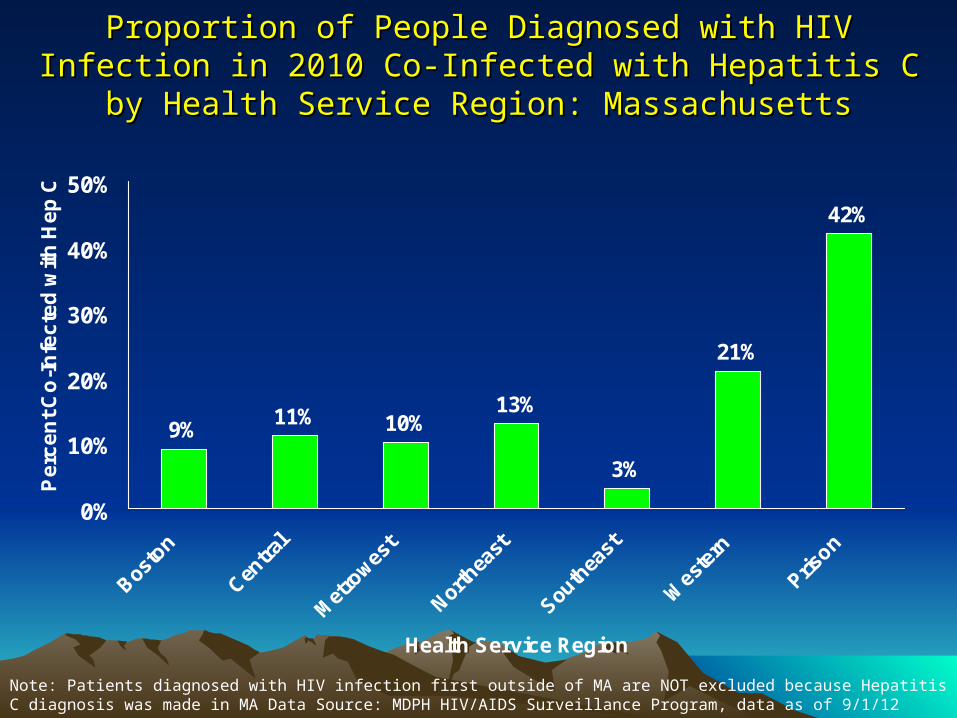
Proportion of People Diagnosed with HIV Infection in 2010 Co-Infected Proportion of People Diagnosed with HIV Infection in 2010 Co-Infected with Hepatitis C by Health Service Region: Massachusettswith Hepatitis C by Health Service Region: Massachusetts
9%11% 10%
13%
3%
21%
42%
0%
10%
20%
30%
40%
50%
Bosto
n
Centra
l
Met
rowes
t
North
east
South
east
Wes
tern
Prison
Health Service Region
Pe
rce
nt
Co
-In
fec
ted
wit
h H
ep
C
Note: Patients diagnosed with HIV infection first outside of MA are NOT excluded because Hepatitis C diagnosis was made in MA Data Source: MDPH HIV/AIDS Surveillance Program, data as of 9/1/12
HIV/AIDS Epidemiology of Emerging Populations — MSM and Women
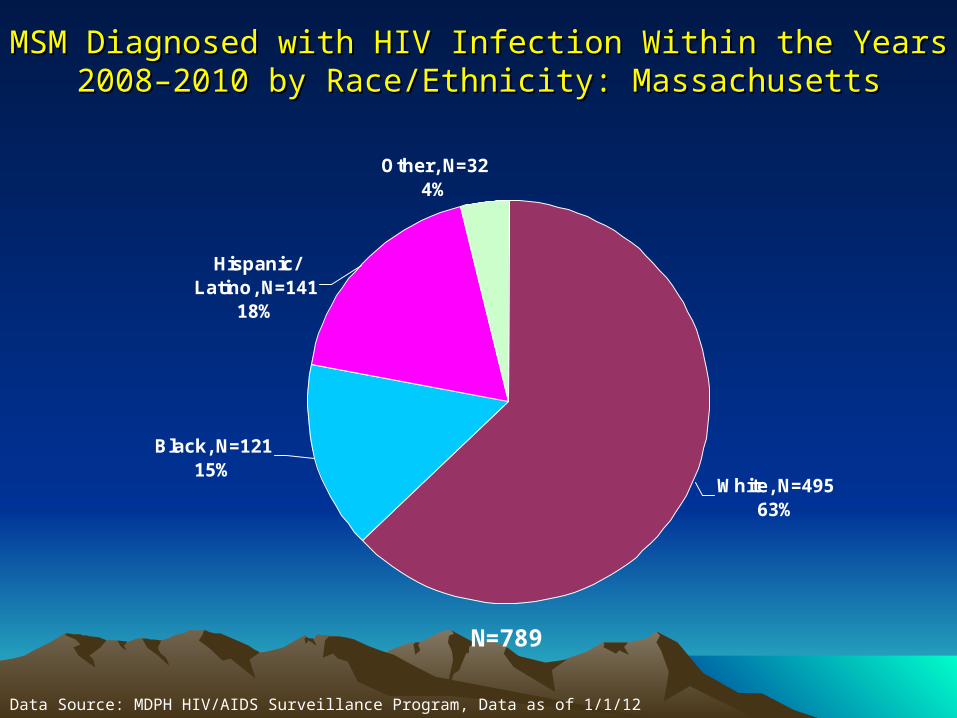
MSM Diagnosed with HIV Infection Within the Years 2008–2010 by MSM Diagnosed with HIV Infection Within the Years 2008–2010 by Race/Ethnicity: MassachusettsRace/Ethnicity: Massachusetts
White, N=49563%
Hispanic/Latino, N=141
18%
Other, N=324%
Black, N=12115%
Data Source: MDPH HIV/AIDS Surveillance Program, Data as of 1/1/12
N=789
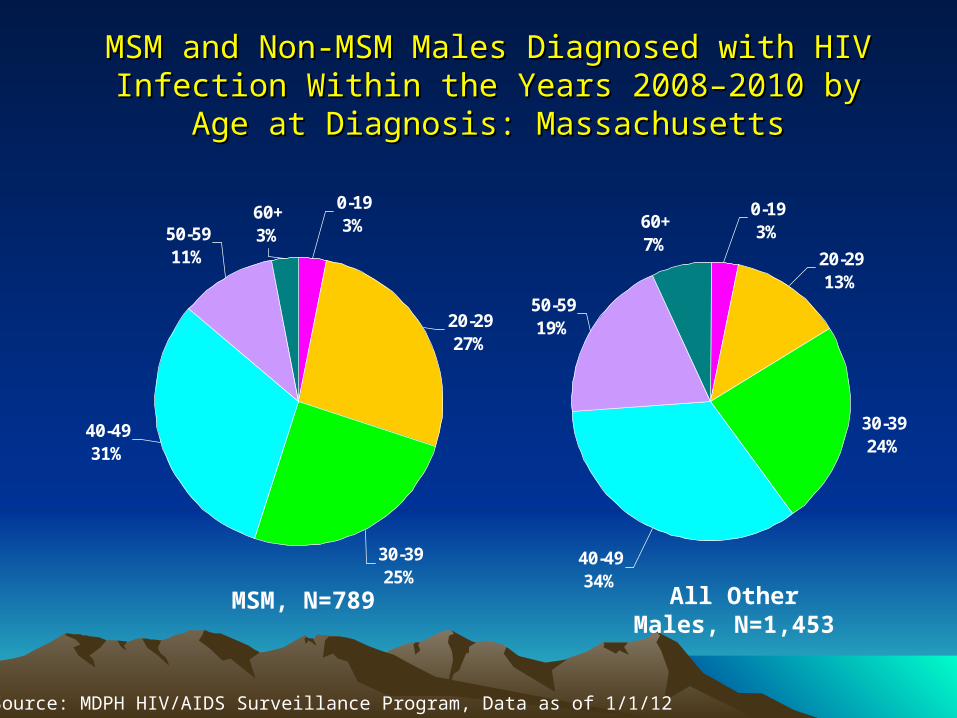
40-4934%
50-5919%
60+7%
0-193%
20-2913%
30-3924%
Data Source: MDPH HIV/AIDS Surveillance Program, Data as of 1/1/12
MSM and Non-MSM Males Diagnosed with HIV Infection MSM and Non-MSM Males Diagnosed with HIV Infection Within the Years 2008–2010 by Age at Diagnosis: Within the Years 2008–2010 by Age at Diagnosis:
MassachusettsMassachusetts
40-4931%
50-5911%
60+3%
0-193%
20-2927%
30-3925%
MSM, N=789 All Other Males, N=1,453
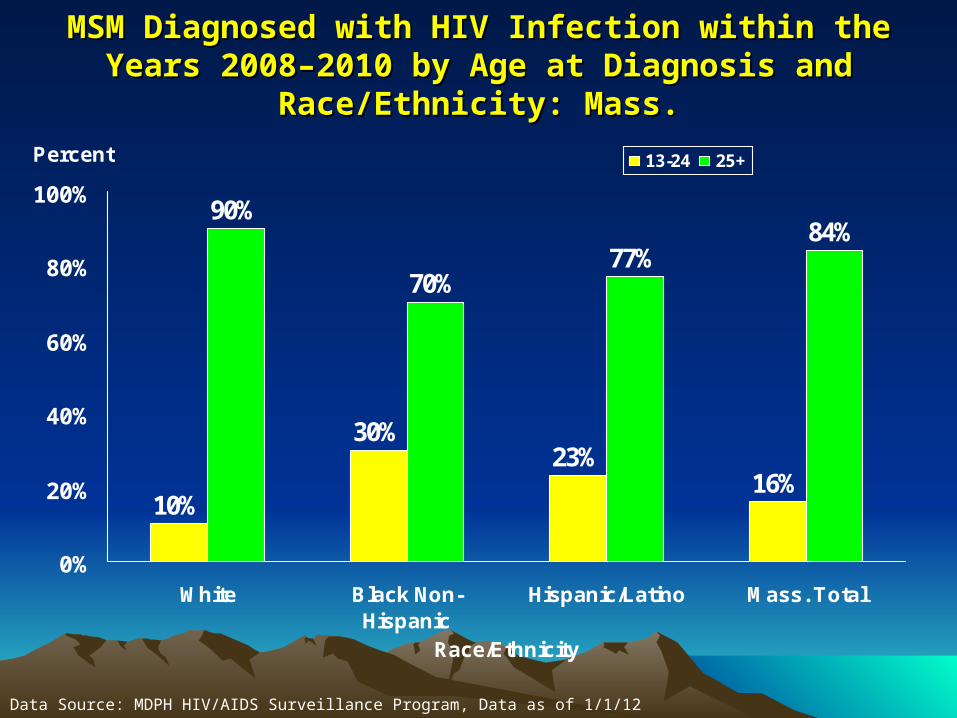
MSM Diagnosed with HIV Infection within the Years 2008–2010 by MSM Diagnosed with HIV Infection within the Years 2008–2010 by Age at Diagnosis and Race/Ethnicity: Mass.Age at Diagnosis and Race/Ethnicity: Mass.
10%
30%23%
16%
90%
70%77%
84%
0%
20%
40%
60%
80%
100%
White Black Non-Hispanic
Hispanic/Latino Mass. Total
Race/Ethnicity
Percent 13-24 25+
Data Source: MDPH HIV/AIDS Surveillance Program, Data as of 1/1/12
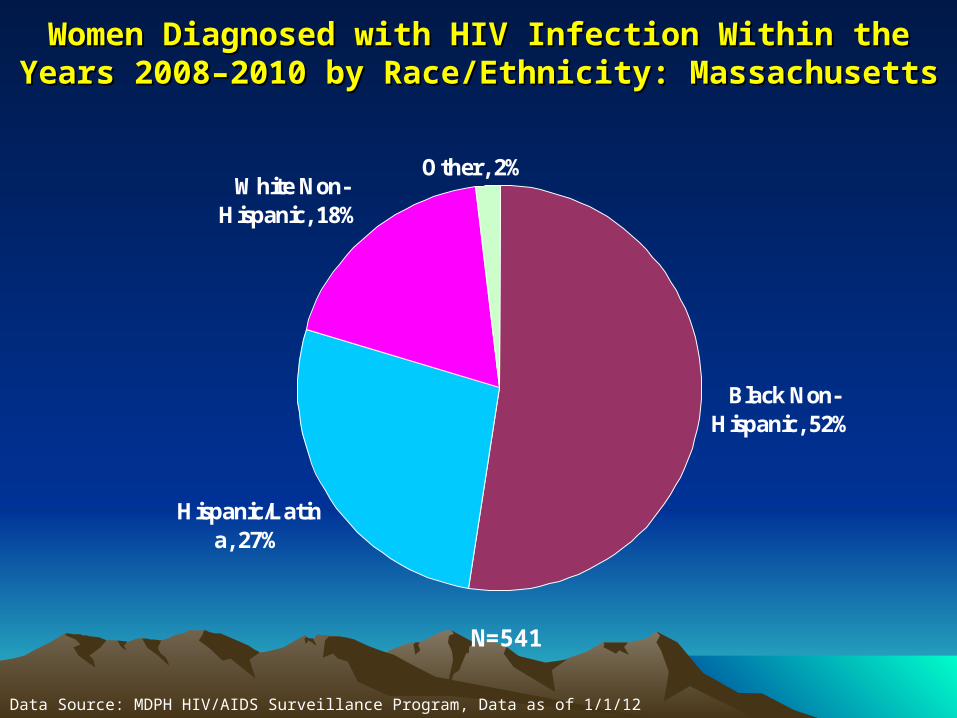
Women Diagnosed with HIV Infection Within the Years 2008–2010 Women Diagnosed with HIV Infection Within the Years 2008–2010 by Race/Ethnicity: Massachusettsby Race/Ethnicity: Massachusetts
Black Non-Hispanic, 52%
Hispanic/Latina, 27%
White Non-Hispanic, 18%
Other, 2%
Data Source: MDPH HIV/AIDS Surveillance Program, Data as of 1/1/12
N=541
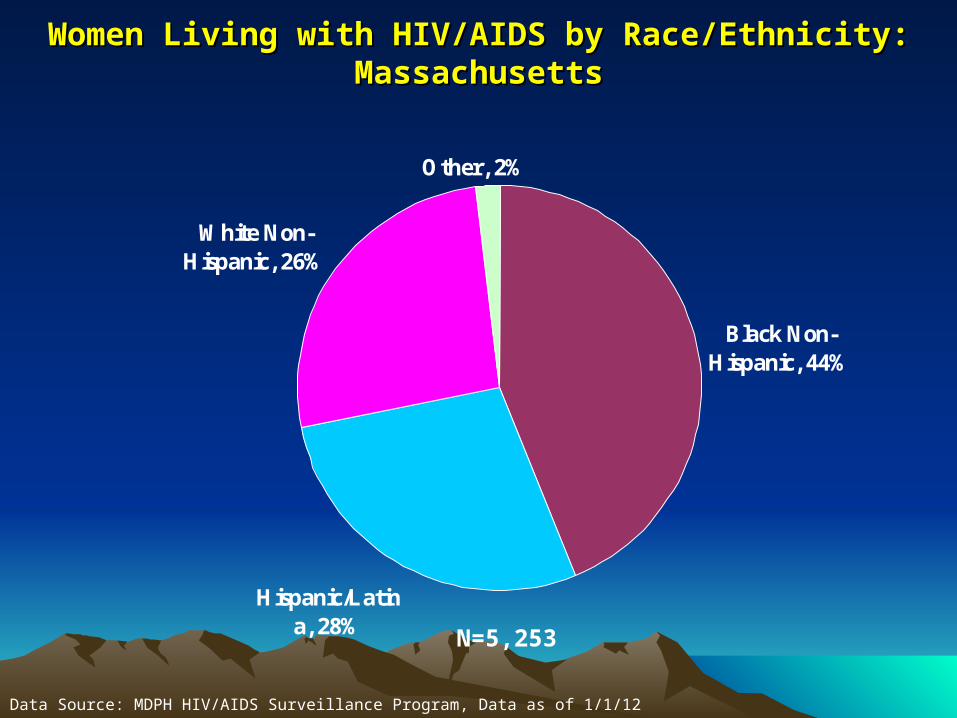
Women Living with HIV/AIDS by Race/Ethnicity: MassachusettsWomen Living with HIV/AIDS by Race/Ethnicity: Massachusetts
Black Non-Hispanic, 44%
Hispanic/Latina, 28%
White Non-Hispanic, 26%
Other, 2%
Data Source: MDPH HIV/AIDS Surveillance Program, Data as of 1/1/12
N=5,253
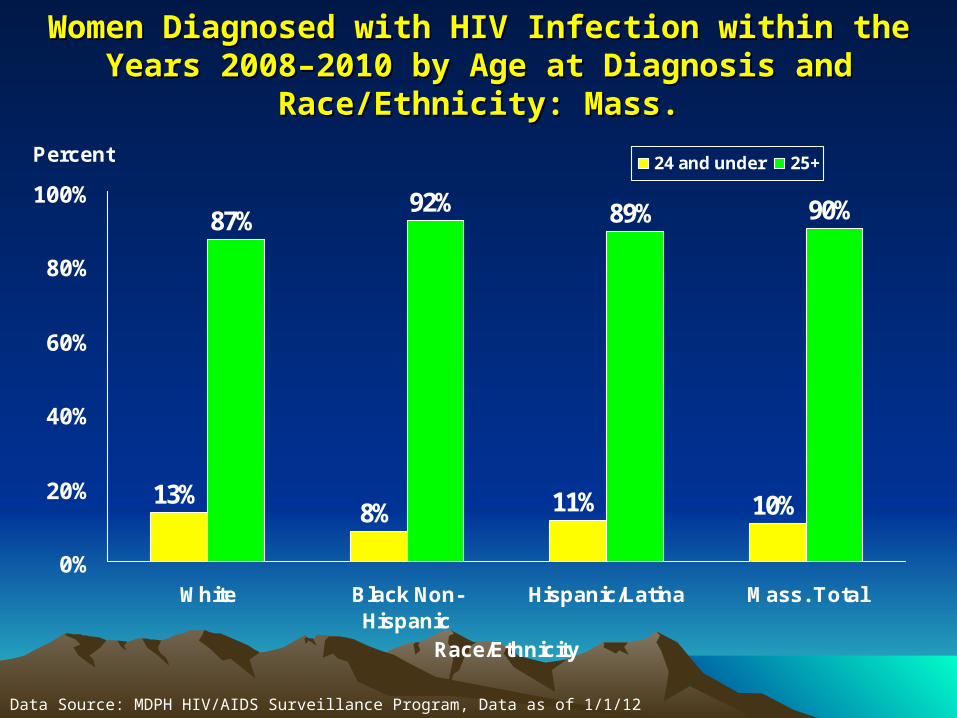
Women Diagnosed with HIV Infection within the Years 2008–2010 Women Diagnosed with HIV Infection within the Years 2008–2010 by Age at Diagnosis and Race/Ethnicity: Mass.by Age at Diagnosis and Race/Ethnicity: Mass.
13%8% 11% 10%
87%92% 89% 90%
0%
20%
40%
60%
80%
100%
White Black Non-Hispanic
Hispanic/Latina Mass. Total
Race/Ethnicity
Percent24 and under 25+
Data Source: MDPH HIV/AIDS Surveillance Program, Data as of 1/1/12

Fiscal ProjectionsState Fiscal Year 2014
05
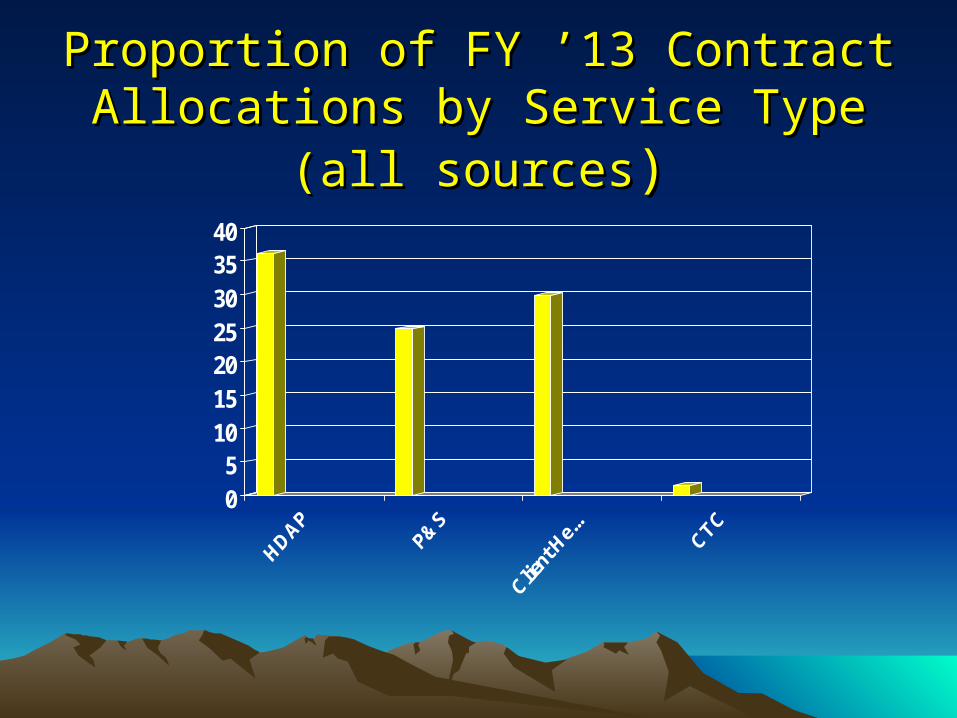
10152025303540
Proportion of FY ’13 Contract Allocations Proportion of FY ’13 Contract Allocations by Service Type (all sourcesby Service Type (all sources))
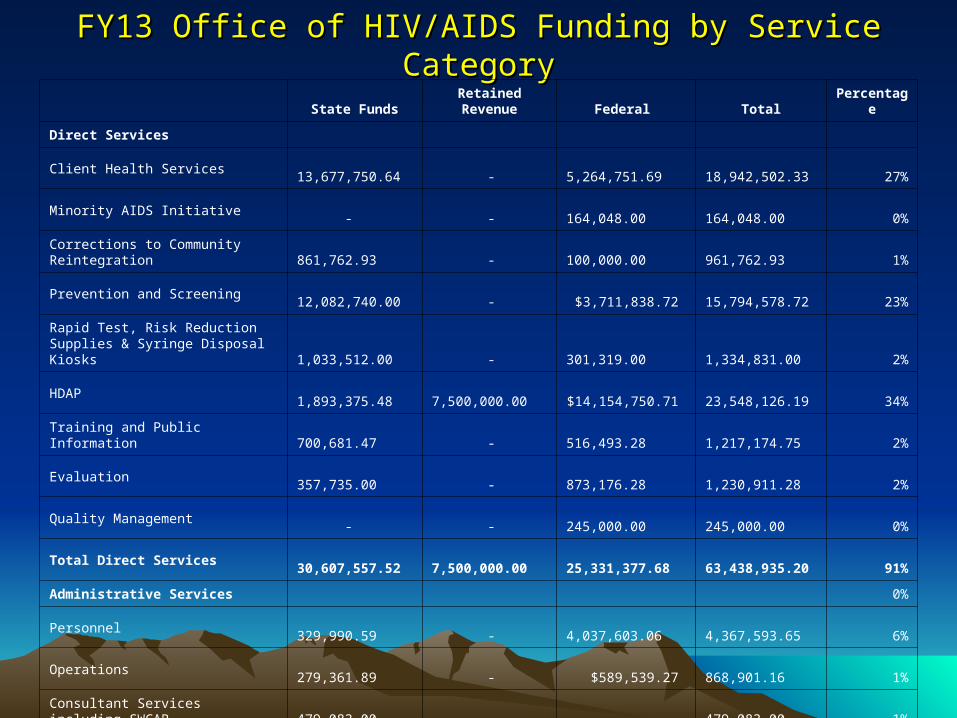
FY13 Office of HIV/AIDS Funding by Service CategoryFY13 Office of HIV/AIDS Funding by Service Category
State Funds Retained Revenue Federal Total Percentage
Direct Services
Client Health Services 13,677,750.64 - 5,264,751.69 18,942,502.33 27%
Minority AIDS Initiative - - 164,048.00 164,048.00 0%
Corrections to Community Reintegration 861,762.93 - 100,000.00 961,762.93 1%
Prevention and Screening 12,082,740.00 - $3,711,838.72 15,794,578.72 23%
Rapid Test, Risk Reduction Supplies & Syringe Disposal Kiosks 1,033,512.00 - 301,319.00 1,334,831.00 2%
HDAP 1,893,375.48 7,500,000.00 $14,154,750.71 23,548,126.19 34%
Training and Public Information 700,681.47 - 516,493.28 1,217,174.75 2%
Evaluation 357,735.00 - 873,176.28 1,230,911.28 2%
Quality Management - - 245,000.00 245,000.00 0%
Total Direct Services 30,607,557.52 7,500,000.00 25,331,377.68 63,438,935.20 91%
Administrative Services 0%
Personnel 329,990.59 - 4,037,603.06 4,367,593.65 6%
Operations 279,361.89 - $589,539.27 868,901.16 1%
Consultant Services including SWCAB 479,083.00 - - 479,083.00 1%
Other Department Support 405,030.00 - - 405,030.00 1%
Total Administrative Services 1,493,465.48 - 4,627,142.33 6,120,607.81 9%
Total Funding 32,101,023.00 7,500,000.00 29,958,520.00 69,559,543.00 100%
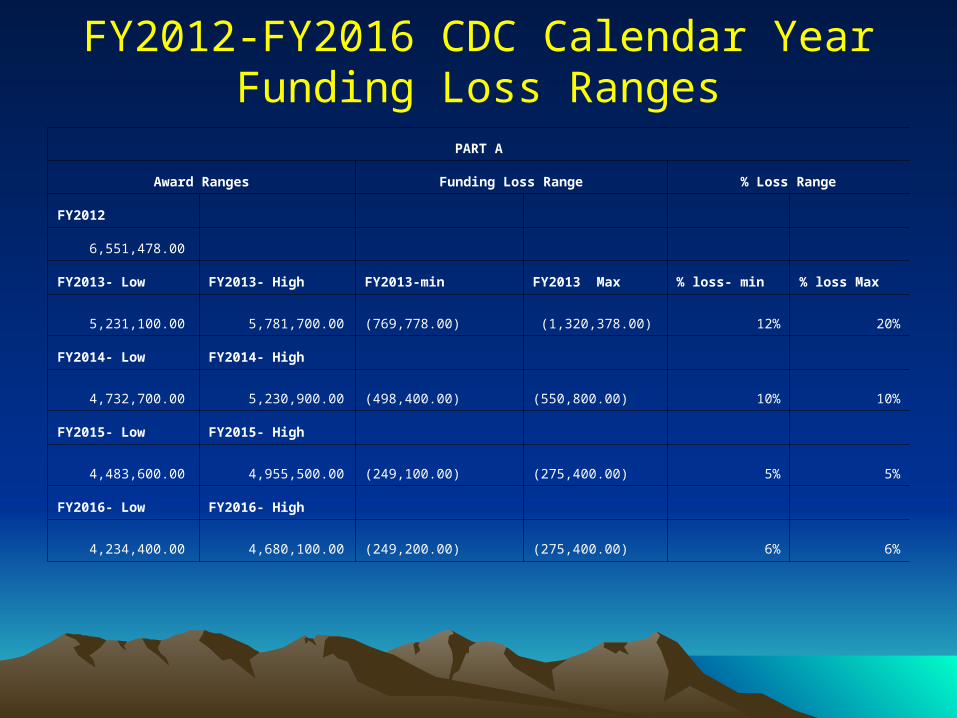
FY2012-FY2016 CDC Calendar Year Funding Loss Ranges
PART A
Award Ranges Funding Loss Range % Loss Range
FY2012
6,551,478.00
FY2013- Low FY2013- High FY2013-min FY2013 Max % loss- min % loss Max
5,231,100.00 5,781,700.00 (769,778.00) (1,320,378.00) 12% 20%
FY2014- Low FY2014- High
4,732,700.00 5,230,900.00 (498,400.00) (550,800.00) 10% 10%
FY2015- Low FY2015- High
4,483,600.00 4,955,500.00 (249,100.00) (275,400.00) 5% 5%
FY2016- Low FY2016- High
4,234,400.00 4,680,100.00 (249,200.00) (275,400.00) 6% 6%
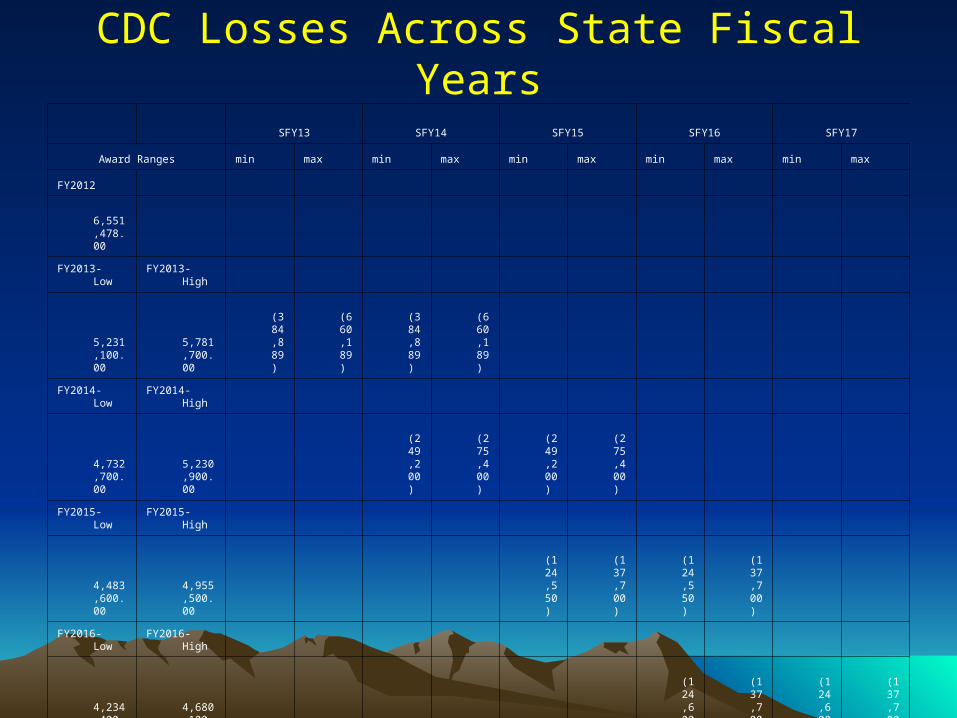
CDC Losses Across State Fiscal Years
SFY13 SFY14 SFY15 SFY16 SFY17
Award Ranges min max min max min max min max min max
FY2012
6,551,478.00
FY2013- Low FY2013- High
5,231,100.00 5,781,700.00 (384,889) (660,189) (384,889) (660,189)
FY2014- Low FY2014- High
4,732,700.00 5,230,900.00 (249,200) (275,400) (249,200) (275,400)
FY2015- Low FY2015- High
4,483,600.00 4,955,500.00 (124,550) (137,700) (124,550) (137,700)
FY2016- Low FY2016- High
4,234,400.00 4,680,100.00 (124,600) (137,700) (124,600) (137,700)
(384,889) (660,189) (634,089) (935,589) (373,750) (413,100) (249,150) (275,400) (124,600) (137,700)
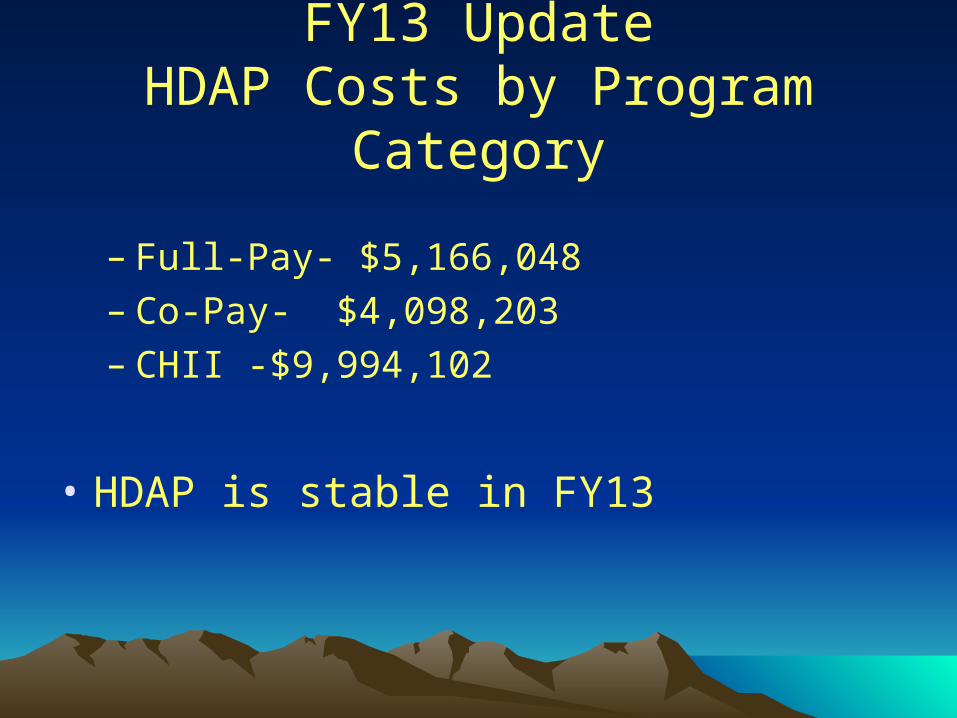
FY13 UpdateHDAP Costs by Program Category
– Full-Pay- $5,166,048– Co-Pay- $4,098,203– CHII -$9,994,102
• HDAP is stable in FY13
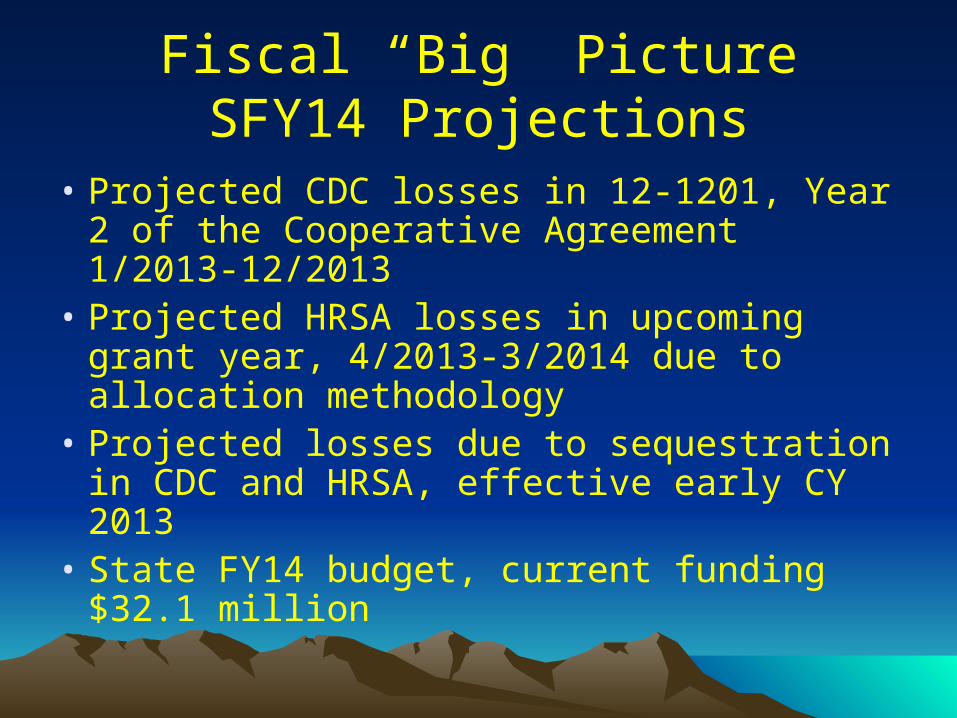
Fiscal “Big” PictureSFY14 Projections
• Projected CDC losses in 12-1201, Year 2 of the Cooperative Agreement 1/2013-12/2013
• Projected HRSA losses in upcoming grant year, 4/2013-3/2014 due to allocation methodology
• Projected losses due to sequestration in CDC and HRSA, effective early CY 2013
• State FY14 budget, current funding $32.1 million
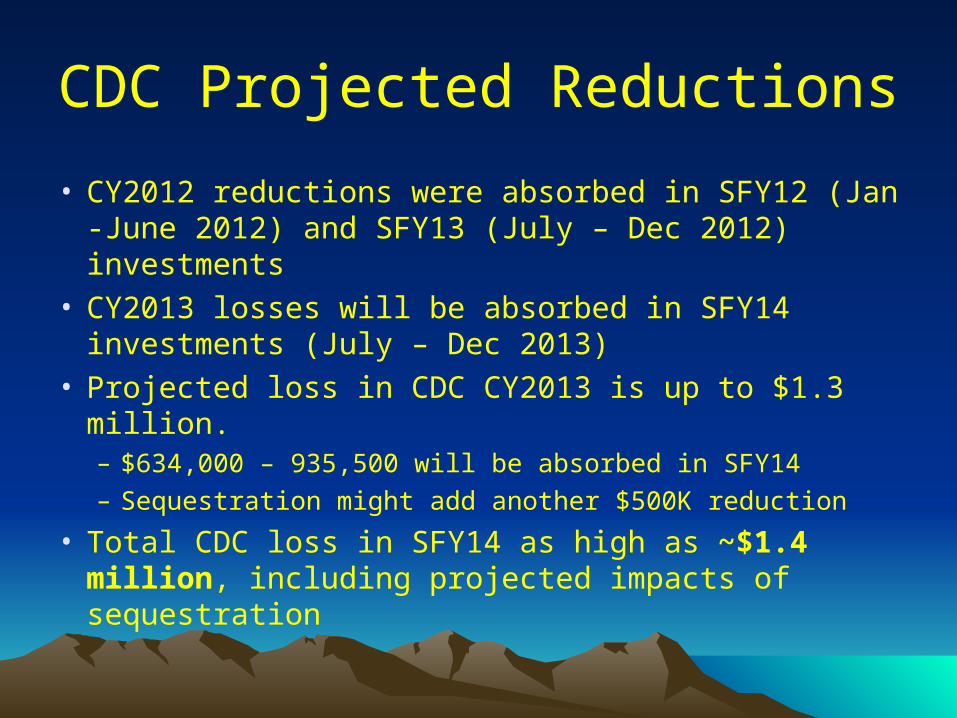
CDC Projected Reductions
• CY2012 reductions were absorbed in SFY12 (Jan -June 2012) and SFY13 (July – Dec 2012) investments
• CY2013 losses will be absorbed in SFY14 investments (July – Dec 2013)
• Projected loss in CDC CY2013 is up to $1.3 million. – $634,000 – 935,500 will be absorbed in SFY14
– Sequestration might add another $500K reduction
• Total CDC loss in SFY14 as high as ~$1.4 million, including projected impacts of sequestration
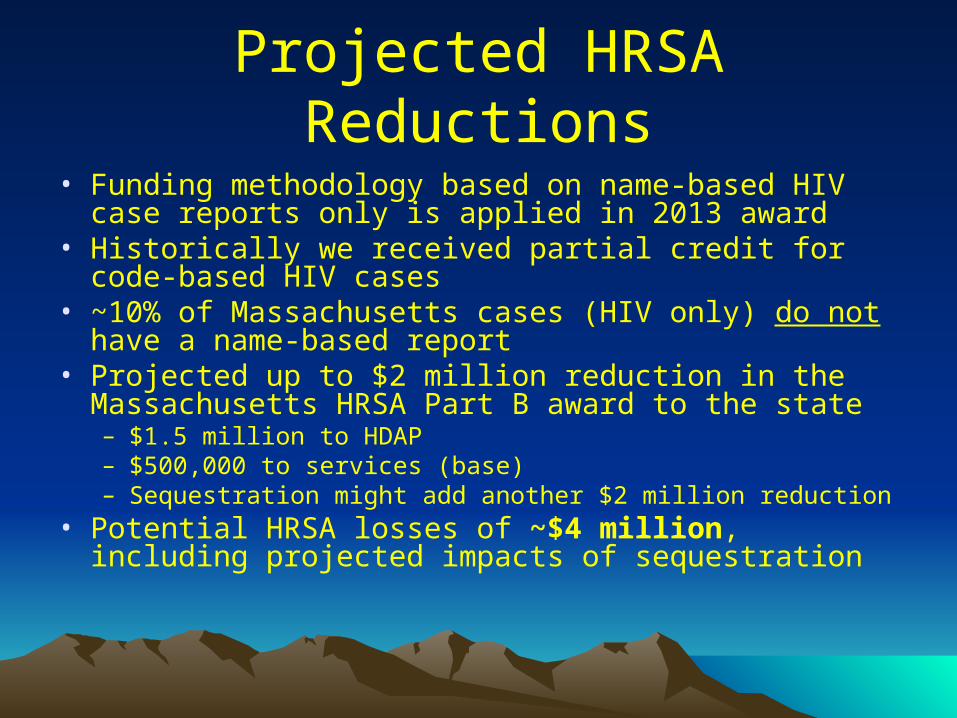
Projected HRSA Reductions
• Funding methodology based on name-based HIV case reports only is applied in 2013 award
• Historically we received partial credit for code-based HIV cases
• ~10% of Massachusetts cases (HIV only) do not have a name-based report
• Projected up to $2 million reduction in the Massachusetts HRSA Part B award to the state– $1.5 million to HDAP– $500,000 to services (base)– Sequestration might add another $2 million reduction
• Potential HRSA losses of ~$4 million, including projected impacts of sequestration
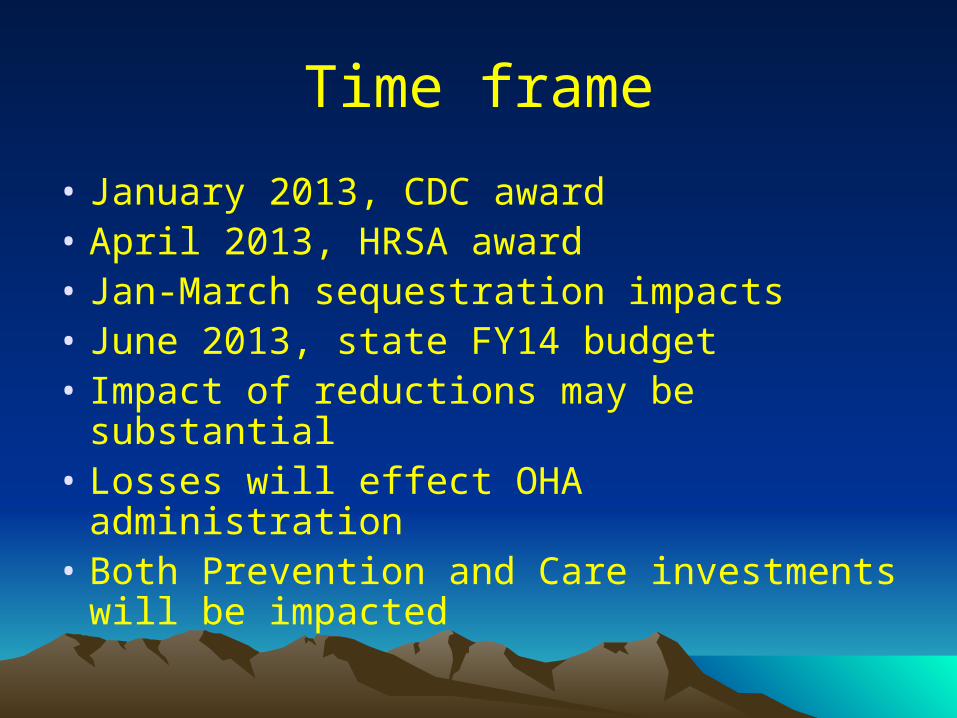
Time frame
• January 2013, CDC award• April 2013, HRSA award• Jan-March sequestration impacts• June 2013, state FY14 budget • Impact of reductions may be substantial • Losses will effect OHA administration • Both Prevention and Care investments will be
impacted

Thank youThank you
H. Dawn FukudaH. Dawn FukudaOffice of HIV/AIDSOffice of HIV/AIDS
[email protected](617) 624-5303(617) 624-5303