p MOBILITY AND THE SHARING ECONOMY: IMPACTS...
4
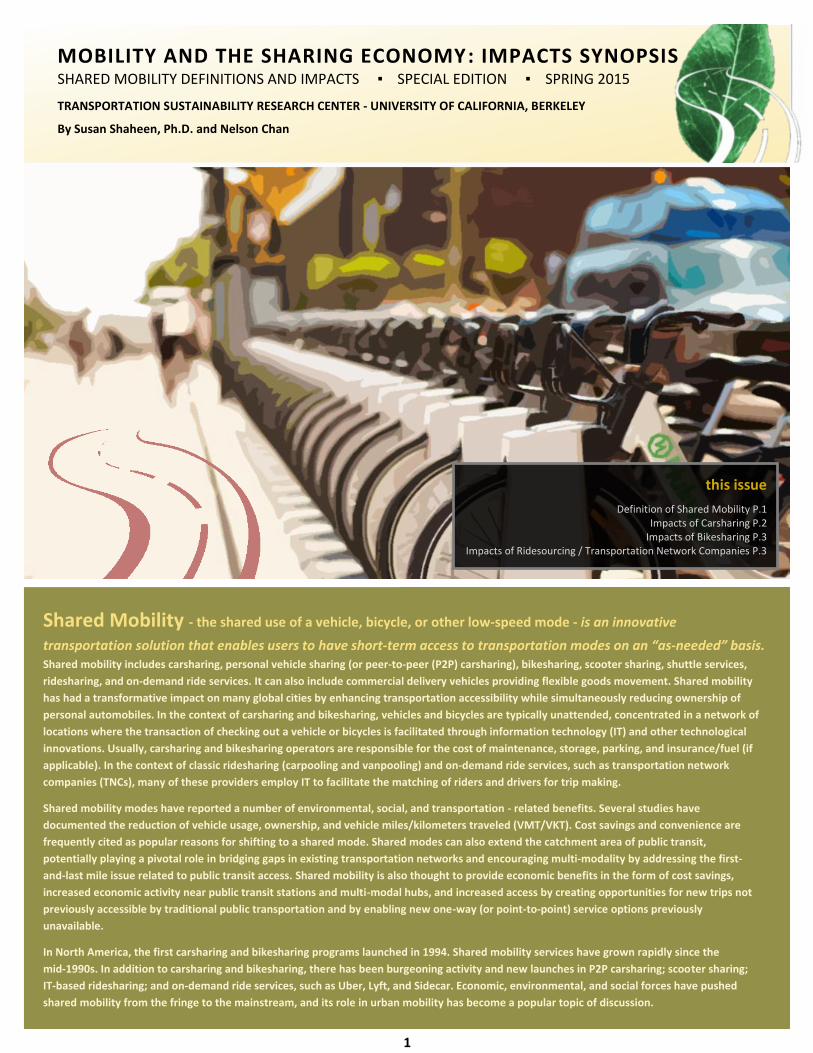
MOBILITY AND THE SHARING ECONOMY: IMPACTS SYNOPSIS SHARED MOBILITY DEFINITIONS AND IMPACTS ▪ SPECIAL EDITION ▪ SPRING 2015 TRANSPORTATION SUSTAINABILITY RESEARCH CENTER - UNIVERSITY OF CALIFORNIA, BERKELEY By Susan Shaheen, Ph.D. and Nelson Chan this issue Definition of Shared Mobility P.1 Impacts of Carsharing P.2 Impacts of Bikesharing P.3 Impacts of Ridesourcing / Transportation Network Companies P.3 1 Shared Mobility - the shared use of a vehicle, bicycle, or other low-speed mode - is an innovative transportation solution that enables users to have short-term access to transportation modes on an “as-needed” basis. Shared mobility includes carsharing, personal vehicle sharing (or peer-to-peer (P2P) carsharing), bikesharing, scooter sharing, shuttle services, ridesharing, and on-demand ride services. It can also include commercial delivery vehicles providing flexible goods movement. Shared mobility has had a transformative impact on many global cities by enhancing transportation accessibility while simultaneously reducing ownership of personal automobiles. In the context of carsharing and bikesharing, vehicles and bicycles are typically unattended, concentrated in a network of locations where the transaction of checking out a vehicle or bicycles is facilitated through information technology (IT) and other technological innovations. Usually, carsharing and bikesharing operators are responsible for the cost of maintenance, storage, parking, and insurance/fuel (if applicable). In the context of classic ridesharing (carpooling and vanpooling) and on-demand ride services, such as transportation network companies (TNCs), many of these providers employ IT to facilitate the matching of riders and drivers for trip making. Shared mobility modes have reported a number of environmental, social, and transportation - related benefits. Several studies have documented the reduction of vehicle usage, ownership, and vehicle miles/kilometers traveled (VMT/VKT). Cost savings and convenience are frequently cited as popular reasons for shifting to a shared mode. Shared modes can also extend the catchment area of public transit, potentially playing a pivotal role in bridging gaps in existing transportation networks and encouraging multi-modality by addressing the first- and-last mile issue related to public transit access. Shared mobility is also thought to provide economic benefits in the form of cost savings, increased economic activity near public transit stations and multi-modal hubs, and increased access by creating opportunities for new trips not previously accessible by traditional public transportation and by enabling new one-way (or point-to-point) service options previously unavailable. In North America, the first carsharing and bikesharing programs launched in 1994. Shared mobility services have grown rapidly since the mid-1990s. In addition to carsharing and bikesharing, there has been burgeoning activity and new launches in P2P carsharing; scooter sharing; IT-based ridesharing; and on-demand ride services, such as Uber, Lyft, and Sidecar. Economic, environmental, and social forces have pushed shared mobility from the fringe to the mainstream, and its role in urban mobility has become a popular topic of discussion.
Transcript of p MOBILITY AND THE SHARING ECONOMY: IMPACTS...
p
MOBILITY AND THE SHARING ECONOMY: IMPACTS SYNOPSIS SHARED MOBILITY DEFINITIONS AND IMPACTS ▪ SPECIAL EDITION ▪ SPRING 2015
TRANSPORTATION SUSTAINABILITY RESEARCH CENTER - UNIVERSITY OF CALIFORNIA, BERKELEY
By Susan Shaheen, Ph.D. and Nelson Chan
this issue
Definition of Shared Mobility P.1 Impacts of Carsharing P.2
Impacts of Bikesharing P.3 Impacts of Ridesourcing / Transportation Network Companies P.3
1
Shared Mobility - the shared use of a vehicle, bicycle, or other low-speed mode - is an innovative
transportation solution that enables users to have short-term access to transportation modes on an “as-needed” basis. Shared mobility includes carsharing, personal vehicle sharing (or peer-to-peer (P2P) carsharing), bikesharing, scooter sharing, shuttle services,
ridesharing, and on-demand ride services. It can also include commercial delivery vehicles providing flexible goods movement. Shared mobility
has had a transformative impact on many global cities by enhancing transportation accessibility while simultaneously reducing ownership of
personal automobiles. In the context of carsharing and bikesharing, vehicles and bicycles are typically unattended, concentrated in a network of
locations where the transaction of checking out a vehicle or bicycles is facilitated through information technology (IT) and other technological
innovations. Usually, carsharing and bikesharing operators are responsible for the cost of maintenance, storage, parking, and insurance/fuel (if
applicable). In the context of classic ridesharing (carpooling and vanpooling) and on-demand ride services, such as transportation network
companies (TNCs), many of these providers employ IT to facilitate the matching of riders and drivers for trip making.
Shared mobility modes have reported a number of environmental, social, and transportation - related benefits. Several studies have
documented the reduction of vehicle usage, ownership, and vehicle miles/kilometers traveled (VMT/VKT). Cost savings and convenience are
frequently cited as popular reasons for shifting to a shared mode. Shared modes can also extend the catchment area of public transit,
potentially playing a pivotal role in bridging gaps in existing transportation networks and encouraging multi-modality by addressing the first-
and-last mile issue related to public transit access. Shared mobility is also thought to provide economic benefits in the form of cost savings,
increased economic activity near public transit stations and multi-modal hubs, and increased access by creating opportunities for new trips not
previously accessible by traditional public transportation and by enabling new one-way (or point-to-point) service options previously
unavailable.
In North America, the first carsharing and bikesharing programs launched in 1994. Shared mobility services have grown rapidly since the
mid-1990s. In addition to carsharing and bikesharing, there has been burgeoning activity and new launches in P2P carsharing; scooter sharing;
IT-based ridesharing; and on-demand ride services, such as Uber, Lyft, and Sidecar. Economic, environmental, and social forces have pushed
shared mobility from the fringe to the mainstream, and its role in urban mobility has become a popular topic of discussion.
2
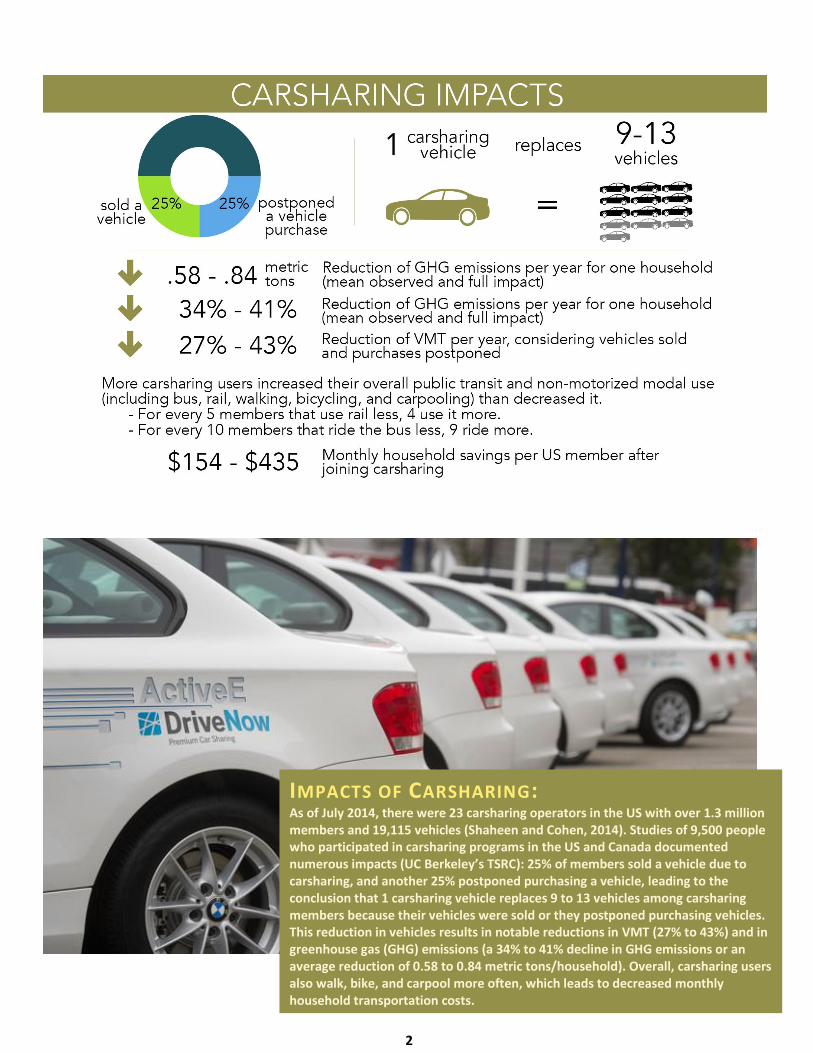
IMPACTS OF CARSHARING: As of July 2014, there were 23 carsharing operators in the US with over 1.3 million members and 19,115 vehicles (Shaheen and Cohen, 2014). Studies of 9,500 people who participated in carsharing programs in the US and Canada documented numerous impacts (UC Berkeley’s TSRC): 25% of members sold a vehicle due to carsharing, and another 25% postponed purchasing a vehicle, leading to the conclusion that 1 carsharing vehicle replaces 9 to 13 vehicles among carsharing members because their vehicles were sold or they postponed purchasing vehicles. This reduction in vehicles results in notable reductions in VMT (27% to 43%) and in greenhouse gas (GHG) emissions (a 34% to 41% decline in GHG emissions or an average reduction of 0.58 to 0.84 metric tons/household). Overall, carsharing users also walk, bike, and carpool more often, which leads to decreased monthly household transportation costs.
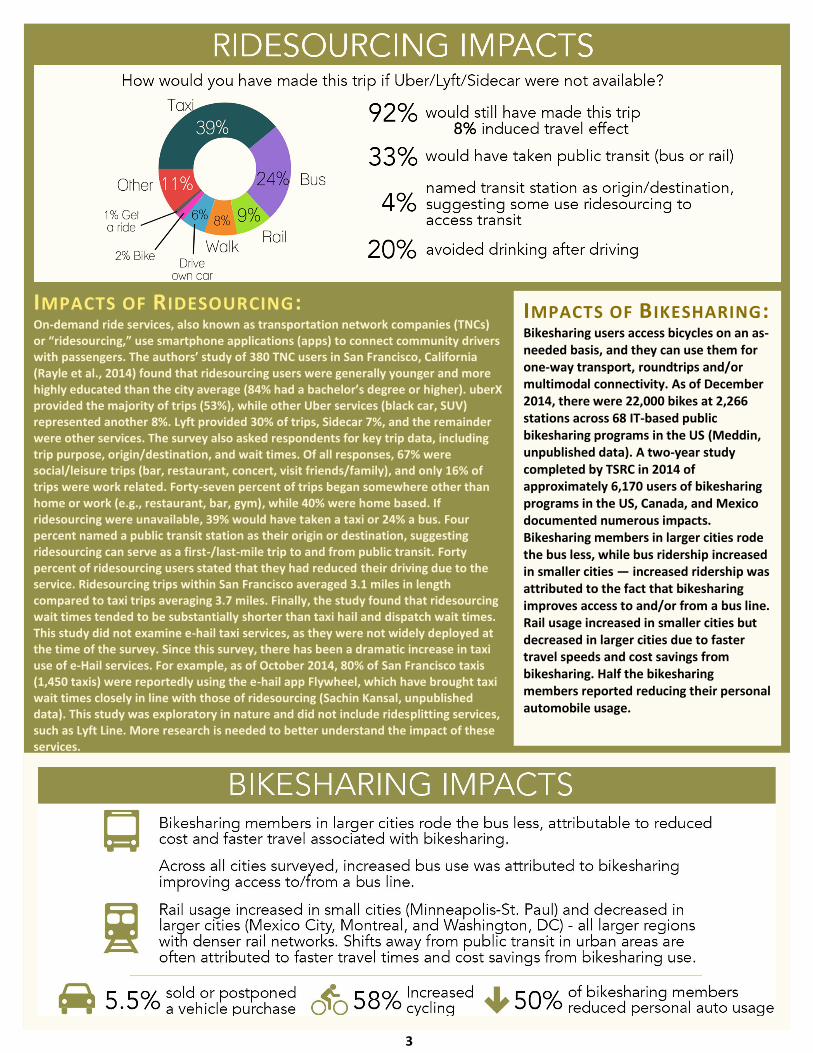
IMPACTS OF RIDESOURCING: On-demand ride services, also known as transportation network companies (TNCs) or “ridesourcing,” use smartphone applications (apps) to connect community drivers with passengers. The authors’ study of 380 TNC users in San Francisco, California (Rayle et al., 2014) found that ridesourcing users were generally younger and more highly educated than the city average (84% had a bachelor’s degree or higher). uberX provided the majority of trips (53%), while other Uber services (black car, SUV) represented another 8%. Lyft provided 30% of trips, Sidecar 7%, and the remainder were other services. The survey also asked respondents for key trip data, including trip purpose, origin/destination, and wait times. Of all responses, 67% were social/leisure trips (bar, restaurant, concert, visit friends/family), and only 16% of trips were work related. Forty-seven percent of trips began somewhere other than home or work (e.g., restaurant, bar, gym), while 40% were home based. If ridesourcing were unavailable, 39% would have taken a taxi or 24% a bus. Four percent named a public transit station as their origin or destination, suggesting ridesourcing can serve as a first-/last-mile trip to and from public transit. Forty percent of ridesourcing users stated that they had reduced their driving due to the service. Ridesourcing trips within San Francisco averaged 3.1 miles in length compared to taxi trips averaging 3.7 miles. Finally, the study found that ridesourcing wait times tended to be substantially shorter than taxi hail and dispatch wait times. This study did not examine e-hail taxi services, as they were not widely deployed at the time of the survey. Since this survey, there has been a dramatic increase in taxi use of e-Hail services. For example, as of October 2014, 80% of San Francisco taxis (1,450 taxis) were reportedly using the e-hail app Flywheel, which have brought taxi wait times closely in line with those of ridesourcing (Sachin Kansal, unpublished data). This study was exploratory in nature and did not include ridesplitting services, such as Lyft Line. More research is needed to better understand the impact of these services.
IMPACTS OF BIKESHARING: Bikesharing users access bicycles on an as-needed basis, and they can use them for one-way transport, roundtrips and/or multimodal connectivity. As of December 2014, there were 22,000 bikes at 2,266 stations across 68 IT-based public bikesharing programs in the US (Meddin, unpublished data). A two-year study completed by TSRC in 2014 of approximately 6,170 users of bikesharing programs in the US, Canada, and Mexico documented numerous impacts. Bikesharing members in larger cities rode the bus less, while bus ridership increased in smaller cities — increased ridership was attributed to the fact that bikesharing improves access to and/or from a bus line. Rail usage increased in smaller cities but decreased in larger cities due to faster travel speeds and cost savings from bikesharing. Half the bikesharing members reported reducing their personal automobile usage.
3
References
Martin, E. and Shaheen, S. (2010). Greenhouse Gas Impacts of Carsharing in North America. Mineta Transportation Institute, Report 09-11. Martin, E. and Shaheen S. (2011) The Impact of Carsharing on Public Transit and Non-Motorized Travel: AN Exploration of North American Carsharing Survey Data. Energies 4, 2094-2114. Rayle, L. et al. (2014) App-Based, On-Demand Ride Services: Comparing Taxi and RIdesourcing Trips and User Characteristics in San Francisco. University of California Transportation Center, UCTC-FR-2014-08. Shaheen, S. and Cohen, A. (2013) Carsharing and Personal Vehicle Services: Worldwide Market Developments and Emerging Trends, International Journal of Sustainable Transportation (7)1, 5-34. Shaheen, S. et al. (2014) Public Bikesharing in North America During a Period of Rapid Expansion: Understanding Business Models, Industry Trends & User Impacts.” Mineta Transportation Institute, Report 12-29.
TSRC Methodology
Please see references above for more information on individual study methodologies. Please note TSRC never releases disaggregated or proprietary data without the express permission of the respective operator(s). The authors would like to thank all of the operators, experts, associations, and study partners who made this research possible. Data and insights from this outlook should be attributed to TSRC, UC Berkeley. For more, please see http://imr.berkeley.edu.
TSRC Shared Mobility Research Team: Susan Shaheen, Ph.D.; Adam Cohen; Elliot Martin Ph.D.; Rachel Finson; Matt Christensen; Nelson Chan
ABOUT TSRC The Transportation Sustainability Research Center (TSRC) was formed in 2006. TSRC is managed by the Institute of Transportation Studies of the University of California, Berkeley; it is headquartered at the university’s Richmond Field Station.
TSRC uses a wide range of analysis and evaluation tools: including questionnaires, interviews, focus groups, automated data collection systems, GIS, and simulation models to collect data and perform analysis and interpret the data. The center develops impartial findings and recommendations for key issues of interest to industry and policy makers to aid in decision making. TSRC has assisted in developing and implementing major California and federal regulations and initiatives regarding sustainable transportation including: zero emission vehicle credits for carsharing vehicles as part of the Zero Emission Vehicle (ZEV) Mandate in California. Others include the California Global Warming Solutions Act (AB 32), the Low Emission Vehicle Program, the California Clean Cars Program (AB 1493), Low Carbon Fuel Standards policies, Sustainable Communities and Climate Protection Act (SB 375), and the federal Energy Independence and Security Act of 2007.
MOBILITY AND THE SHARING ECONOMY: IMPACTS SYNOPSIS
Spring 2015
TRANSPORTATION SUSTAINABILITY RESEARCH CENTER
1301 S. 46th Street Richmond Field Station (RFS), Building 190
Richmond, California 94804
Office: (510) 665-3467 Fax: (510) 665-2128
http://imr.berkeley.edu
http://www.tsrc.berkeley.edu
© UC Regents and ITS/TSRC 2014
4