P E R Seismic Demands and their Dependence on Ground Motions
28
2001 PEER Annual Meeting P P E E E E R R Seismic Demands and their Dependence on Ground Motions Helmut Krawinkler Stanford University
Transcript of P E R Seismic Demands and their Dependence on Ground Motions

2001 PEER Annual Meeting
PPEEEERR Seismic Demands and their
Dependence on GroundMotions
Helmut Krawinkler
Stanford University

2001 PEER Annual Meeting
What are Seismic Demands?
� Damage Measures� Roof and story drifts� Local deformations (e.g., plastic hinge rotation)� Floor acceleration and velocity� Cost-related damage indices� Cumulative damage measures (e.g., energy)
� Design Parameters� Story shear forces and overturning moments� Relative strength of fuses (strong column concept)

2001 PEER Annual Meeting
Purpose of Demand Evaluation
� Understanding of Behavior� Rigorous Probabilistic Performance
Assessment in the Presence of Uncertainties� Approximate Performance Assessment� Conceptual Design (Strength and Stiffness
Requirements)

2001 PEER Annual Meeting
PPEEEERR Probabilistic Performance
Assessment in the Presenceof Uncertainties

2001 PEER Annual Meeting
Incremental Dynamic Analysis (IDA)
� Spectral Acceleration Hazard
� Incremental Dynamic Analysis Curves
� Probability Distribution of Drift given Sa
� System Drift Capacity Data Points
� Probability Distribution of CapacityCornell/Jalayer
Maximum Interstory drift Angle,qmax HSa(sa) = Pr [Sa > sa ]
sa1
sa2
Sa a
t T
1
Median Capacity
δ C HSa(sa1)
δ D
qmax |Sa2
qmax = a Sa b

2001 PEER Annual Meeting
Accuracy of IDA Depends on
� Description of return period dependent hazard� Intensity measure
� Frequency content
� Duration
� Description of structural properties, includingdeterioration
� Analytical modeling and analysis tool
� Method of prediction (analysis method)
2001 PEER Annual Meeting
PPEEEERR
Description of return perioddependent hazard
2001 PEER Annual Meeting
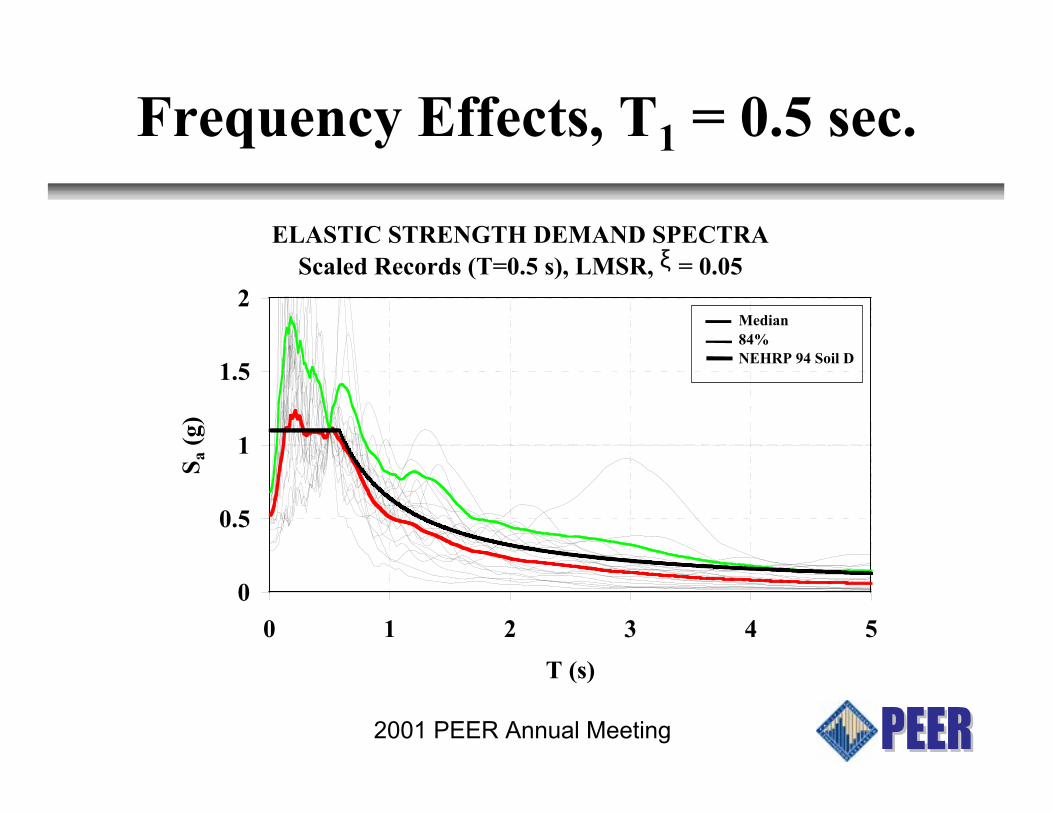
Frequency Effects, T1 = 0.5 sec.
ELASTIC STRENGTH DEMAND SPECTRAScaled Records (T=0.5 s), LMSR, ξ = 0.05
0
0.5
1
1.5
2
0 1 2 3 4 5
T (s)
S a (
g)
Median84%NEHRP 94 Soil D

2001 PEER Annual Meeting
Frequency Effects, T1 = 2.0 sec.
ELASTIC STRENGTH DEMAND SPECTRAScaled Records (T=2.0 s), LMSR, ξ = 0.05
0
0.5
1
1.5
2
0 1 2 3 4 5
T (s)
S a (
g)
Median84%NEHRP 94 Soil D

2001 PEER Annual Meeting
Near-Fault Effects
Elastic SDOF Velocity Demands15-D* vs. Recorded Near-Fault, ξ = 2%
0
200
400
600
800
0 0.5 1 1.5 2 2.5 3 3.5 4
T (sec)
Sv (c
m /
sec)
LP89lgpc LP89lexEZ92erzi LN92lucrNR94rrs NR94sylmKB95kobj KB95tato15-D* (mean)
2001 PEER Annual Meeting
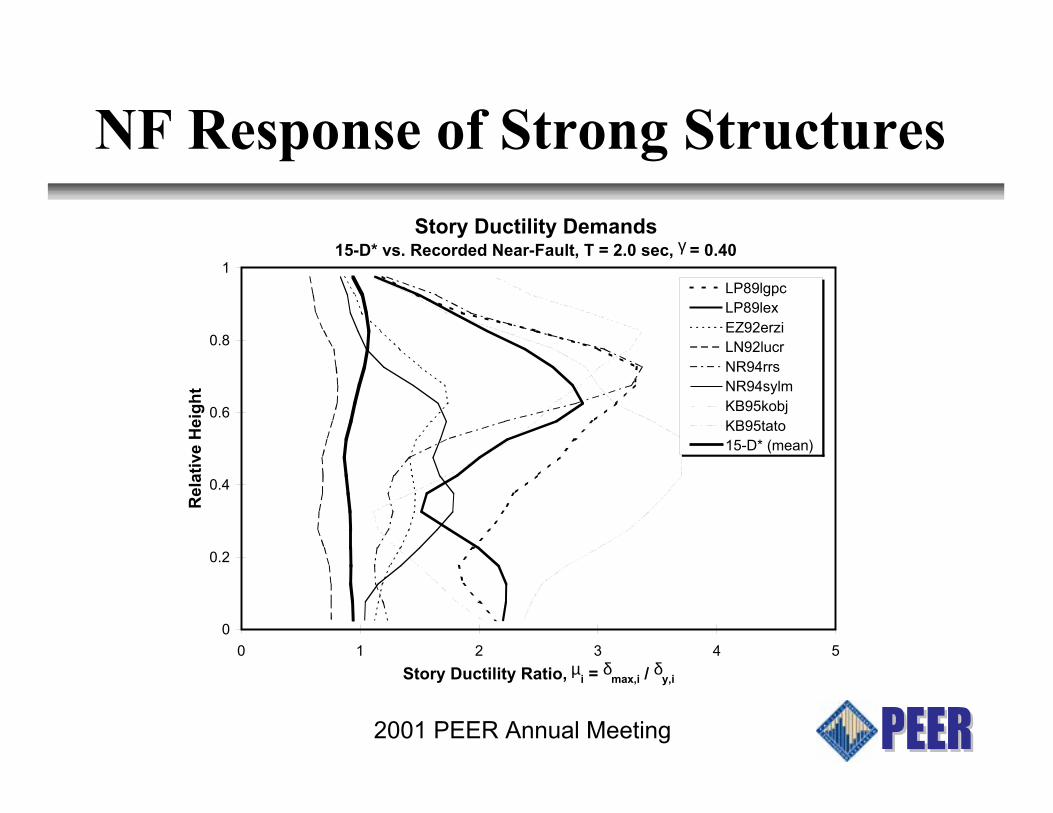
NF Response of Strong Structures
Story Ductility Demands15-D* vs. Recorded Near-Fault, T = 2.0 sec, γ = 0.40
0
0.2
0.4
0.6
0.8
1
0 1 2 3 4 5
Story Ductility Ratio, µi = δmax,i / δy,i
Rel
ativ
e H
eig
ht
LP89lgpcLP89lexEZ92erziLN92lucrNR94rrsNR94sylmKB95kobjKB95tato15-D* (mean)

2001 PEER Annual Meeting
Story Ductility Demands15-D* vs. Recorded Near-Fault, T = 2.0 sec, γ = 0.15
0
0.2
0.4
0.6
0.8
1
0 2 4 6 8 10 12
Story Ductility Ratio, µi = δmax,i / δy,i
Rel
ativ
e H
eig
ht
LP89lgpcLP89lexEZ92erziLN92lucrNR94rrsNR94sylmKB95kobjKB95tato15-D* (mean)
NF Response of Weak Structures

2001 PEER Annual Meeting
Improvement of Intensity Measure
Figure 5 � IDA plot of IDR versus (left) Sa(T1) and (right) SaRsaα
IDRMAX
0.00 0.02 0.04 0.06 0.08 0.10 0.12 0.14 0.16 0.18 0.20
SaR
Saα
0
1
2
3
α = 0.9TF = 1.8T1
IDRMAX
0.00 0.02 0.04 0.06 0.08 0.10 0.12 0.14 0.16 0.18 0.20
Sa (T
1,5%)
0
1
2
3
4
5
6IV79-A6 LP89-LG LP89-LX EZ92-EZ NR94-NH NR94-RS NR94-SY KB95-JM
Tp/T1 > 1
Tp/T1 < 1
(a) Intensity Measure = Sa(T1) (b) Intensity Measure = SaRsaα
Cordova/Deierlein
2001 PEER Annual Meeting
PPEEEERR Description of structural
properties, includingdeterioration

2001 PEER Annual Meeting
Basic Modes of Deterioration
Normalized Deformation (%)
Nor
mal
ized
Loa
d (%
)
1.0
1.0 5.0
Normalized Deformation (%)
Nor
mal
ized
Loa
d (%
)
1.0
1.0 5.0
Normalized Deformation (%)
Nor
mal
ized
Loa
d (%
)
1.0
1.0 5.0
Normalized Deformation (%)
Nor
mal
ized
Loa
d (%
)
1.0
1.0 5.0
No deterioration Strength deterioration
Strength det. with capping Strength det. with capping & stiff. det
2001 PEER Annual Meeting
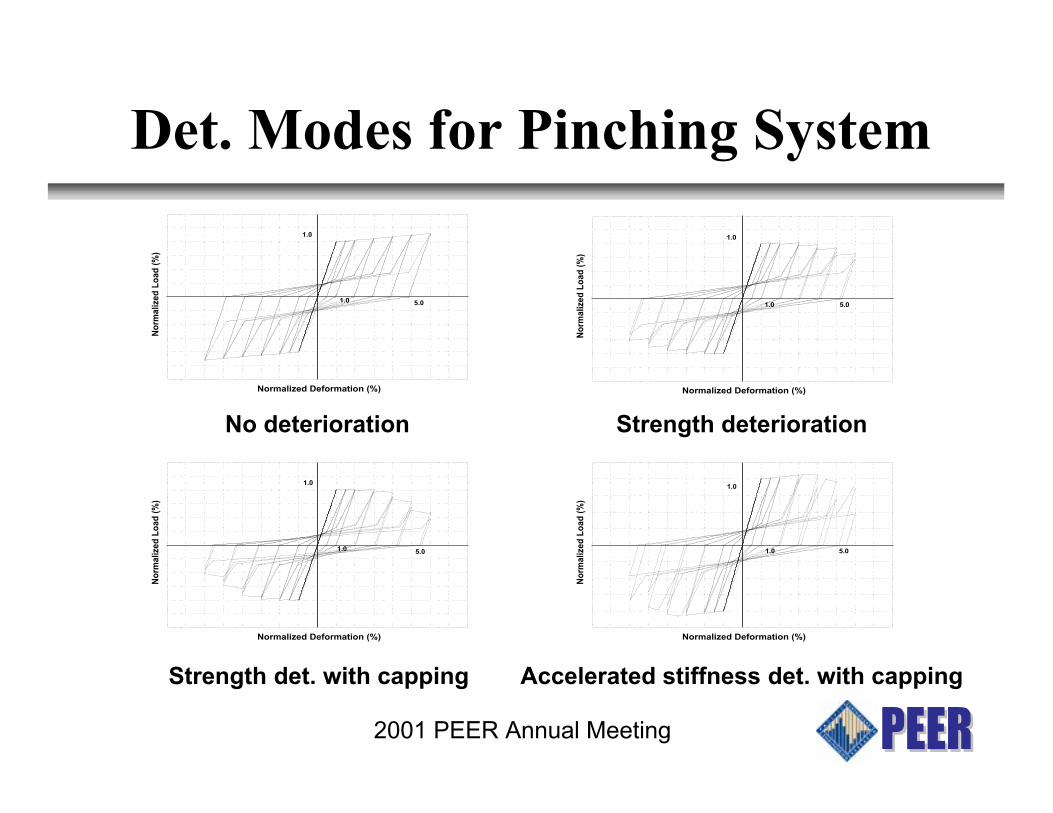
Det. Modes for Pinching System
Normalized Deformation (%)
No
rmal
ized
Lo
ad (
%)
1.0
1.0 5.0
Normalized Deformation (%)
No
rmal
ized
Lo
ad (
%)
1.0
1.0 5.0
Normalized Deformation (%)
No
rmal
ized
Lo
ad (
%)
1.0
1.0 5.0
Normalized Deformation (%)
No
rmal
ized
Lo
ad (
%)
1.0
1.0 5.0
No deterioration Strength deterioration
Strength det. with capping Accelerated stiffness det. with capping
2001 PEER Annual Meeting
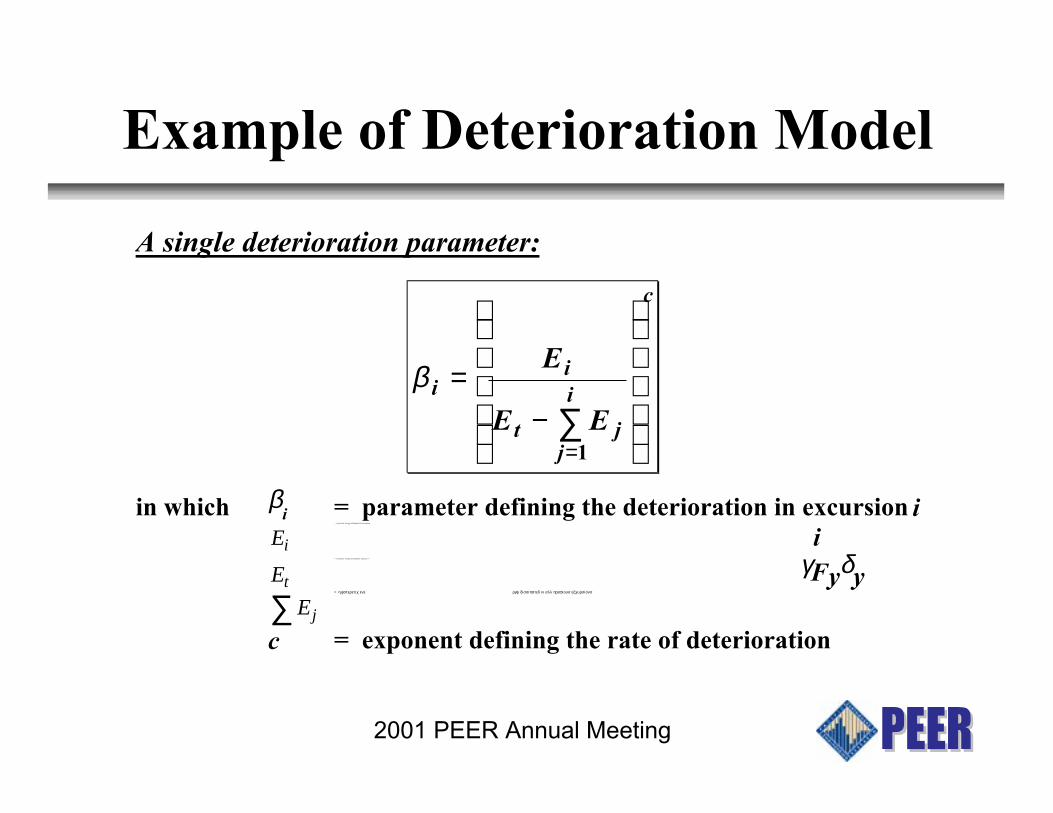
Example of Deterioration Model
A single deterioration parameter:
c
i
jjt
ii
EE
E
−=
∑=1
β
in which βi = parameter defining the deterioration in excursion i
Ei
= hysteretic energy dissipated in excursion
iEt
= hysteretic energy dissipation capacity = γFyδyEj∑
= ηψστερετιχ ενε ργψ δισσιπατεδ ιν αλλ πρεϖιουσ εξχυρσιονσ
c = exponent defining the rate of deterioration

2001 PEER Annual Meeting
Calibration of Deterioration Model
Pinching Hysteretic Model, Halil-Column 1,P-∆=0, α=0.10,αcap=-0.24,κ=0.5,γk=100,γs=50,γa=30,γc=40,δc=2.3δ
y
-40000
-30000
-20000
-10000
0
10000
20000
30000
40000
-15 -10 -5 0 5 10 15
Displacement
Fo
rce
AnalyticalExperimental
2001 PEER Annual Meeting
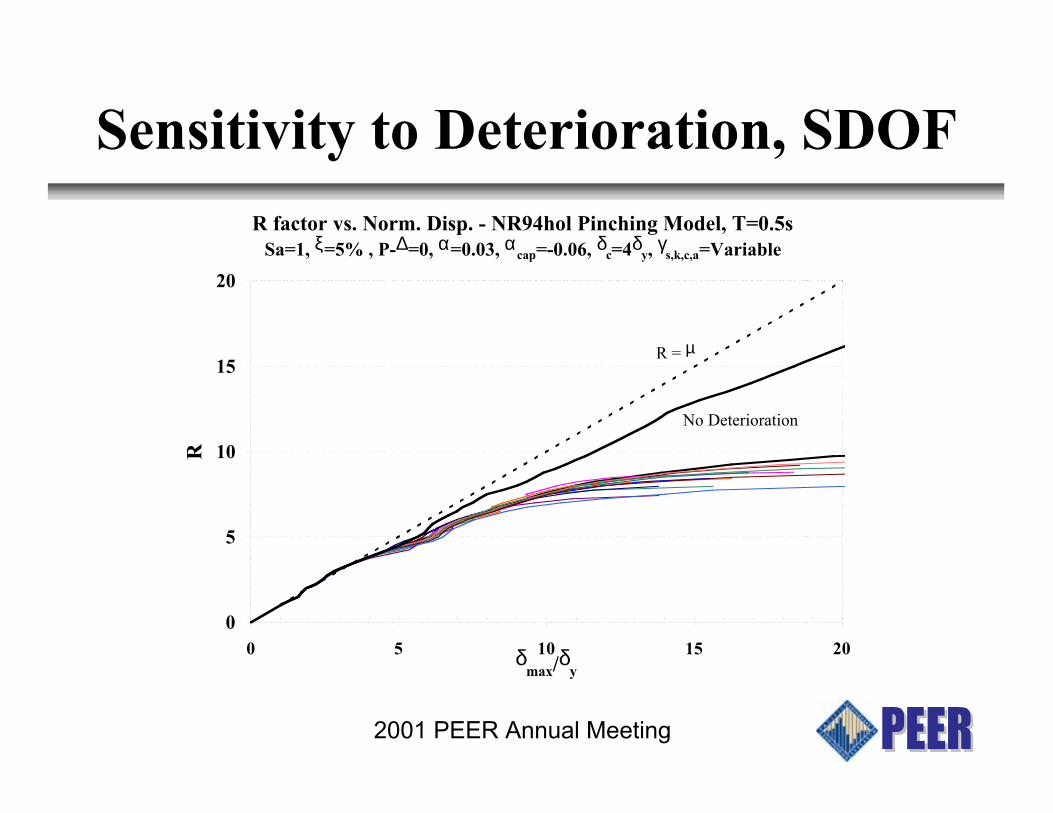
Sensitivity to Deterioration, SDOFR factor vs. Norm. Disp. - NR94hol Pinching Model, T=0.5s
Sa=1, ξ=5% , P-∆=0, α=0.03, αcap=-0.06, δc=4δy, γs,k,c,a=Variable
0
5
10
15
20
0 5 10 15 20δmax/δy
R
R = µ
No Deterioration
2001 PEER Annual Meeting
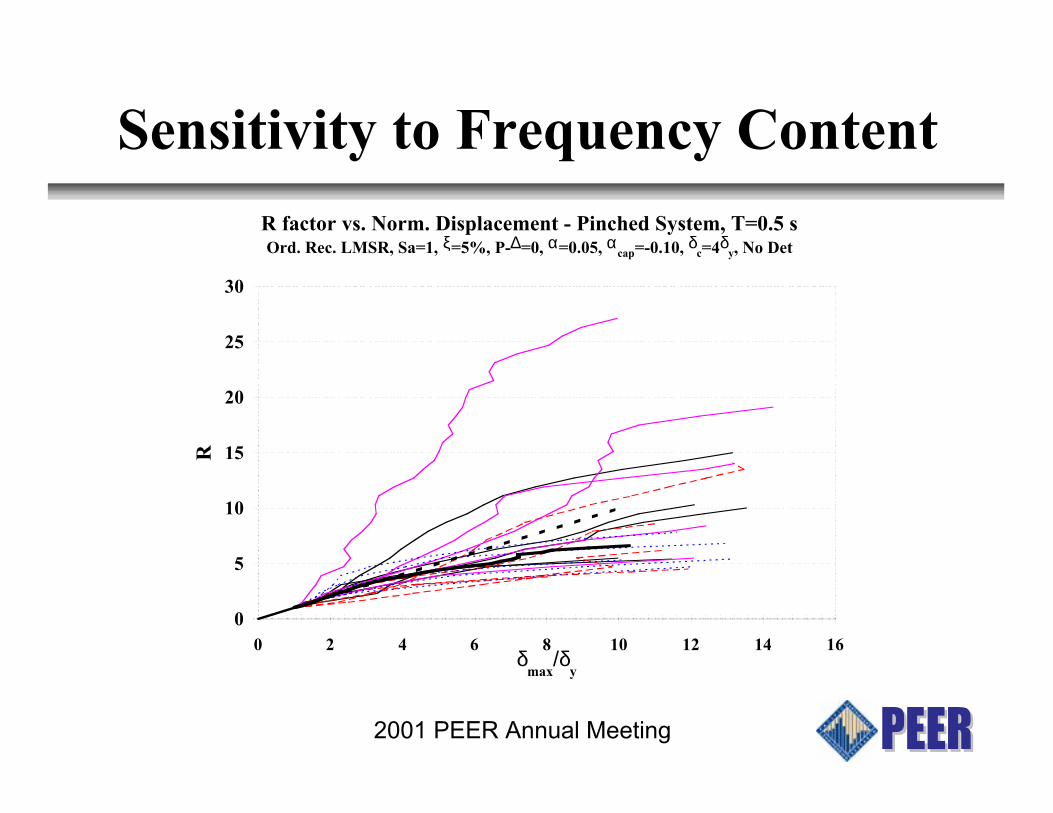
Sensitivity to Frequency ContentR factor vs. Norm. Displacement - Pinched System, T=0.5 sOrd. Rec. LMSR, Sa=1, ξ=5%, P-∆=0, α=0.05, αcap=-0.10, δc=4δ
y, No Det
0
5
10
15
20
25
30
0 2 4 6 8 10 12 14 16δ
max/δ
y
R

2001 PEER Annual Meeting
Deterioration Effect, MDOF System
2001 PEER Annual Meeting
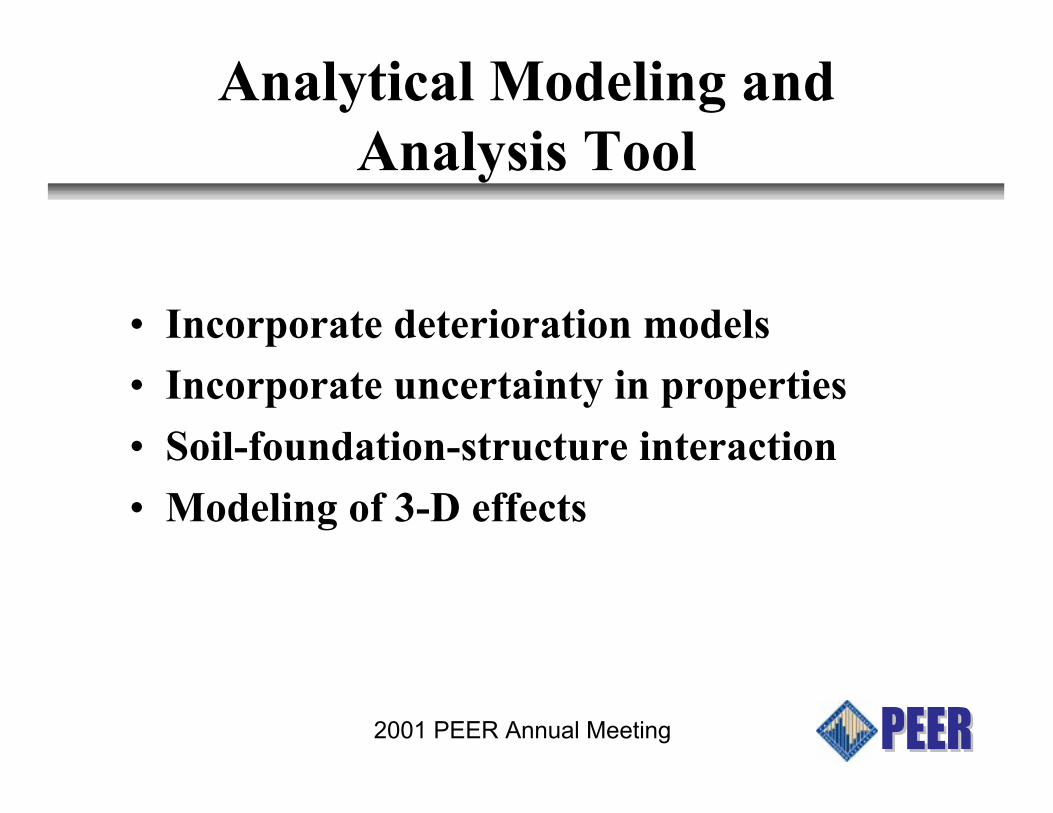
Analytical Modeling andAnalysis Tool
� Incorporate deterioration models
� Incorporate uncertainty in properties
� Soil-foundation-structure interaction
� Modeling of 3-D effects

2001 PEER Annual Meeting
Method of Prediction(Analysis Method)
STORY DRIFT ANGLE ENVELOPES Dynamic Analysis, Record LA30 (Tabas): LA 20-Story, Pre-Northridge
1
3
5
7
9
11
13
15
17
19
21
0 0.03 0.06 0.09 0.12 0.15
Story Drift Angle
Flo
or L
evel
Model M2 Model M1A
Model M2A Model M2AK
Model M1 FW Model M1FS
Model M1-NPD Model M1E-PD
Model M1E-NPD Model M1: Collapse

2001 PEER Annual Meeting
Understanding of Behavior - Walls
20-StoryT = 1.22 sec.

2001 PEER Annual Meeting
Understanding of Behavior - Walls
µ = 3

2001 PEER Annual Meeting
PEER Research Activities
� Demand database for many structuralsystems and different ground motion types
� Sensitivity of demands to ground motioncharacteristics (ordinary and near-fault)
� Collapse safety prediction from IDAs
� Improved intensity measures for reducinguncertainties in demand prediction
� Prediction of demand parameters for lossestimation (structural and nonstructural)

2001 PEER Annual Meeting
PEER Research Activities, cont�d
� Modeling of deterioration
� Evaluation of demand parameters forconceptual design
� Fragility curves for bridge peers andsystems
� Probabilistic demand models for bridges

2001 PEER Annual Meeting
Ultimate Objective
� Provide knowledge and data needed toimplement a performance assessmentmethodology based on the PEER frameworkequation (short term)
� Provide understanding, knowledge, and dataneeded to develop and implement aperformance-based conceptual designmethodology for retrofitting existing structuresand designing new ones (long range)