P About the Asian Development Bank overty Research...
114
Research Study on 2005 International Comparison Program in Asia and the Pacific for Selected Countries in Asia and the Pacific P OVERTY -S PECIFIC P URCHASING P OWER P ARITIES
-
Upload
phungkhanh -
Category
Documents
-
view
213 -
download
0
Transcript of P About the Asian Development Bank overty Research...

Research Study on
2005 International Comparison Program in Asia and the Pacific
for Selected Countries in Asia and the Pacific
POVERTY-SPECIFICPURCHASING POWER PARITIES
About the Research Study on Poverty-Specific Purchasing Power Parities for Selected Countries in Asia and the Pacific
The Research Study on Poverty-Specific Purchasing Power Parities for Selected Countries in Asia and the Pacific is a methodological research for compiling purchasing power parities (PPP) for measuring poverty in the region. The study covers 16 of the 23 economies participating in the 2005 International Comparison Program in Asia and the Pacific. It presents a detailed account of the activities undertaken to estimate PPPs using the recommended methodology of the Poverty Advisory Group of the World Bank, as well as alternative PPPs derived from poverty-specific price surveys.
About the Asian Development Bank
ADB’s vision is an Asia and Pacific region free of poverty. Its mission is to help its developing member countries substantially reduce poverty and improve the quality of life of their people. Despite the region’s many successes, it remains home to two thirds of the world’s poor. Nearly 1.7 billion people in the region live on $2 or less a day. ADB is committed to reducing poverty through inclusive economic growth, environmentally sustainable growth, and regional integration.
Based in Manila, ADB is owned by 67 members, including 48 from the region. Its main instruments for helping its developing member countries are policy dialogue, loans, equity investments, guarantees, grants, and technical assistance. In 2007, it approved $10.1 billion of loans, $673 million of grant projects, and technical assistance amounting to $243 million.
Asian Development Bank6 ADB Avenue, Mandaluyong City1550 Metro Manila, Philippineswww.adb.org/economicsPublication Stock No. 020408 Printed in the Philippines
9 7 8 9 7 1 5 6 1 6 5 9 1
ISBN 971561659- 3Research Study on P
overty-SPecific PurchaSing P
ower ParitieS for Selected Countries in Asia and the Pacific


2005 International Comparison Program in Asia and the Pacific
Economics and Research Department
March 2008
Research Study on
Poverty-SPecific PurchaSing Power ParitieS
for Selected Countries in Asia and the Pacific

© 2008 Asian Development BankAll rights reserved. Published 2008.
Cataloging-in-Publication DataISBN: 978-971-561-659-1Publication Stock No. 020408Asian Development Bank.
The views expressed in this book do not necessarily reflect the views and policies of the Asian Development Bank (ADB) or its Board of Governors or the governments they represent.
The ADB does not guarantee the accuracy of the data included in this publication and accepts no responsibility for any consequence of their use.
Asian Development Bank6 ADB Avenue, Mandaluyong City1550 Metro Manila, PhilippinesTel +63 2 632 4444Fax +63 2 636 2444www.adb.org/statistics

iii
Foreword
The vision of the Asian Development Bank (ADB) is an Asia and Pacific region free of poverty. ADB has made poverty reduction in its member economies, home to two thirds of the world’s poor, its overarching mission. The Long-Term Strategic Framework (LTSF) gives the agenda for ADB’s poverty
reduction and growth financing activities over the next 15 years. However, the magnitude of the task of addressing poverty in the Asia and Pacific region is immense. Despite encouraging signs of reduction in poverty incidence and in the number of poor over the last decade, there is still a sizeable population of over 600 million living under $1/day, and nearly 1.9 billion living under $2/day. ADB is committed to enhanced understanding of poverty in the region and uses measurement as a management tool in its fight against poverty.
The last two decades have seen increasing reliance by international organizations and policymakers alike on measures of poverty using the international poverty lines (IPL) of $1/day and $2/day. The Millennium Development Goal of halving absolute poverty by 2015 has made $1/day an important element in the war against global poverty. Despite its elevated presence on the global scene, the concept of an IPL; its determination and calibration; and its application in the actual assessment of poverty incidence have remained largely inaccessible and obscure to researchers, practitioners, and the general public.
Operational implementation of IPLs requires their conversion into currency units of countries prior to counting the poor. Purchasing power parities (PPPs) from the International Comparison Program (ICP) are the commonly used converters of $1/day poverty lines. Consequently, the measurement of PPPs plays a crucial role in the calibration and application of international poverty lines.
For the 2005 round of the ICP, ADB served as the regional coordinator for the Asia and Pacific region. This role gave the ADB an opportunity to contribute to enhanced understanding of the concept of IPL, and to focus on compiling PPPs particularly suitable for measuring poverty in the region. ADB instituted the poverty PPP research as a satellite project of the 2005 ICP Asia Pacific. The project was funded by the Department for International Development (DFID) of the Government of the United Kingdom of Great Britain and Northern Ireland under the Poverty Reduction Cooperation Fund.
The study secured the active cooperation and participation of 16 of the 21 member economies of ADB that participated in the 2005 ICP Asia Pacific. The 16 member economies are Bangladesh, Bhutan, Cambodia, Fiji Islands, India, Indonesia, Lao People’s Democratic Republic, Malaysia, Maldives, Mongolia, Nepal, Pakistan, Philippines, Sri Lanka, Thailand, and Viet Nam. In the true spirit of a collaborative research study, the participating countries made significant contributions in designing and conducting surveys specifically formulated to collect prices of goods and services that are typically consumed by the poor. Their active participation was crucial to the success of the project.
PPPs in the 2005 ICP Asia Pacific and in the poverty PPP initiative project share a common characteristic: they measure spatial price differences. However, the actual tool kits, methods, and computational strategies used in their measurement could not be more different. Consequently, the Global Office of the ICP at the World Bank established a Poverty Advisory Group (PAG) to provide guidance on methods and operational procedures. The poverty PPP study established the implementation of the PAG-recommended methodology as a benchmark, but at the same time embarked on an ambitious array of tasks including conducting separate poverty-specific price surveys and undertaking extensive sensitivity analyses.

iv
This report is essentially a document on the activities of the study and logs the various milestones achieved. The report presents an extensive discussion of the conceptual framework and measurement issues associated with the use of IPLs. It is designed as a primer on the subject to general readers. Poverty PPPs based on the PAG methodology and on using the Malaysian ringgit as the reference currency were computed for the currencies of the 16 participating countries. The project demonstrated the feasibility of conducting poverty-specific price surveys and established that price data from such surveys would significantly influence the numerical values of the PPPs. The contents of the report are expected to provide a significant input into the development and further refinement of methodologies for compiling PPPs specific to poverty measurement.
I sincerely thank all those who have contributed to making the poverty PPP study a success—in particular, DFID which provided the funding. The ICP Global Office provided valuable technical assistance, and international and local consultants assisted ADB in conducting this important research. I also wish to thank the dedicated staff of the Development Indicators and Policy Research Division (ERDI) of the Economics and Research Department of ADB and, most important, the national coordinating agencies and other government agencies in each of the 16 participating economies for their in-kind and financial contributions, cooperation, and hard work.
Ifzal Ali Chief Economist Asian Development Bank

v
AcknowledgmentsSixteen member countries of the Asian Development Bank (ADB) participated in the Research Study
on Poverty-Specific Purchasing Power Parities for Selected Countries in Asia and the Pacific. The 16 countries are among the 21 ADB member economies that participated in the 2005 International Comparison Program in Asia and the Pacific (2005 ICP Asia Pacific).
The ADB gratefully acknowledges the contributions of the ICP national officers, namely, Md. Zobdul Hoque, Bangladesh; Dorji Tshering, Bhutan; Khin Song, Cambodia; Nilima Lal, Fiji Islands; Ramesh Kolli and Vishnu Kumar, India; Ali Rosidi, Indonesia; Onkeo Ounalom, Lao People’s Democratic Republic; Ismail Yusoff, Malaysia; Mariyam Niyaf, Maldives; Batjargal Badamtsetseg and Ayush Demberel, Mongolia; Bikash Bista, Nepal; Arif Mahmood Cheema, Pakistan; Rosie Sta. Ana, Philippines; D.C.A. Gunawardena, Sri Lanka; Patchareeya Tanomchit and Pricha Chaiwathanasaransuk, Thailand; and Nguyen Thi Lien, Viet Nam and their team members for their hard work and collection of high-quality poverty-specific price data. The study also benefited greatly from the contribution of Olivier Dupriez of the World Bank who provided mapped household expenditure survey data to the basic headings in the 2005 ICP Asia Pacific.
The study was conducted by the Development Indicators and Policy Research Division (ERDI) of the Economics and Research Department of ADB. This report was prepared by D.S. Prasada Rao ably assisted by Gaye Parcon and Eileen Capilit. Vaskar Saha, former Principal Statistician, and Chellam Palanyandy, Principal Statistician, provided guidance and overall supervision of the study. The team was also assisted by Rana Hasan, Senior Economist; and Rhoda Magsombol, Jewelwayne Cain, Lutgarda Labios, and Virginia Ganac. Valuable suggestions were also provided by Hyun Son and Yoko Nimi. Administrative support was provided by Clarita D. Truong. Editorial work was performed by Gloria Argosino with the assistance of Cherry Lynn T. Zafaralla. Design and typesetting were performed by Joe Mark Ganaban and Mercedita Cabaneros with the assistance of Fatima Christine D. Blanco. This report was published with the support of the ADB Printing Unit under the supervision of Raveendranath Rajan.
The ADB acknowledges the generous support of the Department for International Development of the Government of the United Kingdom of Great Britain and Northern Ireland, which provided funding for the study.
Bishnu Dev PantAssistant Chief EconomistDevelopment Indicators and Policy Research Division


vii
ContentsForeword .................................................................................................................................. iiiAcknowledgments ......................................................................................................................vContents ...................................................................................................................................viiTables and Figures ......................................................................................................................xAbbreviations ...........................................................................................................................xiiExecutive Summary .................................................................................................................xiii
CHAPTER 1 2005 ICP Asia Pacific and Purchasing Power Parities for Measuring Poverty .............. 1
Background of the 2005 ICP Asia Pacific ...................................................................................1Regional Poverty and the Role of PPPs .......................................................................................1Poverty PPP Study in the Region ................................................................................................2Structure of the Report ...............................................................................................................2
CHAPTER 2 Basic Steps in Measuring National and Regional Poverty with the Use of International Poverty Lines ........................................................... 4Introduction ...............................................................................................................................4The $1/day and $2/day International Poverty Lines ....................................................................4Use of Purchasing Power Parities of Currencies for Converting IPLs ..........................................5Main Issues with the Current Practice ........................................................................................5
CHAPTER 3 ICP in the Asia and Pacific Region and Purchasing Power Parities ............................. 7
Introduction ...............................................................................................................................7Concept and Uses of Purchasing Power Parities..........................................................................7Basic Framework for the 2005 ICP Asia Pacific ..........................................................................8Methodology for the ICP ...........................................................................................................9Overview of the Results ............................................................................................................11Need for Poverty-Specific PPPs ................................................................................................12
CHAPTER 4 Basic Framework for Purchasing Power Parities for Converting Poverty Lines ......... 13
Introduction .............................................................................................................................13Product Lists ............................................................................................................................13Price Data .................................................................................................................................17Expenditure Share Weights ......................................................................................................17The Reference Population—Who Are the Poor? .......................................................................20Summary of Issues ....................................................................................................................21

viii
CHAPTER 5 Recommended Methodology for Compiling Poverty PPPs in the 2005 ICP Asia Pacific ................................................................................. 23Introduction .............................................................................................................................23PAG’s Recommended Methodology .........................................................................................23Basic Heading PPPs Based on the 2005 ICP Asia Pacific ........................................................24Compiling Expenditure Share Weights for the Poor .................................................................24Aggregation Methods ...............................................................................................................30Conclusion ...............................................................................................................................35
CHAPTER 6 Poverty-Specific Price Surveys in the 2005 ICP Asia Pacific ..................................... 36
Introduction .............................................................................................................................36Country Participation ..............................................................................................................37Product Specifications and Product Lists ..................................................................................37The Survey Framework ............................................................................................................39Collection and Validation of Price Data ..................................................................................40Comparing Price Data from the 2005 ICP Asia Pacific Price Surveys and the Poverty-Specific Price Surveys .....................................................................................43PPPs at the Basic Heading Level from the 2005 ICP Asia Pacific and Poverty-Specific Survey Prices ...........................................................................................46A Preliminary Comparison of Poverty-Specific Price Survey Data and Household Expenditure Survey Unit Values ......................................................................48Conclusion ...............................................................................................................................56
CHAPTER 7 Sensitivity Analysis of Poverty PPPs Estimated Using Various Sources of Price Data and Aggregation Methods .................................................................................. 57Introduction .............................................................................................................................57Schematic Representation of Approaches and Methods for Compiling PPPs ............................57Major Components of the Computational Scheme ...................................................................59PPPs Computed Using the PAG Methodology .........................................................................61PPPs Computed with the Use of Poverty-Specific Price Survey Data and Expenditure Weights of the Poor .......................................................................................63Comparison of PPPs from the PAG Methodology and Poverty-Specific Price Survey Data ......65Effect of Democratic Weights versus Plutocratic Weights .........................................................68Sensitivity of PPP Estimates to the Choice of Aggregation Method ..........................................68Sensitivity of Estimates of Poverty Incidence ............................................................................69Conclusion and Recommended Poverty PPPs for the 2005 ICP Asia Pacific ............................70
ix
CHAPTER 8 International Poverty Lines for the Asia and Pacific Region .................................. 74
Introduction .............................................................................................................................74The Basic Concept of International Poverty Lines ....................................................................74Determination of International Poverty Lines ..........................................................................74International Poverty Lines Based on Alternative Sets of PPPs..................................................77Sensitivity Analysis ...................................................................................................................782005 Estimates of Poverty in the Asia and Pacific Region Using International Poverty Lines ............................................................................................................................78Conclusion ...............................................................................................................................80
CHAPTER 9 Milestones Achieved in the Poverty PPP Study, 2005 ICP Asia Pacific, and Future Work................................................................................................. 81Introduction .............................................................................................................................81Milestones Achieved .................................................................................................................81Direction of Future Work .........................................................................................................82
Appendix ......................................................................................................................... 85
Bibliography and References ................................................................................................ 95

x
Tables and FiguresTable 1. Main Aggregates Used in the 2005 ICP Asia Pacific Comparisons ............................9Table 2. Summary Results for 2005 ICP Asia Pacific PPPs ...................................................10Table 3. Number of Basic Headings and Items
for Major Individual Consumption Expenditures by Households ...........................14Table 4. Representativity of Food and Nonalcoholic Beverages and Clothing
and Footwear of the General Population versus the Poor Population .......................15Table 5. Comparison of Quantities in the 2005 ICP Asia Pacific
and in the Poverty-Specific Price Surveys ................................................................17Table 6. Expenditure Share Weights: National Accounts, Households below the $1/day
Poverty Line, and Households around the Indonesian Poverty Line (percent) .........18Table 7. Bandwidths and Estimated Population Size in Intervals around the Poverty Line ....26Table 8. Household Expenditure Survey Availability
and Consumer Price Index Movements ...................................................................29Table 9. Sample Products and Specifications for Poverty-Specific Price Surveys ....................38Table 10. Sample Quantities: 2005 ICP Asia Pacific Price Surveys versus
Poverty-Specific Price Surveys .................................................................................39Table 11. Sample Quantities: 2005 ICP Asia Pacific Price Surveys versus
Poverty-Specific Price Surveys .................................................................................39Table 12. Quaranta Table for Rice ..........................................................................................41Table 13. Quaranta Table for Cabbage ...................................................................................42Table 14. Adjustment of Poverty-Specific Price Survey Data to Mid-2005 .............................43Table 15. Price Ratios of Selected Items from Poverty-Specific Price Surveys
and 2005 ICP Asia Pacific Price Surveys .................................................................45Table 16. Comparison of Prices from Poverty-Specific Price Surveys
and 2005 ICP Asia Pacific Price Surveys (percent) ..................................................45Table 17. Nonparametric Tests for Equality of Means: 2005 ICP Asia Pacific
and Poverty Price Consumption PPPs .....................................................................48Table 18. Household Food and Beverage Expenditures Covered
by Matched Products for Poor Households .............................................................50Table 19. Ratio of Poverty-Specific Survey Prices and Household Expenditure
Surveys Unit Values for Selected Products ...............................................................51Table 20. Pairwise Correlation: All Matched Items .................................................................55Table 21. Pairwise Correlation: Only “Good” Matched Items ................................................55Table 22. Spearman Correlation: All Matched Items ..............................................................55Table 23. Spearman Correlation: Only “Good” Matched Items .............................................55Table 24. Poverty PPPs: PAG Methodology, 2005 ..................................................................62Table 25. Poverty PPPs: Poverty-Specific Price Data, 2005 .....................................................64Table 26. Poverty PPPs: 2005 ICP Asia Pacific, PAG Methodology,
and Poverty-Specific Price Survey Data, 2005 .........................................................66Table 27. Poverty PPPs: Democratic and Plutocratic Weights, 2005 .......................................68Table 28. Poverty PPPs by Aggregation Methods, 2005 ..........................................................70Table 29. Estimates of Poverty Incidence for 16 Countries .....................................................72Table 30. Poverty PPPs Using Democratic Weights: PAG Methodology versus
Poverty-Specific Price Data, 2005 ..........................................................................73

xi
Table 31. IPL with ICP PPPs for Consumption, 2005 ...........................................................75Table 32. IPLs Based on Alternative Sets of PPPs ...................................................................78Table 33. Summary of International Poverty Lines in Malaysian Ringgit
and United States Dollar .........................................................................................79Table 34. Estimates of Poverty Incidence in the Asia and Pacific Region:
International Poverty Lines, Poverty PPPs Based on PAG Methodology, and Poverty-Specific Price Survey Data, 2005 .........................................................79
Figure 1. Comparison of Poverty-Specific Prices and 2005 ICP Asia Pacific Prices for Selected Countries .............................................................................................47
Figure 2. Comparison of Poverty and ICP Basic Heading PPPs for Selected Countries .............................................................................................49
Figure 3. A Schematic Diagram for the Computation of Poverty Puchasing Power Parities ........................................................................58
Figure 4. Relationship between Real Per Capita Income and National Poverty Lines .....................................................................................76
Appendix Table 1. Coverage of Basic Heading ..........................................................................85Appendix Table 2. Household Expenditure Surveys —Source of Expenditure Weights
for the Poor ............................................................................................................86Appendix Table 3. Poverty-Specific Price Survey Product List ...................................................87

xii
Abbreviations
ADB Asian Development BankCPD country-product-dummy CPI consumer price indexCPRD country-product-representativity-dummy CUP conventional unit to express parityEKS Eltetö-Köves-Szulc GDP gross domestic productGK Geary-KhamisHK$ Hong Kong dollarHES household expenditure survey (surveys)HFCE household final consumption expenditureRs Indian rupeesICP International Comparison ProgramICEH individual consumption expenditures by householdsIPL international poverty lineLao PDR Lao People’s Democratic RepublicMDG Millennium Development GoalMER market exchange rateOECD Organisation for Economic Co-operation and DevelopmentPAG Poverty Advisory GroupPLI price level indexPPP purchasing power parityPRC People’s Republic of ChinaRM Malaysian ringgitSPD structured product descriptionUS United States
In this report, unless otherwise specified, “$” refers to US dollars.
xiii
The Asian Development Bank (ADB) has formally adopted poverty reduction in the Asia and Pacific region as an overarching goal. ADB is actively involved in monitoring the incidence and severity of poverty in the region and in assessing the area’s performance toward the Millennium Development
Goal of halving absolute poverty by the year 2015. The incidence of absolute poverty is generally measured using $1/day or $2/day as the international poverty line (IPL). An important step in using the IPL is to convert it into local currency units. A common practice has been to use consumption-based purchasing power parities (PPPs) from the International Comparison Program (ICP) to convert the IPL. Recognizing the limitations of the ICP consumption PPPs and the need for more accurate, focused, and meaningful currency converters, ADB considered the compilation of poverty PPPs as an important goal for the 2005 ICP in Asia and the Pacific (ICP Asia Pacific).
The main goals of the poverty PPP study were to: (i) implement the methodology proposed by the Poverty Advisory Group (PAG) of the Global Office at the World Bank and produce a set of poverty PPPs specifically for the purpose of converting the IPL; (ii) conduct poverty-specific price surveys in the participating countries to collect data on prices of goods and services considered typical of the consumption patterns of the poor; (iii) compile poverty PPPs using the price data collected from poverty-specific price surveys; (iv) study the sensitivity of the PPP estimates derived from diverse sources of price data and with the use of various analytical approaches; (v) to identify a poverty line better suited to the Asia and Pacific region than the conventional IPL; and (vi) estimate poverty incidence applying the new IPL converted using the derived poverty PPPs.
The report aims to present (i) a detailed account of the activities successfully undertaken as part of the poverty PPP study, and (ii) the new estimates of poverty PPPs derived using the PAG methodology as well as alternative PPPs based on poverty-specific price surveys.
The poverty PPP study covered 16 of the 21 member economies participating in the 2005 ICP Asia Pacific. The countries are: Bangladesh, Bhutan, Cambodia, Fiji Islands, India, Indonesia, Lao People’s Democratic Republic, Malaysia, Maldives, Mongolia, Nepal, Pakistan, Philippines, Sri Lanka, Thailand, and Viet Nam.
A short history on the use of IPLs is in Chapter 2. The current approach of using $1/day and $2/day as articulated by the World Bank in 1990 is described. The chapter focuses on the empirical implementation of the approach, which requires conversion of IPL into local currency units using PPPs for the consumption aggregate of the ICP. The main deficiencies of the approach are that (i) the ICP PPPs are not based on prices of goods and services relevant to the poor, and (ii) the weights used in calculating the PPPs do not reflect the expenditure patterns of the poor. A related issue is that the PPPs used by the World Bank are based on outdated data. For example, PPPs for India are extrapolated from data for 1985, which was the last time India participated in the ICP. The general conclusion is that there is an urgent need for poverty PPPs to replace the currently used conversion factors.
Executive Summary

2005 International Comparison Program in Asia and the Pacific xiv
Executive Summary
The poverty PPP study is intertwined with the 2005 ICP Asia Pacific. The 2005 ICP Asia Pacific compiled PPPs for converting economic aggregates such as gross domestic product, consumption, and investment, whereas poverty PPPs are needed for converting the IPL into local currency units. In recognition of this symbiotic relationship, Chapter 3 gives an overview of the concept of PPPs and the framework and methodology used in the 2005 ICP Asia Pacific. Recent published results from the 2005 ICP Asia Pacific are presented for the benefit of the readers. Of particular relevance in the 2005 ICP Asia Pacific results are the estimates of PPPs for the household final consumption expenditure aggregate, as this is the PPP traditionally used for converting the IPL.
The primary purpose of poverty PPPs is particularly narrow compared with that of PPPs of the 2005 ICP Asia Pacific. The poverty PPPs are specifically for the purpose of converting poverty lines for estimating poverty incidence. The framework for poverty PPPs differs significantly from that of the 2005 ICP Asia Pacific. While the ICP PPPs refer to the prices relevant to the whole population, poverty PPPs refer only to the population identified as poor. Consequently, the whole approach to identifying the product lists, organizing the price surveys, and compiling weights is significantly different. Chapter 4 establishes a general framework for compiling poverty PPPs, with a particular focus on the problem of determining the reference population.
The methodology for compiling poverty PPPs prescribed by the PAG is described in Chapter 5. The PAG, after considering various alternatives, resolved that the best strategy for the 2005 ICP was to improve poverty PPPs by explicitly incorporating the expenditure patterns of the poor. The contents of Chapter 5 form the core of this report. The chapter gives a detailed description of the methods used at the various stages involved in compiling the poverty PPPs. The empirical implementation of the PAG recommendation is described in detail. The process of establishing correspondence between ICP and household expenditure categories that are relevant to the poor is a particularly difficult task. The chapter therefore presents technical material relating to the compilation of democratic and plutocratic weights; and the aggregation methods used in international comparisons.
The main contribution of the poverty PPP study is the collection and use of price data for goods and services considered typical of the purchases made by the poor. Chapter 6 describes the whole process involved in collecting prices through special surveys conducted in the 16 countries. These surveys are very similar to the 2005 ICP data specific price surveys. A special workshop was organized to prepare the list of products for the poverty-specific price surveys. A survey framework was established with the aim of obtaining reliable estimates of prices of goods relevant to the poor. The poverty-specific price surveys were conducted from August to November 2006. The procedures involved in validating price data are also documented here.
Chapter 6 is designed to help the reader in appreciating the price data collected through the poverty-specific price surveys. The differences in prices collected through the poverty and 2005 ICP Asia Pacific price surveys were analyzed. For most nonfood items, the poverty prices were found to be generally lower than the ICP prices, but for food items, a significant portion of the poverty prices tend to be higher than the 2005 ICP Asia Pacific prices. The differences in price data make it difficult to predict whether the poverty PPPs will be lower than ICP PPPs or vice versa. An analysis of the PPPs at the basic heading level does not reveal any specific trend. Chapter 6 gives a comparison of poverty price data with unit values or average prices paid

xvResearch Study on Poverty-Specific Purchasing Power Parities for Selected Countries in Asia and the Pacific
Executive Summary
by households as revealed in the household expenditure data. A detailed analysis of unit value data collected from Bangladesh, India, Indonesia, and Nepal yields the general conclusion that the poverty prices collected through the poverty-specific price surveys and the unit values from the household expenditure surveys appear to be fairly close. The poverty-specific price survey data tended to be slightly higher than the median unit values. The analysis conducted and results reported in Chapter 6 indicate that the poverty-specific price survey data indeed accurately reflect the prices paid by the poor.
Chapter 7 contains results of the poverty PPP computations, based on the PAG methodology and poverty-specific price survey data, using different analytical techniques and aggregation methods. The resulting PPPs are compared and contrasted. The conclusions from the analysis are encouraging. First, it was found that the PAG methodology does produce PPPs that differ from the 2005 ICP Asia Pacific consumption PPPs. Second, more significant for the poverty PPP study in the Asia and Pacific region is that the use of poverty-specific price survey data resulted in significant changes in poverty PPPs, thereby affecting the incidence of poverty. The changes are a lot more substantial than the changes due to the implementation of the PAG methodology. With the Malaysian ringgit (RM) as the reference currency, it was found that poverty PPPs computed using the poverty-specific price survey data for most of the countries, with the exception of a few countries like the Fiji Islands and the Maldives, are lower than the PPPs implied by the PAG methodology. This is a significant finding that is likely to have a major impact on how poverty PPPs will be compiled in future rounds of the ICP. Also in Chapter 7, results from the sensitivity analysis indicate insensitivity to the use of democratic or plutocratic weights, but sensitivity to the index number method used for aggregation. These results are likely to be very useful in refining the methodology for poverty PPP compilation in the future.
The basic concept of IPLs and the method used to compute them are presented in Chapter 8. Although $1/day and $2/day IPLs are popular, there is little appreciation among users as to how the lines are set. The IPLs are not artificial constructs: they are specifically designed to extract a single poverty line out of the 16 poverty lines used in the participating countries. The method used in deriving the IPL is illustrated with numerical examples. The main result is that the IPL for the Asia and Pacific region based on data for the 16 participating countries is RM2.830 for the PAG methodology and RM2.945 for the poverty-specific price survey. Converted into US dollars using recently released data from the Global Office of the 2005 ICP at the World Bank, these poverty lines are equivalent to $1.341 for the PAG and $1.396 for PPPs based on the poverty-specific price surveys. Thus, the IPL, following the practice of the World Bank, may be said to be $1/day in 2005. Although there is little difference in the IPL from the PAG and from the poverty-specific price surveys approach followed in this poverty PPP study, the differences in the PPPs have a significant effect on the estimates of poverty incidence. PPPs estimated using the PAG methodology give a higher level of poverty incidence for most countries than PPPs derived from poverty-specific price survey data.
Chapter 9 gives a brief summary of the findings. It discusses a number of areas where further research and exploratory work are necessary to improve the PPPs compiled for estimating poverty. Coverage of more countries and a greater integration of poverty PPP work with the ICP and the national consumer price index will have the added benefits of enhancing the statistical capacity of economies, thereby improving the quality of the evidence base necessary for formulating, implementing, and assessing poverty reduction policies in this region where poverty remains a major concern.

Background of the 2005 ICP Asia Pacific
The 2005 International Comparison Program (ICP) in Asia and the Pacific (2005 ICP Asia Pacific) is a major statistical exercise
undertaken in the region as part of the global statistical initiative to conduct international comparisons covering 146 countries. The Asian Development Bank (ADB) was the regional coordinator and oversaw the successful conclusion of the 2005 ICP Asia Pacific, culminating in the release of the publication Purchasing Power Parities and Real Expenditures (ADB 2007b). Twenty-one member-economies of ADB participated in the 2005 ICP Asia Pacific: Bangladesh; Bhutan; Brunei Darussalam; Cambodia; People’s Republic of China (PRC); Fiji Islands; Hong Kong, China; India; Indonesia; Lao People’s Democratic Republic (Lao PDR); Malaysia; Maldives; Mongolia; Nepal; Pakistan; Philippines; Singapore; Sri Lanka; Taipei,China; Thailand; and Viet Nam. The Islamic Republic of Iran and Macao, China also participated.
The 2005 ICP Asia Pacific represents a significant achievement as it successfully brought together the participation of the world’s two most populous and fastest growing economies, the PRC and India. The PRC participated in the program for the first time. On the other hand, India last participated in 1985. The 2005 ICP Asia Pacific covered five of the eight most populous economies in the world. Major outputs of the 2005 ICP Asia Pacific include estimates of purchasing power parities (PPPs) of currencies of the participating economies
along with estimates of real gross domestic product (GDP), real per capita consumption, real government expenditure, and real investment. The results in Purchasing Power Parities and Real Expenditures based on data collected from complex price surveys and respective national accounts sources are crucial for evidence-based policy making and provide valuable information for research at the national, regional, and global levels.
Regional Poverty and the Role of PPPs
The Asia and Pacific region, which is home to more than 50% of the world’s population, is also a region where absolute poverty is highly prevalent. A recent study by Ravallion and Chen (2007) shows encouraging trends of poverty reduction in the region, but it also shows that more than 615 million people in the region still live in absolute poverty, with expenditure or income of less than $1/day. Poverty incidence in the region is at a staggering level, with nearly 1.9 billion people spending less than $2/day.
Recognizing the need to understand the level and nature of poverty in the region, the 2005 ICP Asia Pacific included a study to measure national and regional poverty (referred to in this report as poverty PPPs) using the international poverty line (IPL) of $1/day or $2/day. The main focus is on the role and suitability of PPP estimates derived from the 2005 ICP Asia Pacific for converting the IPL. Traditionally, PPPs of currencies derived for the consumption aggregate within the ICP have been
2005 ICP Asia Pacific and Purchasing Power Parities for Measuring Poverty
Chapter 1

2005 International Comparison Program in Asia and the Pacific 2
Chapter 1
used in converting the IPL into local currency units for counting the poor. The World Bank has been regularly publishing estimates of national, regional, and global poverty based on IPLs of $1/day and $2/day. ADB has provided estimates of poverty incidence based on the IPL in the theme chapter of Key Indicators 2004 (ADB 2004).
The use of PPP as a proxy for the consumption aggregate of the ICP has attracted considerable criticism. First, as the ICP PPPs are essentially based on prices of goods and services collected for the purpose of international comparisons at the GDP level, they may not adequately reflect the purchasing power of currencies as experienced by the poor in the region. Second, from the description of the methodology for the ICP (see ADB 2007b and Chapter 3 of this report for details), it is clear that the weights used in combining the price data to derive consumption PPPs are from national accounts and, therefore, the weights reflect the average expenditure patterns of the country as a whole. These patterns may bear little resemblance to the purchase patterns of the poor. Those are the two main criticisms against the use of consumption PPPs for estimating poverty. Consequently, a major goal set for the 2005 ICP Asia Pacific is the compilation of PPPs that are particularly suitable for assessing poverty PPPs based on IPLs.
Poverty PPP Study in the Region
Poverty PPPs are important to accurately measure poverty incidence and formulate policies to reduce poverty in the region. Of the 23 participating economies in the 2005 ICP Asia Pacific, 16 expressed their commitment to the poverty PPP study, namely, Bangladesh, Bhutan, Cambodia, Fiji Islands, India, Indonesia, Lao PDR, Malaysia, Maldives, Mongolia, Nepal, Pakistan, Philippines, Sri Lanka, Thailand, and Viet Nam. The 16 devoted additional effort and resources to generate the poverty PPPs.
The principal goal of the study on poverty PPPs was to provide estimates of PPPs that represent a significant improvement over the currently used PPPs for converting the IPL. In pursuing this goal, it was agreed that the poverty PPPs for the 2005 ICP Asia Pacific would be generated by strictly adhering to the guidelines set by the Poverty Advisory Group (PAG) established by the Global Office of the ICP at the World Bank. The PAG approach served as the baseline approach in compiling poverty PPPs.
At the initial stages of the poverty PPP study in the region, it was realized that compilation of meaningful and satisfactory poverty PPPs would require much research on the sensitivity of poverty PPPs to the use of different sources of price data and index number methodologies. While there has been considerable research over the last two decades on methods for general international comparisons,1 surprisingly, little work has focused on producing meaningful PPPs for the study of poverty incidence.
The poverty PPPs component of the 2005 ICP Asia Pacific is essentially a research initiative designed to provide useful input into future work on the compilation of poverty PPPs. Two modest objectives were set for the poverty PPP study in the region. The first was to compile a set of PPPs for currencies of the 16 participating countries for the purpose of converting the IPL based on the methodology endorsed by the PAG. The second objective was to conduct a major investigation into the sensitivity of the estimated PPPs to different sources of price data in addition to the price data gathered as part of the 2005 ICP Asia Pacific. The study would also examine if the derived PPPs are sensitive to the different sets of weights and different aggregation methodologies. The output generated from this objective would serve as a major input into the deliberations on the identification of a suitable approach and methodology for compiling poverty PPPs in the future.
Structure of the Report
The report gives an overview of the work on poverty PPPs and is designed to serve as a research document for future use. The determination and use of the IPL and the role of PPPs for converting the IPL are not commonly known and appreciated even though governments, the general public, and various international aid organizations appear to regularly monitor estimates of the incidence of national, regional, and global poverty. Hence, a major objective of this report is to provide the reader with the general background, conceptual framework, and methodology employed in poverty PPP-related work. In addition, the report also serves as a record of the major findings emanating from this research. It is hoped that the findings will form the basis for further improvements in compiling poverty PPPs in the future.
1 These are adequately documented in the ICP 2003–2006 Handbook (World Bank 2007).

3Research Study on Poverty-Specific Purchasing Power Parities for Selected Countries in Asia and the Pacific
Chapter 1
Chapter 2 gives a brief overview of the basic steps involved in measuring national and regional poverty using the IPL and sets the background for the rest of the report. Chapter 3 reviews the principal aspects of the compilation of PPPs and real aggregates as part of the 2005 ICP Asia Pacific. A proper understanding of the concepts and methods underlying the computation of PPPs for GDP and consumption is deemed necessary to understand the limitations of these PPPs in converting the IPL. Chapter 4 describes a general framework that underpins the compilation of poverty PPPs. The central issues surrounding this activity are described in detail. Chapter 5 presents the methodology for compiling poverty PPPs for the 2005 ICP Asia Pacific
recommended by the PAG. Chapter 6 is devoted to the central research effort of the study. The core of the chapter is the design and conduct of poverty-specific price surveys, and a comparison of the results from the poverty and ICP price surveys. Chapter 7 presents alternative sets of poverty PPPs derived using different sources of price data and different methodologies. The sensitivity analysis in the chapter provides important clues to the future direction of work in this area. Chapter 8 describes the steps and processes involved in determining the IPL and presents several IPLs derived using results from the study. Chapter 9 gives a brief summary and identifies future directions for further work in this important area.

Introduction
Monitoring the incidence and severity of poverty at the national, regional, and global levels is an important step in
developing and implementing policies for reducing poverty in the world. Accurate measurement and compilation of internationally comparable estimates of the incidence of poverty are essential for monitoring the performance of countries against the first and most important of the Millennium Development Goals (MDGs), that of halving absolute poverty in the world by 2015.
Measuring poverty incidence with the use of nationally established poverty lines is a common practice in many countries. An examination of the methods and practices in different countries highlights common elements as well as diversity in practices. For example, across countries there is a common thread in the methodology used for determining poverty lines. Poverty lines are generally based on food and nonfood expenditure components, with the food component essentially determined on the basis of a specific energy requirement. Household expenditure surveys (HES) are the main source of data for this purpose. However, there are subtle differences in the translation of caloric needs into monetary values. Much of the divergence in practices observed across countries is in determining the nonfood poverty line. Differences have also been observed in determining and/or translating national poverty lines for subregions of a given country.
Given the differences in national practices, it is difficult to properly assess the performance of different countries in achieving the first MDG. An obvious strategy in such circumstances is to use for all countries a single poverty line that is referred to as the international poverty line (IPL). The World Bank initiated the use of the IPL, compiling national, regional, and global poverty estimates. It has developed and popularized the use of the IPLs $1/day and $2/day for the purpose.
The $1/day and $2/day International Poverty Lines
Since the early 1990s, the World Bank has been using IPLs in estimating poverty incidence in different countries. These poverty lines may be considered as absolute poverty lines, and the approach is to simply count the number of people whose expenditure is below $1/day or $2/day. The estimates are then deemed comparable across countries as they all refer to a single poverty line. The World Bank procedure is a simple approach that managed to convey to the developed world the powerful message that a sizeable global population lives below $1/day. Therefore, IPLs serve the dual purpose of providing a single yardstick for measuring poverty incidence in different countries, and at the same time creating among developed nations an awareness of the plight of the poor in those countries.
Basic Steps in Measuring National and Regional Poverty with the Use of International Poverty Lines
Chapter 2
5Research Study on Poverty-Specific Purchasing Power Parities for Selected Countries in Asia and the Pacific
Chapter 2
The IPL tends to give an impression of remoteness, and the general perception in different countries is usually that the $1/day and $2/day IPLs are not realistic and do not accurately reflect the national poverty lines actually used in different countries. Further, these poverty lines tend to convey the impression that they are kept constant over time. However, neither of these criticisms of the IPL is valid. The World Bank methodology recognizes the importance of national poverty lines. In fact, the IPLs are determined by calibrating them to be representative of the poverty lines in a large number of developing countries. Chen and Ravallion (2004 and 2007) give a detailed description of this process. This issue is further discussed in Chapter 8 of this report. It was found that many national poverty lines were close to $1/day when they were converted using purchasing power parities (PPPs). Therefore, the decision was made to recommend the use of the IPL $1/day as a global representative of national poverty lines. A similar procedure is employed in updating the IPL over time.2
Use of Purchasing Power Parities of Currencies for Converting IPLs
A crucial step in implementing an IPL is converting it into local currency units. The local currency equivalents of $1/day and $2/day poverty lines are used in conjunction with information on income distribution to arrive at global and regional estimates of poverty incidence. Market exchange rates (MER) are not used to convert the IPL, instead, conversion factors based on the real purchasing power of the currencies are used. The general reluctance of many countries to use poverty incidence estimates based on the IPL is largely due to the misconception that the IPL is converted into local currency units using the MER. A commonly observed fact is that the MER does not accurately reflect the purchasing powers of currencies in low-income countries. In fact, the PPPs of currencies with respect to the United States (US) dollar are usually well below the MER.
2 IPLs are not simply updated using movements in consumer prices within the US or in any other country. Instead, a procedure similar to the one used in 1990, the year when this procedure was first implemented, is repeated. For example, in 1993, $1.08 was found to be representative of the national poverty lines converted into US dollars using PPPs.
If PPPs are to be used for the purpose of converting the IPL, an important question that arises is which of the available PPPs should be used. PPPs are available for each of the major economic aggregates that form the GDP.3 The World Bank approach has been to use the PPP for the consumption aggregate obtained from the ICP to convert the IPL. As PPP data are available only for those countries participating in the ICP, the PPPs used were for the individual consumption expenditure by household (ICEH) aggregate of benchmark years, for all countries participating in the respective benchmark comparisons. For countries that did not participate in the ICP benchmark comparisons, and for the nonbenchmark years when ICP PPPs are not available, the World Bank mainly relied on the extrapolated PPPs reported in the Penn World Tables. In more recent years, it relied on extrapolations compiled within the World Bank for its World Development Indicators publication.
Main Issues with the Current Practice
Over the last few years, the PPP data used in deriving global and regional poverty estimates have attracted considerable attention, and various limitations of the current approach have been identified. Deaton (2000) and Reddy and Pogge (2003) provide a comprehensive summary of some of the relevant issues. Some of the principal issues are listed below.
(i) The ICP PPPs are based on prices of commodities that are not representative of the consumption baskets of the poor.
(ii) The ICP PPPs are weighted averages of commodity-specific price relatives with weights that do not adequately represent the consumption patterns of the poor.
(iii) The aggregation methodology used does not offer a direct comparison of a fixed basket of goods and services consumed.
(iv) The PPPs used are not consistent in their temporal movements between benchmarks.
3 For more details of the range of PPPs available, see ADB 2007b.

2005 International Comparison Program in Asia and the Pacific 6
Chapter 2
A related issue with the practical implementation of this approach is that the PPPs used for converting the IPL are all based on extrapolations from earlier benchmarks of the ICP. The last global comparison was for 1996 based on data collected in 1993. In addition, India last participated in the ICP in 1985. Extrapolations for the People’s Republic
of China, which had not participated in any of the earlier rounds of ICP, are based on work undertaken by individual researchers.4 This means that PPPs used as converters are based on data at least a decade old. It is imperative that PPPs be based on current data, and the 2005 ICP Asia Pacific provides a great opportunity to compile PPPs based on recent data.
4 The most commonly used PPP between the US dollar and the Chinese yuan is from the work Rueon (1996) undertaken for the Organisation for Economic Co-operation and Development (OECD).

Introduction
Measuring poverty with the use of the international poverty lines of $1/day and $2/day requires converting these yardsticks
into local currency units before counting the poor and calculating the incidence of poverty in the countries of the region. What is the best way to convert the IPL? Analysts prefer PPPs of currencies for converting nominal aggregates, like consumption, investment, and GDP expressed in local currency units, into real aggregates expressed in a common currency unit. Exchange rates, which are used in international trade and other transactions, are considered less suitable for compiling real aggregates for comparison across countries. The main objective of this chapter is to present the conceptual framework, the methodology for measuring the PPPs, and an overview of the current estimates of PPPs available from the 2005 ICP Asia Pacific. The contents of this chapter are based on ADB (2007b). Readers may refer to Part 2 of ADB (2007b).
Concept and Uses of Purchasing Power Parities
Over the last four decades, a consensus has emerged on the need to compile PPPs for the purpose of expressing cross-country aggregate data in a common currency unit. There is also an increasing realization that MERs do not reflect the purchasing power of local currencies; and that the exchange
rates are the result of fluctuations in the demand and supply for currencies of different countries, which are influenced by capital movements and other considerations.
In concept, PPPs of currencies are always defined with respect to a reference currency, which needs to be explicitly identified. The PPP of currency A in terms of a reference currency B measures the number of units of currency A that has the same purchasing power as one unit of currency B with respect to a specific basket of goods and services. For example, a PPP at the GDP level of 15 Indian rupees (Rs) per $1 means that Rs15 have the same purchasing power as $1 in terms of purchasing goods and services that make up the GDP.
Identifying the basket of goods and services is crucial for the purposes of interpreting and using a given PPP. The most celebrated example of a PPP is the Big Mac index, which shows the purchasing power of different currencies, or their ability to purchase a single specific commodity, a Big Mac. If a Big Mac costs 12 Hong Kong dollars (HK$) in Hong Kong, China and 5.70 Malaysian ringgit (RM) in Malaysia, then the PPP is HK$2.11/RM1.00. Though the Big Mac-based PPP is simple to understand, it is also easy to appreciate the limited use of such a PPP in comparing the purchasing power of currencies in Hong Kong, China and Malaysia with respect to the basket of goods and services that represent the typical consumption in those economies.
ICP in the Asia and Pacific Region and Purchasing Power Parities
Chapter 3

2005 International Comparison Program in Asia and the Pacific 8
Chapter 3
In practice, PPPs at the GDP level is commonly used for comparing real incomes across countries. As GDP encompasses all goods and services in the domestic market, real per capita incomes are obtained by converting per capita incomes in local currency units into a common or reference currency unit. Part 5 of ADB (2007b) provides PPPs for currencies of 23 participating economies at the GDP level and for broad aggregates such as private consumption, government consumption, and gross fixed capital formation. The breakdown for some of these aggregates is also provided.
A point to note is that it is important to choose the most appropriate and most pertinent PPP for the particular comparison at hand. It is inappropriate to use the GDP-level PPP for the purpose of comparing, for example, total expenditure on food or housing.
Given the availability of PPPs for different benchmark years from various phases of the ICP, PPPs are extensively used5 in assessing the performance of nations and in empirical analyses on catch-up and convergence. Real per capita incomes based on PPPs are used in the construction of the human development index (United Nations Development Programme 2006) and in the study of global and regional inequality. It should be noted that despite the versatility of PPPs, it is still necessary to use exchange rates when trade-related aggregates like imports and the current account balance are being compared.
The critical aspect is the choice of appropriate PPPs for converting a given aggregate in nominal terms. An incorrect choice will result in incorrect conclusions regarding the volumes or real aggregates involved. The term “volume” is used to refer to an aggregate that has been adjusted for price level differences. This is a term that is similar to “quantity” used with respect to a single commodity. This issue is particularly relevant in the context of measuring poverty and translating the IPL into local currency units.
The preceding discussion shows that for purposes of studying poverty, the real aggregates should be derived using PPPs that measure differences in price levels across countries but should focus on the goods and services that are relevant to the poor. Since this report is devoted to issues concerning the compilation of PPPs for measuring
5 See ADB (2007b, 9�12) for a more detailed discussion of theADB (2007b, 9�12) for a more detailed discussion of the uses of PPPs.
poverty, the discussion in the ensuing parts will focus on measurement and the choice of aggregation methodology for compiling poverty PPPs.
Basic Framework for the 2005 ICP Asia Pacific
At the recommendation of the Statistical Commission of the United Nations, work on the ICP with 2005 as the benchmark year began in 2002. Given the extensive and truly global coverage with 146 participating countries, the ICP work for the 2005 benchmark was distributed among regions. The ICP covered five geographic regions—Africa, Asia and Pacific region, Commonwealth of Independent States, Latin America and West Asia, and a sixth region comprising countries involved in the OECD/Eurostat PPP program. ADB assumed the role of regional coordinator of ICP in the Asia and Pacific region.
The coverage of ICP in the region is impressive as it included, for the very first time, both India and the PRC together in an international comparisons exercise. The two are the most populous and fastest growing economies of the world, and account for a majority of the poor in the world. Their participation has reinforced the global nature of the ICP and has provided reliable PPPs for the currencies of these countries based on price data collected following international standards and guidelines. It is useful to note that with the exception of Brunei Darussalam; Hong Kong, China; Macao, China; Singapore; and Taipei,China, most economies in the 2005 ICP Asia Pacific consider poverty measurement and poverty reduction as central issues for their governments.
All 23 participating economies worked in close collaboration with ADB in conducting extensive price surveys in their respective areas. They participated actively in workshops specially designed for the purpose of comparing and validating price data they collected, using specially designed product lists and price surveys.
The main objective of the 2005 ICP Asia Pacific was to compile PPPs at the GDP level as well as at the more disaggregated level. Table 1 shows the broad categories used in the comparisons.
The classification in Table 1 follows the standard national accounts classification of GDP from the expenditure side of the national accounts.

9Research Study on Poverty-Specific Purchasing Power Parities for Selected Countries in Asia and the Pacific
Chapter 3
In implementing the ICP, PPPs were computed at 155 basic headings, which were then aggregated upward to arrive at PPPs for major aggregates.
Methodology for the ICP
The methodology for compiling PPPs and real aggregates is fully set out in the ICP 2003-2006 Handbook, henceforth referred to as the ICP Handbook (World Bank 2007). The handbook describes procedures to be followed at various stages of the implementation of the ICP, and presents various statistical methods in compiling PPPs. This section gives a brief overview of the methodology; further details are in ADB (2007b).
The ICP uses a hierarchical structure in compiling PPPs. At the first stage, basic price data are aggregated to provide PPPs for 155 basic headings, which are progressively aggregated to yield PPPs at the desired level of aggregation. As in the case of the consumer price index (CPI), compiling PPPs requires data on prices as well as weights that reflect the importance of different products.
The following steps are involved in the process of compiling PPPs.
The first and most important step is to prepare a list of goods and services that will be priced in the economies that participated in the 2005 ICP Asia Pacific. The lists are prepared separately for the main aggregates: household consumption, government consumption, and gross fixed capital formation. No price data are collected for imports and exports, as exchange rates are used for the purpose of comparing the balance of trade.
There are two main considerations in making the list of products. The first is that the selected products must be comparable across the participating economies. Comparability of products ensures that their prices can be used in making price comparisons and the resulting price levels are based on comparing “like with like.” The second consideration is representativity of the products included in the list. If price comparisons based on these products are to accurately reflect the price levels in different economies, then the products priced for this purpose must be representative of the consumption of people in different economies. Comparability and representativity are two competing considerations that need to be balanced in preparing the products list.
Table 1. Main Aggregates Used in the 2005 ICP Asia Pacific Comparisons
Gross Domestic Product
1. Individual Consumption Expenditure by Households
01. Food and nonalcoholic beverages
02. Alcoholic beverages, tobacco, and narcotics
03. Clothing and footwear
04. Housing, water, electricity, and gas
05. Furnishings, household equipment, and maintenance
06. Health
07. Transport
08. Communication
09. Recreation and culture
10. Education
11. Restaurants and hotels
12. Miscellaneous goods and services
13. Net purchases abroad
2. Individual Consumption Expenditure by NPISHs
3. Individual Consumption Expenditure by Government
01. Housing
02. Health
03. Recreation and culture
04. Education
05. Social protection
4. Collective Consumption Expenditure by Government
5. Gross Fixed Capital Formation
01. Machinery and equipment
02. Construction
03. Other products
6. Changes in Inventories and Acquisitions Less Disposal of Valuables
01. Changes in inventories
02. Acquisitions less disposal of valuables
7. Balance of Exports and Imports
ICP = International Comparison Program;NPISHs = nonprofit institutions serving households.
2005 International Comparison Program in Asia and the Pacific 10
Chapter 3
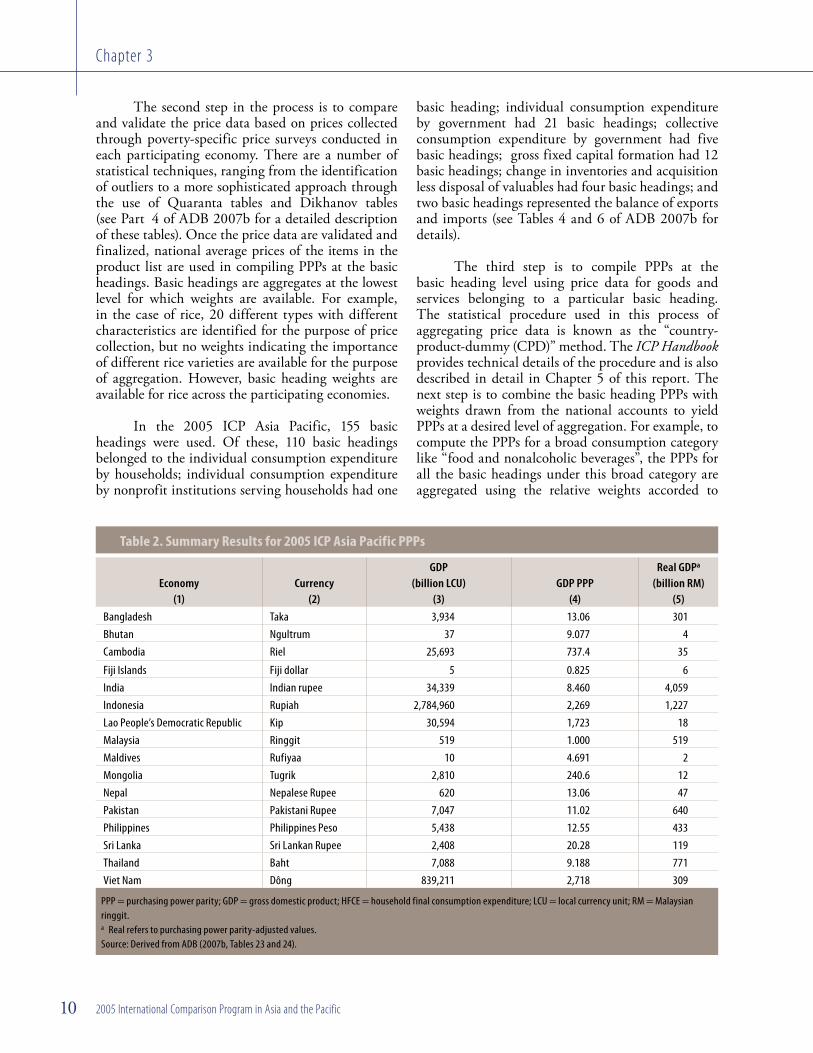
Table 2. Summary Results for 2005 ICP Asia Pacific PPPs
Economy(1)
Currency(2)
GDP (billion LCU)
(3)GDP PPP
(4)
Real GDPa (billion RM)
(5)Bangladesh Taka 3,934 13.06 301 Bhutan Ngultrum 37 9.077 4 Cambodia Riel 25,693 737.4 35
Fiji Islands Fiji dollar 5 0.825 6 India Indian rupee 34,339 8.460 4,059 Indonesia Rupiah 2,784,960 2,269 1,227 Lao People’s Democratic Republic Kip 30,594 1,723 18 Malaysia Ringgit 519 1.000 519 Maldives Rufiyaa 10 4.691 2 Mongolia Tugrik 2,810 240.6 12 Nepal Nepalese Rupee 620 13.06 47 Pakistan Pakistani Rupee 7,047 11.02 640 Philippines Philippines Peso 5,438 12.55 433 Sri Lanka Sri Lankan Rupee 2,408 20.28 119 Thailand Baht 7,088 9.188 771 Viet Nam Dông 839,211 2,718 309
PPP = purchasing power parity; GDP = gross domestic product; HFCE = household final consumption expenditure; LCU = local currency unit; RM = Malaysian ringgit.a Real refers to purchasing power parity-adjusted values.Source: Derived from ADB (2007b, Tables 23 and 24).
The second step in the process is to compare and validate the price data based on prices collected through poverty-specific price surveys conducted in each participating economy. There are a number of statistical techniques, ranging from the identification of outliers to a more sophisticated approach through the use of Quaranta tables and Dikhanov tables (see Part 4 of ADB 2007b for a detailed description of these tables). Once the price data are validated and finalized, national average prices of the items in the product list are used in compiling PPPs at the basic headings. Basic headings are aggregates at the lowest level for which weights are available. For example, in the case of rice, 20 different types with different characteristics are identified for the purpose of price collection, but no weights indicating the importance of different rice varieties are available for the purpose of aggregation. However, basic heading weights are available for rice across the participating economies.
In the 2005 ICP Asia Pacific, 155 basic headings were used. Of these, 110 basic headings belonged to the individual consumption expenditure by households; individual consumption expenditure by nonprofit institutions serving households had one
basic heading; individual consumption expenditure by government had 21 basic headings; collective consumption expenditure by government had five basic headings; gross fixed capital formation had 12 basic headings; change in inventories and acquisition less disposal of valuables had four basic headings; and two basic headings represented the balance of exports and imports (see Tables 4 and 6 of ADB 2007b for details).
The third step is to compile PPPs at the basic heading level using price data for goods and services belonging to a particular basic heading. The statistical procedure used in this process of aggregating price data is known as the “country-product-dummy (CPD)” method. The ICP Handbook provides technical details of the procedure and is also described in detail in Chapter 5 of this report. The next step is to combine the basic heading PPPs with weights drawn from the national accounts to yield PPPs at a desired level of aggregation. For example, to compute the PPPs for a broad consumption category like “food and nonalcoholic beverages”, the PPPs for all the basic headings under this broad category are aggregated using the relative weights accorded to

11Research Study on Poverty-Specific Purchasing Power Parities for Selected Countries in Asia and the Pacific
Chapter 3
different basic headings. In ADB (2007b), a total of 26 categories are used to publish the final results. The Eltetö-Köves-Szulc (EKS) method of aggregation is used in computing PPPs for aggregates above the basic heading level. The EKS method is an index number method used for multilateral price comparisons satisfying some basic properties like transitivity, base invariance, and characteristicity. A full description of these properties is in ADB (2007b, 16-17) and in the ICP Handbook.
Data on expenditure weights are critical to the computation of PPPs. The participating economies were required to provide national average weights for the 155 basic headings. A variety of sources, including expenditure weights from the CPI, HES, government expenditure accounts, and capital expenditure surveys, were used in compiling weights at the national level for all the basic headings (see ADB 2007b). It must be noted that these weights are for the population as a whole and may not reflect the weights or expenditure patterns of any particular segment of the population.
The final step in the process of aggregation is to combine the PPPs of the basic heading to derive an estimate of PPP for GDP for all the participating economies. In the 2005 ICP Asia Pacific, PPPs for different currencies are computed using the Hong Kong dollar as the numeraire currency. Summary results are presented in Part 2, and detailed results in Part 5 of ADB (2007b).
Overview of the Results
Table 2 presents PPPs and real values at the aggregate level. For purposes of illustration, results are presented at the GDP level and for household final consumption expenditure (HFCE) (interchangeably referred to as individual consumption expenditures by households [ICEH]). In this table, the Malaysian ringgit is the reference currency for presenting the PPPs. The aggregation methodology used in computing PPPs ensured that the choice of the reference currency does not alter the relativities between pairs of countries. Column (3) presents
Table 2. Summary Results for 2005 ICP Asia Pacific PPPs (continued)
HFCE (billion LCU)
(6)HFCEa PPP
(7)
Real HFCE (billion RM)
(8)
Exchange Rate (LCU/RM)
(9)
Population (thousand)
(10) 2,987 12.06 248 16.99 136,990
15 8.733 2 11.64 635 20,866 764.0 27 1,081 13,828
4 0.732 5 0.447 842 20,198 7.379 2,737 11.64 1,101,318
1,788,138 1,983 902 2,563 218,869 18,194 1,770 10 2,814 5,651
233 1.000 233 1.000 26,128 4 4.606 1 3.380 294
1,547 247.1 6 318.2 2,548 507 12.52 40 18.84 25,343
5,367 9.796 548 15.72 153,963 3,773 11.44 330 14.55 85,261 1,674 18.94 88 26.54 19,668 4,003 8.261 485 10.62 64,763
486,989 2,800 174 4,188 83,120
2005 International Comparison Program in Asia and the Pacific 12
Chapter 3
GDP for the 16 participating countries, expressed in the local currency units listed in column (2). Column (4) presents PPPs of different currencies expressed relative to the Malaysian ringgit. For example, the PPP for the Indonesian rupiah (Rp) is 2,269. This means that Rp2,269 and RM1.00 have the same purchasing power when goods and services included in the GDP are considered. Column (9) presents the corresponding exchange rates for purposes of comparative analysis. A comparison of the exchange rate of the rupiah with its PPP suggests that the price level in Indonesia is lower in Malaysia.
Table 2 also presents PPPs and real values corresponding to the aggregate representing HFCE.6
The population data in the last column can be used to derive per capita real HFCE, which can be compared across countries. Part 2 of ADB (2007b) gives a more complete description and discussion of results from the 2005 ICP Asia Pacific.
An important aspect that will later be considered in more detail may be noted here. The PPPs for the same currency are different for different aggregates. For example, for the Bangladesh currency, the taka (Tk), the PPP is Tk13.06 when GDP is considered but is lower at Tk12.06 for HFCE. Two points may be noted here. First, if GDP PPPs are used for comparing real HFCE, it is likely that real consumption in Bangladesh will be underestimated, as a higher PPP of Tk13.06 is used in place of Tk12.06. Second, in Bangladesh, consumption goods with a PPP of Tk12.06 are relatively cheaper than investment and other goods that make up the GDP. Hence it is important that appropriate PPPs are used for converting a given real aggregate.
Need for Poverty-Specific PPPs
Thus far, this chapter has provided an overview of the 2005 ICP Asia Pacific methodology and an intuitive understanding of the PPPs. It is important to understand the scope and meaning of PPPs from the 2005 ICP Asia Pacific so as to assess their suitability for the purpose of converting the IPL into a common currency unit.
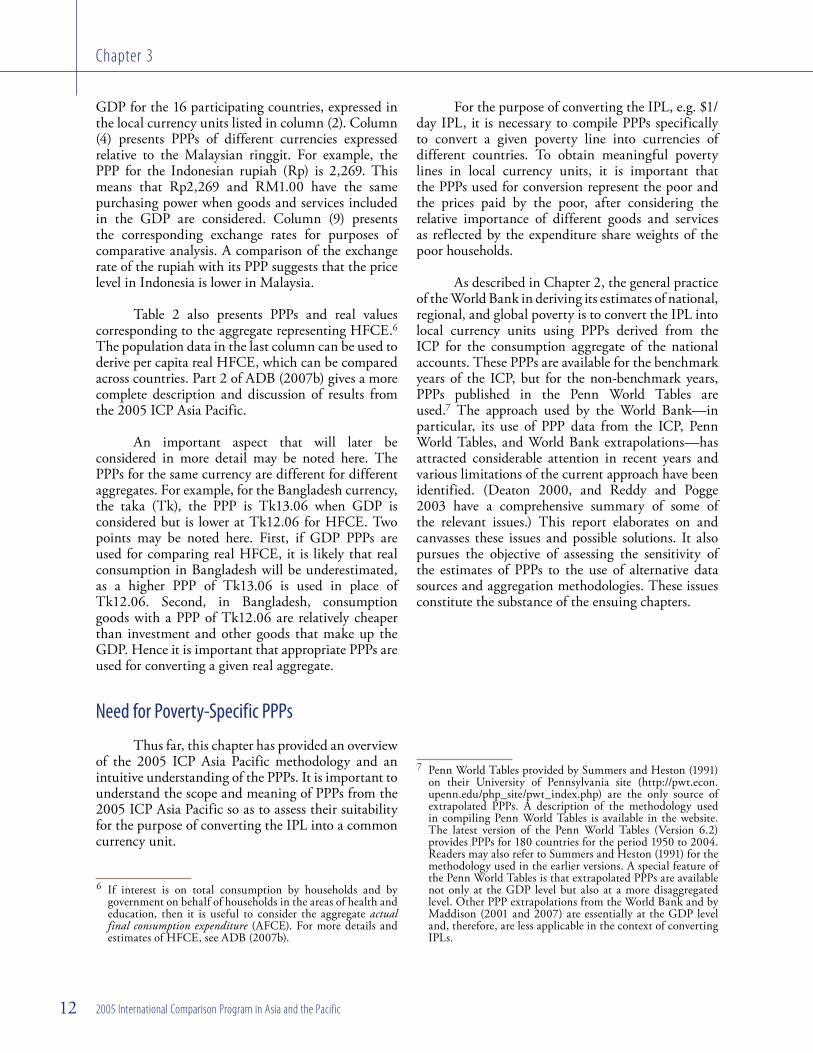
6 If interest is on total consumption by households and by government on behalf of households in the areas of health and education, then it is useful to consider the aggregate actual final consumption expenditure (AFCE). For more details and estimates of HFCE, see ADB (2007b).
For the purpose of converting the IPL, e.g. $1/day IPL, it is necessary to compile PPPs specifically to convert a given poverty line into currencies of different countries. To obtain meaningful poverty lines in local currency units, it is important that the PPPs used for conversion represent the poor and the prices paid by the poor, after considering the relative importance of different goods and services as reflected by the expenditure share weights of the poor households.
As described in Chapter 2, the general practice of the World Bank in deriving its estimates of national, regional, and global poverty is to convert the IPL into local currency units using PPPs derived from the ICP for the consumption aggregate of the national accounts. These PPPs are available for the benchmark years of the ICP, but for the non-benchmark years, PPPs published in the Penn World Tables are used.7 The approach used by the World Bank—in particular, its use of PPP data from the ICP, Penn World Tables, and World Bank extrapolations—has attracted considerable attention in recent years and various limitations of the current approach have been identified. (Deaton 2000, and Reddy and Pogge 2003 have a comprehensive summary of some of the relevant issues.) This report elaborates on and canvasses these issues and possible solutions. It also pursues the objective of assessing the sensitivity of the estimates of PPPs to the use of alternative data sources and aggregation methodologies. These issues constitute the substance of the ensuing chapters.
7 Penn World Tables provided by Summers and Heston (1991) on their University of Pennsylvania site (http://pwt.econ.upenn.edu/php_site/pwt_index.php) are the only source of extrapolated PPPs. A description of the methodology used in compiling Penn World Tables is available in the website. The latest version of the Penn World Tables (Version 6.2) provides PPPs for 180 countries for the period 1950 to 2004. Readers may also refer to Summers and Heston (1991) for the methodology used in the earlier versions. A special feature of the Penn World Tables is that extrapolated PPPs are available not only at the GDP level but also at a more disaggregated level. Other PPP extrapolations from the World Bank and by Maddison (2001 and 2007) are essentially at the GDP level and, therefore, are less applicable in the context of converting IPLs.

Basic Framework for Purchasing Power Parities for Converting Poverty Lines
Introduction
Purchasing power parities, as described in Chapter 3, are essentially price index numbers specially designed for making comparisons
over space, i.e., across regions within a country or across countries. There are essentially three major steps in compiling PPPs. First, determine the basket of goods and services that need to be priced for computing the PPPs. In this step, it is important to ensure that the items selected closely correspond to the aggregate PPP that is being used to convert the aggregate.8 Consistency between the purpose for compiling the PPPs on one hand and the product list on the other hand is essential. Second, collect price data based on a survey framework that adequately accounts for the main outlets used for the purchase of items under consideration. Third, determine the weights to be used in the process of aggregating price data. The weights should accurately reflect the relative importance of a particular item or a specific basic heading. This chapter is devoted to the three steps in compiling PPPs for converting the IPL into local currency units.
8 PPPs are like a price index. Since the price (P), quantity (Q), and value indexes (V) are supposed to satisfy the relationship V = P.Q or, equivalently, Q = V/P, this means that real values or quantities are obtained by dividing the value index by a suitable price index. Therefore, V, P, and Q must refer to the same basket of goods and services.
Product Lists
Based on the meaning accorded to PPPs as spatial price index numbers,9 the items priced for the purpose of PPPs should closely relate to the purpose for which PPPs are compiled. Poverty-specific PPPs are sought principally for converting a given IPL into a local currency unit. Therefore, such PPPs must reflect the general price levels experienced by the poor. An implication is that it is necessary to identify products, goods, and services that are typically consumed by the poor. In establishing a framework for compiling poverty PPPs, it is useful to examine the available options. Three options are discussed here.
ICP Product Lists
A simple option is to use the product lists of the 2005 ICP Asia Pacific and the list of goods and services that have been identified for price surveys within the ICP. As mentioned in Chapter 3, the ICP covers all components of the GDP, which include household consumption, government consumption, and gross fixed capital formation. As poverty-specific PPPs refer to the consumption of poor households, the most appropriate component of the ICP product list is the product list for HFCE. In the Asia and Pacific region, a total of 656 goods and services have been specified for the purpose of price surveys. Table 3
9 See Rao (2004), which discusses spatial price index numbers and PPPs in relation to the compilation of the consumer price index.
Chapter 4

2005 International Comparison Program in Asia and the Pacific 14
Chapter 4
shows a summary of the number of basic headings and the number of products used in the 2005 ICP Asia Pacific for the ICEH, while Appendix 2 of ADB (2007b) gives a breakdown of this list by all basic headings. It should be noted that not all items were priced in all the economies, and not all items were considered representative in all the economies.
For the computation of poverty PPPs to convert poverty lines, the product list and the price data collected from the ICP price surveys may be used. The main issue here is that the goods and services considered in the list are not likely to be representative of the consumption patterns of the poor. For example, to maintain a level of comparability across all the 23 economies that participated in the 2005 ICP Asia Pacific, which included Hong Kong, China and Singapore, and at the same time to ensure representativity of the consumption patterns of the general populations of those economies, the products included in the list are generally of higher quality and may not be relevant to the consumption patterns of the poor in the participating economies.
The problem of pricing higher quality products may not pose a major problem if the relative levels of prices of items in the ICP list are similar to the relative levels of prices of items that are commonly consumed by the poor. For example, if rice of good quality costs Rs15.00 in India and RM2.00 in Malaysia, then this implies a PPP of Rs7.50/RM1.00. If at the same time, rice of a much inferior quality costs Rs7.00 in India and RM1.00 in Malaysia, then the PPP for the lower quality rice is Rs7.00/RM1.00. In this case, even though the better quality rice is not representative of the consumption pattern of the poor, the PPP based on this item is a reasonable approximation of the PPP based on the lower quality rice.
In assessing the suitability of the items list used in the 2005 ICP Asia Pacific for the purpose of poverty PPPs, it is necessary to examine if the relative price levels for the two baskets—the 2005 ICP Asia Pacific basket and the basket of goods and services that are relevant to the poor—are similar. If the relative price structures for these two baskets are similar, then the 2005 ICP Asia Pacific items list and the prices collected as part thereof may be used. However, there is little empirical evidence that can be used in making such judgments.
ICP Products Representative of the Consumption Patterns of the Poor
Because the list of items used in the 2005 ICP Asia Pacific were drawn up without considering the requirements of the poverty PPPs, one can determine if there is a subset of items that may be considered representative of or relevant to the consumption patterns of the poor. This strategy was tried as part of the study. National statisticians attending various workshops during the course of the 2005 ICP Asia Pacific and the poverty PPP study were requested to provide their subjective indication of whether or not a particular item can be considered as representative of the poor in their respective countries. On an experimental basis, the data were collected for items belonging to the two major expenditure groups relevant to the poor, i.e., food and clothing. Table 4 summarizes these information.
Of the 211 items under the food and nonalcoholic beverages in the 2005 ICP Asia Pacific product list, Bangladesh considered 115 as relevant to the general population and only 71 as relevant to the poor. In general, more products were classified as representative of the general population than of the
Table 3. Number of Basic Headings and Items for Major Individual Consumption Expenditures by Households
DescriptionNumber of
Basic HeadingsNumber of
Specified Items
Food and nonalcoholic Beverages 29 211Alcoholic beverages, tobacco, and narcotics 5 19Clothing and footwear 5 71Housing, water, electricity, and other fuels 7 14Furnishings, household equipment, and routine maintenance 13 82Health 7 70Transport 13 48Communication 3 14Recreation and culture 13 61Education 1 6Restaurants and hotels 2 21Miscellaneous goods and services 10 39Total 108 656
Source: Table 2 and Appendix 2 of ADB (2007b).

15Research Study on Poverty-Specific Purchasing Power Parities for Selected Countries in Asia and the Pacific
Chapter 4
poor. However, there were exceptions. In Bhutan, 88 items were considered representative of the general population compared with 99 items for the poor. A similar comparison appears to hold for clothing and footwear.
In general, this approach of identifying items representative of the poor from the 2005 ICP Asia Pacific list has not proved useful. Part of the problem stems from the fact that the concept of “representativity” seems to be difficult to grasp and implement.10 The national statisticians were unable to provide an accurate indication of the representativity of the items included in the 2005 ICP Asia Pacific list. Therefore, the possibility of using a subset of
10 The difficulty associated with the concept of “representativity” was also reflected in the price surveys and eventual price data submitted to the Regional Office. In several cases, many commodities that were identified by country representatives as being representative were not priced while, at the same time, several commodities that were identified as not representative were priced and data were submitted. Mainly due to the problem associated with representativity and inconsistencies in the understanding of this concept in the participating countries, the use of the aggregation method, CPRD method, was abandoned.
the items considered relevant to the poor had to be abandoned during the course of the study.
Poverty-Specific Product List
Given that infrastructure is in place for conducting price surveys for the 2005 ICP Asia, it may be possible to identify and price a list of products considered typical of the consumption of poor households in countries participating in the poverty PPPs study. The idea here is to use a separate product list taking into consideration the possibility that the relative price levels across countries may differ for goods and services that are typically consumed by the poor and those consumed by the general population.
The process of identifying the list of items to be priced and establishing a framework for conducting the poverty-specific price surveys is very resource-intensive. The 2005 ICP Asia Pacific product list and the structured product description (SPD) associated with the product specifications can be used as a starting point. These product lists can then be modified using input from national statisticians involved in compiling CPI numbers
Table 4. Representativity of Food and Nonalcoholic Beverages and Clothing and Footwear of the General Population versus the Poor Population
Country
Food and Nonalcoholic Beverages Clothing and Footwear
General Poor General Poor
Bangladesh 115 71 34 31Bhutan 88 99 46 35Cambodia 125 65 52 37Fiji Islands 131 127 57 46India 109 162 53 58Indonesia 188 89 69 34Lao People’s Democratic Republic 100 35 47 9Malaysia 159 161 68 68Maldives 79 65 41 24Mongolia 94 68 54 42Nepal 67 80 37 32Pakistan 105 107 42 26Philippines 127 78 45 36Sri Lanka 121 159 55 29Thailand 151 80 62 30Viet Nam 166 165 62 60Number of Products 211 71

2005 International Comparison Program in Asia and the Pacific 16
Chapter 4
and researchers/statisticians working on measuring poverty in different areas.
Several advantages are associated with this approach.
(i) The main advantage of this approach is that the final set of poverty PPPs can be considered relevant for poverty analysis as the prices explicitly refer to the goods and services that enter the consumption of poor households. To compute the necessary PPPs, these price data can be combined with expenditure weights derived from the HES.
(ii) Preparing product lists at the regional or subregional level is consistent with the approach used in the 2005 ICP Asia Pacific.
(iii) The poverty-specific price surveys approach also allows selecting the outlets from which price data are collected. The 2005 ICP Asia Pacific prices are typically national average prices and therefore, prices were collected from all types of outlets. The price quotations were then averaged over outlets and regions to form a national average price. However, for poverty PPPs, price surveys need not cover certain types of outlets that are not typically used by poorer sections of the population. Instead, the poverty-specific price surveys could focus on outlets such as general markets and weekly fairs organized on a regular basis. It is not that higher income households do not buy from these outlets, but that low-income households use mainly these outlets.
(iv) The poverty-specific price surveys approach also allows collection of prices on both food and nonfood items. While HES can be used in certain instances as a source of data on prices paid by households for food items, such surveys do not provide information on prices paid for nonfood items of expenditure. This issue is considered further in Chapter 6 where unit values for certain consumption
items derived from the household surveys are compared with price data collected as a part of poverty-specific price surveys.
(v) Involving countries in preparing the product lists for monitoring movements in prices paid by the poor will enhance their participation and create a sense of ownership of the results obtained.
(vi) Conducting these surveys will strengthen and enhance the statistical capacity of the participating countries. The poverty-specific price surveys may be the basis for the compilation of price index numbers for low-income groups in these countries. This type of information is crucial to the preparation and monitoring of poverty as part of the poverty reduction strategy activities undertaken in many countries as a means of achieving the MDGs.
Two major questions arise if this approach is implemented. First, what are the goods and services that are typical of the consumption patterns of poor households? Without knowing who the poor are, it is difficult to discuss the types of goods and services they purchase. Obviously the information from the HES can help identify the important goods and services through the expenditure shares and give some information on the prices paid by the households. Well-established HES are necessary to establish the product lists suitable for poverty PPP work.
The second question is, are the national statisticians and poverty researchers adequately informed and equipped to establish a judgmental list of products to be priced in markets? Though this is a question that is difficult to answer, it is possible that local knowledge and experience can be useful in preparing a product list for poverty PPP work.
A major milestone for the poverty PPP study in the Asia and Pacific region is the collection and use of price data for products considered relevant to the consumption patterns of the poor. The actual implementation process is described in Chapter 6 of this report.

17Research Study on Poverty-Specific Purchasing Power Parities for Selected Countries in Asia and the Pacific
Chapter 4
Price Data
In the 2005 ICP Asia Pacific, price data were collected through extensive price surveys conducted in the participating economies, and national averages of prices of the products were submitted to the Regional Office. Appendix 3 of ADB (2007b) gives detailed accounts of the experiences of the 23 participating economies, including the survey frameworks used.
Two particular aspects of the 2005 ICP Asia Pacific prices may render the collected price data less effective for the purpose of compiling PPPs for converting poverty lines. First, as national average prices, the prices were necessarily collected from all types of outlets, including those that were not patronized by the poor. For example, outlets such as supermarkets are of limited use as far as the poor are considered. Second, prices tend to be influenced by the service aspects associated with the outlets. For example, air-conditioned supermarkets with parking facilities may include the costs of those services in the prices of the products. Thus, the use of national average prices that include price data from outlets that are not generally used by the poor may overstate the prices paid by the poor.
A related and well-researched issue is whether the poor pay higher prices for the purchases they make.11 For the purpose of compiling poverty PPPs, this issue is not directly relevant. What is relevant is if the reason for the higher prices is the typically small quantities of purchases made by the poor. The units of purchases for which price data were collected as part of the 2005 ICP Asia Pacific tended to be a lot larger than what could be relevant to the poor.
Table 5 compares the units of purchases used in the 2005 ICP Asia Pacific and what may be more typical for the poor. The table lists four products that are in the 2005 ICP Asia Pacific product list that could be considered as important items in the consumption patterns of the poor. For example, the poor in many countries in South, Southeast, and East Asia consume coarse rice. However, the 2005 ICP Asia Pacific price surveys priced items that are purchased in quantities of 10 kilograms while the poor typically purchase much smaller quantities.
11 The studies of Musgrove and Galindo (1988); Fabricant, Kamara, and Mills (1990); Rao (2000); and Attanasio and Frayne (2006) are a few that focus on this issue.
Basically the discussion here illustrates why the price data collected as part of the 2005 ICP Asia Pacific price surveys may not be representative of the prices paid by the poor. The question, however, is whether the quantity of purchase and differences in prices paid by the poor and nonpoor will have any real effect on the PPPs. This is one of the central questions pursued in this study, and the question of sensitivity of the results is further considered in Chapters 6 and 7 of this report.
Expenditure Share Weights
The numerical values of PPPs, like any standard price index numbers used in measuring temporal changes in prices, are determined, first, by the price relatives for different items in the product list and, second, by the weights used in aggregating the price relatives. A related determinant is, obviously, the index number formula used in the actual computation. The selection of product lists and the collection of price data in compiling poverty PPPs have been discussed in the previous two sections. This section discusses the suitability of using weights from the 2005 ICP Asia Pacific for the purpose of computing poverty PPPs.
Given the main objective of compiling PPPs for the purpose of converting poverty lines, the weights used in compiling poverty PPPs must reflect the importance that the poor in different countries attach to different commodities and commodity groups. The question is whether the weights used in computing PPPs for the 2005 ICP Asia Pacific adequately represent the purchase patterns as reflected by the expenditure shares of the poor. At the conceptual level, the weights used in the 2005 ICP Asia Pacific are drawn from the national accounts
Table 5. Comparison of Quantities in the 2005 ICP Asia Pacific and in the Poverty-Specific Price Surveys
ProductItem Priced
ICP PovertyCoarse rice 10 kg 1 kgBeef — nonspecific cut 1 kg 250 gChillis — dried, red 100 g 50 gCandle 1 piece from a pack
of 4–6 candles1 piece
g = gram; kg = kilogram.
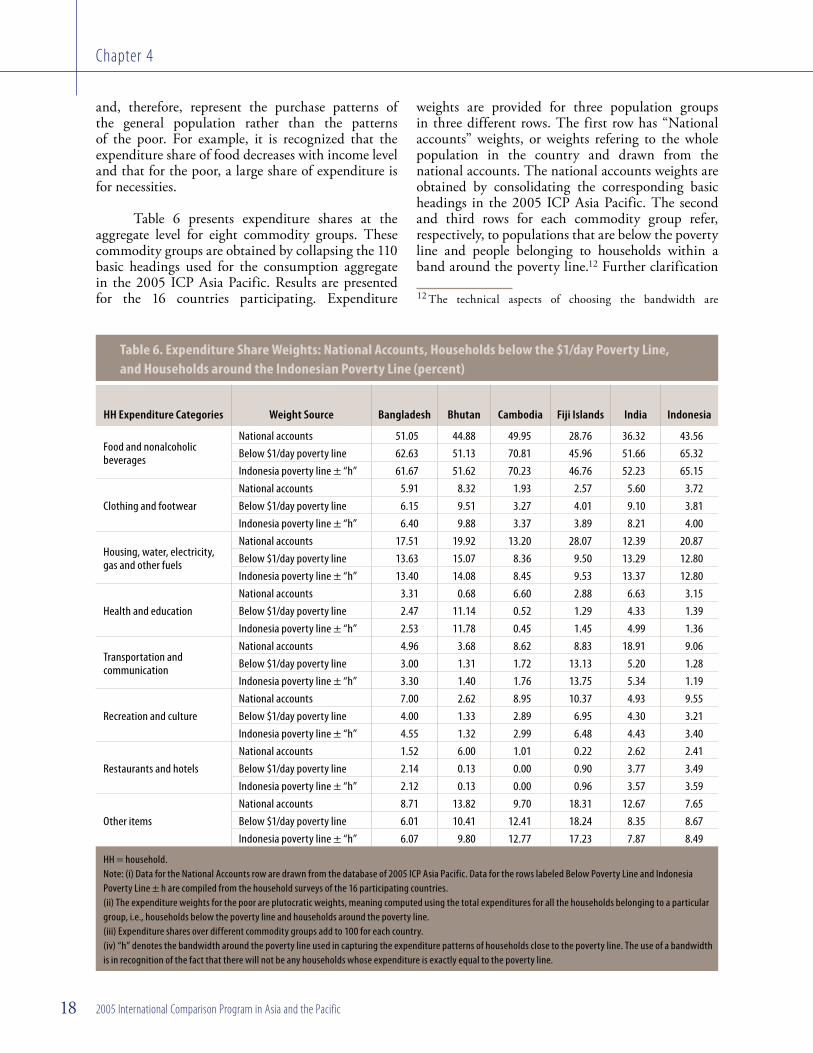
2005 International Comparison Program in Asia and the Pacific 18
Chapter 4
Table 6. Expenditure Share Weights: National Accounts, Households below the $1/day Poverty Line, and Households around the Indonesian Poverty Line (percent)
HH Expenditure Categories Weight Source Bangladesh Bhutan Cambodia Fiji Islands India Indonesia
Food and nonalcoholic beverages
National accounts 51.05 44.88 49.95 28.76 36.32 43.56Below $1/day poverty line 62.63 51.13 70.81 45.96 51.66 65.32Indonesia poverty line ± “h” 61.67 51.62 70.23 46.76 52.23 65.15
Clothing and footwearNational accounts 5.91 8.32 1.93 2.57 5.60 3.72Below $1/day poverty line 6.15 9.51 3.27 4.01 9.10 3.81Indonesia poverty line ± “h” 6.40 9.88 3.37 3.89 8.21 4.00
Housing, water, electricity, gas and other fuels
National accounts 17.51 19.92 13.20 28.07 12.39 20.87Below $1/day poverty line 13.63 15.07 8.36 9.50 13.29 12.80Indonesia poverty line ± “h” 13.40 14.08 8.45 9.53 13.37 12.80
Health and educationNational accounts 3.31 0.68 6.60 2.88 6.63 3.15Below $1/day poverty line 2.47 11.14 0.52 1.29 4.33 1.39Indonesia poverty line ± “h” 2.53 11.78 0.45 1.45 4.99 1.36
Transportation and communication
National accounts 4.96 3.68 8.62 8.83 18.91 9.06Below $1/day poverty line 3.00 1.31 1.72 13.13 5.20 1.28Indonesia poverty line ± “h” 3.30 1.40 1.76 13.75 5.34 1.19
Recreation and cultureNational accounts 7.00 2.62 8.95 10.37 4.93 9.55Below $1/day poverty line 4.00 1.33 2.89 6.95 4.30 3.21Indonesia poverty line ± “h” 4.55 1.32 2.99 6.48 4.43 3.40
Restaurants and hotelsNational accounts 1.52 6.00 1.01 0.22 2.62 2.41Below $1/day poverty line 2.14 0.13 0.00 0.90 3.77 3.49Indonesia poverty line ± “h” 2.12 0.13 0.00 0.96 3.57 3.59
Other itemsNational accounts 8.71 13.82 9.70 18.31 12.67 7.65Below $1/day poverty line 6.01 10.41 12.41 18.24 8.35 8.67Indonesia poverty line ± “h” 6.07 9.80 12.77 17.23 7.87 8.49
HH = household.Note: (i) Data for the National Accounts row are drawn from the database of 2005 ICP Asia Pacific. Data for the rows labeled Below Poverty Line and Indonesia Poverty Line ± h are compiled from the household surveys of the 16 participating countries. (ii) The expenditure weights for the poor are plutocratic weights, meaning computed using the total expenditures for all the households belonging to a particular group, i.e., households below the poverty line and households around the poverty line.(iii) Expenditure shares over different commodity groups add to 100 for each country. (iv) “h” denotes the bandwidth around the poverty line used in capturing the expenditure patterns of households close to the poverty line. The use of a bandwidth is in recognition of the fact that there will not be any households whose expenditure is exactly equal to the poverty line.
Table 6. Expenditure Share Weights: National Accounts, Households below the $1/day Poverty Line, and Households around the Indonesian Poverty Line (percent) (continued)
Lao People’s Democratic Republic Malaysia Maldives Mongolia Nepal Pakistan Philippines Sri Lanka Thailand Viet Nam
50.12 19.70 27.51 40.58 50.52 51.03 46.05 39.97 17.74 33.9576.18 52.88 55.92 72.70 59.09 55.53 63.80 71.32 57.18 55.1473.95 52.29 53.27 72.17 57.46 54.45 63.42 71.81 57.09 54.73
1.85 2.51 4.25 12.23 6.43 7.84 2.27 10.05 7.78 3.831.99 3.38 4.40 5.37 6.28 8.79 2.50 2.67 2.58 4.672.33 3.07 4.42 5.69 6.17 9.02 2.53 2.63 2.43 4.74
13.05 19.46 35.63 18.82 14.36 14.18 14.56 8.22 8.01 16.3210.30 19.13 10.98 7.51 15.46 16.51 14.49 12.64 20.46 16.4110.77 19.91 10.46 7.55 16.56 17.21 14.57 12.85 20.63 16.48
2.28 2.71 5.89 1.50 7.79 5.90 2.71 2.65 9.92 7.811.37 1.10 3.73 0.60 4.25 4.20 1.01 1.50 0.98 3.221.45 0.85 3.33 0.51 4.29 4.04 1.01 1.30 0.95 3.15
12.27 21.12 9.66 9.97 4.73 7.48 10.03 20.70 19.54 12.852.22 7.00 5.21 2.44 2.02 2.88 3.28 2.07 4.75 4.292.63 7.66 5.55 2.50 2.18 3.27 3.31 1.99 5.03 4.778.08 13.03 6.01 7.34 5.93 7.00 10.15 3.62 19.10 14.512.23 6.61 4.83 1.62 5.29 2.74 5.63 1.52 5.76 5.832.75 7.47 7.00 1.82 5.68 2.54 5.81 1.34 5.69 5.891.07 1.25 3.83 1.94 1.02 0.40 4.40 0.42 1.86 1.080.53 1.48 5.31 1.85 1.04 2.35 3.53 2.00 3.52 1.720.63 1.56 5.56 1.81 1.03 2.42 3.59 1.99 3.52 1.81
11.29 20.16 7.22 7.58 9.20 6.19 9.86 14.35 16.06 9.615.14 8.38 9.59 7.84 6.60 7.03 5.78 6.25 4.77 8.725.50 7.17 10.37 7.96 6.60 7.02 5.74 6.13 4.67 8.47
and, therefore, represent the purchase patterns of the general population rather than the patterns of the poor. For example, it is recognized that the expenditure share of food decreases with income level and that for the poor, a large share of expenditure is for necessities.
Table 6 presents expenditure shares at the aggregate level for eight commodity groups. These commodity groups are obtained by collapsing the 110 basic headings used for the consumption aggregate in the 2005 ICP Asia Pacific. Results are presented for the 16 countries participating. Expenditure
weights are provided for three population groups in three different rows. The first row has “National accounts” weights, or weights refering to the whole population in the country and drawn from the national accounts. The national accounts weights are obtained by consolidating the corresponding basic headings in the 2005 ICP Asia Pacific. The second and third rows for each commodity group refer, respectively, to populations that are below the poverty line and people belonging to households within a band around the poverty line.12 Further clarification
12 The technical aspects of choosing the bandwidth are

19Research Study on Poverty-Specific Purchasing Power Parities for Selected Countries in Asia and the Pacific
Chapter 4
Table 6. Expenditure Share Weights: National Accounts, Households below the $1/day Poverty Line, and Households around the Indonesian Poverty Line (percent)
HH Expenditure Categories Weight Source Bangladesh Bhutan Cambodia Fiji Islands India Indonesia
Food and nonalcoholic beverages
National accounts 51.05 44.88 49.95 28.76 36.32 43.56Below $1/day poverty line 62.63 51.13 70.81 45.96 51.66 65.32Indonesia poverty line ± “h” 61.67 51.62 70.23 46.76 52.23 65.15
Clothing and footwearNational accounts 5.91 8.32 1.93 2.57 5.60 3.72Below $1/day poverty line 6.15 9.51 3.27 4.01 9.10 3.81Indonesia poverty line ± “h” 6.40 9.88 3.37 3.89 8.21 4.00
Housing, water, electricity, gas and other fuels
National accounts 17.51 19.92 13.20 28.07 12.39 20.87Below $1/day poverty line 13.63 15.07 8.36 9.50 13.29 12.80Indonesia poverty line ± “h” 13.40 14.08 8.45 9.53 13.37 12.80
Health and educationNational accounts 3.31 0.68 6.60 2.88 6.63 3.15Below $1/day poverty line 2.47 11.14 0.52 1.29 4.33 1.39Indonesia poverty line ± “h” 2.53 11.78 0.45 1.45 4.99 1.36
Transportation and communication
National accounts 4.96 3.68 8.62 8.83 18.91 9.06Below $1/day poverty line 3.00 1.31 1.72 13.13 5.20 1.28Indonesia poverty line ± “h” 3.30 1.40 1.76 13.75 5.34 1.19
Recreation and cultureNational accounts 7.00 2.62 8.95 10.37 4.93 9.55Below $1/day poverty line 4.00 1.33 2.89 6.95 4.30 3.21Indonesia poverty line ± “h” 4.55 1.32 2.99 6.48 4.43 3.40
Restaurants and hotelsNational accounts 1.52 6.00 1.01 0.22 2.62 2.41Below $1/day poverty line 2.14 0.13 0.00 0.90 3.77 3.49Indonesia poverty line ± “h” 2.12 0.13 0.00 0.96 3.57 3.59
Other itemsNational accounts 8.71 13.82 9.70 18.31 12.67 7.65Below $1/day poverty line 6.01 10.41 12.41 18.24 8.35 8.67Indonesia poverty line ± “h” 6.07 9.80 12.77 17.23 7.87 8.49
HH = household.Note: (i) Data for the National Accounts row are drawn from the database of 2005 ICP Asia Pacific. Data for the rows labeled Below Poverty Line and Indonesia Poverty Line ± h are compiled from the household surveys of the 16 participating countries. (ii) The expenditure weights for the poor are plutocratic weights, meaning computed using the total expenditures for all the households belonging to a particular group, i.e., households below the poverty line and households around the poverty line.(iii) Expenditure shares over different commodity groups add to 100 for each country. (iv) “h” denotes the bandwidth around the poverty line used in capturing the expenditure patterns of households close to the poverty line. The use of a bandwidth is in recognition of the fact that there will not be any households whose expenditure is exactly equal to the poverty line.
Table 6. Expenditure Share Weights: National Accounts, Households below the $1/day Poverty Line, and Households around the Indonesian Poverty Line (percent) (continued)
Lao People’s Democratic Republic Malaysia Maldives Mongolia Nepal Pakistan Philippines Sri Lanka Thailand Viet Nam
50.12 19.70 27.51 40.58 50.52 51.03 46.05 39.97 17.74 33.9576.18 52.88 55.92 72.70 59.09 55.53 63.80 71.32 57.18 55.1473.95 52.29 53.27 72.17 57.46 54.45 63.42 71.81 57.09 54.73
1.85 2.51 4.25 12.23 6.43 7.84 2.27 10.05 7.78 3.831.99 3.38 4.40 5.37 6.28 8.79 2.50 2.67 2.58 4.672.33 3.07 4.42 5.69 6.17 9.02 2.53 2.63 2.43 4.74
13.05 19.46 35.63 18.82 14.36 14.18 14.56 8.22 8.01 16.3210.30 19.13 10.98 7.51 15.46 16.51 14.49 12.64 20.46 16.4110.77 19.91 10.46 7.55 16.56 17.21 14.57 12.85 20.63 16.48
2.28 2.71 5.89 1.50 7.79 5.90 2.71 2.65 9.92 7.811.37 1.10 3.73 0.60 4.25 4.20 1.01 1.50 0.98 3.221.45 0.85 3.33 0.51 4.29 4.04 1.01 1.30 0.95 3.15
12.27 21.12 9.66 9.97 4.73 7.48 10.03 20.70 19.54 12.852.22 7.00 5.21 2.44 2.02 2.88 3.28 2.07 4.75 4.292.63 7.66 5.55 2.50 2.18 3.27 3.31 1.99 5.03 4.778.08 13.03 6.01 7.34 5.93 7.00 10.15 3.62 19.10 14.512.23 6.61 4.83 1.62 5.29 2.74 5.63 1.52 5.76 5.832.75 7.47 7.00 1.82 5.68 2.54 5.81 1.34 5.69 5.891.07 1.25 3.83 1.94 1.02 0.40 4.40 0.42 1.86 1.080.53 1.48 5.31 1.85 1.04 2.35 3.53 2.00 3.52 1.720.63 1.56 5.56 1.81 1.03 2.42 3.59 1.99 3.52 1.81
11.29 20.16 7.22 7.58 9.20 6.19 9.86 14.35 16.06 9.615.14 8.38 9.59 7.84 6.60 7.03 5.78 6.25 4.77 8.725.50 7.17 10.37 7.96 6.60 7.02 5.74 6.13 4.67 8.47
is necessary here as to which country’s poverty line is used. Since Table 6 is for illustration, the second row refers to $1/day poverty line while the third row refers to Indonesia’s poverty line. Both poverty lines were converted into different local currency units using PPPs derived as part of this study. However, the main conclusions drawn from Table 6 are expected to hold even if the poverty line of some other country is used. The process of computing these PPPs is further explained in Chapters 5 and 7.
considered in detail in Chapter 5 of this report.
The expenditure share weights in Table 6 exhibit some important patterns that are consistent with prior expectations on the spending patterns of the poor versus the patterns of the general population. As expected, the expenditures on food and nonalcoholic beverages by the poor households below the poverty line tended to be significantly larger. The shares of food and nonalcoholic beverages are 62.63% for the poor and 51.05% for the general population in Bangladesh. The share of food expenditure for the general population for Bangladesh tends to decrease as the relative income level of the country increases. The lowest shares for food and nonalcoholic beverages

2005 International Comparison Program in Asia and the Pacific 20
Chapter 4
are observed for Thailand and Malaysia followed by the Maldives and Fiji Islands; the highest shares are recorded in Pakistan, Nepal, Lao PDR, and Cambodia. The trends for households around the poverty line are similar. Table 6 also shows similar trends for other consumption categories such as clothing and footwear and recreation and culture.
The general observations here also apply to other basic headings in general. The expenditure shares for individual basic headings such as rice, other cereals, bread and bakery products, etc., reveal not only the spending patterns of the poor in different countries but also subregional differences in the type of goods consumed. This aspect needs to be adequately accounted for in computing the PPPs.
The expenditure weights in Table 6 show systematic and significant differences in the purchase patterns of the general population and of the poor population below and around the poverty line. This means that the numerical values of the PPPs derived could be significantly affected by the choice of the weights used. If the PPPs are shown to be sensitive to the weights used, then it is necessary to ensure that the weights used can adequately represent the purchase patterns of the poor.
The past World Bank practice of using ICP PPPs for the consumption aggregate implies that the PPPs are derived using price data from the ICP and are aggregated using the expenditure patterns from the national accounts, which essentially reflect the patterns of the general population. It is possible that the numerical values of these PPPs could change if weights based on the expenditure patterns of the poor are used instead. This aspect of the World Bank approach has received considerable attention and criticism from researchers and practitioners.
The Reference Population—Who Are the Poor?
The reference population for compiling PPPs for the 2005 ICP Asia Pacific is clearly the whole population. Price data used in computing the PPPs refer to the national average prices of the items included in the product list. Such prices are based on surveys conducted in the whole country covering the general population. Similarly, the weights used in aggregating from the basic heading level upward are from national accounts and represent the whole
population. There may be practical issues associated with the compilation of weights and collection of prices, but it is clear that the 2005 ICP Asia Pacific covers the whole country and therefore the reference population is the whole population.
If the ICP PPP approach is to be adopted for purposes of poverty PPPs, it is necessary to identify the segment of the population in each of the 16 participating countries for which the poverty PPPs are representative. If price data are to be collected for the purpose of poverty PPPs, these data need to refer to the prices paid by the poor for items that are considered representative of their consumption patterns. Similarly, the expenditure shares are expected to reflect the spending patterns of the poor. In both of these instances, it is necessary to identify the “poor” before the product lists are constructed and price data are collected.
The 2005 ICP Asia Pacific comparisons are less problematic as they cover the whole country, whereas poverty PPP requires some focus on identifying the target population to which the PPPs refer. This step is crucial in that all the subsequent steps—identifying the goods and services that are representative of the consumption patterns of the poor and the expenditure weights needed in the aggregation process—all depend on the reference population.
Circularity is implicit in the process outlined here. The PPPs are being compiled for purposes of identifying the poor in different countries. However, the preceding discussion suggests that it is necessary to first identify the poor so as to derive meaningful PPPs for converting the IPL. This problem has been dealt with by Pradhan (2001) and Deaton (2004). Pradhan examines this issue in the context of setting a poverty line for Indonesia whereas Deaton uses India and Indonesia. The circularity problem can be tackled using an iterative process if some useful convergence properties associated with various approaches could be established. The iterative process consists of three steps.
Step 1. Start with an initial reference population in each country. This population may refer to all those households with expenditure around the poverty line.13 The poverty
13 The whole population below the poverty line can be used instead of just the population around the poverty line. Deaton (2004) uses Kernel smoothing to determine the optimal bandwidth around the poverty line to determine the households to be included in that group around the poverty

21Research Study on Poverty-Specific Purchasing Power Parities for Selected Countries in Asia and the Pacific
Chapter 4
line in each country may be obtained by converting the poverty line of a selected country into the currency of all the other countries using an appropriate currency converter—one may use the Penn World Tables or the World Bank PPP for private consumption as a starting point, or start with just exchange rates.14
Step 2. Derive PPPs for poverty line conversion using price data from each country and expenditure share weights for those households identified as poor in the first step.
Step 3. The process in Step 1 is repeated by using the PPPs derived in Step 2 to convert the reference country’s poverty line into different local currency units. This repetitive process is continued until the PPPs converge.
Several points concerning the iterative method must be noted.
(i) The three-step approach can be used only for countries where there are well-established and reliable household expenditure or living standard measurement surveys.
(ii) For purposes of integrating this work with the 2005 ICP Asia Pacific, it is necessary to have data from more recently conducted surveys, if possible within the last 5 years. Several countries in the Asia and Pacific region have data from 1999 or 2000 surveys.
(iii) It is necessary to further examine the nature of the reference populations resulting from the iterative process. In particular, it is useful to check if the reference populations are insensitive to the choice of the starting poverty lines. If the result shows sensitivity
line. A similar approach needs to be used to determine those households just above the poverty line and to be included in the set of poor households. This issue is discussed further in Chapter 5.
14Deaton (2004) converts the Indian poverty line into Indonesian currency and uses the Indian poverty line in Indian rupees and in Indonesian rupiah as the poverty lines for India and Indonesia, respectively. The PPPs from this process may not be invariant to the choice of the country and its poverty line used for purposes of identifying the reference populations in different countries.
then it is necessary to find an alternative approach.
(iv) It is also necessary to check if the iterative process converges to the same set of PPPs irrespective of which conversion factor is used in converting the reference country’s poverty line in Step 1.
(v) Since the PPPs are likely to be sensitive to the selection of the reference country and its poverty line, a single IPL, the $1/day or $2/day poverty line, may be used as a starting point instead of the poverty line of a selected country. (On the basis of the general properties of this iterative method, it is likely that the PPPs for $1/day and $2/day could result in two different PPPs.)
The iterative scheme as described forms the basis for all the computations undertaken as part of the study. The actual steps used and all the practical considerations associated with the determination of the reference population are explained in detail in Chapter 5.
Summary of Issues
This chapter has dealt with various building blocks that provide a framework for the computation of PPPs for converting poverty lines for the purpose of international comparisons. The discussion of the issues indicates that while the approach used for the purpose of the 2005 ICP Asia Pacific can provide a conceptual framework for poverty PPPs, the same approach needs to be modified if the resulting PPPs are to provide meaningful converters for poverty lines. The most critical issue is that of identifying the reference population. This problem requires an analytical approach that can simultaneously determine the PPPs and the reference populations through the use of an iterative process.
Data-related issues are also significant. The process underlying the preparation of the product lists for the 2005 ICP Asia Pacific, and the need to achieve balance between representativity and comparability, imply that the goods and services included in the 2005 ICP Asia Pacific product list are not likely to be representative of the purchases made by the poor in the countries under consideration. Therefore, using price information for the products that may not adequately represent the purchases of
2005 International Comparison Program in Asia and the Pacific 22
Chapter 4
the poor is likely to make the PPPs based on such price data less than ideal. In a similar vein, it may be argued that the use of weights from national accounts is also inappropriate when poverty PPPs are compiled. From an index number perspective, it is important that the weights represent the spending patterns of the reference population that is considered poor. As the national accounts weights are for the whole population, it is likely that the patterns for the poor will differ significantly. The expenditure weights compiled for the 16 countries included in this study reveal significant differences between the patterns for the poor and those for the general population.
In summary, it is critical that the compilation of poverty PPPs be rooted in a methodology that is designed specifically for the purpose. The use of PPPs from the 2005 ICP Asia Pacific is inadequate. One, it is not clear how the poverty PPPs actually differ from the ICP PPPs for the consumption aggregate. Two, it is also not clear how sensitive the poverty PPPs are to various approaches used in determining the product lists, price collection, and use of weights and to the choice of the index number formula used for the actual aggregation. These issues of sensitivity are addressed in Chapter 7 of this report.

Chapter 5
Introduction
At the inception stage of the global 2005 ICP, it was generally recognized that support for the ICP would be further enhanced if its results can help improve the methodology for measuring the incidence of poverty in different regions with the use of IPLs. The Global Office of the ICP at the World Bank brought a small group of international experts together to form the PAG, to provide guidance and help set the direction for the work of compiling PPPs for converting IPLs. There was also general agreement that the main thrust of the work during the global 2005 ICP would be to set up the methodology and procedures for the smooth running of the ICP, and that the poverty PPP work would subsequently be added. After carefully assessing the current approach of using consumption PPPs generated by the ICP for converting the IPL and also taking into account what would be feasible within the global 2005 ICP, the PAG recommended a methodology for compiling the PPPs for the conversion of poverty lines. Considering the compilation of poverty PPPs to be an ongoing research that may yield recommendations for future rounds of the ICP, the PAG initiated a number of research projects.15
This chapter describes the general approach recommended by the PAG and gives details of the implementation of the methodology. The PAG methodology was taken as the baseline methodology
15 Additional information on poverty PPP studies is on http://go.worldbank.org/4YG715RGTO.
Recommended Methodology for Compiling Poverty PPPs in the 2005 ICP Asia Pacific
for the poverty PPP study of the 2005 ICP Asia Pacific. The results from implementing the methodology are in Chapter 7. A number of alternative sets of PPPs derived using approaches that deviate from the PAG methodology are also presented in Chapter 7, which also examines the sensitivity of PPPs to the use of different approaches.
PAG’s Recommended Methodology
The PAG considered the current practice of simply using PPPs for the consumption aggregate of the ICP as inadequate for the purpose of converting the IPL. The PAG discussed the main issues regarding the ICP consumption PPPs in terms of their commodity coverage and the use of national average weights in deriving the PPPs. While it was generally acknowledged that both the items priced and the weights used would have a bearing on poverty PPPs, the use of incorrect weights to aggregate price data was considered the more immediate problem that had to be addressed. The main focus of the 2005 round is to conduct the ICP effectively, but given the time and financial constraints, it was recognized that it would not be feasible to conduct separate poverty-specific price surveys during this round. Further, the PAG was uncertain about the magnitude of the difference that would be generated if ICP price data were to be substituted for price data from poverty-specific baskets of goods and services.

Chapter 5
2005 International Comparison Program in Asia and the Pacific 24
The PAG-recommended methodology for compiling poverty PPPs for the global 2005 ICP had the following elements:
(i) The price data for poverty PPPs would be the same as that used for the ICP. Therefore, the basic heading PPPs generated from the ICP would be used for computing the poverty PPPs.
(ii) The weights used in computing the poverty PPPs would be based on the expenditure weights of those households whose expenditure is around the poverty line.
(iii) The aggregation methodology used would be the same as that used for the ICP, i.e., the Eltetö-Köves-Szulc method for aggregation above the basic heading level.
Although the recommended method appears to be a simple variation of the current ICP methodology, its implementation is complex because it requires the expenditure shares of the poor as weights. The rest of this chapter discusses the main issues and procedures followed in compiling poverty PPPs as part of the 2005 ICP Asia Pacific. The following sections present basic heading PPPs for selected basic headings; describes the compilation of weights for the purpose of aggregation; and provides a brief description of the aggregation methods used at various stages in the poverty PPP study in the 2005 ICP Asia Pacific.
Basic Heading PPPs Based on the 2005 ICP Asia Pacific
The 2005 ICP Asia Pacific price data are the basic input into the computation of poverty PPPs using the PAG methodology. Consistent with the PAG recommendation, basic heading PPPs were drawn from the 2005 ICP Asia Pacific but re-expressed using the Malaysian ringgit as the reference currency. The countries included are Bangladesh, Bhutan, Cambodia, Fiji Islands, India, Indonesia, Lao PDR, Malaysia, Maldives, Mongolia, Nepal, Pakistan, Philippines, Sri Lanka, Thailand, and Viet Nam.
As the poverty PPPs are based on household consumption only, the poverty PPP computations made use of only PPPs for 110 basic headings
that make up the household final consumption expenditure.
Typically, the basic heading PPPs were then combined using the expenditure shares to derive an aggregated PPP. In the case of the poverty PPPs, they were combined using the expenditure share weights for the poor.
Compiling Expenditure Share Weights for the Poor
The main source of expenditure data is the household expenditure surveys conducted regularly in the 16 countries. For the purpose of computing the PPPs, expenditure weights need to correspond to the basic headings used in the 2005 ICP Asia Pacific. As compiling PPPs is not the main objective of the HES, the commodities and groups used in the surveys do not readily correspond with the 2005 ICP Asia Pacific basic headings and categories.
There are two main tasks in the process of compiling weights for the poor. First is to establish correspondence between the 2005 ICP Asia Pacific and HES data sets by constructing a mapping between the two sources. Once such a mapping is established, the second task is to identify the poor households to compute the budget shares and weights for the poor. Identification of the poor is accomplished through an iterative scheme developed by Deaton (2004). Once these two tasks are completed, then a set of weights in the form of expenditure shares for the poor is derived. The two tasks are discussed in more detail in the following paragraphs.
Mapping Household Expenditure Surveys to ICP Basic Headings
Establishing correspondence between HES and the 2005 ICP Asia Pacific data is an arduous, resource-intensive task. Much time and manpower are needed to establish the mappings. Both have been generously allocated by the World Bank in its effort to move this study forward. Basic elements of the approach of Dupriez (2007) are briefly described here.16
16 See http://siteresources.worldbank.org/ICPINT/Resources/ 270056-1195253046582/Dupriez_BuildingaHHCdatabase-fortheCalculationofPovertyPPPs_Mar07.pdf.

Chapter 5
25Research Study on Poverty-Specific Purchasing Power Parities for Selected Countries in Asia and the Pacific
Dupriez has written a software based on Stata (versions 8 and 9) to construct HES data sets that can be used for ICP purposes. In the process, he developed a software not only for establishing a mapping of all goods and services in the HES with the ICP basic headings but also for detecting and fixing possible outliers in the data sets. The mapping process consists of the following steps:
(i) extracting household characteristics,
(ii) calculating annual consumption for all goods and services covered by the survey,
(iii) detecting and fixing outliers in consumption values,
(iv) mapping all goods and services to the corresponding basic headings,
(v) splitting the values stored in “fake” basic headings, and
(vi) running quality control tables.
The most important step is the mapping of HES commodities to ICP basic headings. As noted earlier, there are 110 basic headings for HFCE in the 2005 ICP Asia Pacific. Only 107 of those can possibly be obtained from HES. The three basic headings that cannot be mapped are financial intermediation services indirectly measured, purchases by resident households in the rest of the world, and purchases by nonresident households in the economic territory of the country.
Three challenges were encountered in mapping, mainly because HES are not instruments specifically devised for ICP purposes.
(i) In the HES, several items are like composite commodities that do not exist as basic headings in the ICP. For example, meat could be an expenditure item in the HES in a given country, but corresponding to this are five basic headings within the ICP, e.g., beef and veal; pork; lamb, mutton, and goat; poultry; other meats and meat preparations. In this case, the HES would provide a household expenditure on “meat.” To address this problem, a dummy basic heading (in addition to the 110 basic headings for HFCE) with the title UNBR (unbroken) Meat is constructed. Given that
weights are available for five meat basic headings in the ICP, the total expenditure on UNBR Meat is distributed among the five basic headings on a pro rata basis. (See Dupriez 2007.)
(ii) Some basic headings in the ICP are aggregates of items in the HES. In this case the solution is simple, and the relevant aggregates are formed out of the individual components.
(iii) No data corresponding to certain basic headings in the ICP are available in the HES. For example, in Bangladesh, 29 basic headings in the ICP had no corresponding entries in the HES. These basic headings accounted for only 1.2% of the total ICP weights. The corresponding figures for Indonesia, Sri Lanka, and Thailand, respectively, are 15 (0.53%), 11 (2.6%), and 6 (4.26%).
Identifying Households on the Poverty Line
The next task in compiling expenditure share data is to identify all households in different countries that are deemed to be on the poverty line. There are several issues to resolve here and two steps to follow.
Step 1. Select a poverty line.
The first step is to select a poverty line for the purpose of extracting the expenditure patterns of the poor. Several choices are available, and the choice made is likely to have an effect on the numerical values of the PPPs generated. In this study two poverty lines are selected for the purpose of examining the sensitivity of poverty PPPs. One poverty line is a variant of the $1/day IPL, and the other is the national poverty line used in Indonesia. The Indonesian poverty line for 2005 was set at Rp1,549,296/annum.17 The reasons for the selection of the Indonesian poverty line are discussed in Chapter 7. For purposes of exposition, the following discussion is based on the IPL of $1/day.
The $1/day IPL in recent literature refers to $1.08 in 1993.18 For the purpose of this study, the IPL for 2005 is required. The $1.08 IPL in 1993
17 Data provided by Badan Pusat Statistik.18 See Chen and Ravallion (2004) for a description of the
historical development of this approach.

Chapter 5
2005 International Comparison Program in Asia and the Pacific 26
Table 7. Bandwidths and Estimated Population Size in Intervals around the Poverty Line
CountryNational Poverty
Lines h
Poverty Line ± h
Bandwidth
Lower Bound Upper Bound
Bangladesh 9,672.72 203.73 9,468.99 9,876.45 Bhutan 8,884.32 844.92 8,039.40 9,729.24 Cambodia 775,260.00 29,969.10 745,290.90 805,229.10 Fiji Islands 1,820.00 89.95 1,730.05 1,909.95 India 4,905.63 119.12 4,786.51 5,024.75 Indonesia 1,549,296.00 34,908.92 1,514,387.08 1,584,204.92 Lao People’s Democratic Republic 1,115,520.00 127,469.94 988,050.06 1,242,989.94 Malaysia 1,860.00 145.82 1,714.18 2,005.82 Maldives 5,475.00 1,131.39 4,343.61 6,606.39 Mongolia 296,808.00 16,949.40 279,858.60 313,757.40 Nepal 7,695.60 587.02 7,108.58 8,282.62 Pakistan 10,543.68 183.12 10,360.56 10,726.80 Philippines 14,046.00 535.19 13,510.81 14,581.19 Sri Lanka 21,804.00 830.19 20,973.81 22,634.19 Thailand 14,904.00 901.82 14,002.18 15,805.82 Viet Nam 2,076,000.00 122,265.93 1,953,734.07 2,198,265.93
h = bandwidth. Note: National poverty line refers to the latest available poverty line in local currency units.
was converted to 2005 prices using the CPI in the United States. The new line for 2005 is found to be $1.46. This means that over the period 1993 to 2005, consumer prices in the US increased by 35%.
To identify the households around a given poverty line, the IPL of $1.46 needs to be converted into local currency units. Suppose Malaysia is selected as the country of interest. As a starting point, PPPs for the HFCE for Malaysia from the recently released Final Results of the Global ICP19 indicate a PPP of $1 = RM2.11. Then the IPL in RM is equal to 1.46 x 2.11 = RM3.0806/day. (The $ poverty line can be similarly converted into any other national currency unit using an appropriate PPP.) This can be annualized by multiplying 3.0806 by 365 giving a PPP-based annual poverty line of RM1,124.42. Therefore, any person with expenditure less than the poverty line of RM1,124.42 is considered poor.
19 Final Results from the Global ICP are available from the World Bank (see http://siteresources.worldbank.org/ICPINT/Resources/ICP_final-results.pdf).
Step 2. Identify households around the poverty line.
Once a poverty line is selected, the next step is to identify the households on the poverty line. As the poverty line for Malaysia used in the illustration is RM1,124.42, a single figure in monetary terms, it is likely that no individual in the Malaysian HES would have an annual expenditure exactly equal to RM1,124.42. It is necessary to use a small interval around the poverty line for the purpose. A small bandwidth20 is selected so as to define this interval. In the current study, the following formula is used for computing the bandwidth. The bandwidth, h, is given as
h = 1.059sn-1/5 (1)
20 This is a term used in Kernel smoothing. Deaton (2004 and 2006) describes the use of the Kernel smoothing technique as a solution to this problem.

Chapter 5
27Research Study on Poverty-Specific Purchasing Power Parities for Selected Countries in Asia and the Pacific
where s is the sample standard deviation and n is the sample size.21
In practice, expenditure weights are computed using household expenditure data where total household expenditure is recorded in the survey. Therefore, in applying the formula, n is the total sample size used in the HES.
In the case of Malaysia, the latest household expenditure data available refer to the year 2004 and the corresponding value for the bandwidth is calculated to be h = RM145.82 and therefore, the interval around the poverty line of RM1,124.42 is given as 978.6 and 1,270.24. In calculations in the sensitivity analysis, a smaller bandwidth of 0.5 h is used. A smaller bandwidth means that a smaller
21 The bandwidth, h, given by the formula is optimum in the sense that it minimizes the mean square error when the Kernel used has a standard normal probability density function. For more details, refer to any standard text on nonparametric methods. Greene (2003, 453–56) provides a simple exposition of the methodology used here. This is also similar to the bandwidth concept used in Deaton (2006).
number of households will belong to the given interval whereas a wider bandwidth will capture households further away from the poverty line.
Once the bandwidth and the interval around the poverty line are determined, it is then possible to identify all the households whose per capita expenditures lie within the interval considered. Table 7 presents bandwidths computed using equation (1).
Computing the Expenditure Share Weights
For a given household r, the expenditure share of commodity22 n is given by
N
∑n=1
pnrqnrwnr = pnrqnr
(2)
22 The term “commodity” is used in place of basic headings, which are more relevant in PPP calculations.
Table 7. Bandwidths and Estimated Population Size in Intervals around the Poverty Line (continued)
Poverty Line ± h Poverty Line ± 0.5 h
Sample Size Bandwidth Sample Size
Households Headcount Lower Bound Upper Bound Households Headcount
342 1,701 9,570.85 9,774.58 167 844 279 1,659 8,461.86 9,306.78 132 769 806 3,895 760,275.45 790,244.55 405 1,951 230 1,034 1,775.02 1,864.98 127 572
2,248 14,013 4,846.07 4,965.19 1,165 7,134 1,709 7,798 1,531,841.54 1,566,750.46 831 3,819 1,346 8,803 1,051,785.03 1,179,254.97 668 4,323
604 3,551 1,787.09 1,932.91 316 1,818 126 903 4,909.31 6,040.69 67 484 741 3,504 288,333.30 305,282.70 366 1,767 335 1,836 7,402.09 7,989.11 170 950 463 3,235 10,452.12 10,635.24 230 1,579
1,708 8,229 13,778.41 14,313.59 850 4,120 924 3,991 21,388.90 22,219.10 464 1,978
1,719 7,014 14,453.09 15,354.91 840 3,411 464 2,243 2,014,867.03 2,137,132.97 233 1,134

Chapter 5
2005 International Comparison Program in Asia and the Pacific 28
where pnr represents the price of n-th commodity (n=1,2,…N) for household r and qnr represents the quantity of n-th commodity consumed by household r. The expenditure share shows the proportion of total expenditure of household r for commodity n. Therefore, it is easy to compute household expenditure share weights for each of the households.
Suppose expenditure share weights are computed for each household r in a total of R households. To compile weights to be used in the PPP computation, the weights need to be aggregated to derive the necessary weighting scheme. Two types of weighting schemes are considered, democratic and plutocratic weights.
Democratic weights are simple averages of the expenditure shares of all households belonging to the income interval defined around the poverty line. If R households belong to this group, then the democratic weight based on these R households is given as:
1R ∑wn =
R
r=1wnr
(3)
where wn is the expenditure share of n-th commodity that will be used as a weight in the PPP computations.
These weights are considered democratic as each household gets the same weight in the computation of the expenditure share weights.
Plutocratic weights are weights that represent the whole set of households as a group. These weights are derived by considering the total expenditure of all the households on a given commodity, n, as a share of the total expenditure on all commodities by all households. Therefore, the whole group of households is treated as a single entity. Plutocratic weights are calculated as
∑wn = R
r=1pnrqnr
∑N
∑ pnrqnrr=1 n=1
R
(4)
The numerator of this expression shows the total amount spent on commodity n by all the R households taken together. In contrast, the
denominator shows the total expenditure of all the households on all the commodities.
It is easy to see that in the computation of plutocratic weights, households with larger expenditures tend to be given a higher weight in the computation of the expenditure shares.
While democratic weights are the preferred choice, plutocratic weights are also used in PPP computations to check the sensitivity of the derived PPPs to the choice of the method of deriving average expenditure share weights.
The following numerical example illustrates the concepts of democratic and plutocratic weights and shows the kind of average weights that can result from their use.
Household 1 Household 2Expenditure Budget
shareExpenditure Budget
shareItem 1 50 0.33 20 0.67Item 2 100 0.67 10 0.33
Democratic weights Plutocratic weightsItem 1 0.5 0.38Item 2 0.5 0.62
This example illustrates the two different methods of computing averages across households. Democratic weights offset the unbalanced patterns of the two households whereas plutocratic weights tend to retain the expenditure pattern of the richer household whose total expenditure is 150 (household 1) compared with only 30 by household 2.
In practice, however, the use of democratic and plutocratic weights is likely to produce less extreme results than the example above, as the averages are taken over all the households around the poverty line, which are expected to have similar total expenditures. The sensitivity of PPPs to the use of democratic and plutocratic weights is further examined in Chapter 7.
Addressing Nonavailability of HES for the Benchmark Year
Because HES are costly to conduct, countries conduct them once in 3–5 years. Further, the HES are not perfectly synchronized across the countries participating in the poverty PPP study. Considerations

Chapter 5
29Research Study on Poverty-Specific Purchasing Power Parities for Selected Countries in Asia and the Pacific
concerning the use of HES data that may not correspond to the benchmark year, in this case 2005 for the ICP Asia Pacific, should be identified.
Table 8 shows the HES data used in all the PPP computations in the study. The idea was to use the HES data closest to the 2005 benchmark year. However, there were two exceptions. At the time of the analysis, only 2001 HES data for Pakistan was available. Information from 2001 was processed before data for a more recent year became available. The situation with Indonesia is also the same. After the initial processing of the 2002 HES data, 2005 data became available. As the processes involved in the analysis are complex, it was not possible to make use of the 2005 HES data. Details of the HES from different countries used in this study are presented in Appendix Table 2.
In Table 8, column (2) gives the equivalent of $1/day ($1.08 in 1993, which is equivalent to $1.46 in 2005) converted into the respective local currency units using PPPs from the 2005 ICP Asia Pacific and the Global ICP. The column shows what may be considered the conversion of the IPL to local currency units.
To use that poverty line to compute expenditure weights discussed in the previous section, it is necessary to find all households around this poverty line in each of the countries with the use of the latest available HES data. In the case of Bangladesh, India, and Mongolia, HES data are available for 2005 and therefore, the figures in columns (2) and (3) can be used directly for these countries. In the case of Malaysia, however, the latest available HES data refer to 2004. To find all those households around the poverty line, it is necessary to adjust the poverty line of RM3.08 in 2005 to 2004 prices. The resulting poverty line is RM2.99. This adjustment is made using the CPI data drawn from International Financial Statistics 2007 of the International Monetary Fund. Similarly, the poverty line for Viet Nam is dong (D) 7,843.08, which is adjusted downward from the 2005 level of D8,491.70. In the case of Pakistan the available HES is for 2001 and therefore, its poverty line of Pakistani rupees (Prs)30.14 is adjusted to Prs24.20, reflecting the price changes over the period 2001 to 2005.
The assumption here is that the expenditure patterns, in particular those of the poor, do not change too dramatically over a short period and that
Table 8. Household Expenditure Survey Availability and Consumer Price Index Movements
Country
$1/day equivalent HES
2005 2005 2004 2003 2002 2001
(1) (2) (3) (4) (5) (6)Bangladesh 36.60 36.60 Bhutan 26.11 23.71 Cambodia 2,403.90 2,189.10 Fiji Islands 2.00 1.83 India 23.21 23.21 Indonesia 6,132.80 4,903.30 Lao People’s Democratic Republic 5,851.32 4,942.83 Malaysia 3.08 2.99 Maldives 12.79 12.92 Mongolia 739.16 739.16 Nepal 37.18 33.84 Pakistan 30.14 24.20 Philippines 33.95 29.76 Sri Lanka 55.07 43.13 Thailand 23.95 21.90 Viet Nam 8,491.70 7,843.08
HES = household expenditure survey.

Chapter 5
2005 International Comparison Program in Asia and the Pacific 30
expenditure share patterns extracted from the HES year would be equally applicable to the benchmark year.
Computing the PPPs
An iterative scheme is used in computing the PPPs. Once the expenditure share weights are compiled, then the basic heading PPPs can be combined with these weights to derive a new set of PPPs. Once new PPPs are obtained, they can, in turn, be used in deriving a new set of weights and the process is continued until the PPPs converge completely. However, combining price data and expenditure share weights requires the use of an appropriate aggregation methodology.
Aggregation Methods
As there are 16 countries participating, it is necessary to make use of multilateral index numbers in deriving PPPs. Multilateral comparisons essentially involve comparisons of prices or quantities between every pair of countries included in the study. If there are 16 countries, then there will be 120 binary comparisons involving pairs of countries, and every binary comparison is considered equally essential. This is particularly the case with international comparisons undertaken by international organizations. In multilateral comparisons, it is necessary to ensure internal consistency in the results reported; therefore, the methods used for this purpose are expected to satisfy some basic properties.
Desirable Properties of PPPs
Suppose PPPs are computed for the currencies of all the countries involved using a particular index number formula. To meaningfully express PPPs, it is necessary to nominate a country whose currency, j, is taken as the reference currency.23 By definition, the PPP of the reference currency is always equal to 1. Hence, PPPj represents the PPP of currency j, expressed in the units of a reference currency.
Base-country invariance is an important property of PPPs. It means that the results of comparisons do not depend on the choice of the base country or of the numeraire currency. This property ensures that all the countries involved in
23 A basket of currencies may also be nominated to serve as a reference currency for the purpose of PPP computations.
the comparisons are treated symmetrically, which reflects a level of neutrality expected of international comparisons.
Transitivity is a crucial property of PPPs because it ensures that comparisons made between any pair of countries are mutually consistent. Having PPPs that are transitive means that an indirect comparison between two countries via a third country will yield the same result as a direct comparison between the first two countries. For example, if the countries concerned are j, k, and l, the PPP between countries j and k (PPPj,k) will be identical to the product of the PPP between j and l (PPPj,l) and the PPP between l and k (PPPl,k). This relationship can be expressed algebraically as follows:
PPPj,k = PPPj,l × PPPl,k (5)
In more general terms, transitivity is satisfied if PPPs are such that the above equation holds for any selected set of three countries, say j, k and l (1, 2, …, M).
Characteristicity is an important property in the case of multilateral comparisons that satisfy the transitivity property. Transitivity implies that a comparison between countries j and k (for example, between Malaysia and India) would be affected by country l (say Thailand). Characteristicity stipulates that a formula should minimize possible distortions to binary comparisons created due to the transitivity restriction.
Additivity and other properties are also desirable. For example, the index number formula should be such that PPPs derived are invariant to the choice of the units in which quantities are measured. Whether the price of rice is measured per one kilogram unit or per 10 kilogram units, the resulting PPP should be the same. This result is usually referred to as “axioms.” Details of the axiomatic approach can be found in Diewert (1988) and Balk (1995). Of all such properties, additivity is one of the most commonly discussed properties. Additivity ensures that subaggregates converted using PPPs add up to a total GDP converted into a real aggregate using a PPP at the GDP level. Additivity is a property that is obviously satisfied by the national accounts in local currency units. If PPPs are derived using an aggregation method that guarantees additivity, such as the Geary-Khamis (GK) method, the national accounts expressed in a common currency unit will also satisfy additivity. The estimates in this

Chapter 5
31Research Study on Poverty-Specific Purchasing Power Parities for Selected Countries in Asia and the Pacific
publication are compiled using mainly the EKS method, which is not an additive method.
Two scenarios are likely to be considered when aggregation methods are being selected for PPP compilation. If the basic heading PPPs are available from the 2005 ICP Asia Pacific, then the only step involved in poverty PPP compilation is to aggregate such basic heading PPPs with the use of expenditure share weights derived using the iterative procedure described earlier. If the price data are obtained from a price survey directly, then it is necessary to aggregate item-level price data to derive basic heading PPPs. At this level, no weights are available. In the interest of completeness, methods of aggregation below and above the basic heading level are presented here.
Aggregation below the Basic Heading Level
For this round of international comparisons, the main aggregation procedure recommended for deriving PPPs at the basic heading level from item-level price data is the country-product-dummy (CPD) method.24 The basic input into the CPD method is the national average price for each of the products.
In compiling the poverty PPP, the CPD method was used in aggregating price data collected from the poverty-specific price surveys conducted in the 16 participating countries. The starting point for the CPD approach, therefore, is a matrix of prices (in local currency) for priced products within each of the 16 countries. As expected, there were gaps in the price matrix because it was not possible (nor generally desirable) for all countries to price every product on the list.
The CPD method is a regression technique. The underlying model is multiplicative and assumes that prices vary by product within countries at the same rate across all countries, and that prices vary between countries at the same rate across all products. This is sometimes referred to as the law of one price. As is usual with a regression equation, an error term (also multiplicative in this case) is required to handle variations in the observed product/country prices from those generated by the model. In practice, one country and one product in one country have to be
24 A popular alternative to the CPD method is the EKS method used by Eurostat and OECD. A comparative assessment of the relative merits of these methods is available in the ICP Handbook (World Bank 2007). Rao (2004) discusses all aspects of the CPD method including a comparison with the EKS method.
chosen as the base and all other product-country combinations are measured in terms of their variation from these bases.
The multiplicative CPD model can be shown using a simple example. Assume that we have m countries and their product list consists of n products. Then, for each product (i) in each country (j), the price observed is pij for i = 1, 2, ……., N and j = 1, 2, ……., M. This means that there are M countries and N commodities. In this case M=16 and N=155. Note that the prices pij are expressed in each country’s national currency. The CPD model is expressed as pij = aißjυij where ai is the product term, ßj is the country term, and υij is the error term.
Additive models have some useful properties and so, in practice, the CPD model is converted from a multiplicative one to an additive one by expressing the terms in the model as logarithms:
log(pij) = log(aißjυij) = log(ai) + log(ßj) + log(υij) (6) = ηi + �j + uij
This method is known as CPD because the model can be rewritten using dummy variables for commodities and countries. The model is
In pij = �1D1 + �2D2 + ... + �MDM + η1D1*
+ η2D2*+...ηnDn*+uij
(7)
where Di is the dummy variable for commodity i taking the value 1 if the price observation refers to commodity i, and the value 0 otherwise; Dj
* is a country dummy variable that takes a value of 1 if the price observation refers to country j, and a value of 0 otherwise.
The parameters in the model are estimated using a least-squares approach. Given that the model requires the outputs to be expressed in terms of one country’s currency, the outputs are simply PPPs expressed in terms of that base country. In the model, if we assume that the base country is country 1, then a1= 1. In addition, it is necessary to select a product to act as a base product, so if we make ß1 = 1, then the model produces estimates of prices in terms of their variation from product 1 in country 1. Any other country can be made the base country simply by dividing each country’s PPP by the new country’s

Chapter 5
2005 International Comparison Program in Asia and the Pacific 32
PPP. The CPD model assigns the same weight to each product’s price, so it is often referred to as an “unweighted model,” although it should really be described as a model with equal weights.25
One useful output from the CPD model is a set of estimated prices for each product for each country. These prices provide an estimate of what the prices would be if the relationships set out above held in practice. The differences between observed prices and these modeled prices can provide an indication of possible problems with the prices provided by a country. Large differences indicate possible problems, e.g., because the prices for the same product vary significantly across countries or because the relativities between prices of products within a country vary significantly compared with those in other countries. The distribution of these differences provides the underlying basis for the Dikhanov table, developed in the World Bank as an editing tool (see Part 4 of ADB 2007b). The distributions can be graphed to provide a simple means of identifying potential problem prices, either for a particular product or within a country.
The CPD method is used in deriving PPPs at the basic heading level in the course of processing price data collected through poverty-specific price surveys.
A variant of the CPD method, known as the country-product-representativity-dummy (CPRD) method, can use any additional information that may be available indicating the representativity status. The method introduces a dummy variable in the CPD regression, Rij, for commodity i in country j such that if the product is representative, then Rij = 0; and if it is not representative, then Rij = 1. Then the CPD model presented before is extended to include the representativeness dummy variable, Rij. The new model is then given as
log(pij) = log(ai) + log(ßj) + δ log(Rij)
+log(υij) (8)
where the new parameter δ captures the effect of inclusion of price data for nonrepresentative items. Thus, the CPRD model is supposed to provide estimates of PPPs, which are more reliable
25 There are weighted versions of the CPD model. For some important applications of weighted CPD models, see Rao (2005) and Diewert (2005).
than the PPPs that do not take into account unrepresentativeness of some of the price data used.
In the poverty PPP study, the CPRD method could not be used as the data on representativity provided by the participating economies had not been very reliable. Use of incorrect indications of representativity or nonrepresentativity is likely to introduce further biases into the results.
Further details of the CPD and CPRD methods can be found in the ICP Handbook (World Bank 2007).
Aggregation above the Basic Heading Level
It is easier to describe the foregoing methods using the following notation. Let pij and qij denote, respectively, the price and quantity of product i in country j. Since the aggregation here makes use of basic heading PPPs, pij simply denotes the basic heading PPP for i-th basic heading in j-th country. The quantity qij, refers to the basic heading that is an aggregate over several commodities. Therefore, qij is given by eij/pij where the price refers to the basic heading PPP of commodity i in country j.
Paasche: Pjk =
N∑ pijqiji=1N∑ pikqiji=1
(9)
Laspeyres: Ljk = N∑ pikqiki=1
N∑ pijqiki=1 (10)
Fisher: Fjk = √—PjkLjk (11)
Tornqvist: Tjk = N∏i=1
pikpij
(wij+wik)2
(12)
where: wij = N∑ pkjqkjk=1
pijqij are expenditure shares.
For the purpose of poverty PPP compilation, the total expenditure is taken to be equal to the
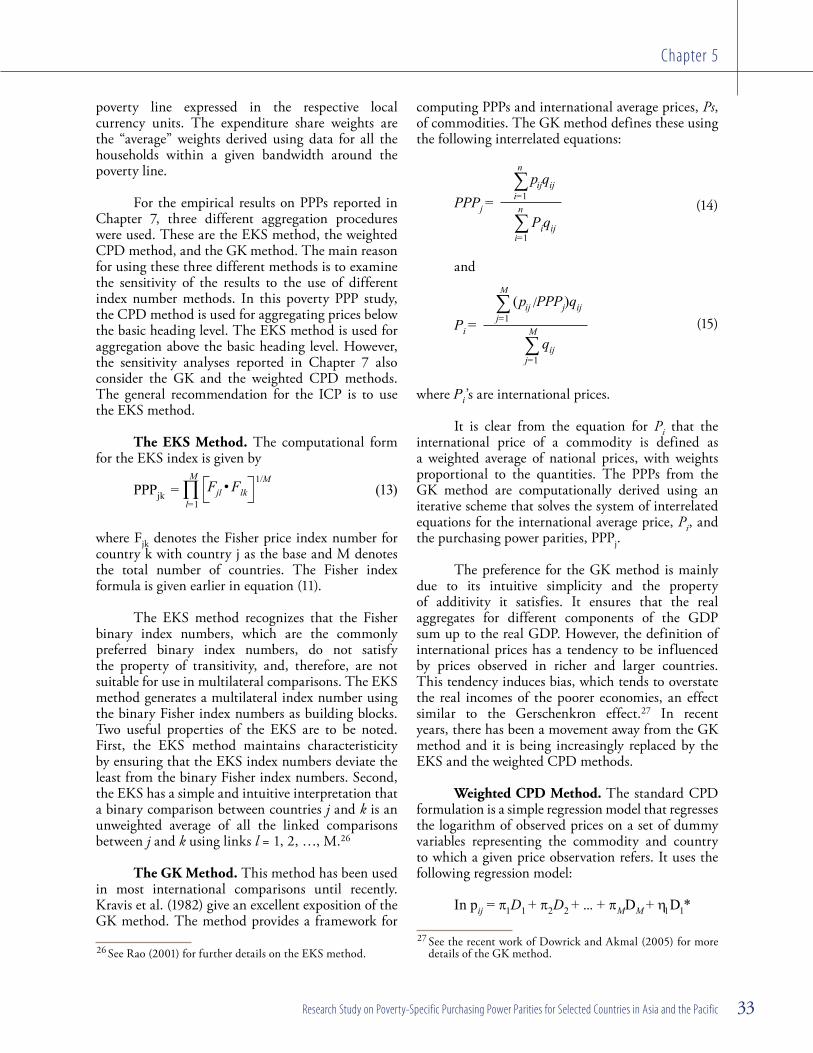
Chapter 5
33Research Study on Poverty-Specific Purchasing Power Parities for Selected Countries in Asia and the Pacific
poverty line expressed in the respective local currency units. The expenditure share weights are the “average” weights derived using data for all the households within a given bandwidth around the poverty line.
For the empirical results on PPPs reported in Chapter 7, three different aggregation procedures were used. These are the EKS method, the weighted CPD method, and the GK method. The main reason for using these three different methods is to examine the sensitivity of the results to the use of different index number methods. In this poverty PPP study, the CPD method is used for aggregating prices below the basic heading level. The EKS method is used for aggregation above the basic heading level. However, the sensitivity analyses reported in Chapter 7 also consider the GK and the weighted CPD methods. The general recommendation for the ICP is to use the EKS method.
The EKS Method. The computational form for the EKS index is given by
PPPjk = M∏l=1
Fjl • Flk1/M
(13)
where Fjk denotes the Fisher price index number for country k with country j as the base and M denotes the total number of countries. The Fisher index formula is given earlier in equation (11).
The EKS method recognizes that the Fisher binary index numbers, which are the commonly preferred binary index numbers, do not satisfy the property of transitivity, and, therefore, are not suitable for use in multilateral comparisons. The EKS method generates a multilateral index number using the binary Fisher index numbers as building blocks. Two useful properties of the EKS are to be noted. First, the EKS method maintains characteristicity by ensuring that the EKS index numbers deviate the least from the binary Fisher index numbers. Second, the EKS has a simple and intuitive interpretation that a binary comparison between countries j and k is an unweighted average of all the linked comparisons between j and k using links l = 1, 2, …, M.26
The GK Method. This method has been used in most international comparisons until recently. Kravis et al. (1982) give an excellent exposition of the GK method. The method provides a framework for
26 See Rao (2001) for further details on the EKS method.
computing PPPs and international average prices, Ps, of commodities. The GK method defines these using the following interrelated equations:
∑PPPj = i=1
pijqij
n
∑ Piqiji=1
n
(14)
and
∑Pi = j=1
(pij /PPPj)qij
M
∑ qijj=1
M
(15)
where Pi’s are international prices.
It is clear from the equation for Pi that the international price of a commodity is defined as a weighted average of national prices, with weights proportional to the quantities. The PPPs from the GK method are computationally derived using an iterative scheme that solves the system of interrelated equations for the international average price, Pi, and the purchasing power parities, PPPj.
The preference for the GK method is mainly due to its intuitive simplicity and the property of additivity it satisfies. It ensures that the real aggregates for different components of the GDP sum up to the real GDP. However, the definition of international prices has a tendency to be influenced by prices observed in richer and larger countries. This tendency induces bias, which tends to overstate the real incomes of the poorer economies, an effect similar to the Gerschenkron effect.27 In recent years, there has been a movement away from the GK method and it is being increasingly replaced by the EKS and the weighted CPD methods.
Weighted CPD Method. The standard CPD formulation is a simple regression model that regresses the logarithm of observed prices on a set of dummy variables representing the commodity and country to which a given price observation refers. It uses the following regression model:
In pij = �1D1 + �2D2 + ... + �MDM + η1D1*
27 See the recent work of Dowrick and Akmal (2005) for more details of the GK method.

Chapter 5
2005 International Comparison Program in Asia and the Pacific 34
+ η2D2*+...ηnDn*+uij
(16)
where D and D*, respectively, refer to country and product dummy variables. This formulation was used in handling missing observations. It was also used as a method for aggregating price data below the basic heading level.
Rao (1995) showed that it is feasible to consider a generalization of the CPD method that can be used for aggregation above the basic heading level. Rao proposed an extension that allows for the use of weights—an extension with its roots in weighted least squares—with weights reflected by the expenditure shares. The model is equivalent to running the following regression model with transformed observations.
√—vij In pij = �1√—vijD1 + �2√
—vijD2 + ...
+ �M√—vijDM + η1√—vijD1*+...
+ ηn√—vijDn*+uij
(17)
The required PPPs are simply given by PPPj = exp(�̂) where �̂j is the least-squares estimator of �̂j.
Even though the weighted CPD is a simple extension of the CPD model, Rao (2004 and 2005) demonstrated that it is a powerful technique with very important properties, a few of which are listed below.
(i) The weighted CPD method is equivalent to the Rao (1990) system for multilateral comparisons. This result, proven in Rao (2005), establishes a link between the econometric approach and the standard PPP and international price approach in the GK method. Since the weights here are based on shares, this method is size-neutral.
(ii) When applied to binary comparisons, the method results in index numbers that are superlative. In fact, it is possible to obtain an explicit form in the case of binary comparisons, and the resulting index is a geometric average of price relatives (similar to the Tornqvist index). Diewert (2005) shows that a number of other indices can also be generated by varying the CPD model specification.
(iii) The weighted CPD model allows for a more complex specification of the disturbances. For example, spatial structures in price relatives can be gainfully exploited and incorporated into the computations through a spatially autocorrelated disturbance specification (see Rao 2004 for more details).
(iv) The CPD model can be viewed as a simplified hedonic model. This interpretation suggests the possible use of the generalized CPD method to include quality characteristics explicitly in the regression specification. Incorporation of quality and outlet characteristics allows for the use of a more general approach to international comparisons where the standard approach of pricing very tightly specified items can be replaced by an approach based on loosely specified items with all the specifications recorded for each price observation. As a result of this approach, it is possible to improve the representativeness of the baskets priced for purposes of the ICP.
All the three aggregation procedures—EKS, GK, and weighted CPD methods—have been used in Deaton (2006). A comparative analysis of the results from the three methods provides a measure of the sensitivity of PPPs to the aggregation method used.
The multilateral index number methods are designed to take into account differences in expenditure patterns of countries. For example, the EKS method is built from binary Fisher PPPs such that the multilateral PPPs from the EKS method deviate the least from the binary PPPs. Similarly, the weighted CPD method explicitly accounts for differences in expenditure patterns. However, it may be noted that the reliability of PPPs increases when comparisons involve similar countries with similar expenditure patterns.28 In cases where countries are very dissimilar, it may be necessary to use a sub-regionalized approach.
28 There are multilateral methods (see Rao and Timmer 2003) that improve upon the EKS method by explicitly accounting for dissimilarities in expenditure patterns in the computation of multilateral PPPs. But these methods are still not widely used.
Chapter 5
35Research Study on Poverty-Specific Purchasing Power Parities for Selected Countries in Asia and the Pacific
Conclusion
The main objective of this chapter has been to articulate the methodology recommended by the PAG at the Global Office of the ICP and then discuss the implementation strategy for the recommendations. It is clear from this chapter that the PAG recommendation is only a simple first step in the quest for improved PPPs for estimating poverty and that the actual implementation is a lot more complex
than what is involved in the general ICP approach in computing PPPs. The main complexity is introduced because the reference population representing the poor is not determined independently of the poverty PPPs that rely on the expenditure patterns of the poor. Therefore, it is necessary to simultaneously determine the poor and the poverty PPPs. This is achieved through the iterative scheme proposed by Deaton (2004 and 2006) and implemented here using household expenditure data for the 16 countries.

Chapter 6
Introduction
A significant milestone for the poverty PPP study in the 2005 ICP Asia Pacific is the inclusion of a feasibility study to conduct price surveys specifically designed for the purpose of compiling PPPs for converting the IPL. The surveys represent a major step forward from the PAG methodology. The PAG recommended the computation of poverty PPPs with the use of price data for consumption items that are collected as part of the general ICP along with expenditure weights of the poor. The innovation in PAG’s recommendation is the recognition that budget shares reflecting the purchase patterns of the poor are likely to differ significantly from the patterns observed for the general population. The PAG methodology also articulates an iterative procedure to resolve the circularity issue arising out of the need to identify the poor to elicit the expenditure patterns needed in computing poverty PPPs, and the need to use poverty PPPs to identify the poor in the first place. The resolution of the circularity problem is a crucial step in the computation of poverty PPPs.
The PAG recommendation considered the issue of suitability of prices collected for items specified for the general ICP for the purpose of poverty PPP computation. While recognizing the use of ICP price data for poverty PPP as a possible setback, the PAG was of the opinion that taking account of differences in expenditure share weights between the poor and the general population is likely to be more important. It also felt that it would not be feasible to conduct special price surveys as part of the current ICP round.
Poverty-Specific Price Surveys in the 2005 ICP Asia Pacific
Consequently, the current baseline methodology for poverty PPPs recommends aggregation of PPPs for basic headings generated from the ICP using the expenditure patterns of the poor.
The Regional Office of the 2005 ICP Asia Pacific at ADB, however, recognized the need to examine further the feasibility of conducting price surveys specifically for the poverty PPP study. The decision to pursue the poverty-specific price survey approach was made after a discussion of the issues between the Regional Office and the national price statisticians involved in the 2005 ICP Asia Pacific. Several questions were raised about the meaning and feasibility of price surveys specifically to measure prices paid by the poor. The first and most difficult question was, obviously, Who are the poor? Not knowing who the poor are, how can we conduct such a survey? Where are the poor located? What do they typically consume? Where do the poor shop? What are the types of outlets used by the poor? What about the variation across countries in the region?
This chapter is devoted to a description of the general process underlying the conduct of poverty-specific price surveys, including the process of preparing the product list for the poverty-specific price surveys. The following sections give details on country participation and the process involved, the product lists and item specifications, the general survey framework that guided the poverty-specific price surveys in different countries, and validation of the poverty-specific price survey data collected. Two sections make a comparative assessment of the

Chapter 6
37Research Study on Poverty-Specific Purchasing Power Parities for Selected Countries in Asia and the Pacific
prices collected as part of the poverty-specific price surveys and prices of comparable products from the 2005 ICP Asia Pacific price surveys. PPPs at the basic heading level computed using poverty-specific price survey data are presented and compared with those derived using 2005 ICP Asia Pacific price surveys. The chapter also addresses the issue of whether the price data collected through poverty-specific price surveys correspond to the unit values29 (or average item prices) observed for poor households. The unit values considered here are derived from HES and poor households are identified using the national poverty lines.
Country Participation
Sixteen countries participated in the poverty PPP study, which was carried out as an extension of the 2005 ICP Asia Pacific. The preparation of the product lists for poverty PPPs was undertaken in two steps.
Step 1. Endorsement of the conduct of a poverty-specific price survey and provision of the initial product list by countries.
This first step was undertaken during the 2005 ICP Asia Pacific workshop held on 21–22 November 2005, when the participating countries endorsed the idea of conducting price surveys for poverty PPPs. In the ensuing months, each country provided the Regional Office with a product list consisting roughly of 50 to 60 items. In preparing the product lists, the participating countries sought advice from poverty specialists, price statisticians, and HES statisticians in their respective countries. The Regional Office analyzed the lists and identified patterns of overlapping products across countries. A workshop to finalize the product lists was held thereafter.
Step 2. Finalization of the product list using the subregionalized approach.
The consolidated product lists showed clear patterns driven by subregional groupings of countries. Therefore, it was decided that a subregional approach
29 Deaton (2004) and Rao and O’Donnell (2004) make use of unit values from household expenditures to derive PPPs for food items. Deaton’s work is on India and Indonesia; Rao and O’Donnell focus on Ethiopia and Uganda. Unit values from household expenditures are considered an additional source of price data.
would be adopted in the finalization workshop held on 16–17 June 2006. During the workshop, the second step, operationalizing the preparation and finalization of the products list for the poverty-specific price surveys, was taken.
Three subregions were considered: the South Asian region comprising Bangladesh, Bhutan, Fiji Islands, India, Maldives, Nepal, Pakistan, and Sri Lanka; the Mekong region comprising Cambodia, Lao PDR, Thailand, and Viet Nam; and the East Asian region and others comprising Indonesia, Malaysia, Mongolia, and Philippines.
Representatives from countries of the subregions deliberated on their subregional product lists and highlighted the salient features of their lists. The main consideration in preparing the lists was the quality of the products that are commonly purchased by the poor. It was generally recognized that the quality of products purchased by the poor would be inferior compared with the purchases of the more affluent sections of the population. The typical purchase quantity was also considered. That the poor tended to purchase small quantities was usually cited as a reason why they may be paying higher prices. The final consideration was the type of outlets where the poor generally make their purchases. General and wet markets and small shop outlets are considered typical sources of purchases.
Product Specifications and Product Lists
The final consolidated list based on the subregional lists has 155 products belonging to 45 basic headings identified in the 2005 ICP Asia Pacific. In comparison, the 2005 ICP Asia Pacific list has over 656 products covering 110 basic headings of ICEH. An implication is that the participating countries felt that the remaining 65 basic headings consist of items that are not of major significance to purchases made by the poor. For purposes of illustration, a sample list is given in Table 9. Only six varieties of rice are included in the basic heading “rice” for poverty-specific price surveys. The lower quality of the products included here is reflected in the quality specifications. Most of the rice items refer to the ordinary coarse variety that may have a high percentage of broken rice. An interesting feature of the list is the inclusion of two varieties of subsidized rice, which are common in some South Asian countries. The product list also indicates the regions where the given items are considered

Chapter 6
2005 International Comparison Program in Asia and the Pacific 38
Table 9. Sample Products and Specifications for Poverty-Specific Price Surveys
BH Code Product Name SAR Mekong Others Quality Quantity UOM PackageOther
Specification Outlet
1101111 Coarse #6 - parboiled, 15–50% broken
X Coarse, 15–50% broken (Medium quality)
1 kilo Loose Parboiled Open markets; Small local shops; Weekly market for rural
1101111 Coarse rice, ordinary, loose (a) (subsidized)
X Coarse, ordinary
1 kilo Loose Subsidized; Not parboiled
Open markets; Small local shops; Weekly market for rural
1101111 Coarse rice, ordinary, loose (b) (not subsidized)
X Coarse, ordinary
1 kilo Loose Not subsidized; Not parboiled
Open markets; Small local shops; Weekly market for rural
1101111 Coarse rice, 20–50% broken, not parboiled
X Coarse, 20-50% broken (Medium quality)
1 kilo Loose Not parboiled Open markets; Small local shops; Weekly market for rural
1101111 Coarse, >50% broken, not parboiled
X Coarse, >50% broken
1 kilo Loose Not parboiled Open markets; Small local shops; Weekly market for rural
1101111 Glutinous rice X X Low-medium 1 kilo Loose Open markets; Small local shops; Weekly market for rural
1101111 Count 61101112 Bajra flour X Low 1 kilo Loose Open markets; Small local
shops; Weekly market for rural
1101112 Beaten rice (Chira)
X Low 500 grams Loose Open markets; Small local shops; Weekly market for rural
1101112 Dahl - Kasari X Low-medium 250 grams Loose Open markets; Small local shops; Weekly market for rural
1101112 Dahl - Musur/Lentil
X Low-medium 250 grams Loose Open markets; Small local shops; Weekly market for rural
1101112 Dahl - Split peas X Low-medium 250 grams Loose Open markets; Small local shops; Weekly market for rural
1101112 Maize flour X Low-medium 1 kilo Loose Open markets; Small local shops; Weekly market for rural
1101112 Sawtu X Low-medium 1 kilo Loose Open markets; Small local shops; Weekly market for rural
1101112 Wheat flour - loose
X Low-medium 1 kilo Loose Open markets; Small local shops; Weekly market for rural
1101112 Wholemeal flour (Atta) (not subsidized)
X X Low-medium 1 kilo Loose Open markets; Small local shops; Weekly market for rural
1101112 Wholemeal flour (Atta) (subsidized)
X Low-medium 1 kilo Loose Open markets; Small local shops; Weekly market for rural
1101112 Count 10
UOM = unit of measure.

Chapter 6
39Research Study on Poverty-Specific Purchasing Power Parities for Selected Countries in Asia and the Pacific
important from the perspective of the poor. The last column shows the outlets that are considered typical sources for purchases by the poor.
Appendix Table 3 gives the full list of products included in the poverty-specific price surveys.
In summary, there are significant differences between the 2005 ICP Asia Pacific and the poverty PPPs in terms of the product lists, item specifications and characteristics, and outlets. Tables 10 and 11 highlight the differences.
Table 10 shows that the 2005 ICP Asia Pacific price surveys target purchases made in larger quantities. However, it is not clear whether the poor pay higher prices as they make purchases in smaller quantities. A factor that may offset the disadvantages associated with smaller quantity purchases is the fact that the poor tend to purchase from less expensive outlets. A comparison of item-level prices from the two surveys will be presented later.
Table 10. Sample Quantities: 2005 ICP Asia Pacific Price Surveys versus Poverty-Specific Price Surveys
Product
Item Priced
ICP Poverty
Coarse rice 10 kg 1 kgBeef - nonspecific cut 1 kg 250 gChillis - dried, red 100 g 50 gCandle 1 piece from a pack
of 4–6 candles1 piece
Table 11 shows differences in the quality of the products targeted for price surveys. Even when the product is the same, the quality of the product varies significantly across the two surveys. A good example is a bicycle. For the 2005 ICP Asia Pacific, a bicycle is of good quality with various features so that it becomes comparable across countries. In contrast, the poverty-specific price survey specification for the bicycle item reflects poorer quality as typically purchased by the poor. Given these differences, one would expect that prices paid by the poor would be lower, reflecting the lower quality of the products purchased.
Table 11. Sample Quantities: 2005 ICP Asia Pacific Price Surveys versus Poverty-Specific Price Surveys
Product
Item Priced
ICP Poverty
Rice Coarse; Brown; White; Premium
Coarse; Ordinary
Meats Choice cuts; nonspecific cut
Nonspecific cut
Vegetables Good quality Low qualityWine Table wine; Premium;
Native wineNative wine
Garments Local popular brand, medium quality
Cheapest brand, low quality
Bicycle Good quality with additional features
Cheap quality and basic features
The Survey Framework
The countries were given specific instructions on the survey framework and the general approach to follow in conducting the poverty-specific price surveys. The target price for the survey was the average of the prices paid over all the transactions or the purchases made by the poor in a given period of time.
Given the timing of the poverty PPP study and finalization of the product list in June 2006, it was generally agreed that countries would conduct the poverty-specific price surveys over a 2-week period in the last quarter of 2006. Because seasonality could be a problem, it was agreed that price data collected would be translated back to the June quarter of 2005.
The following are the main elements of the survey framework.
(i) Stratificationofthepopulation. As the survey needed to capture the purchases made by the poor in rural and urban areas, a stratified sampling approach with stratification based on rural and urban areas as well as by regions or states of the country at large was recommended.
(ii) Sampling frame of outlets within eachstratum. The sampling frame was to cover all relevant outlets specific to the

Chapter 6
2005 International Comparison Program in Asia and the Pacific 40
poor. Depending on the product, the frame covered different types of markets and outlets including open markets, wet markets, small retail shops, and weekly markets.
(iii) Samplingdesigns. A self-weighting design with the number of price quotations collected from a location reflecting the volume of transactions was used. The volume of transactions depended on the number of the poor. In such cases it was possible to derive national average prices by taking simple averages of the price quotations. However, when a simple random sample of prices was collected from different regions and outlets, then it was necessary to use a weighted average with weights proportional to the quantities purchased from the outlets.
The countries were advised to use the existing CPI infrastructure and framework for collecting prices. If the CPI survey covered only urban areas, the countries needed to include a selection of rural areas (towns and villages). Countries were advised to ensure that all relevant types of outlets for a given product were adequately covered.
Collection and Validation of Price Data
The countries conducted their poverty-specific price surveys during the third and fourth quarters of 2006, and submitted to the Regional Office national average prices. These averages are unweighted arithmetic averages of individual price quotations. The price data submitted were analyzed and validated using standard ICP procedures, and the results were presented at the validation workshop held in March 2007.
From the reports made by the country representatives, it is apparent that the participating countries ensured adequate coverage of both rural and urban outlets used by the poor.
A general conclusion from the data validation workshop was that the reported price data were of high quality. The participating countries appeared to have benefited from their ICP price survey experience. As a result, prices submitted were clean without too many outliers. The workshop participants expressed confidence that the price data submitted represented well the prices paid by the poor in their respective countries.
Appendix Table 1 shows the coverage of basic headings in different countries. The last column shows the number of countries without any price data for the given basic heading. As a number of basic headings had only one commodity, it is possible that some countries may not have priced that particular commodity and hence the basic heading has no data. The table shows that “passenger transport by railway” was not priced in nine countries. Similarly, Cambodia, Fiji Islands, and Lao PDR had no price data for 13, 12, and 11 basic headings, respectively. At the other end of the spectrum, India, Philippines, and Thailand had priced data for all the basic headings.
Quaranta Tables for Validating Price Data
Quaranta tables (developed in 1999 by Vincenzo Quaranta from the Italian Statistical Office) are a commonly used diagnostic tool for checking the presence of outliers in the price data. To demonstrate the quality of poverty-specific price survey data collected, Quaranta tables for the basic headings of rice in Table 12, and for product item Cabbage (basic heading Fresh and Chilled Vegetables) in Table 13 are presented here.

Chapter 6
41Research Study on Poverty-Specific Purchasing Power Parities for Selected Countries in Asia and the Pacific
Table 12. Quaranta Table for Rice
Quaranta Table Diagnostics-Filters - Rice
Basic Heading Code 1101111 Time period Jun-05 Run dateScope of Coverage Country Upper bound 150 Lower bound 50Averaging Method Arithmetic mean Imputation CPDPrice Attributes NALocation Attributes NAProduct Attributes NA
Summary Information
Number of items included in the analysis 6 out of 6 Average weight of basic heading in total expenditure 222.2Number of countries included in the analysis 16 out of 16 Average coefficient variation 14.7Base country A
Country Level Details
Country XR PPP PLI (%) Weight* Items Var.Co.A 1.00 1.00 100.0 222.2 3;*3 14.1B 16.99 9.77 57.5 222.2 3;*3 6.9C 11.64 9.62 82.6 222.2 3;*3 22.7D 1080.64 569.70 52.7 222.2 4;*4 14.5E 0.45 0.65 145.1 222.2 1;*1 0.0F 11.64 5.50 47.2 222.2 6;*6 14.6G 2562.58 1335.46 52.1 222.2 2;*2 29.2H 2813.55 1801.81 64.0 222.2 3;*3 18.1I 3.38 2.46 72.9 222.2 2;*1 12.1J 318.24 357.77 112.4 222.2 3;*2 6.3K 18.84 13.25 70.3 222.2 3;*3 20.5L 15.72 8.86 56.4 222.2 1;*1 0.0M 14.55 16.32 112.2 222.2 3;*3 15.5N 26.54 16.44 61.9 222.2 2;*2 7.0O 10.62 7.70 72.5 222.2 2;*2 9.0P 4187.61 2364.72 56.5 222.2 3;*3 13.9
PLI = price level index; PPP = purchasing power parity; Var Co = coefficient of variation; XR = exchange rate. * Shares are multiplied by 10,000.
Tables 12 and 13 are typical of Quaranta tables used in the process of validating price data. Table 12 provides information for validating data at the basic heading level while Table 13 provides information on price data for individual products that constitute a given basic heading.
In Table 13, diagnostics are presented for Cabbage, which is an item belonging to basic heading “Fresh and Chilled Vegetables and Fruits.” The NC-price (price in national or local currency) gives the average price of the product expressed in local currency units. Therefore, prices in the NC-price column are not strictly comparable. The column “Quotations” shows the number of price quotations
used in computing the national average prices. The coefficient of variation presented in the column “Var. Co.” provides a measure of reliability of the average price reported by a country. For example, in country A, the national average price is 7.011 with a coefficient of variation30 equal to 8.7 indicating a high degree of reliability. The column “XR-price” converts national prices into a common currency using the market exchange rates (MER). The XR-prices are comparable across countries. Here these prices show a high degree of variability ranging from a low of 0.30 for country E to a high of 1.84 for country I.
30 Coefficient of variation is defined as (standard deviation/arithmetic mean )*100.

Chapter 6
2005 International Comparison Program in Asia and the Pacific 42
Table 13. Quaranta Table for Cabbage
Item-level Details
8811011712 Cabbage Var.Co.: 21.5
Country NC-price Quotations Var.Co. XR-price XR-ratio CUP-price CUP-ratio Pref. UoM
A 7.011 20 8.7 0.41 68.24 0.97 92.13 500 - GramsB 5.763 36 24.9 0.49 81.82 1.08 102.75 500 - GramsC 669.035 73 13.8 0.62 102.36 0.96 91.89 500 - GramsD 0.496 17 2.8 1.11 183.51 1.07 101.93 500 - GramsE 3.537 654 22.3 0.30 50.21 0.83 79.53 500 - GramsF 998.236 395 25.5 0.39 64.40 0.84 79.74 500 - GramsG 1807.640 14 10.0 0.64 106.22 1.37 130.41 500 - GramsH 1.212 229 11.4 1.21 200.30 1.21 115.52 500 - GramsI 6.235 58 22.5 1.84 305.00 1.28 122.49 500 - GramsJ 187.182 27 23.3 0.59 97.24 0.85 81.11 500 - GramsK 7.219 77 25.5 0.38 63.33 0.90 86.14 500 - GramsL 5.469 70 17.3 0.35 57.54 0.93 88.25 500 - GramsM 17.197 255 28.8 1.18 195.47 1.65 157.37 500 - GramsN 18.896 60 25.8 0.71 117.72 1.28 121.61 500 - GramsO 5.411 36 22.5 0.51 84.23 0.90 85.84 500 - GramsP 1675.920 32 23.1 0.40 66.16 1.00 95.14 500 - Grams
CUP = conventional unit to express parity; NC = price in local currency; Pref. Uom = preferred unit of measure; Var. Co. = coefficient of variation; XR = exchange rate.
It is important to see if such variations are due to intrinsic differences in price levels of countries. This is achieved using the conventional unit to express parity (CUP-price) shown in column “CUP-price.” The CUP-price is derived by converting the NC-price using the PPP for the basic heading, Fresh and Chilled Vegetables and Fruits. The CUP-prices are, therefore, adjusted for price level differences across countries and are expected to be close to each other. This is reflected in the narrow range of 0.83 for country E to 1.65 for country M. The variability in the CUP-prices is measured using the coefficient of variation in the CUP-ratios reported in the column “CUP-ratio.” For the item Cabbage, the coefficient of variation, reported at the top of the table, is 21.5 indicating fairly consistent price data across countries for this item.
Table 12 provides summary information for the basic heading, rice. Six products are included under this basic heading. The XR column shows the MERs for 2005. The PPP column shows the basic heading PPPs computed using information on prices of six different varieties of rice using the CPD method (discussed in Chapter 5). For example, a PPP of 9.766 for country B implies that 9.766 units of country B currency have the same purchasing power as one unit
of the currency of country A. The column “PLI”, the price level index, is simply the ratio of PPP to the exchange rate (multiplied by 100). For example, a PLI of 57.495 percent for country B implies that the price level in country B are roughly half that observed in country A. The weight column shows the weight attached to the particular basic heading in each of the countries. In the table, the weights are all shown to be equal to 222.2, indicating that a dummy value was fed into the tabulation.31 The column “Items” shows a pair of numbers: the first number shows the number of items in the basic heading that were priced in a given country and the second number shows the number of items that are considered representative. In the poverty-specific price surveys all items are considered to be representative; therefore both numbers are the same. For example, in country F all the six varieties of rice were priced, whereas in country E only one variety was priced. The last column, “Var. Co.”, shows the reliability of price data for each country. This is a coefficient of variation of the CUP-prices for each of the rice varieties priced in a given country. A low coefficient of variation implies
31 Expenditure weights are not required for computing basic heading PPPs reported in the Quaranta table. These weights are needed for aggregation above the basic heading level.

Chapter 6
43Research Study on Poverty-Specific Purchasing Power Parities for Selected Countries in Asia and the Pacific
that the variation in prices of different varieties of rice included in the basic heading are very similar after they are adjusted for the PPP of the basic heading. The low values reported in this column show that the price data for this basic heading are reliable.
The validation of all price data from the poverty-specific price surveys was conducted using tables similar to Tables 12 and 13. It was generally recognized that the data from the poverty price surveys was of good quality.
Adjusting Poverty-Specific Price Survey Data to 2005 Levels
The price data supplied were adjusted using CPI data available at the most detailed level to adjust the third or fourth quarter 2006 prices to June 2005. Details of the adjustment for each participating country are given in Table 14.
These adjustments to price data provided by the countries are also designed to minimize the seasonal effects on commodity prices, especially prices of fruits and vegetables. Once the price adjustments were made, price data from the poverty-specific price
surveys could be compared and contrasted with the price data for similar products collected in the 2005 ICP Asia Pacific price surveys. This forms the substance of the next section.
Comparing Price Data from the 2005 ICP Asia Pacific Price Surveys and the Poverty-Specific Price Surveys
Sets of price data from the 2005 ICP Asia Pacific price surveys and as part of the poverty-specific price surveys were used in computing PPPs for converting the IPL. The resulting PPPs are presented in Chapter 7. Two sets of comparisons are presented here. First, the raw prices from the two sources are compared. Second, the basic heading PPPs resulting from the two sets are compared. It is not clear how PPPs would change when poverty-specific price survey data are uniformly less than the 2005 ICP Asia Pacific prices in two countries under consideration. It must be noted that PPPs based on the poverty-specific price surveys would not necessarily be lower than PPPs based on the 2005 ICP Asia Pacific price surveys even if the ICP prices
Table 14. Adjustment of Poverty-Specific Price Survey Data to Mid-2005
Country Survey Period Data Description
Bangladesh November 2006 CPI for November 2006 indexed on June 2005 by item level; CPI by rural and urban areasBhutan August 2006 Quarterly CPI at basic heading level; 3rd quarter 2006 as index for August 2006; average
of 2nd and 3rd quarters 2005 as index for June 2005Cambodia October 2006 Item level CPI for October 2006 and June 2005Fiji Islands August 2006 2004-2007 monthly CPI by commodity groupsIndia September 2006 For urban prices: CPI for industrial workers by commodity groups
For rural prices: CPI for agricultural laborers by major commodity groupsIndonesia September 2006 June 2005 and September 2006 CPI by major commodity groups
Lao People’s Democratic Republic November 2006 2005-2006 monthly CPI by major commodity groupsMalaysia August 2006 June 2005 to August 2006 monthly CPI by basic headingMaldives October 2006 June 2005 and October 2006 CPI by product classMongolia October 2006 June 2005 to October 2006 monthly CPI by commodity groupsNepal August 2006 National urban CPI for June 2005 and August 2006 by subgroups (close to BH level)Pakistan October 2006 June 2005 and October 2006 CPI by commodity classPhilippines August 2006 The Philippines provided adjusted pricesSri Lanka August 2006 Monthly 2005 and August 2006 CPI by commodity classThailand August 2006 June 2005 and August 2006 CPI by commodity classViet Nam August 2006 CPI for August 2006 indexed on June 2005 by commodity classCPI = consumer price index; BH = basic heading.

Chapter 6
2005 International Comparison Program in Asia and the Pacific 44
Asia Pacific, which were typically much larger (Table 10 has some examples). Another possible reason could be that the poor may be predominantly located in the rural areas and, due to transportation costs, prices of many products, especially clothing and household goods, could be higher than the prices paid in urban locations. This particular phenomenon is evident in poverty prices collected in Bhutan. Note, however, that Bhutan made special efforts in the poverty-specific price surveys to collect prices representative of the poor and, therefore, had a good proportion of price quotations from the rural areas including some remote areas.
Table 16 summarizes the differences in the two surveys for items that could be matched. It presents the percentage of the matched items where poverty prices are lower than the 2005 ICP Asia Pacific prices, higher than the ICP prices by less than 20%, and higher than the ICP prices by more than 20%. The table also shows that a large proportion of items for Bhutan and Fiji Islands have poverty prices higher than the 2005 ICP Asia Pacific prices. Another interesting point is that for food-related items, a higher proportion have poverty prices higher than the ICP prices. A possible explanation is that as food purchases are usually made on a day-to-day basis and due to the rural location of the outlets where the poor are located, the poor might have no choice but to pay the market prices even if they are high. On the other hand, nonfood purchases like clothing can be made in urban locations nearby, thus allowing to search for lower prices.
In the “All Items” panel in Table 16, Viet Nam, Indonesia, Thailand, and India have the highest proportion of items with prices less than the corresponding 2005 ICP Asia Pacific prices. The lowest percentage is observed in Nepal with 74.68% of poverty prices less that ICP prices followed by Fiji Islands with 76.92%, Bangladesh with 77.66%, Maldives with 78.69% and Bhutan with 79.75%. There is only a small percentage of products ranging from a low of 1.03% in India to a high of 8.20% in the Maldives where poverty prices exceeded ICP prices by more than 20%.
The second and third panels in Table 16 show detailed results computed for food and nonfood items. It is interesting to note that poverty prices are below the 2005 ICP Asia Pacific prices for most of the nonfood items, with a high value of 98.31% in the case of India. For most countries, this percentage is well above 90%, with the lowest percentage at 83.33
are generally higher. This is mainly due to the fact that the PPPs are expressed relative to the currency of a reference country.32 The data presented here are also used in making inferences on the regularly asked question, do the poor pay higher prices?
Item-Level Prices
Before comparing the prices, it is necessary to make the items between the two sources compatible. First, not all 2005 ICP Asia Pacific items had corresponding items in the poverty-specific price survey product list. Therefore, it was necessary to establish correspondence between the products in the two lists. As the 2005 ICP Asia Pacific product list had in excess of 650 products compared with 155 in the poverty-specific price surveys, a large portion of price data from the ICP list could not be used for comparisons. Further, purchase quantities for the ICP commodities were generally a lot bigger than the purchase quantities for the poverty-specific price surveys. This is evident from Table 9. Therefore, price quotations obtained from the ICP price surveys had to be converted to a quantity unit comparable with that used in the poverty-specific price surveys. For example, prices of rice items were collected for units of 10 kg. in the ICP. They had to be adjusted to the 1 kg. purchase quantity in the poverty-specific price surveys. All prices were derived using a pro rata adjustment, which assumes a linear relationship between quantity and price.
Examination of the prices reveals that, in general, poverty-specific price survey data were lower than the 2005 ICP Asia Pacific survey prices. Price ratios of selected items from the two surveys are presented in Table 15. However, in most of the countries, there were also products for which poverty-specific price survey data were higher than prices from the 2005 ICP Asia Pacific price surveys. There can be several reasons for that. For example, because the poor usually purchase small quantities, they tended to pay higher prices when compared, on a pro rata basis, with purchase quantities used in the 2005 ICP
32 A simple example helps in understanding the mechanics of this. Suppose the ICP price for 1 chicken egg is RM0.28 in Malaysia and Rs2.00 in India. This gives a PPP of Rs7.14 per RM for the ICP. Suppose the price of chicken egg in Malaysia and India from poverty price surveys are RM0.24 and Rs1.90, respectively. This means that in both countries poverty-specific price survey data are lower than the respective ICP prices. The PPP based on poverty price surveys, based on the price of chicken egg, is Rs7.92 per RM; this PPP is higher than the corresponding PPP from ICP prices. The reason for this is that the poor in Malaysia pay a relatively lower price for chicken egg than their counterparts in India do.

Chapter 6
45Research Study on Poverty-Specific Purchasing Power Parities for Selected Countries in Asia and the Pacific
Table 15. Price Ratios of Selected Items from Poverty-Specific Price Surveys and 2005 ICP Asia Pacific Price Surveys
CountryChicken
Egg Cabbage Garlic Salt
Softdrinks (small bottle)
T-shirt - men’s
T-Shirt (top)
- girl’s
Kerosene (open
market)House Candle Pencil
Men’s Basic Haircut
–street side
Basic Body Soap
Bangladesh 1.00 1.22 0.76 0.87 0.64 0.30 0.21 0.97 0.43 0.38 0.18 0.70 Bhutan 0.58 0.71 0.56 1.01 0.81 0.61 0.61 1.03 0.78 1.02 0.82 0.45 Cambodia 0.90 0.89 0.91 1.08 0.71 0.25 0.54 1.01 0.50 0.33 0.55 0.89 Fiji Islands 1.05 0.58 1.03 1.10 1.16 0.33 0.55 0.96 0.67 0.29 0.79 0.95 India 1.03 0.61 1.81 0.48 0.58 0.30 0.37 1.05 0.44 0.73 0.34 0.65 Indonesia 0.72 0.81 1.00 0.76 0.58 0.61 0.75 1.38 0.40 0.56 0.29 0.83 Lao People’s Democratic Republic 0.79 0.88 0.68 0.58 0.76 0.36 0.46 1.04 0.12 0.44 0.68 0.54 Malaysia 0.88 0.88 1.09 0.98 0.95 0.22 0.49 1.42 0.85 0.84 0.41 0.95 Maldives 0.93 0.72 0.85 1.07 1.03 0.61 0.66 0.91 0.37 0.60 0.22 0.93 Mongolia 1.07 0.76 1.15 0.97 0.81 0.22 0.24 - 0.55 0.47 0.58 0.53 Nepal 1.02 0.97 1.22 0.98 0.80 0.37 0.43 1.10 0.64 0.73 0.43 0.43 Pakistan 0.69 0.73 0.68 1.00 0.77 0.63 0.67 0.97 0.65 0.93 0.42 1.02 Philippines 0.96 1.03 0.58 0.38 0.82 0.58 0.21 0.89 1.05 0.89 0.64 0.74 Sri Lanka 1.11 0.84 0.83 0.84 0.66 0.38 0.49 1.36 0.46 0.72 0.43 0.85 Thailand 0.70 0.59 0.83 0.85 0.80 0.31 0.32 1.02 0.97 0.70 0.47 0.92 Viet Nam 0.91 0.92 0.91 0.56 0.98 0.21 0.23 1.09 0.24 0.47 0.62 0.74
ICP = International Comparison Program. Note: Prices ratios are computed as poverty price over ICP price.
Table 16. Comparison of Prices from Poverty-Specific Price Surveys and 2005 ICP Asia Pacific Price Surveys (percent)
Country
All Items Food Items Nonfood Items
Poverty < ICP
Poverty > ICP
(up to 20%)
Poverty > ICP
(> 20%)Poverty
< ICP
Poverty > ICP
(up to 20%)
Poverty > ICP
(> 20%)Poverty
< ICPPoverty > ICP
(up to 20%)Poverty > ICP
(> 20%)
Bangladesh 77.66 17.02 5.32 60.00 30.00 10.00 90.74 7.41 1.85 Bhutan 79.75 16.46 3.80 59.38 34.38 6.25 93.62 4.26 2.13 Cambodia 83.61 9.84 6.56 73.08 15.38 11.54 91.43 5.71 2.86 Fiji Islands 76.92 15.38 7.69 45.83 33.33 20.83 95.12 4.88 - India 91.75 7.22 1.03 81.58 15.79 2.63 98.31 1.69 - Indonesia 92.68 4.88 2.44 88.89 8.33 2.78 95.65 2.17 2.17 Lao People’s Democratic Republic 90.00 6.67 3.33 96.00 4.00 - 85.71 8.57 5.71 Malaysia 89.69 6.19 4.12 83.33 9.52 7.14 94.55 3.64 1.82 Maldives 78.69 13.11 8.20 72.00 20.00 8.00 83.33 8.33 8.33 Mongolia 83.10 9.86 7.04 60.87 26.09 13.04 93.75 2.08 4.17 Nepal 74.68 22.78 2.53 51.61 45.16 3.23 89.58 8.33 2.08 Pakistan 83.33 14.44 2.22 83.33 11.11 5.56 83.33 16.67 - Philippines 85.71 12.09 2.20 84.21 10.53 5.26 86.79 13.21 - Sri Lanka 85.26 9.47 5.26 75.00 20.00 5.00 92.73 1.82 5.45 Thailand 92.05 7.95 - 91.89 8.11 - 92.16 7.84 - Viet Nam 94.57 4.35 1.09 94.87 2.56 2.56 94.34 5.66 -
ICP = International Comparison Program.

Chapter 6
2005 International Comparison Program in Asia and the Pacific 46
reported for the Maldives and Pakistan. Possible reasons could be, first, it is likely that the quality of the products priced in the 2005 ICP Asia Pacific price surveys are of higher quality than those priced in the poverty-specific price surveys. It is more difficult to ensure that the same quality product is priced in both surveys when it comes to nonfood items. Second, one may argue that purchases of nonfood items are made by rural households when they travel for some other purposes to urban centers, where the prices are likely to be lower.
In the case of food items, a larger proportion of food items, compared with a similar proportion of nonfood items, have poverty prices higher than the ICP prices. This difference assumes a larger significance when it is coupled with the fact that food items and their packaging in poverty-specific price surveys are of lower quality. The reasons for this observation could be that, first, the poor make food purchases as and when they need them and cannot wait until low prices are offered for the items. Second, prices of food items are likely to be higher in rural areas due to costs of transportation as well as to higher marketing margins extracted by traders.
General trends in the poverty-specific and 2005 ICP Asia Pacific price surveys are examined in a series of graphs presented in Figure 1 for some selected countries, namely, Bhutan, Fiji Islands, India, Mongolia, Philippines, and Viet Nam. The charts present scatter plots of poverty and ICP prices in their logarithmic form, so ln(Poverty price) and ln(ICP price) are used in the x-axis and y-axis, respectively. The scatter plots are based on the subsets of items that are priced in a given country in both the poverty-specific price surveys and 2005 ICP Asia Pacific price surveys. As the products are diverse, the price range is large in most countries. Because there are items like bread and bicycle on the product lists, it is more convenient to present them using a logarithmic scale. Further, the scatter plots in original prices tended to exhibit heteroscedasticity, i.e., scatter plots tend to be distributed more widely as poverty prices increased. A natural way of addressing this problem is to take logarithms of prices.
The charts show two types of trend lines. The solid line represents the line of equality between poverty and 2005 ICP Asia Pacific prices. If ICP prices were equal to poverty prices the scatter plots would be on the solid line. So all those observations above the solid line represent items for which ICP prices are above the poverty prices. The light weighted
line represents a fitted regression equation between poverty prices and ICP prices (in logarithms). While the general trend is that a majority of ICP prices are above the poverty prices, as expected, there are subtle differences between countries. In addition, all the trend lines indicate that products with high poverty prices also have high ICP prices.
In both Bhutan and Fiji Islands, there are a number of low-end priced products for which the 2005 ICP Asia Pacific prices are lower than poverty prices. This may be due to higher transportation costs involved in making goods available in rural areas. In contrast, ICP prices in India are generally higher than poverty prices with a few exceptions. For Mongolia, there are many mid-range price products for which ICP prices are found to be lower than the poverty prices. In the case of Viet Nam, for the observed range of prices, the trend line is uniformly above the price of equality between ICP and poverty prices.
The results generally indicate the plausibility of the prices collected through the poverty-specific price surveys in the 16 participating countries.
PPPs at the Basic Heading Level from the 2005 ICP Asia Pacific and Poverty-Specific Survey Prices
Poverty price data discussed in the previous section confirm the general expectations in terms of comparative levels of poverty-specific price survey data and 2005 ICP Asia Pacific survey prices. The next question to consider is the effect of using poverty prices on PPPs at the basic heading level. As PPPs are multilateral price index numbers, it is difficult to speculate whether basic heading poverty PPPs would be higher or lower than ICP PPPs. For example, poverty prices in a given country, say India, are uniformly below the ICP prices for all the items within a basic heading. What then could be said about the basic heading poverty PPP if the reference country is Malaysia? If the Malaysian poverty and ICP prices are the same, then at least in a binary comparison, it can be said that the basic heading PPP for the Indian rupee with poverty prices would be lower than the ICP PPP for the same basic heading. This conclusion gets reversed if Malaysian poverty prices are lower than the corresponding ICP prices by a bigger proportion than in India. In other cases, it would be difficult to speculate.

Chapter 6
47Research Study on Poverty-Specific Purchasing Power Parities for Selected Countries in Asia and the Pacific
Bhutan
y = 1.1033x
(2.00)
(1.00)
1.00
2.00
3.00
4.00
5.00
6.00
7.00
8.00
(1.00) 1.00 2.00 3.00 4.00 5.00 6.00
Poverty Prices
ICP
Price
s
Fiji Islands
y = 1.1822x
(4.00)
(3.00)
(2.00)
(1.00)
1.00
2.00
3.00
4.00
(3.00) (2.00) (1.00) 1.00 2.00 3.00 4.00
Poverty Prices
ICP
Price
s
India
y = 1.2358x
(4.00)
(2.00)
2.00
4.00
6.00
8.00
10.00
(4.00) (2.00) 2.00 4.00 6.00 8.00
Poverty Prices
ICP
Price
sIC
P Pr
ices
Mongolia
y = 1.1046x
2.00
0
0
4.00
6.00
8.00
10.00
12.00
2.00 4.00 6.00 8.00 10.00 12.00
Poverty Prices
ICP
Price
s
Philippines
y = 1.1707x
(2.00)
2.00
4.00
6.00
8.00
10.00
(2.00) (1.00) 1.00 2.00 3.00 4.00 5.00 6.00 7.00 8.00
Poverty Prices
Viet Nam
y = 1.0932x
2.00
0
0
4.00
6.00
8.00
10.00
12.00
14.00
16.00
2.00 4.00 6.00 8.00 10.00 12.00 14.00
Poverty Prices
ICP
Price
s
Figure 1. Comparison of Poverty-Specific Prices and 2005 ICP Asia Pacific Prices for Selected Countries

Chapter 6
2005 International Comparison Program in Asia and the Pacific 48
A comparison of some interest would be to see if the basic heading PPPs from poverty-specific price survey data are significantly different from those obtained from the 2005 ICP Asia Pacific survey prices. There are several points to note here. There are 110 basic headings for ICEH in the 2005 ICP Asia Pacific whereas there are only 45 in the poverty-specific price surveys. Therefore, a comparison can be attempted only for 45 basic headings. The second point is that there is no a priori expectation as to which PPPs would be higher or which would be lower. The only point of interest is to see if the PPPs differ significantly. The question of whether the differences in the basic heading PPPs from the two surveys make any difference to the poverty PPPs is examined in Chapter 7.
Trends that may be present in the basic heading PPPs based on poverty and ICP prices will be clearer if charts are used in place of tables. As basic heading PPPs express the number of local currency units that are equivalent to one unit of the reference country currency, the basic heading PPPs are expected to be in a narrower ranger than the range for prices of items in the ICP or poverty price surveys. Therefore, the scatter plots in Figure 2 are not converted into logarithms. They are in the currency units of the respective countries.
The six charts are based on basic heading PPPs computed using 2005 ICP Asia Pacific and poverty-specific price survey data. As the poverty PPPs cover only 45 basic headings, the scatter plots are based on results for the overlapping basic headings for which there are PPPs from both sources. The fitted lines have slopes close to 1 for Bhutan, Fiji Islands, and Philippines. Slopes for the other three countries are below 1.
The equality of ICP and poverty basic heading PPPs is examined using a nonparametric test for all the countries using the Wilcoxon signed-rank test for equal means.
Table 17 shows the values of the z-statistic and the p-values of the Wilcoxon signed-rank test for equal means. The results show that the ICP and poverty basic heading PPPs are significantly different for Indonesia, Maldives, Philippines, Sri Lanka, and Thailand. The results, however, are not very useful in drawing any conclusions about the total effect of using ICP or poverty prices on the poverty PPPs generated. In any statistical test, the PPPs are considered to be a random sample. However, in combining basic
heading PPPs to derive a PPP for consumption, different weights are assigned to different basic heading PPPs. Results presented in Chapter 7 will provide an indication as to the differences in PPPs brought about by differences in ICP and poverty-specific price survey data.
A Preliminary Comparison of Poverty-Specific Price Survey Data and Household Expenditure Survey Unit Values
HES as a Source of Price Data
The HES are the standard sources for expenditure weights. Their main purpose is to collect data on household expenditure on different consumption items. In many countries, data are also collected on the quantities of items consumed along with the total household expenditure on the item. These quantities include consumption of purchased quantities as well as consumption of own production and payments in kind. To match the value with the quantity consumed, a value is imputed for the in-kind consumption component. If the HES data provide
Table 17. Nonparametric Tests for Equality of Means: 2005 ICP Asia Pacific and Poverty Price Consumption PPPs
Country
Wilcoxon Signed-Rank Test for Equal Means
z-stat p-value
Bangladesh 1.484 0.138Bhutan –0.909 0.364Cambodia –1.264 0.206Fiji Islands –1.434 0.152India 1.405 0.160Indonesia 3.178 0.002*Lao People’s Democratic Republic –0.311 0.756Maldives –2.585 0.010*Mongolia 0.886 0.376Nepal –0.107 0.915Pakistan –0.717 0.474Philippines –1.676 0.094*Sri Lanka 0.305 0.761Thailand 1.744 0.081*Viet Nam 2.297 0.022*
* Denotes significance at 10% or lower.

Chapter 6
49Research Study on Poverty-Specific Purchasing Power Parities for Selected Countries in Asia and the Pacific
Bhutan
ICP
Pove
rty
Fiji Islands
ICP
Pove
rty
India
ICP
Pove
rty
Pove
rty
Mongolia
ICP
Pove
rty
Philippines
ICP
Viet Nam
ICP
Pove
rty
y = 1.0444x
0.00
5.00
10.00
15.00
20.00
25.00
0.00 2.00 4.00 6.00 8.00 10.00 12.00 14.00 16.00 18.00
y = 0.8794x
0.00
5.00
10.00
15.00
20.00
0.00 2.00 4.00 6.00 8.00 10.00 12.00 14.00 16.00
y = 1.0687x
0.00
5.00
10.00
15.00
20.00
25.00
30.00
0.00 5.00 10.00 15.00 20.00 25.00
y = 1.0209x
0.00
0.20
0.40
0.60
0.80
1.00
1.20
1.40
0.00 0.20 0.40 0.60 0.80 1.00 1.20 1.40
y = 0.9704x
0.00
100.00
200.00
300.00
400.00
500.00
600.00
700.00
800.00
0.00 100.00 200.00 300.00 400.00 500.00 600.00
y = 0.8843x
0.00
1,000.00
2,000.00
3,000.00
4,000.00
5,000.00
6,000.00
7,000.00
8,000.00
0.00 1,000.00 2,000.00 3,000.00 4,000.00 5,000.00
Figure 2. Comparison of Poverty and ICP Basic Heading PPPs for Selected Countries

Chapter 6
2005 International Comparison Program in Asia and the Pacific 50
information on expenditure as well as quantity for each household, then unit values can be computed for the items. The unit values vary from household to household.
Deaton (2004) explores the possibility of using unit values from HES as a source of price information for the purpose of computing PPPs. His work, based on data for India and Indonesia, has shown that it is possible to make use of the currently known index number methods to estimate PPPs based on unit value data. His work also demonstrates the problems associated with unit value data.
For the purpose of the poverty PPP study, unit prices are a particularly attractive source of price data. As unit values can be obtained for each household in the HES, it would be possible to obtain average prices paid by all those households in the survey that may be considered to be poor. In this case, the price data refer specifically to poor households. This is in contrast to the price data collected from the poverty-specific price surveys described earlier in this chapter. Poverty-specific price surveys provide price data collected from outlets that are the most likely sources of purchases by the poor, although the same outlets may also be used by households from different income brackets. Poverty-specific price surveys are also restricted to lower quality items and small purchase quantities, thereby enhancing the possibility that the collected prices may represent the prices paid by the poor.
The next subsection is devoted to a preliminary comparison of prices from poverty-specific price surveys and unit values from HES.
A Comparison of Unit Values and Poverty-Specific Price Survey Data
Poverty-specific price survey data were compared with unit values calculated from HES in Bangladesh, India, Indonesia, and Nepal. The prices and unit values cover food and beverage items only. The following steps were undertaken to make the comparisons.
Step 1. Match items from the poverty-specific price surveys with items for which expenditure and quantity information is recorded in the HES.
Several difficulties were encountered in this step. First, it was not always possible to match product descriptions across the poverty-specific price surveys and the HES (Table 18). In addition to the fact that certain products existed in one survey and not in the other, the product descriptions did not always match perfectly. In some cases (Table 19), products were lumped together in the HES (for example, “coffee [ground beans, instant]” versus “coffee powder” in the poverty survey in Indonesia); in other cases, the descriptions seemed to be for very similar products, but are perhaps not identical (for example, “wheat flour ” in both surveys in Nepal but with a large divergence between the poverty survey price and median unit values). Second, even if product descriptions were similar, there were cases where the units of measurement were different and could not be harmonized. For example, sometimes the HES used “pieces”, while the poverty-specific price survey expressed units in terms of a specific weight. Additionally, in Indonesia there seemed to
Table 18. Household Food and Beverage Expenditures Covered by Matched Products for Poor Households*
Country
Number of Products
in Poverty Survey Number of “Good” Matches
Total Number of
Matched Products
Average Coverage of Matched Products in Household Food and Beverage Expenditures
(%)**
Bangladesh (2005) 67 36 52 70India (2004/05) 78 51 75 77India (only samples surveyed in 2005) 78 51 75 77Indonesia (2005) 49 32 32 54Nepal (2004/05) 50 21 26 65
* Poor households were defined on the bases of official/national poverty lines (upper poverty lines for Bangladesh).** Average computed using household sample weights.Note: Good matched items include correct matches, duplicates, and those whose conversions are ignored due to the comparability and closeness of values of the household expenditure survey prices with the poverty-specific survey prices.

Chapter 6
51Research Study on Poverty-Specific Purchasing Power Parities for Selected Countries in Asia and the Pacific
be some products for which harmonization of units could be achieved in principle, but the resulting poverty-specific price survey data and HES unit values were very different.
Step 2: Compute unit values for matched products.
Several important points must be noted. First, household-level observations on unit values were obtained from expenditure and quantity information only when the item in question was purchased by the household. In other words, items obtained as gifts or from homegrown stock were ignored in computing unit values. Second, unit values were obtained from sample households that are below the national poverty line. Third, the unit values typically displayed a wide range (i.e., a large difference between minimum and maximum). For this reason, it was decided that the median value of the unit values would be the best one to compare with prices obtained from the poverty-specific price surveys. Fourth, statistics on unit values (such as median and mean unit values) were computed using household sample weights to derive nationally representative unit values for poor households.
Step 3: Adjust poverty-specific price survey data to synchronize with unit values from the HES year.
As they stand, the prices and unit values collected in the two sets of surveys do not pertain to the same date. While the poverty-specific price survey data were collected in 2006, the HES from which unit values were calculated were carried out in different years: January to December 2005 for Bangladesh, July 2004 to June 2005 for India, February 2005 for Indonesia, and April 2003 to April 2004 for Nepal.
The difference in timing of the two sets of surveys was dealt with in the following manner. First, the poverty-specific price survey data were converted to 2005 values using disaggregated CPI data obtained from national statistical offices. (See the section, Adjusting poverty-specific price survey data to 2005 levels.) Second, the following steps were taken for each of the countries insofar as unit values from HES are concerned.
(i) For Bangladesh and Indonesia, no adjustments were made since the surveys were carried out in 2005.
Table 19. Ratio of Poverty-Specific Survey Prices and Household Expenditure Surveys Unit Values for Selected Products
Bangladesh
Products
UOM Remarks
Average Budget
Share (%)
Price Ratios
PPS HESPPS to HES (Median)
PPS to HES (Mean)
Coarse rice, parboiled Rice - coarse 1 kg Duplicate 3.8 1.00 0.95Ordinary coarse rice #1 Rice - coarse 1 kg Duplicate 3.8 1.07 1.03Ordinary coarse rice #3 Rice - coarse 1 kg Duplicate 3.8 0.99 0.94Onion Onion 250 g 1.2 1.35 0.98Beef - nonspecific cuts Beef 250 g 1.1 1.03 1.04Betel - leaves Betel leaf 10 pc Duplicate 0.9 9.40 0.38Salt Salt 1 kg 0.9 0.93 0.88Chicken - nonspecific cuts Hen 250 g 0.8 1.54 1.50Chillis - dried, red Dried chili 50 g 0.8 0.79 0.82Betel nut - dried (Aracanut/Arecanut) Betel nut 50 g 0.7 1.15 1.07Turmeric powder Turmeric 50 g 0.7 1.40 1.44Chillis - fresh, green, or red Green chilli 100 g 0.6 1.21 1.09PPS = poverty-specific price survey; HES = household expenditure survey; UOM = unit of measure; kg = kilogram; g = gram; pc = piece.

Chapter 6
2005 International Comparison Program in Asia and the Pacific 52
(ii) For India, the survey was carried out from July 2004 to June 2005. No adjustments were made on the data.
(iii) For Nepal, unit values from the HES, which was carried out from April 2003 to April 2004, were converted to 2005 values using the CPI for the food subgroup. Unfortunately, there were several drawbacks in the procedure. First, the CPI data pertained only to the food component. More disaggregated information was not available. Second, the CPI data are annual in nature; they extend from July of one year to June of the following year (and so do not match perfectly the period over which the HES was carried out). Third, it was not possible to determine in which month a household was surveyed. Therefore, the adjustments to the unit values are on the crude side.
The comparison exercise generated a huge amount of data. Summary tables showing ratios of prices from the poverty-specific price surveys and unit values from the HES for some commonly featured items (selected based on budget share) are presented in Table 19. The tables include a column labeled “Remarks.” The following is an explanation of the remarks.
(i) No remarks. Products without remarks are considered to have good matches from the HES and the poverty-specific price surveys.
(ii) Duplicate. A product from the HES tends to have a good match with two or more products from the poverty-specific price surveys (and vice versa).
(iii) No conversion. There are problems in harmonizing the units of measurements
Table 19. Ratio of Poverty-Specific Survey Prices and Household Expenditure Surveys Unit Values for Selected Products (continued)
India (July 2004 to June 2005)
Product
UOM Remarks
Average Budget Share
(%)
Price Ratios
PPS HES
PPS (Natl) to HES
(Median)
PPS (Natl) to HES (Mean)
PPS (U/R) to HES
(Median)
PPS (U/R)
to HES (Mean)
Coarse rice, parboiled Rice - other sources 1 kg Duplicate 16.0 1.06 1.05 1.03 1.01Ordinary coarse rice #1 Rice - other sources 1 kg Duplicate 16.0 1.11 1.09 1.08 1.06Ordinary coarse rice #2 Rice - other sources 1 kg Duplicate 16.0 1.03 1.02 1.00 0.99Ordinary coarse rice #3 Rice - other sources 1 kg Duplicate 16.0 0.92 0.91 0.89 0.88Glutinous rice Rice - other sources 1 kg Duplicate 16.0 0.99 0.98 0.97 0.95Wholemeal flour (Atta) - not subsidized
Wheat/atta - other sources 1 kg 9.0 1.59 1.45 1.55 1.41
Mustard oil - unrefined Mustard oil 1 kg 5.8 1.03 1.03 1.02 1.03Milk - not pasteurized (buffalo or cow) Milk: liquid 1 L Duplicate 5.0 1.15 1.08 1.16 1.08Milk - pasteurized Milk: liquid 1 L Duplicate 5.0 1.25 1.17 1.27 1.19Potato Sugar - other sources 1 kg 4.0 1.11 1.13 1.07 1.08White sugar Potato 1 kg 3.9 0.98 0.98 0.95 0.95Coarse rice, subsidized Rice (PDS) 1 kg 2.9 1.07 1.06 1.04 1.03Bidi cigarettes Bidi 1 pc 1.9 1.13 1.00 1.20 1.06Tea leaves Tea: leaf 1 g 1.8 1.00 0.80 1.00 0.80Onion Onion 1 kg 1.8 1.31 1.26 1.25 1.20
PPS = poverty-specific price survey; HES = household expenditure survey; UOM = unit of measure; kg = kilogram; g = gram; pc = piece; L = liter; PDS = public distribution system.

Chapter 6
53Research Study on Poverty-Specific Purchasing Power Parities for Selected Countries in Asia and the Pacific
between a product from the HES and the corresponding product from the poverty-specific price surveys.
(iv) Ignoring conversion. These are cases where there is close correspondence between price and median unit values if two commodities of different units of measurements are not converted/harmonized (and poor correspondence if they are converted/harmonized on the basis of the units reported in the surveys). This may have happened because enumerators did not actually use the units reported in the HES.
The most appropriate comparison would be between the poverty-specific price survey data and the median unit values observed from the HES. It should be noted that the unit values cover all households below the poverty line. As the unit values are known
to have errors reflected as outliers, it is better to use the median prices derived from the HES.
The most notable observation in Table 19 is that poverty-specific price survey data are often above the median unit values. There are a few exceptions to this general observation. If the focus is on items that may be considered essential, like rice and milk, the poverty prices appear to be close to the median unit values observed.
Tables 20–23 list the results of some simple pairwise and Spearman rank correlations involving well-matched products as well as others.
The reported correlations show a strong correlation between unit values and prices from the poverty-specific price survey. However, strong correlations do not necessarily mean equality of prices from the poverty-specific price survey and unit
Table 19. Ratio of Poverty-Specific Survey Prices and Household Expenditure Surveys Unit Values for Selected Products (continued)
Indonesia
Products
UOM Remarks
Average Budget Share
(%)
Price Ratios
PPS HES
PPS to HES
(Median)PPS to HES
(Mean)
Coarse rice, subsidized Rice (local, high quality, imported)
1 kg Duplicate 28.4 0.31 0.30
Ordinary coarse rice #3 Rice (local, high quality, imported)
1 kg Duplicate 28.4 1.32 1.29
Brown sugar Granulated sugar 100 g Duplicate, Ignoring conversions
4.5 1.11 1.04
White sugar Granulated sugar 100 g Duplicate, Ignoring conversions
4.5 1.30 1.22
Cooking oil - vegetable Other cooking oil 250 ml 4.2 1.20 1.05Coconut oil - unrefined Coconut oil 250 ml 2.3 0.97 0.91Onion Shallot 250 g Ignoring conversions 1.9 1.94 1.54Salt Salt 1 kg 1.6 16.43 10.63Coffee powder Coffee (ground, beans, instant) 100 g Ignoring conversions 1.6 1.74 1.21MSG (monosodium glutamate) MSG (monosodium glutamate) 10 g Ignoring conversions 1.1 1.39 1.01Garlic Garlic 100 g Ignoring conversions 1.1 0.90 0.71Chillis - fresh, green or red Red chilli 100 g Ignoring conversions 1.0 0.76 0.73Tea - dust Tea 50 g Ignoring conversions 1.0 0.85 0.72
PPS = poverty-specific price survey; HES = household expenditure survey; UOM = unit of measure; kg = kilogram; g = gram; ml = milliliter.

Chapter 6
2005 International Comparison Program in Asia and the Pacific 54
Table 19. Ratio of Poverty-Specific Survey Prices and Household Expenditure Surveys Unit Values for Selected Products (continued)
Nepal
Products
UOM Remarks
Average Budget Share
(%)
Price Ratios
PPS HESPPS to HES (Median)
PPS to HES (Mean)
Coarse rice, subsidized Coarse rice 1 kg Duplicate 28.1 1.04 0.98Ordinary coarse rice #1 Coarse rice 1 kg Duplicate 28.1 1.16 1.09Mustard oil - unrefined Mustard oil 250 ml 6.6 0.88 0.91Wheat flour - loose Wheat flour 1 kg 4.9 1.90 1.83Coarse rice, parboiled Fine rice 1 kg 3.0 1.28 1.23Salt Salt 1 kg 2.8 1.41 1.28Maize Flour Maize flour 1 kg 2.6 1.66 1.64Beaten rice (Chira) Beaten rice (Chira) 500 g 2.4 1.22 1.20Chicken - nonspecific cuts Chicken 250 g 2.3 1.04 1.04Potato Potatoes/Colosia 500 g 2.3 1.58 1.59Ruai/carp Fish 500 g Duplicate 2.1 1.36 1.32Small fresh fish Fish 500 g Duplicate 2.1 1.15 1.11White sugar Sugar 100 g 1.9 1.32 1.26Dhal - Musur Lentil (Masuru) 250 g 1.6 0.99 1.03
PPS = poverty-specific price survey; HES = household expenditure survey; UOM = unit of measure; kg = kilogram; g = gram; ml = milliliter.
value prices but they tend to exhibit a strong linear relationship. As already mentioned, the median unit values tend to be generally below the poverty prices. A point to note here is that what is required is a PPP that adequately represents prices paid by those households that are located around the poverty line. If price tends to increase with income, it may be that unit values for households around the poverty line may even be closer to the prices collected through the poverty-specific price surveys.
Suitability of Poverty-Specific Price Survey Data to Represent Prices Paid by the Poor
The analysis presented here provides useful insights regarding the suitability of the price data from the poverty-specific price surveys for representing the prices paid by the poor. The preliminary analysis gives encouraging signs. However, the results have
to be interpreted with caution. In attempting a comparison between poverty-specific price survey data and HES unit values, a number of adjustments had to be made. Further, the price data for poverty-specific price surveys were collected in late 2006 and adjusted backward using CPI data usually available at an aggregated level.
Notwithstanding these adjustments, the two sets of prices show encouraging consistency reflected in strong correlations, especially when the correlations are computed using unit values for products that may be considered as good quality matches. In general, the poverty-specific price survey data tend to be higher than the median unit values computed. For a number of important items like rice and cooking oil, the differences between unit values and poverty-specific price survey data are only marginal.

Chapter 6
55Research Study on Poverty-Specific Purchasing Power Parities for Selected Countries in Asia and the Pacific
Table 20. Pairwise Correlation: All Matched Items
Poverty Survey
Household Expenditure Survey
Median Mean Observations
Bangladesh 0.881 0.885 52India (National*) 0.896 0.891 75India (Urban/Rural**) 0.901 0.896 75India (National*) - 2005 0.895 0.898 75India (Urban/Rural**) - 2005 0.900 0.902 75Indonesia 0.788 0.779 33Nepal 0.964 0.970 21
* Poor households were defined on the bases of official/national poverty lines (upper poverty lines for Bangladesh).** Average computed using household sample weights.
Table 21. Pairwise Correlation:Only “Good” Matched Items
Poverty Survey
Household Expenditure Survey
Median Mean Observations
Bangladesh 0.948 0.904 38India (Nationala) 0.985 0.984 51India (Urban/Ruralb) 0.988 0.987 51India (Nationala) - 2005 0.983 0.988 51India (Urban/Ruralb) - 2005 0.986 0.990 51Indonesia 0.788 0.779 33Nepal 0.964 0.970 21a and b: See Step 3 in the subsection on comparison of unit values and poverty-specific price survey data.Note: “Good” matched items include correct matches, duplicates, and those whose conversions were ignored due to the credibility of the household expenditure survey.
Table 22. Spearman Correlation: All Matched Items
Poverty Survey
Household Expenditure Survey
Median Mean Observations
Bangladesh 0.889 0.903 52India (National*) 0.958 0.957 75India (Urban/Rural**) 0.958 0.958 75India (National*) - 2005 0.959 0.957 75India (Urban/Rural**) - 2005 0.959 0.957 75Indonesia 0.756 0.761 33Nepal 0.962 0.962 21
* Poor households were defined on the bases of official/national poverty lines (upper poverty lines for Bangladesh).** Average computed using household sample weights.
Table 23. Spearman Correlation: Only “Good” Matched Items
Poverty Survey
Household Expenditure Survey
Median Mean Observations
Bangladesh 0.953 0.912 38India (Nationala) 0.989 0.988 51India (Urban/Ruralb) 0.990 0.989 51India (Nationala) - 2005 0.989 0.988 51India (Urban/Ruralb) - 2005 0.990 0.989 51Indonesia 0.756 0.761 33Nepal 0.962 0.962 21a and b: See Step 3 in the subsection on comparison of unit values and poverty-specific price survey data.Note: “Good” matched items include correct matches, duplicates, and those whose conversions are ignored due to the credibility of the household expenditure survey.

Chapter 6
2005 International Comparison Program in Asia and the Pacific 56
Conclusion
At the beginning of this chapter, a number of questions that cast doubt on the feasibility of conducting price surveys to capture prices paid by the poor were canvassed. The main purpose of this chapter is to report the results from surveys conducted specifically for the purpose of compiling poverty PPPs. This chapter described the processes followed in preparing the product lists and the surveys designed to capture the prices paid by the poor. The analysis using the Quaranta tables for data validation reveals that the price data collected as part of the poverty-specific price surveys are of high quality. This is partly due to the fact that the product list is small and the participating countries appeared to have benefited from their prior ICP price survey experience. The preliminary analysis juxtaposing the poverty-specific price survey data and prices from the 2005 ICP Asia Pacific price surveys shows the plausibility of the
prices. Contrasting the poverty-specific price survey data with unit values for commodities that could be matched between HES and poverty-specific price surveys also reveals a high degree of consistency. On the basis of the preliminary analysis, it appears that it is possible to design and conduct surveys especially for the purpose of collecting prices of goods and services that are typically purchased by the poor from the most commonly used outlets. The analysis conducted here suggests the need for further investigation of the data from those two important sources.
The next step, which will be considered in Chapter 7, is to examine if prices from the poverty-specific price surveys are likely to make a big difference to the poverty PPPs compared with the PPPs derived, as suggested by the PAG, using 2005 ICP Asia Pacific basic heading PPPs with expenditure weights for the poor.

Chapter 7
Sensitivity Analysis of Poverty PPPs Estimated Using Various Sources of Price
Data and Aggregation MethodsIntroduction
The last six chapters focused on the development of a conceptual framework and on the methodology and techniques needed to empirically estimate poverty PPPs. As explained in Chapters 4 and 5, several alternatives are available at each stage of the implementation of the basic methodology. This means that a number of alternative estimates of poverty PPPs can be derived through either simple modifications to the methodology or major variations in the type of data used in compiling them. The approach historically in use for this purpose was to employ PPP for the consumption aggregate from the 2005 ICP Asia Pacific to convert the IPL. Although simple, this approach has been criticized since (i) the PPPs from the 2005 ICP Asia Pacific are generally based on price data items that may be of little relevance to the poor; and (ii) the expenditure weights used in computing the PPPs usually represent the average patterns of the whole population and not those of the poor.
The methodology endorsed by the PAG represents an important step in enhancing the relevance of PPPs used for measuring poverty. Implementing the methodology is complex even though it appears to be a simple step to improve the use of consumption PPPs. For instance, there are several steps where choices have to be made in compiling the expenditure share weights for households on the poverty line and in aggregating the price and expenditure share weights. An additional source of
price data, the poverty-specific price surveys, adds another dimension to the options available.
These new sources of prices, and methods available for compiling poverty PPPs represent an exciting array of possibilities. They also offer fertile new ground for research that can result in PPPs that are better suited for measuring poverty. The main objective of this chapter is to present an array of PPP estimates that can be derived from the use of alternative sources of price data, and examine the sensitivity or robustness of the PPP estimates in different scenarios.
Schematic Representation of Approaches and Methods for Compiling PPPs
Chapters 5 and 6 discuss feasible approaches in compiling poverty PPPs. The approaches are presented here in a schematic diagram (Figure 3) outlining the methodology used and indicating alternatives considered at each stage of this poverty PPP study.
The first part of the schematic diagram examines the major components of the methodology and identifies the types of choices confronting a researcher. The second part illustrates the various pathways involved in implementing the iterative scheme.

Chapter 7
2005 International Comparison Program in Asia and the Pacific 58
New PPPs
Poverty Line in Local Currency Units
Initial Set of PPPsfrom ICP
National Poverty$1/day
Poverty Line
ICPBasic
HeadingPPPs
PovertyPrices withNA Weights
Methods ofAggregation above BH
EKS WCPD GK
HHs within 0.5Bandwidth
HHs within aBandwidth
HHs belowPoverty Line
DemocraticWeights
PlutocraticWeights
ComputeExpenditure
Weightsfor Poor
BH PPPs
CPD method
ICP Price Surveys Poverty Survey Prices Unit Values from HES
Source of Price Data
Figure 3. A Schematic Diagram for the Computation of Poverty Puchasing Power Parities
PPP = purchasing power parity; CPD = country-product-dummy; EKS = Eltetö-Kölves-Szulc; GK = Geary-Khamis; HH = household; HES = household expenditure survey; ICP = International Comparison Program; NA = national accounts; WCPD = weighted country-product-dummy.

Chapter 7
59Research Study on Poverty-Specific Purchasing Power Parities for Selected Countries in Asia and the Pacific
Major Components of the Computational Scheme
Sources of Price Data. Three major sources of price data are identified in the report.
(i) The first source is the 2005 ICP Asia Pacific. Extensive price surveys were conducted in all the participating countries to collect prices for an exhaustive product list. In this source, 656 items were in the product list for the consumption aggregate, which is the most relevant aggregate for computing the poverty PPP. The participating countries provided the estimated average national prices for all items priced in their countries. Chapter 3 of this report and Part 3 of ADB (2007b) give further details of the methods used in collecting prices.
(ii) The second source of price data is the poverty-specific price surveys, conducted specifically for the purpose of collecting prices of goods and services that were considered representative of the purchases of the poor, and coming from outlets used mainly by the poor. Details of poverty-specific price surveys conducted as part of the poverty PPP study are in Chapter 6. This type of survey was designed and conducted for the first time as part of the 2005 ICP Asia Pacific.
(iii) Another source of price data is the HES conducted regularly in the participating countries. In addition to data on household expenditure, surveys in some countries are designed in a way that makes it feasible to compute unit values for consumption items listed in the HES. To compute unit values, it is necessary to have information on expenditure for a commodity as well as total quantity of the commodity. Unit values are useful because they can be measured for each household and, therefore, can be used in studying unit values paid by poor households. However, unit values have limitations. The practical issues encountered in measuring and comparing unit values with prices collected through poverty-specific price surveys are discussed in detail in Chapter 6.
In the current poverty PPP study, only the first two sources of data are explored. The use of unit values must be explored in future rounds of the ICP.
Irrespective of which source of price data is used, the ultimate aim is to compile a set of PPPs at the basic heading level.
Aggregation Methods. The CPD is the recommended method for computing PPPs at the basic heading level. For purposes of aggregating basic heading PPPs to yield poverty PPPs, the three most commonly used methods are the EKS, weighted CPD, and GK methods, as described in Chapter 5.
Compilation of Expenditure Share Weights. Expenditure share weights together with basic heading PPPs provide all the information necessary to implement any one of the selected aggregation methods. Six steps are involved in compiling the expenditure share weights for the poor. “Poor households” may refer to households around the poverty line—this is the most relevant concept if one wishes to compile PPPs for converting poverty lines. Alternatively, poor households may refer to all households below the poverty line. The steps described below provide an alternative exposition of the discussion in Chapter 5.
Step 1. Select the poverty line.
The first step in the process is to select a poverty line for the purpose of identifying the appropriate households to use in compiling expenditure share weights. Results would be sensitive to the choice of the poverty line. In this study, two alternative poverty lines were considered.
The first was the poverty line of $1/day used in 1993 (which is actually $1.08) updated to 2005 using the CPI in the United States. The main rationale was that if $1.08 was considered an appropriate IPL in 1993 for purposes of creating international awareness, then updating it using the US CPI would serve to maintain the same level of awareness about the purchasing power of the poverty line in the developed world.
The second poverty line used was the poverty line of Indonesia, expressed in Indonesian rupiah. Indonesia is a large country with reliable HES. In addition, the country conducts poverty studies on a regular basis. In the process of deciding on the
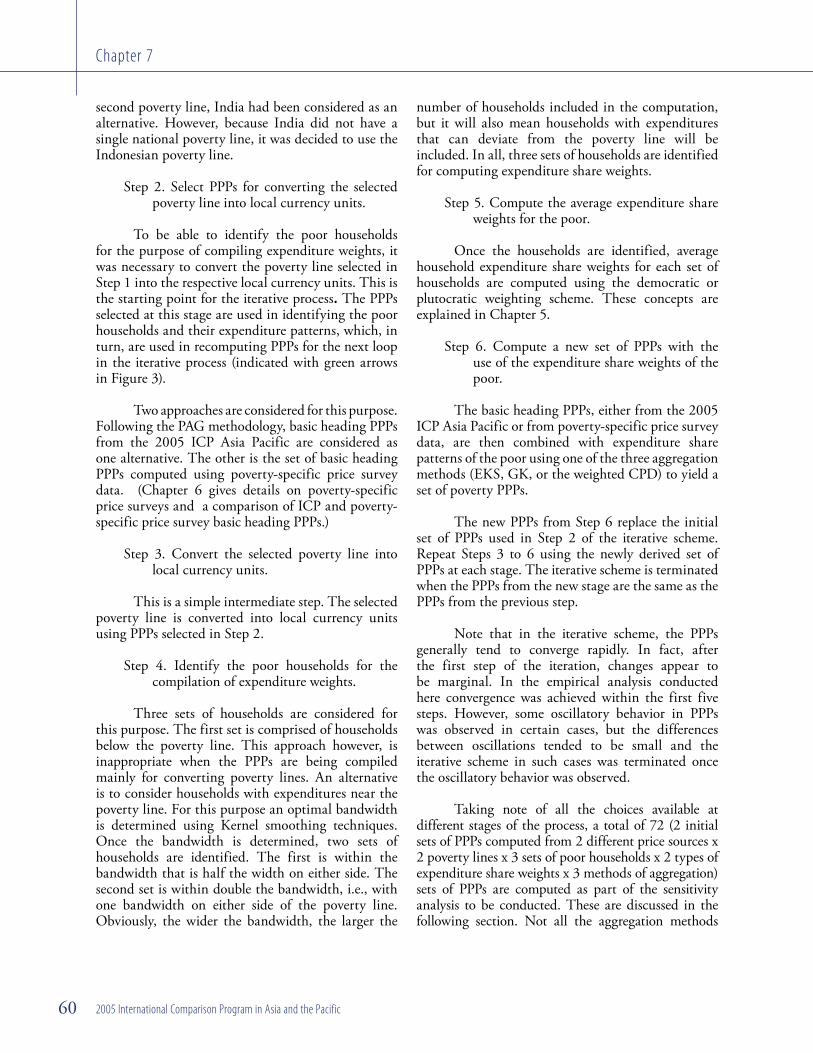
Chapter 7
2005 International Comparison Program in Asia and the Pacific 60
second poverty line, India had been considered as an alternative. However, because India did not have a single national poverty line, it was decided to use the Indonesian poverty line.
Step 2. Select PPPs for converting the selected poverty line into local currency units.
To be able to identify the poor households for the purpose of compiling expenditure weights, it was necessary to convert the poverty line selected in Step 1 into the respective local currency units. This is the starting point for the iterative process. The PPPs selected at this stage are used in identifying the poor households and their expenditure patterns, which, in turn, are used in recomputing PPPs for the next loop in the iterative process (indicated with green arrows in Figure 3).
Two approaches are considered for this purpose. Following the PAG methodology, basic heading PPPs from the 2005 ICP Asia Pacific are considered as one alternative. The other is the set of basic heading PPPs computed using poverty-specific price survey data. (Chapter 6 gives details on poverty-specific price surveys and a comparison of ICP and poverty-specific price survey basic heading PPPs.)
Step 3. Convert the selected poverty line into local currency units.
This is a simple intermediate step. The selected poverty line is converted into local currency units using PPPs selected in Step 2.
Step 4. Identify the poor households for the compilation of expenditure weights.
Three sets of households are considered for this purpose. The first set is comprised of households below the poverty line. This approach however, is inappropriate when the PPPs are being compiled mainly for converting poverty lines. An alternative is to consider households with expenditures near the poverty line. For this purpose an optimal bandwidth is determined using Kernel smoothing techniques. Once the bandwidth is determined, two sets of households are identified. The first is within the bandwidth that is half the width on either side. The second set is within double the bandwidth, i.e., with one bandwidth on either side of the poverty line. Obviously, the wider the bandwidth, the larger the
number of households included in the computation, but it will also mean households with expenditures that can deviate from the poverty line will be included. In all, three sets of households are identified for computing expenditure share weights.
Step 5. Compute the average expenditure share weights for the poor.
Once the households are identified, average household expenditure share weights for each set of households are computed using the democratic or plutocratic weighting scheme. These concepts are explained in Chapter 5.
Step 6. Compute a new set of PPPs with the use of the expenditure share weights of the poor.
The basic heading PPPs, either from the 2005 ICP Asia Pacific or from poverty-specific price survey data, are then combined with expenditure share patterns of the poor using one of the three aggregation methods (EKS, GK, or the weighted CPD) to yield a set of poverty PPPs.
The new PPPs from Step 6 replace the initial set of PPPs used in Step 2 of the iterative scheme. Repeat Steps 3 to 6 using the newly derived set of PPPs at each stage. The iterative scheme is terminated when the PPPs from the new stage are the same as the PPPs from the previous step.
Note that in the iterative scheme, the PPPs generally tend to converge rapidly. In fact, after the first step of the iteration, changes appear to be marginal. In the empirical analysis conducted here convergence was achieved within the first five steps. However, some oscillatory behavior in PPPs was observed in certain cases, but the differences between oscillations tended to be small and the iterative scheme in such cases was terminated once the oscillatory behavior was observed.
Taking note of all the choices available at different stages of the process, a total of 72 (2 initial sets of PPPs computed from 2 different price sources x 2 poverty lines x 3 sets of poor households x 2 types of expenditure share weights x 3 methods of aggregation) sets of PPPs are computed as part of the sensitivity analysis to be conducted. These are discussed in the following section. Not all the aggregation methods

Chapter 7
61Research Study on Poverty-Specific Purchasing Power Parities for Selected Countries in Asia and the Pacific
were used in the computations for all the choices made at the intermediate stages. Therefore, the actual sets of PPPs presented below are the maximum of 72.
The remaining part of this chapter discusses the sensitivity of the PPP estimates to the different choices made at different stages.
PPPs Computed Using the PAG Methodology
The PAG methodology recommends that the consumption PPPs from the ICP be selected as the main source of prices. These basic heading PPPs were combined with appropriate expenditure share weights for the poor, and the EKS method was used for aggregating basic heading PPPs.
In implementing the PAG methodology, however, it is necessary to make selections at three different stages. These choices are required for the purpose of compiling expenditure share weights for the poor.
(i) First, it is necessary to start with a poverty line. Two options are considered. The first is $1.08/day IPL (in 1993) after an adjustment is made for temporal movements. The resulting poverty line is $1.46, which, after being converted into Malaysian ringgit using the latest ICP Global and ICP Asia Pacific results, becomes RM3.08/day. The second poverty line is the Indonesian poverty line, which is rupiah (Rp) 1,549,296/annum.33 (The choice would obviously influence the result. In particular, it would keep the population of the poor fixed for Indonesia in the international comparisons. This issue is considered further in the last section.)
(ii) Second, it is necessary to decide which segment of the poor population to consider for the purpose of computing average budget shares. Here three sets of households were experimented with: (i) all households below the poverty line; (ii) all households within “h” from the poverty line, i.e., all households within ± h around the poverty line; and (iii) all households within ±0.5h around the poverty line. Results from the
33 This poverty line was provided by the Indonesian representative from Badan Pusat Statistik.
three sets of households are computed and presented.
(iii) Finally, once the set of households is identified, then the average budget shares need to be computed. The choice is to use either democratic or plutocratic weights. The results presented are for average shares based on democratic weights. The choice implies that all the households in the set are given equal weight irrespective of their total expenditure. This is particularly useful when households around the poverty line are considered.
Table 24 presents the PPPs computed using the PAG-recommended methodology.
Columns (1) to (5) present the PPPs for the currencies of the 16 countries participating in the study. All the PPPs are expressed relative to the reference currency computed using the EKS aggregation method. The PPPs here satisfy the transitivity property. Therefore, the relativities between different currencies will remain unchanged when the reference currency is changed. Column (1) presents consumption taken from ADB (2007b).34 PPPs based on the US$ poverty line and the Indonesian poverty line are presented in columns (2) to (5). Three sets of the poor, i.e., all those under the poverty line; those within ± h of the poverty line; and those within ± 0.5 h of the poverty line are presented in columns (2) to (4). For the Indonesian poverty line, only results for the poor within ± h of the poverty line are presented.
As shown in columns (10) to (12), the differences between columns (2) to (4) are small, generally less than 1% within each other. Note that PPPs in column (4), based on expenditure shares of households within ± 0.5h of the poverty line, are higher than those presented in columns (2) and (3), although the differences remain generally below 1%. This pattern does not seem to be present in other scenarios considered here. Further, some computational problems in terms of nonconvergence were encountered when households within ± 0.5 h of the poverty line were considered. The nonconvergence was not considered serious as it reflected a tendency to vary within a small band (usually around the
34 Unless otherwise stated, consumption here means household final consumption expenditure.

Chapter 7
2005 International Comparison Program in Asia and the Pacific 62
fourth significant digit). For example, after several iterations, nonconvergence varied between 11.999 and 12.002 in the case of Bangladesh. In such cases it was decided to take the average of the values over the last four iterations. The results indicate that the choice of the interval around the poverty line may not make a significant difference in PPPs.35
In the discussion that follows and in the tables, only PPPs based on expenditure share weights for the poor households within h from either side of the poverty line are considered.
Therefore, columns (3) and (5) represent the PPPs generated using the PAG methodology
35 To be able to make comments about the statistical significance of the differences, it is necessary to estimate standard errors associated with the PPPs presented here. Deaton (2007) and O’Donnell and Rao (2007) considered this issue, but Deaton’s approach for the computation of standard errors appears to be more complete. However, these methods have not been developed enough to make their application suitable.
but using two different poverty lines. One poverty line is equivalent to RM3.08 (equal to $1.46) and the other is Rp1,549,296. The difference between columns (3) and (5) is again fairly small, indicating the robustness of the PPPs to variations in the choice of the underlying poverty line.
The purpose of Table 24 is to show the difference between the ICP consumption PPPs, which were used for converting the IPL since 1990, and the PPPs based on the PAG-recommended methodology. If attention is focused on the differences between columns (1) and (3) shown in column (7), and between columns (1) and (5) shown in column (9), it appears that applying the PAG methodology generates PPPs that are significantly different from the ICP consumption PPPs. The direction of the difference is not uniform across the 15 countries in the table. The largest declines in PPPs under the PAG methodology compared with the ICP consumption PPPs shown in column (7) are evident in the case of Fiji Islands (10.14%), Maldives (8.82%), Thailand (5.88%), and
Table 24. Poverty PPPs: PAG Methodology, 2005 (local currency units per Malaysian ringgit)
Country
ICP Consumption PPP
Poverty PPPs
US$ Poverty LineIndonesia Poverty
Line
< Poverty Line±h of the Poverty
Line±0.5h of the Poverty Line
±h of the Poverty Line
(1) (2) (3) (4) (5)
Malaysia 1.000 1.000 1.000 1.000 1.000 Bangladesh 12.06 11.88 11.95 12.00 11.85 Bhutan 8.733 8.474 8.641 8.694 8.494 Cambodia 764.0 780.2 795.6 798.7 781.4 Fiji Islands 0.732 0.650 0.658 0.657 0.647 India 7.379 7.534 7.440 7.465 7.497 Indonesia 1,983 1,990 2,002 2,008 1,987 Lao People’s Democratic Republic 1,770 1,899 1,874 1,884 1,891 Maldives 4.606 4.150 4.200 4.225 4.145 Mongolia 247.1 239.9 241.2 241.9 238.7 Nepal 12.52 12.07 12.22 12.24 12.00 Pakistan 9.796 9.782 9.679 9.703 9.744 Philippines 11.44 11.02 11.14 11.18 10.98 Sri Lanka 18.94 17.87 17.96 18.08 17.83 Thailand 8.261 7.773 7.775 7.803 7.816 Viet Nam 2,800 2,756 2,794 2,803 2,752
PPP = purchasing power parity; ICP = International Comparison Program; PAG = Poverty Advisory Group.
Table 24. Poverty PPPs: PAG Methodology, 2005 (local currency units per Malaysian ringgit) (continued)
Percent Difference between Poverty PPPs and the ICP Consumption PPPs
Percent Difference among Poverty PPPs based on the US$ Poverty LineUS$ Poverty Line
Indonesia Poverty Line
< Poverty Line±h of the Poverty
Line±0.5h of the Poverty Line
±h of the Poverty Line
< Poverty Line vs. Band of ±h
< Poverty Line vs. Band of ±0.5h
Band of ±h vs. Band of ±0.5h
(6) (7) (8) (9) (10) (11) (12)
(2) / (1) (3) / (1) (4) / (1) (5) / (1) (3) / (2) (4) / (2) (4) / (3) (1.50) (0.88) (0.49) (1.77) 0.63 1.03 0.40 (2.96) (1.05) (0.46) (2.74) 1.97 2.59 0.61
2.12 4.14 4.54 2.28 1.98 2.37 0.38 (11.26) (10.14) (10.28) (11.67) 1.26 1.10 (0.15)
2.10 0.82 1.16 1.59 (1.25) (0.91) 0.34 0.36 0.94 1.25 0.21 0.57 0.89 0.31 7.31 5.90 6.46 6.84 (1.31) (0.79) 0.52
(9.90) (8.82) (8.25) (10.00) 1.20 1.82 0.62 (2.93) (2.40) (2.11) (3.41) 0.54 0.85 0.30 (3.61) (2.39) (2.23) (4.18) 1.27 1.43 0.16 (0.14) (1.20) (0.95) (0.54) (1.06) (0.81) 0.25 (3.66) (2.61) (2.26) (4.02) 1.09 1.45 0.35 (5.63) (5.16) (4.54) (5.86) 0.49 1.15 0.66 (5.90) (5.88) (5.54) (5.39) 0.03 0.38 0.35 (1.57) (0.22) 0.11 (1.71) 1.37 1.71 0.33

Chapter 7
63Research Study on Poverty-Specific Purchasing Power Parities for Selected Countries in Asia and the Pacific
Sri Lanka (5.16%). The biggest increases are recorded for Lao PDR (5.90%) and Cambodia (4.14%). The change represents a small increase in PPPs under the new methodology.
The data from Table 24 indicate that the new methodology brings about significant changes in PPPs used for conversion. The PPPs show a certain degree of robustness to different approaches to identifying the poor households for the purpose of computing expenditure share weights as well as to the choice of the underlying poverty line.
PPPs Computed with the Use of Poverty-Specific Price Survey Data and Expenditure Weights of the Poor
This section presents PPPs from the poverty-specific price survey data as an alternative to the general ICP price data. Thus the results presented deviate one step further from the PAG-recommended
methodology and two steps away from the conventional use of consumption PPPs from the ICP.
Table 25 presents PPPs where the price data come from the poverty-specific price surveys. Otherwise all the other details are exactly the same as those for the PAG methodology discussed in the preceding section. Some salient features of Table 25 are presented here.
The poverty PPPs are robust to the set of households identified as poor and to the use of the IPL and the Indonesian poverty line expressed in Malaysian ringgit. This is confirmed by PPPs in columns (3) and (5) for the two poverty lines. Differences between the estimates are less than 1 percentage point and within the realms of statistical errors associated with these PPPs. Similarly, a comparison of PPPs in columns (2) to (4), respectively, based on all households below the poverty line; households within an interval h from the poverty line; and households within an interval of 0.5 h from the poverty line, shows that all are close to each other. However, PPPs in column (4) are
Table 24. Poverty PPPs: PAG Methodology, 2005 (local currency units per Malaysian ringgit)
Country
ICP Consumption PPP
Poverty PPPs
US$ Poverty LineIndonesia Poverty
Line
< Poverty Line±h of the Poverty
Line±0.5h of the Poverty Line
±h of the Poverty Line
(1) (2) (3) (4) (5)
Malaysia 1.000 1.000 1.000 1.000 1.000 Bangladesh 12.06 11.88 11.95 12.00 11.85 Bhutan 8.733 8.474 8.641 8.694 8.494 Cambodia 764.0 780.2 795.6 798.7 781.4 Fiji Islands 0.732 0.650 0.658 0.657 0.647 India 7.379 7.534 7.440 7.465 7.497 Indonesia 1,983 1,990 2,002 2,008 1,987 Lao People’s Democratic Republic 1,770 1,899 1,874 1,884 1,891 Maldives 4.606 4.150 4.200 4.225 4.145 Mongolia 247.1 239.9 241.2 241.9 238.7 Nepal 12.52 12.07 12.22 12.24 12.00 Pakistan 9.796 9.782 9.679 9.703 9.744 Philippines 11.44 11.02 11.14 11.18 10.98 Sri Lanka 18.94 17.87 17.96 18.08 17.83 Thailand 8.261 7.773 7.775 7.803 7.816 Viet Nam 2,800 2,756 2,794 2,803 2,752
PPP = purchasing power parity; ICP = International Comparison Program; PAG = Poverty Advisory Group.
Table 24. Poverty PPPs: PAG Methodology, 2005 (local currency units per Malaysian ringgit) (continued)
Percent Difference between Poverty PPPs and the ICP Consumption PPPs
Percent Difference among Poverty PPPs based on the US$ Poverty LineUS$ Poverty Line
Indonesia Poverty Line
< Poverty Line±h of the Poverty
Line±0.5h of the Poverty Line
±h of the Poverty Line
< Poverty Line vs. Band of ±h
< Poverty Line vs. Band of ±0.5h
Band of ±h vs. Band of ±0.5h
(6) (7) (8) (9) (10) (11) (12)
(2) / (1) (3) / (1) (4) / (1) (5) / (1) (3) / (2) (4) / (2) (4) / (3) (1.50) (0.88) (0.49) (1.77) 0.63 1.03 0.40 (2.96) (1.05) (0.46) (2.74) 1.97 2.59 0.61
2.12 4.14 4.54 2.28 1.98 2.37 0.38 (11.26) (10.14) (10.28) (11.67) 1.26 1.10 (0.15)
2.10 0.82 1.16 1.59 (1.25) (0.91) 0.34 0.36 0.94 1.25 0.21 0.57 0.89 0.31 7.31 5.90 6.46 6.84 (1.31) (0.79) 0.52
(9.90) (8.82) (8.25) (10.00) 1.20 1.82 0.62 (2.93) (2.40) (2.11) (3.41) 0.54 0.85 0.30 (3.61) (2.39) (2.23) (4.18) 1.27 1.43 0.16 (0.14) (1.20) (0.95) (0.54) (1.06) (0.81) 0.25 (3.66) (2.61) (2.26) (4.02) 1.09 1.45 0.35 (5.63) (5.16) (4.54) (5.86) 0.49 1.15 0.66 (5.90) (5.88) (5.54) (5.39) 0.03 0.38 0.35 (1.57) (0.22) 0.11 (1.71) 1.37 1.71 0.33

Chapter 7
2005 International Comparison Program in Asia and the Pacific 64
lower than those in column (3) for all countries. The differences, however, are small.
The main feature of Table 25 is the difference between the PPPs conventionally used (consumption PPPs from the ICP) and PPPs based on poverty-specific price survey data aggregated using expenditure weights of the poor. Column (7) shows percentage differences between columns (1) and (3). Interestingly, the differences between the columns are significant, whether they are positive or negative, except for the Maldives. In most cases, the poverty PPPs based on poverty price survey data are significantly lower than the consumption PPPs. The margin is biggest for Indonesia (19.63%) followed by Viet Nam (15.99%), then Bangladesh and Sri Lanka (both at 15.69%).
The only countries that show an increase in PPPs are the Philippines (9.31%) followed by Lao PDR (7.69%), Cambodia (5.74%), Mongolia (3.07%),
and Maldives (0.30%). On the other hand, the PPP for India decreased by 12.73%, a significant decrease in the PPP value that can have a significant influence on the estimates of poverty incidence.
In the discussion of the likely effects of poverty-specific price survey data, it was mentioned that there was no a priori expectation as to which direction the final PPPs may move from the conventional consumption PPPs. Where the PPPs declined, the indication is that the poverty prices in those countries are lower relative to the prices paid by the poor in Malaysia. Similarly, in countries like Cambodia, the prices paid by the poor, relative to the rest of the population, are higher than the prices paid by the poor relative to the rest in Malaysia. This phenomenon is likely to occur in low-income countries where the prices paid by the poor and the general population are similar as the population in general is poor. This explanation appears to be plausible as the increases are mainly evident in low-income countries like
Table 25. Poverty PPPs: Poverty-Specific Price Data, 2005(local currency units per Malaysian ringgit)
Country
ICP Consumption PPP
Poverty PPPs
US$ Poverty Line Indonesia Poverty Line
< Poverty Line±h of the Poverty
Line±0.5h of the Poverty Line ±h of the Poverty Line
(1) (2) (3) (4) (5)
Malaysia 1.000 1.000 1.000 1.000 1.000 Bangladesh 12.06 10.14 10.17 10.18 10.19 Bhutan 8.733 8.169 8.244 8.261 8.204 Cambodia 764.0 784.6 807.9 811.9 800.5 Fiji Islands 0.732 0.649 0.671 0.672 0.667 India 7.379 6.441 6.440 6.469 6.479 Indonesia 1,983 1,569 1,594 1,599 1,588 Lao People’s Democratic Republic 1,770 1,934 1,906 1,914 1,920 Maldives 4.606 4.471 4.619 4.649 4.582 Mongolia 247.1 255.9 254.7 255.2 256.0 Nepal 12.52 11.88 11.81 11.85 11.83 Pakistan 9.796 9.063 9.033 9.046 9.064 Philippines 11.44 12.55 12.50 12.53 12.54 Sri Lanka 18.94 15.96 15.97 16.04 16.01 Thailand 8.261 7.197 7.176 7.182 7.207 Viet Nam 2,800 2,341 2,352 2,360 2,356
PPP = purchasing power parity; ICP = International Comparison Program.
Table 25. Poverty PPPs: Poverty-Specific Price Data, 2005 (local currency units per Malaysian ringgit) (continued)
Percent Difference between Poverty PPPs and the ICP Consumption PPPs Percent Difference among Poverty PPPs based on the US$ Poverty LineUS$ Poverty Line Indonesia Povety Line
< Poverty Line
±h of the Poverty Line
±0.5h of the Poverty Line ±h of the Poverty Line
< Poverty Line vs. Band of ±h
< Poverty Line vs. Band of ±0.5h
Band of ±h vs. Band of ±0.5h
(6) (7) (8) (9) (10) (11) (12)
(1) / (2) (1) / (3) (1) / (4) (1) / (5) (2) / (3) (2) / (4) (3) ./ (4) (15.89) (15.69) (15.55) (15.51) 0.24 0.41 0.17
(6.46) (5.60) (5.41) (6.06) 0.92 1.12 0.20 2.69 5.74 6.27 4.77 2.97 3.49 0.50
(11.39) (8.32) (8.17) (8.90) 3.46 3.62 0.16 (12.72) (12.73) (12.33) (12.20) (0.01) 0.44 0.46 (20.86) (19.63) (19.39) (19.93) 1.55 1.85 0.30
9.30 7.69 8.16 8.49 (1.47) (1.04) 0.44 (2.92) 0.30 0.93 (0.52) 3.32 3.97 0.63
3.55 3.07 3.27 3.60 (0.46) (0.27) 0.19 (5.11) (5.68) (5.36) (5.46) (0.60) (0.26) 0.35 (7.49) (7.80) (7.66) (7.48) (0.33) (0.19) 0.15
9.76 9.31 9.57 9.67 (0.41) (0.17) 0.24 (15.75) (15.69) (15.32) (15.49) 0.07 0.50 0.43 (12.87) (13.13) (13.06) (12.75) (0.29) (0.21) 0.08 (16.39) (15.99) (15.71) (15.85) 0.48 0.80 0.33

Chapter 7
65Research Study on Poverty-Specific Purchasing Power Parities for Selected Countries in Asia and the Pacific
methodology is modified and poverty-specific price survey data are used in place of ICP price data? If the difference is negligible, then the main focus of future work would be in the refinements associated with implementing the PAG methodology. However, if the differences turn out to be significant, then it would be necessary to focus attention on improving the poverty-specific price survey methodology and framework further. Table 26 provides all the necessary information to examine this important question.
Column (1) presents the consumption PPPs from the 2005 ICP Asia Pacific that would have been used if the standard practice of the last two decades were continued. These are the PPPs that the World Bank would have used in converting the IPL. There are two other sets of PPPs that incrementally differ from the consumption PPPs from the ICP. Columns (2) and (4) show new sets of PPPs derived using the methodology recommended by the PAG for this round. The only difference is that column (2) is based on the $1/day IPL and column (4) is based
Cambodia, Lao PDR, Mongolia, and in, what may be an exception, Philippines.
Data from Table 25 point to the conclusion that the use of poverty-specific price survey data has resulted in significant changes to PPPs and the direction of change is related to the income level of the countries involved. This conclusion, in turn, implies that application of the new PPPs based on poverty-specific price survey data is likely to alter the estimates of poverty incidence. Countries like Cambodia, Lao PDR, and Mongolia will show a significantly higher level of poverty incidence.
Comparison of PPPs from the PAG Methodology and Poverty-Specific Price Survey Data
The next question to explore is, how much difference does it make to PPPs if the PAG
Table 25. Poverty PPPs: Poverty-Specific Price Data, 2005(local currency units per Malaysian ringgit)
Country
ICP Consumption PPP
Poverty PPPs
US$ Poverty Line Indonesia Poverty Line
< Poverty Line±h of the Poverty
Line±0.5h of the Poverty Line ±h of the Poverty Line
(1) (2) (3) (4) (5)
Malaysia 1.000 1.000 1.000 1.000 1.000 Bangladesh 12.06 10.14 10.17 10.18 10.19 Bhutan 8.733 8.169 8.244 8.261 8.204 Cambodia 764.0 784.6 807.9 811.9 800.5 Fiji Islands 0.732 0.649 0.671 0.672 0.667 India 7.379 6.441 6.440 6.469 6.479 Indonesia 1,983 1,569 1,594 1,599 1,588 Lao People’s Democratic Republic 1,770 1,934 1,906 1,914 1,920 Maldives 4.606 4.471 4.619 4.649 4.582 Mongolia 247.1 255.9 254.7 255.2 256.0 Nepal 12.52 11.88 11.81 11.85 11.83 Pakistan 9.796 9.063 9.033 9.046 9.064 Philippines 11.44 12.55 12.50 12.53 12.54 Sri Lanka 18.94 15.96 15.97 16.04 16.01 Thailand 8.261 7.197 7.176 7.182 7.207 Viet Nam 2,800 2,341 2,352 2,360 2,356
PPP = purchasing power parity; ICP = International Comparison Program.
Table 25. Poverty PPPs: Poverty-Specific Price Data, 2005 (local currency units per Malaysian ringgit) (continued)
Percent Difference between Poverty PPPs and the ICP Consumption PPPs Percent Difference among Poverty PPPs based on the US$ Poverty LineUS$ Poverty Line Indonesia Povety Line
< Poverty Line
±h of the Poverty Line
±0.5h of the Poverty Line ±h of the Poverty Line
< Poverty Line vs. Band of ±h
< Poverty Line vs. Band of ±0.5h
Band of ±h vs. Band of ±0.5h
(6) (7) (8) (9) (10) (11) (12)
(1) / (2) (1) / (3) (1) / (4) (1) / (5) (2) / (3) (2) / (4) (3) ./ (4) (15.89) (15.69) (15.55) (15.51) 0.24 0.41 0.17
(6.46) (5.60) (5.41) (6.06) 0.92 1.12 0.20 2.69 5.74 6.27 4.77 2.97 3.49 0.50
(11.39) (8.32) (8.17) (8.90) 3.46 3.62 0.16 (12.72) (12.73) (12.33) (12.20) (0.01) 0.44 0.46 (20.86) (19.63) (19.39) (19.93) 1.55 1.85 0.30
9.30 7.69 8.16 8.49 (1.47) (1.04) 0.44 (2.92) 0.30 0.93 (0.52) 3.32 3.97 0.63
3.55 3.07 3.27 3.60 (0.46) (0.27) 0.19 (5.11) (5.68) (5.36) (5.46) (0.60) (0.26) 0.35 (7.49) (7.80) (7.66) (7.48) (0.33) (0.19) 0.15
9.76 9.31 9.57 9.67 (0.41) (0.17) 0.24 (15.75) (15.69) (15.32) (15.49) 0.07 0.50 0.43 (12.87) (13.13) (13.06) (12.75) (0.29) (0.21) 0.08 (16.39) (15.99) (15.71) (15.85) 0.48 0.80 0.33

Chapter 7
2005 International Comparison Program in Asia and the Pacific 66
on the poverty line used in Indonesia. Note that differences in PPPs in columns (2) and (4), shown in column (10), are small and insignificant, indicating a certain degree of robustness to the specification of the poverty line.
The rest of the discussion in this section will focus on the PPPs based on the arbitrarily selected IPL. (This is the poverty line extrapolated from $1.08/day in 1993 using price movements in the US and then converting them to Malaysian ringgit using the latest ICP results reported by the Global Office at the World Bank.)
PPPs in column (3) go a step further from the PAG-recommended methodology. In addition to using expenditure share weights of the poor, these PPPs make use of prices from poverty-specific price surveys conducted in the 16 participating countries specifically for examining the likely effect of replacing price data from the ICP with that in the poverty-specific price surveys. So a comparison
of columns (2) and (3) will provide an indication of the likely effect of changing the source of price data from the ICP. A comparison of PPPs in columns (2) and (3), and also columns (4) and (5), reveal significant differences between the two sets of PPPs. The percentage differences between column (2) and column (3), shown in column (8), indicate that the differences are large and significant, but the direction is not uniform. The poverty-specific price survey PPPs (column 3) are lower than PPPs based on PAG methodology for Indonesia (20.38%), Viet Nam (15.8%), Bangladesh (14.94%), India (13.44%), and Sri Lanka (11.10%) followed by other countries. PPPs based on the poverty-specific price survey data are higher in Philippines (12.23%), Maldives (10.00), and Mongolia (5.61%). The other conclusion that can be drawn is that the use of poverty-specific price survey data has significantly affected the PPPs for converting poverty lines.
The percentage differences in pairs of PPPs are presented in columns (6) to (11). A comparison
Table 26. Poverty PPPs: 2005 ICP Asia Pacific, PAG Methodology, and Poverty-Specific Price Survey Data, 2005 (local currency units per Malaysian ringgit)
Country
ICP Consumption
PPP
Poverty PPPs
US$ Poverty Line Indonesia Poverty Line
PAG Poverty Survey PAG Poverty Survey
(1) (2) (3) (4) (5)
Malaysia 1.000 1.000 1.000 1.000 1.000 Bangladesh 12.06 11.95 10.17 11.85 10.19 Bhutan 8.733 8.641 8.244 8.494 8.204 Cambodia 764.0 795.6 807.9 781.4 800.5 Fiji Islands 0.732 0.658 0.671 0.647 0.667 India 7.379 7.440 6.440 7.497 6.479 Indonesia 1,983 2,002 1,594 1,987 1,588 Lao People’s Democratic Republic 1,770 1,874 1,906 1,891 1,920 Maldives 4.606 4.200 4.619 4.145 4.582 Mongolia 247.1 241.2 254.7 238.7 256.0 Nepal 12.52 12.22 11.81 12.00 11.83 Pakistan 9.796 9.679 9.033 9.744 9.064 Philippines 11.44 11.14 12.50 10.98 12.54 Sri Lanka 18.94 17.96 15.97 17.83 16.01 Thailand 8.261 7.775 7.176 7.816 7.207 Viet Nam 2,800 2,794 2,352 2,752 2,356
PPP = purchasing power parity; ICP = International Comparison Program; PAG = Poverty Advisory Group.
Table 26. Poverty PPPs: 2005 ICP Asia Pacific, PAG Methodology, and Poverty-Specific Price Survey Data, 2005 (local currency units per Malaysian ringgit) (continued)
Percent Difference
ICP vs. Poverty PPP PAG vs. Poverty Survey US vs. Indonesia Poverty Line
ICP vs. PAGICP vs. Poverty
Survey US$ Poverty LineIndonesia Poverty
Line PAG Poverty Survey
(6) (7) (8) (9) (10) (11)
(1) and (2) (1) and (3) (2) and (3) (4) and (5) (2) and (4) (3) and (5) (0.88) (15.69) (14.94) (13.99) (0.89) 0.22 (1.05) (5.60) (4.59) (3.41) (1.70) (0.49)
4.14 5.74 1.54 2.44 (1.79) (0.92) (10.14) (8.32) 2.03 3.13 (1.70) (0.64)
0.82 (12.73) (13.44) (13.58) 0.76 0.61 0.94 (19.63) (20.38) (20.10) (0.72) (0.37) 5.90 7.69 1.69 1.54 0.89 0.74
(8.82) 0.30 10.00 10.54 (1.30) (0.82) (2.40) 3.07 5.61 7.25 (1.03) 0.51 (2.39) (5.68) (3.38) (1.34) (1.83) 0.23 (1.20) (7.80) (6.68) (6.98) 0.67 0.34 (2.61) 9.31 12.23 14.26 (1.45) 0.33 (5.16) (15.69) (11.10) (10.22) (0.74) 0.24 (5.88) (13.13) (7.71) (7.78) 0.52 0.44 (0.22) (15.99) (15.80) (14.39) (1.49) 0.16

Chapter 7
67Research Study on Poverty-Specific Purchasing Power Parities for Selected Countries in Asia and the Pacific
of columns (6) and (7) suggests that the poverty-specific price surveys (in column 3) deviate from ICP PPPs (column 1) by a larger margin than the margin by which PAG methodology-based PPPs (column 2) deviate from ICP PPPs. These results suggest that the use of poverty survey data had a bigger effect than the effect induced by a shift from the use of national income weights to poverty weights. The use of poverty-specific price survey data resulted in a significant decline in PPPs for countries like India, and this could be due to the ability of the poverty-specific price survey data to more accurately reflect the prices paid by the poor through the inclusion of items like subsidized rice and wheat. There are some exceptions like Fiji Islands and Lao PDR where the use of expenditure shares of the poor captured most of the effect. This is mainly due to the fact that the ICP prices paid by the general population, and poverty-specific survey price data (representing the prices paid by the poor) are very similar.
The main finding in this section is that the use of price data from poverty-specific price surveys resulted in a bigger change than just the replacement of weights by the expenditure weights of the poor in computing the poverty PPPs. The result provides some indication that the ICP products may not be a good proxy for the goods and services used by the poor. The effect could be significant. In the case of low-income countries where the differences in type and quality of goods and services consumed by the poor and the general population are likely to be less pronounced, the use of poverty-specific price surveys is likely to make only a marginal difference compared with the difference generated by the use of weights representing the expenditure patterns of the poor.
Table 26. Poverty PPPs: 2005 ICP Asia Pacific, PAG Methodology, and Poverty-Specific Price Survey Data, 2005 (local currency units per Malaysian ringgit)
Country
ICP Consumption
PPP
Poverty PPPs
US$ Poverty Line Indonesia Poverty Line
PAG Poverty Survey PAG Poverty Survey
(1) (2) (3) (4) (5)
Malaysia 1.000 1.000 1.000 1.000 1.000 Bangladesh 12.06 11.95 10.17 11.85 10.19 Bhutan 8.733 8.641 8.244 8.494 8.204 Cambodia 764.0 795.6 807.9 781.4 800.5 Fiji Islands 0.732 0.658 0.671 0.647 0.667 India 7.379 7.440 6.440 7.497 6.479 Indonesia 1,983 2,002 1,594 1,987 1,588 Lao People’s Democratic Republic 1,770 1,874 1,906 1,891 1,920 Maldives 4.606 4.200 4.619 4.145 4.582 Mongolia 247.1 241.2 254.7 238.7 256.0 Nepal 12.52 12.22 11.81 12.00 11.83 Pakistan 9.796 9.679 9.033 9.744 9.064 Philippines 11.44 11.14 12.50 10.98 12.54 Sri Lanka 18.94 17.96 15.97 17.83 16.01 Thailand 8.261 7.775 7.176 7.816 7.207 Viet Nam 2,800 2,794 2,352 2,752 2,356
PPP = purchasing power parity; ICP = International Comparison Program; PAG = Poverty Advisory Group.
Table 26. Poverty PPPs: 2005 ICP Asia Pacific, PAG Methodology, and Poverty-Specific Price Survey Data, 2005 (local currency units per Malaysian ringgit) (continued)
Percent Difference
ICP vs. Poverty PPP PAG vs. Poverty Survey US vs. Indonesia Poverty Line
ICP vs. PAGICP vs. Poverty
Survey US$ Poverty LineIndonesia Poverty
Line PAG Poverty Survey
(6) (7) (8) (9) (10) (11)
(1) and (2) (1) and (3) (2) and (3) (4) and (5) (2) and (4) (3) and (5) (0.88) (15.69) (14.94) (13.99) (0.89) 0.22 (1.05) (5.60) (4.59) (3.41) (1.70) (0.49)
4.14 5.74 1.54 2.44 (1.79) (0.92) (10.14) (8.32) 2.03 3.13 (1.70) (0.64)
0.82 (12.73) (13.44) (13.58) 0.76 0.61 0.94 (19.63) (20.38) (20.10) (0.72) (0.37) 5.90 7.69 1.69 1.54 0.89 0.74
(8.82) 0.30 10.00 10.54 (1.30) (0.82) (2.40) 3.07 5.61 7.25 (1.03) 0.51 (2.39) (5.68) (3.38) (1.34) (1.83) 0.23 (1.20) (7.80) (6.68) (6.98) 0.67 0.34 (2.61) 9.31 12.23 14.26 (1.45) 0.33 (5.16) (15.69) (11.10) (10.22) (0.74) 0.24 (5.88) (13.13) (7.71) (7.78) 0.52 0.44 (0.22) (15.99) (15.80) (14.39) (1.49) 0.16

Chapter 7
2005 International Comparison Program in Asia and the Pacific 68
Effect of Democratic Weights versus Plutocratic Weights
Table 27 presents the PPPs computed using democratic and plutocratic weights for aggregating the expenditure weights of households around the poverty line. The main difference is that democratic weights give equal importance to all the households in the set whereas plutocratic weights accord weights relative to the size of the household expenditure. In Chapter 5, the use of democratic weights was preferred to plutocratic weights. For a number of alternative scenarios, PPPs were computed using both systems of weights. There is very little difference generated by and between the two approaches, hence the choice here is almost inconsequential. Therefore, the use of democratic weights, which give equal weight to all households, may be recommended.
Sensitivity of PPP Estimates to the Choice of Aggregation Method
All the PPPs presented in Tables 24 to 27 are computed using the EKS method of aggregation described in Chapter 5. However, several alternative methods of aggregation are available for this purpose. The GK method was used in earlier rounds of the ICP until 1985, and is still used in the construction of the Penn World Tables.36 For computing PPPs, the weighted CPD method based on a generalization of the CPD method using weights in the regression estimation was considered by Deaton (2006) and Rao and O’Donnell (2004). Table 28 presents PPP estimates generated using the EKS, GK, and weighted CPD methods of aggregation.
36 The PPPs in the 2005 ICP Asia Pacific provides results generated using the GK method (see ADB 2007b, Appendix 6).
Table 27. Poverty PPPs: Democratic and Plutocratic Weights, 2005(local currency units per Malaysian ringgit)
Country
US$ Poverty Line
ICP Basic Headings PPPs
Below Poverty Line Within ±h of Poverty Line
Democratic Plutocratic Democratic Plutocratic
(1) (2) (3) (4)
Bangladesh 11.88 11.86 11.95 11.95 Bhutan 8.474 8.486 8.641 8.640 Cambodia 780.2 781.5 795.6 795.6 Fiji Islands 0.650 0.651 0.658 0.659 India 7.534 7.380 7.440 7.316 Indonesia 1,990 1,991 2,002 2,002 Lao People’s Democratic Republic 1,899 1,892 1,874 1,873 Malaysia 1.000 1.000 1.000 1.000 Maldives 4.150 4.138 4.200 4.206 Mongolia 239.9 239.4 241.2 241.2 Nepal 12.07 12.06 12.22 12.21 Pakistan 9.782 9.752 9.679 9.673 Philippines 11.02 11.01 11.14 11.14 Sri Lanka 17.87 17.86 17.96 17.94 Thailand 7.773 7.769 7.775 7.772 Viet Nam 2,756 2,756 2,794 2,793
PPP = purchasing power parity; ICP = International Comparison Program.
Table 27. Poverty PPPs: Democratic and Plutocratic Weights, 2005 (local currency units per Malaysian ringgit) (continued)
US$ Poverty Line Indonesia Poverty Line
Poverty Basic Headings PPPs ICP Basic Headings PPPs Poverty Basic Headings PPPs
Below Poverty Line Within ±h of Poverty Line Within ±h of Poverty Line
Democratic Plutocratic Democratic Plutocratic Democratic Plutocratic Democratic Plutocratic
(5) (6) (7) (8) (9) (10) (11) (12)
10.14 10.14 10.17 10.16 11.85 11.82 10.19 10.18 8.169 8.169 8.244 8.243 8.494 8.483 8.204 8.202 784.6 786.7 807.9 807.2 781.4 779.4 800.5 800.0 0.649 0.655 0.671 0.672 0.647 0.647 0.667 0.667 6.441 6.417 6.440 6.413 7.497 7.313 6.479 6.436 1,569 1,575 1,594 1,596 1,987 1,985 1,588 1,589 1,934 1,929 1,906 1,904 1,891 1,886 1,920 1,919 1.000 1.000 1.000 1.000 1.000 1.000 1.000 1.000 4.471 4.509 4.619 4.624 4.145 4.133 4.582 4.587 255.9 255.4 254.7 254.5 238.7 238.1 256.0 255.8 11.88 11.84 11.81 11.80 12.00 11.96 11.83 11.84 9.063 9.063 9.033 9.023 9.744 9.706 9.064 9.062 12.55 12.54 12.50 12.50 10.98 10.96 12.54 12.54 15.96 15.95 15.97 15.94 17.83 17.78 16.01 16.01 7.197 7.194 7.176 7.173 7.816 7.802 7.207 7.204 2,341 2,341 2,352 2,352 2,752 2,746 2,356 2,356

Chapter 7
69Research Study on Poverty-Specific Purchasing Power Parities for Selected Countries in Asia and the Pacific
Results reported in columns (1) to (3), which make use of ICP prices and poverty weights, i.e., the PAG methodology, show that PPPs from the weighted CPD appear to be lower than PPPs from the EKS and GK methods, with a couple of exceptions. In most cases, the weighted CPD PPPs are closer to those generated by the EKS. A notable feature of the results is that the GK PPPs for some low-income countries like Viet Nam, Lao PDR, and Bangladesh are higher than the EKS PPPs. This result does not support the general criticism leveled against the use of the GK method—that GK parities are lower for low-income countries, thus overstating the real income or expenditure.
The results are more mixed when poverty-specific survey price data are used. It appears that the EKS and weighted CPD methods generate PPPs that are close to each other, which in turn differ from the GK-based PPPs. These results clearly indicate the need to further explore the issue of choice of the appropriate aggregation methodology.
Sensitivity of Estimates of Poverty Incidence
Attention so far has focused on the robustness of PPP estimates to different sources of price data, to different expenditure weights, and, finally, to the use of different aggregation methods. In this section, the effect of the use of different poverty lines to generate PPPs and the effect of different sources of price data on the estimates of poverty incidence are discussed. Table 29 presents estimates of poverty incidence computed using PPPs generated from different sources of price data and two different poverty lines.
The top panel of Table 29 focuses on estimates generated when the IPL is used. The main point of interest here is that the estimates of poverty incidence are fairly robust and insensitive to variations in identifying the poor and to the use of democratic or plutocratic weights. These results are consistent with the sensitivity results reported and discussed earlier.
Table 27. Poverty PPPs: Democratic and Plutocratic Weights, 2005(local currency units per Malaysian ringgit)
Country
US$ Poverty Line
ICP Basic Headings PPPs
Below Poverty Line Within ±h of Poverty Line
Democratic Plutocratic Democratic Plutocratic
(1) (2) (3) (4)
Bangladesh 11.88 11.86 11.95 11.95 Bhutan 8.474 8.486 8.641 8.640 Cambodia 780.2 781.5 795.6 795.6 Fiji Islands 0.650 0.651 0.658 0.659 India 7.534 7.380 7.440 7.316 Indonesia 1,990 1,991 2,002 2,002 Lao People’s Democratic Republic 1,899 1,892 1,874 1,873 Malaysia 1.000 1.000 1.000 1.000 Maldives 4.150 4.138 4.200 4.206 Mongolia 239.9 239.4 241.2 241.2 Nepal 12.07 12.06 12.22 12.21 Pakistan 9.782 9.752 9.679 9.673 Philippines 11.02 11.01 11.14 11.14 Sri Lanka 17.87 17.86 17.96 17.94 Thailand 7.773 7.769 7.775 7.772 Viet Nam 2,756 2,756 2,794 2,793
PPP = purchasing power parity; ICP = International Comparison Program.
Table 27. Poverty PPPs: Democratic and Plutocratic Weights, 2005 (local currency units per Malaysian ringgit) (continued)
US$ Poverty Line Indonesia Poverty Line
Poverty Basic Headings PPPs ICP Basic Headings PPPs Poverty Basic Headings PPPs
Below Poverty Line Within ±h of Poverty Line Within ±h of Poverty Line
Democratic Plutocratic Democratic Plutocratic Democratic Plutocratic Democratic Plutocratic
(5) (6) (7) (8) (9) (10) (11) (12)
10.14 10.14 10.17 10.16 11.85 11.82 10.19 10.18 8.169 8.169 8.244 8.243 8.494 8.483 8.204 8.202 784.6 786.7 807.9 807.2 781.4 779.4 800.5 800.0 0.649 0.655 0.671 0.672 0.647 0.647 0.667 0.667 6.441 6.417 6.440 6.413 7.497 7.313 6.479 6.436 1,569 1,575 1,594 1,596 1,987 1,985 1,588 1,589 1,934 1,929 1,906 1,904 1,891 1,886 1,920 1,919 1.000 1.000 1.000 1.000 1.000 1.000 1.000 1.000 4.471 4.509 4.619 4.624 4.145 4.133 4.582 4.587 255.9 255.4 254.7 254.5 238.7 238.1 256.0 255.8 11.88 11.84 11.81 11.80 12.00 11.96 11.83 11.84 9.063 9.063 9.033 9.023 9.744 9.706 9.064 9.062 12.55 12.54 12.50 12.50 10.98 10.96 12.54 12.54 15.96 15.95 15.97 15.94 17.83 17.78 16.01 16.01 7.197 7.194 7.176 7.173 7.816 7.802 7.207 7.204 2,341 2,341 2,352 2,352 2,752 2,746 2,356 2,356

Chapter 7
2005 International Comparison Program in Asia and the Pacific 70
The second point of interest is the significant differences in estimates of poverty incidence generated by the use of PPPs based on poverty-specific price surveys and those based on ICP price surveys. Again, consistent with the discussions so far, estimates of poverty incidence based on PPPs using poverty-specific price survey data are generally lower than those computed using PPPs based on the PAG methodology in 9 out of 15 countries. Therefore, the use of poverty-specific price survey data generally reduces the estimates of poverty incidence except for Cambodia, Fiji Islands, Lao PDR, Maldives, Mongolia, and Philippines where PPPs based on poverty-specific price surveys show a higher incidence of poverty.
In the lower panel of Table 29, the incidence of poverty in Indonesia remains constant in all scenarios, as the Indonesian poverty line is used as the reference poverty line. For all countries, the estimates of poverty incidence based on the Indonesian poverty line are lower than the estimates resulting from the use of an IPL. The difference between the top and the
bottom panels captures the effect of using different poverty lines for computing poverty incidence.
For purposes of comparing poverty incidence, estimates generated in the literature for the region and for 2005, which are reported in Key Indicators 2007 (ADB 2007), are presented in the last two rows. The last row shows estimates of PPPs based on $1/day IPL converted using PPPs for consumption from the Penn World Tables. These estimates appear to be consistently lower than those generated using national poverty lines. This pattern may indicate that the PPPs used are inappropriate or that the IPL is not consistent with the national poverty lines used.
Conclusion and Recommended Poverty PPPs for the 2005 ICP Asia Pacific
The contents of this chapter are the central focus of the poverty PPP study. Figure 3 summarizes the steps involved in compiling the poverty PPPs and
Table 28. Poverty PPPs by Aggregation Methods, 2005(local currency units per Malaysian ringgit)
Country
US$ Poverty Line
ICP Basic Heading PPPs Poverty Basic Heading PPPs
EKS GK WCPD EKS GK WCPD
(1) (2) (3) (4) (5) (6)
Bangladesh 11.95 12.54 11.39 10.17 10.10 10.41 Bhutan 8.641 8.606 8.358 8.244 7.608 8.771 Cambodia 795.6 772.0 728.3 807.9 692.2 746.7 Fiji Islands 0.658 0.615 0.584 0.671 0.600 0.648 India 7.440 8.019 7.071 6.440 6.543 6.606 Indonesia 2,002 1,989 1,844 1,594 1,490 1,605 Lao People’s Democratic Republic 1,874 1,928 1,806 1,906 1,942 1,972 Malaysia 1.000 1.000 1.000 1.000 1.000 1.000 Maldives 4.200 3.712 3.513 4.619 4.033 4.750 Mongolia 241.2 213.6 222.6 254.7 235.5 245.0 Nepal 12.22 12.79 11.68 11.81 11.38 12.13 Pakistan 9.679 10.30 9.336 9.033 9.069 9.535 Philippines 11.14 10.78 10.20 12.50 11.98 12.58 Sri Lanka 17.96 17.87 16.55 15.97 15.59 16.54 Thailand 7.775 7.974 7.309 7.176 7.166 7.219 Viet Nam 2,794 2,866 2,647 2,352 2,207 2,314
PPP = purchasing power parity; ICP = International Comparison Program; EKS = Eltetö-Köves-Szulc; GK = Geary-Khamis; WCPD = weighted country product dummy.
Table 28. Poverty PPPs by Aggregation Methods, 2005(local currency units per Malaysian ringgit) (continued)
Indonesia Poverty Line
ICP Basic Heading PPPs Poverty Basic Heading PPPs
EKS GK WCPD EKS GK WCPD
(7) (8) (9) (10) (11) (12)
11.85 11.94 11.08 10.19 10.09 10.53 8.494 8.197 8.178 8.204 7.444 8.765 781.4 739.1 705.8 800.5 687.6 757.9 0.647 0.595 0.567 0.667 0.598 0.643 7.497 7.850 7.026 6.479 6.558 6.819 1,987 1,928 1,806 1,588 1,482 1,576 1,891 1,897 1,796 1,920 1,965 2,134 1.000 1.000 1.000 1.000 1.000 1.000 4.145 3.635 3.464 4.582 4.022 4.884 238.7 206.7 216.2 256.0 235.0 253.1 12.00 11.98 11.12 11.83 11.27 12.07 9.744 10.16 9.236 9.064 9.043 10.419 10.98 10.35 9.91 12.54 12.03 13.21 17.83 17.30 16.15 16.01 15.61 17.82 7.816 7.822 7.249 7.207 7.218 8.147 2,752 2,717 2,550 2,356 2,221 2,306

Chapter 7
71Research Study on Poverty-Specific Purchasing Power Parities for Selected Countries in Asia and the Pacific
also help identify the choices to be made at different steps. In all, a total of 144 different combinations and sets of poverty PPPs are possible; all of them have the potential to replace the consumption PPPs from the ICP used in converting the IPL.
This chapter presented PPPs compiled using the methodology recommended by the PAG and compares them with the conventionally used consumption PPPs. The conclusion is that the use of expenditure share weights of poor households can affect the estimates of PPPs significantly. The results presented here support the recommendation of the PAG and confirm that replacing the national income weights with the expenditure share weights is a necessary first step in refining and improving the relevance of PPPs used for converting the IPL.
The chapter examined the effect of the use of poverty-specific price surveys as the main source of price data in computing the basic heading PPPs, which are used as inputs in poverty PPP computation. The results suggest that poverty-specific price survey data have a major effect on poverty PPPs. A
comparison of the poverty-specific price surveys PPPs with the conventional PPPs and PAG methodology PPPs suggests that using the poverty-specific price survey data has a bigger effect on the final PPPs than using just the expenditure patterns of the poor. The results suggest that collection of price data through poverty-specific product lists and price surveys can improve the estimates of PPPs for converting IPLs.
The chapter also examined the robustness of PPPs to variations in using democratic versus plutocratic weights, different aggregation methods, and identifying households around the poverty line. There is virtually no difference in the results from the use of democratic and plutocratic weights. In contrast, the use of the aggregation method has the potential to generate differences in estimated poverty PPPs. Finally, using the expenditure weights of households below the poverty line rather than those of households around the poverty line has a negligible effect compared with the effect generated by the use of poverty-specific price survey data and poverty-specific expenditure patterns of the poor.
Table 28. Poverty PPPs by Aggregation Methods, 2005(local currency units per Malaysian ringgit)
Country
US$ Poverty Line
ICP Basic Heading PPPs Poverty Basic Heading PPPs
EKS GK WCPD EKS GK WCPD
(1) (2) (3) (4) (5) (6)
Bangladesh 11.95 12.54 11.39 10.17 10.10 10.41 Bhutan 8.641 8.606 8.358 8.244 7.608 8.771 Cambodia 795.6 772.0 728.3 807.9 692.2 746.7 Fiji Islands 0.658 0.615 0.584 0.671 0.600 0.648 India 7.440 8.019 7.071 6.440 6.543 6.606 Indonesia 2,002 1,989 1,844 1,594 1,490 1,605 Lao People’s Democratic Republic 1,874 1,928 1,806 1,906 1,942 1,972 Malaysia 1.000 1.000 1.000 1.000 1.000 1.000 Maldives 4.200 3.712 3.513 4.619 4.033 4.750 Mongolia 241.2 213.6 222.6 254.7 235.5 245.0 Nepal 12.22 12.79 11.68 11.81 11.38 12.13 Pakistan 9.679 10.30 9.336 9.033 9.069 9.535 Philippines 11.14 10.78 10.20 12.50 11.98 12.58 Sri Lanka 17.96 17.87 16.55 15.97 15.59 16.54 Thailand 7.775 7.974 7.309 7.176 7.166 7.219 Viet Nam 2,794 2,866 2,647 2,352 2,207 2,314
PPP = purchasing power parity; ICP = International Comparison Program; EKS = Eltetö-Köves-Szulc; GK = Geary-Khamis; WCPD = weighted country product dummy.
Table 28. Poverty PPPs by Aggregation Methods, 2005(local currency units per Malaysian ringgit) (continued)
Indonesia Poverty Line
ICP Basic Heading PPPs Poverty Basic Heading PPPs
EKS GK WCPD EKS GK WCPD
(7) (8) (9) (10) (11) (12)
11.85 11.94 11.08 10.19 10.09 10.53 8.494 8.197 8.178 8.204 7.444 8.765 781.4 739.1 705.8 800.5 687.6 757.9 0.647 0.595 0.567 0.667 0.598 0.643 7.497 7.850 7.026 6.479 6.558 6.819 1,987 1,928 1,806 1,588 1,482 1,576 1,891 1,897 1,796 1,920 1,965 2,134 1.000 1.000 1.000 1.000 1.000 1.000 4.145 3.635 3.464 4.582 4.022 4.884 238.7 206.7 216.2 256.0 235.0 253.1 12.00 11.98 11.12 11.83 11.27 12.07 9.744 10.16 9.236 9.064 9.043 10.419 10.98 10.35 9.91 12.54 12.03 13.21 17.83 17.30 16.15 16.01 15.61 17.82 7.816 7.822 7.249 7.207 7.218 8.147 2,752 2,717 2,550 2,356 2,221 2,306

Chapter 7
2005 International Comparison Program in Asia and the Pacific 72
It is therefore recommended that the following four sets of PPPs (Table 30) be used for converting the IPL into common currency units. All the PPPs are expressed using the Malaysian ringgit as the reference currency.
The key to using the PPPs in Table 30 is as follows. The PAG methodology uses basic heading PPPs based on the 2005 ICP Asia Pacific price surveys and expenditure patterns of the poor. The PPPs based on poverty-specific price survey data also make use of expenditure weights of the poor. All the expenditure shares are computed as democratic weights and for all households with expenditures within h of the poverty line. The EKS aggregation method is used in all computations. The $1/day refers to the IPL $1.08/
day in 1993 dollars updated using the US CPI. The Indonesian poverty line is the national poverty line for 2005. The $1/day and the Indonesian poverty lines are used in the compilation of expenditure share weights of households around the poverty line.
For the 2005 ICP, the PAG recommended that PPPs in column (3) be used. The difference between columns (3) and (4) is very small. If the price data from the poverty-specific price surveys are used, the resulting PPPs would be those presented in columns (5) and (6). The use of the new PPPs will have the effect of reducing poverty incidence in a number of the participating countries. The significant effect of the poverty-specific price survey data on PPPs is an important area for further research.
Table 29. Estimates of Poverty Incidence for 16 Countries
Line Price RefPopn Weight Bangladesh Bhutan CambodiaFiji
Islands India Indonesia
$1/day poverty line
Poverty survey prices adjusted to June 2005
Below the poverty line
Plutocratic 54.46 36.10 59.33 31.84 49.97 22.59Democratic 54.48 36.10 59.16 31.43 50.21 22.29
Band of ±hPlutocratic 54.67 36.59 61.04 32.84 49.92 23.48Democratic 54.70 36.59 61.10 32.80 50.20 23.41
Band of ±0.5hPlutocratic 54.77 36.68 61.34 32.98 50.06 23.75Democratic 54.88 36.68 61.42 32.90 50.51 23.60
ICP(PAG)
Below the poverty line
Plutocratic 66.34 38.05 58.88 31.57 58.73 40.93Democratic 66.41 37.95 58.78 31.49 59.94 40.91
Band of ±hPlutocratic 66.90 38.73 60.04 32.05 58.18 41.33Democratic 66.95 38.73 60.09 31.98 59.16 41.39
Band of ±0.5hPlutocratic 67.21 39.08 60.28 31.97 58.24 41.57Democratic 67.22 39.08 60.32 31.97 59.38 41.59
Indonesia national poverty line
Poverty survey Band of ±h
around the poverty line
Plutocratic 43.36 29.99 51.74 27.48 41.98 14.74Democratic 43.51 30.16 51.86 27.49 42.46 14.74
ICP (PAG)Plutocratic 36.71 19.23 33.63 18.34 36.28 14.74Democratic 36.85 19.23 33.78 18.34 37.61 14.74
Poverty incidence from Key Indicators 2007National poverty lines 40.00 31.70 34.70 25.50 27.50 16.70$1/day poverty line 36.26 0.00 18.47 25.50 35.07 7.65
h = bandwidth; ICP = International Comparison Program; RefPopn = reference population; PAG = Poverty Advisory Group.
Table 29. Estimates of Poverty Incidence for 16 Countries (continued)
Lao People’s Democratic Republic Malaysia Maldives Mongolia Nepal Pakistan Philippines Sri Lanka Thailand Viet Nam
70.02 2.42 15.28 31.06 61.17 41.60 34.62 13.78 2.07 22.4470.26 2.42 14.96 31.28 61.46 41.60 34.68 13.80 2.08 22.4469.22 2.42 16.25 30.93 61.00 41.12 34.44 13.78 2.04 22.7569.29 2.42 16.25 30.95 61.00 41.26 34.46 13.84 2.04 22.7369.52 2.42 16.80 30.97 61.09 41.36 34.60 13.97 2.04 22.8669.56 2.42 16.69 31.05 61.28 41.41 34.60 13.99 2.05 22.9068.83 2.42 11.54 27.52 62.56 48.54 28.28 19.46 2.98 32.6969.01 2.42 11.54 27.58 62.59 48.86 28.30 19.53 2.98 32.6768.23 2.42 12.15 27.80 63.32 47.92 28.81 19.85 2.98 33.5868.26 2.42 12.15 27.84 63.36 47.94 28.82 19.88 2.98 33.6368.41 2.42 12.39 27.97 63.44 48.07 29.00 20.23 3.03 33.8468.50 2.42 12.39 28.02 63.48 48.09 29.04 20.32 3.04 33.8460.75 1.33 10.48 24.39 53.29 30.71 28.31 8.71 1.07 15.3760.83 1.33 10.18 24.52 53.35 30.81 28.37 8.73 1.08 15.4341.88 0.46 3.92 12.60 38.34 18.55 13.08 5.21 0.55 12.2841.99 0.46 3.92 12.66 38.42 18.66 13.10 5.26 0.55 12.34
32.70 5.10 21.00 36.10 30.90 23.90 30.00 22.70 9.80 19.5028.84 0.00 1.00 11.03 24.74 9.75 13.18 4.83 0.00 8.38

Chapter 7
73Research Study on Poverty-Specific Purchasing Power Parities for Selected Countries in Asia and the Pacific
Table 30. Poverty PPPs Using Democratic Weights: PAG Methodology versus Poverty-Specific Price Data, 2005 (local currency units per Malaysian ringgit)
Country Currency
PAG Methodology Based on Poverty-Specific Price Surveys
$1/day PL of Indonesia $1/day PL of Indonesia
(1) (2) (3) (4) (5) (6)
Bangladesh Taka 11.95 11.85 10.17 10.19 Bhutan Ngultrum 8.641 8.494 8.244 8.204 Cambodia Riel 795.6 781.4 807.9 800.5 Fiji Islands Fiji Dollar 0.658 0.647 0.671 0.667 India Indian Rupee 7.440 7.497 6.440 6.479 Indonesia Rupiah 2,002 1,987 1,594 1,588 Lao People’s Democratic Republic Kip 1,874 1,891 1,906 1,920 Malaysia Ringgit 1.000 1.000 1.000 1.000 Maldives Rufiyaa 4.200 4.145 4.619 4.582 Mongolia Tugrik 241.2 238.7 254.7 256.0 Nepal Nepalese Rupee 12.22 12.00 11.81 11.83 Pakistan Pakistani Rupee 9.679 9.744 9.033 9.064 Philippines Philippine Peso 11.14 10.98 12.50 12.54 Sri Lanka Sri Lankan Rupee 17.96 17.83 15.97 16.01 Thailand Baht 7.775 7.816 7.176 7.207 Viet Nam Dong 2,794 2,752 2,352 2,356 PAG = Poverty Advisory Group; PL = poverty line.
Table 29. Estimates of Poverty Incidence for 16 Countries
Line Price RefPopn Weight Bangladesh Bhutan CambodiaFiji
Islands India Indonesia
$1/day poverty line
Poverty survey prices adjusted to June 2005
Below the poverty line
Plutocratic 54.46 36.10 59.33 31.84 49.97 22.59Democratic 54.48 36.10 59.16 31.43 50.21 22.29
Band of ±hPlutocratic 54.67 36.59 61.04 32.84 49.92 23.48Democratic 54.70 36.59 61.10 32.80 50.20 23.41
Band of ±0.5hPlutocratic 54.77 36.68 61.34 32.98 50.06 23.75Democratic 54.88 36.68 61.42 32.90 50.51 23.60
ICP(PAG)
Below the poverty line
Plutocratic 66.34 38.05 58.88 31.57 58.73 40.93Democratic 66.41 37.95 58.78 31.49 59.94 40.91
Band of ±hPlutocratic 66.90 38.73 60.04 32.05 58.18 41.33Democratic 66.95 38.73 60.09 31.98 59.16 41.39
Band of ±0.5hPlutocratic 67.21 39.08 60.28 31.97 58.24 41.57Democratic 67.22 39.08 60.32 31.97 59.38 41.59
Indonesia national poverty line
Poverty survey Band of ±h
around the poverty line
Plutocratic 43.36 29.99 51.74 27.48 41.98 14.74Democratic 43.51 30.16 51.86 27.49 42.46 14.74
ICP (PAG)Plutocratic 36.71 19.23 33.63 18.34 36.28 14.74Democratic 36.85 19.23 33.78 18.34 37.61 14.74
Poverty incidence from Key Indicators 2007National poverty lines 40.00 31.70 34.70 25.50 27.50 16.70$1/day poverty line 36.26 0.00 18.47 25.50 35.07 7.65
h = bandwidth; ICP = International Comparison Program; RefPopn = reference population; PAG = Poverty Advisory Group.
Table 29. Estimates of Poverty Incidence for 16 Countries (continued)
Lao People’s Democratic Republic Malaysia Maldives Mongolia Nepal Pakistan Philippines Sri Lanka Thailand Viet Nam
70.02 2.42 15.28 31.06 61.17 41.60 34.62 13.78 2.07 22.4470.26 2.42 14.96 31.28 61.46 41.60 34.68 13.80 2.08 22.4469.22 2.42 16.25 30.93 61.00 41.12 34.44 13.78 2.04 22.7569.29 2.42 16.25 30.95 61.00 41.26 34.46 13.84 2.04 22.7369.52 2.42 16.80 30.97 61.09 41.36 34.60 13.97 2.04 22.8669.56 2.42 16.69 31.05 61.28 41.41 34.60 13.99 2.05 22.9068.83 2.42 11.54 27.52 62.56 48.54 28.28 19.46 2.98 32.6969.01 2.42 11.54 27.58 62.59 48.86 28.30 19.53 2.98 32.6768.23 2.42 12.15 27.80 63.32 47.92 28.81 19.85 2.98 33.5868.26 2.42 12.15 27.84 63.36 47.94 28.82 19.88 2.98 33.6368.41 2.42 12.39 27.97 63.44 48.07 29.00 20.23 3.03 33.8468.50 2.42 12.39 28.02 63.48 48.09 29.04 20.32 3.04 33.8460.75 1.33 10.48 24.39 53.29 30.71 28.31 8.71 1.07 15.3760.83 1.33 10.18 24.52 53.35 30.81 28.37 8.73 1.08 15.4341.88 0.46 3.92 12.60 38.34 18.55 13.08 5.21 0.55 12.2841.99 0.46 3.92 12.66 38.42 18.66 13.10 5.26 0.55 12.34
32.70 5.10 21.00 36.10 30.90 23.90 30.00 22.70 9.80 19.5028.84 0.00 1.00 11.03 24.74 9.75 13.18 4.83 0.00 8.38

Chapter 8
International Poverty Lines for the Asia and Pacific Region
Introduction
The concept of IPLs was first used in compiling and presenting global estimates of poverty in the 1990 World Development Report (World Bank 1990). The IPLs of $1/day and $2/day have since become widely accepted as benchmarks for assessing and comparing poverty incidence across countries. The World Bank regularly publishes estimates of poverty incidence based on these poverty lines. Chen and Ravallion (2007) examined trends in regional and global estimates of poverty using those poverty lines. The inclusion of $1/day IPL in Goal 1 of the MDGs—the most important goal—have brought worldwide recognition for these IPLs.
The popularity of the $1/day IPL appears to be due to its simplicity and ability to convey powerful messages to policymakers, international organizations, and the general public about the level and severity of poverty in the world. Yet despite the popularity it has enjoyed, it is surprising that the concept itself is not well understood by researchers and the wider public. This poverty PPP study focuses mainly on the computation of PPPs that are appropriate for the conversion of the $1/day and $2/day IPLs into local currency units. It is a major step in estimating poverty incidence or counting the poor in different countries. This chapter describes the concept of IPL and will explain the main steps involved in determining the IPL. Estimates of IPLs and poverty incidence based on the IPL for the participating countries will also be presented.
The Basic Concept of International Poverty Lines
In its simplest form, the IPL is a representative of the poverty lines actually used in low-income countries with a high incidence of poverty. The approach used by the World Bank to establish the first IPL was based on the median of the 10 lowest poverty lines within the original set of 33 low-and high-income countries.37 The basic notion is that the IPL represents a large number of national poverty lines, which are determined using country-specific requirements. The empirical implementation of the basic idea behind the IPL is not always clearly stated. A series of papers by Chen and Ravallion (2001, 2004, and 2007) provide explanations of the methodology behind the determination of the IPL. As Kakwani and Son (2006) indicate, there is really no formal econometric methodology that underpins the exact use of $1/day.
Determination of International Poverty Lines
In the following, the steps involved in the determination of IPLs are presented and illustrated using data and information generated in this poverty PPP study.
37 See Ravallion’s contribution in UNDP (2004).

Chapter 8
75Research Study on Poverty-Specific Purchasing Power Parities for Selected Countries in Asia and the Pacific
Which Currency to Use?
There is absolutely no restriction on the use of a currency unit for the specification of the IPL. Although the established practice is to use the US dollar as the anchor for the IPL, any currency can be used for the purpose. Since 16 countries are participating in the poverty PPP study, and since the Malaysian ringgit has been used as the reference currency in all the PPP calculations reported so far, the Malaysian ringgit is used to represent the national poverty lines in the 16 participating countries.
National Poverty Lines
In computing the IPL, it is necessary to begin with national poverty lines. As the current study uses 2005 as the reference year, all the national poverty lines are for 2005 and are expressed in local currency units. These are presented in Table 31. Column (2)
shows the national poverty lines expressed as number of local currency units per annum.
Converting National Poverty Lines into a Common Currency Unit
The national poverty lines are converted into a common currency unit using an appropriate set of PPPs. In Table 31, the PPPs for HFCE derived as part of the 2005 ICP Asia Pacific are used for the 16 countries. The final results and the IPL computed using this method will depend on the choice of the PPPs made at this stage. The sensitivity of the IPL to the choice of PPPs, and the main considerations involved in the choice of the PPPs are considered in the next section. Table 31 shows the ICP PPPs for consumption in column (1), and the national poverty lines expressed in Malaysian ringgit after conversion are in column (3). As IPLs are usually shown on a per day basis, figures in column (3) are derived by
Table 31. IPL with ICP PPPs for Consumption, 2005
CountryICP PPPs for
Consumption
2005 National
Poverty Lines
National Poverty Lines in RM/day
(2) / ((1)*365)
Index of Per Capita Real GDP
(HKG=100)
Trendline between
(3) and (4)US$1/day
(1)*(5)Final Annual IPL
(6)*365 days
(1) (2) (3) (4) (6) (7)
Bangladesh 12.06 9,672.72 2.20 3.56
(5)= 1.8818 + 0.1208(4)
32.98 12,036.80 Bhutan 8.733 9,784.60 3.07 10.35 23.88 8,717.82 Cambodia 764.0 819,062.19 2.94 4.07 2,089 762,654.91 Fiji Islands 0.732 1,995.75 7.47 11.80 2.003 730.94 India 7.379 4,905.63 1.82 5.96 20.18 7,366.19 Indonesia 1,983 1,549,296.00 2.14 9.06 5,424 1,979,621.08 Lao People’s Democratic Republic 1,770 1,525,105.94 2.36 5.08 4,840 1,766,586.20Malaysia 1.000 1,915.06 5.25 32.14 2.735 998.23 Maldives 4.606 5,417.88 3.22 11.26 12.60 4,597.39 Mongolia 247.1 347,900.13 3.86 7.41 675.9 246,692.33 Nepal 12.52 8,337.10 1.82 3.03 34.24 12,496.29 Pakistan 9.796 10,543.68 2.95 6.72 26.79 9,779.02 Philippines 11.44 14,046.00 3.36 8.22 31.28 11,416.08 Sri Lanka 18.94 21,804.00 3.15 9.76 51.79 18,904.44
(5)
Thailand 8.261 15,580.64 5.17 19.25 22.59 8,246.25 Viet Nam 2,800 2,247,685.20 2.20 6.00 7,658 2,795,047.76
Median 7.06 2.735 $1/day IPL for Malaysia
1.296 $1/day Poverty Line for US based on a PPP for PIC of 2.11
HKG = Hong Kong, China; GDP = gross domestic product; ICP = International Comparison Program; PIC = private individual consumption (World Bank 2008); PPP = purchasing power parity.

Chapter 8
2005 International Comparison Program in Asia and the Pacific 76
adjusting column (1) to 365 days, i.e., column (3) = column (2) / [column (1) x 365].
A simple interpretation of column (3) follows. The poverty line in each country is expressed in Malaysian ringgit, as converted using the PPPs for HFCE from ADB (2007b). This means the poverty lines are comparable across countries as they are all expressed in the same currency units after adjusting for price-level differences.
The highest level for the poverty line is observed for Fiji Islands followed by Malaysia. Thailand with a poverty line of RM5.17 is the third highest, followed by a group of countries with poverty lines around RM3. The most curious of all the poverty lines is the one for Fiji Islands. It is expected that Fiji Islands’ poverty line would compare well with that of the Maldives and the Philippines. However, Fiji Islands has the highest poverty line of RM7.47—which is 42% higher than the Malaysian poverty line. Fiji Islands’ poverty line may be considered as an outlier.
Generally, it is expected that the national poverty lines increase as the country gets richer and, therefore, countries with a higher real per capita income would have a higher poverty line. To explore this relationship, real per capita levels of the 16 countries, expressed in an index form relative to Hong Kong, China, are presented in column (4). The figures are drawn from Table 4 of ADB (2007b). Malaysia has the highest real per capita income with an index of 32.14, and Nepal has the lowest per capita income with an index of 3.03. Figure 4 shows the relationship between real per capita income (expressed in index form) and the corresponding national poverty line expressed in Malaysian ringgit.
From Figure 4 it can be seen that indeed there is a strong positive relationship between real per capita income and national poverty lines. The line shows a good fit with an R2 = 0.72 when Fiji Islands is excluded. It can be seen that the two high-income countries, Malaysia and Thailand, are on the upper end of the graph and all the low-income countries are
Index of Per Capita Real GDP (Hong Kong, China = 100)
Trend Line
Natio
nal P
over
ty Li
ne B
ased
on
PPPs
(RM
)
0.00 5.00 10.00 15.00 20.00 25.00 30.00 35.00-
1.00
2.00
3.00
4.00
5.00
6.00
7.00
8.00
y = 0.1208x + 1.8818R2 = 0.72
Fiji Islands
Malaysia
Thailand
Nepal
Figure 4. Relationship between Real Per Capita Income and National Poverty Lines
Scattergram
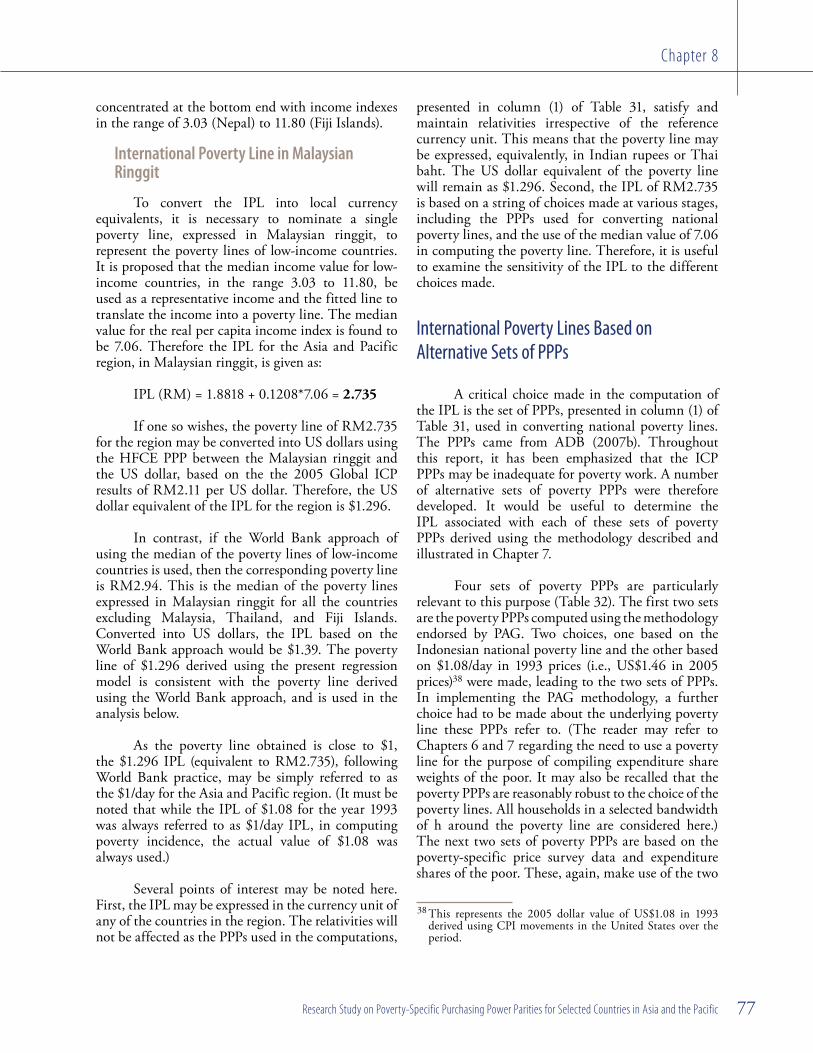
Chapter 8
77Research Study on Poverty-Specific Purchasing Power Parities for Selected Countries in Asia and the Pacific
concentrated at the bottom end with income indexes in the range of 3.03 (Nepal) to 11.80 (Fiji Islands).
International Poverty Line in Malaysian Ringgit
To convert the IPL into local currency equivalents, it is necessary to nominate a single poverty line, expressed in Malaysian ringgit, to represent the poverty lines of low-income countries. It is proposed that the median income value for low-income countries, in the range 3.03 to 11.80, be used as a representative income and the fitted line to translate the income into a poverty line. The median value for the real per capita income index is found to be 7.06. Therefore the IPL for the Asia and Pacific region, in Malaysian ringgit, is given as:
IPL (RM) = 1.8818 + 0.1208*7.06 = 2.735
If one so wishes, the poverty line of RM2.735 for the region may be converted into US dollars using the HFCE PPP between the Malaysian ringgit and the US dollar, based on the the 2005 Global ICP results of RM2.11 per US dollar. Therefore, the US dollar equivalent of the IPL for the region is $1.296.
In contrast, if the World Bank approach of using the median of the poverty lines of low-income countries is used, then the corresponding poverty line is RM2.94. This is the median of the poverty lines expressed in Malaysian ringgit for all the countries excluding Malaysia, Thailand, and Fiji Islands. Converted into US dollars, the IPL based on the World Bank approach would be $1.39. The poverty line of $1.296 derived using the present regression model is consistent with the poverty line derived using the World Bank approach, and is used in the analysis below.
As the poverty line obtained is close to $1, the $1.296 IPL (equivalent to RM2.735), following World Bank practice, may be simply referred to as the $1/day for the Asia and Pacific region. (It must be noted that while the IPL of $1.08 for the year 1993 was always referred to as $1/day IPL, in computing poverty incidence, the actual value of $1.08 was always used.)
Several points of interest may be noted here. First, the IPL may be expressed in the currency unit of any of the countries in the region. The relativities will not be affected as the PPPs used in the computations,
presented in column (1) of Table 31, satisfy and maintain relativities irrespective of the reference currency unit. This means that the poverty line may be expressed, equivalently, in Indian rupees or Thai baht. The US dollar equivalent of the poverty line will remain as $1.296. Second, the IPL of RM2.735 is based on a string of choices made at various stages, including the PPPs used for converting national poverty lines, and the use of the median value of 7.06 in computing the poverty line. Therefore, it is useful to examine the sensitivity of the IPL to the different choices made.
International Poverty Lines Based on Alternative Sets of PPPs
A critical choice made in the computation of the IPL is the set of PPPs, presented in column (1) of Table 31, used in converting national poverty lines. The PPPs came from ADB (2007b). Throughout this report, it has been emphasized that the ICP PPPs may be inadequate for poverty work. A number of alternative sets of poverty PPPs were therefore developed. It would be useful to determine the IPL associated with each of these sets of poverty PPPs derived using the methodology described and illustrated in Chapter 7.
Four sets of poverty PPPs are particularly relevant to this purpose (Table 32). The first two sets are the poverty PPPs computed using the methodology endorsed by PAG. Two choices, one based on the Indonesian national poverty line and the other based on $1.08/day in 1993 prices (i.e., US$1.46 in 2005 prices)38 were made, leading to the two sets of PPPs. In implementing the PAG methodology, a further choice had to be made about the underlying poverty line these PPPs refer to. (The reader may refer to Chapters 6 and 7 regarding the need to use a poverty line for the purpose of compiling expenditure share weights of the poor. It may also be recalled that the poverty PPPs are reasonably robust to the choice of the poverty lines. All households in a selected bandwidth of h around the poverty line are considered here.) The next two sets of poverty PPPs are based on the poverty-specific price survey data and expenditure shares of the poor. These, again, make use of the two
38 This represents the 2005 dollar value of US$1.08 in 1993 derived using CPI movements in the United States over the period.

Chapter 8
2005 International Comparison Program in Asia and the Pacific 78
choices aforementioned. Using the median real per capita index of 7.06, the following IPLs are obtained for the four sets of PPPs.
The two sets of IPLs based on the PAG methodology yield virtually the same IPL. However, the use of poverty-specific price survey data tends to increase the IPL to $1.379 from $1.317 when the US dollar-based poverty line is used, and from $1.327 to $1.378 when the Indonesian poverty line is used.
These results lead to the conclusion that the IPL in Malaysian ringgit is between 2.778 and 2.909, and in US dollar is between $1.317 and $1.379. This basically means that the term $1/day may still be used as an IPL for the Asia and Pacific region. The robustness of the IPL to different approaches generates some confidence in the use of such poverty lines for assessing regional poverty.
Sensitivity Analysis
Chapter 7 has shown that a large number of poverty PPPs result from different combinations of data sets and choices made with respect to the implementation of the methodology for poverty PPPs. Table 33 shows the IPLs generated using different sets of PPPs.
Details of the methods listed in columns (1) to (4) are available in Chapter 7. The IPL based on the PAG methodology tends to be around $1.319, and the poverty-specific price survey data tend to be around $1.380. It is difficult to make any judgment on the statistical significance of the IPL. In case of doubt, one may simply use the geometric mean of all the possible IPLs, which equals $1.350.
2005 Estimates of Poverty in the Asia and Pacific Region Using International Poverty Lines
Table 34 shows estimates of poverty incidence in the 16 countries based on poverty PPPs derived using the PAG methodology as well as the PPPs based on poverty-specific price survey data. In addition, estimates based on the use of ICP PPPs for HFCE are also presented. The IPLs used in each scenario are the headings in the third row. For example, $1.317 is the IPL used when the PPPs are based on the PAG methodology implemented using expenditure weights based on $1/day poverty line. The second row shows the set of PPPs used in converting the respective IPLs to compute poverty incidence. For example, column (4) represents estimates of poverty incidence when the IPL of $1.379/day is converted using PPPs based on poverty-specific price survey data.
A comparison of column (1) with columns (2) and (3) suggests that the use of the PAG methodology can have an effect on the estimates of poverty incidence. However, a greater difference in poverty incidence can be seen when PPPs based on poverty-specific price survey data are used. The IPLs for all these PPPs, presented in the third row of the table, are all very close to each other. Therefore, the significant differences between columns (2) and (4), and (3) and (5), can be attributed to the effect of using price data collected using poverty-specific price surveys. These results point toward the need for further research specially designed to collect price data of goods and services, in order to accurately represent the purchases made by the poor.
Table 32. IPLs Based on Alternative Sets of PPPs
Poverty PPPs used Estimated Regressiona
IPL in RM
IPL in US$
PPPs based on PAG methodology and $1/day (1993) poverty line 1.8861 + 0.1263*X 2.778 1.317PPPs based on PAG methodology and Indonesian national poverty line 1.9155 + 0.1252*X 2.800 1.327PPPs based on poverty-specific price survey prices and $1/day (1993) poverty line 2.0217 + 0.1257*X 2.909 1.379PPPs based on poverty-specific price survey and Indonesian national poverty line 2.0199 + 0.1256*X 2.907 1.378IPL = international poverty line; PAG = Poverty Advisory Board; PPP = puchasing power parity; RM = Malaysian ringgit.a This is the fitted regression line between the national poverty lines, expressed in RM using a selected set of PPPs, and the real per capita income index.

Chapter 8
79Research Study on Poverty-Specific Purchasing Power Parities for Selected Countries in Asia and the Pacific
Table 33. Summary of International Poverty Lines in Malaysian Ringgit and United States Dollar
Method International Poverty Lines
Poverty Line Price Reference Population Type of Weight Malaysian Ringgit United States dollar
(1) (2) (3) (4) (5) (6)
$1/day Poverty Line
ICP Prices
Below PLDemocratic 2.794 1.324Plutocratic 2.800 1.327
±h around PLDemocratic 2.778 1.317Plutocratic 2.781 1.318
±0.5h around PLDemocratic 2.767 1.311Plutocratic 2.781 1.318
Poverty Survey Prices
Below PLDemocratic 2.922 1.385Plutocratic 2.921 1.385
±h around PLDemocratic 2.909 1.379Plutocratic 2.911 1.380
±0.5h around PLDemocratic 2.900 1.374Plutocratic 2.902 1.376
Indonesia Poverty Line
ICP Prices ±h around PLDemocratic 2.800 1.327Plutocratic 2.810 1.332
Poverty Survey Prices ±h around PL
Democratic 2.907 1.378Plutocratic 2.908 1.378
Geometric Mean 2.849 1.350ICP = International Comparison Program; PL = poverty line.
Table 34. Estimates of Poverty Incidence in the Asia and Pacific Region: International Poverty Lines, Poverty PPPs Based on PAG Methodology, and Poverty-Specific Price Survey Data, 2005
Country
Poverty Incidence (%)
ICP PPP for HFCE $1/day PAG INO PL; PAG $1/day; Pov INO PL; Pov
IPL: RM2.735 US$1.296
IPL: RM2.778 US$1.317
IPL: RM2.800 US$1.327
IPL: RM2.909 US$1.379
IPL: RM2.907 US$1.378
(1) (2) (3) (4) (5)
Bangladesh 58.99 59.48 59.32 49.57 49.66Bhutan 33.15 33.25 33.00 33.23 33.11Cambodia 48.96 53.08 52.38 57.25 56.66Fiji Islands 31.49 27.88 27.53 30.48 30.27India 51.31 52.81 53.76 46.56 46.87Indonesia 30.84 32.88 32.92 19.33 18.99Lao People’s Democratic Republic 55.43 60.85 62.14 66.03 66.42Malaysia 1.39 1.55 1.58 1.86 1.85Maldives 11.06 8.30 8.30 13.60 13.42Mongolia 23.30 22.96 22.83 27.70 27.93Nepal 57.62 57.07 56.32 57.85 57.94Pakistan 37.88 38.17 39.35 36.16 36.40Philippines 24.46 23.98 23.67 31.70 31.82Sri Lanka 16.25 14.34 14.34 11.26 11.31Thailand 2.30 1.79 1.93 1.46 1.53Viet Nam 25.91 26.76 26.29 19.25 19.28HFCE = household final consumption expenditure; ICP = International Comparison Program; INO PL = Indonesia poverty line; PAG = Poverty Advisory Group;Pov. = Poverty-Specific Price Survey Data; PPP = purchasing power parity.

Chapter 8
2005 International Comparison Program in Asia and the Pacific 80
Conclusion
Chapter 8 has provided a description of the process involved in determining the IPL. The IPLs are mainly designed to represent a diverse set of national poverty lines through a single poverty line. The actual IPL value will depend on the group of countries considered for the purpose of calculation. The IPL based on the PAG methodology and on poverty-specific price survey data are $1.319 and
$1.380, respectively. The results presented also indicate that the IPL derived would be similar to that of the World Bank approach of using the median of the national poverty lines converted using PPPs. However, the IPL values obtained appear to be fairly robust to different sets of PPPs used. The estimates of poverty incidence suggest that the use of PPPs derived using price data from the poverty-specific price surveys can have a significant effect on the estimates of poverty incidence.

Chapter 9
Milestones Achieved in the Poverty PPP Study,
2005 ICP Asia Pacific, and Future WorkIntroduction
With the Asia and Pacific region being home to more than half of the world’s poor, ADB made poverty measurement with the use of PPPs an integral part of the 2005 ICP Asia Pacific. At the inception stages, the compilation of poverty PPPs was earmarked as a major initiative of the 2005 ICP Asia Pacific.
At the outset, the principal goals of the poverty PPP study were to implement the methodology recommended by the PAG at the Global Office of the ICP located at the World Bank, and to compile a set of new PPPs specifically for the purpose of converting the IPLs of $1/day and $2/day. The conversion of the IPL into local currency units is an important first step in estimating the number of poor in the region. In recognition of the need to refine the process and to contribute to further development in the region, ADB conceived the poverty PPP study as a research initiative that would yield crucial information for the compilation of poverty PPPs. The study could not have been undertaken without generous financial assistance from the Department for International Development of the Government of the United Kingdom of Great Britain and Northern Ireland, and ADB.
A summary of the general findings of the study and avenues for future refinements are presented in this chapter.
Milestones Achieved
The poverty PPP study achieved several milestones and the findings are likely to have a significant influence on the methodology for compiling poverty PPPs in the future.
Sixteen of the 21 ADB member economies in the 2005 ICP Asia Pacific participated in the study. Among them were Bangladesh, India, Indonesia, and Pakistan, four of the eight most populous countries in the world. As the four considered measuring poverty as a major activity, their participation is likely to make the findings from the study relevant to other countries and regions of the world.
The methodology recommended by the PAG is a significant advance over the current use of PPPs from the ICP for converting the IPL. The PAG recommendation is to use the expenditure patterns of the poor, instead of national accounts weights used in the ICP, in combining price data collected as part of the ICP price surveys. Although the suggested methodology appears to be a simple first step, implementation is complex. In particular, its implementation required that a proper correspondence between the ICP basic headings and the consumption items in the HES be established. This difficult and resource-intensive task was undertaken by the Global Office at the World Bank. Once this correspondence was established, the next step was to undertake the complex task of implementing the iterative procedure devised by Deaton (2004).

Chapter 9
2005 International Comparison Program in Asia and the Pacific 82
The PAG methodology was successfully implemented and a set of poverty PPPs was compiled, thus achieving the principal goal of the study. The main finding is that the poverty PPPs based on the PAG methodology differ from the conventionally used consumption PPPs from the ICP.
Parallel to the work of implementing the PAG methodology, a major initiative in the 2005 ICP Asia Pacific was undertaken to further improve the methodology. This initiative entailed examining whether data collected on prices for items that are considered typical of the consumption patterns of the poor would produce significantly different poverty PPPs. This was a difficult task because it required separate price surveys, similar to those conducted in the 2005 ICP Asia Pacific for household final consumption.
Planning for the poverty-specific price surveys began after the surveys for the 2005 ICP Asia Pacific were completed. Through a series of workshops organized by the Regional Office of the 2005 ICP Asia Pacific at ADB, a product list along with detailed specification of products and outlets were prepared. The countries were briefed about the survey framework to be employed, and the poverty-specific price surveys were completed in most participating countries during the last quarter of 2006.
The poverty-specific price data collected by the participating countries were reviewed and the validation workshop held in April 2007 endorsed the use of the price data.
As part of the second stage of the study, the poverty-specific price survey data replaced the 2005 ICP Asia Pacific price data in the compilation of poverty PPPs. Basic heading PPPs estimated from the poverty-specific price survey data were used in conjunction with expenditure patterns of the poor. They had been compiled with the use of the iterative scheme applied on the 2005 ICP Asia Pacific data.
The study also examined the sensitivity of poverty PPPs to different ways of computing the expenditure patterns of the poor (use of democratic versus plutocratic weights); to different ways of identifying the poor households (those below the poverty line and those around the poverty line); and to the application of different index number methods
(the EKS, Geary-Khamis, and the weighted CPD methods) for aggregating price data. The results of the sensitivity test are mixed. They show a degree of robustness to different ways of computing expenditure patterns and to different ways of identifying the poor. However, different aggregation procedures appear to result in significant differences in the final PPPs. This study used the standard EKS method as the main aggregation procedure, but further research is required to develop more robust aggregation procedures.
The study also examined the problem of constructing the IPL. Using a method similar to that used by the World Bank in deriving the IPLs of $1/day and $2/day, the study focused on deriving an IPL for the Asia and Pacific region. The results show that the use of RM2.83/day was appropriate with PPPs from the PAG methodology, and RM2.945/day with PPPs based on the poverty-specific price surveys. The IPLs, expressed in US dollars, and converted using the consumption PPPs from the 2005 ICP global comparisons, are $1.341/day for the PAG PPPs and $1.376/day for the poverty-specific price survey PPPs. Again, consistent with the convention used by the World Bank in using $1/day in place of $1.08/day in 1993, the IPL for the Asia and Pacific region can be stated as $1/day in 2005, or around RM2.90/day in terms of a regional currency unit. The IPLs were surprisingly insensitive to different methods and approaches except for the use of poverty-specific price surveys as the main source for PPPs.
A major conclusion from the estimates of poverty incidence is that, although the IPLs are fairly robust and are around $1/day, the use of PPPs from the PAG methodology and from the poverty-specific price surveys appeared to make a significant difference in the estimates of poverty incidence in different countries. The use of PPPs based on poverty-specific price surveys had a significant effect of either increasing or decreasing the estimates of poverty incidence.
Direction of Future Work
The differences in PPPs computed with the use of price data collected through the poverty-specific price surveys reinforce the need to examine the methodology further and to expand the scope
Chapter 9
83Research Study on Poverty-Specific Purchasing Power Parities for Selected Countries in Asia and the Pacific
and size of poverty-specific price surveys. There are several directions that the work on poverty PPPs can pursue.
Increase the Number of Countries Covered. The 2005 ICP Asia Pacific included 21 member economies of ADB. There is scope to improve this coverage through the participation of the remaining 21 ADB member economies. The poverty PPP study covered only 16 countries. It is necessary to bring other ADB member economies into the study as poverty reduction is a major goal in most of those economies.
Consider a Regional Focus within Large Countries. During the workshops for the poverty PPP study, a strong subregional influence became evident on the types of commodities consumed by the poor. This influence was stronger on the poverty PPPs than on PPPs for the 2005 ICP Asia Pacific, perhaps because the poor tend to consume more of local products than international or multinational products. A related study could examine the feasibility of implementing this work in large countries like India and Indonesia. Compilation of poverty PPPs for regions within a country would be particularly significant to the participating countries.
Integrate Poverty PPP Work with Regular ICP, CPI, and HES. In the 2005 ICP Asia Pacific, ICP PPP and poverty PPP work were treated as separate projects with a much higher priority accorded to the ICP activities. The strategy was to ensure successful completion of the 2005 ICP Asia Pacific and to produce credible estimates of PPP at the GDP level. In future rounds of the ICP, it should be possible to coordinate and closely integrate the activities of the poverty PPP and the general ICP work to make both projects cost-effective. The comparative analysis of prices from poverty-specific price surveys and the unit values from HES also indicate possible synergies in the area of compiling appropriate price data for poverty PPP compilation. If HES in different countries were harmonized, then the task of using HES data for PPP compilation would be easier.
Conduct Research on Analytical Aspects. There are a number of areas where further research on the theoretical foundations of the poverty PPP work should be undertaken. Several aspects concerning the iterative process and calibration of IPLs require
further research. During implementation, it was found that poverty PPP computations are too complex and labor-intensive. The simultaneous use of household expenditure data and PPPs in the iterative process was found to be difficult and time- consuming. Development of computer programs to automate the steps involved in implementing the iterative process would greatly benefit and also enhance the use of the methodology by the countries involved. The sensitivity analysis has shown that the results are sensitive to the use of different aggregation methods; sometimes, the differences are larger than those driven by differences in expenditure patterns.
Enhanced participation of ADB member economies in the poverty PPP study will further strengthen their statistical capacities. Conducting poverty-specific price surveys would help improve the infrastructure for price collection and facilitate price collection in rural and urban areas. Participation in the ICP, and in the poverty PPP study in particular, will help many ADB member economies improve their compilation of the CPI and help them compile CPI for the poor. Such indexes with special focus on the poor are likely to be very helpful in monitoring the effects of increasing prices—food prices in particular—on the welfare of the poorer sections of society.
The research study has achieved the major objectives identified at the outset. The first and primary goal has been to describe and implement the methodology recommended by the PAG. In the process of implementation, the study found that the results could be affected by the choice of the poverty line used as the basis for compiling expenditure share weights. Two poverty lines were used in the study, one based on an update of the 1993 poverty line of $1.08 and the other one based on the Indonesian poverty line.
The main contribution of the study is to show that poverty PPPs calculated from poverty-specific price surveys can make a difference in the estimates of the IPL. The analysis presented here establishes the viability of price surveys specifically for poverty measurement. There is room for improvement in the preparation of the item lists and product specifications and in the conduct of price surveys. With the data collected from the poverty-specific price surveys compared and contrasted with limited data available

Chapter 9
2005 International Comparison Program in Asia and the Pacific 84
in the form of unit values from HES, the plausibility of price data from poverty-specific price surveys is determined.
The second contribution of the study is the compilation of poverty PPPs using different data sets and aggregation methodologies. The results show that the conventionally used PPPs from the ICP can be improved through the implementation of the PAG methodology, which advocates the use of expenditure weights of the poor. The results also show that significantly larger differences in PPPs result from
the use of data from poverty-specific price surveys. The results reported here clearly establish the need to examine the issue of conducting poverty-specific price surveys in future rounds of the ICP.
In conclusion, the poverty-specific price survey data had a significant effect on the magnitudes of poverty PPPs. The results of the poverty PPP study will have a profound effect on the methodology used in the computation of poverty PPPs in the future, at both national and regional levels.

85
Appendix Table 1. Coverage of Basic Heading
Appendix
BH Code Description
Number of Items
Specified
Number of Items Priced/ Collected Number of Countries without
Price DataAverage Minimum Maximum1101111 Rice 6 3 1 6 01101112 Other cereals, flour and other products 10 5 0 10 21101113 Bread 2 2 1 2 01101114 Other bakery products 1 1 0 1 21101115 Pasta products 2 2 1 2 01101121 Beef and veal 1 1 0 1 31101122 Pork 1 1 0 1 51101124 Poultry 1 1 0 1 31101131 Fresh, chilled or frozen fish and seafood 5 3 0 5 11101132 Preserved or processed fish and seafood 4 3 0 4 21101141 Fresh milk 2 2 0 2 31101142 Preserved milk and other milk products 2 2 0 2 11101144 Eggs and egg-based products 2 1 1 2 01101153 Other edible oils and fats 5 2 1 4 01101161 Fresh or chilled fruit 4 3 0 4 11101171 Fresh or chilled vegetables other than potatoes 13 10 4 13 01101172 Fresh or chilled potatoes 3 2 1 3 01101173 Frozen, preserved or processed vegetables, and vegetable-
based products 2 2 0 2 21101181 Sugar 2 2 1 2 01101191 Food products n.e.c. 6 4 3 6 01101211 Coffee, tea, and cocoa 3 2 1 3 01101221 Mineral waters, soft drinks, fruit and vegetable juices 1 1 1 1 01102121 Wine 1 1 0 1 71102211 Tobacco 4 3 0 4 11102311 Narcotics 3 2 0 3 5
BH = basic heading.

Appendix
2005 International Comparison Program in Asia and the Pacific 86
BH Code Description
Number of Items
Specified
Number of Items Priced/ Collected Number of Countries without
Price DataAverage Minimum Maximum1103111 Clothing materials, other articles of clothing, and clothing
accessories 1 1 0 1 41103121 Garments 22 18 12 22 01103211 Shoes and other footwear 3 3 1 3 01104511 Electricity 1 1 1 1 01104531 Other fuels 4 2 1 4 01105111 Furniture and furnishings 2 2 1 2 01105211 Household textiles 7 5 1 7 01105311 Major household appliances whether electric or not 1 1 0 1 41105411 Glassware, tableware, and household utensils 6 6 3 6 01105521 Small tools and miscellaneous accessories 2 2 0 2 11105611 Nondurable household goods 3 3 2 3 01106111 Pharmaceutical products 1 1 1 1 01107131 Bicycles 1 1 0 1 41107311 Passenger transport by railway 1 1 0 1 91107321 Passenger transport by road 4 3 0 4 11109421 Cultural services 1 1 0 1 31109511 Newspapers, books, and stationery 3 3 2 3 01112111 Hairdressing salons and personal grooming establishments 1 1 1 1 01112121 Appliances, articles and products for personal care 4 4 4 4 01112321 Other personal effects 1 1 0 1 2
Total Number of Products 15545 Number of Basic Headings
BH = basic heading.
Appendix Table 1. Coverage of Basic Heading (continued)

Appendix
87Research Study on Poverty-Specific Purchasing Power Parities for Selected Countries in Asia and the Pacific
Appendix Table 2. Household Expenditure Surveys—Source of Expenditure Weights for the Poor
Country Survey Title Reference Year
Remarks
Bangladesh Household Income and Expenditure Survey
2005 A two-stage stratified random sampling comprising of 10,080 households from 504 rural and urban areas. Publication: Report of the Household Income and Expenditure Survey 2005.
Bhutan Living Standards Survey
2003 A nationwide survey of 4,120 households following the LSMS methodology developed by the World Bank. Publication: Bhutan Living Standard Survey 2003.
Cambodia Socio-Economic Survey
2003–2004 A nationwide representative sample of 15,000 households within 900 primary sampling units (PSU) corresponding to 867 villages. Publication: 2004 Cambodia Socio-Economic Survey (CSES 2004).
Fiji Household Income and Expenditure Survey
2002–2003 A two-stage stratified random sample comprising of households from rural and urban areas. Publication: 2002–03 Household Income and Expenditure Survey.
India National Sample Survey
2004–2005 61st Round - a quinquinial round (full survey). Publication: Nine volumes covering Consumer Expenditure in the NSS 61st Round.
Indonesia National Socio-Economic Survey (SUSENAS)
2002 Conducted in all areas in Indonesia with sample households from the urban and rural areas.The sample design for urban area is a two-step sample design while a three-step sample design was used in rural areas. Publication: National Socio-Economic Survey (SUSENAS) 2002
Lao People’s Democratic Republic
Expenditure and Consumption Survey
2002–2003 A two-stage sampling scheme comprising 49,970 persons in 8,092 households from 540 urban and rural areas. Publication: Lao Expenditure and Consumption Survey 2002/2003.
Malaysia Household Expenditure Survey
2004–2005 A stratified multi-stage sampling is used. Stratification is by state classified by urban/rural households; multi-stage refers to the selection of enumeration blocks (EBs) in each stratum and selection of living quarters (LQs) within the selected EBs. Publication: Report on Household Expenditure Survey, Malaysia 2004/05.
Maldives Household Income and Expenditure Survey
2002–2003 A random sample of households was drawn from each strata comprising the island of Male and five development regions.
Mongolia Household Income and Expenditure Survey
2005 The survey covered a total of 11,232 households in both urban and rural areas. Publication: Main report of Household Income and Expenditure Survey/Living Standards Measurement Survey.
Nepal Living Standards Survey
2003 The survey followed the Living Standards Measurement Survey (LSMS) methodology developed at the World Bank. It used a two-stage stratified sampling scheme to select a nationally representative sample. NLSS II enumerated 3,912 households from 326 PSUs in the cross-sectional sample. Publication: Nepal Living Standards Survey 2003/04.
Pakistan Household Integrated Economic Survey
2001–2002 A two-stage stratified sample design was adopted for this survey comprising households from both urban and rural areas. Publication: Pakistan Integrated Household Survey 2001–02 (Round IV).
Philippines Family Income and Expenditure Survey
2003 A nationwide survey of households using area sample design. The survey employed stratified multi-stage sampling with the 17 regions of the country as the primary strata. Publication: 2003 Family Income and Expenditure Survey.
Sri Lanka Household Income and Expenditure Survey
2001–2002 Employed a two-stage stratified random sampling of urban and rural areas and estate sectors. Publication: 2002 Household Income and Expenditure Survey Final Report.
Thailand Household Socio-Economic Survey
2002 A stratified two-stage sampling was adopted for the survey. The primary sampling units were blocks for municipal areas and villages for nonmunicipal areas. The secondary sampling units were private households. Publication: Report of the Household Socio-Economic Survey.
Viet Nam Living Standards Survey
2004 Employed a multi-stage sampling procedure with households as the ultimate sampling unit and regions as domains. Publication: Result of the Survey on Household Living Standards 2004 and Database of the Household Living Standards Survey 2004.

Appendix
2005 International Comparison Program in Asia and the Pacific 88
Appendix Table 3. Poverty-Specific Price Survey Product List
Product Name Quality Quantity UOM Package Other Specifications Outlet
Coarse #6 - parboiled, 15–50% broken
Coarse, 15-50% broken (medium quality)
1 kilo Loose Parboiled Open markets; small local shops; weekly market for rural
Coarse rice, ordinary, loose (a) (subsidized)
Coarse, ordinary 1 kilo Loose Subsidized; not parboiled Open markets; small local shops; weekly market for rural
Coarse rice, ordinary, loose (b) (not subsidized)
Coarse, ordinary 1 kilo Loose Not subsidized; not parboiled
Open markets; small local shops; weekly market for rural
Coarse rice, 20% - 50% broken, not parboiled
Coarse, 20-50% broken (medium quality)
1 kilo Loose Not parboiled Open markets; small local shops; weekly market for rural
Coarse, >50% broken, not parboiled
Coarse, >50% broken
1 kilo Loose Not parboiled Open markets; small local shops; weekly market for rural
Glutinous rice Low-medium 1 kilo Loose Open markets; small local shops; weekly market for rural
Bajra flour Low 1 kilo Loose Open markets; small local shops; weekly market for rural
Beaten rice (chira) Low 500 grams Loose Open markets; small local shops; weekly market for rural
Dahl - kasari Low-medium 250 grams Loose Open markets; small local shops; weekly market for rural
Dahl - musur/lentil Low-medium 250 grams Loose Open markets; small local shops; weekly market for rural
Dahl - split peas Low-medium 250 grams Loose Open markets; small local shops; weekly market for rural
Maize flour Low-medium 1 kilo Loose Open markets; small local shops; weekly market for rural
Sawtu Low-medium 1 kilo Loose Open markets; small local shops; weekly market for rural
Wheat flour - loose
Low-medium 1 kilo Loose Open markets; small local shops; weekly market for rural
Wholemeal flour (atta) (not subsidized)
Low-medium 1 kilo Loose Open markets; small local shops; weekly market for rural
Wholemeal flour (atta) (subsidized)
Low-medium 1 kilo Loose Open markets; small local shops; weekly market for rural
White bread or loaf bread, sliced/unsliced - prepackaged or loose
Low-medium 400 grams Loose Cheap kind of bread Local shop/bakery
Roll or bun - loose Low-medium 50 grams Loose Local shop/bakeryBiscuits Low quality;
broken200 grams Loose or
pre-packagedTypical source
Dried noodles 200 grams Packed Cheaper brand Typical sourceInstant noodles 75 grams Packed Cheaper brand Typical sourceBeef, nonspecific cuts
Low 250 grams Loose Open market; wet market; small retail shop

Appendix
89Research Study on Poverty-Specific Purchasing Power Parities for Selected Countries in Asia and the Pacific
Appendix Table 3. Poverty-Specific Price Survey Product List ( )
Product Name Quality Quantity UOM Package Other Specifications Outlet
Pork - nonspecific cut
Low 250 grams Loose Open market; wet market; small retail shop
Chicken, nonspecific cuts
Low 250 grams Loose Open market; wet market; small retail shop
Catfish Low-medium 500 grams Loose 20-25 cms long; cheaper kind
Wet market; open market
Mackerel Low-medium 500 grams Loose Whole or pieces/slices Wet market; open marketRuai/carp Low-medium 500 grams Loose Whole or pieces/slices Wet market; open marketSmall fresh fish Low-medium 500 grams Loose Whole or pieces/slices Wet market; open marketTilapia Low-medium 500 grams Loose Whole or pieces/slices Wet market; open marketCanned sardines 175 grams Tin can Cheaper brand Typical source; local shopsDried fish Medium 250 grams Loose Cheaper kind of fish Typical sourceDried shrimp Medium 100 grams Loose With broken pieces Typical sourceSmoked fish Medium 250 grams Loose Whole or pieces/slices Typical source; local shopsFresh milk - not pasteurized (buffalo or cow)
250 ml Loose Typical source; local shops
Fresh milk - pasteurized
250 ml Loose Typical source
Powdered milk - box
250 grams Box Small local shops
Condensed milk 250 grams Tin can Cheaper brand Small local shopsChicken egg - 1 1 piece Loose Approximately 50 g each,
cheaper kind of eggOpen markets; small local shops
Salted duck egg 1 piece Loose Open markets; small local shopsCoconut oil Medium 250 ml Loose Small local shopsCooking oil - vegetable (e.g. soya)
Medium 250 ml Loose Small local shops
Mustard oil - unrefined
Medium 250 ml Loose Small local shops
Palm oil Medium 250 ml Loose Small local shopsPork fat 250 ml Loose Open market Banana - yellow (medium size)
Low quality; a bit overripe
1 piece Loose Variety commonly consumed by the poor
Open market; weekly market; local shop
Coconut 1 piece Loose Open market; weekly market; local shop
Lemon Low quality; a bit overripe
1 piece Loose Open market; weekly market; local shop
Pawpaw/papaya Low quality; a bit overripe
1 piece Loose Open market; weekly market; local shop
Arum Low 1 piece Loose Open market; weekly market; local shop
Cabbage Low 1 piece Loose Open market; weekly market; local shop
Chilli - fresh green/red
Low 100 grams Loose Cheaper variety Open market; weekly market; local shop
Eggplant/brinjal Low 500 grams Loose Open market; weekly market; local shop

Appendix
2005 International Comparison Program in Asia and the Pacific 90
Product Name Quality Quantity UOM Package Other Specifications Outlet
Garlic Low 500 grams Loose Open market; weekly market; local shop
Ginger Low 500 grams Loose Open market; weekly market; local shop
Onion Low 500 grams Loose Open market; weekly market; local shop
Peanut Low 100 grams Loose Open market; weekly market; local shop
Pumpkin Low 500 grams Loose Open market; weekly market; local shop
Raddish - white Low 500 grams Loose Open market; weekly market; local shop
Spinach Low 250 grams Loose Open market; weekly market; local shop
Maize - corn on cob
Low 1 piece Loose Open market; weekly market; local shop
Water spinach Low 100 grams Loose Open market; weekly market; local shop
Cassava Low 500 grams Loose Open market; weekly market; local shop
Potato Medium 500 grams Loose Open market; weekly market; local shop
Sweet potato Low 500 grams Loose Cheaper variety Open market; weekly market; local shop
Chillis - dried (red) Low 50 grams Loose Open market; weekly market; local shop
Brown sugar Medium refined 100 grams Loose or locally packed (not branded)
Small local shops
White sugar 100 grams Loose or locally packed (not branded)
Small local shops
Chilli powder - red Medium 50 grams Loose or locally packed (not branded)
Small local shops
Fish sauce Low 500 ml bottle Cheapest brand and packaging
Typical source
MSG (monosodium glutamate)
100 grams pack Cheapest brand Typical source
Salt 1 kilo Iodized Cheapest brand Typical sourceSoy sauce 250 ml bottle Cheapest brand and
packagingTypical source
Tamarind dried (used for cooking)
Medium 100 grams Loose Typical source
Turmeric powder Medium 50 grams Loose or locally packed (not branded)
Typical source
Appendix Table 3. Poverty-Specific Price Survey Product List (continued)

Appendix
91Research Study on Poverty-Specific Purchasing Power Parities for Selected Countries in Asia and the Pacific
Appendix Table 3. Poverty-Specific Price Survey Product List (continued)
Product Name Quality Quantity UOM Package Other Specifications Outlet
Coffee powder Local variety, cheap brand
100 grams Loose or locally packed (not branded)
Not imported Typical source
Tea - dust Medium 50 grams Loose or locally packed (not branded)
Typical source
Tea leaves packaged
Low-medium 100 grams Loose or cheap package
Typical source
Soft drink (local) 375 ml Local package
Typical source
Native wine 1 litre Fermented, 40–45% alcohol
Common local wine Typical source
Bidi 1 piece Loose Local brand Typical sourceChewing tobacco 10 grams Pre-packaged Local brand Typical sourceCigarettes 1 stick Loose Local or cheapest brand Typical sourceTobacco leaves, loose
10 pieces Loose Typical source
Betel leaves Low-medium 10 pieces Loose Not prepared Typical sourceBetel nut - dried (aracanut/arecanut)
Medium 50 grams Loose, not prepacked
Cheap local brand Typical source
Pan masala Low-medium 5 grams Pre-packaged Typical sourceSalwar kameez or shirt fabric - cotton-polyester
Low 1 meter Width is 45 inches; around 75% polyester
Typical source
Bra - basic Low 1 piece Typical sourceSaree (5.5m) - cotton (50–60 thread count)
Medium 1 piece Typical source
Saree (5.5m) - synthetic
Medium 1 piece 100% synthetic material Typical source
Kurta/sarong women’s
Medium 1 piece Polyester or cheap cotton Typical source
Sarong or lungi - men’s (30–40 thread count)
Medium 1 piece Polyester or cheap cotton Typical source
Shirt (casual) - men’s
Medium quality; mostly polyester
1 piece Local or cheapest brand Typical source
Shirt (dress) - boys’
Low; mostly polyester
1 piece Typical source
Shorts - boys’ Low quality; mostly polyester or cheap/coarse cotton
1 piece Garterized waist; about knee-length; local or cheapest brand
Typical source
Shorts - men’s Low quality; mostly polyester or cheap/coarse cotton
1 piece Garterized waist; about knee-length; local or cheapest brand
Typical source

Appendix
2005 International Comparison Program in Asia and the Pacific 92
Appendix Table 3. Poverty-Specific Price Survey Product List (continued)
Product Name Quality Quantity UOM Package Other Specifications Outlet
Skirt - girls’ Low quality; mostly polyester or cheap/coarse cotton
1 piece Knee-length; local or cheapest brand
Typical source
Skirt - women’s Low quality; mostly polyester or cheap/coarse cotton
1 piece Knee-length; local or cheapest brand
Typical source
T-Shirt - boys’ Low quality; mostly polyester or cheap/coarse cotton
1 piece Solid color; local or cheapest brand
Typical source
T-Shirt - girls’ Low quality; mostly polyester or cheap/coarse cotton
1 piece Solid color; local or cheapest brand
Typical source
T-shirt - men’s Low quality; mostly polyester or cheap/coarse cotton
1 piece Solid color; local or cheapest brand
Typical source
T-shirt - women’s Low quality; mostly polyester or cheap/coarse cotton
1 piece Solid color; local or cheapest brand
Typical source
Underwear briefs - boys’
Low quality; mostly polyester or cheap/coarse cotton
1 piece Local or cheapest brand Typical source
Underwear briefs - girls’
Low quality; mostly polyester or cheap/coarse cotton
1 piece Local or cheapest brand Typical source
Underwear/briefs - men’s
Low quality; mostly polyester or cheap/coarse cotton
1 piece Local or cheapest brand Typical source
Underwear/panties - women’s
Low quality; mostly polyester or cheap/coarse cotton
1 piece Local or cheapest brand Typical source
Women’s headgear (muslim)
Low quality; mostly polyester or cheap/coarse cotton
1 piece Local or cheapest brand Typical source

Appendix
93Research Study on Poverty-Specific Purchasing Power Parities for Selected Countries in Asia and the Pacific
Appendix Table 3. Poverty-Specific Price Survey Product List (continued)
Product Name Quality Quantity UOM Package Other Specifications Outlet
Women’s house dress (daster)
Low quality; mostly polyester or cheap/coarse cotton
1 piece Local or cheapest brand Typical source
Girls’ house dress (daster)
Medium quality; mostly polyester
1 piece Local or cheapest brand Typical source
Sandals - boys’ Low 1 piece One pair Rubber; local or cheapest brand
Typical source
Sandals - girls’ Low 1 piece One pair Rubber; local or cheapest brand
Typical source
Sandals or slippers, plastic or rubber, men/women
Low 1 piece One pair Rubber; local or cheapest brand
Typical source
Electricity - price per kilowatt hour (lowest slab)
1 kwh Household rate, not industrial
Charcoal 250 grams Loose or locally packed (not branded)
Small local shop
Coal 5-10 kilo Typical sourceFirewood 5 kilo Dry wood, typical source Typical sourceKerosene (open market)
1 litre Typical source
Mat natural material
Low 1 piece 100x200cm Typical source
Plastic moulded stacking chair
Medium 1 piece Typical source
Bath towel Cheap quality 1 piece 100x60cm Typical sourceBlanket (woolen synthetic)
Cheap quality 1 piece Size: Single Typical source
Cotton/polyester blanket
Cheap quality 1 piece Size: single Typical source
Cotton/polyester sheet, medium thread count
Cheap quality 1 piece Size: single Typical source
Gamcha - cotton (40–50 thread count)
Cheap quality 1 piece Normal towel size Typical source
Mosquito net Cheap quality 1 piece Size: Single Typical sourcePillow Cheap quality 1 piece Size: regular Typical sourceKerosene stove Cheap quality 1 piece One burner Typical sourceFrying pan 1 piece Aluminum, thin; 8 inches
diameterTypical source
Medium-size pot 1 piece Aluminum, thin; 2 liters capacity
Typical source
Plate (plastic) Cheap quality 1 piece 9 inches in diameter Typical sourcePlate (ceramics) Cheap quality 1 piece 9 inches in diameter Typical source

Appendix
2005 International Comparison Program in Asia and the Pacific 94
Appendix Table 3. Poverty-Specific Price Survey Product List (continued)
Product Name Quality Quantity UOM Package Other Specifications Outlet
Single drinking tumbler (plastic)
Cheap quality 1 piece 250 ml capacity Typical source
Small kitchen knife Cheap quality 1 piece Blade: 6 inches long Typical sourceBattery (AA - Eveready, dry cell)
1 pack 2 pieces in a pack
Cheap brand Typical source
Regular bulb (40 watt)
1 piece Cheap brand Typical source
House candles 1 piece Loose Size: 2cm diameter, 10–15cm height
Typical source
Laundry detergent Medium 100 grams Bar or powder
Could be part of 1 long bar Typical source
Wooden matches Medium 1 box Match box Box contains 50 matchsticks
Typical source
Paracetamol 500 mg per tablet
10 piece Tablet Typical source
Normal basic bicycle
Cheap quality 1 piece Local brand Typical source
Intra-city train fare (short distance)
No airconditioning
1 fare Adult; minimum distance; no airconditioning
Adult bus fare (long distance), no airconditioning
1 fare Adult; 300km distance
Adult bus fare (short distance) no airconditioning
1 fare Adult 100km distance
Intra-city adult bus fare (with airconditioning)
1 fare Minimum fare
Intra-city adult bus fare (no airconditioning)
1 fare Minimum fare
Admission to movies
Lowest class 1 ticket Adult; new film Moviehouse
Exercise book 1 piece Stapled cover (soft), (120 pages)
Typical source
Fixed ball point pen
Medium 1 piece Typical source
Pencil Medium 1 piece With eraser on other end Typical sourceMen’s basic haircut - street-side
1 service Adult Local barber
Adult toothbrush Cheap quality 1 piece Typical sourceBasic body soap 1 piece Cheap brand Typical sourceComb - plastic Cheap quality 1 piece Men’s hair comb Typical sourceToothpaste Cheap quality 1 piece 50 grams Typical sourceUmbrella Low 1 piece Cheapest brand Typical source
95
Bibliography and ReferencesADB. 2004. Key Indicators 2004. Asian Development
Bank, Manila. ———. 2007a. Key Indicators 2007. Asian
Development Bank, Manila. ———. 2007b. 2005 International Comparison
Program in Asia and the Pacific Purchasing Power Parities and Real Expenditures. Asian Development Bank, Manila.
Attanasio, O. and C. Frayne. 2006. “Do The Poor Pay More?” Paper presented at the 8th BREAD Conference on Development Economics, Bureau for Research and Economic Analysis of Development, Ithaca, New York.
Balk, B. 1995. “Axiomatic Price Index Theory: A Survey.” International Statistical Review 63(1):69–93.
Chen, S., and M. Ravallion. 2001. “How Did the World’s Poorest Fare in the 1990s?” Review of Income and Wealth 47(September):283–300.
———. 2004. “How Have the World’s Poorest Fared since the Early 1980s?” World Bank Research Observer 19(2):141–69.
Deaton, A. 2000. Counting the World’s Poor: Problems and Possible Solutions. Working Papers 212, Woodrow Wilson School of Public and International Affairs, Research Program in Development Studies, Princeton University, Massachusetts.
———. 2004. Measuring Poverty. Working Papers 170, Woodrow Wilson School of Public and International Affairs, Research Program in Development Studies, Princeton University, Massachusetts.
———. 2006. “Purchasing Power Parity Exchange Rates for the Poor: Using Household Surveys to Construct PPPs.” Research Program in Development Studies, Princeton University. Processed.
———. 2007. Income, Aging, Health and Wellbeing Around the World: Evidence from the Gallup World Poll. NBER Working Papers 13317, National Bureau of Economic Research, Inc, Cambridge, Massachusetts.
Diewart, W. E. 1988. The Early History of Price Index Research. NBER Working Paper 2713, National Bureau of Economic Research. Cambridge, Massachusetts.
Diewart, W. E. 2005. “Weighted Country-Product Dummy Variable Regressions and Index Number Formulae.” Review of Income and Wealth 51(4):561–70.
Dowrick, S., and M. Akmal. 2005. “Contradictory Trends in Global Income Inequality: A Tale of Two Biases.” Review of Income and Wealth 51(2):201–29.
Dupriez, O. 2007. “Building a Household Consumption Database for the Calculation of Poverty PPPs, Technical Note.” Available: http://go.worldbank.org/4YG7I5RGT0.
Fabricant, S. J., C. W. Kamara, and A. Mills. 1999. “Why the Poor Pay More: Household Curative Expenditures in Rural Sierra Leone.” International Journal of Health Planning and Management 14:179.
Greene, W. H. 2002. Econometric Analysis. 5th ed. Upper Saddle River, NJ: Prentice Hall.
International Monetary Fund. 2007. International Financial Statistics. Washinton, D. C.
Kakwani, N., and H. H. Son. Measuring the Impact of Price Changes on Poverty. International Poverty Centre UNDP Working Paper No. 33. Available: http://ssrn.com/abstract=965874.
Kravis, I. B., A. Heston, and R. Summers. 1982. World Product and Income – International Comparisons of Real Gross Product. Baltimore and London: Johns Hopkins University Press.
Maddison, A. 2001. The World Economy: A Millennial Perspective. Published by the Academic Foundation under arrangement with Organisation for Economic Co-Operation and Development.
———. 2007. Contours of the World Economy I-2030 AD: Essays in Macro-Economic History. Oxford: Oxford University Press.
Musgrove, P., and O. Galindo. 1988. “Do the Poor Pay More? Retail Food Prizes in Northeast

2005 International Comparison Program in Asia and the Pacific 96
Bibliography and References
Brazil.” Economic Development and Cultural Change 37:91–109.
O’Donnell, C. J., and D. S. P. Rao. 2007. “Predicting Expenditure Shares for Computing PPP Exchange Rates.” Available: http://go.worldbank.org/4YG7I5RGT0.
Pradhan, M. et al. 2001. “Eating Like Which “Joneses”? An Iterative Solution to the Choice of a Poverty Line “Reference Group”.” Review of Income and Wealth 47(December):473–87.
Prasada Rao, D. S. 1990. “A System of Log-Change Index Numbers for Multilateral Comparisons.” In J. Salazar-Carrillo and D. S. Prasada Rao, eds., Comparisons of Prices and Real Products in Latin America, Contributions to Economic Analysis Series. Amsterdam: North-Holland Publishing Company.
———. 1995. On the Equivalence of the Generalized Country-Product-Dummy (CPD) Method and the Rao-System for Multilateral Comparisons. Working Paper No. 5, Centre for International Comparisons, University of Pennsylvania, Philadelphia.
———. 2000. “Price Heterogeneity and ‘Real’ Inequality: A Case-study of Prices and Poverty in Rural South India.” Review of Income and Wealth 46:201–12.
———. 2001. “Weighted EKS and Generalised CPD Methods for Aggregation at Basic Heading Level and above Basic Heading Level.” Paper presented at the Joint World Bank-OECD Seminar on Purchasing Power Parities: Real Advances in Methods and Applications, 30 January–1 February 2001, Washington, DC.
———. 2004. The Country-Product-Dummy Method: A Stochastic Approach to the Computation of Purchasing Power Parities in the ICP. CEPA Working Papers Series WP032004, School of Economics, University of Queensland, Australia.
———. 2005. “On the Equivalence of Weighted Country-Product-Dummy (CPD) Method and the Rao-system for Multilateral Price Comparisons.” Review of Income and Wealth 51(4):571–80.
Prasada Rao, D. S. and M. P. Timmer. 2003. “Purchasing Power Parities for Industry Comparisons Using Weighted Elteto-Koves-Szulc (EKS) Methods.” Review of Income and Wealth 49(4, December):491–511.
Ravallion, M. 2004. “Monitoring Progress Against Global Poverty.” International Poverty Center, UNDP. Available: http://www.undp-povertycentre.org/pub/IPCPovertyInFocus4.pdf.
Ravallion, M., and S. Chen. 2007. Absolute Poverty Measures for the Developing World, 1981-2004. Policy Research Working Paper Series 4211, The World Bank, Washington, DC.
Reddy S., and T. Pogge. 2003. How Not to Count the Poor. Columbia University, New York. Available: http://www.socialanalysis.org.
Ruoen, R., and C. Kai. 1996. China’s GDP in U.S. Dollars based on Purchasing Power Parity, Volume 1. Policy Research Working Paper WPS 1415, The World Bank, Washington, DC. Available: http://go.worldbank.org/6FTFD8OHC0.
Sangraula, P., S. Chen, and M. Ravallion. 2007. New Evidence on the Urbanization of Global Poverty. Policy Research Working Paper Series 4199, The World Bank, Washington, DC.
Summers, R., and A. Heston. 1991. “The Penn World Table (Mark 5): An Expanded Set of International Comparisons, 1958-1988.” Quarterly Journal of Economics 106(2):327–68.
World Bank. 1990. World Development Report 1990. New York: Oxford University Press for the World Bank.
———. 2007. ICP 2003–2006 Handbook. Washington, DC. Avalable: http://go.worldbank.org/MW520NNFK0.

Research Study on
2005 International Comparison Program in Asia and the Pacific
for Selected Countries in Asia and the Pacific
POVERTY-SPECIFICPURCHASING POWER PARITIES
About the Research Study on Poverty-Specific Purchasing Power Parities for Selected Countries in Asia and the Pacific
The Research Study on Poverty-Specific Purchasing Power Parities for Selected Countries in Asia and the Pacific is a methodological research for compiling purchasing power parities (PPP) for measuring poverty in the region. The study covers 16 of the 23 economies participating in the 2005 International Comparison Program in Asia and the Pacific. It presents a detailed account of the activities undertaken to estimate PPPs using the recommended methodology of the Poverty Advisory Group of the World Bank, as well as alternative PPPs derived from poverty-specific price surveys.
About the Asian Development Bank
ADB’s vision is an Asia and Pacific region free of poverty. Its mission is to help its developing member countries substantially reduce poverty and improve the quality of life of their people. Despite the region’s many successes, it remains home to two thirds of the world’s poor. Nearly 1.7 billion people in the region live on $2 or less a day. ADB is committed to reducing poverty through inclusive economic growth, environmentally sustainable growth, and regional integration.
Based in Manila, ADB is owned by 67 members, including 48 from the region. Its main instruments for helping its developing member countries are policy dialogue, loans, equity investments, guarantees, grants, and technical assistance. In 2007, it approved $10.1 billion of loans, $673 million of grant projects, and technical assistance amounting to $243 million.
Asian Development Bank6 ADB Avenue, Mandaluyong City1550 Metro Manila, Philippineswww.adb.org/economicsPublication Stock No. 020408 Printed in the Philippines
9 7 8 9 7 1 5 6 1 6 5 9 1
ISBN 971561659- 3
Research Study on Poverty-SPecific P
urchaSing Pow
er ParitieS for Selected Countries in Asia and the Pacific