
Oxygen, Hydrogen and Carbon Isotopes - UC Santa Cruzapaytan/290A_Winter2014/pdfs/290A... · Oxygen,...
66
Oxygen, Hydrogen and Carbon Isotopes Fresh water - Rain, Lakes, Groundwater, Ice Plants – Leaves and roots (also specific compounds) Animals – bones and tissue Seawater – Carbonate – CaCO 3 (other minerals)
Transcript of Oxygen, Hydrogen and Carbon Isotopes - UC Santa Cruzapaytan/290A_Winter2014/pdfs/290A... · Oxygen,...

Oxygen, Hydrogen and Carbon Isotopes
Fresh water -
Rain, Lakes, Groundwater, Ice
Plants –
Leaves and roots (also specific compounds)
Animals –
bones and tissue
Seawater –
Carbonate –
CaCO3 (other minerals)

Isotope Abundances


Hydrogen isotopes (δD)Two stable isotopes of Hydrogen. 1H and 2H (Deuterium, “D”.) Expressed in ‰
notation as:
δD = [(2H/1H) sample –
(2H/1H) standard(SMOW)] x1000(2H/1H) standard(SMOW)
-
Big
relative mass difference so big fractionations imposed by environmental and biological processes.
Oxygen isotopes (δ18O)Three stable isotopes of O; we mostly care about 16O and 18O
Expressed in ‰
notation as:
δ18O = [18O/16O sample –
18O/16O standard(SMOW) ] x100018O/16O standard(SMOW)
-
Smaller relative mass difference so smaller fractionations imposed by environmental and biological processes.


Effects of latitude, aridity, altitude and continentality
on the hydrogen isotope composition of
precipitation
can be clearly seen. [reasons for variation are Temperature and Rainout]
Precipitation δD
Oxygen and Hydrogen in Precipitation

Global meteoric water line (GMWL)
δD = 8 δ18O +10
8 represents the ratio of the fractionation factors between D/H and 18O/16O.
Mostly Equilibrium
fractionation, but effect
of Kinetic fractionation
drags line off the origin…

Water Sources –
groundwater mixing, storm sources and history
Evaporation in lakes and reservoirs
Changes in the hydrological cycle over time
Changes in sea level
Peruvian stalagmite calcite δ18O recordlinking northern and southern high latitudeice core records (Kammer* et al., 2012)

Lake Chichancanab
and Mayan Collapse

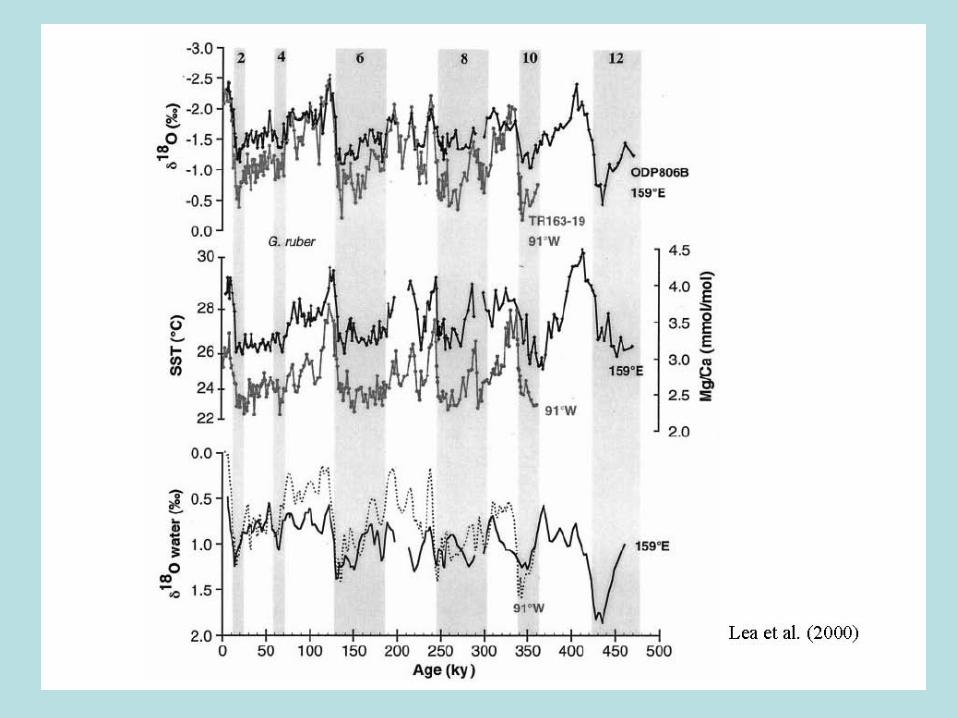
Oxygen isotope fluctuations in seawater as recorded in marine sediments can be indicative of ice volume and thus sea level changes. Temperature effects will be included as well. Indicative of exchange among water reservoirs.
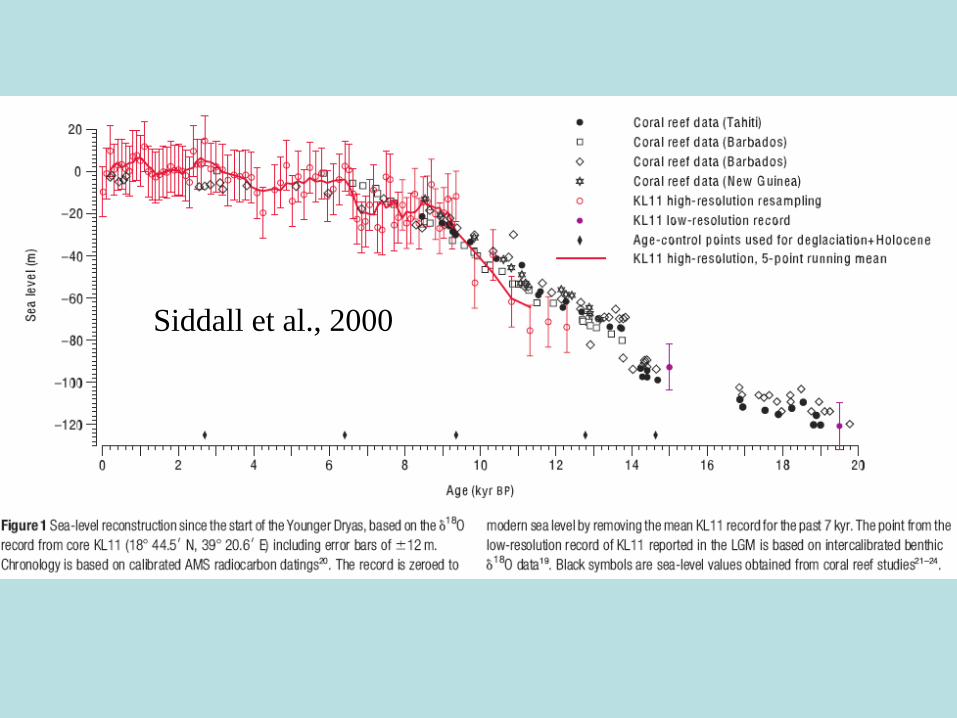
Siddall et al., 2000


Zachos
et al., 2001


Plants, Animals, Soil Organic Matter
1.
Trace past climates/precipitation /environmentAssume plants take their O and H from the environment around them, as environmental changes influence the δ18O and δD of meteoric water we can examine fossil plants to reconstruct ancient climates/precipitation patterns [Compound-specific particularly].
δD and δ18O in meteoric water.Influenced by climate,latitude, altitude etc…
Fractionation?
Fixation of δD and δ18O into plant tissue.
Analyze plantδD and δ18O
Reconstructpast climate,
elevation etc…
Regional precipitation patterns, Latitude, altitude, continentality, intensity, source. -Relative humidity/ aridity-Seasonality-Temperature

2. Investigate the biology of the plant. Determine what type of plants we are looking at (C3, C4, CAM etc…).
Can’t always tell just by using δ13C values…
Different fractionations in C3, C4 and CAM plants…
Determine biosynthetic pathway of the plant
Analyse
celluloseδD and δ18O
Applications for modern and fossil plantsMarine and terrestrial organic matterPetroleum sourcesPlant evolution

Sternberg, (1989)
C4 = low‐med
δD and higher
δ18O values
CAM = high δD
and low‐med
δ18O values
C3 = lower δD
and lower δ18O
values
δD and δ18O values
from plant cellulose
of
different plants
growing in same site
in Texas.
Same area, therefore
same input of soil
δD, therefore same
baseline.

3. Tracing water sources for plantsAre different plants in the same environment drinking from different
pools of water in the soil?
δA
δB
δP = δAδP = fδB + fδA δP = δB
Evapotranspiration Farquhar et al., (1989)

18O in fluids (body water), tissues (hair, feather) and biological minerals (focus here on apatite, not calcium carbonate)
18O in body water most tissues is 18O- enriched relative to environmental water
•
Oxygen in PO4
and CO3
rapidly equilibrates with body water and temperature (carbonic anhydrase, pyrophosphatase
and other
enzymes)

Major Oxygen FluxesIN•
Ingested water: drinking water and water in food (not fractionated)
•
Atmosphere O2 (globally constant value of +20‰, fractionated)
•
Food dry matter
OUT•
Respired CO2 (fractionated)
•
Water in urine and feces•
Water lost in exhalation, sweat, evaporation (fractionated)
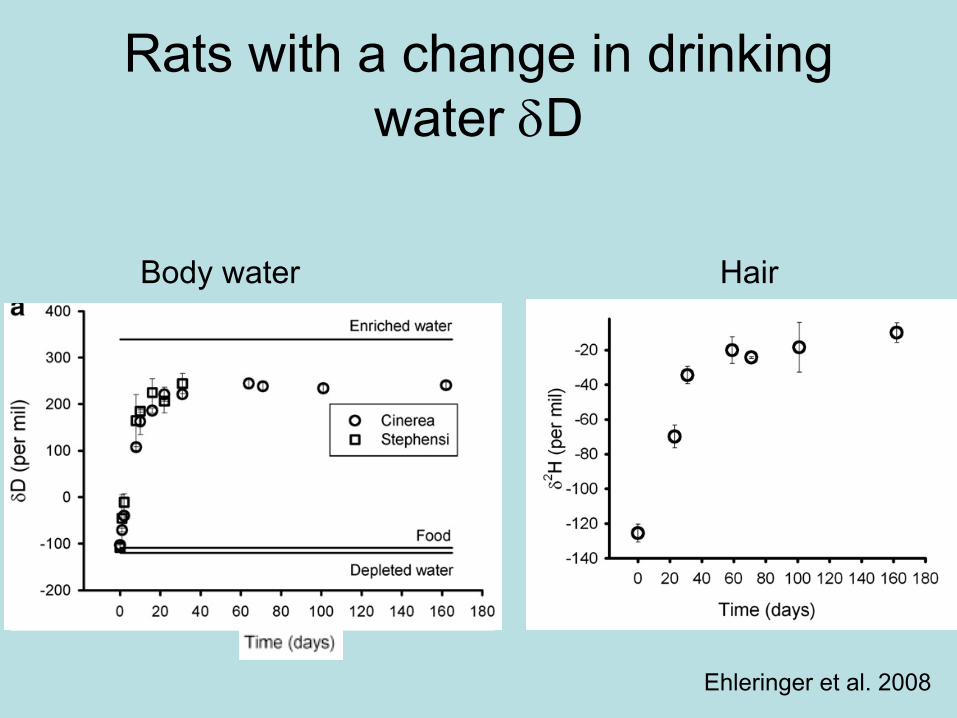
Rats with a change in drinking water D
Body water Hair
Ehleringer
et al. 2008

Geographic patterns in human hair D
Ehleringer
et al. 2008
• Tap water D varies• Diet constant: Dd
-115‰
27% hair H from drinking water85% variability explained

Changes in hair 18O, D with “migration”
Ehleringer
et al. 2008

Apatite 18O18O depends on the temperature and body fluid 18O value from which the biomineral precipitates
•
For homeotherms
(mammals, birds), there is a constant temperature dependent difference constant offset between 18O of body water and PO4
(~18‰), between body water
•
For heterotherms, as temp. , bioapatite
18O values
Changes in temperature, Habitat allocation, Migration (salmon), Seasonality

STABLE ISOTOPE COMPOSITIONS OF BIOLOGICAL APATITE; DINOSAUR THERMOREGULATION.
( M.J. KOHN, T.E. CERLING)
Ectotherms maintain uniform temperature only in core areasEctotherms = Highly variable
Endotherms
= Less variable


The black numbers indicate how much carbon is stored in various reservoirs, in billions of tons (GigaTons, circa 2004). The purple numbers indicate how much carbon moves between reservoirs each year. The sediments, as defined in this diagram, do not include the ~70 million GtC
of carbonate rock and kerogen.

On geologic times scales, the carbon cycle model can be represented by 3 reservoirs, sedimentarycarbonate, sedimentary organic carbon, and the mantle, as well as fluxes between these reservoirs and the oceans and atmosphere.

When more C is removed into the reduced organic C reservoir residual C in the ocean and carbonates becomes enriched in 13C (heavy), atmospheric CO2
is lower and O2
is higher (less consumed for oxidation).
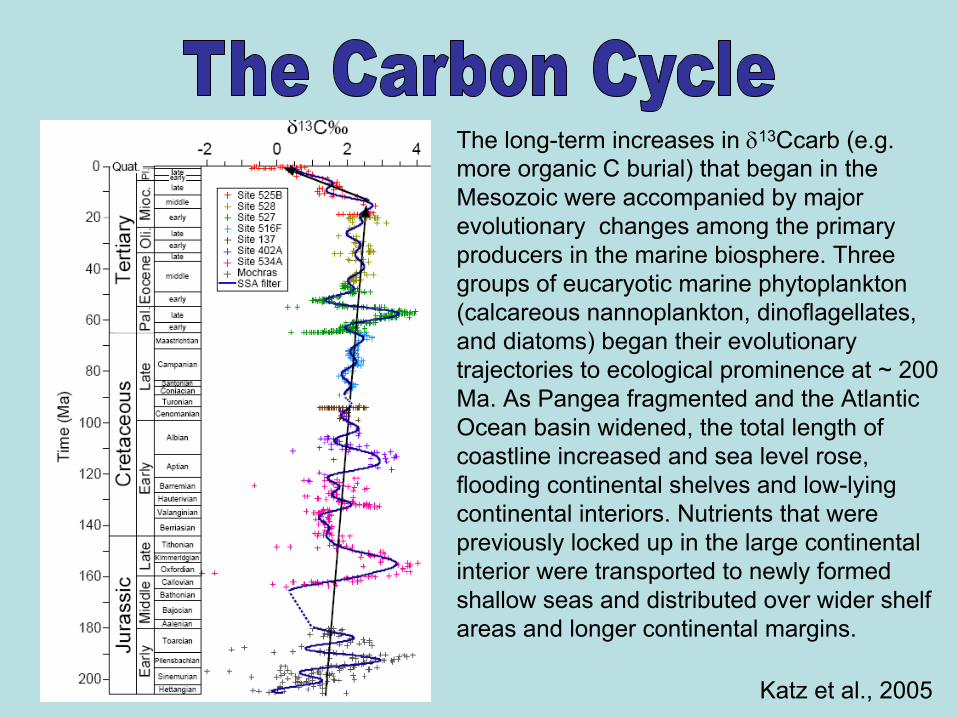
The long-term increases in 13Ccarb (e.g. more organic C burial) that began in the Mesozoic were accompanied by major evolutionary changes among the primary producers in the marine biosphere. Threegroups of eucaryotic
marine phytoplankton (calcareous nannoplankton, dinoflagellates, and diatoms) began their evolutionary trajectories to ecological prominence at ~ 200 Ma. As Pangea
fragmented and the Atlantic Ocean basin widened, the total length of coastline increased and sea level rose, flooding continental shelves and low-lyingcontinental interiors. Nutrients that were previously locked up in the large continental interior were transported to newly formed shallow seas and distributed over wider shelf areas and longer continental margins.
Katz et al., 2005

The decline since the late Miocene in addition to changes in ocean circulation could be related to the evolution of C4 plants (less fractionation in organic C burial).
Perturbations in the global C cycle.

McInerney
and Wing 2011

Cerling
et al. 97Nature
δ13C
Warm season grassArid adapted dicots
Cool season grass most trees and shrubs

Food Sources for Coastal Marine Animalsδ13C values of consumers can be
used to indicate food source
Fish:Offshore = primarily planktonic food sourceSeagrass
= some primarily
planktonic, some primarily benthic
Invertebrates:Offshore = primarily planktonic food sourceSeagrass
= primarily benthic food
source [France, 1995]

Tracing organic matter sources and carbon burial in mangrove sediments over the past 160 years (Gonneea
et al., 2004).

C3 -
C4 balance varies with climate
Tieszen
et al.
Ecol. Appl. (1997) Tieszen
et al. Oecologia
(1979)

δ13C varies with environment within C3 plants

drought
normal
Diefendorf
et al. (2010) PNAS
Light matters too

QuantumYield
(moles C fixed perphoton absorbed)
Temperature (°C)3 6 9 12 15 18 21 24 27 30
C4 plants
C3 plants
Today (360 ppm)
LGM (180 ppm)
With equal water higher CO2
is better for C3 plants but the temperature sensitivity changes
At the LGM, was there less C4 biomass (because of lower temperatures) or more C4 biomass (because of lower pCO2)?
Ehleringer
et al. 1997 Oecologia
C3 decreases in efficiency because of Photorespiration

Great Plains ecosystems
Use isotopes in animals and soils to track CUse isotopes in animals and soils to track C33
--toto--CC44
balancebalance

AverageMeasured
Enamelδ13C
Enamel δ13C value predicted from local vegetation
For C you are what you eat
Bison isotope values track C3
-to-C4balance of grasslands
-12
-10
-8
-6
-4
-2
0
-14 -12 -10 -8 -6 -4 -2 0
Y = -1.90 +0.78XR = 0.98
CA OKMT SDND WYNE

%C4
Grass Should Increase in the LGM Based on Temperature Model

Holocene -Late Glacial
Last GlacialMaximum
Pre-LGM
Proboscideans
Holocene bison
Ingelside
horses
Horses -
Bison

Summary on Quaternary Prairies
1)
Despite climate change, %C4
biomass is remarkably constant through time.
2)
Always lots of C4
biomass on plains and plateaus and no C4
consumed by mastodons.
3)
Only climate-vegetation models that account for changes in pCO2
as well as temperature provide reasonable %C4
estimates in parts of the Quaternary with different atmospheric compositions.
Koch et al. (2004) P3

Signature of Plants (C3/C4) is reflected in soil carbon isotopes

δ13C of paleosol
carbonates from Pakistan
Quade
et al. (1989)Development of theAsian monsoon revealed by marked ecological shift during the latest Miocene in northern Pakistan. Nature 342: 163-166.

Diet shifts in Mio-Pliocene Mammals
Cerling
et al. (1997) Nature

CO2
reconstructions from 13C in aquatic plants
Why are there variations in 13C of aquatic plants?
Growth Rate
Active vs. Diffusive Inorganic C uptake
Type of Organism
CCM (CO2
concentrating mechanisms)
pCO2
and [CO2
]aq
Water Temperature
Cell Size and Geometry
Greater fractionation at higher [CO2
(aq)]

Pagani et al., 2005
The carbon isotope fractionation by haptophyte
algae. Photosynthesis is related to [CO2], growth rate (food), temperature and species.


Other Applications
Oxidation of methane (C and H)
Source of methane in gas hydrates and seeps (C and H)
Forensics (C, O, H) sources of ivory, fake maple,
Archeology (C, O) migration, food source, trading
Tracking anthropogenic C in the atmosphere and ocean
Stratigraphy and correlation (O, C, H)
Radiocarbon dating (14C)
Fluid crystallization temperatures (O, geology)
Diagenesis
(of carbonates)
Strength of the biological pump (C benthic platonic difference)


